Embed Size (px)
Citation preview

Environmental performance evaluation of RoPax ferriesCO2 EMISSIONS The EEDI (Energy Effi ciency Design Index) and the EEOI (Energy Effi ciency Operational Indicator), which are being worked out by the IMO, can be seen as two of the most advanced concepts in international discussions to reduce CO2 emissions from ships. However, there is disagreement on the applicability of the current approaches to special operational demands such as those of RoRo vessels and short sea shipping. The following article assesses these ships’ different kinds of cargo in regard to their energy requirements.
Constantin Hagemeister, Hans Otto Holmegaard Kristensen
Due to an increasing fo-cus on the environmen-tal impact of different
transport modes, it is of great importance that they be com-pared on an equal basis so that their impact – defi ned as ener-gy demands and/or emissions per transport unit – is related to the same unit for the different transport modes.For RoPax ferries, it can be diffi -cult to fi nd a suitable common transport unit as they often transport a mix of cargo, such as passengers, passenger cars, lorries, busses and other rolling transport units. The following article, which de-scribes a method to determine a common transport unit for RoPax ships, was formulated by senior researcher Hans Otto Kristensen from the Techni-cal University of Denmark in cooperation with Constantin Hagemeister from the Bremen University of Applied Sciences. The statistical analysis, which is the basis of the method, was prepared as a bachelor’s the-sis for the Cooperative Degree Course in Naval Architecture and Ocean Engineering, which was held in cooperation with both universities.
Energy Efficiency Design IndexThe Energy Effi ciency Design Index (EEDI) was developed to improve the energy effi ciency of purpose-built vessels both from a technical and design point of view. So far it can be regarded as the most advanced
element in the IMO discussion to reduce CO2 emissions from ships. While the short-term effect will be limited, it is assumed that the EEDI applied to con-ventionally designed and pro-pelled ships will contribute to the global effort to reduce CO2 emissions from the shipping sector in the longer term with new ships built in accordance with the EEDI entering into operation. Regarding the applicability of the EEDI, it was conclud-ed that the current approach could be feasible with certain reservations for large oceango-ing cargo ships having uniform design criteria, i.e. large tank-ers, bulk carriers, container ships, LNG carriers, LPG carri-ers, RoRo vehicle carriers and the largest general cargo ships. These ship types account for the majority of CO2 emissions in the industry. However, it has been argued that the current EEDI approach is not feasible for small ves-sels, passenger vessels, RoPax and RoRo ships and short sea shipping in general, as well as for ships designed for a certain route or with a specifi c trans-portation task.At MEPC 60 (March 2010), it was decided to further develop the EEDI for RoRo ships, and a two-year period was agreed.For most vessels, the unit for the EEDI is grams of CO2 per dwt per nautical mile. Originally, this unit was also suggested for RoRo passenger ships; however,
this led to a very large scatter in the statistical data of the index. One of the reasons for this scat-ter is the design diversity of RoPax ships. Some of the ships carry relatively few passengers and a lot of cargo, resulting in a relatively high deadweight, while other RoPax ferries carry many passengers with a high focus on service facilities. Thus, these ferries have requirements for large passenger spaces (caf-eterias, restaurants and cabins), resulting in large ships with a relatively low deadweight. In both cases, large volume is needed, which in general is proportional to the gross reg-ister tonnage (GT) of the ship. Therefore, the IMO has suggest-ed that deadweight be replaced by GT in the EEDI calculation for RoPax ships, so that the unit of EEDI for them is grams CO2/GT/nautical mile.
Energy Efficiency Operational Index (EEOI)For existing ships, the IMO has further suggested the introduc-tion of an Energy Effi ciency
Operational Indicator (EEOI). The Marine Environment Pro-tection Committee (MEPC) has agreed to circulate guide-lines (MEPC.1 - Circ.684) for voluntary use of this index, which can be used to estab-lish a consistent approach .As the amount of CO2 emitted from a ship is directly related to the consumption of bun-ker fuel oil, the EEOI can also provide useful information on the ship’s fuel effi ciency.These EEOI guidelines can be regarded as an indicator of the energy effi ciency of a ship in operation in the form of CO2 emitted per unit of transport work. As the guidelines are recommendatory and present possible use of an operational indicator, shipowners and op-erators are invited to imple-ment either these guidelines or an equivalent method in their environmental manage-ment systems and consider adoption of the principles therein when developing plans for performance moni-toring.
Unit General Low comfort High comfort
m2 per lane metre 4 - -
m3 per lane metre 24 - -
m2 per car 15 - -
m3 per car 67.5 - -
m2 per unberthed passenger 3.5 - -
m3 per unberthed passenger 10 7 13
m2 per berthed passenger 4.5 - -
m3 per berthed passenger 13 - -
Table 1: Area and volume equivalents
10 Ship & Offshore | 2011 | No 3
SHIPBUILDING & EQUIPMENT | GREEN SHIP TECHNOLOGY | RORO SHIPS & FERRIES
SPI_003-11_10_35_20110516111249_462631.indd 10SPI_003-11_10_35_20110516111249_462631.indd 10 16.05.2011 11:13:0516.05.2011 11:13:05

In its simplest form, the EEOI is defi ned as the ratio of mass of CO2 emitted per unit of trans-port work:
EEOI = Mass of CO2/(transport work)
Transport work and allocation principleFor vessels like RoPax ships, which carry a combination of passengers (either travelling with their cars or as ‘foot pas-sengers’) and freight, operators may wish to consider some form of weighted average based on the relative distribution of passengers and freight or the use of other parameters or in-dicators, as appropriate.On a RoPax ship, some of the internal volume is meant for the carriage of rolling cargo, while other volume is solely dedicated to the carriage of pas-sengers (restaurants/cafeterias, corridors, toilets and cabins).
The structural part and associat-ed equipment of these volumes contribute to the light weight of the ship, which together with the deadweight have an infl u-ence on the propulsion power and therefore on the exhaust gas emissions, including CO2.For a reasonable allocation of emissions to the differ-ent types of cargo on a RoRo passenger ship, the emissions have to be distributed relative to the volume that each cargo type occupies. Calculating the average weight (ship struc-tural weight + cargo) for the different volume types shows that the weight is roughly independent of the volume type, which means that a volu-metric allocation principle can also be considered as a weight-based allocation me-thod. As the power demand is proportional to the ship’s to-tal weight (displacement), the method is therefore rationally
seen from a ship design and hydrodynamic point of view, which is of paramount impor-tance for the validity and un-derstanding of the method.
Determination of volumes for different types of cargoIn order to determine the vol-umes for the different types of cargo carried on a RoPax ferry, general arrangement plans for 60 RoPax ships have been ana-lysed for the following spaces :
Cargo space for rolling car- go Accommodation for restau- rants, cafeterias, corridors, toilets, etc.Accommodation for pan- tries, galleys, air condition rooms and storeroomsAccommodation for passen- ger cabins and associated corridors and storerooms.
The ferries are considered quite representative, being typical
West European and Scandina-vian ferries built from 1974 to 2009, with the following age distribution averaging 16 years:1974 - 1989: 17 ships1990 - 1999: 17 ships2000 - 2009: 26 shipsBy using statistical data over 37 years, it is also possible to see if there is a trend towards higher standards, i.e. larger vol-umes with decreasing age of the ferries. The analysis shows a slightly higher volume per lane metre and per car, which was expected due to larger cars and higher standards with respect to free space on the car deck between the vehicles. As vol-ume is the product of area and height, the area per cargo unit was also determined during the analysis. The results of this analysis are summarised in Table 1.The volume for each cargo seg-ment is shown in Figures 1 – 5 [1].
Fig. 1: Volume of cars [1]
2000 - 2010Volume = 65.9 x cars + 1327
0
15000
30000
45000
60000
0 300 600 900Car capacity
Volume (m³)
Fig. 2: Volume for lorries [1]
2000 - 2010Volume = 24.1 x lane metres
0
20000
40000
60000
80000
100000
0 1000 2000 3000 4000Lane metres
Volume (m³)
Ship & Offshore | 2011 | No 3 11
SPI_003-11_10_35_20110516111249_462631.indd 11SPI_003-11_10_35_20110516111249_462631.indd 11 16.05.2011 11:13:0616.05.2011 11:13:06
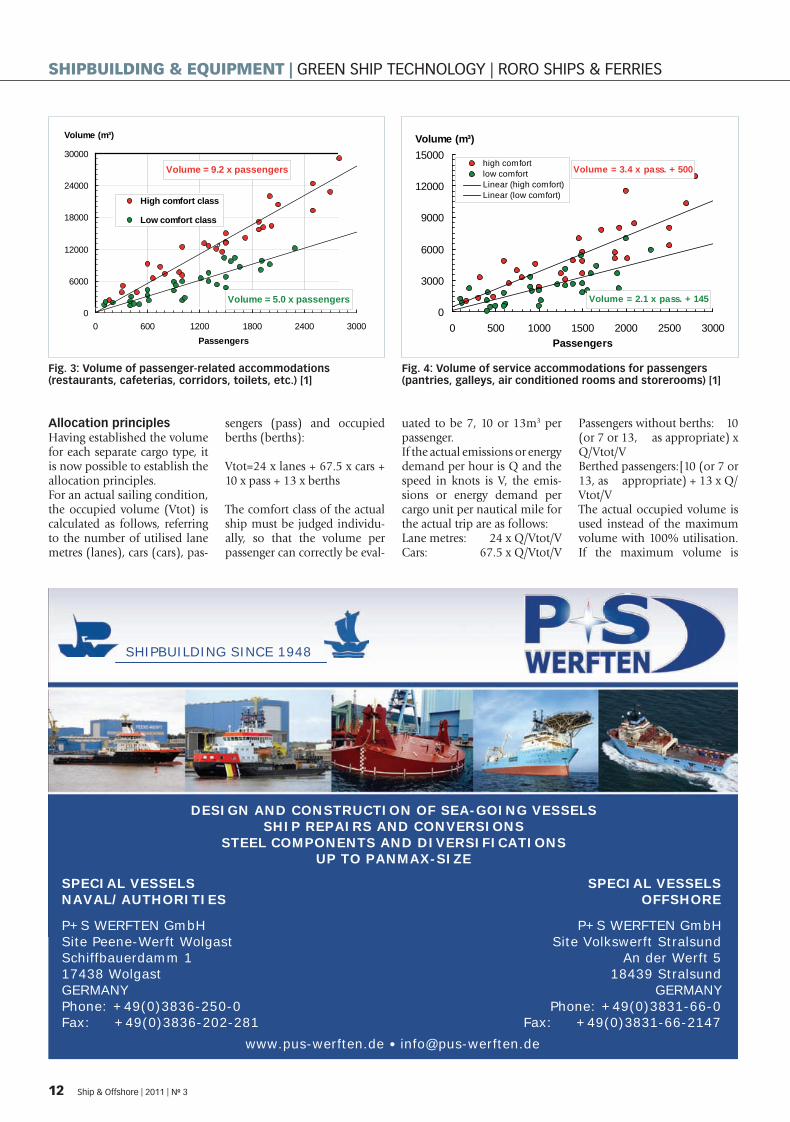
Fig. 3: Volume of passenger-related accommodations (restaurants, cafeterias, corridors, toilets, etc.) [1]
Volume = 9.2 x passengers
Volume = 5.0 x passengers0
6000
12000
18000
24000
30000
0 600 1200 1800 2400 3000Passengers
Volume (m³)
High comfort class
Low comfort class
a
Fig. 4: Volume of service accommodations for passengers (pantries, galleys, air conditioned rooms and storerooms) [1]
Volume = 3.4 x pass. + 500
Volume = 2.1 x pass. + 1450
3000
6000
9000
12000
15000
0 500 1000 1500 2000 2500 3000Passengers
Volume (m³)
high comfortlow comfortLinear (high comfort)Linear (low comfort)
Allocation principlesHaving established the volume for each separate cargo type, it is now possible to establish the allocation principles. For an actual sailing condition, the occupied volume (Vtot) is calculated as follows, referring to the number of utilised lane metres (lanes), cars (cars), pas-
sengers (pass) and occupied berths (berths):
Vtot=24 x lanes + 67.5 x cars + 10 x pass + 13 x berths
The comfort class of the actual ship must be judged individu-ally, so that the volume per passenger can correctly be eval-
uated to be 7, 10 or 13m3 per passenger.If the actual emissions or energy demand per hour is Q and the speed in knots is V, the emis-sions or energy demand per cargo unit per nautical mile for the actual trip are as follows:Lane metres: 24 x Q/Vtot/VCars: 67.5 x Q/Vtot/V
Passengers without berths: 10 (or 7 or 13, as appropriate) x Q/Vtot/V Berthed passengers: [10 (or 7 or 13, as appropriate) + 13 x Q/Vtot/VThe actual occupied volume is used instead of the maximum volume with 100% utilisation. If the maximum volume is
SHIPBUILDING SINCE 1948
SPECIAL VESSELS OFFSHORE
P+S WERFTEN GmbH Site Volkswerft Stralsund
An der Werft 5 18439 Stralsund
GERMANY Phone: +49(0)3831-66-0
Fax: +49(0)3831-66-2147
SPECIAL VESSELS NAVAL/AUTHORITIES
P+S WERFTEN GmbH Site Peene-Werft Wolgast Schiffbauerdamm 1 17438 Wolgast GERMANY Phone: +49(0)3836-250-0 Fax: +49(0)3836-202-281
www.pus-werften.de • [email protected]
DESIGN AND CONSTRUCTION OF SEA-GOING VESSELS SHIP REPAIRS AND CONVERSIONS
STEEL COMPONENTS AND DIVERSIFICATIONS UP TO PANMAX-SIZE
12 Ship & Offshore | 2011 | No 3
SHIPBUILDING & EQUIPMENT | GREEN SHIP TECHNOLOGY | RORO SHIPS & FERRIES
SPI_003-11_10_35_20110516111249_462631.indd 12SPI_003-11_10_35_20110516111249_462631.indd 12 16.05.2011 11:13:0616.05.2011 11:13:06

Fig. 5: Volume of passenger cabins and associated corridors and storerooms [1]
Fig. 6: Total cargo volume (for rolling cargo and passengers) of RoPax ships [2]
Volume = 13 x berths
0
8000
16000
24000
32000
0 500 1000 1500 2000 2500Berths
Volume (m³)
0
25000
50000
75000
100000
125000
30 70 110 150 190 230
Length pp (m)
Car
go v
olum
e (m
3 )
used, not all of the emissions or energy demand will be allo-cated for the actual trip, which is incorrect since all emissions have to be distributed over the actual cargo, including passen-gers.
Total cargo volume of RoPax shipsUsing ferry data from the Ship-Pax database [2], the total cargo volumes for a large number of ferries have been calculated, i.e. Vtot has been calculated assum-ing 100% utilisation. The result of this analysis is shown in Fig. 6, where it is observed that the total volume is proportional to the length between pp in a higher order than one. It is also observed that the scatter is rela-tively high up to a length of ap-proximately 150m. Above this
length, the scatter is reduced, which is probably due to the fact that these passenger ships become slightly more homog-enous and similar in layout.
CO2 emissions per m3 per nautical mile at 100% cargo utilisationBy using the data in the Ship-Pax database, it has also been possible to calculate the CO2 emissions per m3 per nautical mile for the same ferries shown in Fig. 6. The results of these calculations are shown in Fig. 7. Due to the aforementioned scatter of total volume up to a length of approximately 150m, there is a similar scatter of the CO2 emissions for the same length between pp. The scatter in service speed can be seen in Fig. 8.
Ship & Offshore | 2011 | No 3 13
SPI_003-11_10_35_20110516111249_462631.indd 13SPI_003-11_10_35_20110516111249_462631.indd 13 16.05.2011 11:13:1116.05.2011 11:13:11
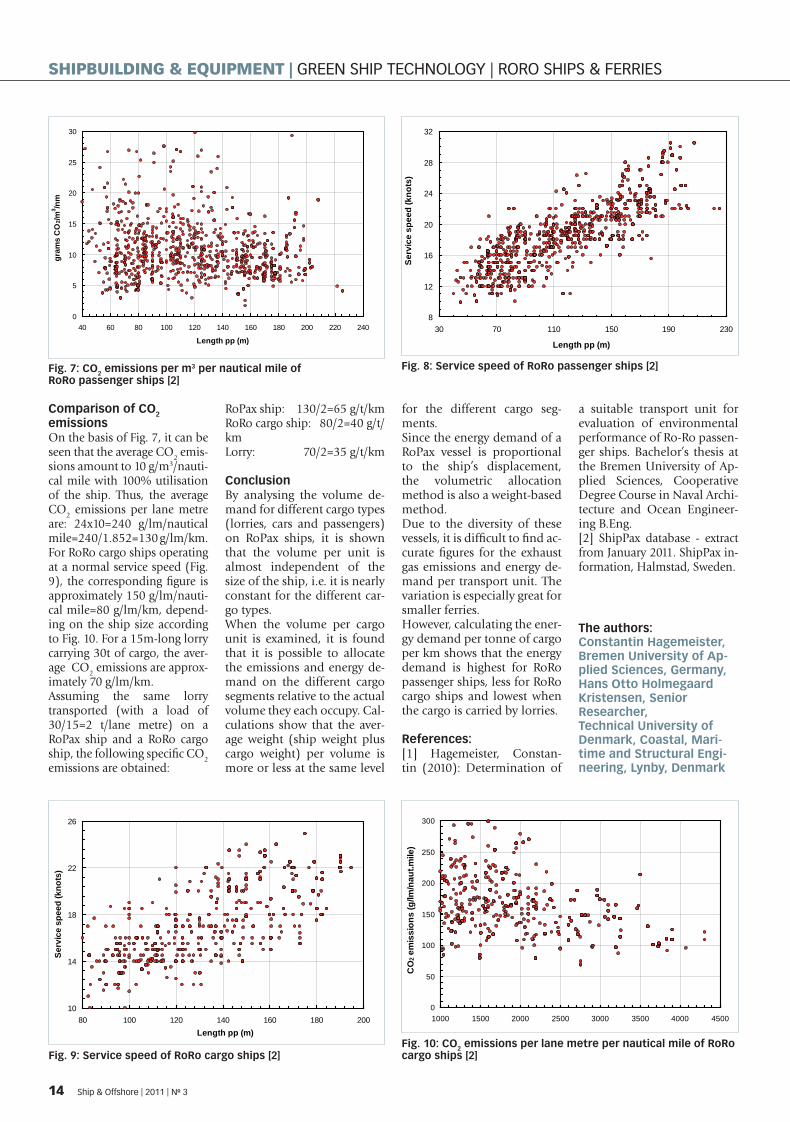
Comparison of CO2 emissions On the basis of Fig. 7, it can be seen that the average CO2 emis-sions amount to 10 g/m3/nauti-cal mile with 100% utilisation of the ship. Thus, the average CO2 emissions per lane metre are: 24x10=240 g/lm/nautical mile=240/1.852=130 g/lm/km. For RoRo cargo ships operating at a normal service speed (Fig. 9), the corresponding fi gure is approximately 150 g/lm/nauti-cal mile=80 g/lm/km, depend-ing on the ship size according to Fig. 10. For a 15m-long lorry carrying 30t of cargo, the aver-age CO2 emissions are approx-imately 70 g/lm/km. Assuming the same lorry transported (with a load of 30/15=2 t/lane metre) on a RoPax ship and a RoRo cargo ship, the following specifi c CO2 emissions are obtained:
RoPax ship: 130/2=65 g/t/kmRoRo cargo ship: 80/2=40 g/t/kmLorry: 70/2=35 g/t/km
ConclusionBy analysing the volume de-mand for different cargo types (lorries, cars and passengers) on RoPax ships, it is shown that the volume per unit is almost independent of the size of the ship, i.e. it is nearly constant for the different car-go types.When the volume per cargo unit is examined, it is found that it is possible to allocate the emissions and energy de-mand on the different cargo segments relative to the actual volume they each occupy. Cal-culations show that the aver-age weight (ship weight plus cargo weight) per volume is more or less at the same level
for the different cargo seg-ments. Since the energy demand of a RoPax vessel is proportional to the ship’s displacement, the volumetric allocation method is also a weight-based method. Due to the diversity of these vessels, it is diffi cult to fi nd ac-curate fi gures for the exhaust gas emissions and energy de-mand per transport unit. The variation is especially great for smaller ferries. However, calculating the ener-gy demand per tonne of cargo per km shows that the energy demand is highest for RoRo passenger ships, less for RoRo cargo ships and lowest when the cargo is carried by lorries.
References:[1] Hagemeister, Constan-tin (2010): Determination of
a suitable transport unit for evaluation of environmental performance of Ro-Ro passen-ger ships. Bachelor’s thesis at the Bremen University of Ap-plied Sciences, Cooperative Degree Course in Naval Archi-tecture and Ocean Engineer-ing B.Eng. [2] ShipPax database - extract from January 2011. ShipPax in-formation, Halmstad, Sweden.
Fig. 8: Service speed of RoRo passenger ships [2]
Fig. 9: Service speed of RoRo cargo ships [2]Fig. 10: CO2 emissions per lane metre per nautical mile of RoRo cargo ships [2]
8
12
16
20
24
28
32
30 70 110 150 190 230
Length pp (m)
Serv
ice
spee
d (k
nots
)
10
14
18
22
26
80 100 120 140 160 180 200Length pp (m)
Serv
ice
spee
d (k
nots
)
0
50
100
150
200
250
300
1000 1500 2000 2500 3000 3500 4000 4500
L t
CO
2 em
issi
ons
(g/lm
/nau
t.mile
)
The authors:Constantin Hagemeister, Bremen University of Ap-plied Sciences, Germany, Hans Otto Holmegaard Kristensen, Senior Researcher,Technical University of Denmark, Coastal, Mari-time and Structural Engi-neering, Lynby, Denmark
Fig. 7: CO2 emissions per m3 per nautical mile of RoRo passenger ships [2]
0
5
10
15
20
25
30
40 60 80 100 120 140 160 180 200 220 240
Length pp (m)
gram
s C
O2/m
3 /nm
14 Ship & Offshore | 2011 | No 3
SHIPBUILDING & EQUIPMENT | GREEN SHIP TECHNOLOGY | RORO SHIPS & FERRIES
SPI_003-11_10_35_20110516111249_462631.indd 14SPI_003-11_10_35_20110516111249_462631.indd 14 16.05.2011 11:13:1116.05.2011 11:13:11