Embed Size (px)
Citation preview

Green Infrastructure Strategies of Nashville
SPEAKERS
Chris Armour is vice chair of the Metro Nashville Tree Advisory Committee and co-founder of Trees Nashville, a nonprofit that is working to teach Nashville the value of its urban forest
Kim Hawkins is a founding principal in Nashville-based Hawkins Partners, landscape architects and was a founding board member of the Tennessee Urban Forestry Council.
PROGRAM
I. Nashville Naturally
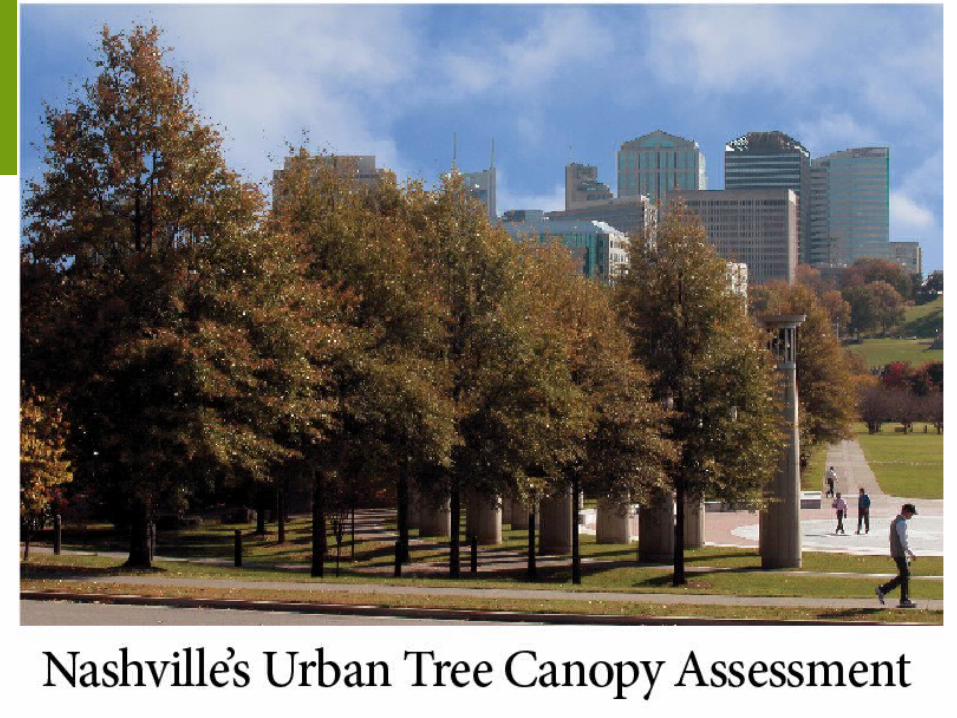
II. Urban Tree Canopy Assessment
III. Green Infrastructure Strategies
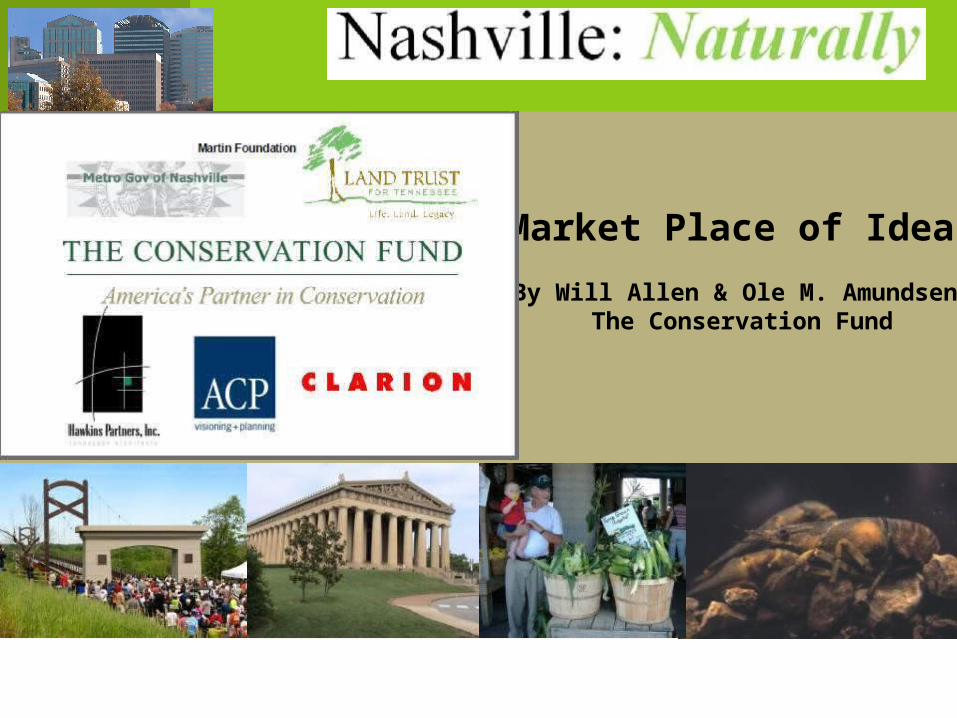
Market Place of Ideas
By Will Allen & Ole M. Amundsen The Conservation Fund
Background
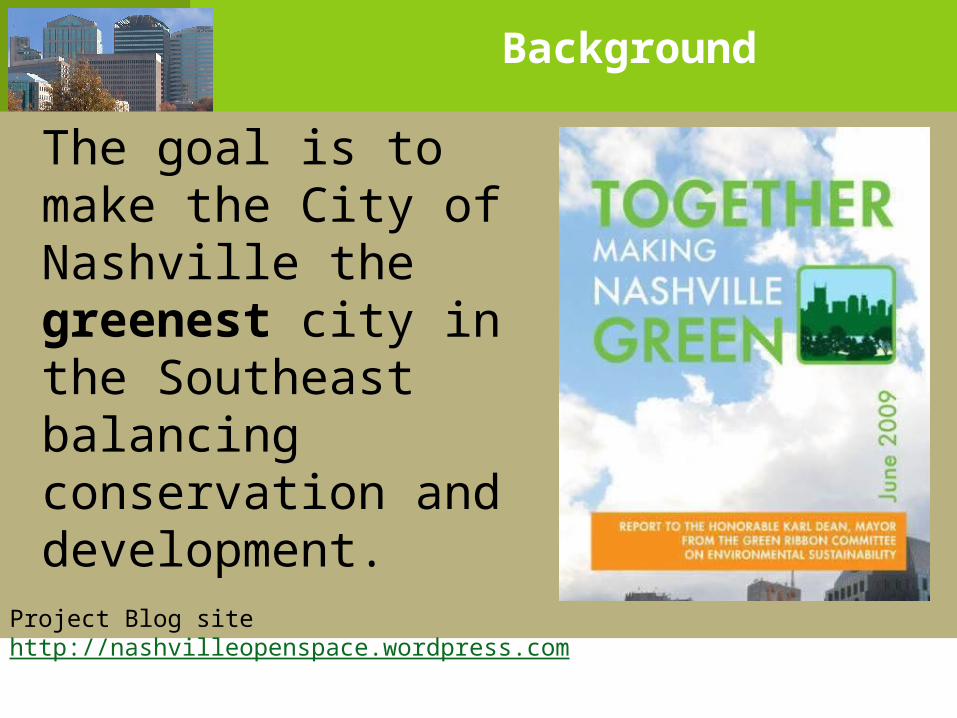
Project Blog site http://nashvilleopenspace.wordpress.com
The goal is to make the City of Nashville the greenest city in the Southeast balancing conservation and development.
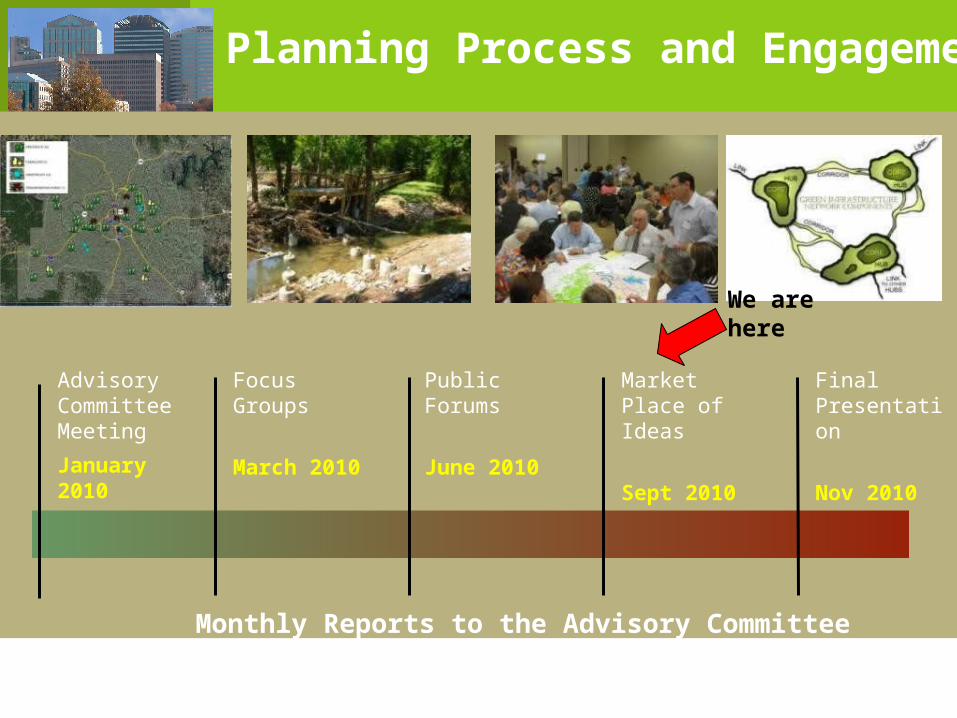
Planning Process and Engagement
Focus Groups
March 2010
Public Forums
June 2010
Advisory Committee Meeting
January 2010
Market Place of Ideas
Sept 2010
Final Presentation
Nov 2010
We are here
Monthly Reports to the Advisory Committee
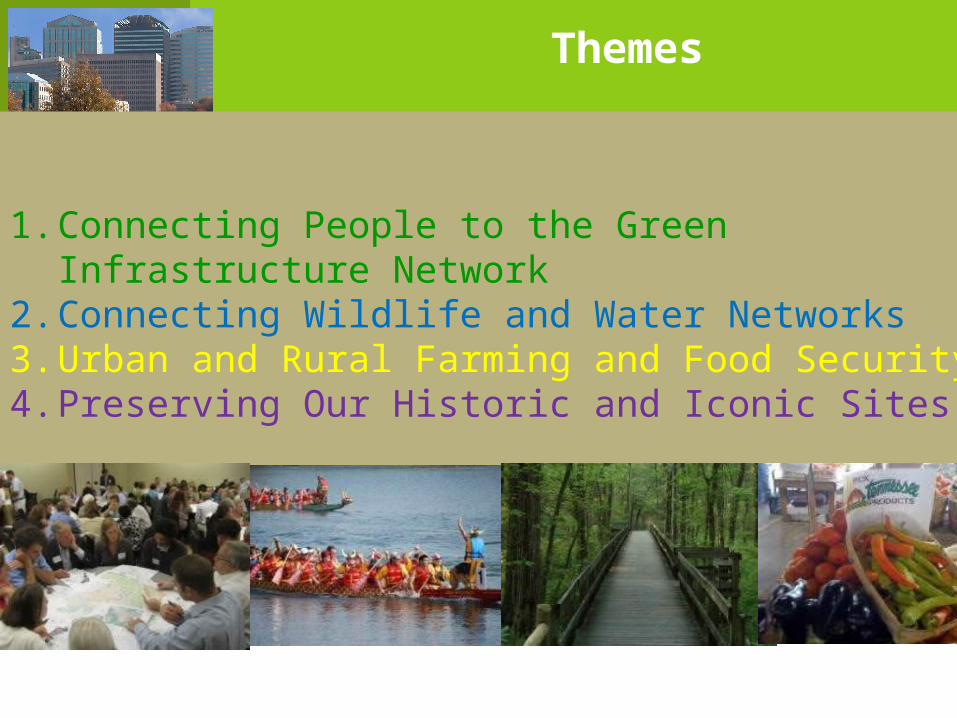
Themes
1. Connecting People to the Green Infrastructure Network2. Connecting Wildlife and Water Networks3. Urban and Rural Farming and Food Security4. Preserving Our Historic and Iconic Sites
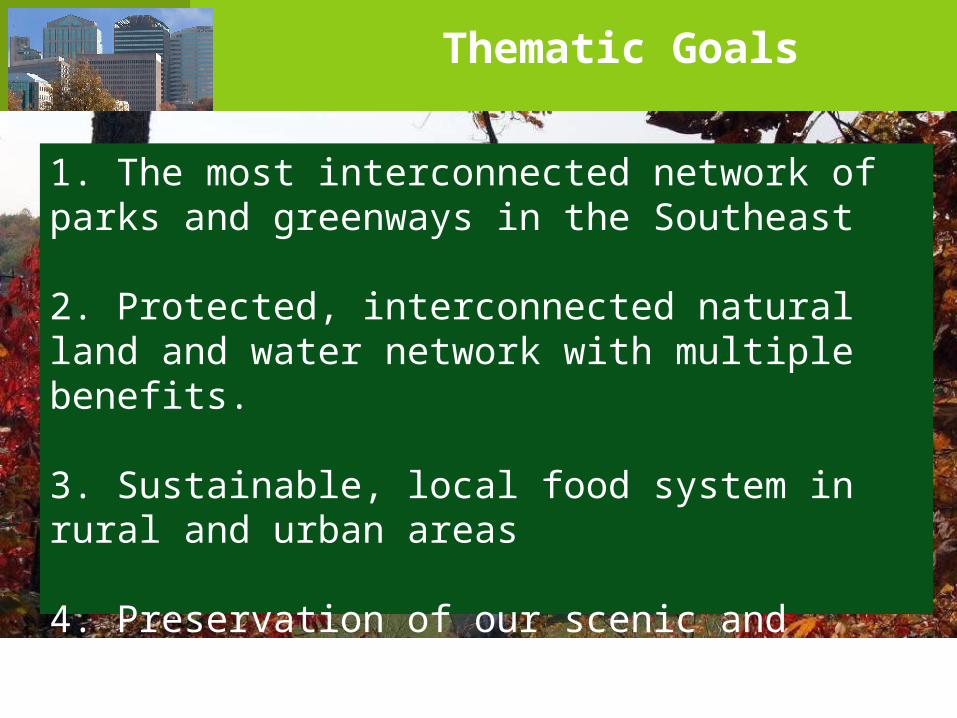
Thematic Goals
1. The most interconnected network of parks and greenways in the Southeast 2. Protected, interconnected natural land and water network with multiple benefits. 3. Sustainable, local food system in rural and urban areas
4. Preservation of our scenic and historic beauty
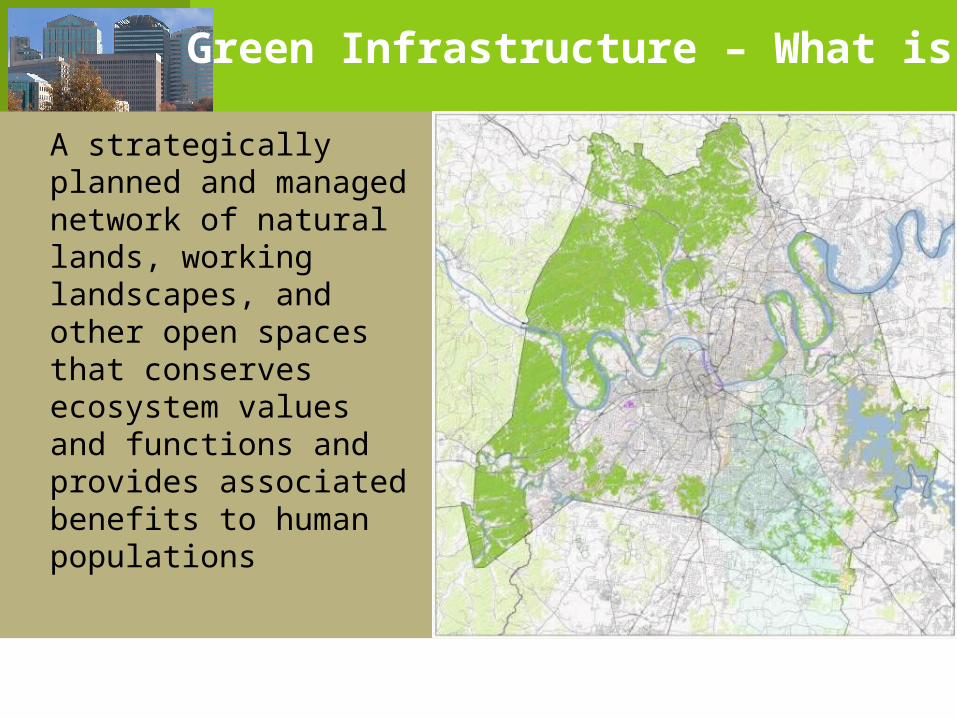
A strategically planned and managed network of natural lands, working landscapes, and other open spaces that conserves ecosystem values and functions and provides associated benefits to human populations
Green Infrastructure – What is it?
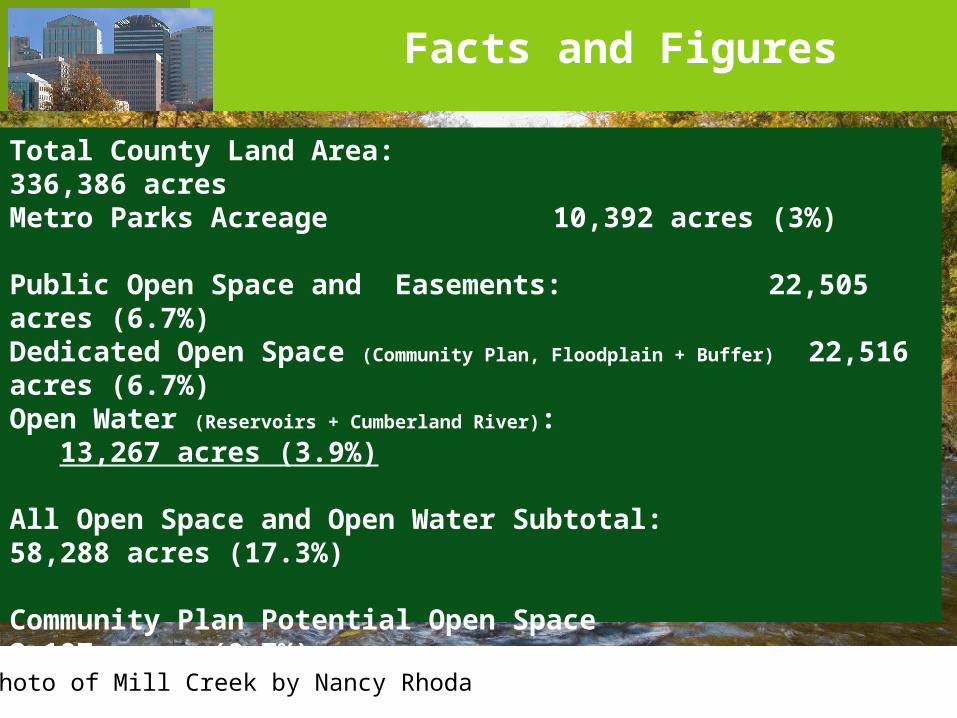
Facts and Figures
Total County Land Area: 336,386 acres Metro Parks Acreage 10,392 acres (3%)
Public Open Space and Easements: 22,505 acres (6.7%)Dedicated Open Space (Community Plan, Floodplain + Buffer) 22,516 acres (6.7%)Open Water (Reservoirs + Cumberland River): 13,267 acres (3.9%)
All Open Space and Open Water Subtotal: 58,288 acres (17.3%)
Community Plan Potential Open Space 2,197 acres (0.7%)
Green Infrastructure Hubs (Protected or Regulated) 14,356 acres (4.3%)Unprotected Green Infrastructure Hubs 101,240 acres (30.0%)
Photo of Mill Creek by Nancy Rhoda
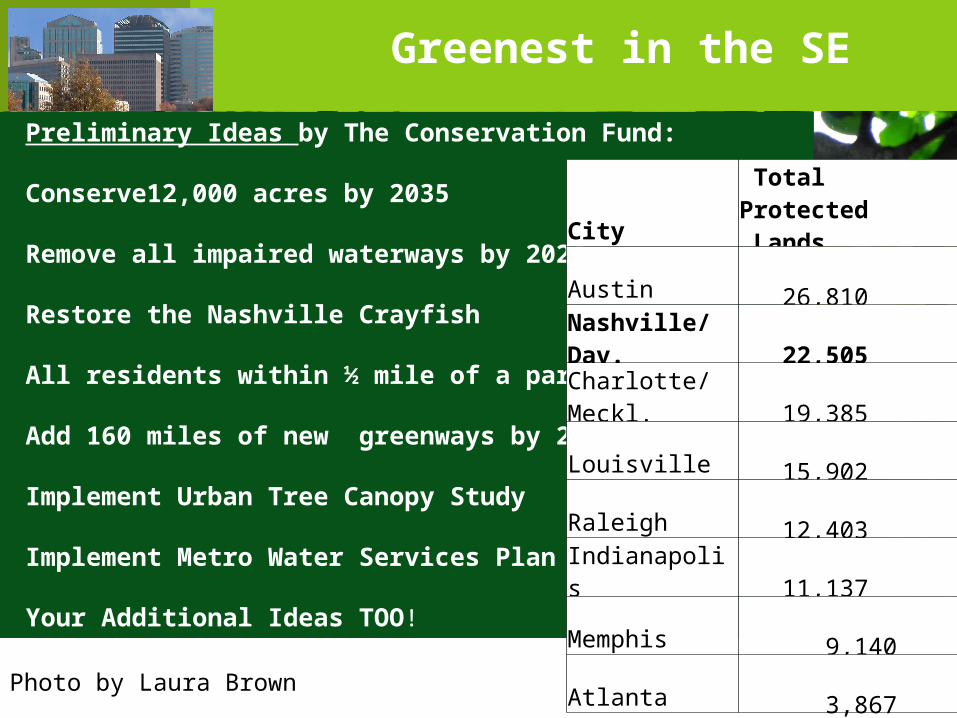
Greenest in the SE
Preliminary Ideas by The Conservation Fund:
Conserve12,000 acres by 2035
Remove all impaired waterways by 2020
Restore the Nashville Crayfish
All residents within ½ mile of a park
Add 160 miles of new greenways by 2035
Implement Urban Tree Canopy Study
Implement Metro Water Services Plan
Your Additional Ideas TOO!
City Total Protected Lands
Austin 26,810
Nashville/Dav. 22,505
Charlotte/Meckl. 19,385
Louisville 15,902
Raleigh 12,403
Indianapolis 11,137
Memphis 9,140
Atlanta 3,867
Photo by Laura Brown
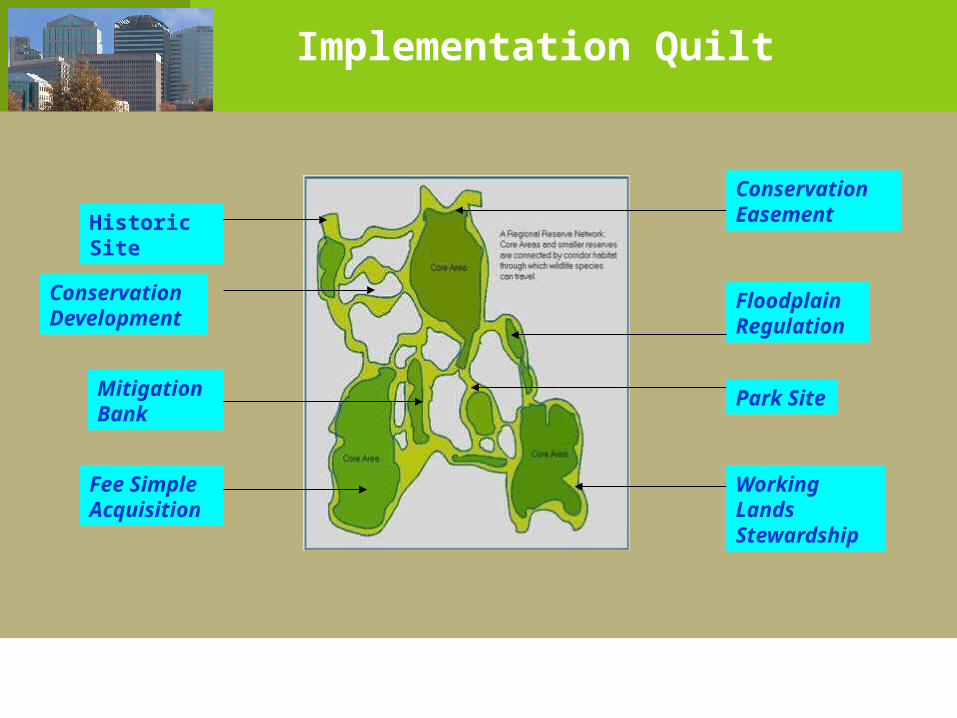
Mitigation Bank
Fee Simple Acquisition
Conservation Development
Historic Site
Working Lands Stewardship
Floodplain Regulation
Conservation Easement
Park Site
Implementation Quilt
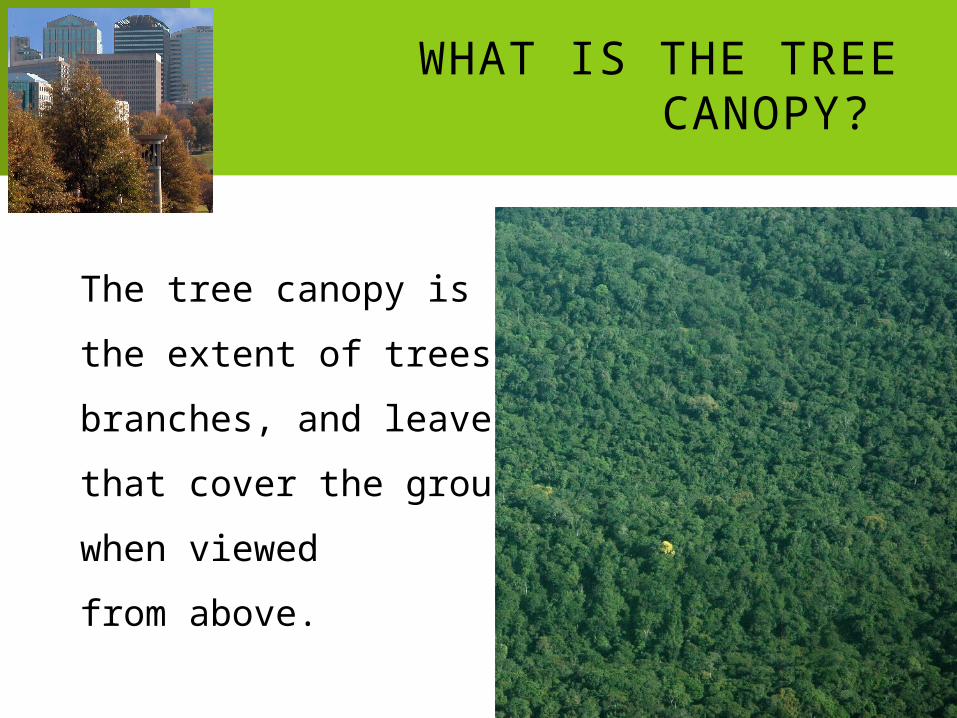
WHAT IS THE TREE CANOPY?
The tree canopy is the extent of trees, branches, and leavesthat cover the ground when viewed from above.
WHY IS IT IMPORTANT?
Best way to determine the location, size, and extent of the urban forest
Increase decision-makers’ understanding of urban forest resources
Determine the amount of tree canopy that currently exists and the amount that could exist
URBAN FORESTRY IN NASHVILLE, PUBLIC
Codes Forester
Public Works
Metro Parks
Metropolitan Development and Housing Agency
Water Services
Metro Tree Advisory Committee
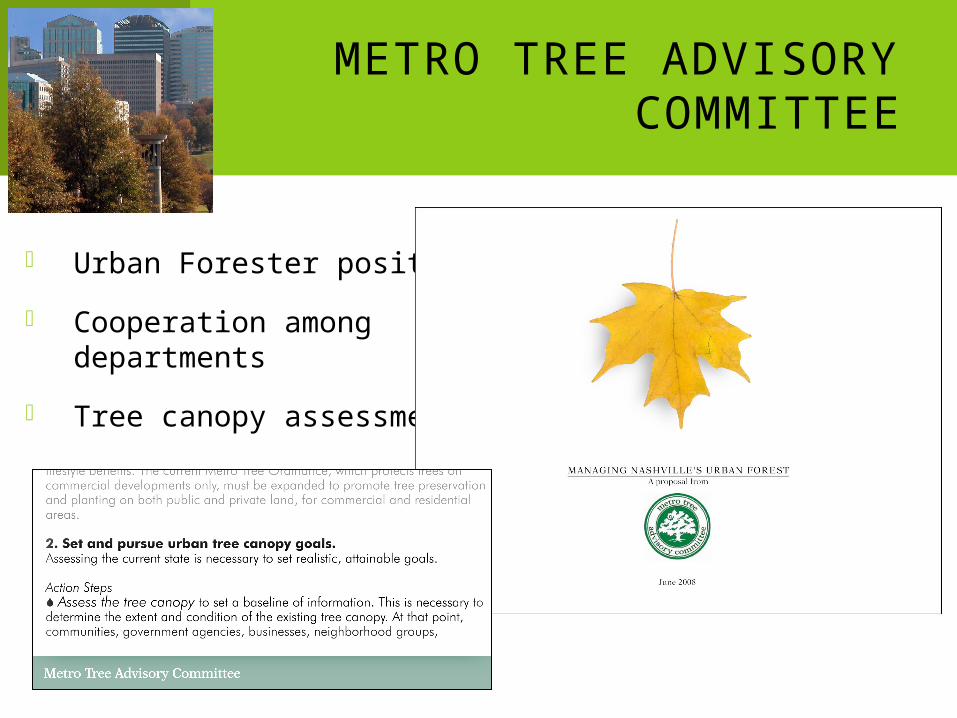
Urban Forester position
Cooperation among departments
Tree canopy assessment
METRO TREE ADVISORY COMMITTEE
TREES FOR A BETTER NASHVILLE
Water Services
Public Works
Parks & Recreation
Codes
Planning
Schools
Housing
US Forest Service
State Division of Forestry
Nashville Electric Service
Metro Council Members
Activists
Nonprofits
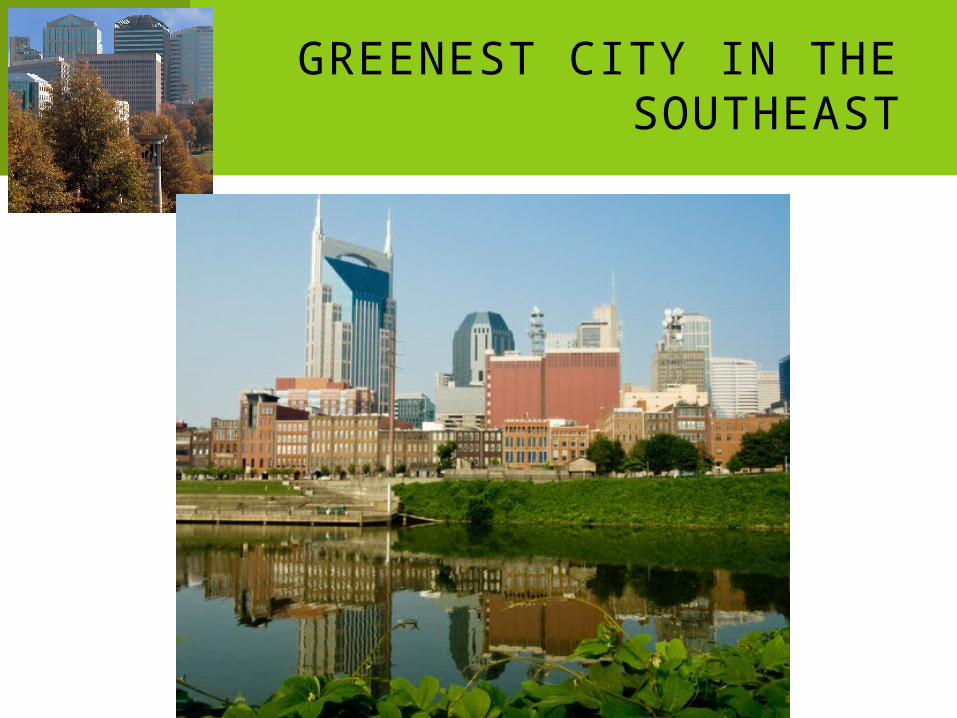
GREENEST CITY IN THE SOUTHEAST
CITY TAKES RESPONSIBILITY FOR PROJECT
Metro Tree Advisory Committee discussed goals and objectives for assessment
MTAC members wrote grant application and RFP
UTC Committee composed of department andMTAC representatives reviewed documents
Public Works secured matching funds
UTC Committee chose vendor
Planning Department supplied data
UTC Committee reviewed findings
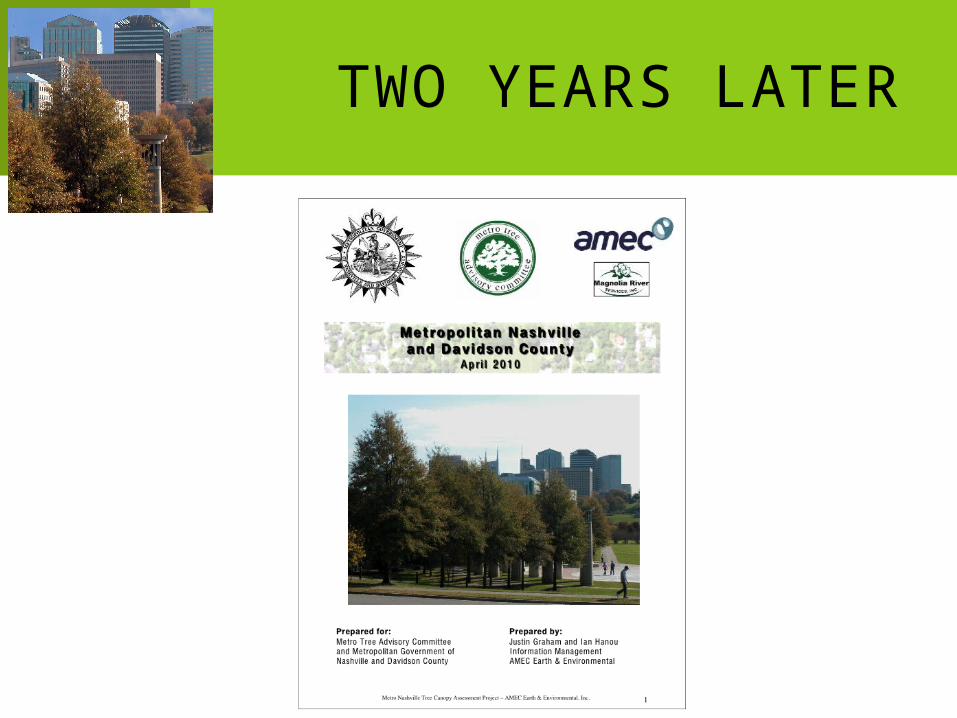
TWO YEARS LATER
NASHVILLE’S TREE CANOPY ASSESSMENT
The tree canopy assessment project
OBJECTIVES
Determine the percentage of tree canopy in the county
Determine distribution of that canopy
Increase city decision makers’ understanding of their urban forest resources
Help set specific, measurable, and attainable tree canopy goals
DATA NEEDED
High-resolution imagery
Supporting GIS layers
Land cover data
Geographic boundaries
DATA SUPPLIED BY FEDERAL AGENCIES
High-resolution imagery from 2008
National Agricultural Imagery Program (NAIP) with 1-meter spatial resolution
LiDAR (Light Detection and Ranging) data with elevation data for canopy height information and support of the land cover classification
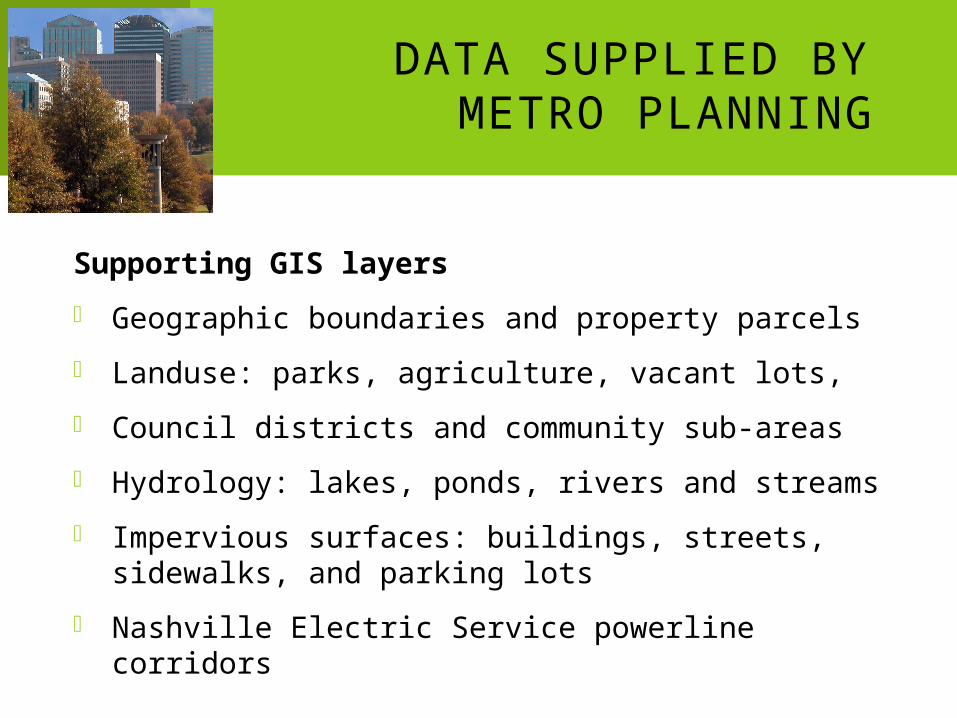
DATA SUPPLIED BY METRO PLANNING
Supporting GIS layers
Geographic boundaries and property parcels
Landuse: parks, agriculture, vacant lots,
Council districts and community sub-areas
Hydrology: lakes, ponds, rivers and streams
Impervious surfaces: buildings, streets, sidewalks, and parking lots
Nashville Electric Service powerline corridors
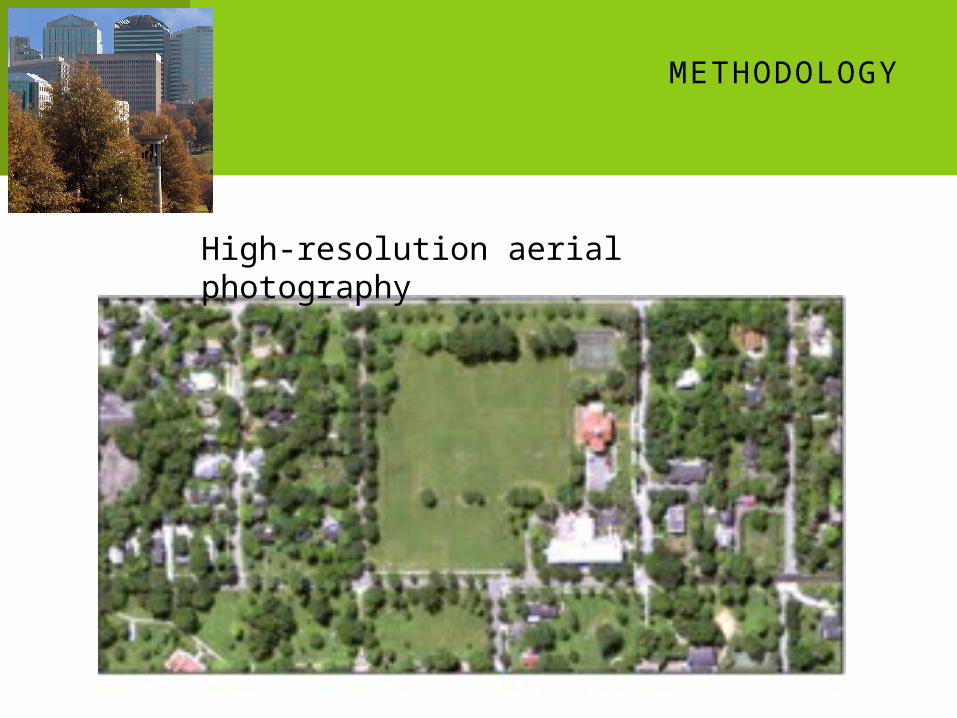
METHODOLOGY
High-resolution aerial photography
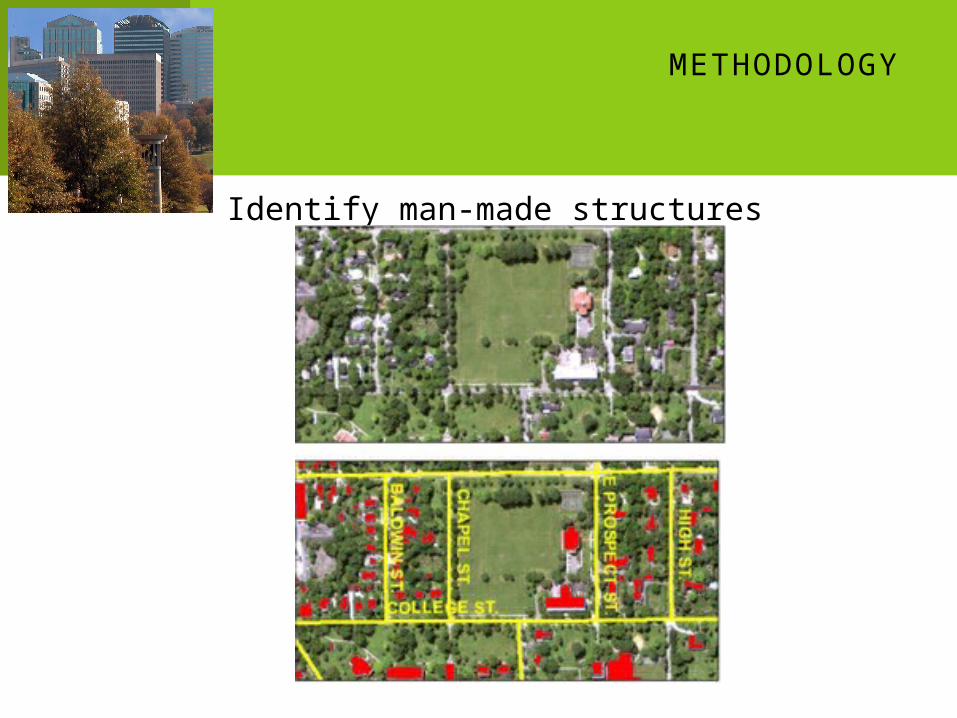
METHODOLOGY
Identify man-made structures
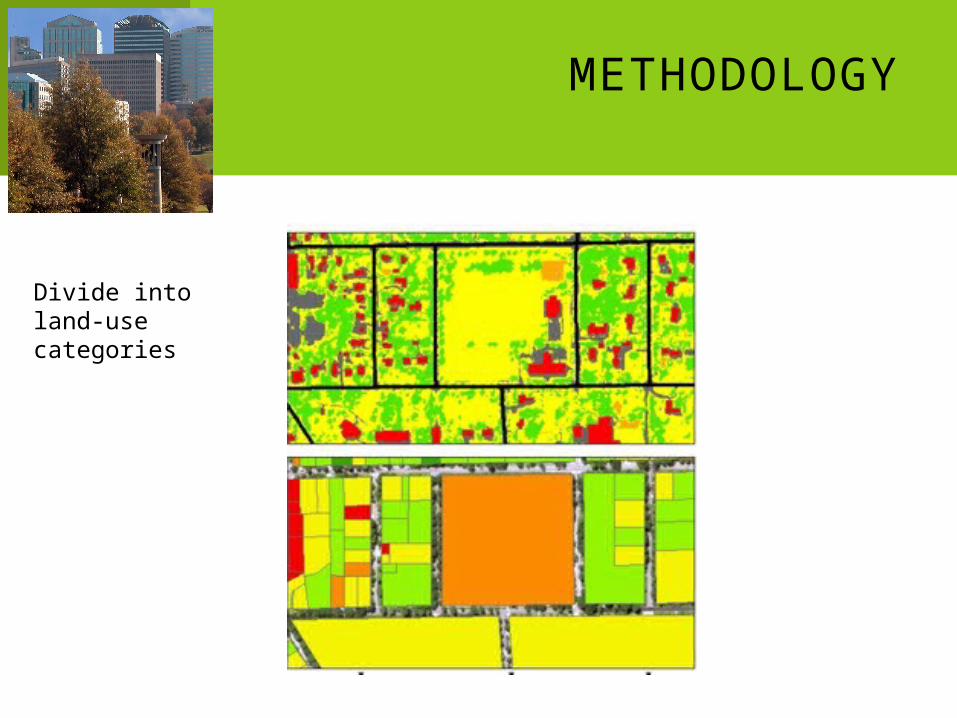
METHODOLOGY
Divide into land-use categories
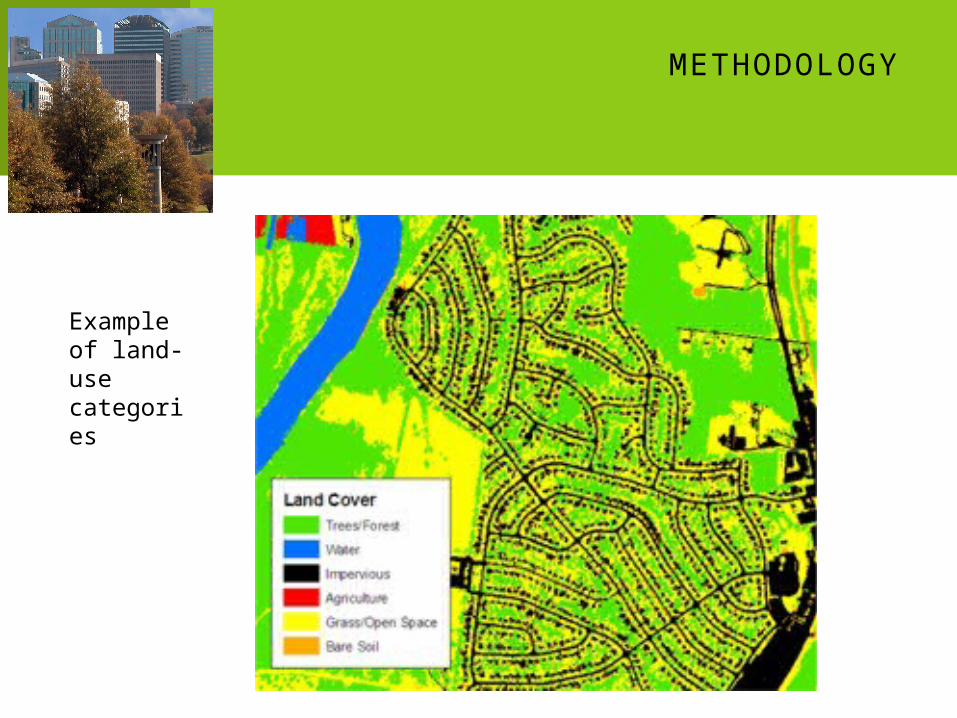
METHODOLOGY
Example of land-use categories
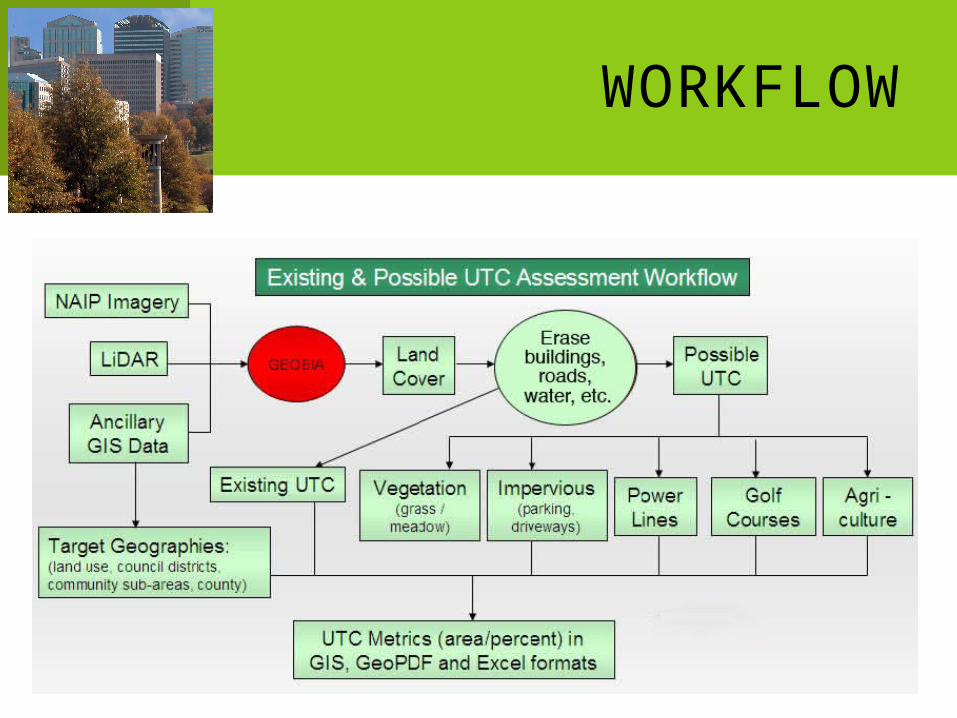
WORKFLOW
FINDINGS
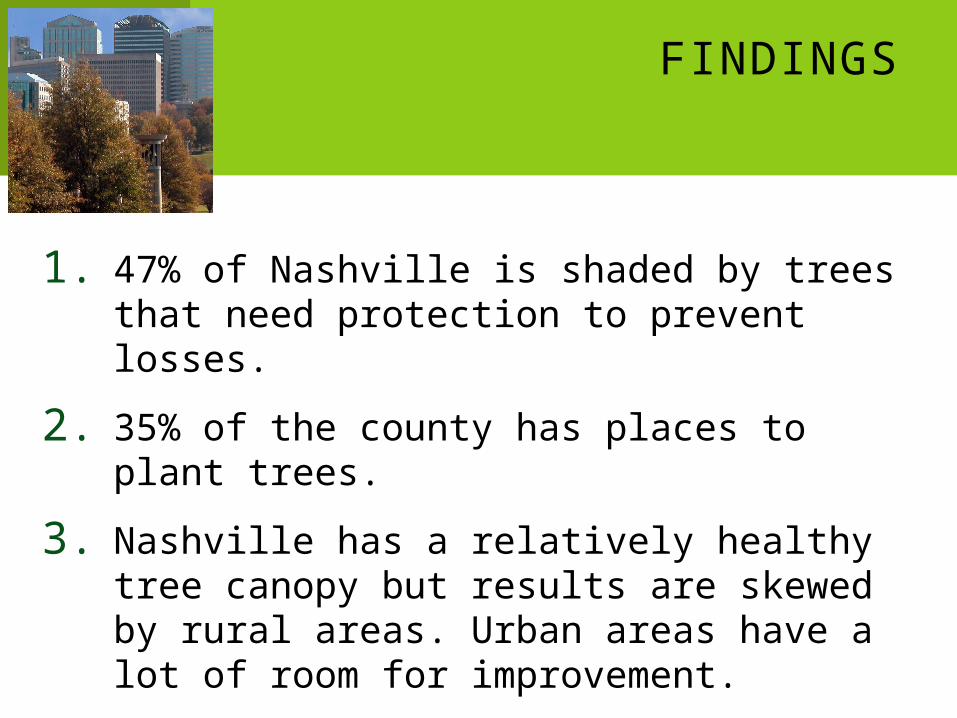
1. 47% of Nashville is shaded by trees that need protection to prevent losses.
2. 35% of the county has places to plant trees.
3. Nashville has a relatively healthy tree canopy but results are skewed by rural areas. Urban areas have a lot of room for improvement.
4. Formula for success involves multiple stakeholders.
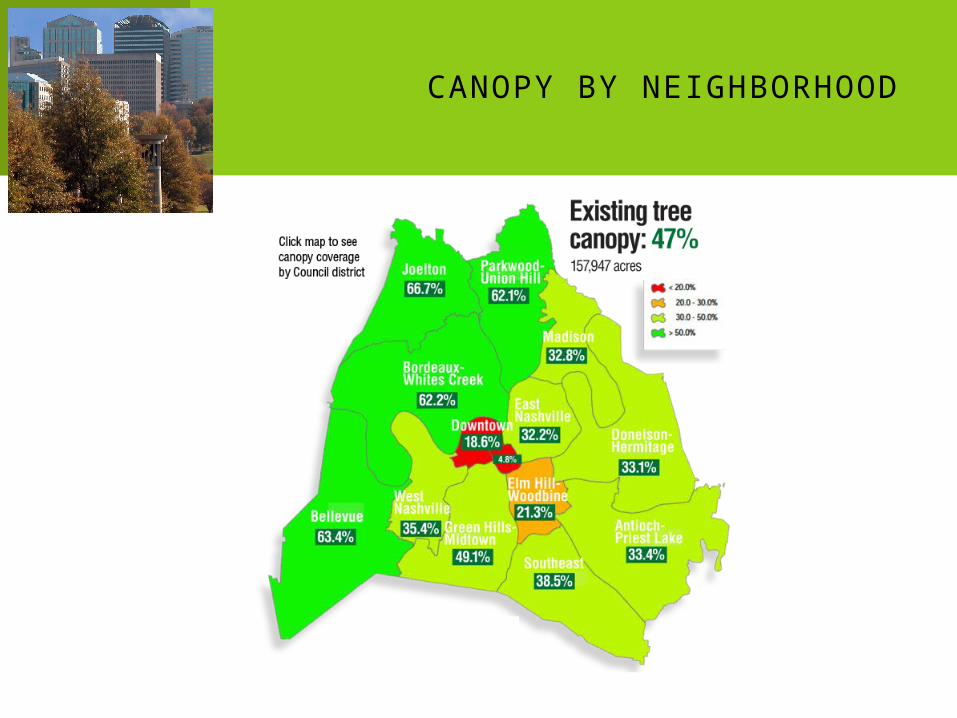
CANOPY BY NEIGHBORHOOD
FINDINGS
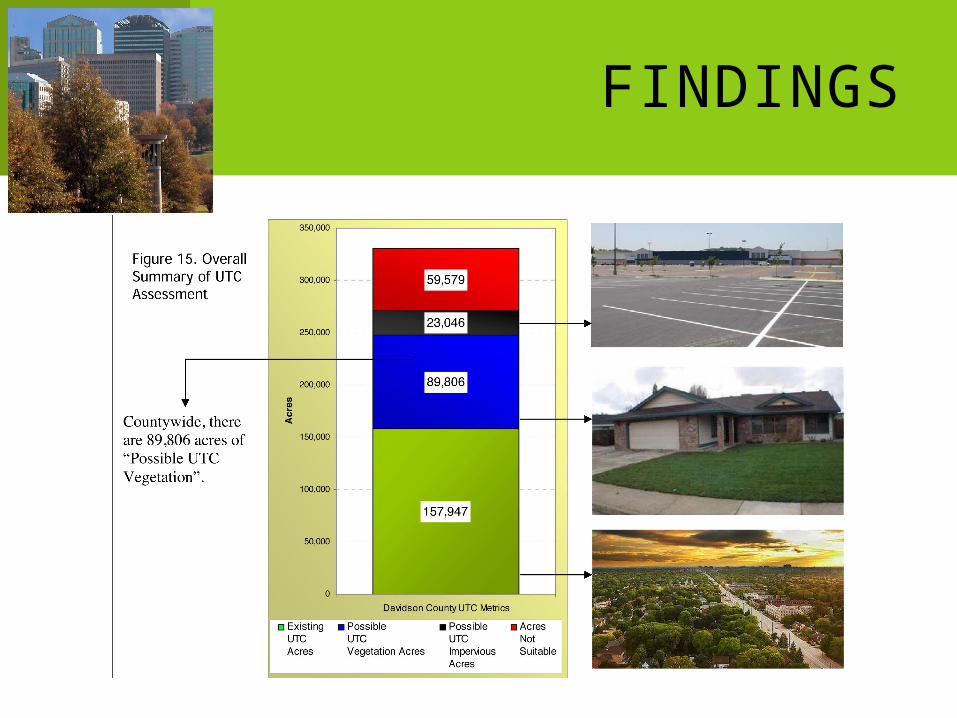
FINDINGS
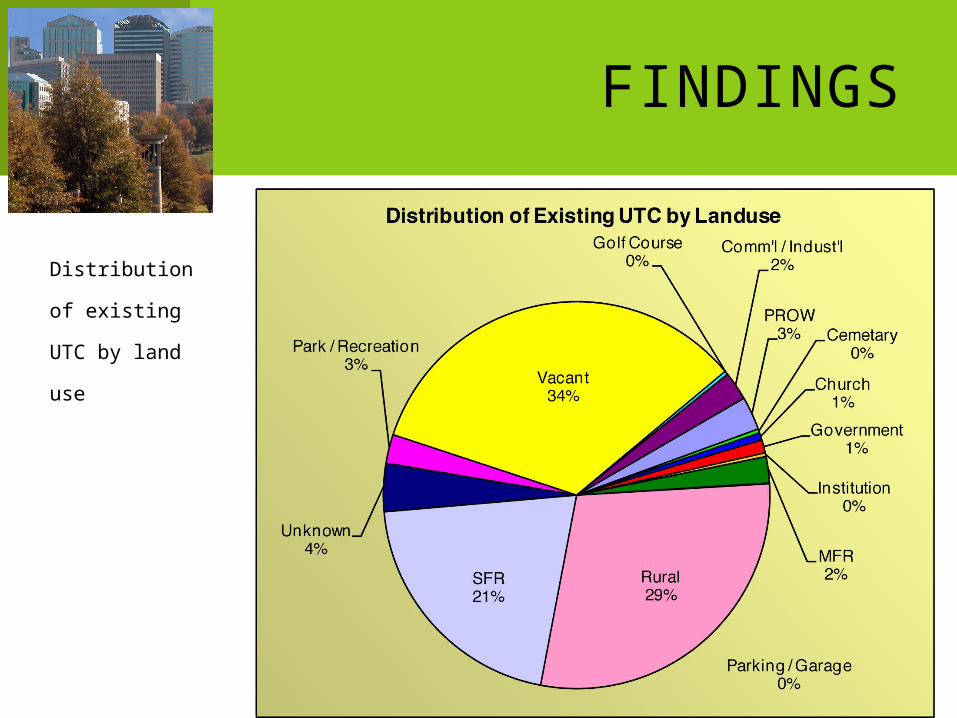
Distribution of
existing UTC by
land use
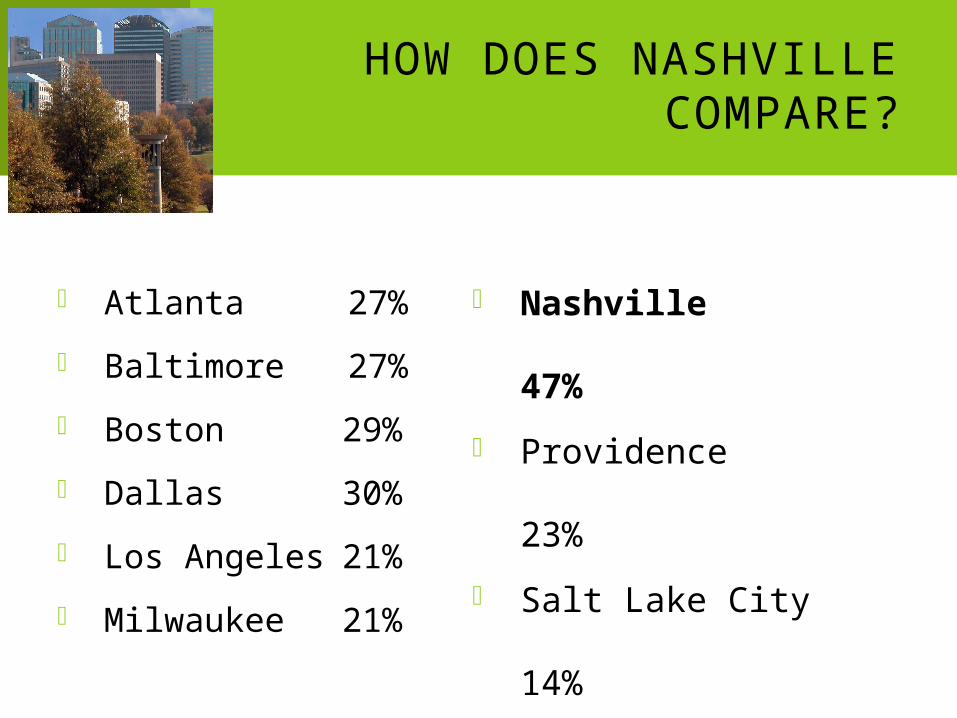
HOW DOES NASHVILLE COMPARE?
Atlanta 27%
Baltimore 27%
Boston 29%
Dallas 30%
Los Angeles 21%
Milwaukee 21%
Nashville
47%
Providence
23%
Salt Lake City
14%
Seattle
23%
St. Louis
43%
Washington DC
35%
FINDINGSFINDINGS
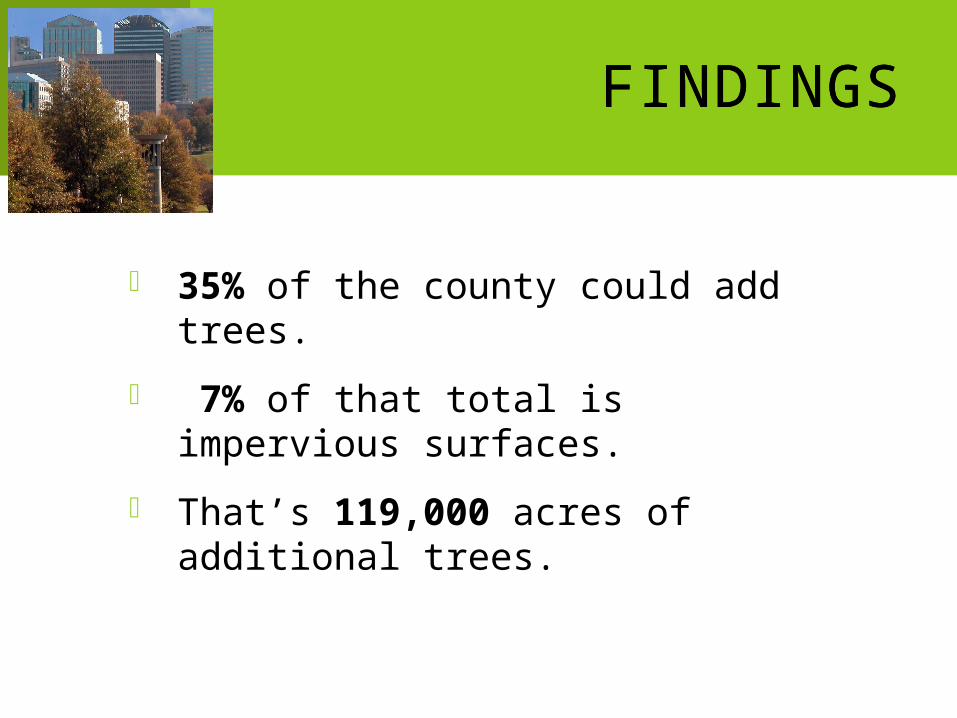
35% of the county could add trees.
7% of that total is impervious surfaces.
That’s 119,000 acres of additional trees.
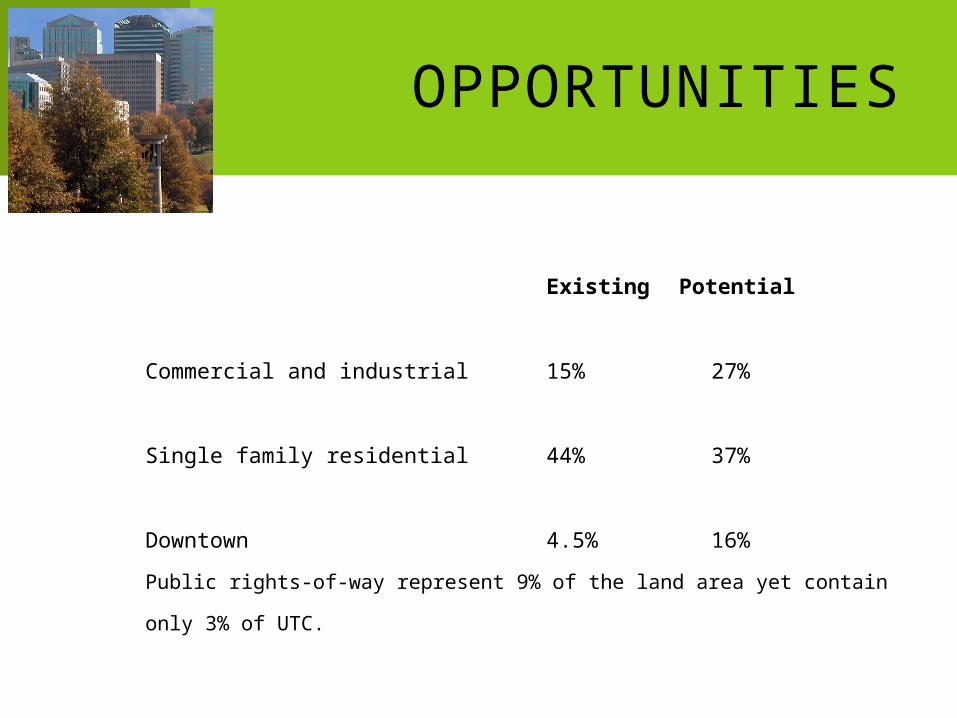
OPPORTUNITIES
Existing Potential
Commercial and industrial 15% 27%
Single family residential 44% 37%
Downtown 4.5% 16%
Public rights-of-way represent 9% of the land area yet contain only 3% of UTC.
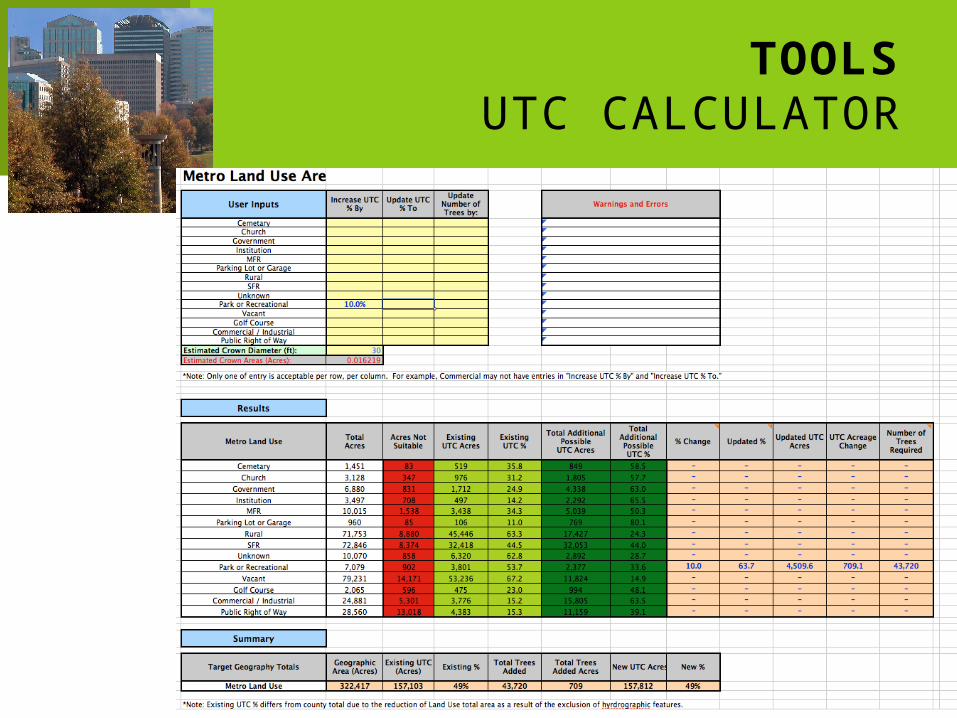
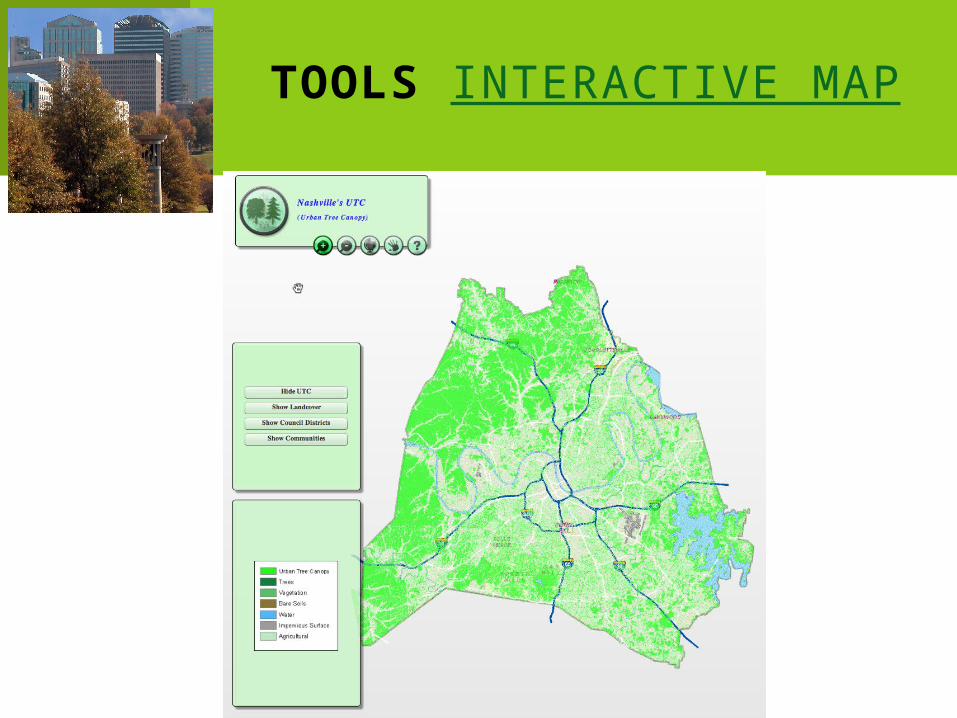
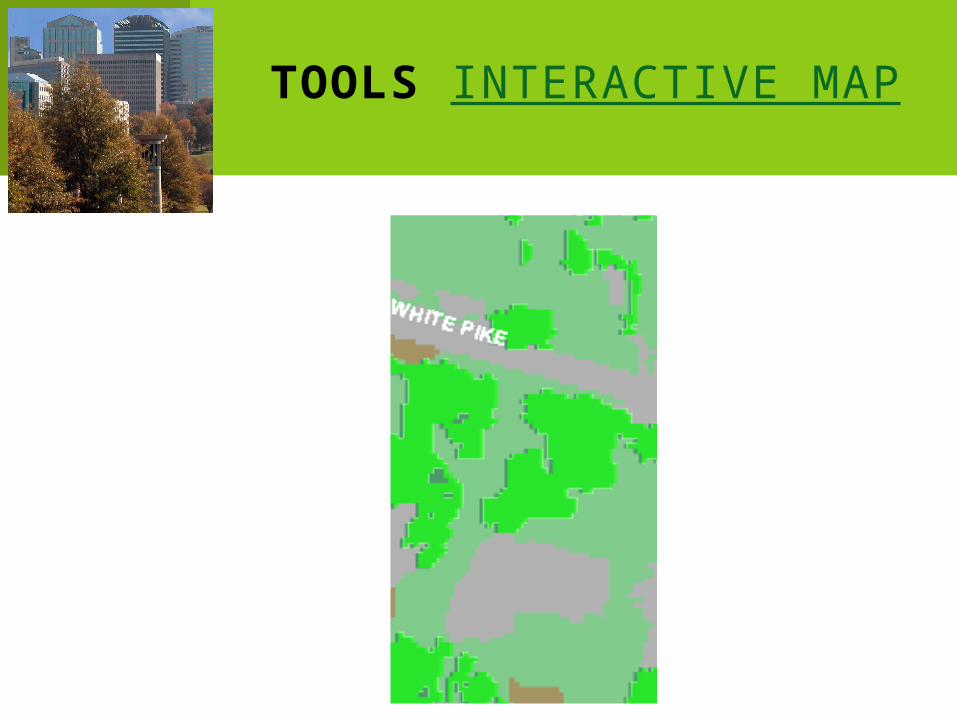
TOOLSUTC CALCULATOR
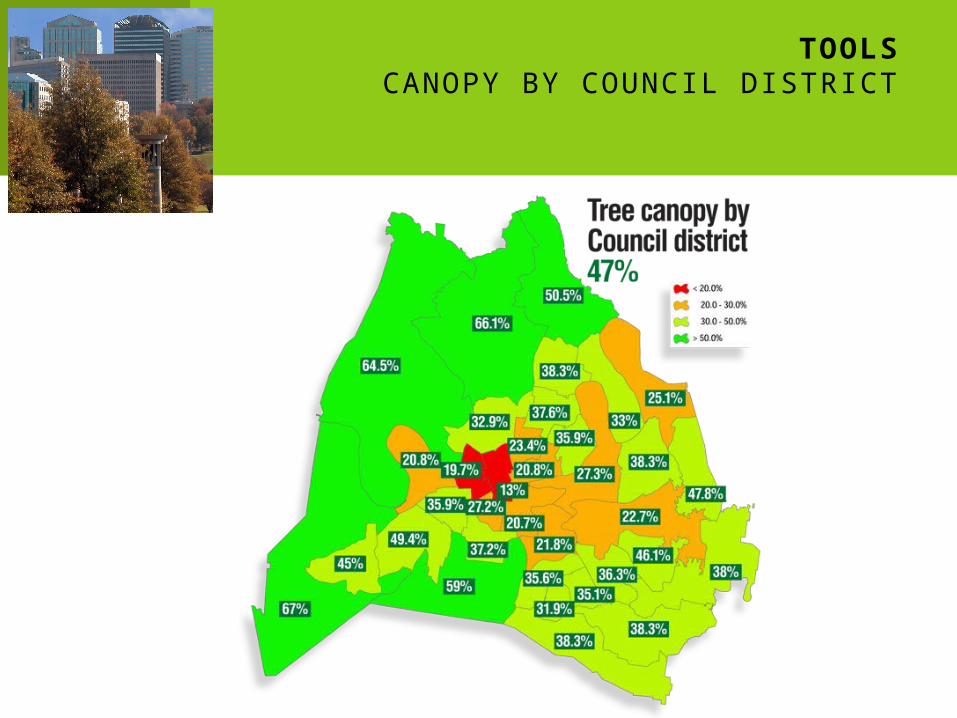
TOOLSCANOPY BY COUNCIL DISTRICT
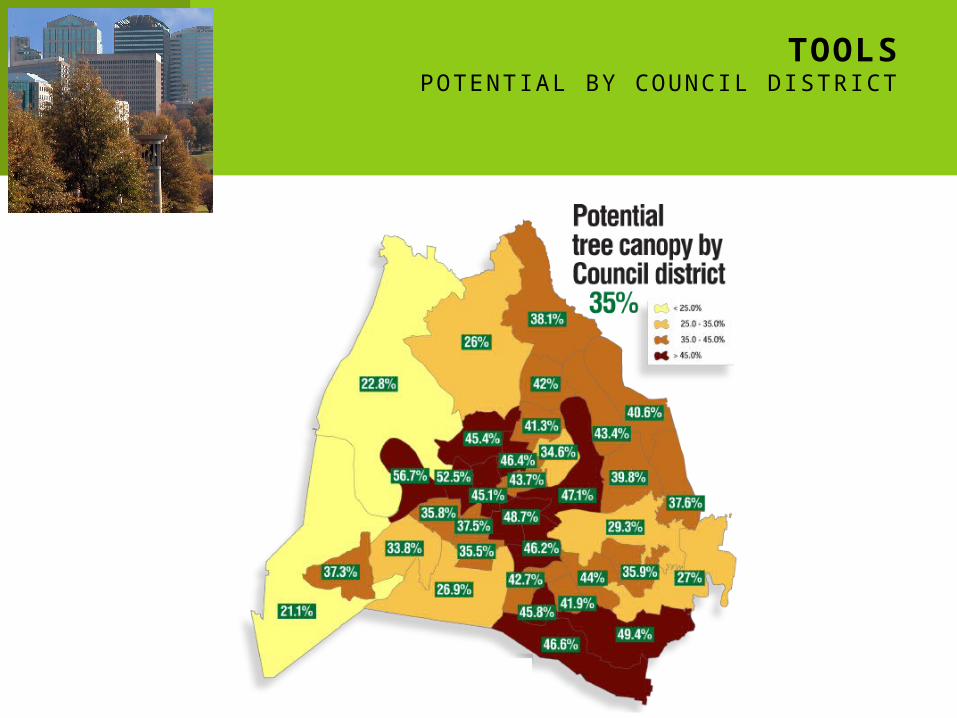
TOOLSPOTENTIAL BY COUNCIL DISTRICT
NEXT STEPS
Set canopy goals that are realistic and measurable.
Start planting trees!
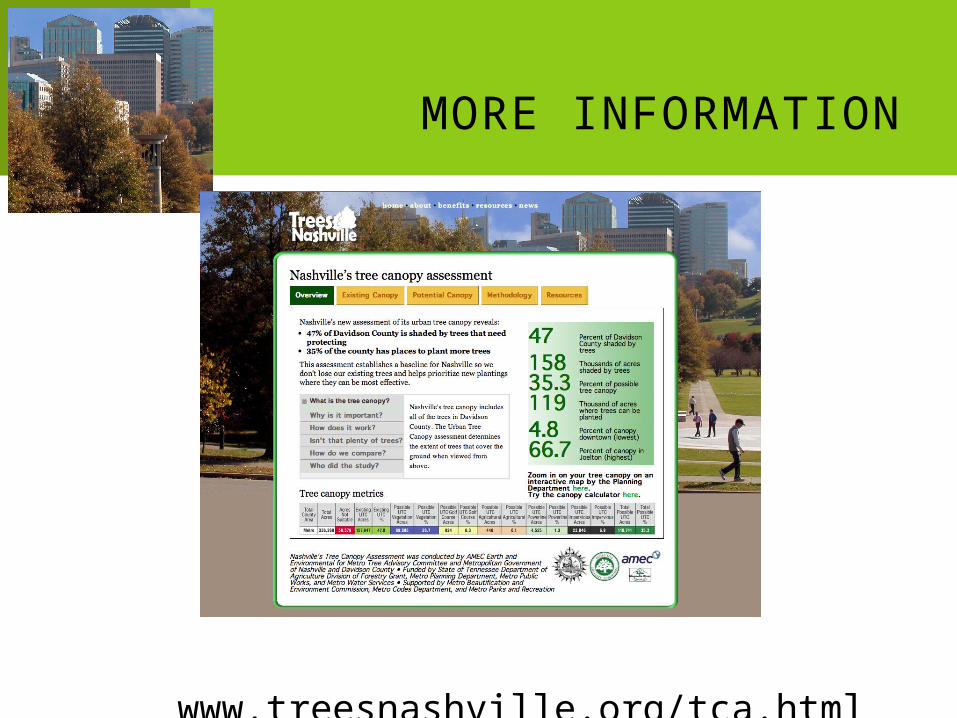
MORE INFORMATION
www.treesnashville.org/tca.html
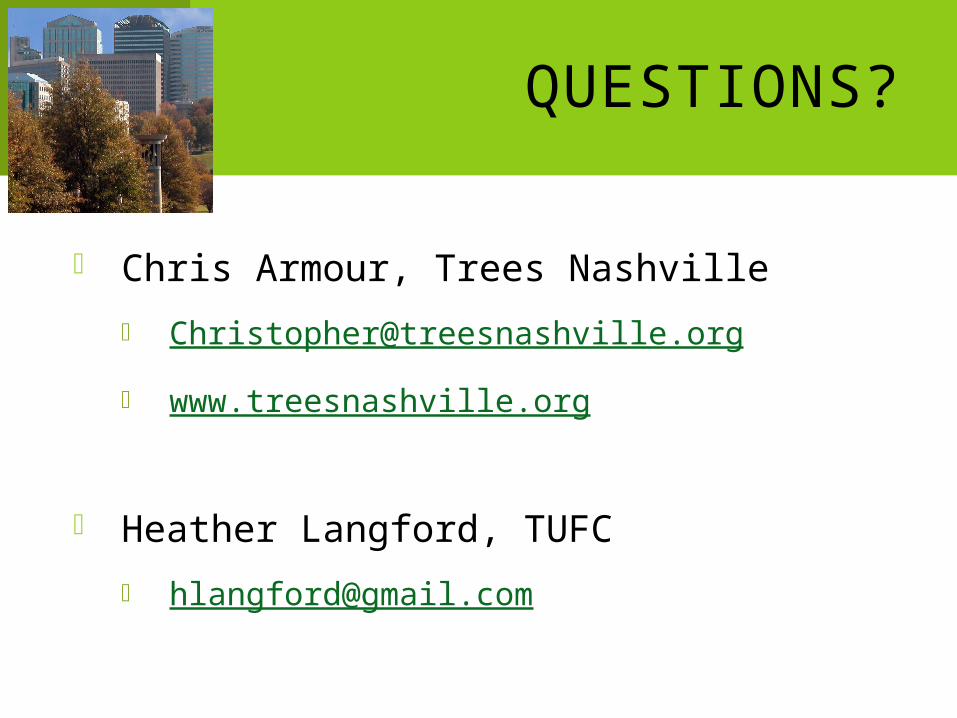
QUESTIONS?
Chris Armour, Trees Nashville [email protected]
www.treesnashville.org
Heather Langford, TUFC [email protected]


![[Arms and Armour Press] Blitzkrieg. Armour Camouflage and Markings, 1939-40](https://img.pdfslide.us/doc/110x75/5453a1e3b1af9fac578b4afe/arms-and-armour-press-blitzkrieg-armour-camouflage-and-markings-1939-40.jpg)