Embed Size (px)
Citation preview
sample is extracted from the ampoule andcleaned of the surrounding excess impreg-nant by standard mechanical polishingtechniques. In this way, we preparednanowires of various metals (In, Sn, andAl) and semiconductors (Se, Te, GaSb,and Bi2Te3) (Fig. 2).
The nanowire composites create substan-tial electric field patterns over the samplesurface. We used a scanning probe microscopeto measure electric fields at the surface of ananocomposite. In a NanoScope (Digital In-struments, Santa Barbara, California) scan-ning force microscope, the sample is mountedwith conductive epoxy to a metal holder andis held at a few volts relative to a conductivecantilever tip that is grounded. The metal-coated, etched, single-crystal silicon tip has aradius of curvature of about 5 nm. The tip isset to oscillate at a frequency near its reso-nance frequency (78 kHz). When the canti-lever encounters a vertical electric field gradi-ent, the effective spring constant is modified,shifting its resonance frequency. By recordingthe amplitude of the cantilever oscillationswhile scanning the sample surface, we obtainan image that reveals the strength of theelectric force gradient (13, 14).
The image, however, may also containtopographical information; it is difficult toseparate the two effects. This is circumvent-ed by taking measurements in two passesover each scan line (15). On the first pass,a topographical image (Fig. 3A) is takenwith the cantilever tapping the surface, andthe information is stored in memory. Onthe second pass, the tip is lifted to aselected separation between the tip andlocal surface topography (typically 20 to200 nm), such that the tip does not touchthe surface. By using the stored topograph-ical data instead of the standard feedback,we can keep the separation constant. Inthis second pass, cantilever oscillation am-plitudes are sensitive to electric force gradi-ents without being influenced by topo-graphic features (Fig. 3B). This two-passmeasurement process is recorded for everyscan line, producing separate topographicand electric force images. From these imag-es, contours of electric force gradient (Fig.3C) can be drawn.
The amplitude of the cantilever oscilla-tions is very large for small lift heights, andthe images fade at separations larger than 80nm. This is consistent with previous reports ofa strong dependence of the tip-surface forceon the vertical separation (13). More workneeds to be done to understand this quantita-tively. Note that some of the nanowires thatappear in the topographic image are missingfrom the electric field image (Fig. 3). This isbecause either electrical contact to thesenanowires has failed or electrical conductionalong the wire length has been interrupted.The scanning force technique thus provides a
802
unique way of mapping the electrical proper-ties of nanocomposites.
Applications of the metal nanowire com-posites include high-density electrical multi-feedthroughs and high-resolution plates fortransferring a two-dimensional charge distri-bution between microelectronic devices. Thesemiconductor nanowires can be used in pho-todetector arrays of high spatial resolution,where each wire acts as a pixel ofsubmicrome-ter dimensions. Also, with the application ofthe injection technique to ultrasmall channelinsulators (channel diameter less than 50 nm)(16, 17), nanowire arrays can be made forfundamental studies of a variety of phenome-na, such as quantum confinement of chargecarriers and mesoscopic transport.
REFERENCES AND NOTES
1. An overview can be found in M. J. Yacaman, T.Tsakalakos, B. H. Kear, Eds., Nanostruct. Mat. 3(nos. 1-6) (1993).
2. R. Roy, Nanophase and Nanocomposite Materi-als, S. Komarneni, J. C. Parker, G. J. Thomas,Eds. (Mat. Res. Soc. Symp. Proc. 286, MaterialsResearch Society, Pittsburgh, PA, 1993), pp.241-250, and references therein.
3. Early work on the preparation of ultrathin super-conducting wires by injection of nanochannelmatrices was done by W. G. Schmidt and R. J.Charles [J. Appl. Phys. 35,2552 (1964)] and byV.N. Bogomolov [Sov. Phys. Usp. 21, 77 (1978)].
4. C. A. Huber and T. E. Huber, J. Appl. Phys. 64,6588 (1988).
5. N. F. Borrelli and J. C. Luong, Proc. SPIE866, 104(1988).
6. B. L. Justus, R. J. Tonucci, A. D. Berry, Appl.Phys. Lett. 61, 3151 (1992).
7. M. J. Tierney and C. R. Martin, J. Phys. Chem. 93,2878 (1989).
8. G. D. Stucky and J. E. Mac Dougall, Science 247,669 (1990), and references therein.
9. P. M. Ajayan and S. lijima, Nature361,333 (1993).10. An array of parallel metal cylinders would be
transparent to light that had a wavelength muchlarger than the cylinder diameter and separationand propagated along the cylinder axis [D. E.Aspnes, A. Heller, J. D. Porter, J. Appl. Phys. 60,3028 (1986)].
11. Whatman Laboratory Division, Clifton, NJ.12. J. W. Diggle, T. C. Downie, C. W. Goulding, J.
Electrochem. Soc. 69, 365 (1969).13. Y. Martin, D. W. Abraham, H. K. Wickramasinghe,
Appl. Phys. Lett. 52, 1103 (1988).14. J. E. Stern, B. D. Terris, H. J. Maimin, D. Rugar,
ibid. 53, 2717 (1988).15. Lift Mode operation, Digital Instruments, Inc., San-
ta Barbara, CA (patent pending).16. R. C. Furneaux, W. R. Rigby, A. P. Davidson,
Nature 337, 147 (1989).17. R. J. Tonucci, B. L. Justus, A. J. Campillo, C. E.
Ford, Science 258, 783 (1992).18. We thank V. Elings for valuable discussions, B.
Schardt and S. Thedford for image processing,and S. Nourbakhsh for electron microscopy. Thiswork was supported by the Army Research Office,the Independent Research Program of the Officeof Naval Research, and the National ScienceFoundation.
22 October 1993; accepted 20 December 1993
Green Fluorescent Protein as aMarker for Gene Expression
Martin Chalfie,* Yuan Tu, Ghia Euskirchen, William W. Ward,Douglas C. Prasherf
A complementary DNA for the Aequorea victoria green fluorescent protein (GFP) producesa fluorescent product when expressed in prokaryotic (Escherichia coli) or eukaryotic(Caenorhabditis elegans) cells. Because exogenous substrates and cofactors are notrequired for this fluorescence, GFP expression can be used to monitor gene expressionand protein localization in living organisms.
Light is produced by the bioluminescentjellyfish Aequorea victoria when calciumbinds to the photoprotein aequorin (1).Although activation of aequorin in vitro orin heterologous cells produces blue light,the jellyfish produces green light. This lightis the result of a second protein in A.victoria that derives its excitation energyM. Chalfie, Y. Tu, G. Euskirchen, Department of Bio-logical Sciences, Columbia University, New York, NY10027, USA.W. W. Ward, Department of Biochemistry and Micro-biology, Cook College, Rutgers University, New Bruns-wick, NJ 08903, USA.D. C. Prasher, Biology Department, Woods HoleOceanographic Institution, Woods Hole, MA 02543,USA.*To whom correspondence should be addressed.fPresent address: U.S. Department of Agriculture,Building 1398, Otis Air National Guard Base, MA02542, USA.
SCIENCE * VOL. 263 * 11 FEBRUARY 1994
from aequorin (2), the green fluorescentprotein (GFP).
Purified GFP, a protein of 238 aminoacids (3), absorbs blue light (maximally at395 nm with a minor peak at 470 nm) andemits green light (peak emission at 509 nmwith a shoulder at 540 nm) (2, 4). Thisfluorescence is very stable, and virtually nophotobleaching is observed (5). Althoughthe intact protein is needed for fluores-cence, the same absorption spectral proper-ties found in the denatured protein arefound in a hexapeptide that starts at aminoacid 64 (6, 7). The GFP chromophore isderived from the primary amino acid se-quence through the cyclization of serine-dehydrotyrosine-glycine within this hexa-peptide (7). The mechanisms that producethe dehydrotyrosine and cyclize the poly-
on
July
30,
200
8 w
ww
.sci
ence
mag
.org
Dow
nloa
ded
from
Fig. 1. Expression of GFP in E. coli. The bacte-ria on the right side of the figure have the GFPexpression plasmid. Cells were photographedduring irradiation with a hand-held long-waveUV source.
peptide to form the chromophore are un-known. To determine whether additionalfactors from A. victoria were needed for theproduction of the fluorescent protein, wetested GFP fluorescence in heterologoussystems. Here, we show that GFP expressedin prokaryotic and eukaryotic cells is capa-ble of producing a strong green fluorescencewhen excited by blue light. Because thisfluorescence requires no additional geneproducts from A. victoria, chromophore for-mation is not species-specific and occurseither through the use of ubiquitous cellularcomponents or by autocatalysis.
Expression ofGFP in Escherichia coli (8)under the control of the T7 promoterresults in a readily detected green fluores-cence (9) that is not observed in controlbacteria. Upon illumination with a long-wave ultraviolet (UV) source, fluorescentbacteria were detected on plates that con-tained the inducer isopropyl-P-D-thioga-lactoside (IPTG) (Fig. 1). Because the
1.0
0.8
C 0.6.5=
j 0.4
0.2
0.0300 400 500 600
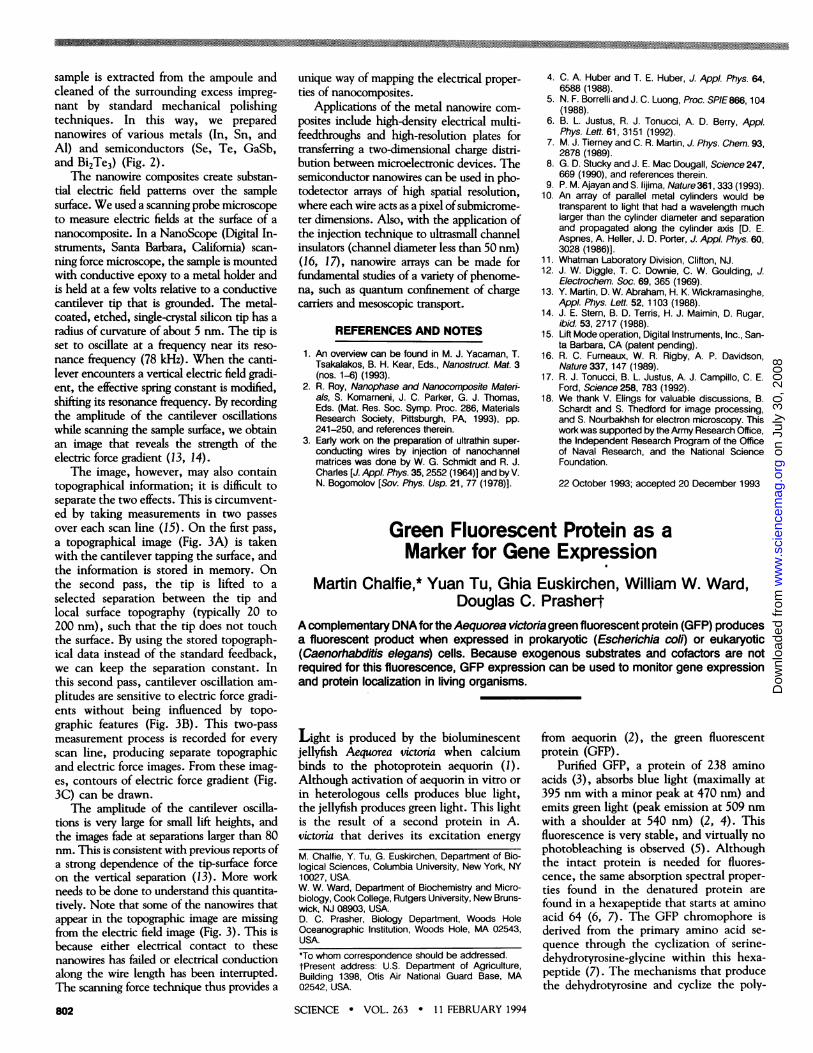
Wavelength (nm)Fig. 2. Excitation and emission spectra of E.coli-generated GFP (solid lines) and purified A.victoria L form GFP (dotted lines).
cells grew well in the continual presenceof the inducer, GFP did not appear tohave a toxic effect on the cells. WhenGFP was partially purified from this strain(10), it was found to have fluorescenceexcitation and emission spectra indistin-guishable from those of the purified nativeprotein (Fig. 2). The spectral properties ofthe recombinant GFP suggest that thechromophore can form in the absence ofother A. victoria products.
Transformation of the nematode Cae-norhabditis elegans also resulted in the pro-duction of fluorescent GFP (II) (Fig. 3).GFP was expressed in a small number ofneurons under the control of a promoterfor the mec-7 gene. The mec-7 gene en-codes a P-tubulin (12) that is abundant insix touch receptor neurons in C. elegansand less abundant in a few other neurons(13, 14). The pattern of expression ofGFP was similar to that detected byMEC-7 antibody or from mec-7-lacZ fu-sions (13-15). The strongest fluorescencewas seen in the cell bodies of the fourembryonically derived touch receptor neu-rons (ALML, ALMR, PLML, and PLMR)in younger larvae. The processes fromthese cells, including their terminalbranches, were often visible in larval ani-mals. In some newly hatched animals, thePLM processes were short and ended inwhat appeared to be prominent growthcones. In older larvae, the cell bodies ofthe remaining touch cells (AVM andPVM) were also seen; the processes ofthese cells were more difficult to detect.These postembryonically derived cellsarise during the first of the four larvalstages (16), but their outgrowth occurs inthe following larval stages (17), with thecells becoming functional during thefourth larval stage (18). The fluorescenceof GFP in these cells is consistent withthese previous results: no fluorescence wasdetected in these cells in newly hatched orlate first-stage larvae, but fluorescence wasseen in four of ten late second-stage lar-
Fig. 3. Expression of GFP in afirst-stage C. elegans larva. Twotouch receptor neurons (ALMRand PLMR) are labeled at theirstrongly fluorescing cell bodies.Processes can be seen project-ing from both of these cell bodies.Halos produced from the out-of-focus homologs of these cells onthe other side of the animal areindicated by arrowheads. Thethick arrow points to the nervering branch from the ALMR cell(out of focus); thin arrows point toweakly fluorescing cell bodies.The background fluorescence isthe result of the animal's autofluo-rescence.
vae, all nine early fourth-stage larvae, andseven of eight young adults (19). In addi-tion, moderate to weak fluorescence wasseen in a few other neurons (Fig. 3) (20).
Like the native protein, GFP expressedin both E. coli and C. elegans is quite stable(lasting at least 10 min) when illuminatedwith 450- to 490-nm light. Some photo-bleaching occurs, however, when the cellsare illuminated with 340- to 390-nm or395- to 440-nm light (21).
Several methods are available to moni-tor gene activity and protein distributionwithin cells. These include the formation offusion proteins with coding sequences forP3-galactosidase, firefly luciferase, and bac-terial luciferase (22). Because such methodsrequire exogenously added substrates or co-factors, they are of limited use with livingtissue. Because the detection of intracellu-lar GFP requires only irradiation by nearUV or blue light, it is not limited by theavailability of substrates. Thus, it shouldprovide an excellent means for monitoringgene expression and protein localization inliving cells (23, 24). Because it does notappear to interfere with cell growth andfunction, GFP should also be a convenientindicator of transformation and one thatcould allow cells to be separated with fluo-rescence-activated cell sorting. We alsoenvision that GFP can be used as a vitalmarker so that cell growth (for example,the elaboration of neuronal processes) andmovement can be followed in situ, especial-ly in animals that are essentially transparentlike C. elegans and zebra fish. The relativelysmall size of the protein may facilitate itsdiffusion throughout the cytoplasm of ex-tensively branched cells like neurons andglia. Because the GFP fluorescence persistsafter treatment with formaldehyde (9),fixed preparations can also be examined. Inaddition, absorption of appropriate laserlight by GFP-expressing cells (as has beendone for Lucifer Yellow-containing cells)(25) could result in the selective killing ofthe cells.
SCIENCE * VOL. 263 * 11 FEBRUARY 1994
It.auulrEl
803
on
July
30,
200
8 w
ww
.sci
ence
mag
.org
Dow
nloa
ded
from
REFERENCES AND NOTES
1. O. Shimomura, F. H. Johnson, Y. Saiga, J. Cell.Comp. Physiol. 59, 223 (1962).
2. J. G. Morin and J. W. Hastings, J. Cell. Physiol. 77,313 (1971); H. Morise, O. Shimomura, F. H.Johnson, J. Winant, Biochemistry 13, 2656 (1974).
3. D. C. Prasher, V. K. Eckenrode, W. W. Ward, F. G.Prendergast, M. J. Cormier, Gene 111, 229(1992).
4. W. W. Ward, C. W. Cody, R. C. Hart, M. J.Cormier, Photochem. Photobiol. 31, 611(1980).
5. F. G. Prendergast, personal communication.6. 0. Shimomura, FEBS Lett. 104, 220 (1979).7. C. W. Cody, D. C. Prasher, W. M. Westler, F. G.
Prendergast, W. W. Ward, Biochemistry 32, 1212(1993).
8. Plasmid pGFP10.1 contains the Eco RI fragmentencoding the GFP complementary DNA (cDNA)from \gfpl0 (3) in pBS(+) (Stratagene). Thefragment was obtained by amplification with thepolymerase chain reaction (PCR) [R. K. Saiki etal., Science 239,487 (1988)] with primers flankingthe Eco RI sites and subsequent digestion withEco RI. DNA was prepared by the Magic Mini-preps procedure (Promega) and sequenced (af-ter an additional ethanol precipitation) on an Ap-plied Biosystems DNA Sequencer 370A at theDNA sequencing facility at Columbia College ofPhysicians and Surgeons. The sequence of thecDNA in pGFP10.1 differs from the publishedsequence by a change in codon 80 within thecoding sequence from CAG to CGG, a changethat replaces a glutamine residue with arginine.[R. Helm, S. Emr, and R. Tsien (personal commu-nication) first alerted us to a possible sequencechange in this clone and independently noted thesame change.] This replacement has no detect-able effect on the spectral properties of the pro-tein (Fig. 2). An E. coli expression construct wasmade with PCR to generate a fragment with anNhe site at the start of translation and an Eco RIsite 5' to the termination signal of the GFP codingsequence from pGFP10.1. The 5' primer wasACAAAGGCTAGCAAAGGAGAAGAAC and the3' primer was the T3 primer (Stratagene). The NheI-Eco RI fragment was ligated into the similarlycut vector pET3a [A. H. Rosenberg et al., Gene56, 125 (1987)] by standard methods (26). Theresulting coding sequence substitutes an Ala forthe initial GFP Met, which becomes the secondamino acid in the polypeptide. The E. coli strainBL21 (DE3) Lys S [F. W. Studier and B. A. Moffat,J. Mol. Biol. 189, 113 (1986)] was transformedwith the resulting plasmid (TU#58) and grown at37°C. Control bacteria were transformed withpET3a. Bacteria were grown on nutrient platescontaining ampicillin (100 Ag/ml) and 0.8 mMIPTG. [A similar PCR-generated fragment (11)was used in our C. elegans construct. As othersare beginning to use pGFP10.1, we have heardthat although similar PCR fragments produce afluorescent product in other organisms (R. Heim,S. Emr, R. Tsien, personal communication; S.Wang and T. Hazelrigg, personal communication;L. Lanini and F. McKeon, personal communica-tion) (23), the Eco RI fragment does not (R. Heim,S. Emr, R. Tsien, personal communication; A.Coxon, J. R. Chaillet, T. Bestor, personal commu-nication). These results may indicate that ele-ments at the 5' end of the sequence or at the startof translation inhibit expression.]
9. We used a variety of microscopes (Zeiss Axio-phot, Nikon Microphot FXA, and Olympus BH2-RFC and BX50) that were equipped for epifluo-rescence microscopy. Usually, filter sets for fluo-rescein isothiocyanate fluorescence were used(for example, the Zeiss filter set used a BP450-490 excitation filter, 510-nm dichroic, and either aBP515-565 or an LP520 emission filter), althoughfor some experiments filter sets that excited atlower wavelengths were used (for example, theZeiss filter set with BP395-440 and LP470 filtersand a 460-nm dichroic or with BP340-390 andLP400 filters with a 395-nm dichroic). In someinstances, a xenon lamp appeared to give a more
intense fluorescence than a mercury lamp whencells were illuminated with light around 470 nm,although usually the results were comparable. Noother attempts were made to enhance the signal(for example, with low-intensity light cameras),although such enhancement may be useful insome instances. Previous experiments had shownthat the native protein was fluorescent after glu-taraldehyde fixation (W. W. Ward, unpublisheddata). S. Wang and T. Hazelrigg (personal com-munication) (23) have found that GFP fusionproteins in Drosophila melanogaster are fluores-cent after formaldehyde fixation. We have con-firmed that fluorescence persists after formalde-hyde fixation with our C. elegans animals and withrecombinant GFP isolated from E. coli. However,the chemicals in nail polish, which is often used toseal cover slips, did appear to interfere with the C.elegans GFP fluorescence.
10. GFP was purified from 250-ml cultures of BL21(DE3) Lys S bacteria containing TU#58; bacteriawere grown in LB broth (26) containing ampicillin(100 pg/ml) and 0.8 mM IPTG. Induction was bestwhen IPTG was present continually. Cells werewashed in 4 ml of 10 mM tris-HCI (pH 7.4), 100mM NaCI, 1 mM MgCI2, and 10 mM dithiothreitol[A. Kumagai and W. G. Dunphy, Cell 64, 903(1991)] and then sonicated (two times for 20 seach) in 4 ml of the same buffer containing 0.1mM phenylmethylsulfonyl fluoride, pepstatin A (1~g/ml), leupeptin (1 ~g/ml), and aprotinin (2 pg/ml) and centrifuged at 5000 rpm for 5 min in thecold. The supernatant was centrifuged a secondtime (15,000 rpm for 15 min) and then dilutedsevenfold with 10 mM tris (pH 8.0), 10 mM EDTA,and 0.02% NaN3. Corrected excitation and emis-sion spectra were obtained with a SPEX FIT11spectrofluorometer (Metuchen, NJ) and com-pared with the purified L isoprotein form of GFPfrom A. victoria (M. Cutler, A. Roth, W. W. Ward,unpublished data). The excitation spectra weremeasured from 300 to 500 nm with a fixed emis-sion wavelength of 509 nm, and the emissionspectra were measured from 410 to 600 nm with afixed excitation of 395 nm. All spectra were re-corded as signal-reference data (where the refer-ence is a direct measurement of the lamp intensitywith a separate photomultiplier tube) at roomtemperature with 1-s integration times and 1-nmincrements. The spectral band widths wereadjusted to 0.94 nm for all spectra.
11. Wild-type and mutant animals were grown andgenetic strains were constructed according to S.Brenner [Genetics 77, 71 (1974)]. The plasmidpGFP10.1 was used as a template for PCR (withthe 5' primer GAATAAAAGCTAGCAAAGATGAG-TAAAG and the 3' T3 primer) to generate afragment with a 5' Nhe site (at the start oftranslation) and a 3' Eco RI site (3' of the termi-nation codon). The DNA was cut to produce anNhe I-Eco RI fragment that was ligated intoplasmid pPD 16.51 (12, 27), a vector containingthe promoter of the C. elegans mec-7 gene.Wild-type C. elegans were transformed by coin-jecting this DNA (TU#64) and the DNA for plas-mid pRF4, which contains the dominant rol-6(sul006) mutation, into adult gonads as described[C. M. Mello, J. M. Kramer, D. Stinchcomb, V.Ambros, EMBO J. 10, 3959 (1991)]. A relativelystable line was isolated (TU1710), and the DNA itcarried was integrated as described by Mitani etal. (15) to produce the integrated elements uls3and uls4 (in strains TU1754 and TU1755, respec-tively). Living animals were mounted on agar (oragarose) pads as described (16), often with 10mM NaN3 as an anesthetic (28) (another nema-tode anesthetic, phenoxypropanol, quenched thefluorescence) and examined with either a Zeissuniversal or axiophot microscope. For C. elegans,a long-pass emission filter works best becausethe animal's intestinal autofluorescence (whichincreases as the animal matures) appears yellow(with band-pass filters the autofluorescence ap-pears green and obscures the GFP fluores-cence). Because much more intense fluores-cence was seen in uls4 than in uls3 animals (for
example, it was often difficult to see the processesof the ALM and PLM cells in uls3 animals whenthe animals were illuminated with a mercurylamp), the former were used for the observationsreported here. The general pattern of cell bodyfluorescence was the same in both strains and inthe parental, nonintegrated strain (fluorescence inthis strain was as strong as that in the uls4animals). The uls4 animals, however, did show anunusual phenotype: both the ALM and PLM touchcells were often displaced anteriorly. The maturecells usually had processes in the correct posi-tions, although occasional cells had abnormallyprojecting processes. These cells could be iden-tified as touch receptor cells because the fluores-cence was dependent on mec-3, a homeoboxgene that specifies touch cell fate (13, 15, 18, 28).Expression of mec-7 is reduced in the ALM touchcells of the head (but not as dramatically in thePLM touch cells of the tail) in mec-3 gene mutants(13, 15). We find a similar change of GFP expres-sion in a mec-3 mutant background for both uls3and uls4. Thus, GFP accurately represents theexpression pattern of the mec-7 gene. It is likelythat the reduced staining in uls3 animals and themisplaced cells in uls4 animals are results ofeither secondary mutations or the amount or po-sition of the integrated DNA.
12. C. Savage et al., Genes Dev. 3, 870 (1989).13. M. Hamelin, I. M. Scott, J. C. Way, J. G. Culotti,
EMBOJ. 11, 2885 (1992).14. A. Duggan and M. Chalfie, unpublished data.15. S. Mitani, H. P. Du, D. H. Hall, M. Driscoll, M.
Chalfie, Development 119, 773 (1993).16. J. E. Sulston and H. R. Horvitz, Dev. Biol. 56, 110
(1977).17. W. W. Walthall and M. Chalfie, Science 239, 643
(1988).18. M. Chalfie and J. Sulston, Dev. Biol. 82, 358
(1981).19. In adults, the thicker size of the animals and the
more intense autofluorescence of the intestinetend to obscure these cells.
20. These include several cells in the head (includingthe FLP cells) and tail of newly hatched animalsand the BDU cells, a pair of neurons just posteriorto the pharynx. Expression of mec-7in these cellshas been seen previously (13, 15). The strongeststaining of these non-touch receptor neurons area pair of cells in the tail that have anteriorlydirected processes that project along the dorsalmuscle line. It is likely that these are the ALN cells,the sister cells to the PLM touch cells [J. G. White,E. Southgate, J. N. Thomson, S. Brenner, Philos.Trans. R. Soc. London Ser. B 314, 1 (1986)].
21. The photobleaching with 395- to 440-nm light isfurther accelerated, to within a second, in thepresence of 10 mM NaN3, which is used as a C.elegans anesthetic (11). However, when cells inC. elegans have been photobleached, some re-covery is seen within 10 min. Further investigationis needed to determine whether this recoveryrepresents de novo synthesis of GFP. Rapid pho-tobleaching (complete within a minute) of thegreen product was also seen when C. eleganswas illuminated with 340- to 390-nm light. Unlikethe photobleaching with 395- to 440-nm light,which abolished fluorescence produced by the340- to 390- or 450- to 490-nm light, photo-bleaching with 340- to 390-nm light did not ap-pear to affect the fluorescence produced by 395-to 490- or 450- to 490-nm light. Indeed, thefluorescence produced by 450- to 490-nm lightappeared to be more intense after brief photo-bleaching by 340- to 390-nm light. This selectivephotobleaching may indicate the production ofmore than one fluorescent product in the animal.These data on GFP fluorescence within E. coliandC. elegans are in contrast to preliminary studiesthat suggest that the isolated native and E. coliproteins are very photostable. We do not knowwhether this in vivo sensitivity to photobleachingis a normal feature of the jellyfish protein (thefluorescence in A. victoria has not been exam-ined) or results from the absence of a necessaryposttranslational modification unique to A. victoria
SCIENCE * VOL. 263 * 11 FEBRUARY 1994804
on
July
30,
200
8 w
ww
.sci
ence
mag
.org
Dow
nloa
ded
from
or from nonspecific damage within the cells.22. Reviewed in T. J. Silhavy and J. R. Beckwith,
Microbiol. Rev. 49, 398 (1985); S. J. Gould and S.Subramani, Anal. Biochem. 175, 5 (1988); and G.S. A. B. Stewart and P. Williams, J. Gen. Microbiol.138, 1289 (1992).
23. R. Helm, S. Emr, and R. Tsien (personal commu-nication) have found that GFP expression in Sac-charomyces cerevisiae can make the cellsstrongly fluorescent without causing toxicity. S.Wang and T. Hazelrigg (personal communication)have found that both COOH-terminal and NH2-terminal protein fusions with GFP are fluorescentin D. melanogaster. L. Lanini and F. McKeon(personal communication) have expressed a GFPprotein fusion in mammalian (COS) cells.
24. We have generated several other plasmid con-
structions that may be useful to investigators.These include a pBluescript II KS (+) derivative(TU#65) containing a Kpn I-Eco RI fragmentencoding GFP with an Age site 5' to the trans-lation start and a Bsm site at the terminationcodon. Also available are gfp versions (TU#60 toTU#63) of the four C. elegans lacZ expressionvectors (pPD16.43, pPD21.28, pPD22.04, andpPD22.11, respectively) as described (27) ex-cept that they lack the Kpn fragment containingthe SV40 nuclear localization signal.
25. J. P. Miller and A. Selverston, Science 206, 702(1979).
26. J. Sanbrook, E. F. Fritsch, T. Maniatis, MolecularCloning: A Laboratory Manual (Cold Spring Har-bor Laboratory Press, Cold Spring Harbor, NY,ed. 2, 1989).
27.
28.29.
A. Fire, S. W. Harrison, D. Dixon, Gene 93, 189(1990).J. C. Way and M. Chalfie, Cell 54, 5 (1988).We are indebted to A. Duggan and D. Xue fortechnical suggestions, to L. Kerr and P. Presley atthe Marine Biological Laboratories at Woods Holefor help with microscopy, to M. Cutler and R.Ludescher for assistance in obtaining the excita-tion and emission spectra, to A. Fire for sugges-tions on vector construction, and to the col-leagues listed in (8) and (23) for permission tocite their unpublished research. Supported byNIH grant GM31997 and a McKnight Develop-ment Award to M.C. and by American CancerSociety grant NP640 to D.C.P.
15 September 1993; accepted 16 November 1993
RNA Polymerase II Initiation Factor Interactionsand Transcription Start Site Selection
Yang Li, Peter M. Flanagan, Herbert Tschochner,*Roger D. Kornbergt
An RNA polymerase II transcription system was resolved and reconstituted from extractsof Schizosaccharomyces pombe. Exchange with components of a Saccharomyces cere-visiae system was undertaken to reveal the factor or factors responsible for the differencein location of the transcription start site, about 30 base pairs and 40 to 120 base pairsdownstream of the TATA box in S. pombe and S. cerevisiae, respectively. Two compo-nents, counterparts of human transcription factor IIF (TFIIF) and TFIIH, could be ex-
changed individually between systems without effect on the start site. Three components,counterparts of human TFIIB, TFIIE, and RNA polymerase II, could not be exchangedindividually but could be swapped in the pairs TFIIE-TFIIH and TFIIB-RNA polymerase II,which demonstrates that there are functional interactions between these components.Moreover, exchange of the latter pair shifted the starting position, which shows that TFIIBand RNA polymerase II are solely responsible for determining the start site of transcription.
Synthesis of mRNA in eukaryotes requiresRNA polymerase II and accessory factors,some which are general and act at most, ifnot all, promoters, and others of whichconfer specificity and control. Five generalfactors-a, b, d, e, and g-have been puri-fied to homogeneity from the budding yeastSaccharomyces cerevisiae and have been iden-tified as counterparts of human-rat factorsTFIIE-E, TFIIH-6, TFIID-r, TFIIB-ot, andTFIIF-Py, respectively (1-8). Because thesefactors assemble at a promoter in a complexwith RNA polymerase II, interactionsamong them are assumed to be important forthe initiation of transcription.
Most studies of general factor interactionshave focused on binding (8). The resultshave shown that the order of assembly of theinitiation complex on promoter DNA beginswith factor d (TFIID), is followed by factor e(TFIIB), and then by polymerase and theremaining factors (6, 9). Factors b (TFIIH),e, and g (TFIIF), however, bind directly to
Department of Cell Biology, Stanford University,School of Medicine, Stanford, CA 94305, USA.
*Present address: Institute fur Biochemie I, Der Uni-versitat Heidelberg, Im Neuenheimer Feld 328, 6900Heidelberg, Germany.tTo whom correspondence should be addressed.
polymerase II, and as many as four of the fivefactors may assemble with the polymerase ina holoenzyme (10) before promoter binding.There are a couple of limitations implicit inthese findings: The functional significance ofinteractions revealed by binding is question-able because only a few percent of initiationcomplexes give rise to transcripts, and thereis little indication of the roles of the variousinteractions in the initiation process.We have used a functional approach to
analyze general transcription factor interac-tions on the basis of the ability of factors to beexchanged between transcription systems. Ex-change between S. cerevisiae and mammaliansystems is of interest because of a markeddifference in location of the transcription startsite, 40 to 120 base pairs downstream of theTATA box in the former versus about 30 basepairs in the latter (11). The TATA-bindingcomponent (TBP) of factor d (TFIID) isfunctionally interchangeable between S. cere-visiae and humans (4, 12, 13), but the tran-scription start site remains characteristic ofthe particular transcription system, irrespec-tive of the source ofTBP. The factor or factorsresponsible for start site selection could not beidentified by this approach because neitherthe other factors nor the polymerase provedinterchangeable between S. cerevisiae andhigher eukaryotic systems. We decided to usea Schizosaccharomyces pombe system because ofits similarity to higher eukaryotes in the loca-tion ofRNA polymerase II transcription startsites and its closer evolutionary relation to S.cerevisiae. Initiation from S. pombe promotersoccurs about 30 base pairs downstream of theTATA box, and initiation from mammalianpromoters introduced in S. pombe occurs atthe same sites as in mammalian cells (14).We have described the derivation of a
chromatographic fraction from S. pombe that,upon addition of TBP, will support promoter-dependent RNA polymerase II transcription
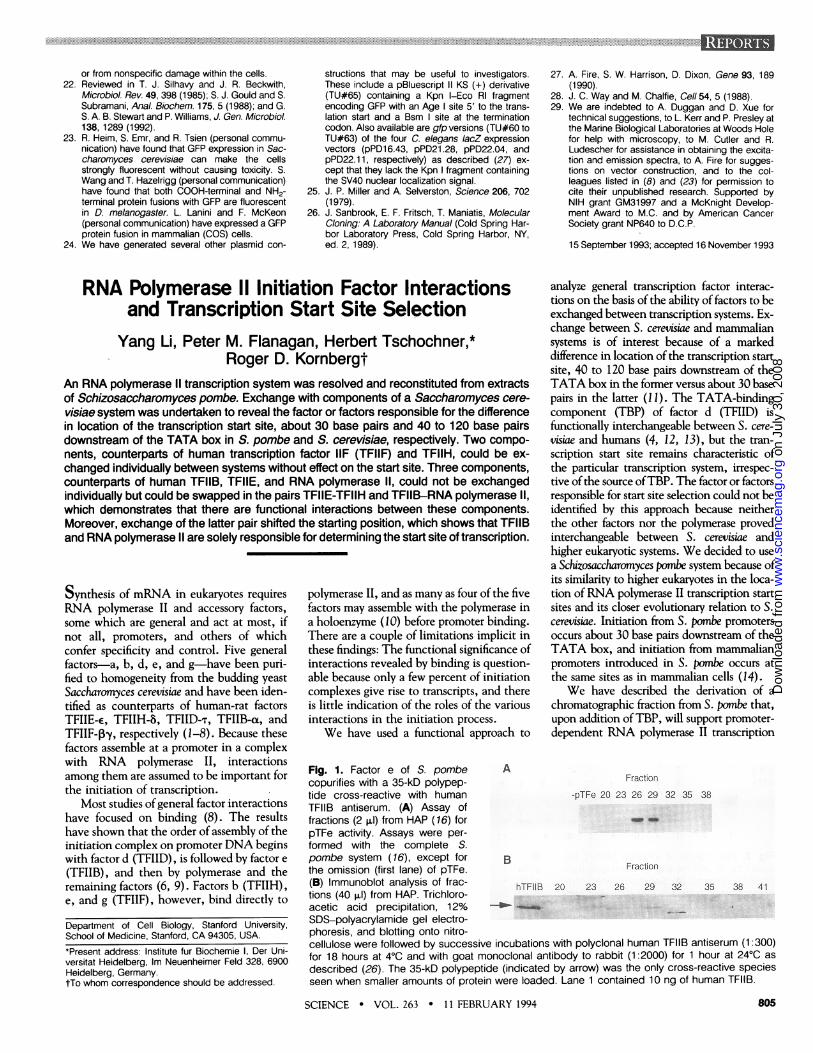
Fig. 1. Factor e of S. pombe Acopurifies with a 35-kD polypep- Fractiontide cross-reactive with human -pTFe 20 23 26 29 32 35 38TFIIB antiserum. (A) Assay offractions (2 pil) from HAP (16) for 'S 4pTFe activity. Assays were per-formed with the complete S.pombe system (16), except for Bthe omission (first lane) of pTFe. Fraction(B) Immunoblot analysis of frac- hTFIIB 20 23 26 29 32 35 38 41tions (40 1l) from HAP. Trichloro-acetic acid precipitation, 12% - . ...SDS-polyacrylamide gel electro-phoresis, and blotting onto nitro-cellulose were followed by successive incubations with polyclonal human TFIIB antiserum (1:300)for 18 hours at 4°C and with goat monoclonal antibody to rabbit (1:2000) for 1 hour at 24°C asdescribed (26). The 35-kD polypeptide (indicated by arrow) was the only cross-reactive speciesseen when smaller amounts of protein were loaded. Lane 1 contained 10 ng of human TFIIB.
SCIENCE * VOL. 263 * 11 FEBRUARY 1994
a.plrala
805
on
July
30,
200
8 w
ww
.sci
ence
mag
.org
Dow
nloa
ded
from