Embed Size (px)
Citation preview
Green Environmental Sustainability Progress Report July to December 2016
A detailed bi-annual overview of the City of Sydney’s progress against our environmental sustainability targets for both the Local Government Area (LGA) and the City’s own operations.
1. Highlights 3
2. Draft Environmental Strategy 2016-2021 5
3. Our future targets 6
4. Sustainability at the City of Sydney 8
5. Low-carbon city 9
6. Water sensitive city 19
7. Climate resilient city 28
8. Zero waste city 31
9. Active and connected city 36
10. Green and cool city 41
11. Delivering to the community 47
12. Glossary 53
13. Appendix 1: Data management plan 56
14. Appendix 2: Environmental Policy 58
Green Environmental Sustainability Progress Report July to December 2016
2
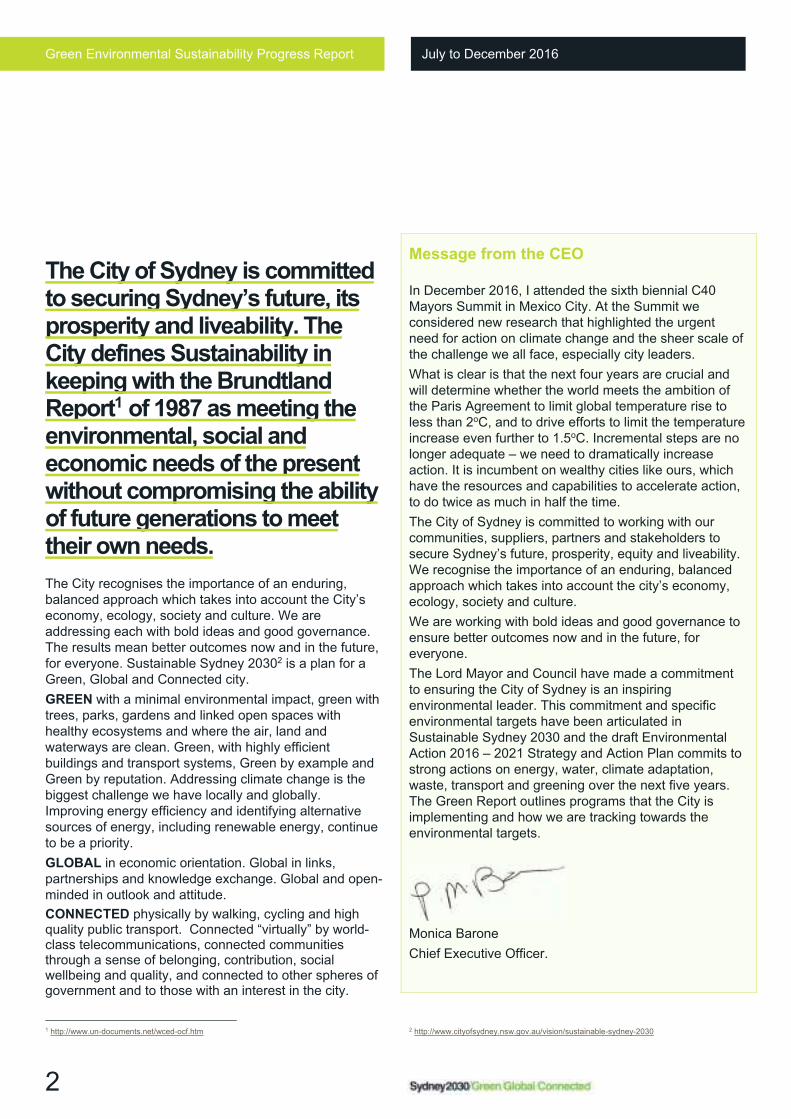
The City of Sydney is committed to securing Sydney’s future, its prosperity and liveability. The City defines Sustainability in keeping with the Brundtland Report1 of 1987 as meeting the environmental, social and economic needs of the present without compromising the ability of future generations to meet their own needs.
The City recognises the importance of an enduring, balanced approach which takes into account the City’s economy, ecology, society and culture. We are addressing each with bold ideas and good governance. The results mean better outcomes now and in the future, for everyone. Sustainable Sydney 20302 is a plan for a Green, Global and Connected city.
GREEN with a minimal environmental impact, green with trees, parks, gardens and linked open spaces with healthy ecosystems and where the air, land and waterways are clean. Green, with highly efficient buildings and transport systems, Green by example and Green by reputation. Addressing climate change is the biggest challenge we have locally and globally. Improving energy efficiency and identifying alternative sources of energy, including renewable energy, continue to be a priority.
GLOBAL in economic orientation. Global in links, partnerships and knowledge exchange. Global and open-minded in outlook and attitude.
CONNECTED physically by walking, cycling and high quality public transport. Connected “virtually” by world-class telecommunications, connected communities through a sense of belonging, contribution, social wellbeing and quality, and connected to other spheres of government and to those with an interest in the city.
1 http://www.un-documents.net/wced-ocf.htm
Message from the CEO
In December 2016, I attended the sixth biennial C40 Mayors Summit in Mexico City. At the Summit we considered new research that highlighted the urgent need for action on climate change and the sheer scale of the challenge we all face, especially city leaders.
What is clear is that the next four years are crucial and will determine whether the world meets the ambition of the Paris Agreement to limit global temperature rise to less than 2oC, and to drive efforts to limit the temperature increase even further to 1.5oC. Incremental steps are no longer adequate – we need to dramatically increase action. It is incumbent on wealthy cities like ours, which have the resources and capabilities to accelerate action, to do twice as much in half the time.
The City of Sydney is committed to working with our communities, suppliers, partners and stakeholders to secure Sydney’s future, prosperity, equity and liveability. We recognise the importance of an enduring, balanced approach which takes into account the city’s economy, ecology, society and culture.
We are working with bold ideas and good governance to ensure better outcomes now and in the future, for everyone.
The Lord Mayor and Council have made a commitment to ensuring the City of Sydney is an inspiring environmental leader. This commitment and specific environmental targets have been articulated in Sustainable Sydney 2030 and the draft Environmental Action 2016 – 2021 Strategy and Action Plan commits to strong actions on energy, water, climate adaptation, waste, transport and greening over the next five years. The Green Report outlines programs that the City is implementing and how we are tracking towards the environmental targets.
Monica Barone
Chief Executive Officer.
2 http://www.cityofsydney.nsw.gov.au/vision/sustainable-sydney-2030
Green Environmental Sustainability Progress Report July to December 2016
3
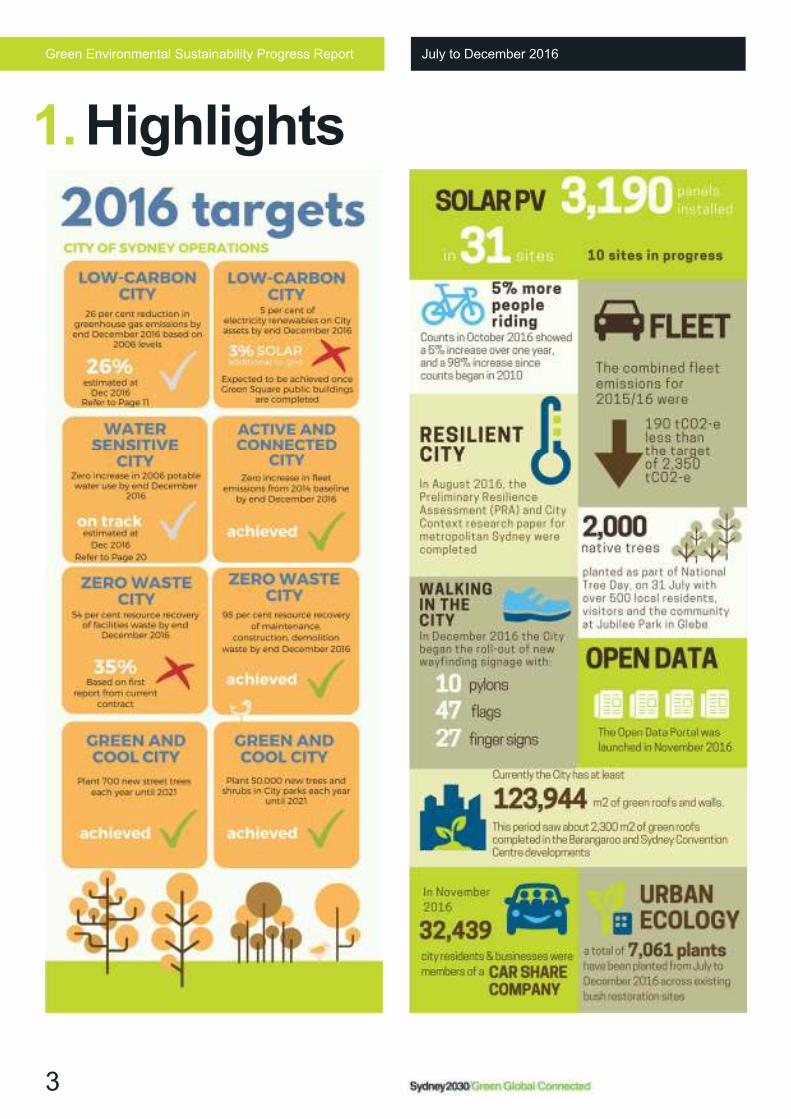
1. Highlights
Green Environmental Sustainability Progress Report July to December 2016
4
Green Environmental Sustainability Progress Report July to December 2016
5
Sustainable Sydney 2030 outlined the aspiration of our community and businesses for our local government area to be an environmental leader on a global scale.
In June 2016, the Council of the City of Sydney endorsed the draft Environmental Action 2016 – 2021 Strategy and
Action Plan (the strategy) for public exhibition. This strategy combines the insights and data from these documents. It outlines our progress to date, and approach to achieving our bold Sustainable Sydney 2030 targets across six themes:
Low-carbon city
We have set ambitious targets for emissions reduction for both our own operations and for the LGA. To achieve deep reductions we will identify energy efficiency opportunities, optimise use of renewable energy and energy storage, and generate low-carbon energy locally.
Water sensitive city
To build resilience to the predicted impacts of climate change, we need to keep our city cool and green. We aim to minimise use of potable water through efficiency and by capturing alternative water sources to recycle for non-potable purposes. Stormwater management will improve the health of our waterways.
Climate resilient city
Our city will experience more heatwaves, extreme storms and flash flooding events as a result of climate change. We need to respond to these changes by collaborating with other agencies to respond effectively in emergencies and protect vulnerable members of the community. Long term planning for infrastructure needs to take into account future climate predictions.
Zero waste city
We see the city’s waste as a valuable resource and will work with the city’s residents and businesses to divert waste away from landfill and encourage more re-use, recycling and energy recovery.
Active and connected city
The City aims to promote the most sustainable modes of transport for residents, workers and visitors to reduce emissions and improve air quality and local amenity. We are improving walking and cycling infrastructure and working with the state government to enhance public transport.
Green and cool city
We are increasing the canopy cover across the city and preserving and increasing native plant and animal habitats. Greening the city reduces the urban heat island effect, improves local air quality and enhances the liveability of the urban environment.
The strategy and action plan details how we will deliver against targets set for our own operations and how we will influence and collaborate with others to contribute towards the achievement of targets for the local government area from 2016 to 2021.
During this five year period, the action plan will be reviewed and adjusted annually as technology progresses, regulatory reforms occur, we continue to learn and stakeholder feedback is continuously incorporated.
2. Draft Environmental Strategy 2016-2021
Green Environmental Sustainability Progress Report July to December 2016
6
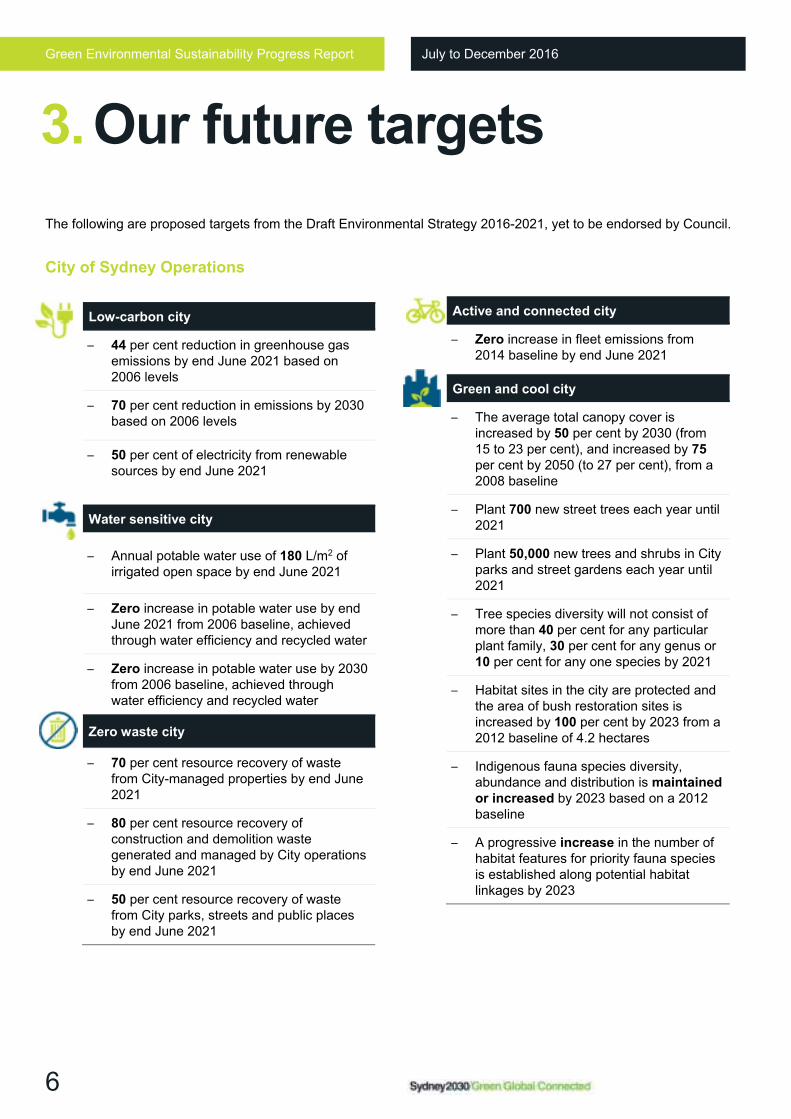
The following are proposed targets from the Draft Environmental Strategy 2016-2021, yet to be endorsed by Council.
City of Sydney Operations
Low-carbon city
– 44 per cent reduction in greenhouse gas emissions by end June 2021 based on 2006 levels
– 70 per cent reduction in emissions by 2030 based on 2006 levels
– 50 per cent of electricity from renewable sources by end June 2021
Water sensitive city
– Annual potable water use of 180 L/m2 of irrigated open space by end June 2021
– Zero increase in potable water use by end June 2021 from 2006 baseline, achieved through water efficiency and recycled water
– Zero increase in potable water use by 2030 from 2006 baseline, achieved through water efficiency and recycled water
Zero waste city
– 70 per cent resource recovery of waste from City-managed properties by end June 2021
– 80 per cent resource recovery of construction and demolition waste generated and managed by City operations by end June 2021
– 50 per cent resource recovery of waste from City parks, streets and public places by end June 2021
Active and connected city
– Zero increase in fleet emissions from 2014 baseline by end June 2021
Green and cool city
– The average total canopy cover is increased by 50 per cent by 2030 (from 15 to 23 per cent), and increased by 75 per cent by 2050 (to 27 per cent), from a 2008 baseline
– Plant 700 new street trees each year until 2021
– Plant 50,000 new trees and shrubs in City parks and street gardens each year until 2021
– Tree species diversity will not consist of more than 40 per cent for any particular plant family, 30 per cent for any genus or 10 per cent for any one species by 2021
– Habitat sites in the city are protected and the area of bush restoration sites is increased by 100 per cent by 2023 from a 2012 baseline of 4.2 hectares
– Indigenous fauna species diversity, abundance and distribution is maintained
or increased by 2023 based on a 2012 baseline
– A progressive increase in the number of habitat features for priority fauna species is established along potential habitat linkages by 2023
3. Our future targets
Green Environmental Sustainability Progress Report July to December 2016
7
Local Government Area
Since the targets for Sustainable Sydney 2030 were set, the City of Sydney local government area (LGA) has undergone significant growth and is expected to continue to grow.
Regardless of future growth, the 2030 targets set by the City of Sydney are absolute.
Zero waste city
– 70 per cent recycling and recovery of residential waste from the local government area by end June 2021
– 70 per cent recycling and recovery of commercial and industrial waste from the local government area by end June 2021
– 80 per cent recycling and recovery of construction and demolition waste from the city by end June 2021
Active and connected city
– 33 per cent of trips to work during the AM peak undertaken by walking by 2030, by city residents
– 10 per cent of total trips made in the city are undertaken by bicycle by 2030
– 80 per cent of trips to work during the AM peak are undertaken by public transport by 2030, by city residents and those travelling to Central Sydney from elsewhere
– 30 per cent of city residents who drive (with an unrestricted drivers licence) are members of a car sharing scheme by 2030
Green and cool city
– The average total canopy cover is increased by 50 per cent by 2030 (from 15 to 23 per cent), and increased by 75 per cent by 2050 (to 27 per cent), from a 2008 baseline
Low-carbon city
– 70 per cent reduction in greenhouse gas emissions by 2030 based on 2006 levels
– Net zero emissions by 2050
– 50 per cent of electricity demand met by renewable sources by 2030
Water sensitive city
– Zero increase in potable water use by 2030 from 2006 baseline, achieved through water efficiency and recycled water
– 50 per cent reduction in the annual solid pollution load discharged to waterways via stormwater by 2030
– 15 per cent reduction in annual nutrient load discharged to waterways via stormwater by 2030
Green Environmental Sustainability Progress Report July to December 2016
8
The City’s commitment to environmental leadership to 2030 is demonstrated by our ambitious targets for emissions, energy, water, waste and green space.
Environmental Commitment
The City’s Environment Policy3 applies to all City of Sydney’s operations, assets, activities and staff.
An Environmental Management System (EMS) supports the City’s commitment to ensuring sustainable asset management and operations.
The Green report is the City of Sydney’s state of the environment report and fulfils the reporting requirements of the NSW Local Government Act 1993 No. 30 Section 428A and the Integrated Planning and Reporting guidelines.
Sustainable Procurement
The City of Sydney is committed to doing business with ethical and socially responsible suppliers. The City sees our suppliers as partners in our sustainability program. We take great care in selecting the companies who supply us with products and services, and expect each of them to operate in line with international, national and local standards and appropriate codes of practice.
The City became a founding member of Supply Nation in 2010, the first and pre-eminent supplier diversity organisation in Australia which connects Australia’s leading brands and government with Indigenous businesses across the country. The City’s Procurement and Social Economic teams developed and presented a social procurement workshop for Aboriginal & Torres Strait Islander businesses, aimed at providing these businesses with an understanding on how to search, and bid, for business opportunities offered by the City. This very successful workshop will be replicated at the upcoming Supply Nation “Connect 2017” conference.
3 City of Sydney Environmental Policy can be seen in Appendix 2.
The City’s Procurement teams have developed a suite of reports to track usage on Cabcharge and Petty Cash. Introduction of these reports have reduced Taxi travel by over 50%, while introducing staff to healthier and more sustainably friendly modes of transport such as walking or riding one of the City’s bike fleet.
Sustainable events management
The City runs many events each year to celebrate the diverse cultural, sporting and recreational aspects of Sydney. These include both small events and larger events such as Sydney New Year’s Eve and Chinese New Year.
We recognise the importance of a balanced approach to
event management which takes into account the city's
economy, ecology, society and culture. Our goal is to
reduce the impact of events we manage and approve on
the environment. The City’s Sustainable Event
Management Policy and Guidelines encourage, and in
some cases require, that events run by the City:
– minimise waste generation
– maximise recycling
– minimise energy consumption
– maximise use of renewable energy
– minimise water consumption
– conserve bio-diversity
– minimise impacts on climate change and
– promote principles of sustainability
Sydney New Year’s Eve
The City undertook a greenhouse gas assessment of
Sydney New Year’s Eve for the period 2008 to 2015. In
the most recent assessment, the estimated total carbon
emissions were 552 tCO2-e. This represented a net
reduction of 14.6 per cent in a like for like comparison
when compared with the base year emissions of 2012. The City will continue to implement sustainability actions
to reduce carbon emissions related to the event. These
include the use of LED lighting, reuse of materials,
maximising recycling, and assessment of supplier
environmental sustainability policies and practices.
4. Sustainability at the City of Sydney
Green Environmental Sustainability Progress Report July to December 2016
9
Cities contribute around 70 per cent of the world’s carbon emissions and can play a significant role in creating a net zero future.
In Sustainable Sydney 2030, we set a 2030 target to reduce emissions both across the city and in our operations by 70 per cent below 2006 levels. In our draft Environmental Action 2016-2021 Strategy and Action Plan, we have strengthened our renewable energy targets for both our own operations and in our local government area.
Our ambitious plans across the city and our own operations will help us to use less energy and improve energy efficiency, comfort and productivity.
5. Low-carbon city
ADVOCACY
Energy market reform
Under the current National Electricity Rules, full network
charges are still payable if a building with solar photovoltaic
panels or trigeneration sends surplus power to the building
next door. This fails to reward the savings a building has
made by not using the long-distance electricity network of
poles and wires.
The City and others proposed regulatory changes to the
National Electricity Rules to improve financial returns for
local generators. Unfortunately the Australian Energy Market
Commission rejected this proposal. This is highly
disappointing as the rule change would have had a positive
effect on the uptake of building and district-scale renewable
energy generation across Australia.
Green Environmental Sustainability Progress Report July to December 2016
10
City of Sydney Operations
Carbon Neutral Program
The City has been measuring, reducing and offsetting all of its operational greenhouse gas emissions since 2006/07. In 2011, the City of Sydney became the first of any level of Government in Australia to be certified as Carbon Neutral under the Australian Government National Carbon Offset Standard (NCOS).
The City remains carbon neutral by continuing to implement emissions saving projects, developing a greenhouse gas emissions inventory with independent verification, and through the provision of accredited offsets equivalent to 100 per cent of the organisation’s emissions.
How we do it
Measure
Any carbon neutral claims must be accurate and verified independently.
Avoid and reduce
The City has been achieving real energy and greenhouse gas emissions savings in our buildings, street lighting, and fleet operations.
Renewable Energy
The City has committed $2 million each year to install renewable energy onto our properties, to generate clean energy locally where and when it is required.
Offset
The City reduces its carbon liability by avoiding and reducing emissions and using offsets for emissions that can’t be avoided.
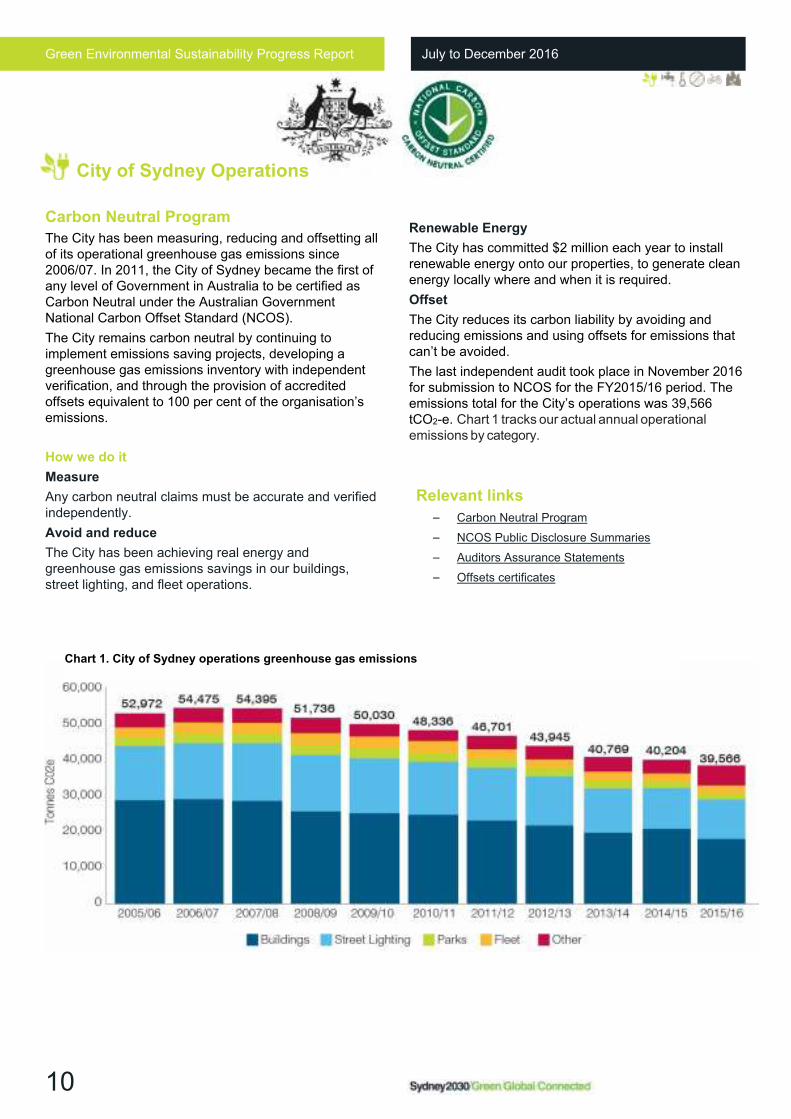
The last independent audit took place in November 2016 for submission to NCOS for the FY2015/16 period. The emissions total for the City’s operations was 39,566 tCO2-e. Chart 1 tracks our actual annual operational emissions by category.
Relevant links
– Carbon Neutral Program
– NCOS Public Disclosure Summaries
– Auditors Assurance Statements
– Offsets certificates
Chart 1. City of Sydney operations greenhouse gas emissions
Green Environmental Sustainability Progress Report July to December 2016
11
Our operational targets
Greenhouse gas emissions
– 44 per cent reduction in greenhouse gas emissions by end June 2021, based on 2006 levels
– 70 per cent reduction in greenhouse gas emissions by 2030 based on 2006 levels
Renewable
energy
– 50 per cent of electricity demand met by renewable sources by end June 2021
How we are tracking
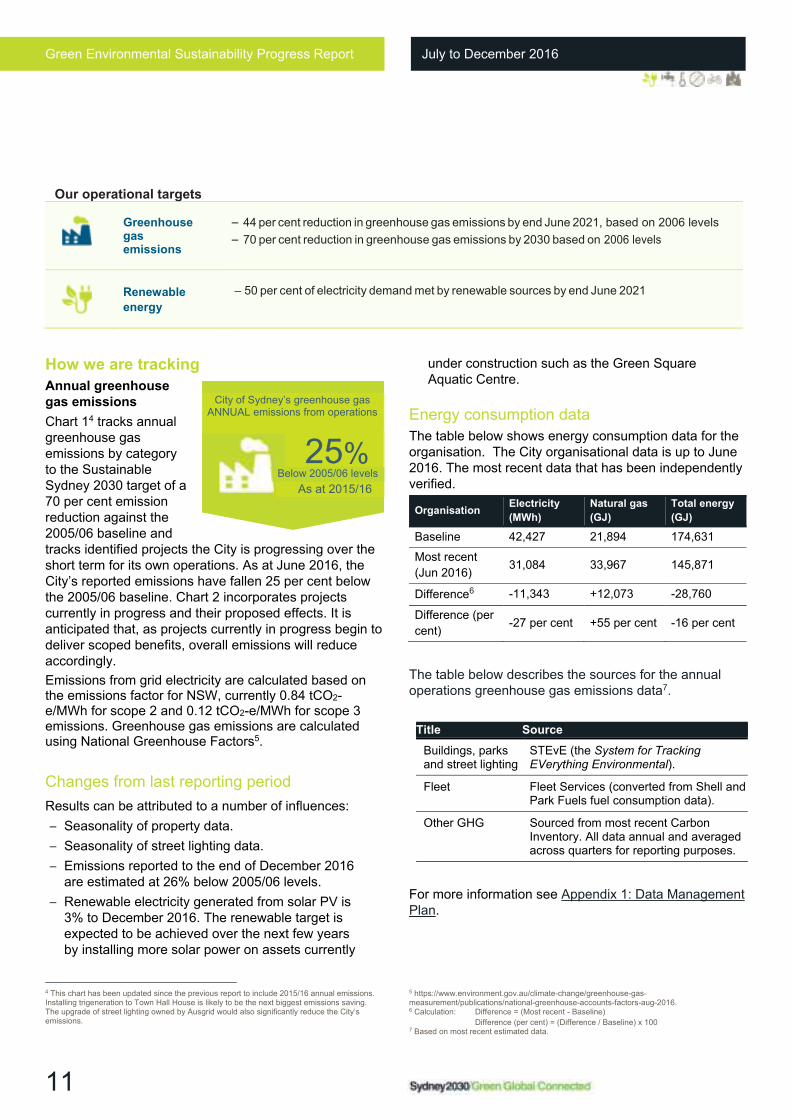
Annual greenhouse
gas emissions
Chart 14 tracks annual greenhouse gas emissions by category to the Sustainable Sydney 2030 target of a 70 per cent emission reduction against the 2005/06 baseline and tracks identified projects the City is progressing over the short term for its own operations. As at June 2016, the City’s reported emissions have fallen 25 per cent below the 2005/06 baseline. Chart 2 incorporates projects currently in progress and their proposed effects. It is anticipated that, as projects currently in progress begin to deliver scoped benefits, overall emissions will reduce accordingly.
Emissions from grid electricity are calculated based on the emissions factor for NSW, currently 0.84 tCO2-e/MWh for scope 2 and 0.12 tCO2-e/MWh for scope 3 emissions. Greenhouse gas emissions are calculated using National Greenhouse Factors5.
Changes from last reporting period
Results can be attributed to a number of influences:
– Seasonality of property data.
– Seasonality of street lighting data.
– Emissions reported to the end of December 2016 are estimated at 26% below 2005/06 levels.
– Renewable electricity generated from solar PV is 3% to December 2016. The renewable target is expected to be achieved over the next few years by installing more solar power on assets currently
4 This chart has been updated since the previous report to include 2015/16 annual emissions. Installing trigeneration to Town Hall House is likely to be the next biggest emissions saving. The upgrade of street lighting owned by Ausgrid would also significantly reduce the City’s emissions.
under construction such as the Green Square Aquatic Centre.
Energy consumption data
The table below shows energy consumption data for the organisation. The City organisational data is up to June 2016. The most recent data that has been independently verified.
Organisation Electricity
(MWh)
Natural gas
(GJ)
Total energy
(GJ)
Baseline 42,427 21,894 174,631
Most recent
(Jun 2016) 31,084 33,967 145,871
Difference6 -11,343 +12,073 -28,760
Difference (per
cent) -27 per cent +55 per cent -16 per cent
The table below describes the sources for the annual operations greenhouse gas emissions data7.
Title Source
Buildings, parks and street lighting
STEvE (the System for Tracking EVerything Environmental).
Fleet Fleet Services (converted from Shell and Park Fuels fuel consumption data).
Other GHG Sourced from most recent Carbon Inventory. All data annual and averaged across quarters for reporting purposes.
For more information see Appendix 1: Data Management Plan.
5 https://www.environment.gov.au/climate-change/greenhouse-gas-measurement/publications/national-greenhouse-accounts-factors-aug-2016. 6 Calculation: Difference = (Most recent - Baseline)
Difference (per cent) = (Difference / Baseline) x 100 7 Based on most recent estimated data.
City of Sydney’s greenhouse gas ANNUAL emissions from operations
25% As at 2015/16
Below 2005/06 levels
Green Environmental Sustainability Progress Report July to December 2016
12
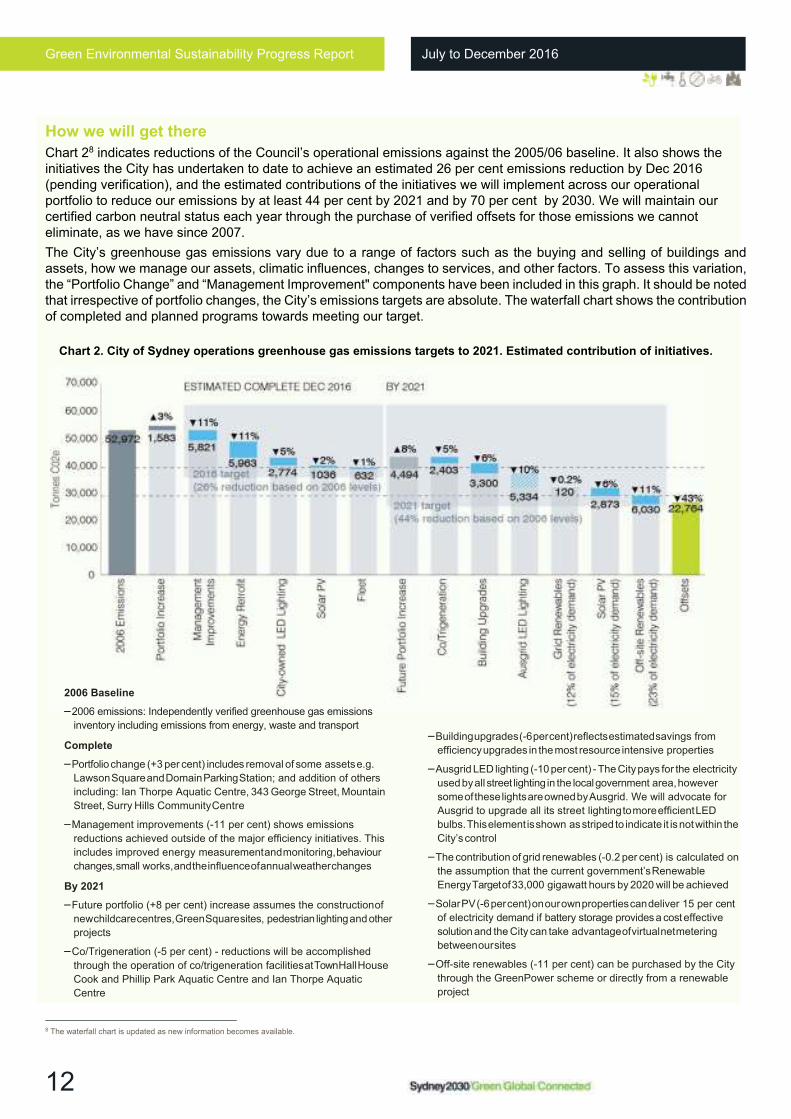
How we will get there
Chart 28 indicates reductions of the Council’s operational emissions against the 2005/06 baseline. It also shows the initiatives the City has undertaken to date to achieve an estimated 26 per cent emissions reduction by Dec 2016 (pending verification), and the estimated contributions of the initiatives we will implement across our operational portfolio to reduce our emissions by at least 44 per cent by 2021 and by 70 per cent by 2030. We will maintain our certified carbon neutral status each year through the purchase of verified offsets for those emissions we cannot eliminate, as we have since 2007.
The City’s greenhouse gas emissions vary due to a range of factors such as the buying and selling of buildings and assets, how we manage our assets, climatic influences, changes to services, and other factors. To assess this variation, the “Portfolio Change” and “Management Improvement" components have been included in this graph. It should be noted that irrespective of portfolio changes, the City’s emissions targets are absolute. The waterfall chart shows the contribution of completed and planned programs towards meeting our target.
2006 Baseline
– 2006 emissions: Independently verified greenhouse gas emissions
inventory including emissions from energy, waste and transport
Complete
– Portfolio change (+3 per cent) includes removal of some assets e.g.
Lawson Square and Domain Parking Station; and addition of others
including: Ian Thorpe Aquatic Centre, 343 George Street, Mountain
Street, Surry Hills Community Centre
– Management improvements (-11 per cent) shows emissions
reductions achieved outside of the major efficiency initiatives. This
includes improved energy measurement and monitoring, behaviour
changes, small works, and the influence of annual weather changes
By 2021
– Future portfolio (+8 per cent) increase assumes the construction of
new childcare centres, Green Square sites, pedestrian lighting and other
projects
– Co/Trigeneration (-5 per cent) - reductions will be accomplished
through the operation of co/trigeneration facilities at Town Hall House
Cook and Phillip Park Aquatic Centre and Ian Thorpe Aquatic
Centre
8 The waterfall chart is updated as new information becomes available.
– Building upgrades (-6 per cent) reflects estimated savings from
efficiency upgrades in the most resource intensive properties
– Ausgrid LED lighting (-10 per cent) - The City pays for the electricity
used by all street lighting in the local government area, however
some of these lights are owned by Ausgrid. We will advocate for
Ausgrid to upgrade all its street lighting to more efficient LED
bulbs. This element is shown as striped to indicate it is not within the
City’s control
– The contribution of grid renewables (-0.2 per cent) is calculated on
the assumption that the current government’s Renewable
Energy Target of 33,000 gigawatt hours by 2020 will be achieved
– Solar PV (-6 per cent) on our own properties can deliver 15 per cent
of electricity demand if battery storage provides a cost effective
solution and the City can take advantage of virtual net metering
between our sites
– Off-site renewables (-11 per cent) can be purchased by the City
through the GreenPower scheme or directly from a renewable
project
Chart 2. City of Sydney operations greenhouse gas emissions targets to 2021. Estimated contribution of initiatives.
Green Environmental Sustainability Progress Report July to December 2016
13
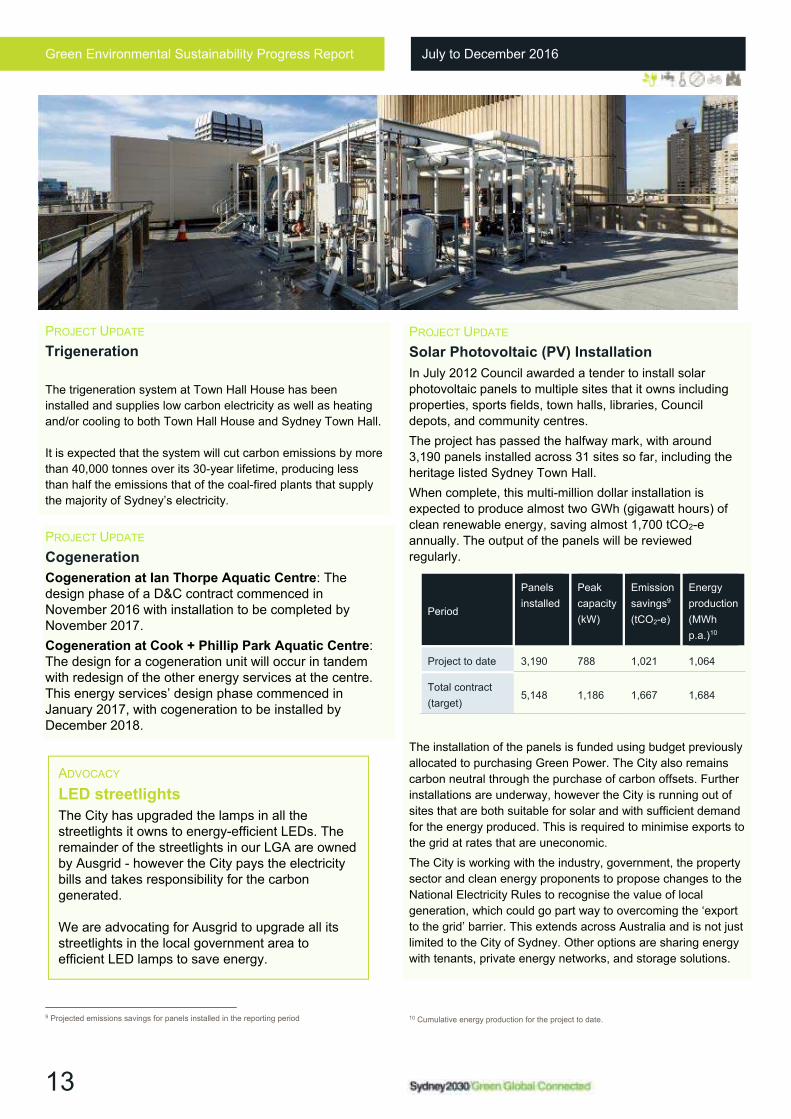
PROJECT UPDATE
Trigeneration
The trigeneration system at Town Hall House has been
installed and supplies low carbon electricity as well as heating
and/or cooling to both Town Hall House and Sydney Town Hall.
It is expected that the system will cut carbon emissions by more
than 40,000 tonnes over its 30-year lifetime, producing less
than half the emissions that of the coal-fired plants that supply
the majority of Sydney’s electricity.
PROJECT UPDATE
Cogeneration
Cogeneration at Ian Thorpe Aquatic Centre: The design phase of a D&C contract commenced in November 2016 with installation to be completed by November 2017.
Cogeneration at Cook + Phillip Park Aquatic Centre: The design for a cogeneration unit will occur in tandem with redesign of the other energy services at the centre. This energy services’ design phase commenced in January 2017, with cogeneration to be installed by December 2018.
9 Projected emissions savings for panels installed in the reporting period
PROJECT UPDATE
Solar Photovoltaic (PV) Installation
In July 2012 Council awarded a tender to install solar
photovoltaic panels to multiple sites that it owns including
properties, sports fields, town halls, libraries, Council
depots, and community centres.
The project has passed the halfway mark, with around
3,190 panels installed across 31 sites so far, including the
heritage listed Sydney Town Hall.
When complete, this multi-million dollar installation is
expected to produce almost two GWh (gigawatt hours) of
clean renewable energy, saving almost 1,700 tCO2-e
annually. The output of the panels will be reviewed
regularly.
The installation of the panels is funded using budget previously
allocated to purchasing Green Power. The City also remains
carbon neutral through the purchase of carbon offsets. Further
installations are underway, however the City is running out of
sites that are both suitable for solar and with sufficient demand
for the energy produced. This is required to minimise exports to
the grid at rates that are uneconomic.
The City is working with the industry, government, the property
sector and clean energy proponents to propose changes to the
National Electricity Rules to recognise the value of local
generation, which could go part way to overcoming the ‘export
to the grid’ barrier. This extends across Australia and is not just
limited to the City of Sydney. Other options are sharing energy
with tenants, private energy networks, and storage solutions.
10 Cumulative energy production for the project to date.
Period
Panels
installed
Peak
capacity
(kW)
Emission
savings9
(tCO2-e)
Energy
production
(MWh
p.a.)10
Project to date 3,190 788 1,021 1,064
Total contract
(target) 5,148 1,186 1,667 1,684
ADVOCACY
LED streetlights
The City has upgraded the lamps in all the streetlights it owns to energy-efficient LEDs. The remainder of the streetlights in our LGA are owned by Ausgrid - however the City pays the electricity bills and takes responsibility for the carbon generated.
We are advocating for Ausgrid to upgrade all its streetlights in the local government area to efficient LED lamps to save energy.
Green Environmental Sustainability Progress Report July to December 2016
14
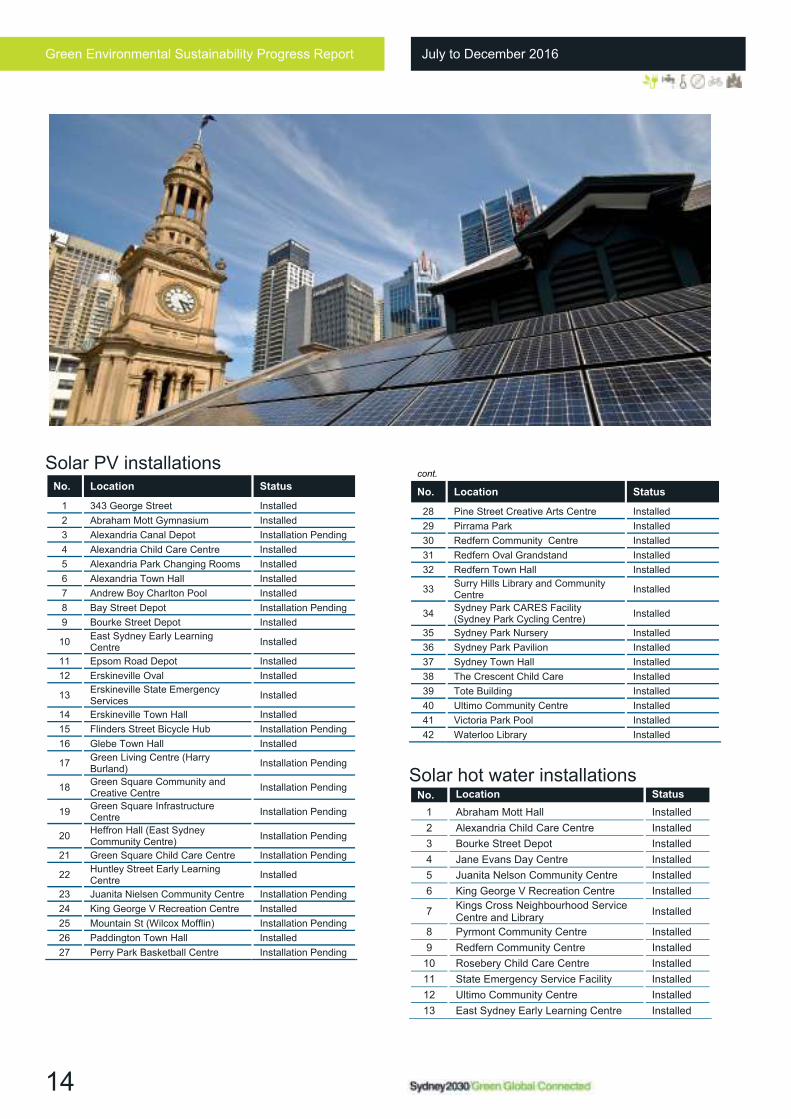
Solar PV installations No. Location Status
1 343 George Street Installed
2 Abraham Mott Gymnasium Installed
3 Alexandria Canal Depot Installation Pending
4 Alexandria Child Care Centre Installed
5 Alexandria Park Changing Rooms Installed
6 Alexandria Town Hall Installed
7 Andrew Boy Charlton Pool Installed
8 Bay Street Depot Installation Pending
9 Bourke Street Depot Installed
10 East Sydney Early Learning Centre
Installed
11 Epsom Road Depot Installed
12 Erskineville Oval Installed
13 Erskineville State Emergency Services
Installed
14 Erskineville Town Hall Installed
15 Flinders Street Bicycle Hub Installation Pending
16 Glebe Town Hall Installed
17 Green Living Centre (Harry Burland)
Installation Pending
18 Green Square Community and Creative Centre
Installation Pending
19 Green Square Infrastructure Centre
Installation Pending
20 Heffron Hall (East Sydney Community Centre)
Installation Pending
21 Green Square Child Care Centre Installation Pending
22 Huntley Street Early Learning Centre
Installed
23 Juanita Nielsen Community Centre Installation Pending
24 King George V Recreation Centre Installed
25 Mountain St (Wilcox Mofflin) Installation Pending
26 Paddington Town Hall Installed
27 Perry Park Basketball Centre Installation Pending
Solar hot water installations
No. Location Status
1 Abraham Mott Hall Installed
2 Alexandria Child Care Centre Installed
3 Bourke Street Depot Installed
4 Jane Evans Day Centre Installed
5 Juanita Nelson Community Centre Installed
6 King George V Recreation Centre Installed
7 Kings Cross Neighbourhood Service Centre and Library
Installed
8 Pyrmont Community Centre Installed
9 Redfern Community Centre Installed
10 Rosebery Child Care Centre Installed
11 State Emergency Service Facility Installed
12 Ultimo Community Centre Installed
13 East Sydney Early Learning Centre Installed
cont.
No. Location Status
28 Pine Street Creative Arts Centre Installed
29 Pirrama Park Installed
30 Redfern Community Centre Installed
31 Redfern Oval Grandstand Installed
32 Redfern Town Hall Installed
33 Surry Hills Library and Community Centre
Installed
34 Sydney Park CARES Facility (Sydney Park Cycling Centre)
Installed
35 Sydney Park Nursery Installed
36 Sydney Park Pavilion Installed
37 Sydney Town Hall Installed
38 The Crescent Child Care Installed
39 Tote Building Installed
40 Ultimo Community Centre Installed
41 Victoria Park Pool Installed
42 Waterloo Library Installed
Green Environmental Sustainability Progress Report July to December 2016
15
PROJECT UPDATE
Building upgrades
In partnership with the NSW Office of Environment and
Heritage (OEH) Energy Efficient Government program the City
has commenced a program of building energy audits at the
sites within its portfolio that are the most energy intensive.
OEH has supported energy audits at seven sites in 2016 with a
further eight sites being audited by the City, with a focus on
both energy and water, in 2017. Based on the finding of these
audits, capital and operational improvement projects will be
prioritised and implemented to assist progress towards
emission and water reduction targets.
PROJECT UPDATE
Utilities consumption management
The City has recently procured a new environmental
sustainability Software as a Service platform referred to as
Sustainability Management and Reporting Tool (SMART), to
manage, monitor and report on utilities and other sustainability
metrics for all assets owned and/or managed by City of
Sydney. SMART will provide City asset managers and staff with
improved visibility of electricity, gas, and water usage, and
waste generation. It will also facilitate the delivery of actions
and targets outlined in the City’s draft Environmental Action
2016-2021 Strategy and Action Plan. The platform is scheduled
to be fully operational by end 2017.
PROJECT UPDATE
Environmental Management System
(EMS)
Description: Implement environmental management processes
to ensure all City staff are aware of their responsibilities in
regards to environmental management.
Priorities for 2016/17 include strengthening environmental
controls, development of Sustainable Design Technical
Guidelines for capital works projects, environmental data
management review and implementation of the Environmental
Sustainability Platform.
Outcomes: Continuous improvement of environmental
management in progress.
PROJECT UPDATE
Environmental Sustainability Platform
(ESP)
Description: Develop the ESP to gather and utilise environmental data, providing strategic information to help reach to Sustainable Sydney 2030 targets and the means to report in accordance with international initiatives. The project includes an Open Data Portal where data is made available to everyone for the wider benefit of the community and to encourage an accessible and connected city.
Outcomes: The Open Data Portal was launched in November
2016 and the City has commenced loading datasets to the
portal. The portal can be accessed at
http://data.cityofsydney.nsw.gov.au/.
PROJECT UPDATE
Fleet
Description: Fleet emissions contribute approximately seven
per cent of the City’s total emissions. Having taken advantage
of all currently available tools and technologies, Fleet
Management are now focussing on low-risk and eco-driving
strategies. Low-risk driving practices almost always contribute
to lower fuel or battery use and fewer emissions.
The City has rolled out its new ‘Low-risk and Eco-driving
Handbook’ and is providing ongoing training to staff with the
aim of further reducing emissions. Low risk driving and eco
driving complement each other, and contributions to one
usually benefit the other.
Outcomes: Maintain fleet emissions at 2014 levels until 2017.
Status: On-going. 2015/16 fleet emissions were 2,160 tCO2-e
which beat the target by 190 tCO2-e. Completion by end 2017.
For more information on fleet see Section 9 – Active and
connected city.
Green Environmental Sustainability Progress Report July to December 2016
16
The local government area
Local government area targets
Greenhouse gas
emissions – 70 per cent reduction in greenhouse gas emissions by 2030 based on 2006 levels
– Net zero emissions by 2050
Renewable
energy – 50 per cent of electricity demand met by renewable sources by 203011
How the local government area is tracking
Annual greenhouse gas emissions
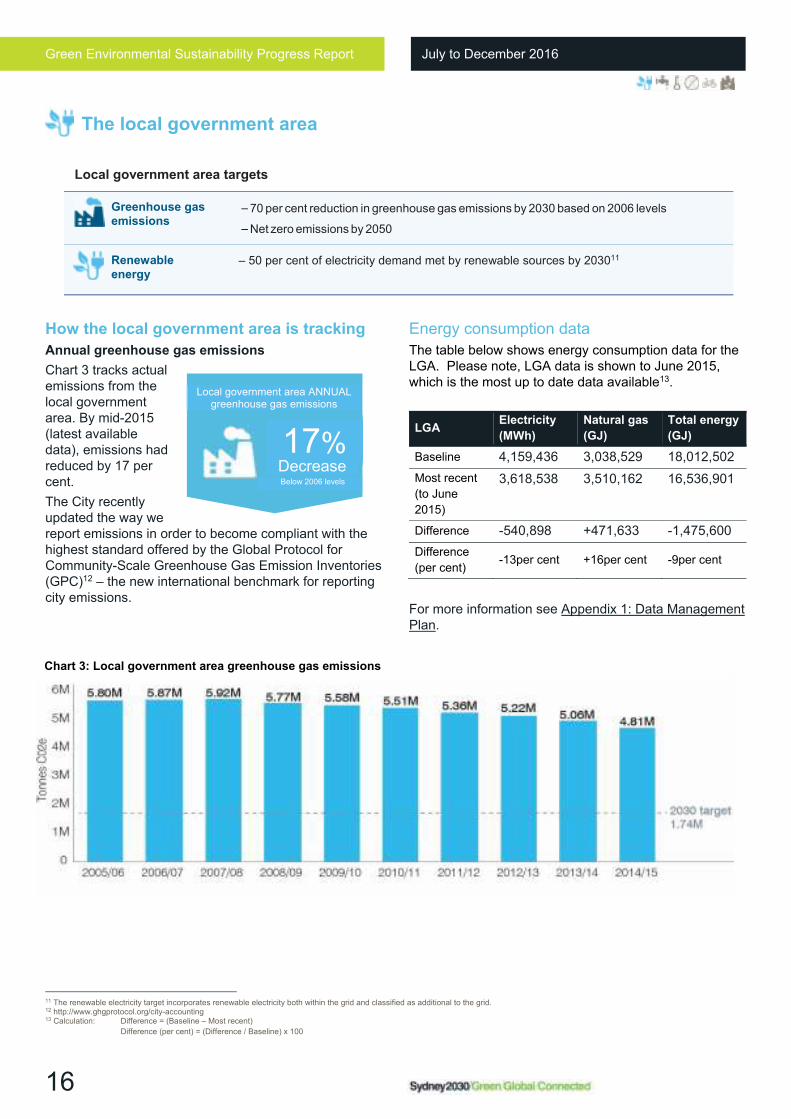
Chart 3 tracks actual emissions from the local government area. By mid-2015 (latest available data), emissions had reduced by 17 per cent.
The City recently updated the way we report emissions in order to become compliant with the highest standard offered by the Global Protocol for Community-Scale Greenhouse Gas Emission Inventories (GPC)12 – the new international benchmark for reporting city emissions.
11 The renewable electricity target incorporates renewable electricity both within the grid and classified as additional to the grid. 12 http://www.ghgprotocol.org/city-accounting 13 Calculation: Difference = (Baseline – Most recent)
Difference (per cent) = (Difference / Baseline) x 100
Energy consumption data
The table below shows energy consumption data for the LGA. Please note, LGA data is shown to June 2015, which is the most up to date data available13.
LGA Electricity
(MWh) Natural gas
(GJ) Total energy
(GJ)
Baseline 4,159,436 3,038,529 18,012,502
Most recent
(to June
2015)
3,618,538 3,510,162 16,536,901
Difference -540,898 +471,633 -1,475,600
Difference
(per cent) -13per cent +16per cent -9per cent
For more information see Appendix 1: Data Management Plan.
Chart 3: Local government area greenhouse gas emissions
Local government area ANNUAL greenhouse gas emissions
Below 2006 levels
17%Decrease
Green Environmental Sustainability Progress Report July to December 2016
17
How we will get there
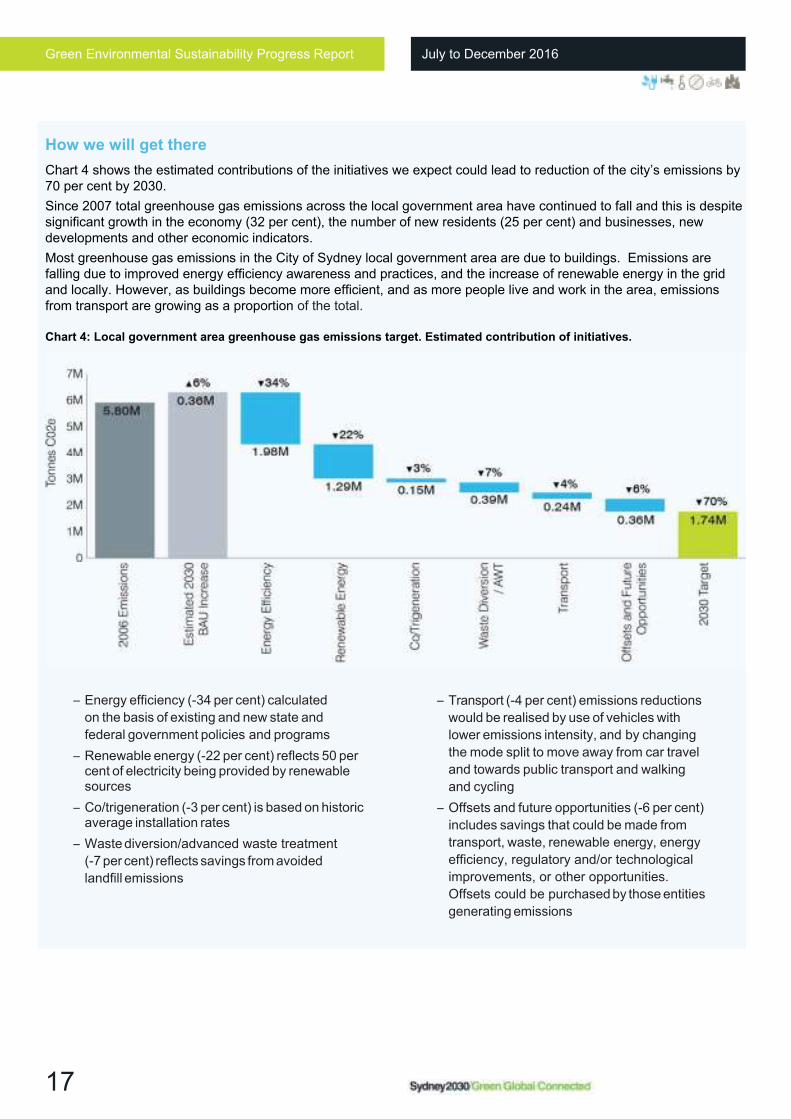
Chart 4 shows the estimated contributions of the initiatives we expect could lead to reduction of the city’s emissions by 70 per cent by 2030.
Since 2007 total greenhouse gas emissions across the local government area have continued to fall and this is despite significant growth in the economy (32 per cent), the number of new residents (25 per cent) and businesses, new developments and other economic indicators.
Most greenhouse gas emissions in the City of Sydney local government area are due to buildings. Emissions are falling due to improved energy efficiency awareness and practices, and the increase of renewable energy in the grid and locally. However, as buildings become more efficient, and as more people live and work in the area, emissions from transport are growing as a proportion of the total.
– Energy efficiency (-34 per cent) calculated
on the basis of existing and new state and
federal government policies and programs
– Renewable energy (-22 per cent) reflects 50 per cent of electricity being provided by renewable sources
– Co/trigeneration (-3 per cent) is based on historic average installation rates
– Waste diversion/advanced waste treatment
(-7 per cent) reflects savings from avoided
landfill emissions
– Transport (-4 per cent) emissions reductions
would be realised by use of vehicles with
lower emissions intensity, and by changing
the mode split to move away from car travel
and towards public transport and walking
and cycling
– Offsets and future opportunities (-6 per cent)
includes savings that could be made from
transport, waste, renewable energy, energy
efficiency, regulatory and/or technological
improvements, or other opportunities.
Offsets could be purchased by those entities
generating emissions
Chart 4: Local government area greenhouse gas emissions target. Estimated contribution of initiatives.
Green Environmental Sustainability Progress Report July to December 2016
18
PROJECT UPDATE
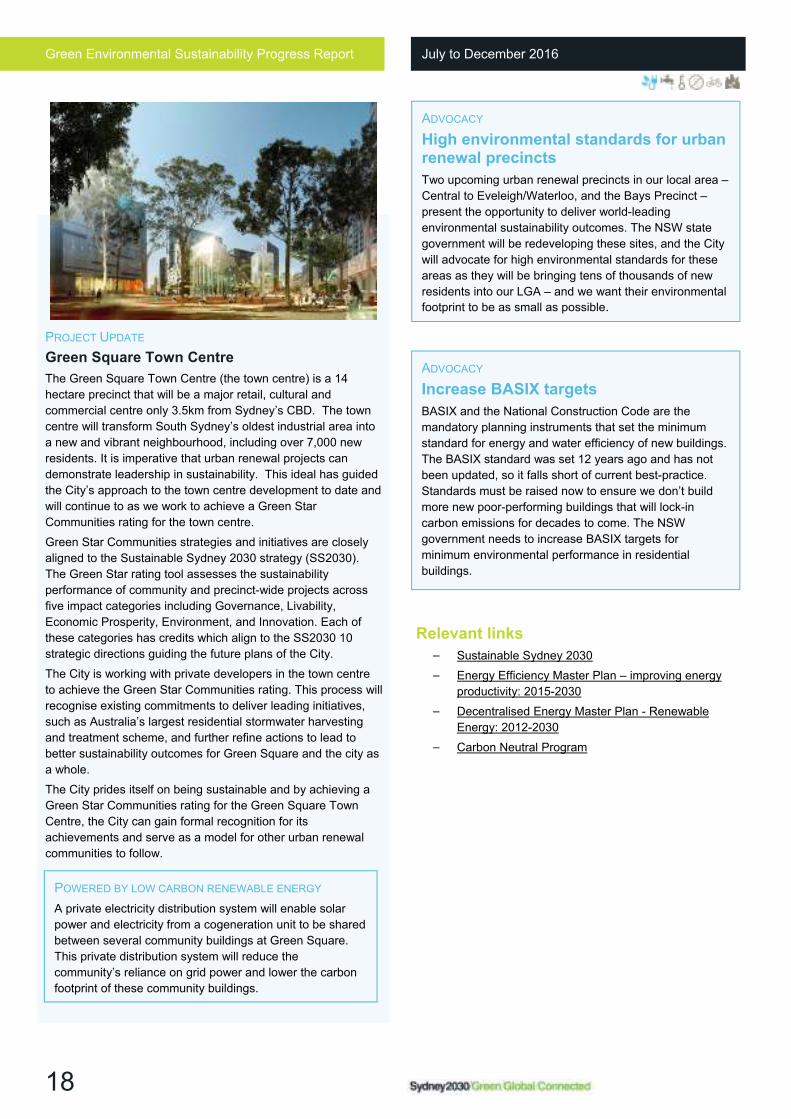
Green Square Town Centre
The Green Square Town Centre (the town centre) is a 14
hectare precinct that will be a major retail, cultural and
commercial centre only 3.5km from Sydney’s CBD. The town
centre will transform South Sydney’s oldest industrial area into
a new and vibrant neighbourhood, including over 7,000 new
residents. It is imperative that urban renewal projects can
demonstrate leadership in sustainability. This ideal has guided
the City’s approach to the town centre development to date and
will continue to as we work to achieve a Green Star
Communities rating for the town centre.
Green Star Communities strategies and initiatives are closely
aligned to the Sustainable Sydney 2030 strategy (SS2030).
The Green Star rating tool assesses the sustainability
performance of community and precinct-wide projects across
five impact categories including Governance, Livability,
Economic Prosperity, Environment, and Innovation. Each of
these categories has credits which align to the SS2030 10
strategic directions guiding the future plans of the City.
The City is working with private developers in the town centre
to achieve the Green Star Communities rating. This process will
recognise existing commitments to deliver leading initiatives,
such as Australia’s largest residential stormwater harvesting
and treatment scheme, and further refine actions to lead to
better sustainability outcomes for Green Square and the city as
a whole.
The City prides itself on being sustainable and by achieving a
Green Star Communities rating for the Green Square Town
Centre, the City can gain formal recognition for its
achievements and serve as a model for other urban renewal
communities to follow.
Relevant links
– Sustainable Sydney 2030
– Energy Efficiency Master Plan – improving energy
productivity: 2015-2030
– Decentralised Energy Master Plan - Renewable
Energy: 2012-2030
– Carbon Neutral Program
ADVOCACY
Increase BASIX targets
BASIX and the National Construction Code are the
mandatory planning instruments that set the minimum
standard for energy and water efficiency of new buildings.
The BASIX standard was set 12 years ago and has not
been updated, so it falls short of current best-practice.
Standards must be raised now to ensure we don’t build
more new poor-performing buildings that will lock-in
carbon emissions for decades to come. The NSW
government needs to increase BASIX targets for
minimum environmental performance in residential
buildings.
ADVOCACY
High environmental standards for urban renewal precincts
Two upcoming urban renewal precincts in our local area –
Central to Eveleigh/Waterloo, and the Bays Precinct –
present the opportunity to deliver world-leading
environmental sustainability outcomes. The NSW state
government will be redeveloping these sites, and the City
will advocate for high environmental standards for these
areas as they will be bringing tens of thousands of new
residents into our LGA – and we want their environmental
footprint to be as small as possible.
POWERED BY LOW CARBON RENEWABLE ENERGY
A private electricity distribution system will enable solar
power and electricity from a cogeneration unit to be shared
between several community buildings at Green Square.
This private distribution system will reduce the
community’s reliance on grid power and lower the carbon
footprint of these community buildings.
Green Environmental Sustainability Progress Report July to December 2016
19
Our operational targets
Water consumption
– Zero increase in potable water use by end June 2021 from 2006 baseline, achieved through water efficiency and recycled water
– Annual potable water use of 180L/m2 of irrigated open space by the end of 2021
The City is transforming to be a water sensitive city that is resilient, cool, green and productive. Our water management approach to meet these targets involves:
– Using less water through changes in behaviour and using water efficient fixtures and fittings
– Capturing alternative water sources to recycle and use for non-potable purposes
– Reducing stormwater pollution, minimising local flood risk, enhancing greening and urban cooling through retrofitting the stormwater management network with raingardens, wetlands, swales and gross pollutant traps
Our approach will drought-proof our city to ensure we can use water when it is hot and dry. Our waterway health will be improved and non-potable water supplies will be safe- guarded for use in the next century and beyond.
The predicted impacts of climate change and population growth will strain our potable water supplies, with potable water demand in the local government area estimated to be 30 per cent higher in 2030 than in 2006.
City of Sydney Operations
How we are tracking
Annual water
consumption
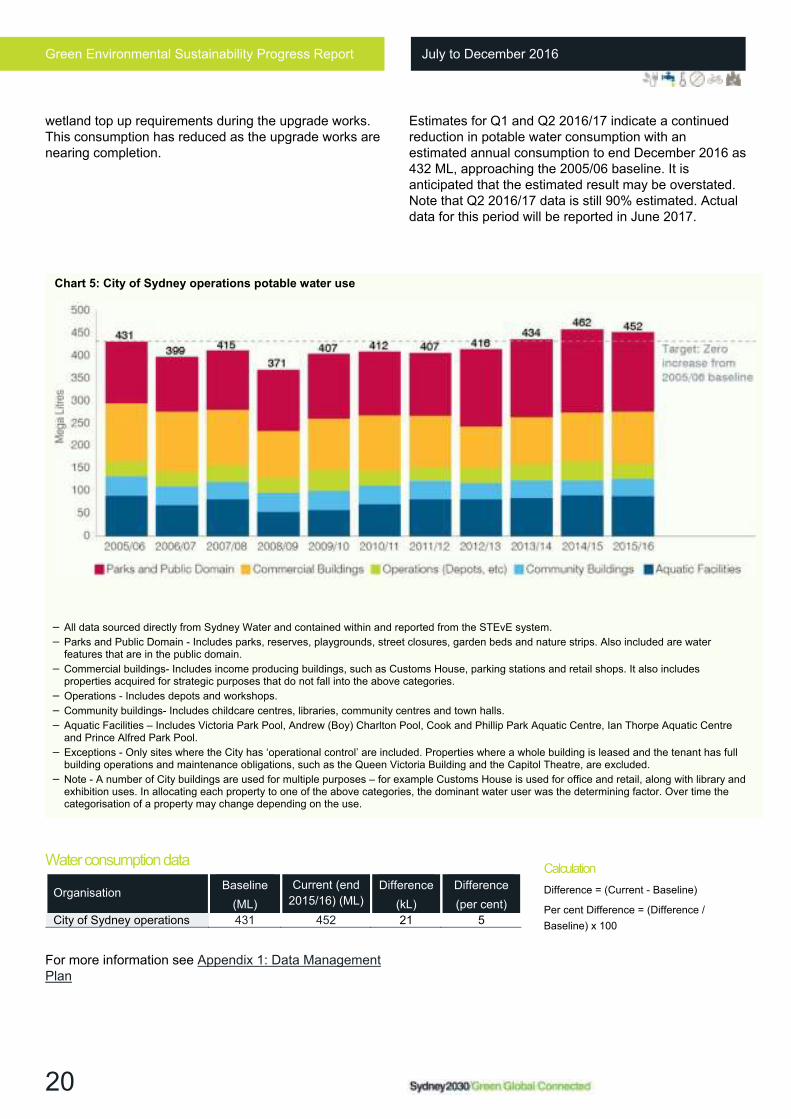
Chart 514 shows annual water consumption by category. This chart has been updated to reflect recent improvements in our data management processes. These improvements have identified additional water meters that have previously not been included in our reports. The inclusion of these meters has resulted in an increase in all years’ consumption figures including the baseline. The baseline has increased from 413 megalitres per annum (MLpa) to 431 MLpa. The 2014/15 and the 2015/16 periods show total water consumption above the City’s interim target of zero increase from the 2005/06 baseline by 2016 at 462 and 452 MLpa respectively. This represents a 5% increase for FY2015/16 relative to the baseline.
The 2014/15 increase was largely due to a mains water leak at the Epsom Road Depot, which has been rectified.
14 All water data has been updated in this report to reflect recent improvements in data management processes.
Other temporary increased water consumption has been noted at Sydney Park due to plant establishment and
6. Water sensitive city
Water is crucial to the social, economic and environmental wellbeing and survival of our city. Our city’s forecast population growth to 2030 will increase the use of our green public spaces, placing pressure on these spaces to remain green and our waterways to stay clean.
City of Sydney’s ANNUAL water consumption from operations
5%
Increase Above 2006 levels as at FY2015/16
Green Environmental Sustainability Progress Report July to December 2016
20
wetland top up requirements during the upgrade works. This consumption has reduced as the upgrade works are nearing completion.
Estimates for Q1 and Q2 2016/17 indicate a continued reduction in potable water consumption with an estimated annual consumption to end December 2016 as 432 ML, approaching the 2005/06 baseline. It is anticipated that the estimated result may be overstated. Note that Q2 2016/17 data is still 90% estimated. Actual data for this period will be reported in June 2017.
– All data sourced directly from Sydney Water and contained within and reported from the STEvE system.
– Parks and Public Domain - Includes parks, reserves, playgrounds, street closures, garden beds and nature strips. Also included are water features that are in the public domain.
– Commercial buildings- Includes income producing buildings, such as Customs House, parking stations and retail shops. It also includes properties acquired for strategic purposes that do not fall into the above categories.
– Operations - Includes depots and workshops.
– Community buildings- Includes childcare centres, libraries, community centres and town halls.
– Aquatic Facilities – Includes Victoria Park Pool, Andrew (Boy) Charlton Pool, Cook and Phillip Park Aquatic Centre, Ian Thorpe Aquatic Centre and Prince Alfred Park Pool.
– Exceptions - Only sites where the City has ‘operational control’ are included. Properties where a whole building is leased and the tenant has full building operations and maintenance obligations, such as the Queen Victoria Building and the Capitol Theatre, are excluded.
– Note - A number of City buildings are used for multiple purposes – for example Customs House is used for office and retail, along with library and exhibition uses. In allocating each property to one of the above categories, the dominant water user was the determining factor. Over time the categorisation of a property may change depending on the use.
Water consumption data
For more information see Appendix 1: Data Management Plan
Organisation Baseline
(ML)
Current (end
2015/16) (ML)
Difference
(kL)
Difference
(per cent)
City of Sydney operations 431 452 21 5
Chart 5: City of Sydney operations potable water use
Calculation
Difference = (Current - Baseline)
Per cent Difference = (Difference /
Baseline) x 100
Green Environmental Sustainability Progress Report July to December 2016
21
.
How we will get there
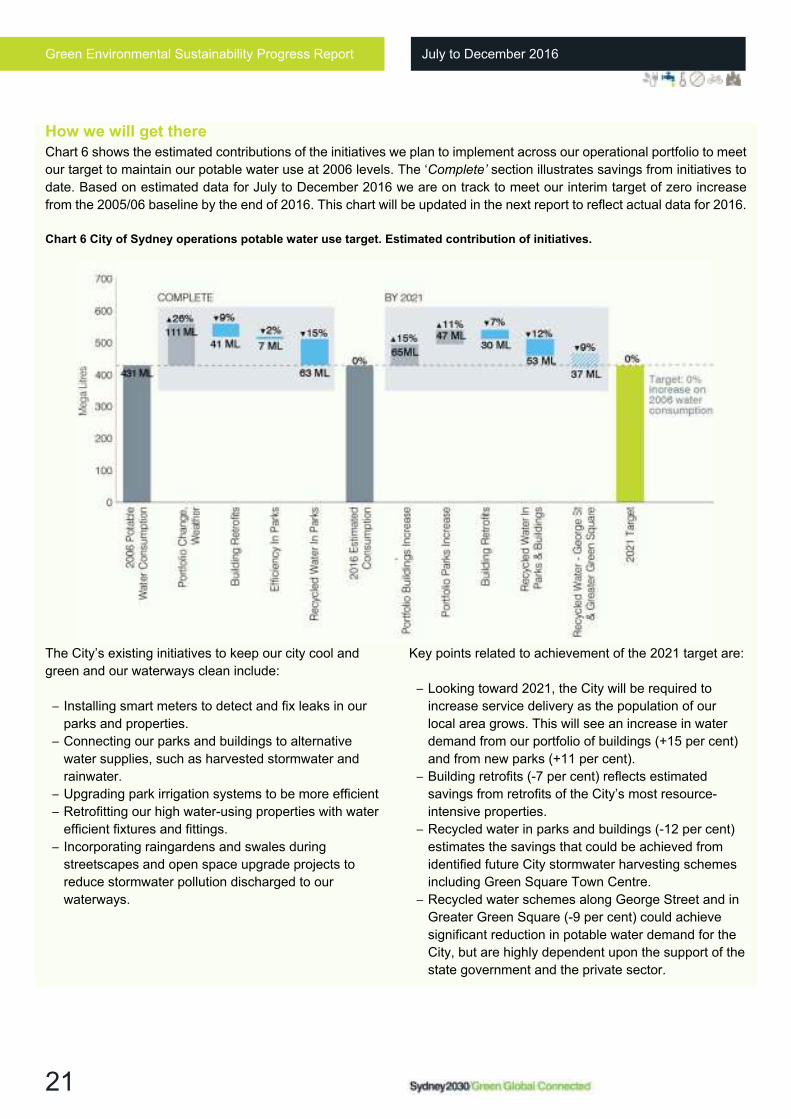
Chart 6 shows the estimated contributions of the initiatives we plan to implement across our operational portfolio to meet
our target to maintain our potable water use at 2006 levels. The ‘Complete’ section illustrates savings from initiatives to
date. Based on estimated data for July to December 2016 we are on track to meet our interim target of zero increase
from the 2005/06 baseline by the end of 2016. This chart will be updated in the next report to reflect actual data for 2016.
Chart 6 City of Sydney operations potable water use target. Estimated contribution of initiatives.
The City’s existing initiatives to keep our city cool and
green and our waterways clean include:
– Installing smart meters to detect and fix leaks in our
parks and properties.
– Connecting our parks and buildings to alternative
water supplies, such as harvested stormwater and
rainwater.
– Upgrading park irrigation systems to be more efficient
– Retrofitting our high water-using properties with water
efficient fixtures and fittings.
– Incorporating raingardens and swales during
streetscapes and open space upgrade projects to
reduce stormwater pollution discharged to our
waterways.
Key points related to achievement of the 2021 target are:
– Looking toward 2021, the City will be required to
increase service delivery as the population of our
local area grows. This will see an increase in water
demand from our portfolio of buildings (+15 per cent)
and from new parks (+11 per cent).
– Building retrofits (-7 per cent) reflects estimated
savings from retrofits of the City’s most resource-
intensive properties.
– Recycled water in parks and buildings (-12 per cent)
estimates the savings that could be achieved from
identified future City stormwater harvesting schemes
including Green Square Town Centre.
– Recycled water schemes along George Street and in
Greater Green Square (-9 per cent) could achieve
significant reduction in potable water demand for the
City, but are highly dependent upon the support of the
state government and the private sector.
Green Environmental Sustainability Progress Report July to December 2016
22
PROJECT UPDATE
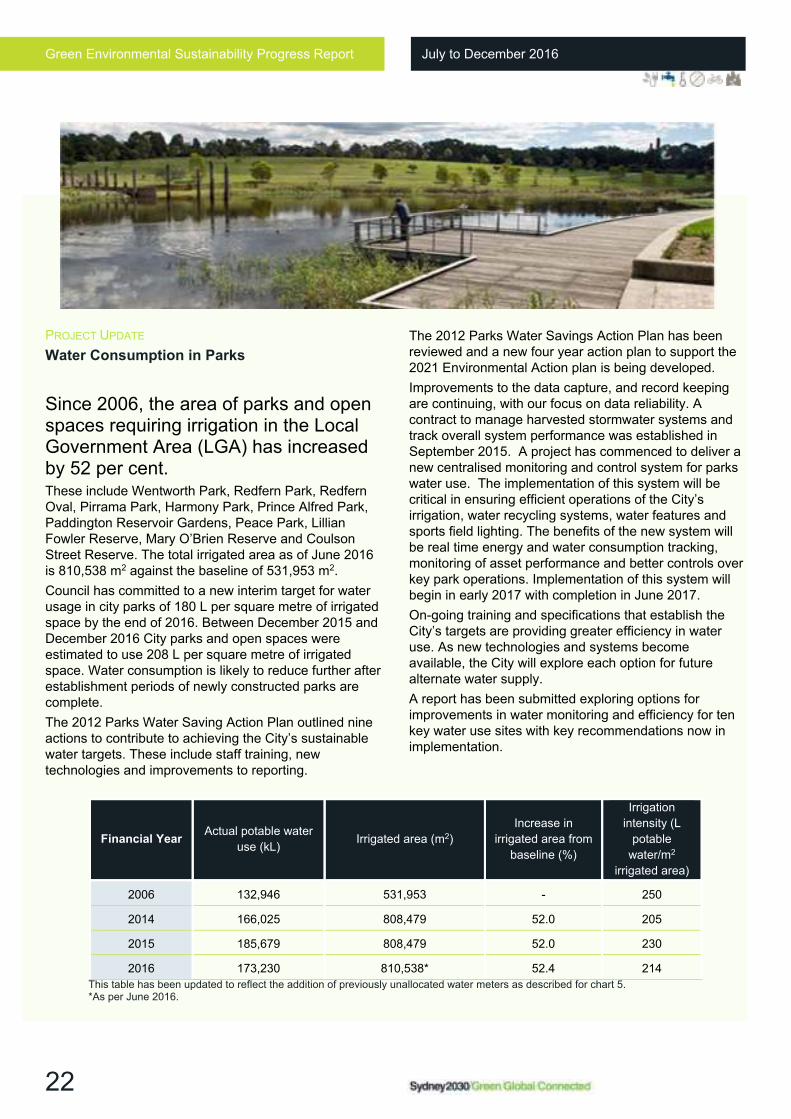
Water Consumption in Parks
Since 2006, the area of parks and open spaces requiring irrigation in the Local Government Area (LGA) has increased by 52 per cent. These include Wentworth Park, Redfern Park, Redfern Oval, Pirrama Park, Harmony Park, Prince Alfred Park, Paddington Reservoir Gardens, Peace Park, Lillian Fowler Reserve, Mary O’Brien Reserve and Coulson Street Reserve. The total irrigated area as of June 2016 is 810,538 m2 against the baseline of 531,953 m2.
Council has committed to a new interim target for water usage in city parks of 180 L per square metre of irrigated space by the end of 2016. Between December 2015 and December 2016 City parks and open spaces were estimated to use 208 L per square metre of irrigated space. Water consumption is likely to reduce further after establishment periods of newly constructed parks are complete.
The 2012 Parks Water Saving Action Plan outlined nine actions to contribute to achieving the City’s sustainable water targets. These include staff training, new technologies and improvements to reporting.
The 2012 Parks Water Savings Action Plan has been reviewed and a new four year action plan to support the 2021 Environmental Action plan is being developed.
Improvements to the data capture, and record keeping are continuing, with our focus on data reliability. A contract to manage harvested stormwater systems and track overall system performance was established in September 2015. A project has commenced to deliver a new centralised monitoring and control system for parks water use. The implementation of this system will be critical in ensuring efficient operations of the City’s irrigation, water recycling systems, water features and sports field lighting. The benefits of the new system will be real time energy and water consumption tracking, monitoring of asset performance and better controls over key park operations. Implementation of this system will begin in early 2017 with completion in June 2017.
On-going training and specifications that establish the City’s targets are providing greater efficiency in water use. As new technologies and systems become available, the City will explore each option for future alternate water supply.
A report has been submitted exploring options for improvements in water monitoring and efficiency for ten key water use sites with key recommendations now in implementation.
Financial Year Actual potable water
use (kL) Irrigated area (m2)
Increase in
irrigated area from
baseline (%)
Irrigation
intensity (L
potable
water/m2
irrigated area)
2006 132,946 531,953 - 250
2014 166,025 808,479 52.0 205
2015 185,679 808,479 52.0 230
2016 173,230 810,538* 52.4 214
This table has been updated to reflect the addition of previously unallocated water meters as described for chart 5. *As per June 2016.
Green Environmental Sustainability Progress Report July to December 2016
23
PROJECT UPDATE
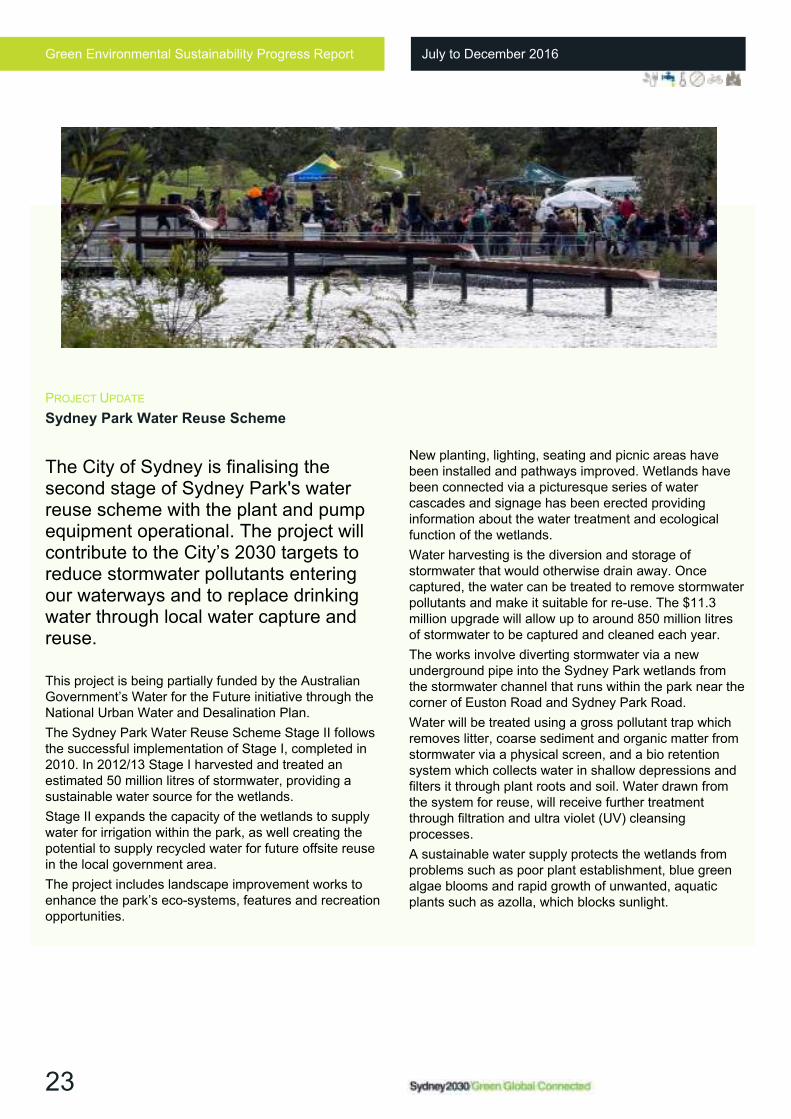
Sydney Park Water Reuse Scheme
The City of Sydney is finalising the second stage of Sydney Park's water reuse scheme with the plant and pump equipment operational. The project will contribute to the City’s 2030 targets to reduce stormwater pollutants entering our waterways and to replace drinking water through local water capture and reuse.
This project is being partially funded by the Australian Government’s Water for the Future initiative through the National Urban Water and Desalination Plan.
The Sydney Park Water Reuse Scheme Stage II follows the successful implementation of Stage I, completed in 2010. In 2012/13 Stage I harvested and treated an estimated 50 million litres of stormwater, providing a sustainable water source for the wetlands.
Stage II expands the capacity of the wetlands to supply water for irrigation within the park, as well creating the potential to supply recycled water for future offsite reuse in the local government area.
The project includes landscape improvement works to enhance the park’s eco-systems, features and recreation opportunities.
New planting, lighting, seating and picnic areas have been installed and pathways improved. Wetlands have been connected via a picturesque series of water cascades and signage has been erected providing information about the water treatment and ecological function of the wetlands.
Water harvesting is the diversion and storage of stormwater that would otherwise drain away. Once captured, the water can be treated to remove stormwater pollutants and make it suitable for re-use. The $11.3 million upgrade will allow up to around 850 million litres of stormwater to be captured and cleaned each year.
The works involve diverting stormwater via a new underground pipe into the Sydney Park wetlands from the stormwater channel that runs within the park near the corner of Euston Road and Sydney Park Road.
Water will be treated using a gross pollutant trap which removes litter, coarse sediment and organic matter from stormwater via a physical screen, and a bio retention system which collects water in shallow depressions and filters it through plant roots and soil. Water drawn from the system for reuse, will receive further treatment through filtration and ultra violet (UV) cleansing processes.
A sustainable water supply protects the wetlands from problems such as poor plant establishment, blue green algae blooms and rapid growth of unwanted, aquatic plants such as azolla, which blocks sunlight.
Green Environmental Sustainability Progress Report July to December 2016
24
PROJECT UPDATE
Green Square Water Reuse Stage 2
The best opportunity to develop water recycling projects in the City of Sydney area is within urban renewal areas as they provide the density and scale required for efficient investment in recycled water infrastructure. Infrastructure provision can be planned and installed at the time of development, which is cheaper and more efficient than retrofitting. Redevelopment also allows private water utilities to offer water services across an entire precinct, improving commercial viability. As well, the City can use planning controls to encourage the delivery of recycled water services.
The City is developing a utility led water reuse scheme in the Greater Green Square area outside of the town centre. Unlike Green Square Water Reuse Stage 1 which captures stormwater for reuse, Stage 2 will collect locally generated wastewater for treatment and reuse. The scheme will be owned and operated by a private water utility and the City will provide space for recycled water infrastructure.
PROJECT UPDATE
Harold Park Stormwater Harvesting Scheme
The Johnston’s Creek Masterplan identified opportunities to treat and harvest stormwater from the Toxteth catchment to provide a non-potable water source for irrigation of the new public park at Harold Park. A separate water re-use study identified opportunities to harvest additional stormwater from the Wigram Catchment to extend the recycled water network to Jubilee Oval and Federal Park North. This will contribute to the City’s water consumption and stormwater quality targets by providing an alternative water source to maintain our parks and reduce pollution entering Rozelle Bay.
The new water reuse scheme includes a treatment system at Harold Park, underground storage tanks in Harold Park and Jubilee Oval, a rising main and electrical connections from Harold Park to Jubilee Oval and Federal Park North and new irrigation systems in Harold Park and Federal Park North. The water reuse scheme is in the final stages of commissioning and will be fully operational in March 2017.
The new public park in Harold Park also includes a series of open spaces and areas of habitat linked by the existing cliff line, paths connecting neighbourhoods and parklands, playgrounds, picnic areas and open grass spaces, historical interpretations and art opportunities, lighting and park furniture.
PROJECT UPDATE
Raingardens
Raingardens are one of the simplest forms of water sensitive urban design (WSUD) and they are ideal for highly urbanised catchments. The City continues to install raingardens to improve water quality and flow.
Raingardens allow stormwater run-off to be collected and absorbed, watering the plants and improving the water quality by a process of filtration through a special soil (bio-filtration media). This process removes key pollutants (suspended solids, heavy metals and high concentrations of nutrients such as phosphorous and nitrogen) prior to the water entering into the main storm water system, which ultimately discharges into our waterways and bays.
A total of 154 raingardens have been installed to date and we continue to install them where viable as part of all infrastructure projects the City undertakes.
PROJECT UPDATE
Victoria Park Improvements
We are undertaking improvement works in Victoria Park, Camperdown to provide a better recreation space for everyone to enjoy. We are also improving the water quality of Lake Northam in the centre of the park.
Incorporation of WSUD into public open space, road and streetscape works and retrofitting the drainage network with stormwater pollutant traps are direct actions from of the Decentralised Water Master Plan to reduce pollution discharged to waterways via stormwater. Victoria Park upgrade presents an excellent opportunity to incorporate WSUD at a relatively low cost and at minimal disruption to the community as works can be integrated with planned upgrade works.
The Victoria Park upgrade works include installation of two new stormwater pollutant traps for Lake Northam, a new recirculation system, pump and weir to improve water quality and a new bio-retention zone and wetland designed with reed plants to clean and filter stormwater runoff in the lake.
Construction commenced in January 2017 and is expected to finish in early 2018.
Relevant links
– Decentralised Water Master Plan: 2012-2030
– Towards 2030: Water Management
– City of Sydney's plans for decentralised water (video)
– Sydney Park wetlands
Green Environmental Sustainability Progress Report July to December 2016
25
Local government area targets
Water
consumption
– Zero increase in potable water use by 2030 from 2006 baseline, achieved through water efficiency and recycled water
Stormwater
quality – 50 per cent reduction in the annual solid pollution load discharged to waterways via
stormwater by 2030
– 15 per cent reduction in annual nutrient load discharged to waterways via stormwater by
2030
The local government area
How are we tracking
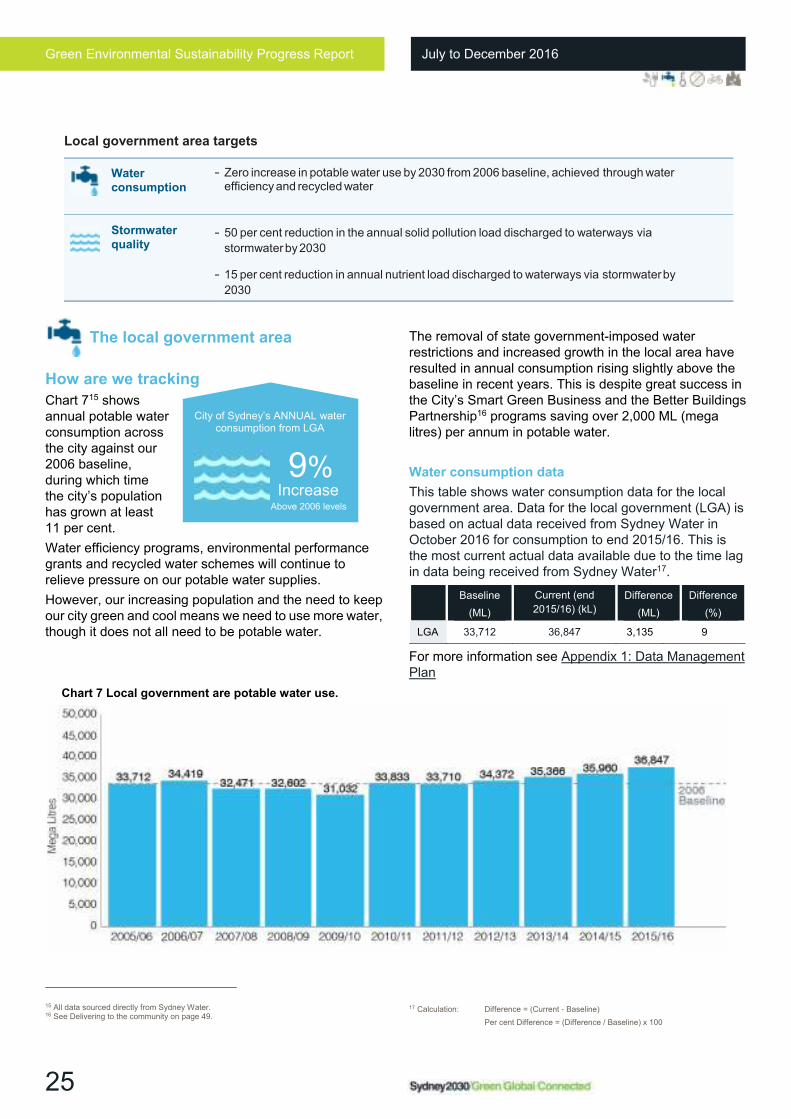
Chart 715 shows annual potable water consumption across the city against our 2006 baseline, during which time the city’s population has grown at least 11 per cent.
Water efficiency programs, environmental performance grants and recycled water schemes will continue to relieve pressure on our potable water supplies.
However, our increasing population and the need to keep our city green and cool means we need to use more water, though it does not all need to be potable water.
15 All data sourced directly from Sydney Water. 16 See Delivering to the community on page 49.
The removal of state government-imposed water restrictions and increased growth in the local area have resulted in annual consumption rising slightly above the baseline in recent years. This is despite great success in the City’s Smart Green Business and the Better Buildings Partnership16 programs saving over 2,000 ML (mega litres) per annum in potable water.
Water consumption data
This table shows water consumption data for the local government area. Data for the local government (LGA) is based on actual data received from Sydney Water in October 2016 for consumption to end 2015/16. This is the most current actual data available due to the time lag in data being received from Sydney Water17.
Baseline
(ML)
Current (end
2015/16) (kL)
Difference
(ML)
Difference
(%)
LGA 33,712 36,847 3,135 9
For more information see Appendix 1: Data Management Plan
17 Calculation: Difference = (Current - Baseline)
Per cent Difference = (Difference / Baseline) x 100
City of Sydney’s ANNUAL water consumption from LGA
9% Increase
Above 2006 levels
Chart 7 Local government are potable water use.
Green Environmental Sustainability Progress Report July to December 2016
26
Estimated contribution of initiatives
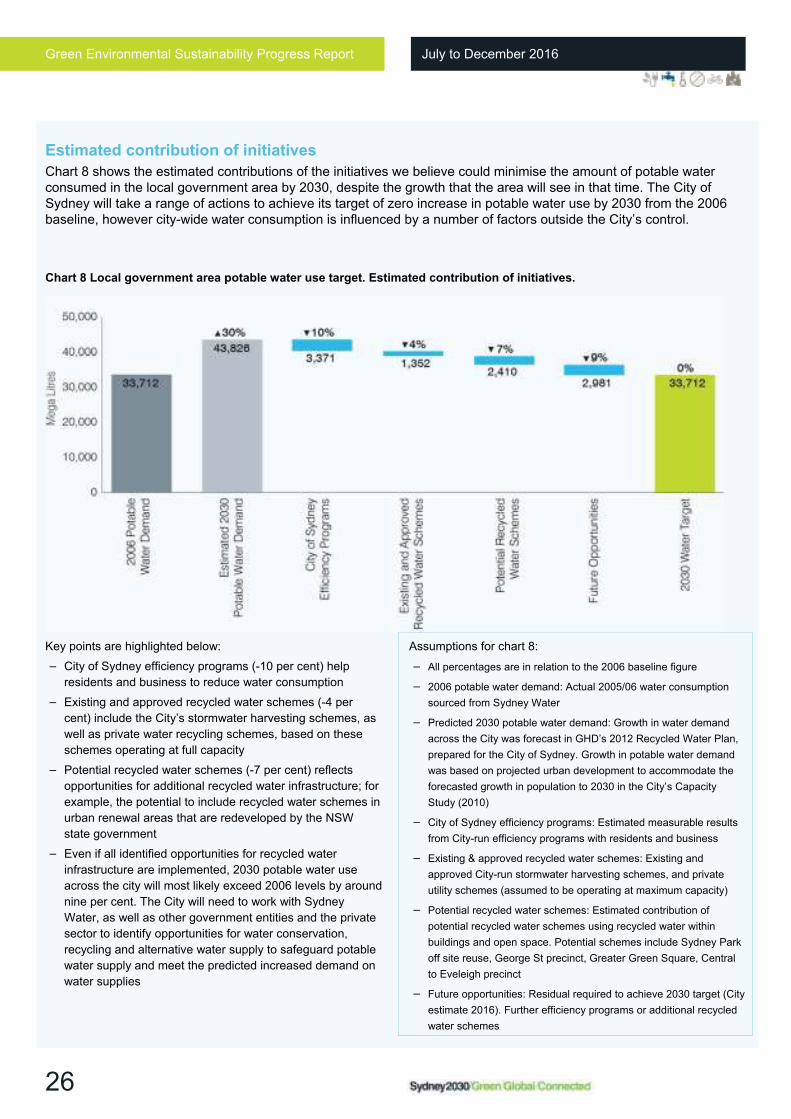
Chart 8 shows the estimated contributions of the initiatives we believe could minimise the amount of potable water consumed in the local government area by 2030, despite the growth that the area will see in that time. The City of Sydney will take a range of actions to achieve its target of zero increase in potable water use by 2030 from the 2006 baseline, however city-wide water consumption is influenced by a number of factors outside the City’s control.
Chart 8 Local government area potable water use target. Estimated contribution of initiatives.
Key points are highlighted below:
– City of Sydney efficiency programs (-10 per cent) help
residents and business to reduce water consumption
– Existing and approved recycled water schemes (-4 per
cent) include the City’s stormwater harvesting schemes, as
well as private water recycling schemes, based on these
schemes operating at full capacity
– Potential recycled water schemes (-7 per cent) reflects
opportunities for additional recycled water infrastructure; for
example, the potential to include recycled water schemes in
urban renewal areas that are redeveloped by the NSW
state government
– Even if all identified opportunities for recycled water
infrastructure are implemented, 2030 potable water use
across the city will most likely exceed 2006 levels by around
nine per cent. The City will need to work with Sydney
Water, as well as other government entities and the private
sector to identify opportunities for water conservation,
recycling and alternative water supply to safeguard potable
water supply and meet the predicted increased demand on
water supplies
Assumptions for chart 8:
– All percentages are in relation to the 2006 baseline figure
– 2006 potable water demand: Actual 2005/06 water consumption
sourced from Sydney Water
– Predicted 2030 potable water demand: Growth in water demand
across the City was forecast in GHD’s 2012 Recycled Water Plan,
prepared for the City of Sydney. Growth in potable water demand
was based on projected urban development to accommodate the
forecasted growth in population to 2030 in the City’s Capacity
Study (2010)
– City of Sydney efficiency programs: Estimated measurable results
from City-run efficiency programs with residents and business
– Existing & approved recycled water schemes: Existing and
approved City-run stormwater harvesting schemes, and private
utility schemes (assumed to be operating at maximum capacity)
– Potential recycled water schemes: Estimated contribution of
potential recycled water schemes using recycled water within
buildings and open space. Potential schemes include Sydney Park
off site reuse, George St precinct, Greater Green Square, Central
to Eveleigh precinct
– Future opportunities: Residual required to achieve 2030 target (City
estimate 2016). Further efficiency programs or additional recycled
water schemes
Green Environmental Sustainability Progress Report July to December 2016
27
PROJECT UPDATE
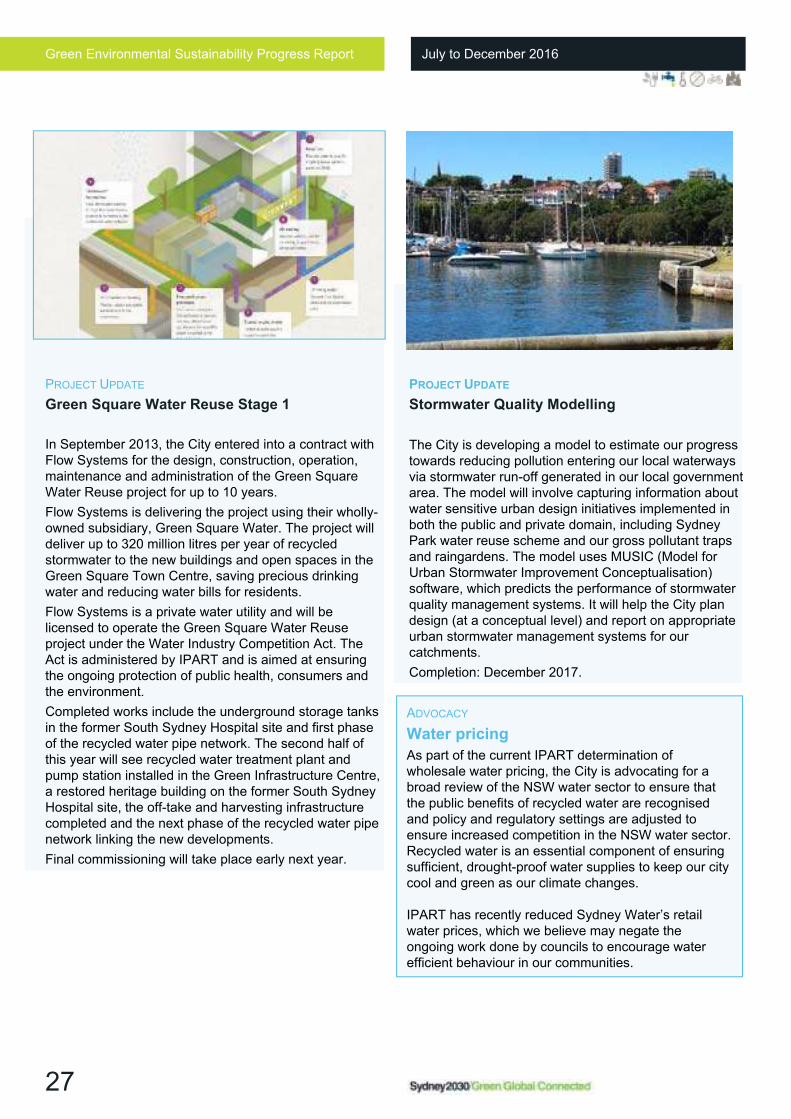
Green Square Water Reuse Stage 1
In September 2013, the City entered into a contract with Flow Systems for the design, construction, operation, maintenance and administration of the Green Square Water Reuse project for up to 10 years.
Flow Systems is delivering the project using their wholly-owned subsidiary, Green Square Water. The project will deliver up to 320 million litres per year of recycled stormwater to the new buildings and open spaces in the Green Square Town Centre, saving precious drinking water and reducing water bills for residents. Flow Systems is a private water utility and will be licensed to operate the Green Square Water Reuse project under the Water Industry Competition Act. The Act is administered by IPART and is aimed at ensuring the ongoing protection of public health, consumers and the environment. Completed works include the underground storage tanks in the former South Sydney Hospital site and first phase of the recycled water pipe network. The second half of this year will see recycled water treatment plant and pump station installed in the Green Infrastructure Centre, a restored heritage building on the former South Sydney Hospital site, the off-take and harvesting infrastructure completed and the next phase of the recycled water pipe network linking the new developments. Final commissioning will take place early next year.
PROJECT UPDATE
Stormwater Quality Modelling
The City is developing a model to estimate our progress towards reducing pollution entering our local waterways via stormwater run-off generated in our local government area. The model will involve capturing information about water sensitive urban design initiatives implemented in both the public and private domain, including Sydney Park water reuse scheme and our gross pollutant traps and raingardens. The model uses MUSIC (Model for Urban Stormwater Improvement Conceptualisation) software, which predicts the performance of stormwater quality management systems. It will help the City plan design (at a conceptual level) and report on appropriate urban stormwater management systems for our catchments. Completion: December 2017.
ADVOCACY
Water pricing
As part of the current IPART determination of wholesale water pricing, the City is advocating for a broad review of the NSW water sector to ensure that the public benefits of recycled water are recognised and policy and regulatory settings are adjusted to ensure increased competition in the NSW water sector. Recycled water is an essential component of ensuring sufficient, drought-proof water supplies to keep our city cool and green as our climate changes.
IPART has recently reduced Sydney Water’s retail water prices, which we believe may negate the ongoing work done by councils to encourage water efficient behaviour in our communities.
Green Environmental Sustainability Progress Report July to December 2016
28
The best available scientific evidence tells us that greenhouse gas emissions from human activity, particularly our use of energy from fossil fuels, are contributing to climate change and the change is occurring faster than initially predicted18.
Climate Adaptation Strategy
The Council endorsed the Climate Adaptation Strategy in 2015 to help us prioritise and plan actions needed to prepare the city for the environmental, social, cultural and economic impacts of climate change. The strategy, titled “Adaption for Climate Change: A long term strategy for the City of Sydney” can be downloaded from our website.
This strategy looks to 2070 to assess, and adapt to, the
risks posed by climate change for the city. It focusses on
near-term climate adaptation outcomes and actions.
Alongside the recent COP21 global agreement to limit
global temperature rise to less than 2˚C, the City has
committed to the Paris Pledge for Action and the Paris
City Hall Declaration to achieve climate stability. Both
commitments demonstrate strong global political
agreement for a climate resilient economy. We are also
part of the C40 Cities Climate Leadership Group.
18 National Aeronautics and Space Administration (NASA) http://climate.nasa.gov/causes/
100 Resilient Cities
Sydney was selected in December 2014 to take part in 100 Resilient Cities, pioneered by the Rockefeller Foundation. Resilient Sydney is a 100RC initiative in collaboration with the City of Sydney, the metropolitan councils of Sydney and the NSW Government. The program is designed to help cities become resilient and deal with future shocks and stresses.
In August 2016, the Preliminary Resilience Assessment (PRA) and City Context research paper for metropolitan Sydney were completed, with a message from the NSW Minister for Planning incorporated. Over 600 representatives from government, business and the community of metropolitan Sydney were consulted in preparing the documents. Advice was sought from an independent group of experts and the documents were approved by the Steering Committee.
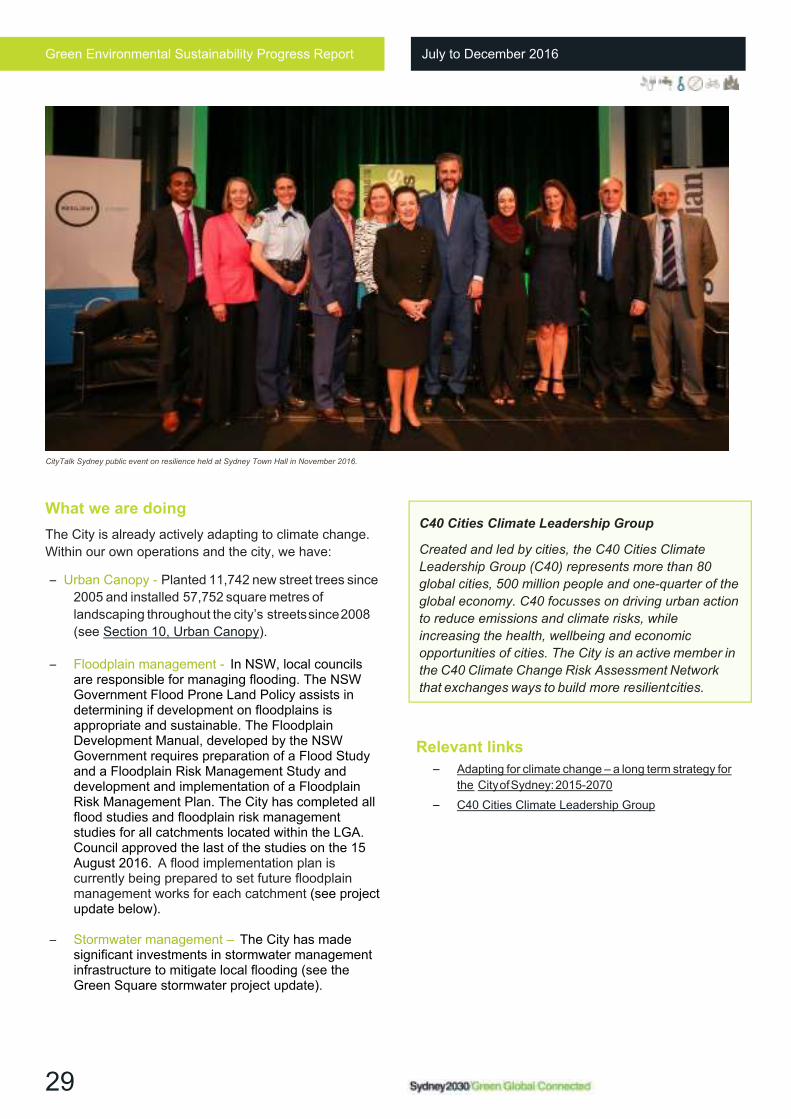
In November 2016, the City hosted a meeting between mayors and general managers from across Sydney’s metropolitan councils to discuss resilience with Michael Berkowitz, President of 100 Resilient Cities and the Resilient Sydney team, led by Chief Resilience Officer Beck Dawson. A CityTalk Sydney public event on resilience was held at Sydney Town Hall and attended by 750 people. The event titled “Is Sydney Ready?” covered the key challenges and opportunities for resilience in Sydney.
Next Steps
Phase 2 is underway with further research, structured community and stakeholder engagement and government collaboration activities. This process supports the development of a Metropolitan Resilience Strategy for Sydney. This will be completed in mid-2017.
7. Climate resilient city
Green Environmental Sustainability Progress Report July to December 2016
29
What we are doing
The City is already actively adapting to climate change.
Within our own operations and the city, we have:
– Urban Canopy - Planted 11,742 new street trees since
2005 and installed 57,752 square metres of
landscaping throughout the city’s streets since 2008
(see Section 10, Urban Canopy).
– Floodplain management - In NSW, local councils
are responsible for managing flooding. The NSW Government Flood Prone Land Policy assists in determining if development on floodplains is appropriate and sustainable. The Floodplain Development Manual, developed by the NSW Government requires preparation of a Flood Study and a Floodplain Risk Management Study and development and implementation of a Floodplain Risk Management Plan. The City has completed all flood studies and floodplain risk management studies for all catchments located within the LGA. Council approved the last of the studies on the 15 August 2016. A flood implementation plan is currently being prepared to set future floodplain management works for each catchment (see project update below).
– Stormwater management – The City has made
significant investments in stormwater management infrastructure to mitigate local flooding (see the Green Square stormwater project update).
Relevant links
– Adapting for climate change – a long term strategy for
the City of Sydney: 2015-2070
– C40 Cities Climate Leadership Group
C40 Cities Climate Leadership Group
Created and led by cities, the C40 Cities Climate
Leadership Group (C40) represents more than 80
global cities, 500 million people and one-quarter of the
global economy. C40 focusses on driving urban action
to reduce emissions and climate risks, while
increasing the health, wellbeing and economic
opportunities of cities. The City is an active member in
the C40 Climate Change Risk Assessment Network
that exchanges ways to build more resilient cities.
CityTalk Sydney public event on resilience held at Sydney Town Hall in November 2016.
Green Environmental Sustainability Progress Report July to December 2016
30
PROJECT UPDATE
Floodplain management
The City of Sydney local government area comprises eight drainage catchment areas in: Alexandra Canal, Blackwattle Bay, Centennial Park, City area, Darling Harbour, Johnston’s Creek, Rushcutters Bay and Woolloomooloo.
The City finalised all Flood Studies and Floodplain Risk Management Studies in August 2016 with the aid of NSW and Federal Government grants. The Green Square Stormwater Drain, Ashmore Trunk Drain and Joynton Avenue Trunk Drain are three significant projects that have all been recently instigated as a result of these studies. Sydney Water is working in partnership with the City on several of these projects as they do own a large proportion of the trunk drainage in the City.
Alongside a series of major flood mitigation projects, the City is presently completing a structural and serviceability assessment of the City’s 190 kilometres length of pipes, 9204 pits and 2997 junction pits.
PROJECT UPDATE
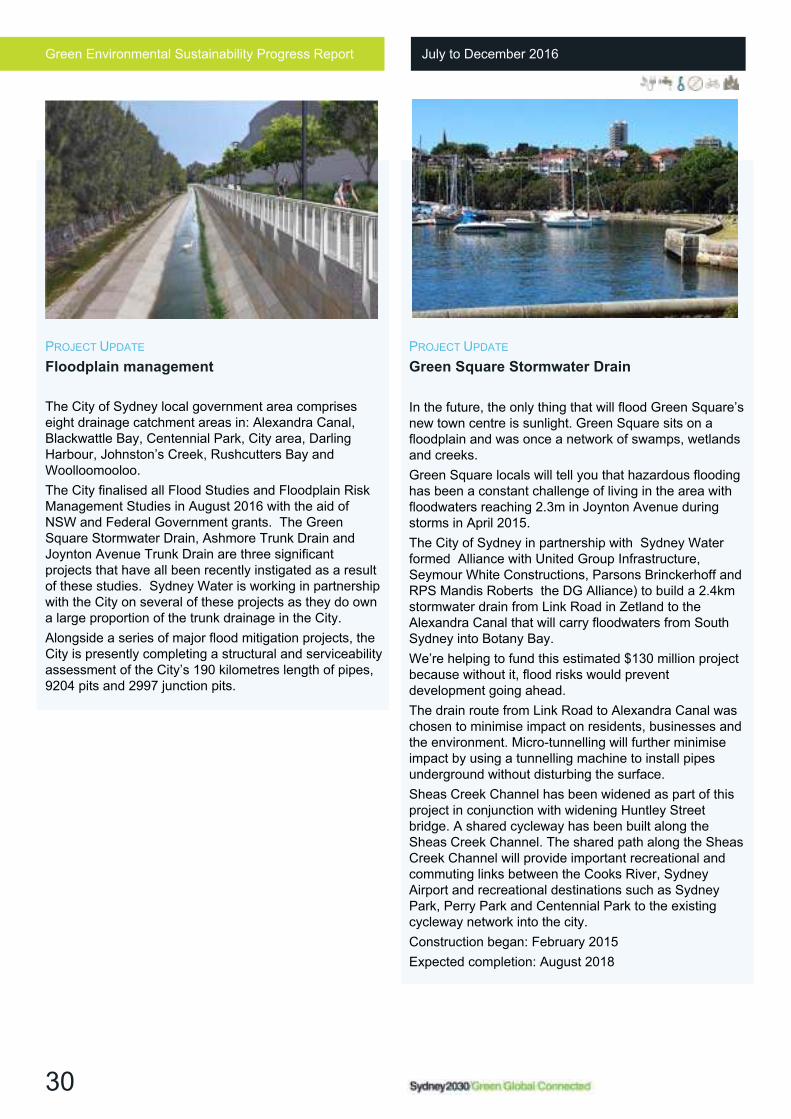
Green Square Stormwater Drain
In the future, the only thing that will flood Green Square’s new town centre is sunlight. Green Square sits on a floodplain and was once a network of swamps, wetlands and creeks. Green Square locals will tell you that hazardous flooding has been a constant challenge of living in the area with floodwaters reaching 2.3m in Joynton Avenue during storms in April 2015.
The City of Sydney in partnership with Sydney Water formed Alliance with United Group Infrastructure, Seymour White Constructions, Parsons Brinckerhoff and RPS Mandis Roberts the DG Alliance) to build a 2.4km stormwater drain from Link Road in Zetland to the Alexandra Canal that will carry floodwaters from South Sydney into Botany Bay.
We’re helping to fund this estimated $130 million project because without it, flood risks would prevent development going ahead.
The drain route from Link Road to Alexandra Canal was chosen to minimise impact on residents, businesses and the environment. Micro-tunnelling will further minimise impact by using a tunnelling machine to install pipes underground without disturbing the surface.
Sheas Creek Channel has been widened as part of this project in conjunction with widening Huntley Street bridge. A shared cycleway has been built along the Sheas Creek Channel. The shared path along the Sheas Creek Channel will provide important recreational and commuting links between the Cooks River, Sydney Airport and recreational destinations such as Sydney Park, Perry Park and Centennial Park to the existing cycleway network into the city.
Construction began: February 2015
Expected completion: August 2018
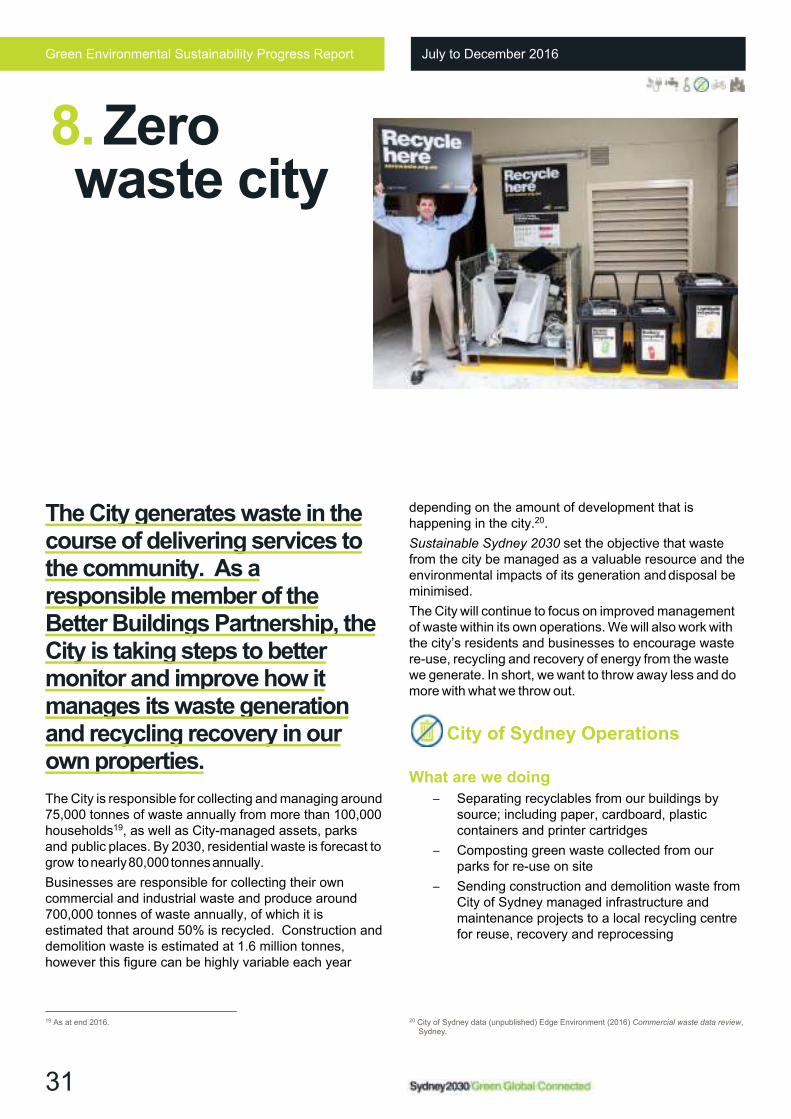
Green Environmental Sustainability Progress Report July to December 2016
31
The City generates waste in the course of delivering services to the community. As a responsible member of the Better Buildings Partnership, the City is taking steps to better monitor and improve how it manages its waste generation and recycling recovery in our own properties.
The City is responsible for collecting and managing around 75,000 tonnes of waste annually from more than 100,000 households19, as well as City-managed assets, parks and public places. By 2030, residential waste is forecast to grow to nearly 80,000 tonnes annually.
Businesses are responsible for collecting their own commercial and industrial waste and produce around 700,000 tonnes of waste annually, of which it is estimated that around 50% is recycled. Construction and demolition waste is estimated at 1.6 million tonnes, however this figure can be highly variable each year
19 As at end 2016.
depending on the amount of development that is happening in the city.20.
Sustainable Sydney 2030 set the objective that waste from the city be managed as a valuable resource and the environmental impacts of its generation and disposal be minimised.
The City will continue to focus on improved management of waste within its own operations. We will also work with the city’s residents and businesses to encourage waste re-use, recycling and recovery of energy from the waste we generate. In short, we want to throw away less and do more with what we throw out.
City of Sydney Operations
What are we doing
– Separating recyclables from our buildings by source; including paper, cardboard, plastic containers and printer cartridges
– Composting green waste collected from our parks for re-use on site
– Sending construction and demolition waste from City of Sydney managed infrastructure and maintenance projects to a local recycling centre for reuse, recovery and reprocessing
20 City of Sydney data (unpublished) Edge Environment (2016) Commercial waste data review, Sydney.
8. Zero waste city
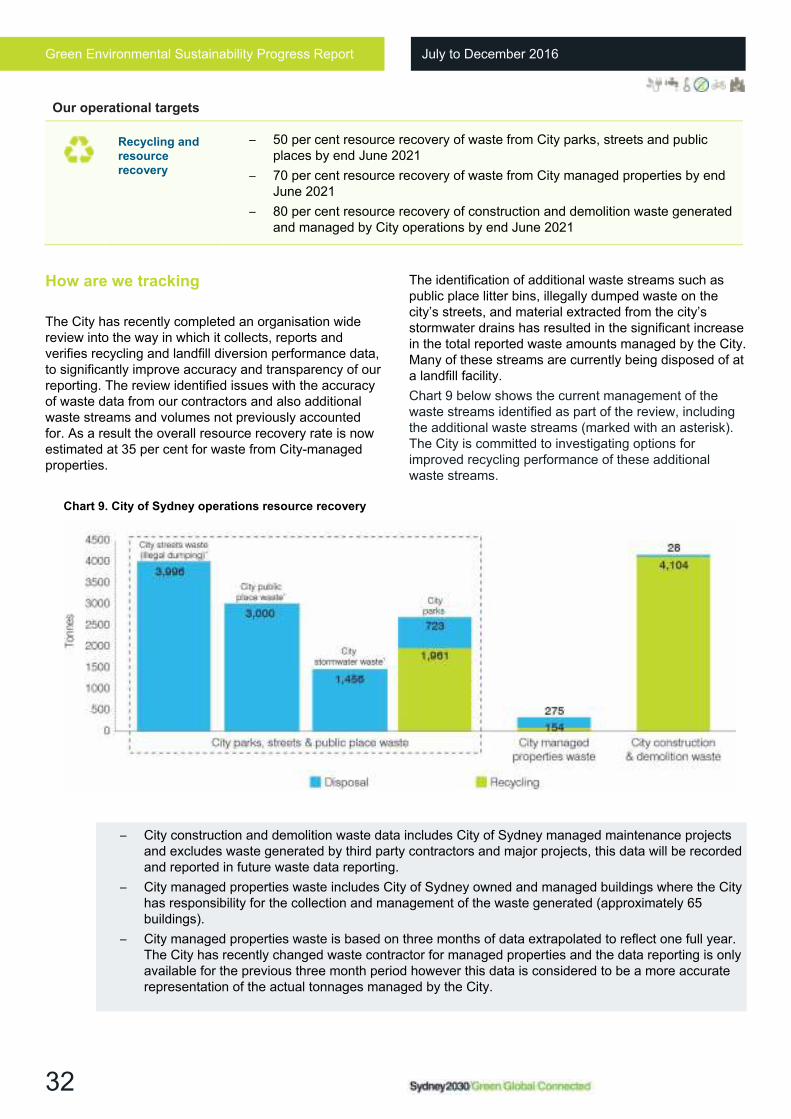
Green Environmental Sustainability Progress Report July to December 2016
32
Our operational targets
Recycling and
resource
recovery
– 50 per cent resource recovery of waste from City parks, streets and public places by end June 2021
– 70 per cent resource recovery of waste from City managed properties by end June 2021
– 80 per cent resource recovery of construction and demolition waste generated and managed by City operations by end June 2021
How are we tracking
The City has recently completed an organisation wide review into the way in which it collects, reports and verifies recycling and landfill diversion performance data, to significantly improve accuracy and transparency of our reporting. The review identified issues with the accuracy of waste data from our contractors and also additional waste streams and volumes not previously accounted for. As a result the overall resource recovery rate is now estimated at 35 per cent for waste from City-managed properties.
The identification of additional waste streams such as public place litter bins, illegally dumped waste on the city’s streets, and material extracted from the city’s stormwater drains has resulted in the significant increase in the total reported waste amounts managed by the City. Many of these streams are currently being disposed of at a landfill facility.
Chart 9 below shows the current management of the waste streams identified as part of the review, including the additional waste streams (marked with an asterisk). The City is committed to investigating options for improved recycling performance of these additional waste streams.
– City construction and demolition waste data includes City of Sydney managed maintenance projects and excludes waste generated by third party contractors and major projects, this data will be recorded and reported in future waste data reporting.
– City managed properties waste includes City of Sydney owned and managed buildings where the City has responsibility for the collection and management of the waste generated (approximately 65 buildings).
– City managed properties waste is based on three months of data extrapolated to reflect one full year. The City has recently changed waste contractor for managed properties and the data reporting is only available for the previous three month period however this data is considered to be a more accurate representation of the actual tonnages managed by the City.
Chart 9. City of Sydney operations resource recovery
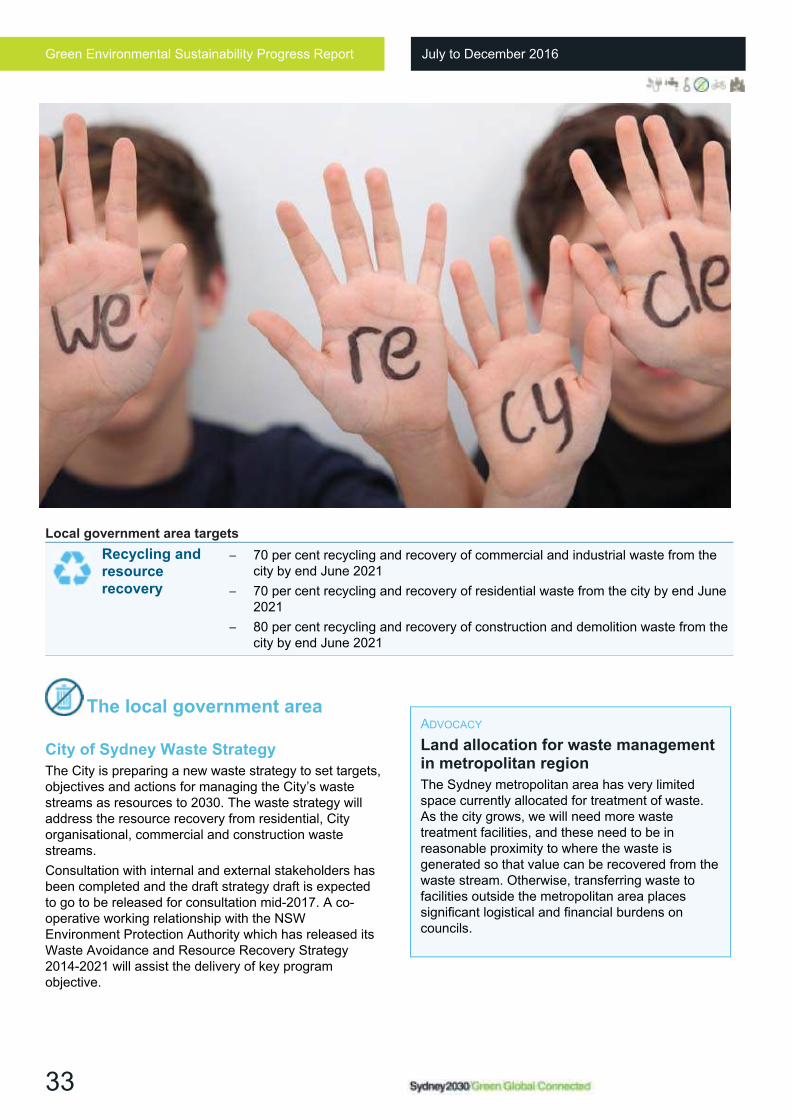
Green Environmental Sustainability Progress Report July to December 2016
33
The local government area
City of Sydney Waste Strategy
The City is preparing a new waste strategy to set targets, objectives and actions for managing the City’s waste streams as resources to 2030. The waste strategy will address the resource recovery from residential, City organisational, commercial and construction waste streams.
Consultation with internal and external stakeholders has been completed and the draft strategy draft is expected to go to be released for consultation mid-2017. A co-operative working relationship with the NSW Environment Protection Authority which has released its Waste Avoidance and Resource Recovery Strategy 2014-2021 will assist the delivery of key program objective.
Local government area targets
Recycling and
resource
recovery
– 70 per cent recycling and recovery of commercial and industrial waste from the city by end June 2021
– 70 per cent recycling and recovery of residential waste from the city by end June 2021
– 80 per cent recycling and recovery of construction and demolition waste from the city by end June 2021
ADVOCACY
Land allocation for waste management in metropolitan region
The Sydney metropolitan area has very limited space currently allocated for treatment of waste. As the city grows, we will need more waste treatment facilities, and these need to be in reasonable proximity to where the waste is generated so that value can be recovered from the waste stream. Otherwise, transferring waste to facilities outside the metropolitan area places significant logistical and financial burdens on councils.
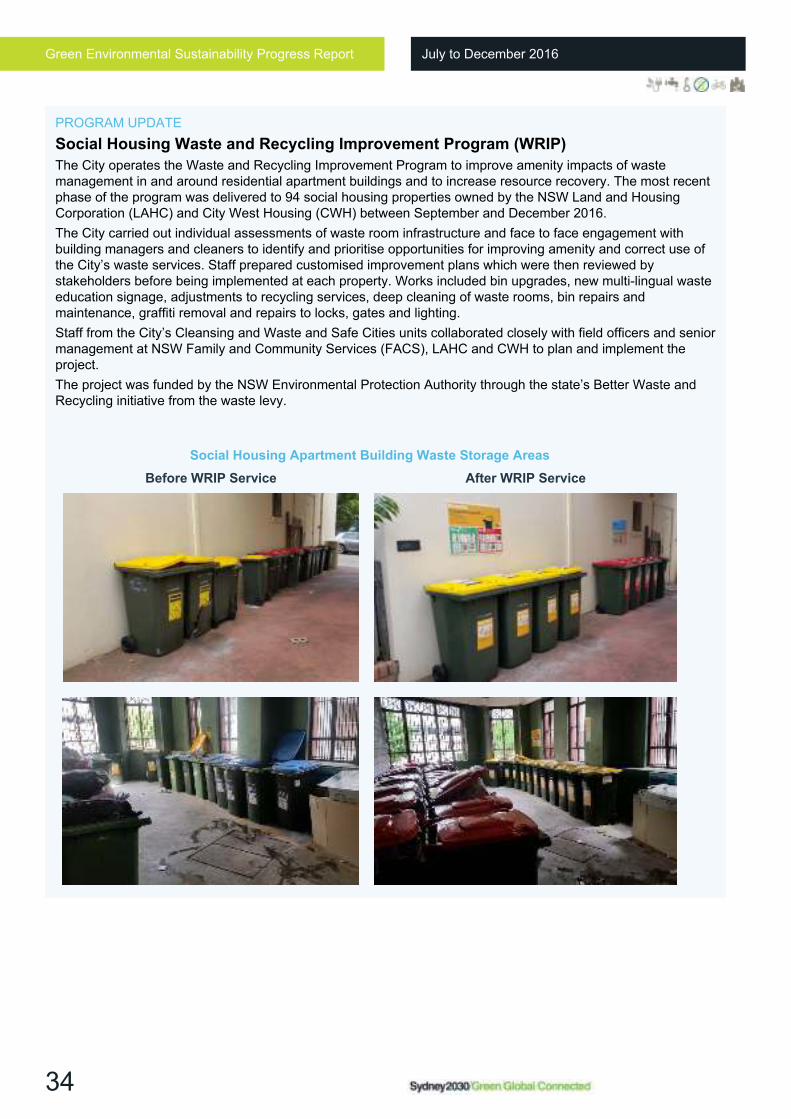
Green Environmental Sustainability Progress Report July to December 2016
34
PROGRAM UPDATE
Social Housing Waste and Recycling Improvement Program (WRIP)
The City operates the Waste and Recycling Improvement Program to improve amenity impacts of waste management in and around residential apartment buildings and to increase resource recovery. The most recent phase of the program was delivered to 94 social housing properties owned by the NSW Land and Housing Corporation (LAHC) and City West Housing (CWH) between September and December 2016.
The City carried out individual assessments of waste room infrastructure and face to face engagement with building managers and cleaners to identify and prioritise opportunities for improving amenity and correct use of the City’s waste services. Staff prepared customised improvement plans which were then reviewed by stakeholders before being implemented at each property. Works included bin upgrades, new multi-lingual waste education signage, adjustments to recycling services, deep cleaning of waste rooms, bin repairs and maintenance, graffiti removal and repairs to locks, gates and lighting.
Staff from the City’s Cleansing and Waste and Safe Cities units collaborated closely with field officers and senior management at NSW Family and Community Services (FACS), LAHC and CWH to plan and implement the project.
The project was funded by the NSW Environmental Protection Authority through the state’s Better Waste and Recycling initiative from the waste levy.
Social Housing Apartment Building Waste Storage Areas
Before WRIP Service After WRIP Service
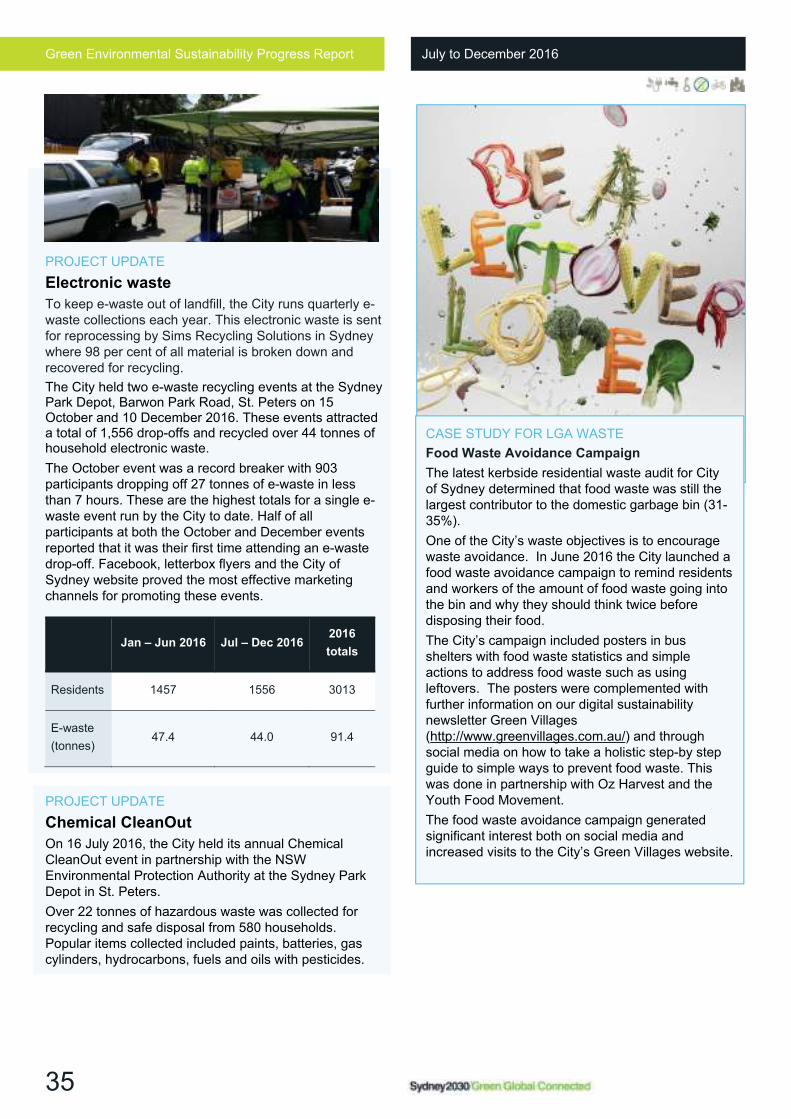
Green Environmental Sustainability Progress Report July to December 2016
35
PROJECT UPDATE
Electronic waste
To keep e-waste out of landfill, the City runs quarterly e-waste collections each year. This electronic waste is sent for reprocessing by Sims Recycling Solutions in Sydney where 98 per cent of all material is broken down and recovered for recycling.
The City held two e-waste recycling events at the Sydney Park Depot, Barwon Park Road, St. Peters on 15 October and 10 December 2016. These events attracted a total of 1,556 drop-offs and recycled over 44 tonnes of household electronic waste.
The October event was a record breaker with 903 participants dropping off 27 tonnes of e-waste in less than 7 hours. These are the highest totals for a single e-waste event run by the City to date. Half of all participants at both the October and December events reported that it was their first time attending an e-waste drop-off. Facebook, letterbox flyers and the City of Sydney website proved the most effective marketing channels for promoting these events.
PROJECT UPDATE
Chemical CleanOut
On 16 July 2016, the City held its annual Chemical CleanOut event in partnership with the NSW Environmental Protection Authority at the Sydney Park Depot in St. Peters.
Over 22 tonnes of hazardous waste was collected for recycling and safe disposal from 580 households. Popular items collected included paints, batteries, gas cylinders, hydrocarbons, fuels and oils with pesticides.
Jan – Jun 2016 Jul – Dec 2016
2016
totals
Residents 1457 1556 3013
E-waste
(tonnes) 47.4 44.0 91.4
CASE STUDY FOR LGA WASTE
Food Waste Avoidance Campaign
The latest kerbside residential waste audit for City of Sydney determined that food waste was still the largest contributor to the domestic garbage bin (31-35%).
One of the City’s waste objectives is to encourage waste avoidance. In June 2016 the City launched a food waste avoidance campaign to remind residents and workers of the amount of food waste going into the bin and why they should think twice before disposing their food.
The City’s campaign included posters in bus shelters with food waste statistics and simple actions to address food waste such as using leftovers. The posters were complemented with further information on our digital sustainability newsletter Green Villages (http://www.greenvillages.com.au/) and through social media on how to take a holistic step-by step guide to simple ways to prevent food waste. This was done in partnership with Oz Harvest and the Youth Food Movement.
The food waste avoidance campaign generated significant interest both on social media and increased visits to the City’s Green Villages website.
Green Environmental Sustainability Progress Report July to December 2016
36
The City is committed to promoting the most sustainable modes of transport for residents, workers and visitors.
City of Sydney Operations
Fleet emissions
The City’s Fleet Services section has continued to lead the fleet industry by reducing greenhouse gas emissions through its Sustainable Fleet Management Program. Having taken advantage of all available tools, fuels and technologies, the program is now focussed on maintaining emissions at 2013/14 levels until new low-emission products and technologies become available in Australia.
The combined fleet emissions for 2015/16 were 190 tonnes better than the target of 2,350 tCO2-e. Emissions for 2016/17 are already on track to again beat the target, with Q1 and Q2 emissions being 56 tCO2-e better than the same period in the previous year. 1,088 litres of fuel was consumed by the City’s fleet during Q1 and Q2 which was a decrease of 51 litres from the same period in 2015/16. 75 per cent of this was blended sustainable bio-diesel.
Our operational targets
Fleet Services continue to monitor odometer and fuelling data with a view to more accurate, timely and relevant data. This will better support fact-based decision making on sustainable asset management and renewal.
It will also assist in identifying engine and driver performance, enabling opportunities for further emission savings.
Research and experience demonstrates that eco-driving goes hand-in-hand with low-risk, safer driving. The City’s Low-risk and Eco-driving handbook continued to be rolled out to the City’s drivers throughout 2016/17. The handbook is a key tool in implementing the eco-driving strategy and is supported by ongoing awareness training and in-cabin driver training. By promoting and improving safer driving behaviour and skills we expect to achieve considerably lower vehicle emissions in the future.
The City was recognised for its Crash Management Strategy and Low-risk and Eco-driving Handbook when it was awarded the Brake Fleet Safety’s Australasian ‘Company Driver Safety Award’ for September 2016.
The Fleet team were again recognised in September when they received the 2016 CGU Benchmark Award for ‘Inspiring Excellence in Fleet Risk Management’ for its clear focus on managing fleet risk and developing a zero crash culture.
9. Active and connected city
Fleet
emissions
– Zero increase in emissions from the City’s fleet of vehicles by 2021, from 2014 levels
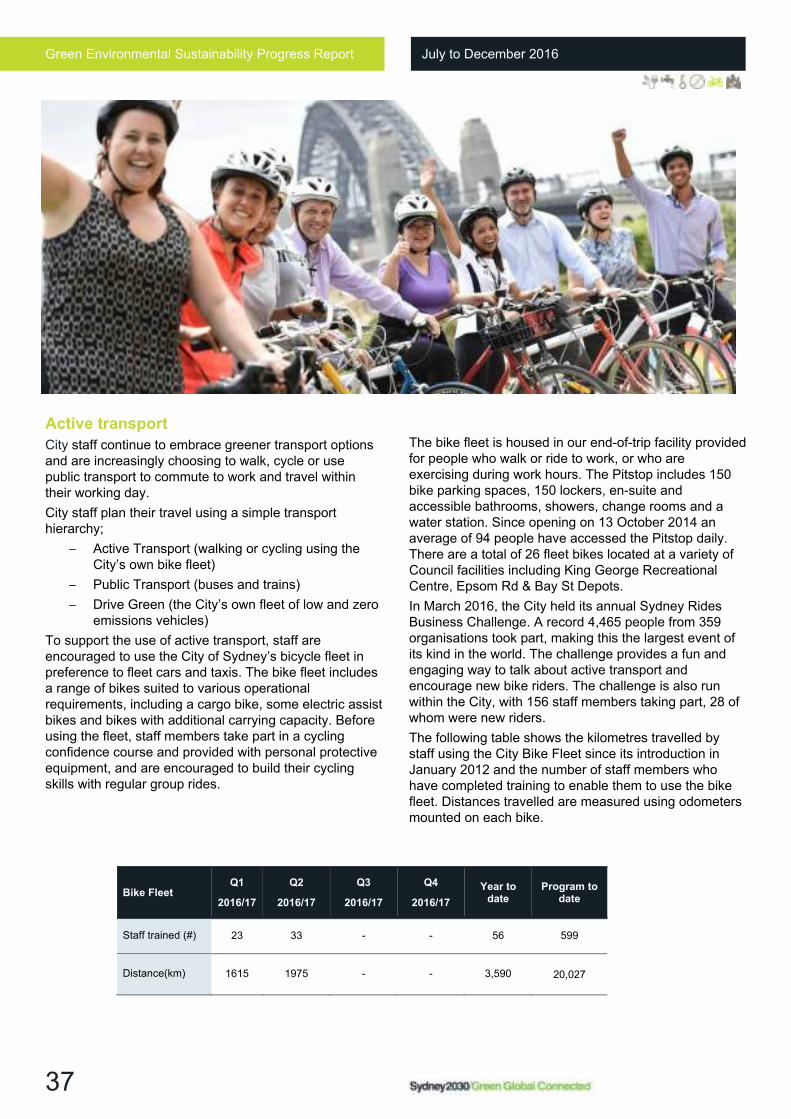
Green Environmental Sustainability Progress Report July to December 2016
37
Active transport
City staff continue to embrace greener transport options and are increasingly choosing to walk, cycle or use public transport to commute to work and travel within their working day.
City staff plan their travel using a simple transport hierarchy;
– Active Transport (walking or cycling using the City’s own bike fleet)
– Public Transport (buses and trains)
– Drive Green (the City’s own fleet of low and zero emissions vehicles)
To support the use of active transport, staff are encouraged to use the City of Sydney’s bicycle fleet in preference to fleet cars and taxis. The bike fleet includes a range of bikes suited to various operational requirements, including a cargo bike, some electric assist bikes and bikes with additional carrying capacity. Before using the fleet, staff members take part in a cycling confidence course and provided with personal protective equipment, and are encouraged to build their cycling skills with regular group rides.
The bike fleet is housed in our end-of-trip facility provided for people who walk or ride to work, or who are exercising during work hours. The Pitstop includes 150 bike parking spaces, 150 lockers, en-suite and accessible bathrooms, showers, change rooms and a water station. Since opening on 13 October 2014 an average of 94 people have accessed the Pitstop daily. There are a total of 26 fleet bikes located at a variety of Council facilities including King George Recreational Centre, Epsom Rd & Bay St Depots.
In March 2016, the City held its annual Sydney Rides Business Challenge. A record 4,465 people from 359 organisations took part, making this the largest event of its kind in the world. The challenge provides a fun and engaging way to talk about active transport and encourage new bike riders. The challenge is also run within the City, with 156 staff members taking part, 28 of whom were new riders.
The following table shows the kilometres travelled by staff using the City Bike Fleet since its introduction in January 2012 and the number of staff members who have completed training to enable them to use the bike fleet. Distances travelled are measured using odometers mounted on each bike.
Bike Fleet Q1
2016/17
Q2
2016/17
Q3
2016/17
Q4
2016/17
Year to date
Program to date
Staff trained (#) 23 33 - - 56 599
Distance(km) 1615 1975 - - 3,590
20,027
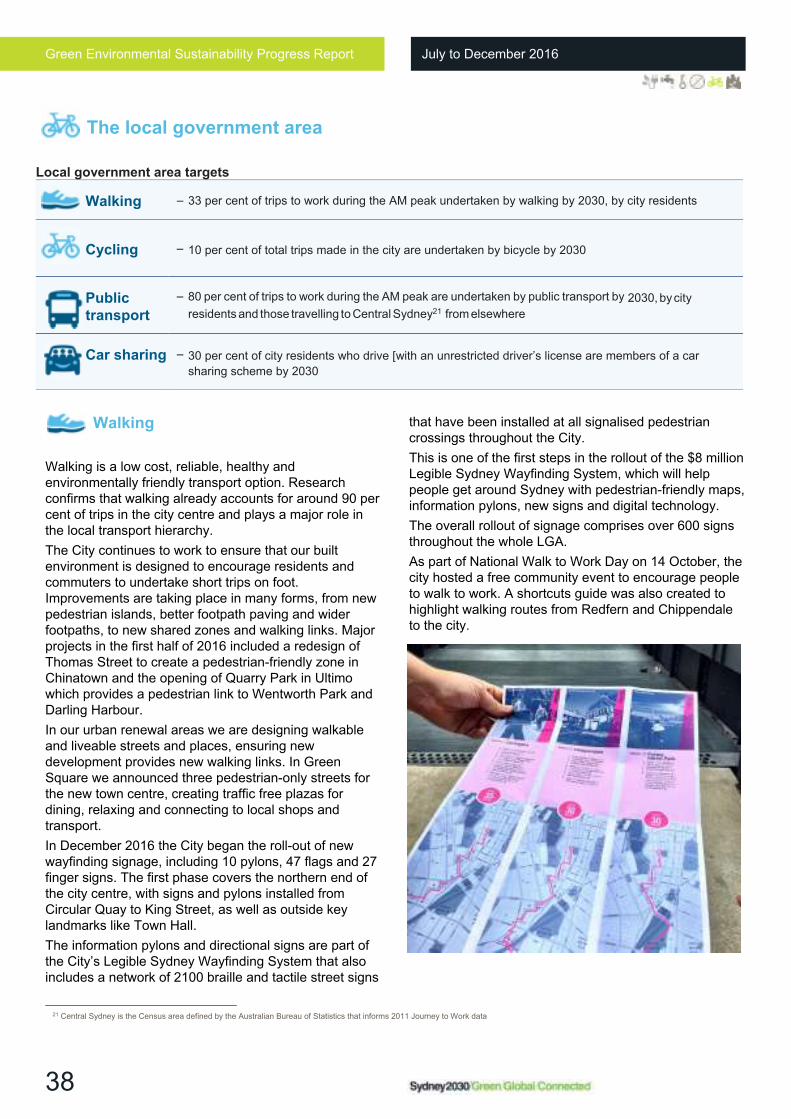
Green Environmental Sustainability Progress Report July to December 2016
38
The local government area
Local government area targets
Walking – 33 per cent of trips to work during the AM peak undertaken by walking by 2030, by city residents
Cycling – 10 per cent of total trips made in the city are undertaken by bicycle by 2030
Public
transport
– 80 per cent of trips to work during the AM peak are undertaken by public transport by 2030, by city
residents and those travelling to Central Sydney21 from elsewhere
Car sharing – 30 per cent of city residents who drive [with an unrestricted driver’s license are members of a car
sharing scheme by 2030
Walking
Walking is a low cost, reliable, healthy and environmentally friendly transport option. Research confirms that walking already accounts for around 90 per cent of trips in the city centre and plays a major role in the local transport hierarchy.
The City continues to work to ensure that our built environment is designed to encourage residents and commuters to undertake short trips on foot. Improvements are taking place in many forms, from new pedestrian islands, better footpath paving and wider footpaths, to new shared zones and walking links. Major projects in the first half of 2016 included a redesign of Thomas Street to create a pedestrian-friendly zone in Chinatown and the opening of Quarry Park in Ultimo which provides a pedestrian link to Wentworth Park and Darling Harbour.
In our urban renewal areas we are designing walkable and liveable streets and places, ensuring new development provides new walking links. In Green Square we announced three pedestrian-only streets for the new town centre, creating traffic free plazas for dining, relaxing and connecting to local shops and transport.
In December 2016 the City began the roll-out of new wayfinding signage, including 10 pylons, 47 flags and 27 finger signs. The first phase covers the northern end of the city centre, with signs and pylons installed from Circular Quay to King Street, as well as outside key landmarks like Town Hall.
The information pylons and directional signs are part of the City’s Legible Sydney Wayfinding System that also includes a network of 2100 braille and tactile street signs
21 Central Sydney is the Census area defined by the Australian Bureau of Statistics that informs 2011 Journey to Work data
that have been installed at all signalised pedestrian crossings throughout the City.
This is one of the first steps in the rollout of the $8 million Legible Sydney Wayfinding System, which will help people get around Sydney with pedestrian-friendly maps, information pylons, new signs and digital technology.
The overall rollout of signage comprises over 600 signs throughout the whole LGA.
As part of National Walk to Work Day on 14 October, the city hosted a free community event to encourage people to walk to work. A shortcuts guide was also created to highlight walking routes from Redfern and Chippendale to the city.
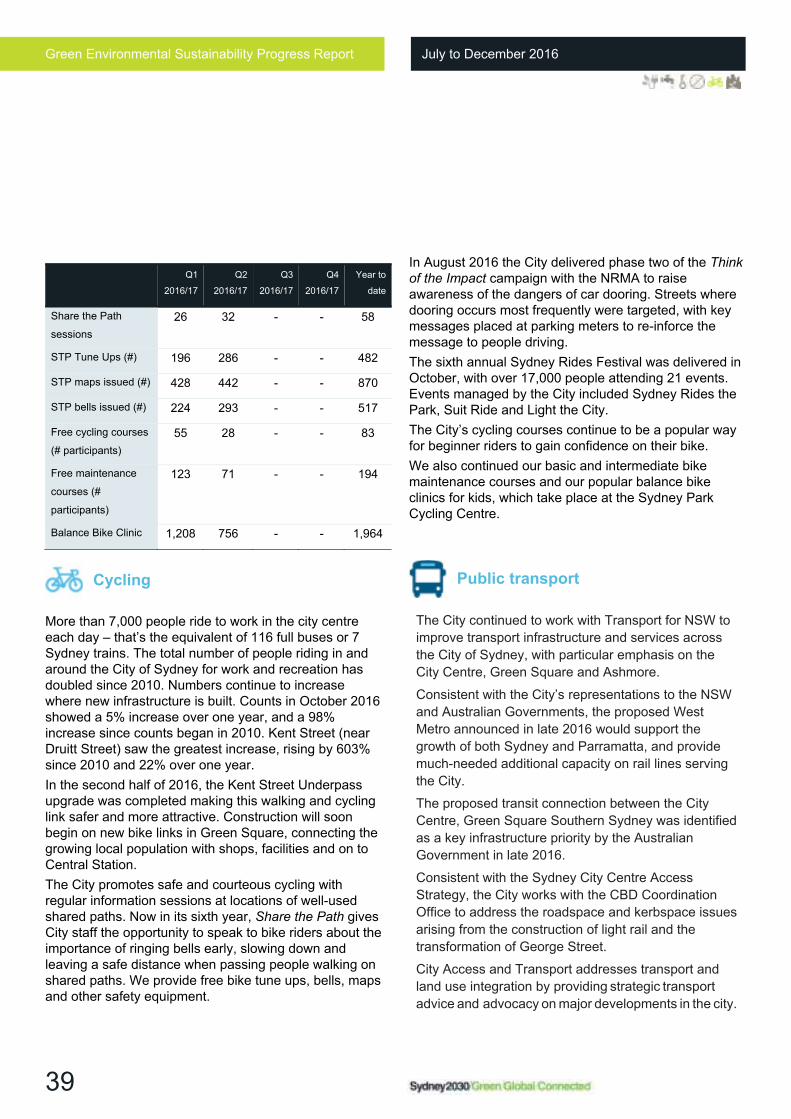
Green Environmental Sustainability Progress Report July to December 2016
39
Cycling
More than 7,000 people ride to work in the city centre each day – that’s the equivalent of 116 full buses or 7 Sydney trains. The total number of people riding in and around the City of Sydney for work and recreation has doubled since 2010. Numbers continue to increase where new infrastructure is built. Counts in October 2016 showed a 5% increase over one year, and a 98% increase since counts began in 2010. Kent Street (near Druitt Street) saw the greatest increase, rising by 603% since 2010 and 22% over one year.
In the second half of 2016, the Kent Street Underpass upgrade was completed making this walking and cycling link safer and more attractive. Construction will soon begin on new bike links in Green Square, connecting the growing local population with shops, facilities and on to Central Station.
The City promotes safe and courteous cycling with regular information sessions at locations of well-used shared paths. Now in its sixth year, Share the Path gives City staff the opportunity to speak to bike riders about the importance of ringing bells early, slowing down and leaving a safe distance when passing people walking on shared paths. We provide free bike tune ups, bells, maps and other safety equipment.
In August 2016 the City delivered phase two of the Think
of the Impact campaign with the NRMA to raise awareness of the dangers of car dooring. Streets where dooring occurs most frequently were targeted, with key messages placed at parking meters to re-inforce the message to people driving.
The sixth annual Sydney Rides Festival was delivered in October, with over 17,000 people attending 21 events. Events managed by the City included Sydney Rides the Park, Suit Ride and Light the City.
The City’s cycling courses continue to be a popular way for beginner riders to gain confidence on their bike.
We also continued our basic and intermediate bike maintenance courses and our popular balance bike clinics for kids, which take place at the Sydney Park Cycling Centre.
Public transport
The City continued to work with Transport for NSW to
improve transport infrastructure and services across
the City of Sydney, with particular emphasis on the
City Centre, Green Square and Ashmore.
Consistent with the City’s representations to the NSW
and Australian Governments, the proposed West
Metro announced in late 2016 would support the
growth of both Sydney and Parramatta, and provide
much-needed additional capacity on rail lines serving
the City.
The proposed transit connection between the City
Centre, Green Square Southern Sydney was identified
as a key infrastructure priority by the Australian
Government in late 2016.
Consistent with the Sydney City Centre Access
Strategy, the City works with the CBD Coordination
Office to address the roadspace and kerbspace issues
arising from the construction of light rail and the
transformation of George Street.
City Access and Transport addresses transport and
land use integration by providing strategic transport
advice and advocacy on major developments in the city.
Q1
2016/17
Q2
2016/17
Q3
2016/17
Q4
2016/17
Year to
date
Share the Path
sessions
26 32 - - 58
STP Tune Ups (#) 196 286 - - 482
STP maps issued (#) 428 442 - - 870
STP bells issued (#) 224 293 - - 517
Free cycling courses
(# participants)
55 28 - - 83
Free maintenance
courses (#
participants)
123 71 - - 194
Balance Bike Clinic 1,208 756 - - 1,964
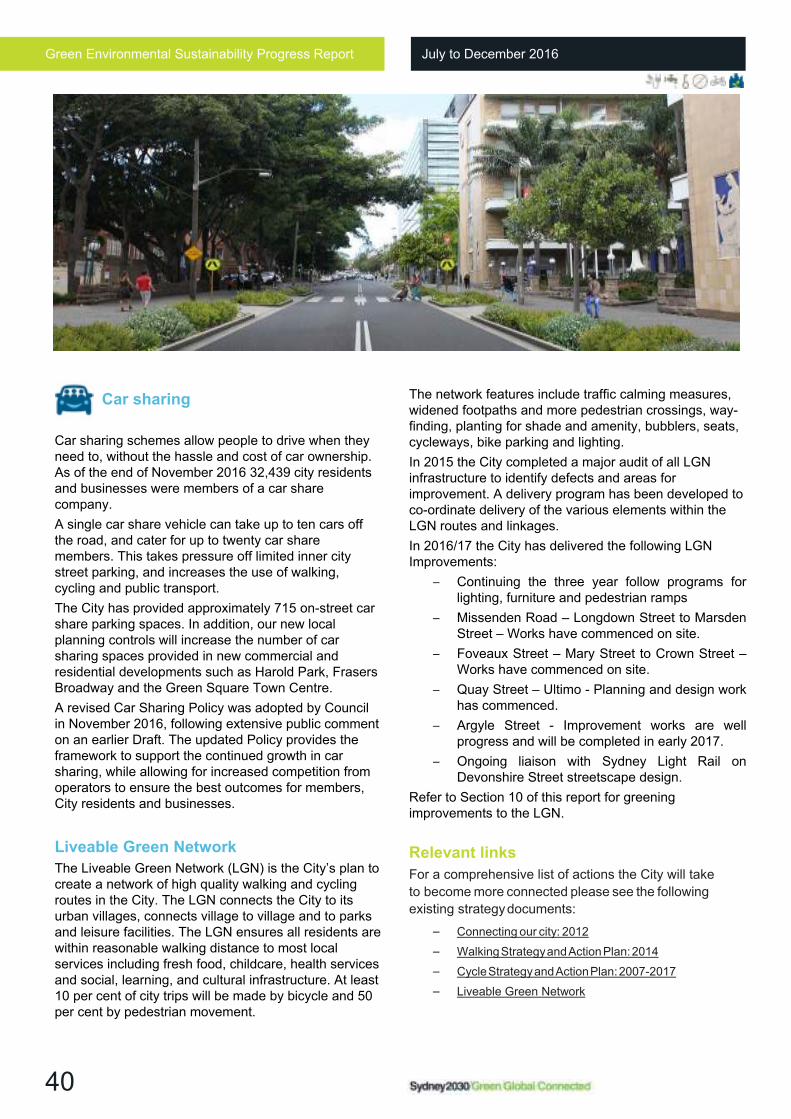
Green Environmental Sustainability Progress Report July to December 2016
40
Car sharing
Car sharing schemes allow people to drive when they need to, without the hassle and cost of car ownership. As of the end of November 2016 32,439 city residents and businesses were members of a car share company.
A single car share vehicle can take up to ten cars off the road, and cater for up to twenty car share members. This takes pressure off limited inner city street parking, and increases the use of walking, cycling and public transport.
The City has provided approximately 715 on-street car share parking spaces. In addition, our new local planning controls will increase the number of car sharing spaces provided in new commercial and residential developments such as Harold Park, Frasers Broadway and the Green Square Town Centre.
A revised Car Sharing Policy was adopted by Council in November 2016, following extensive public comment on an earlier Draft. The updated Policy provides the framework to support the continued growth in car sharing, while allowing for increased competition from operators to ensure the best outcomes for members, City residents and businesses.
Liveable Green Network
The Liveable Green Network (LGN) is the City’s plan to create a network of high quality walking and cycling routes in the City. The LGN connects the City to its urban villages, connects village to village and to parks and leisure facilities. The LGN ensures all residents are within reasonable walking distance to most local services including fresh food, childcare, health services and social, learning, and cultural infrastructure. At least 10 per cent of city trips will be made by bicycle and 50 per cent by pedestrian movement.
The network features include traffic calming measures, widened footpaths and more pedestrian crossings, way-finding, planting for shade and amenity, bubblers, seats, cycleways, bike parking and lighting.
In 2015 the City completed a major audit of all LGN infrastructure to identify defects and areas for improvement. A delivery program has been developed to co-ordinate delivery of the various elements within the LGN routes and linkages.
In 2016/17 the City has delivered the following LGN Improvements:
– Continuing the three year follow programs for lighting, furniture and pedestrian ramps
– Missenden Road – Longdown Street to Marsden Street – Works have commenced on site.
– Foveaux Street – Mary Street to Crown Street – Works have commenced on site.
– Quay Street – Ultimo - Planning and design work has commenced.
– Argyle Street - Improvement works are well progress and will be completed in early 2017.
– Ongoing liaison with Sydney Light Rail on Devonshire Street streetscape design.
Refer to Section 10 of this report for greening improvements to the LGN.
Relevant links
For a comprehensive list of actions the City will take
to become more connected please see the following
existing strategy documents:
– Connecting our city: 2012
– Walking Strategy and Action Plan: 2014
– Cycle Strategy and Action Plan: 2007-2017
– Liveable Green Network
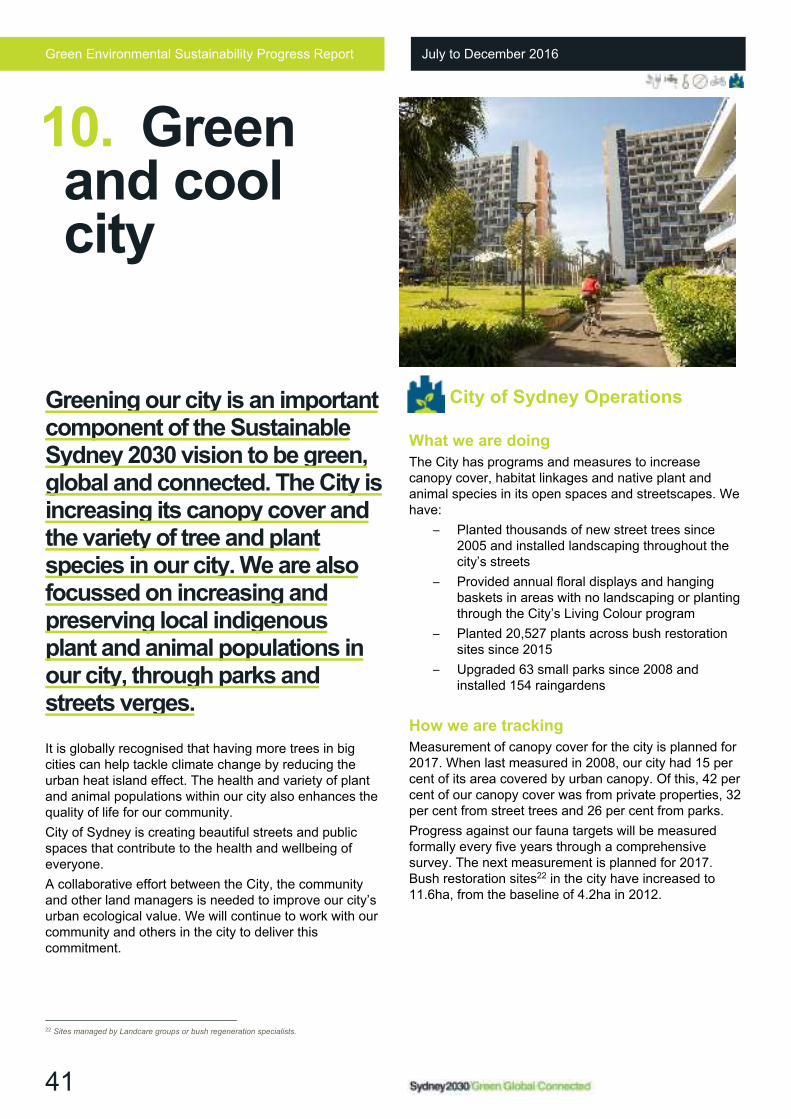
Green Environmental Sustainability Progress Report July to December 2016
41
Greening our city is an important component of the Sustainable Sydney 2030 vision to be green, global and connected. The City is increasing its canopy cover and the variety of tree and plant species in our city. We are also focussed on increasing and preserving local indigenous plant and animal populations in our city, through parks and streets verges.
It is globally recognised that having more trees in big cities can help tackle climate change by reducing the urban heat island effect. The health and variety of plant and animal populations within our city also enhances the quality of life for our community.
City of Sydney is creating beautiful streets and public spaces that contribute to the health and wellbeing of everyone.
A collaborative effort between the City, the community and other land managers is needed to improve our city’s urban ecological value. We will continue to work with our community and others in the city to deliver this commitment.
22 Sites managed by Landcare groups or bush regeneration specialists.
City of Sydney Operations
What we are doing
The City has programs and measures to increase canopy cover, habitat linkages and native plant and animal species in its open spaces and streetscapes. We have:
– Planted thousands of new street trees since 2005 and installed landscaping throughout the city’s streets
– Provided annual floral displays and hanging baskets in areas with no landscaping or planting through the City’s Living Colour program
– Planted 20,527 plants across bush restoration sites since 2015
– Upgraded 63 small parks since 2008 and installed 154 raingardens
How we are tracking
Measurement of canopy cover for the city is planned for 2017. When last measured in 2008, our city had 15 per cent of its area covered by urban canopy. Of this, 42 per cent of our canopy cover was from private properties, 32 per cent from street trees and 26 per cent from parks.
Progress against our fauna targets will be measured formally every five years through a comprehensive survey. The next measurement is planned for 2017. Bush restoration sites22 in the city have increased to 11.6ha, from the baseline of 4.2ha in 2012.
10. Green and cool city
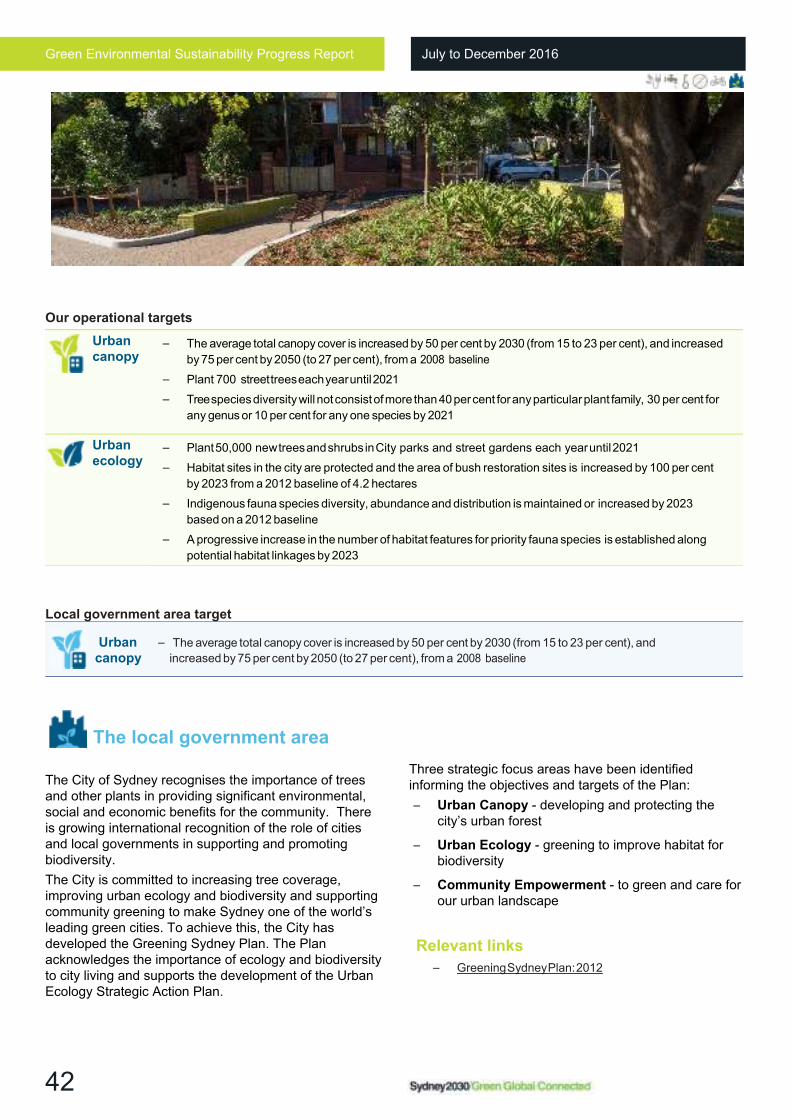
Green Environmental Sustainability Progress Report July to December 2016
42
Local government area target
Urban
canopy – The average total canopy cover is increased by 50 per cent by 2030 (from 15 to 23 per cent), and
increased by 75 per cent by 2050 (to 27 per cent), from a 2008 baseline
The local government area
The City of Sydney recognises the importance of trees and other plants in providing significant environmental, social and economic benefits for the community. There is growing international recognition of the role of cities and local governments in supporting and promoting biodiversity.
The City is committed to increasing tree coverage, improving urban ecology and biodiversity and supporting community greening to make Sydney one of the world’s leading green cities. To achieve this, the City has developed the Greening Sydney Plan. The Plan acknowledges the importance of ecology and biodiversity to city living and supports the development of the Urban Ecology Strategic Action Plan.
Three strategic focus areas have been identified informing the objectives and targets of the Plan:
– Urban Canopy - developing and protecting the city’s urban forest
– Urban Ecology - greening to improve habitat for biodiversity
– Community Empowerment - to green and care for our urban landscape
Relevant links
– Greening Sydney Plan: 2012
Our operational targets
Urban
canopy – The average total canopy cover is increased by 50 per cent by 2030 (from 15 to 23 per cent), and increased
by 75 per cent by 2050 (to 27 per cent), from a 2008 baseline
– Plant 700 street trees each year until 2021
– Tree species diversity will not consist of more than 40 per cent for any particular plant family, 30 per cent for
any genus or 10 per cent for any one species by 2021
Urban
ecology
– Plant 50,000 new trees and shrubs in City parks and street gardens each year until 2021
– Habitat sites in the city are protected and the area of bush restoration sites is increased by 100 per cent
by 2023 from a 2012 baseline of 4.2 hectares
– Indigenous fauna species diversity, abundance and distribution is maintained or increased by 2023
based on a 2012 baseline
– A progressive increase in the number of habitat features for priority fauna species is established along
potential habitat linkages by 2023
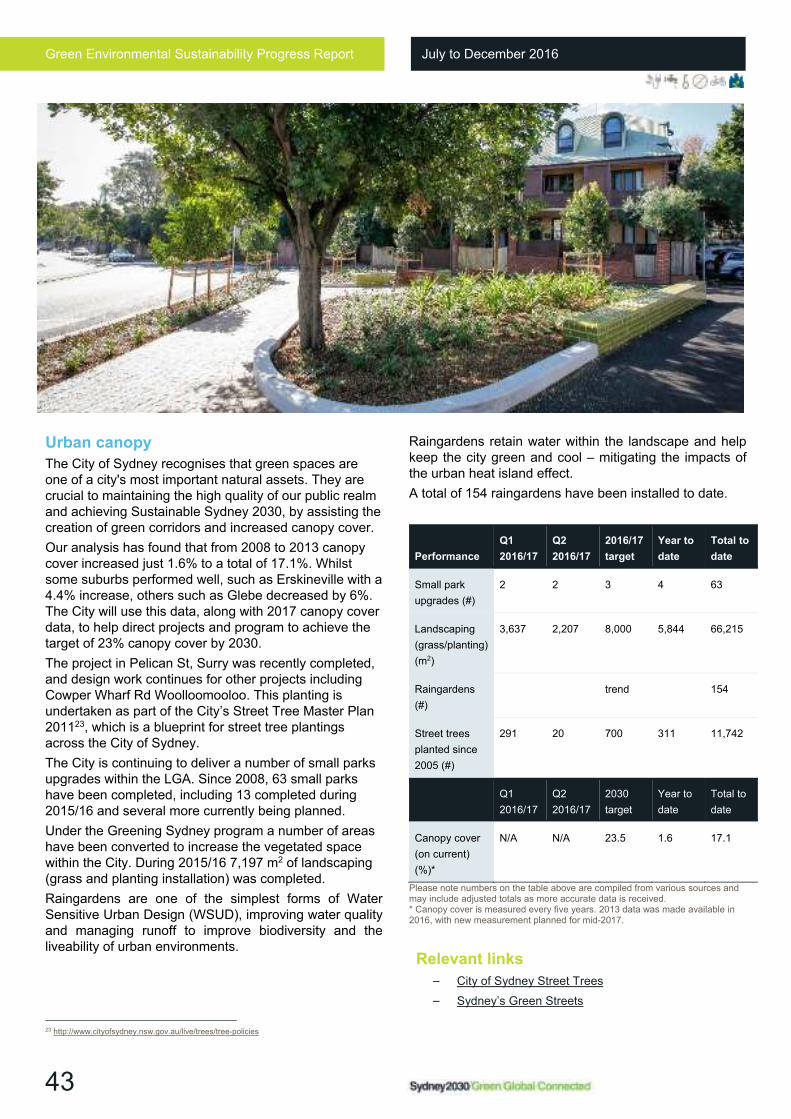
Green Environmental Sustainability Progress Report July to December 2016
43
Urban canopy
The City of Sydney recognises that green spaces are one of a city's most important natural assets. They are crucial to maintaining the high quality of our public realm and achieving Sustainable Sydney 2030, by assisting the creation of green corridors and increased canopy cover.
Our analysis has found that from 2008 to 2013 canopy cover increased just 1.6% to a total of 17.1%. Whilst some suburbs performed well, such as Erskineville with a 4.4% increase, others such as Glebe decreased by 6%. The City will use this data, along with 2017 canopy cover data, to help direct projects and program to achieve the target of 23% canopy cover by 2030.
The project in Pelican St, Surry was recently completed, and design work continues for other projects including Cowper Wharf Rd Woolloomooloo. This planting is undertaken as part of the City’s Street Tree Master Plan 201123, which is a blueprint for street tree plantings across the City of Sydney.
The City is continuing to deliver a number of small parks upgrades within the LGA. Since 2008, 63 small parks have been completed, including 13 completed during 2015/16 and several more currently being planned.
Under the Greening Sydney program a number of areas have been converted to increase the vegetated space within the City. During 2015/16 7,197 m2 of landscaping (grass and planting installation) was completed.
Raingardens are one of the simplest forms of Water Sensitive Urban Design (WSUD), improving water quality and managing runoff to improve biodiversity and the liveability of urban environments.
23 http://www.cityofsydney.nsw.gov.au/live/trees/tree-policies
Raingardens retain water within the landscape and help keep the city green and cool – mitigating the impacts of the urban heat island effect.
A total of 154 raingardens have been installed to date.
Performance
Q1
2016/17
Q2
2016/17
2016/17
target
Year to
date
Total to
date
Small park
upgrades (#)
2 2 3 4 63
Landscaping
(grass/planting)
(m2)
3,637 2,207 8,000 5,844 66,215
Raingardens
(#)
trend 154
Street trees
planted since
2005 (#)
291 20 700 311 11,742
Q1
2016/17
Q2
2016/17
2030
target
Year to
date
Total to
date
Canopy cover
(on current)
(%)*
N/A N/A 23.5 1.6 17.1
Please note numbers on the table above are compiled from various sources and may include adjusted totals as more accurate data is received. * Canopy cover is measured every five years. 2013 data was made available in 2016, with new measurement planned for mid-2017.
Relevant links
– City of Sydney Street Trees
– Sydney’s Green Streets
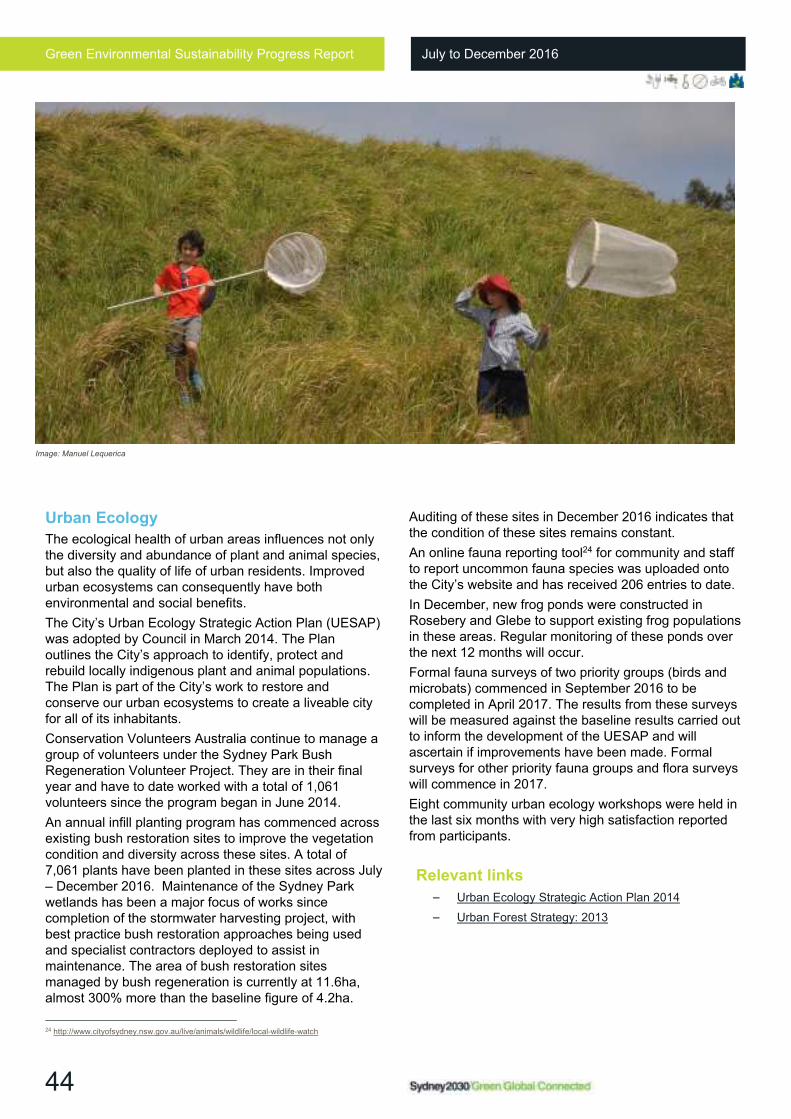
Green Environmental Sustainability Progress Report July to December 2016
44
Urban Ecology
The ecological health of urban areas influences not only the diversity and abundance of plant and animal species, but also the quality of life of urban residents. Improved urban ecosystems can consequently have both environmental and social benefits.
The City’s Urban Ecology Strategic Action Plan (UESAP) was adopted by Council in March 2014. The Plan outlines the City’s approach to identify, protect and rebuild locally indigenous plant and animal populations. The Plan is part of the City’s work to restore and conserve our urban ecosystems to create a liveable city for all of its inhabitants.
Conservation Volunteers Australia continue to manage a group of volunteers under the Sydney Park Bush Regeneration Volunteer Project. They are in their final year and have to date worked with a total of 1,061 volunteers since the program began in June 2014.
An annual infill planting program has commenced across existing bush restoration sites to improve the vegetation condition and diversity across these sites. A total of 7,061 plants have been planted in these sites across July – December 2016. Maintenance of the Sydney Park wetlands has been a major focus of works since completion of the stormwater harvesting project, with best practice bush restoration approaches being used and specialist contractors deployed to assist in maintenance. The area of bush restoration sites managed by bush regeneration is currently at 11.6ha, almost 300% more than the baseline figure of 4.2ha.
24 http://www.cityofsydney.nsw.gov.au/live/animals/wildlife/local-wildlife-watch
Auditing of these sites in December 2016 indicates that the condition of these sites remains constant.
An online fauna reporting tool24 for community and staff to report uncommon fauna species was uploaded onto the City’s website and has received 206 entries to date.
In December, new frog ponds were constructed in Rosebery and Glebe to support existing frog populations in these areas. Regular monitoring of these ponds over the next 12 months will occur.
Formal fauna surveys of two priority groups (birds and microbats) commenced in September 2016 to be completed in April 2017. The results from these surveys will be measured against the baseline results carried out to inform the development of the UESAP and will ascertain if improvements have been made. Formal surveys for other priority fauna groups and flora surveys will commence in 2017.
Eight community urban ecology workshops were held in the last six months with very high satisfaction reported from participants.
Relevant links
– Urban Ecology Strategic Action Plan 2014
– Urban Forest Strategy: 2013
Image: Manuel Lequerica
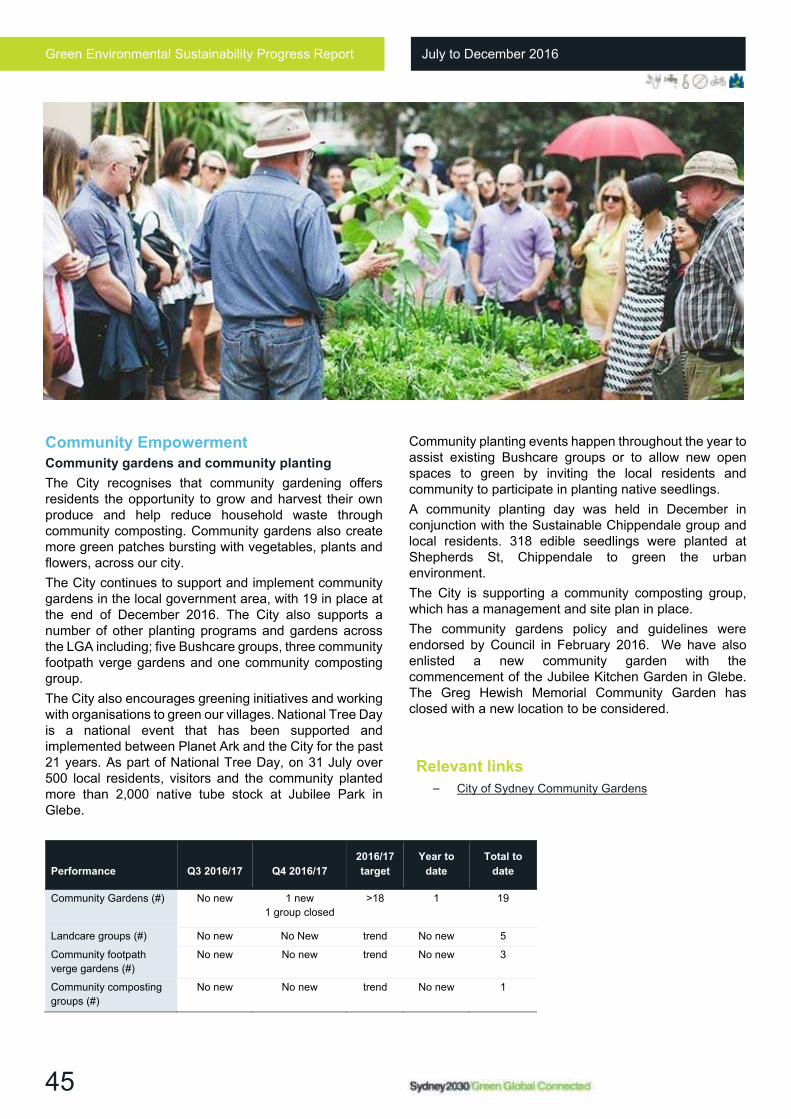
Green Environmental Sustainability Progress Report July to December 2016
45
Community Empowerment
Community gardens and community planting
The City recognises that community gardening offers residents the opportunity to grow and harvest their own produce and help reduce household waste through community composting. Community gardens also create more green patches bursting with vegetables, plants and flowers, across our city.
The City continues to support and implement community gardens in the local government area, with 19 in place at the end of December 2016. The City also supports a number of other planting programs and gardens across the LGA including; five Bushcare groups, three community footpath verge gardens and one community composting group.
The City also encourages greening initiatives and working with organisations to green our villages. National Tree Day is a national event that has been supported and implemented between Planet Ark and the City for the past 21 years. As part of National Tree Day, on 31 July over 500 local residents, visitors and the community planted more than 2,000 native tube stock at Jubilee Park in Glebe.
Community planting events happen throughout the year to assist existing Bushcare groups or to allow new open spaces to green by inviting the local residents and community to participate in planting native seedlings.
A community planting day was held in December in conjunction with the Sustainable Chippendale group and local residents. 318 edible seedlings were planted at Shepherds St, Chippendale to green the urban environment.
The City is supporting a community composting group, which has a management and site plan in place.
The community gardens policy and guidelines were endorsed by Council in February 2016. We have also enlisted a new community garden with the commencement of the Jubilee Kitchen Garden in Glebe. The Greg Hewish Memorial Community Garden has closed with a new location to be considered.
Relevant links
– City of Sydney Community Gardens
Performance Q3 2016/17 Q4 2016/17
2016/17
target
Year to
date
Total to
date
Community Gardens (#) No new 1 new
1 group closed
>18 1 19
Landcare groups (#) No new No New trend No new 5
Community footpath
verge gardens (#)
No new No new trend No new 3
Community composting
groups (#)
No new No new trend No new 1
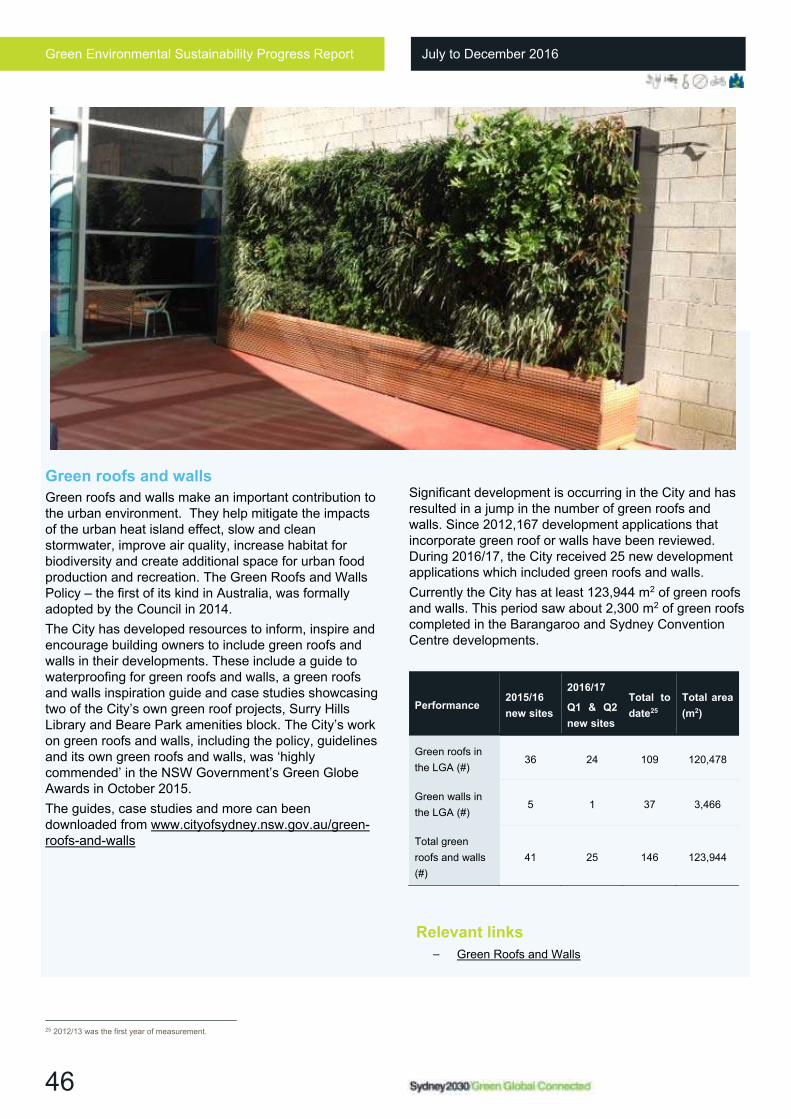
Green Environmental Sustainability Progress Report July to December 2016
46
Green roofs and walls
Green roofs and walls make an important contribution to the urban environment. They help mitigate the impacts of the urban heat island effect, slow and clean stormwater, improve air quality, increase habitat for biodiversity and create additional space for urban food production and recreation. The Green Roofs and Walls Policy – the first of its kind in Australia, was formally adopted by the Council in 2014.
The City has developed resources to inform, inspire and encourage building owners to include green roofs and walls in their developments. These include a guide to waterproofing for green roofs and walls, a green roofs and walls inspiration guide and case studies showcasing two of the City’s own green roof projects, Surry Hills Library and Beare Park amenities block. The City’s work on green roofs and walls, including the policy, guidelines and its own green roofs and walls, was ‘highly commended’ in the NSW Government’s Green Globe Awards in October 2015.
The guides, case studies and more can been downloaded from www.cityofsydney.nsw.gov.au/green-roofs-and-walls
25 2012/13 was the first year of measurement.
Significant development is occurring in the City and has resulted in a jump in the number of green roofs and walls. Since 2012,167 development applications that incorporate green roof or walls have been reviewed. During 2016/17, the City received 25 new development applications which included green roofs and walls.
Currently the City has at least 123,944 m2 of green roofs and walls. This period saw about 2,300 m2 of green roofs completed in the Barangaroo and Sydney Convention Centre developments.
Performance 2015/16
new sites
2016/17
Q1 & Q2
new sites
Total to
date25
Total area
(m2)
Green roofs in
the LGA (#) 36 24 109 120,478
Green walls in
the LGA (#) 5 1 37 3,466
Total green
roofs and walls
(#)
41 25 146 123,944
Relevant links
– Green Roofs and Walls
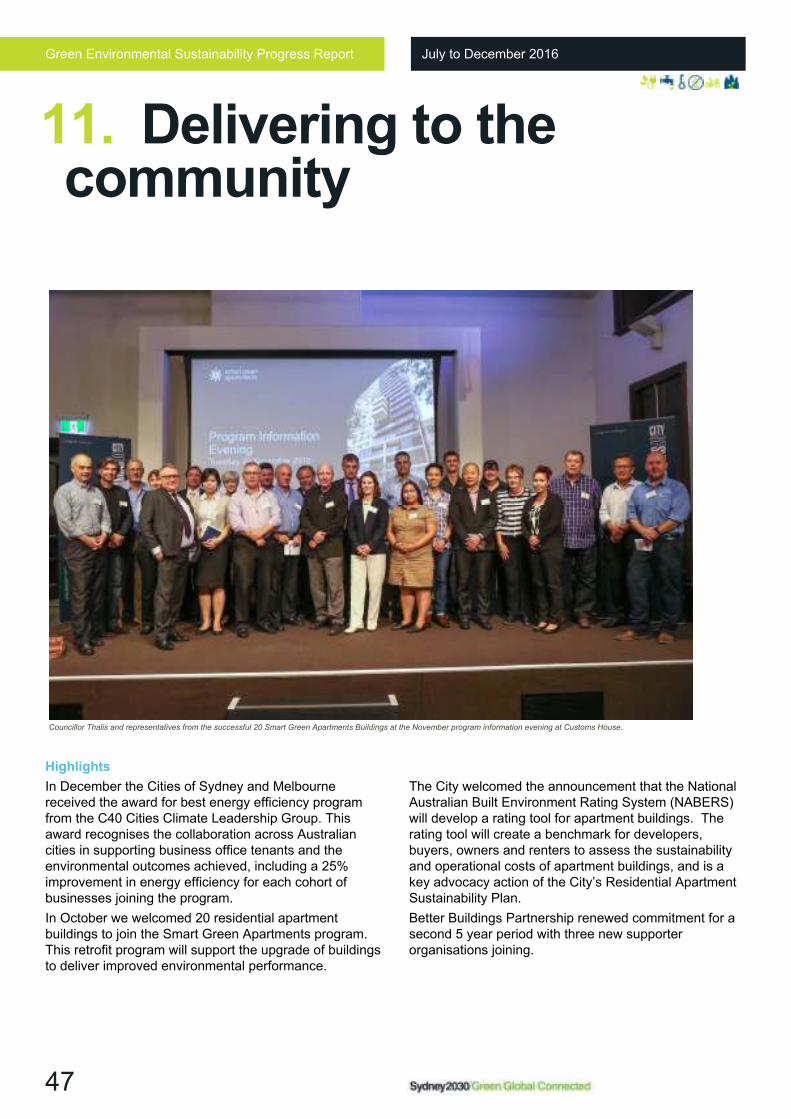
Green Environmental Sustainability Progress Report July to December 2016
47
Highlights
In December the Cities of Sydney and Melbourne received the award for best energy efficiency program from the C40 Cities Climate Leadership Group. This award recognises the collaboration across Australian cities in supporting business office tenants and the environmental outcomes achieved, including a 25% improvement in energy efficiency for each cohort of businesses joining the program.
In October we welcomed 20 residential apartment buildings to join the Smart Green Apartments program. This retrofit program will support the upgrade of buildings to deliver improved environmental performance.
The City welcomed the announcement that the National Australian Built Environment Rating System (NABERS) will develop a rating tool for apartment buildings. The rating tool will create a benchmark for developers, buyers, owners and renters to assess the sustainability and operational costs of apartment buildings, and is a key advocacy action of the City’s Residential Apartment Sustainability Plan.
Better Buildings Partnership renewed commitment for a second 5 year period with three new supporter organisations joining.
11. Delivering to the community
Councillor Thalis and representatives from the successful 20 Smart Green Apartments Buildings at the November program information evening at Customs House.
Green Environmental Sustainability Progress Report July to December 2016
48
BUSINESS SECTOR - PROGRAM UPDATE
Smart Green Business Program
During Quarters 1 & 2, the Smart Green Business (SGB)
Program recruited 43 large businesses across the
accommodation, entertainment and conference venue sectors,
of which 30 have so far implemented identified water efficiency
and/or waste recommendations. The average operating cost
savings made by these 30 businesses is $12,000 per year.
The program also engaged 9 businesses through the City’s
Health and Building Officers who have been providing
sustainability advice during food business inspections. Out of
the businesses engaged, 5 implemented water
recommendations and achieved an average cost savings of
$1,900 per year.
Smart Green Business
Program
Q1
2016/17
Q2
2016/17
Year to
date
Program
to date26
Businesses Recruited 25 18 43 314
Businesses Implementing 11 19 30 282
Potable water savings
implemented
(ML per year)
25 63 88 914
Waste diverted from landfill
(Tonnes per year)
513 701 1,214 8,415
Energy savings implemented
(MwH per year)
243 190 433 6,904
Greenhouse gas emissions
saved
(tCO2-e per year)
661 915 1,576 12,392
Relevant links
– Smart Green Business
26 Program commenced in 2013/2014
BUSINESS SECTOR - PROGRAM UPDATE
Better Buildings Partnership
In December 2016 the City announced that the members of the
Better Buildings Partnership had collectively reduced their
annual carbon emissions by 47 per cent in the year ending 30
June 2016 and as a result enjoyed a $32 million saving from
avoided electricity costs (from their 2006 baseline year).
Over the last 6 months the Partnership released a new best
practice guideline for refurbishing commercial office tenancies
with a target of 60 per cent recovery of materials; developed a
National Construction Code energy efficiency provisions
compliance checklist which will assist building owners and
developers to ensure compliance with the energy efficiency
provisions in new build and major upgrades; and launched a
new leasing standard which sets a minimum definition of green
leasing as a way for tenant and landlords to collaborate for
better sustainability and performance outcomes.
The Partnership has been extended with all members
committed to fund and contribute until June 2021. Three new
supporter organisations have joined the partnership for this
second phase. Paul Wall, national sustainability manager for
DEXUS, has been appointed as the new Leadership Panel
Chair.
Relevant links
– Better Buildings Partnership
27 Average NABERS ratings reported from December 2016 figures.
Performance Q1
2016/17
Q2
2016/17
Year to
date
Program
to date
Commercial office
building floor space
participating in
Sydney CBD (per
cent)
- - 49 49
Members –
Partners (#)
Associate (#)
Supporting (#)
+1
same
+2
same
same
same
15
5
5
15
5
5
NABERS energy
rating (stars)27 - - 4.5 4.5
ST. VINCENT’S HOSPITAL PRECINCT
St Vincent’s hospital, implemented all water
recommendations identified through a SGB audit. Resulting
in yearly savings of 27 mega litres of potable water and 35
tonnes of greenhouse gas emissions from reduced hot
water consumption. They now enjoy reduced operating
costs estimated to be $106,900 per annum.
Green Environmental Sustainability Progress Report July to December 2016
49
BUSINESS SECTOR - PROGRAM UPDATE
CitySwitch Green Office
NATIONAL
In July 2016 the CitySwitch national program launched the Clean
Up Your Energy campaign. The campaign focused on renewable
energy and included a suite of resources; a decision-tree
infographic; a renewable energy e-Book produced with media
partner the Fifth Estate; and factsheets on on-site green power,
off-site green power and carbon offsets. A webinar was held on
the19th of July, which was attended by 70 participants.
Waste resources, including a waste audit assessment and
report, tenancy waste guide and signage were also released and
rolled out nationwide through this period.
In November the program celebrated leading signatories through
a national awards ceremony in Sydney. The National Signatory
of the Year was won by Frasers Property Australia for a range of
projects demonstrating their strong commitment to energy
efficiency, staff health and well-being and indoor environment
quality within their tenancy. National New Signatory of the Year
was awarded to KPMG for transforming their Melbourne tenancy
with a range of energy efficiency initiatives saving over 600,000
kilowatt hours per year. The Partnership of the Year National
Award went to South Australian signatories WAX design and
dsquared Consulting who collaborated on the installation of 5kW
of solar panels on the warehouse office space they rent.
For the year ending November 2016 the national program
evidenced a reduction of 58,000 tonnes of carbon emissions
through energy efficiency improvements, a further 324,000
tonnes of carbon emissions were abated through offset
purchases. 1,500 projects were undertaken by members.
In December the Cities of Sydney and Melbourne won the
prestigious C40 International Award for Building Energy
Efficiency in recognition of the CitySwitch national program’s
contribution to improving performance within the commercial
office sector.
Performance Q1
2016/17
Q2
2016/17
Year to
date
Program
to date
Signatories (#) 4 -4 0 576
Tenancies (#) 24 14 38 801
Office floor Space - NLA
(m2)
60,008 290,52
4
350,532 3,439,30
4
Percentage of all
Australian office space28
13 14 14 14
Average NABERS
Energy energy rating
(stars)
4.1 4.4 4.4 4.4
Relevant links
– CitySwitch Green Office
28 Based on 25.1 million NLA m2 total per Property Council of Australia, Office Market Report 2016
BUSINESS SECTOR - PROGRAM UPDATE
CitySwitch Green Office
SYDNEY
The annual signatory awards event was held in Sydney in
November. At these State awards, Norman Disney & Young
and Westpac received the NSW partnership award for a large
scale refurbishment of their iconic St George C-grade facility.
Marlin Communications won the NSW new signatory award
for their commitment to leadership and ongoing efforts to
improve the performance of their tenancy. Architectus
received the NSW under 2000 square metre signatory of the
year award for their impressive studio fit-out in the iconic MLC
centre. The State Library of NSW was awarded the over 2000
square metres signatory of the year award for their large
scale lighting upgrade and 6 Star NABERS rating
achievement.
In the past 6 months, the City supported 12 Sydney
signatories in their use of the new CitySwitch waste tool to
measure their office waste generation and recycling and set a
baseline. These signatory businesses went on to develop a
waste action plan that seeks to reduce their impact.
In the period 3 events were held; a webinar on renewable
energy options for business, a networking event in
partnership with City of Willoughby and North Sydney, and
the CitySwitch State and National awards ceremony.
Performance Q1
2016/17
Q2
2016/17
Year to
date
Program
to date
Signatories (#) -2 -2 -4 114
Tenancies (#) -1 0 -1 133
Office floor space (NLA -m2)
0 -9,629 -9,629 1,035,638
Office floor space as proportion of Sydney (per cent)29
20.9 20.3 20.3 20.3
Average NABERS energy rating (stars)
- 4.6 4.6 4.6
29 Based on 5.1 million NLA m2 total per Property Council of Australia, Office Market Report 2016
CitySwitch signatories attend the Clean Up Your Energy renewables evening.
Green Environmental Sustainability Progress Report July to December 2016
50
BUSINESS SECTOR - PROGRAM UPDATE
Environmental Upgrade Finance
The City’s environmental upgrade finance scheme is part of the
NSW Government’s Environmental Upgrade Agreements (EUA)
mechanism, which allows councils to enter into agreements with
property owners and finance providers to fund works to improve
the energy, water or environmental efficiency of their building.
Environmental upgrade finance allows the cost of an upgrade to
be shared with the tenant, such that tenants can enjoy the
benefits of an environmental upgrade in the short-term and
operating cost savings in the long-term.
During the period Council adopted a revised Environmental
Upgrade Agreements Policy. This policy specifies the
circumstances under which the City will enter into and administer
an Environmental Upgrade Agreement.
The policy also provides for the management of risks to the City
and third parties that have not been addressed in the standard
template contract.
The policy update follows changes to the EUA financing
mechanism by the NSW Office of Environment and Heritage that
aim to streamline the service. The City consulted with key
stakeholders on the template and policy changes.
During the period 390 visits were made to the service web
pages.
Performance Q1
2016/17
Q2
2016/17
Program
to date
EUA applications received (#) 0 0 7
EUAs signed (#) 0 0 4
Total funds advanced for all
signed EUAs ($M)
0 0 30.4
Estimated emission reductions
from signed EUAs (tonnes p.a.)
9,469
Relevant links
– Environmental Upgrade Finance
COMMUNITY & BUSINESS - PROGRAM UPDATE
Environmental Grants
Environmental initiatives are supported by a number of grants
and sponsorships from the City of Sydney. The three grant
programs facilitate action and help catalyse the solutions that
will be required to deliver Sustainable Sydney 2030. The grants
approved by Council for Quarter 1 and 2 2016/17 were:
Environmental Performance - Innovation: funding is
available for feasibility and demonstration projects which seek
to prove the feasibility of new technologies and processes that
are currently not implemented in the local market, but that have
the potential to achieve greenhouse gas emission reductions
and resource efficiencies at scale;
– Closed Loop Environmental Solutions Pty Ltd: Coffee Cup
Recycling Pilot Project
– Share My Solar Pty Ltd: SolarCloud ATPI
– University of Technology Sydney, Institute for Sustainable Futures:
The Algae Prototype Panel Project
– University Of Technology Sydney, Institute for Sustainable Futures:
Developing Best Practice for End of Trip Facilities in CBD Office
Buildings
– CIM Operations Pty Ltd: Advanced Data Analysis in the Built
Environment
Environmental Performance - Building Operations: in which
funding is available to help lower the costs of implementing
building operation efficiency measures, such as water
monitoring to track water consumption and quickly identify and
address costly leaks or equipment failures;
– Strata Plan 76829: Water monitoring (Surry Hills)
– Strata Plan 54036: Water monitoring (Haymarket)
– Deposited Plan 1067958: Water Monitoring (Ultimo)
– AFIAA Australia 1 Pty Ltd: Water sub-metering (Pyrmont)
– Strata Plan 54229: Water monitoring (Pyrmont)
Environmental Performance - Ratings and Assessments: in
which funding is available to undertake building performance
ratings and assessments to enable a building or facility owner
understand and implement opportunities to improve
environmental performance;
– Strata Plan 57394: Water and Energy Assessment (Pyrmont)
– Strata Plan 76829: Energy Assessment (Surry Hills)
– Strata Plan 77684: Energy Assessment (Glebe)
– Strata Plan 53188: Water and Energy Assessment (Pyrmont)
– Strata Plan 61131: Energy and Water Assessment (Pyrmont)
– Adfa Jamison Pty Ltd: NABERS energy rating (Sydney City)
– Strata Plan 64622: Energy Assessment (Rushcutters Bay)
– Strata Plan 68171: Energy Assessment (Camperdown)
– Strata Plan 78602: Energy Assessment (Woolloomooloo)
Knowledge Exchange
– The Property Council of Australia Ltd: Green Cities 2017
The City’s Environmental Performance Grants has supported
20 projects in the first half of 2016/17.
Relevant links
– Environmental Grants
FUNDING POWERS STUDENT HOUSING Stucco, an affordable student housing complex in Newtown, received funding to demonstrate a financially viable solar project that incorporates battery storage and smart metering in a multi-unit residential building. Believed to be the first of its kind in Australia, this project pioneers a technological, financial and legal example for multi-metered properties. The 30 kilo-watt system combined with 43 kilo-watt hour usable storage will provide approximately 80% Stucco’s energy needs and save an estimated 35 tonnes of carbon emissions per annum. Furthermore, this project has led to the development of a Cooperative Power Purchasing Agreement which has been published online as an open-sourced legal document.
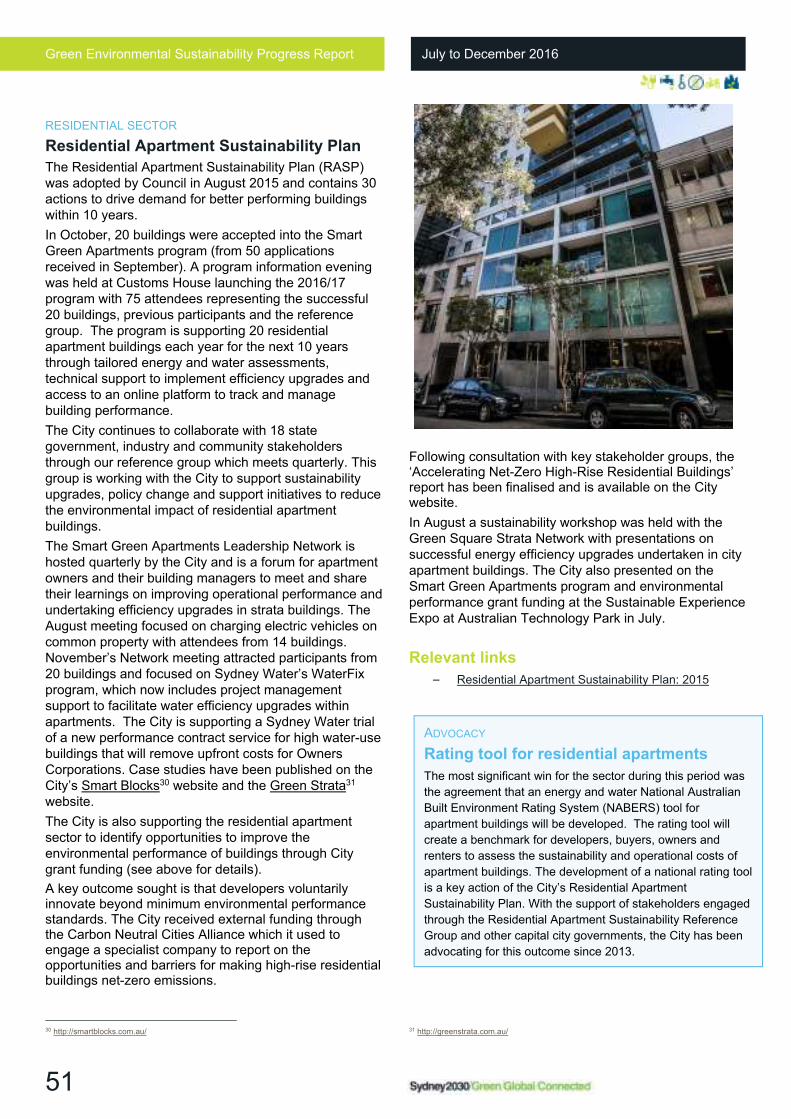
Green Environmental Sustainability Progress Report July to December 2016
51
RESIDENTIAL SECTOR
Residential Apartment Sustainability Plan
The Residential Apartment Sustainability Plan (RASP) was adopted by Council in August 2015 and contains 30 actions to drive demand for better performing buildings within 10 years.
In October, 20 buildings were accepted into the Smart Green Apartments program (from 50 applications received in September). A program information evening was held at Customs House launching the 2016/17 program with 75 attendees representing the successful 20 buildings, previous participants and the reference group. The program is supporting 20 residential apartment buildings each year for the next 10 years through tailored energy and water assessments, technical support to implement efficiency upgrades and access to an online platform to track and manage building performance.
The City continues to collaborate with 18 state government, industry and community stakeholders through our reference group which meets quarterly. This group is working with the City to support sustainability upgrades, policy change and support initiatives to reduce the environmental impact of residential apartment buildings.
The Smart Green Apartments Leadership Network is hosted quarterly by the City and is a forum for apartment owners and their building managers to meet and share their learnings on improving operational performance and undertaking efficiency upgrades in strata buildings. The August meeting focused on charging electric vehicles on common property with attendees from 14 buildings. November’s Network meeting attracted participants from 20 buildings and focused on Sydney Water’s WaterFix program, which now includes project management support to facilitate water efficiency upgrades within apartments. The City is supporting a Sydney Water trial of a new performance contract service for high water-use buildings that will remove upfront costs for Owners Corporations. Case studies have been published on the City’s Smart Blocks30 website and the Green Strata31 website.
The City is also supporting the residential apartment sector to identify opportunities to improve the environmental performance of buildings through City grant funding (see above for details).
A key outcome sought is that developers voluntarily innovate beyond minimum environmental performance standards. The City received external funding through the Carbon Neutral Cities Alliance which it used to engage a specialist company to report on the opportunities and barriers for making high-rise residential buildings net-zero emissions.
30 http://smartblocks.com.au/
Following consultation with key stakeholder groups, the ‘Accelerating Net-Zero High-Rise Residential Buildings’ report has been finalised and is available on the City website.
In August a sustainability workshop was held with the Green Square Strata Network with presentations on successful energy efficiency upgrades undertaken in city apartment buildings. The City also presented on the Smart Green Apartments program and environmental performance grant funding at the Sustainable Experience Expo at Australian Technology Park in July.
Relevant links
– Residential Apartment Sustainability Plan: 2015
31 http://greenstrata.com.au/
ADVOCACY
Rating tool for residential apartments
The most significant win for the sector during this period was
the agreement that an energy and water National Australian
Built Environment Rating System (NABERS) tool for
apartment buildings will be developed. The rating tool will
create a benchmark for developers, buyers, owners and
renters to assess the sustainability and operational costs of
apartment buildings. The development of a national rating tool
is a key action of the City’s Residential Apartment
Sustainability Plan. With the support of stakeholders engaged
through the Residential Apartment Sustainability Reference
Group and other capital city governments, the City has been
advocating for this outcome since 2013.
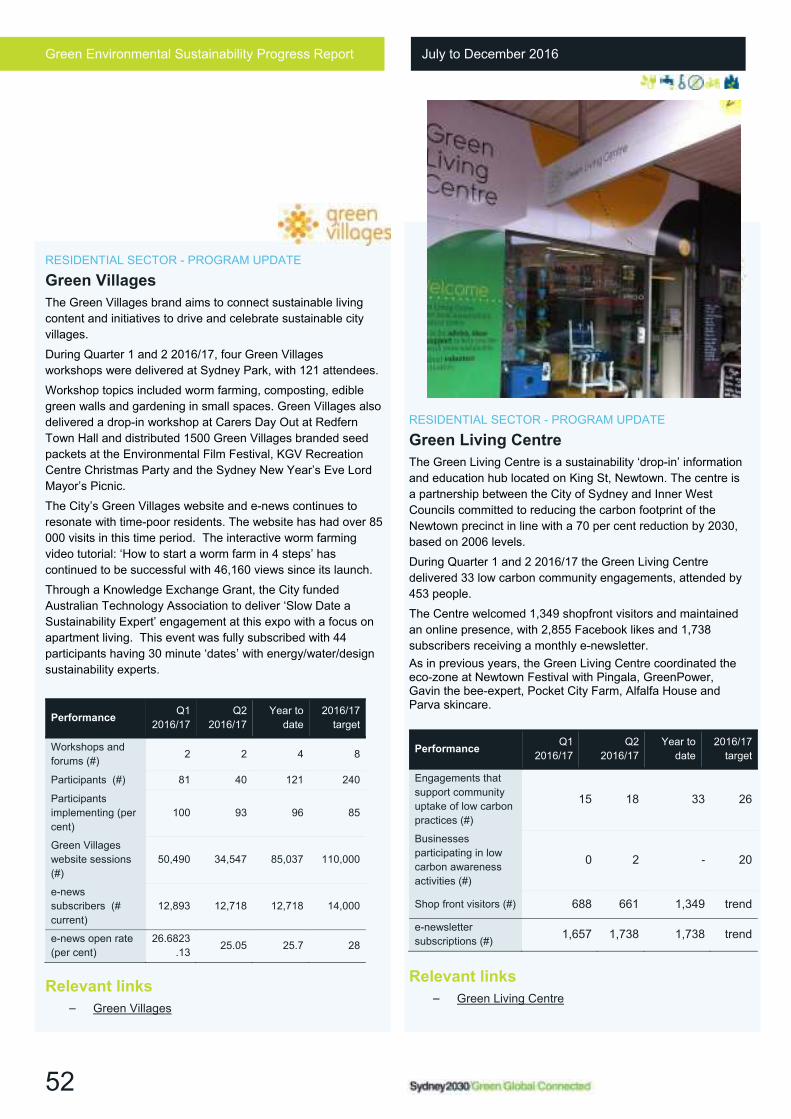
Green Environmental Sustainability Progress Report July to December 2016
52
RESIDENTIAL SECTOR - PROGRAM UPDATE
Green Villages
The Green Villages brand aims to connect sustainable living
content and initiatives to drive and celebrate sustainable city
villages.
During Quarter 1 and 2 2016/17, four Green Villages
workshops were delivered at Sydney Park, with 121 attendees.
Workshop topics included worm farming, composting, edible
green walls and gardening in small spaces. Green Villages also
delivered a drop-in workshop at Carers Day Out at Redfern
Town Hall and distributed 1500 Green Villages branded seed
packets at the Environmental Film Festival, KGV Recreation
Centre Christmas Party and the Sydney New Year’s Eve Lord
Mayor’s Picnic.
The City’s Green Villages website and e-news continues to
resonate with time-poor residents. The website has had over 85
000 visits in this time period. The interactive worm farming
video tutorial: ‘How to start a worm farm in 4 steps’ has
continued to be successful with 46,160 views since its launch.
Through a Knowledge Exchange Grant, the City funded
Australian Technology Association to deliver ‘Slow Date a
Sustainability Expert’ engagement at this expo with a focus on
apartment living. This event was fully subscribed with 44
participants having 30 minute ‘dates’ with energy/water/design
sustainability experts.
Performance Q1
2016/17
Q2
2016/17
Year to
date
2016/17
target
Workshops and
forums (#) 2 2 4 8
Participants (#) 81 40 121 240
Participants
implementing (per
cent)
100 93 96 85
Green Villages
website sessions
(#)
50,490 34,547 85,037 110,000
e-news
subscribers (#
current)
12,893 12,718 12,718 14,000
e-news open rate
(per cent)
26.6823
.13 25.05 25.7 28
Relevant links
– Green Villages
RESIDENTIAL SECTOR - PROGRAM UPDATE
Green Living Centre
The Green Living Centre is a sustainability ‘drop-in’ information
and education hub located on King St, Newtown. The centre is
a partnership between the City of Sydney and Inner West
Councils committed to reducing the carbon footprint of the
Newtown precinct in line with a 70 per cent reduction by 2030,
based on 2006 levels.
During Quarter 1 and 2 2016/17 the Green Living Centre
delivered 33 low carbon community engagements, attended by
453 people.
The Centre welcomed 1,349 shopfront visitors and maintained
an online presence, with 2,855 Facebook likes and 1,738
subscribers receiving a monthly e-newsletter.
As in previous years, the Green Living Centre coordinated the eco-zone at Newtown Festival with Pingala, GreenPower, Gavin the bee-expert, Pocket City Farm, Alfalfa House and Parva skincare.
Performance Q1
2016/17
Q2
2016/17
Year to
date
2016/17
target
Engagements that
support community
uptake of low carbon
practices (#)
15 18 33 26
Businesses
participating in low
carbon awareness
activities (#)
0 2 - 20
Shop front visitors (#) 688 661 1,349 trend
e-newsletter
subscriptions (#) 1,657 1,738 1,738 trend
Relevant links
– Green Living Centre
Green Environmental Sustainability Progress Report July to December 2016
53
Active transport: Involves any physical activity that
gets you from one place to another, such as walking
and cycling.
Annual Carbon Inventory: Internal database developed by the Sustainability Unit summarising annual greenhouse gas emissions from all City of Sydney assets and activities (buildings, street lighting, parks & other) resulting from consumption of electricity, gas and fuel and other sources.
Arterial transport: A high-capacity urban road or route.
BASIX or Building Sustainability Index: A
NSW government index, to rate energy and water
efficiency performance of residential buildings,
that aims to reduce water consumption and
greenhouse gas emissions by 40 per cent
compared to pre-BASIX (2004) buildings.
Biodiversity: Biological diversity including species
richness, ecosystem complexity and genetic variation.
Business-as-usual: A projection (e.g.
greenhouse gas emission levels) based on the
assumption that all existing policy measures
remain in place with no new measures
introduced.
Canopy cover: The proportion of land area
occupied by the tree’s crown or canopy, or
combined canopies, when visualised from directly
above. It is often expressed as a percentage or the
total area covered.
Carbon intensity: Electricity that has a high
emissions concentration, or energy intensity, for
example coal-fired electricity has a high emissions
concentration, or carbon intensity.
Carbon neutral or net zero emissions: Balancing
the amount of carbon released with an equivalent
amount offset by purchasing carbon credits to make
up the difference.
COP21: The 2015 United Nations Climate Change Conference held in Paris, December 2015 that negotiated the Paris Agreement - a global agreement on the reduction limiting global warming to less than 2˚C compared to pre-industrial levels and to drive efforts to limit the temperature increase even further to 1.5˚C.
C40 Cities: is a network of the world’s megacities committed to addressing climate change.
Dual plumbing: A plumbing system with two
separate pipes supplying potable and reclaimed
water to a building or precinct.
Ecosystem: Animals, plants and microorganisms
that live in one place, as well as the environmental
conditions that support them.
Energy efficiency: Using less energy to achieve
the same output.
Energy storage: The capture of energy
produced at one time for use at a later time.
Environmental Action 2016 – 2021 Strategy and Action Plan (draft): The strategy and action plan combines the insights and data from environmental master plans and strategies that the City developed between 2008 and 2015. The plan outlines our progress to date, and approach to achieving our bold Sustainable Sydney 2030 targets.
Environmental Management System (EMS): is a
structured system designed to help manage
environmental impacts and improve the
environmental performance of the City’s operations.
Environmental Upgrade Agreements: A NSW
government finance mechanism for building owners
to access finance for upgrade works of existing
buildings that result in energy, water and other
environmental savings.
Greenhouse gas emissions: Gases that trap
heat in the atmosphere. Greenhouse gases from
human activities are the most significant driver of
observed climate change since the mid-20th
century.
Locally indigenous: A native plant that is limited
to a particular geographic area and often confined
to a specific habitat.
Low-carbon energy: Electricity produced with lower
amounts of carbon dioxide emissions than
conventional fossil fuel power generation, such as
wind, solar and hydro power.
Mitigate: Taking action to reduce impact on the
environment, as well as contributions to climate
change (in this context).
National Australian Built Environment Rating
System or NABERS: An Australian government
initiative that measures and rates the environmental
performance of Australian buildings and tenancies.
12. Glossary
Green Environmental Sustainability Progress Report July to December 2016
54
National Greenhouse Accounts (NGA) Factors: Published by the Department of Climate Change "The National Greenhouse Accounts (NGA) Factors” has been prepared by the Australian Government and is designed for use by companies and individuals to estimate greenhouse gas emissions for reporting under various government programs and for their own purpose.
Net zero emissions: Balancing the amount of
carbon released with an equivalent amount offset.
Usually offsets are through purchasing carbon
credits to make up the difference. The best
practice approach is to reduce, or avoid, carbon
emissions first, then offset any unavoidable
emissions.
Non-potable water: Water that is not of a quality for
drinking and cooking purposes, used for purposes
such as laundry, gardening, car washing and cooling
towers.
Non-potable water: Water that is not of drinking
water quality. Uses include laundry, gardening, car
washing, cooling towers, and so on. Recycled water
is for non-potable use.
Paris Pledge for Action: At COP21 in Paris
(December 2015), a group of global cities, regions,
companies and investors committed achieve climate
stability, limiting global temperature rise to less than
2˚C.
Performance Planning: Performance Planning (PP) is a TechnologyOne product that stores measures, projects and targets. Data can be imported or manually entered depending on the source. Managers are responsible for ensuring accuracy of the data. PP also contains Corporate Plan KPI's and projects.
Potable water: Treated water that is safe
enough for consumption, use in kitchens and
bathrooms.
Potable water: Water that is of drinking water quality for use in bathrooms, kitchens and for consumption.
Raingardens: Gardens that allow rainwater runoff to
be absorbed, providing rainwater for plants and
improving water quality in waterways by up to 30 per
cent.
Recycled water: Former wastewater (sewage) is
treated to remove solids and impurities and used for
non-potable water needs, rather than discharged into
waterways.
Renewable energy: Energy from resources
which are naturally replenished on a human
timescale, such as sunlight, wind, rain, tides,
waves, and geothermal heat.
Resilience: The capacity to survive, adapt and
grow no matter what kinds of chronic stresses and
acute shocks are experienced.
100 Resilient Cities: Pioneered by the Rockefeller
Foundation (100RC) is dedicated to helping cities
around the world become more resilient to the
physical, social and economic challenges that are a
growing part of the 21st century.
Scope 1 GREENHOUSE GAS emissions: Emissions directly occurring "from sources that are owned or controlled by the institution, including: on-campus stationary combustion of fossil fuels; mobile combustion of fossil fuels by institution owned/controlled vehicles; and "fugitive" emissions. Fugitive emissions result from intentional or unintentional releases of greenhouse gases, including the leakage of hydro fluorocarbons from refrigeration and air conditioning equipment".
Scope 2 GREENHOUSE GAS emissions: Indirect emissions generated in the production of electricity consumed by the institution. Scope 2 emissions physically occur at the facility where electricity is generated.
Scope 3 GREENHOUSE GAS emissions: All the other indirect emissions that are "a consequence of the activities of the institution, but occur from sources not owned or controlled by the institution" such as commuting, air travel for university activities, waste disposal; embodied emissions from extraction, production, and transportation of purchased goods; outsourced activities; contractor owned- vehicles; and line loss from electricity transmission and distribution".
Sea level rise: Long-term increases in the mean sea
level due to global warming.
Sustainability Management and Reporting Tool
(SMART): SMART is a new utilities management system that will manage and record energy and water usage by directly extracting consumption data from relevant authorities.
STEvE (System for Tracking Everything
Environmental): STEvE (the System for Tracking
EVerything Environmental) is a Utilities Information Monitoring System.
Stormwater harvesting: Water from intense rainfall
events (stormwater) is captured, cleaned and
typically re-used for non-potable purposes.
Green Environmental Sustainability Progress Report July to December 2016
55
Sustainable Sydney 2030: City of Sydney publication that sets the 2030 vision for the city aligned to the strategic priorities of Green, Global & Connected. Sets the direction, defines at the road map and articulates the step changes required to achieving a more sustainable future.
Swales: Low, moist or marshy land, naturally
landscaped feature or a human-created one, that
manages water runoff, filters pollutants and
increases rainwater permeation.
The best practice approach is to reduce or avoid
carbon emissions first, then offset any unavoidable
emissions.
Trigeneration: A system providing cooling, power
and heating. Electricity is produced locally, the waste
heat is used to supply heating and hot water, and
converted into cooling via a heat-driven chiller system.
Urban heat island effect: Cities are often warmer
than rural areas because vegetation is replaced
with hard structures, such as pavements and
buildings, which absorb and release more heat than
the natural landscape.
Urban renewal areas: A program of land
redevelopment in areas of moderate to high density
urban land use.
Utility corridors: A passage built underground
or aboveground to carry utility lines such as
electricity, water and sewer pipes.
Water efficiency: Using less water to achieve
the same output.
Water sensitive urban design: A design
approach which integrates the urban water cycle
into urban design to reduce environmental
degradation and improve aesthetic appeal.
Wetlands: A land area saturated with water that
forms a distinct ecosystem of aquatic plants that
manage water runoff, filter pollutants and
increase rainwater permeation.
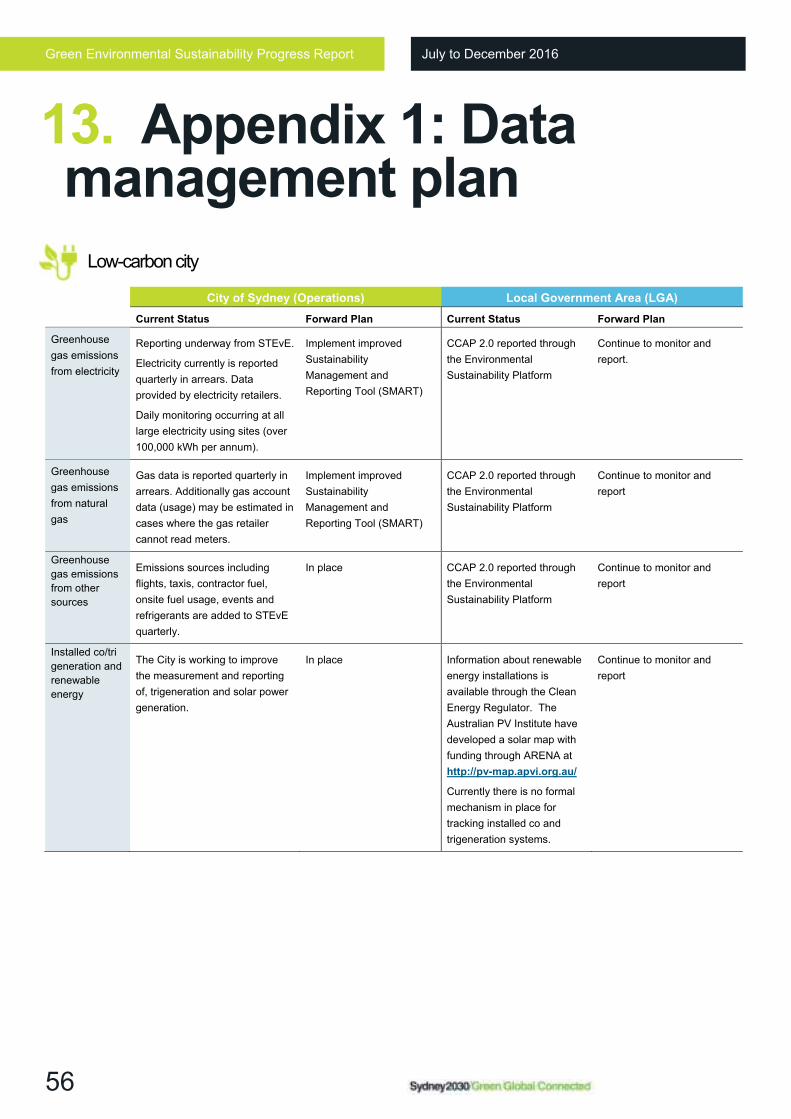
Green Environmental Sustainability Progress Report July to December 2016
56
Low-carbon city
City of Sydney (Operations) Local Government Area (LGA)
Current Status Forward Plan Current Status Forward Plan
Greenhouse
gas emissions
from electricity
Reporting underway from STEvE.
Electricity currently is reported
quarterly in arrears. Data
provided by electricity retailers.
Daily monitoring occurring at all
large electricity using sites (over
100,000 kWh per annum).
Implement improved
Sustainability
Management and
Reporting Tool (SMART)
CCAP 2.0 reported through
the Environmental
Sustainability Platform
Continue to monitor and
report.
Greenhouse
gas emissions
from natural
gas
Gas data is reported quarterly in
arrears. Additionally gas account
data (usage) may be estimated in
cases where the gas retailer
cannot read meters.
Implement improved
Sustainability
Management and
Reporting Tool (SMART)
CCAP 2.0 reported through
the Environmental
Sustainability Platform
Continue to monitor and
report
Greenhouse
gas emissions
from other
sources
Emissions sources including
flights, taxis, contractor fuel,
onsite fuel usage, events and
refrigerants are added to STEvE
quarterly.
In place CCAP 2.0 reported through
the Environmental
Sustainability Platform
Continue to monitor and
report
Installed co/tri
generation and
renewable
energy
The City is working to improve
the measurement and reporting
of, trigeneration and solar power
generation.
In place Information about renewable
energy installations is
available through the Clean
Energy Regulator. The
Australian PV Institute have
developed a solar map with
funding through ARENA at
http://pv-map.apvi.org.au/
Currently there is no formal
mechanism in place for
tracking installed co and
trigeneration systems.
Continue to monitor and
report
13. Appendix 1: Data management plan
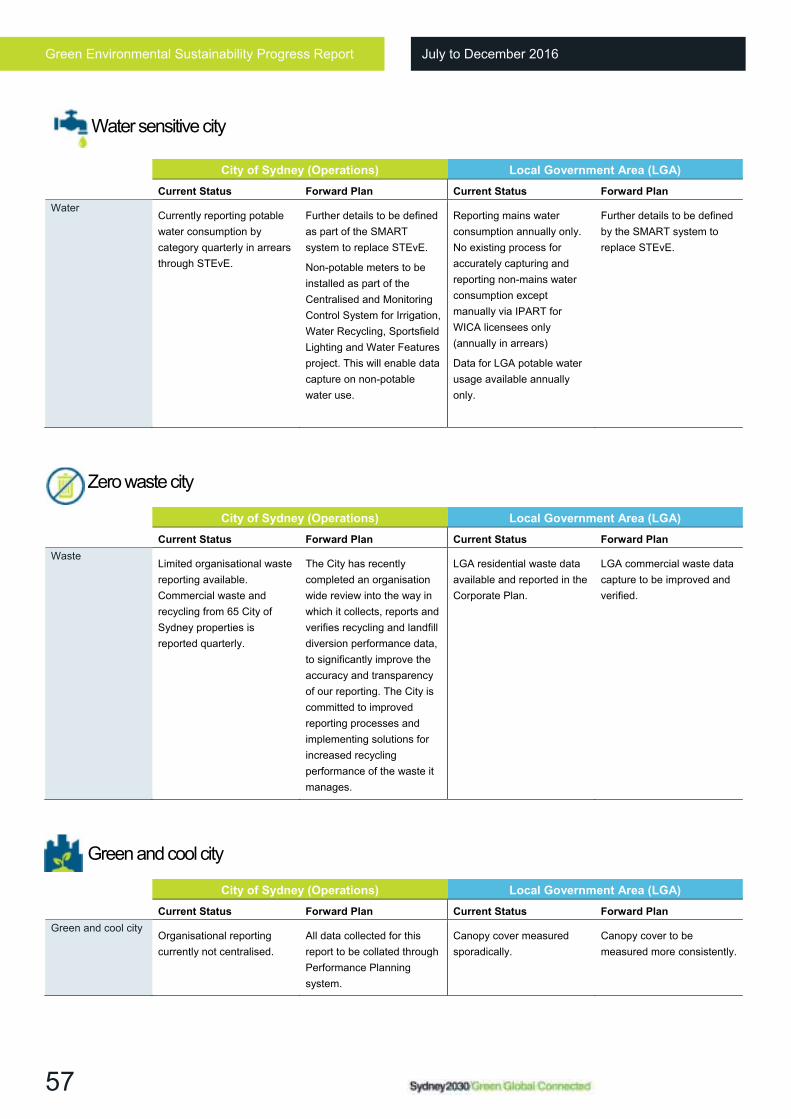
Green Environmental Sustainability Progress Report July to December 2016
57
Water sensitive city
Zero waste city
City of Sydney (Operations) Local Government Area (LGA)
Current Status Forward Plan Current Status Forward Plan
Waste Limited organisational waste
reporting available.
Commercial waste and
recycling from 65 City of
Sydney properties is
reported quarterly.
The City has recently
completed an organisation
wide review into the way in
which it collects, reports and
verifies recycling and landfill
diversion performance data,
to significantly improve the
accuracy and transparency
of our reporting. The City is
committed to improved
reporting processes and
implementing solutions for
increased recycling
performance of the waste it
manages.
LGA residential waste data
available and reported in the
Corporate Plan.
LGA commercial waste data
capture to be improved and
verified.
Green and cool city
City of Sydney (Operations) Local Government Area (LGA)
Current Status Forward Plan Current Status Forward Plan
Green and cool city Organisational reporting
currently not centralised.
All data collected for this
report to be collated through
Performance Planning
system.
Canopy cover measured
sporadically.
Canopy cover to be
measured more consistently.
City of Sydney (Operations) Local Government Area (LGA)
Current Status Forward Plan Current Status Forward Plan
Water Currently reporting potable
water consumption by
category quarterly in arrears
through STEvE.
Further details to be defined
as part of the SMART
system to replace STEvE.
Non-potable meters to be
installed as part of the
Centralised and Monitoring
Control System for Irrigation,
Water Recycling, Sportsfield
Lighting and Water Features
project. This will enable data
capture on non-potable
water use.
Reporting mains water
consumption annually only.
No existing process for
accurately capturing and
reporting non-mains water
consumption except
manually via IPART for
WICA licensees only
(annually in arrears)
Data for LGA potable water
usage available annually
only.
Further details to be defined
by the SMART system to
replace STEvE.
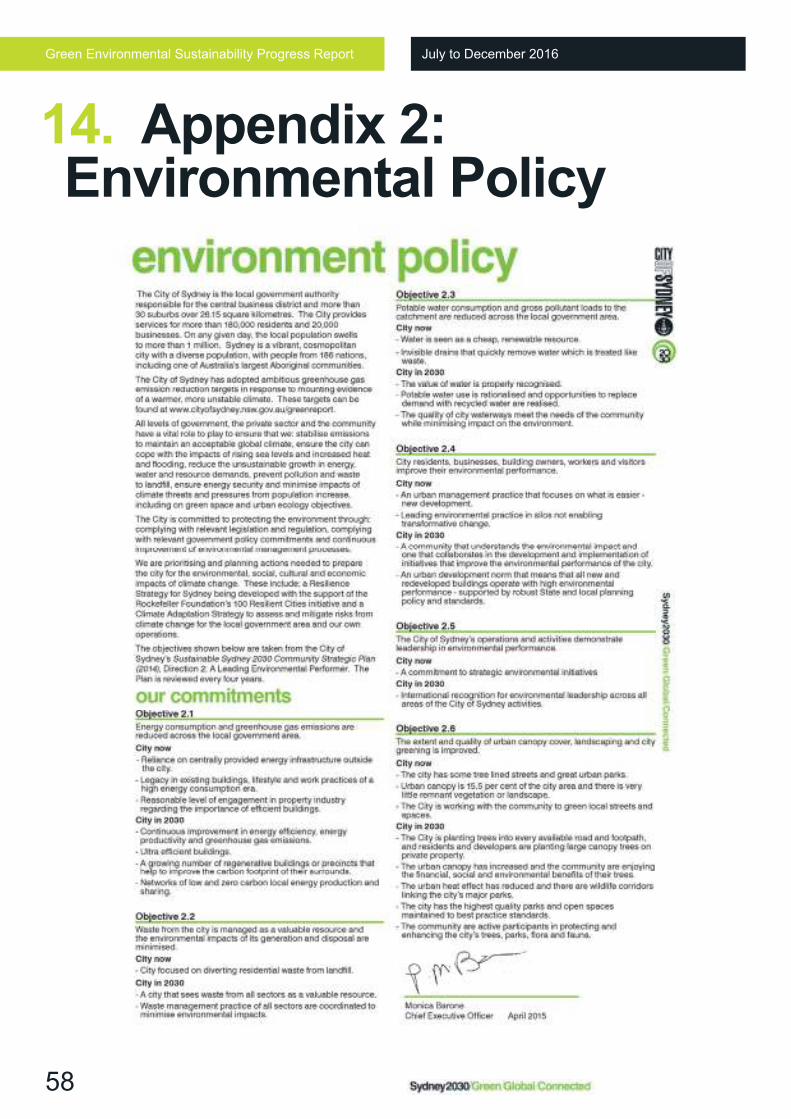
Green Environmental Sustainability Progress Report July to December 2016
58
14. Appendix 2: Environmental Policy
Green Environmental Sustainability Progress Report July to December 2016
59
This report is published biannually for January to June and July
to December by the City of Sydney at:
http://www.cityofsydney.nsw.gov.au/council/forms-and-
publications/environmental-plans-reports
Please direct any questions about this report to:
Mary Watt
Manager Environmental Projects
+61 2 92659713
LEGEND
CO2 Carbon dioxide
GWh Gigawatt hours
Kg Kilogram
kL Kilolitres
kWp Kilowatt peak
LED Light Emitting Diode
LGA Local Government Area
m2 Square meters
ML Megalitres
MWh Megawatt hour
MWe Megawatt equivalent
t Tonne
tCO2-e Tonnes of carbon dioxide equivalent