Embed Size (px)
Citation preview
Research ArticleGreen Data Gathering under Delay Differentiated ServicesConstraint for Internet of Things
Mingfeng Huang,1 Anfeng Liu ,1 TianWang,2 and Changqin Huang3
1School of Information Science and Engineering, Central South University, Changsha 410083, China2School of Computer Science, National Huaqiao University, Quanzhou 362000, China3School of Information Technology in Education, South China Normal University, Guangzhou 510631, China
Correspondence should be addressed to Anfeng Liu; [email protected]
Received 22 August 2017; Revised 4 December 2017; Accepted 19 December 2017; Published 26 February 2018
Academic Editor: Zhi Liu
Copyright © 2018 MingfengHuang et al.This is an open access article distributed under theCreativeCommonsAttributionLicense,which permits unrestricted use, distribution, and reproduction in any medium, provided the original work is properly cited.
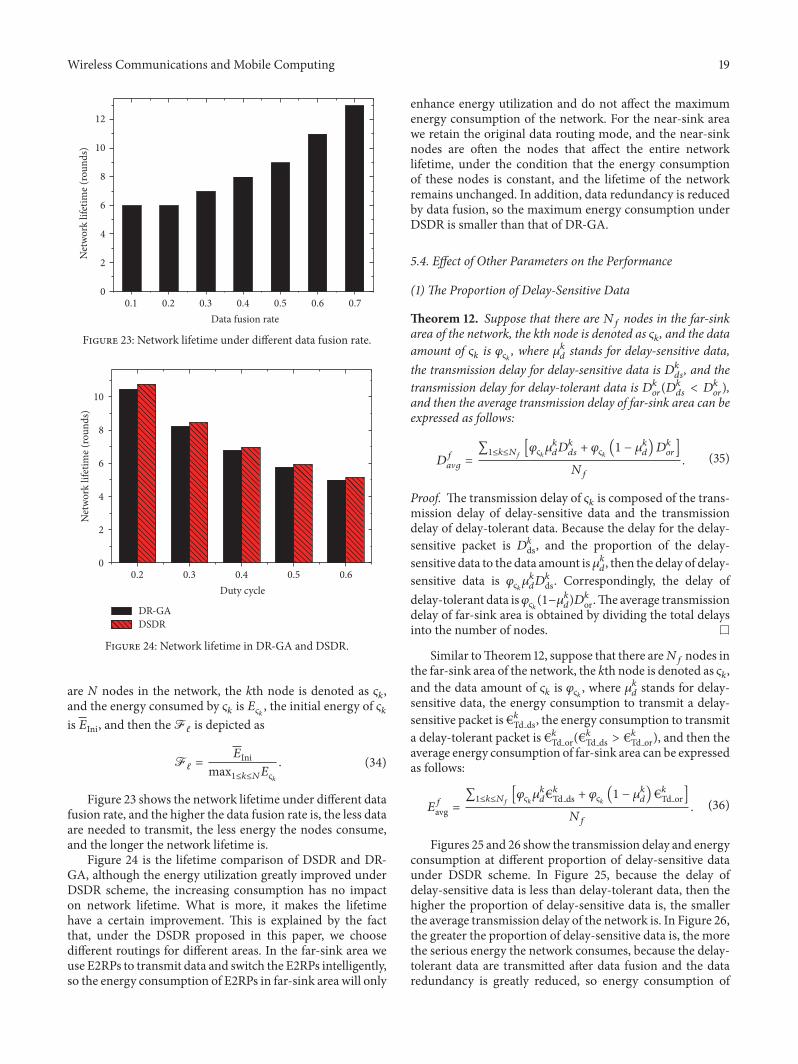
Energy-efficient data gathering techniques play a crucial role in promoting the development of smart portable devices as well assmart sensor devices based Internet of Things (IoT). For data gathering, different applications require different delay constraints;therefore, a delay Differentiated Services based Data Routing (DSDR) scheme is creatively proposed to improve the delaydifferentiated services constraint that is missed from previous data gathering studies.The DSDR scheme has three advantages: first,DSDR greatly reduces transmission delay by establishing energy-efficient routing paths (E2RPs). Multiple E2RPs are established indifferent locations of the network to forward data, and the duty cycles of nodes on E2RPs are increased to 1, so the data is forwardedby E2RPs without the existence of sleeping delay, which greatly reduces transmission latency. Secondly, DSDR intelligently choosestransmission method according to data urgency: the direct-forwarding strategy is adopted for delay-sensitive data to ensureminimum end-to-end delay, while wait-forwarding method is adopted for delay-tolerant data to perform data fusion for reducingenergy consumption. Finally, DSDR make full use of the residual energy and improve the effective energy utilization. The E2RPsare built in the region with adequate residual energy and they are periodically rotated to equalize the energy consumption ofthe network. A comprehensive performance analysis demonstrates that the DSDR scheme has obvious advantages in improvingnetwork performance compared to previous studies: it reduces transmission latency of delay-sensitive data by 44.31%, reducestransmission latency of delay-tolerant data by 25.65%, and improves network energy utilization by 30.61%, while also guaranteeingthe network lifetime is not lower than previous studies.
1. Introduction
Internet of Things (IoT) [1–3] and cloud computing [4–6]leverage the ubiquity of sensor-equipped devices (e.g., smartportable devices, smart sensor nodes) to collect informationat low cost and provide a new paradigm for solving thecomplex sensing applications from the significant demandsof critical infrastructure such as surveillance systems [7–10],remote patient care systems in healthcare [11, 12], intelligenttrafficmanagement [13], automated vehicles in transportationenvironmental [14], and weather monitoring systems. Datagathering is one of the important functions for such sensorbased networks, in which each smart sensor based device issensing information from the surrounding environment andsends data to the sink via multihop routing. After data have
been acquired, the sink can make decisions about perceivedevents, thus bringing smart life to people [8, 10, 11]. But, due tothe limited energy of sensor devices, how to ensure that datais gathered to the sink quickly as well as in an energy-efficientway is an important issue [15–17].
Although the smart sensor based devices (e.g., wirelesssensor nodes, smart phone, and tablets) have powerful com-puting and communication capabilities, the data producedare gettingmore andmore as the scope of application expandsand the variety increases, so the energy of the device isdrained out much faster than before. Green communicationsplay a critical role in or are expected to be an indispensablepart of the smart sensor based networks [1, 10, 13, 18]. Due tothe diversity and complexity of applications running over thenetworks, green communications under delay or quality of
HindawiWireless Communications and Mobile ComputingVolume 2018, Article ID 9715428, 23 pageshttps://doi.org/10.1155/2018/9715428
2 Wireless Communications and Mobile Computing
service guarantee in such networks gain increasing attentionin the research community [19, 20] and face a great challenge.
(1) The challenge of green communication: communi-cation consumption is the largest energy consump-tion in sensor based networks, so the key to greencommunications is to effectively reduce the energyconsumption in communication. Overall, the mainways to reduce energy consumption are as follows:
(a) Using asynchronous sleep/waking workingmode can effectively reduce the energyconsumption of nodes. In this mode, the sensornodes periodically rotate between sleeping andwaking states, and the ratio of the durationthat the nodes are in the waking state to theunit cycle is called the duty cycle [11, 21]. Ingeneral, the energy consumption of the nodein the sleeping state is 1/100–1/1000 of that inwaking state [8, 12, 21]; thus, in order to saveenergy, the node should be in sleeping stateas much as possible. However, the node cancommunicate only when it is in waking state,so the small duty cycle of node can reduce itsenergy consumption effectively, but when it hasdata to send, it needs to wait for the wakingup of the receiver to communicate. And thetime required from the preparation of data atthe sender to the waking up at the receiver iscalled sleeping delay. This means that to reducethe data transmission delay it is necessary toincrease the duty cycle, but at the same timeit will increase the energy consumption of thenode, so how to balance the delay and energyconsumption is a tricky problem.
(b) Another way to effectively reduce energy con-sumption is data fusion. Reference [22] pointsout that event information has relevance bothin time and in space, so data fusion can be usedto fuse multiple event information, thus greatlyreducing the amount of data and reducingenergy consumption. From the perspective ofreducing energy consumption, more data pack-ets should be fused so that the redundancy isminimized. Although a lot of routing strategiesfor data fusion have been proposed, most ofthem have not been applied to sensor networks.What ismore, applications often require that thedelay of the data’s arrival is less than a specifiedthreshold. For example, in a fire monitoringsystem, “alarm”message is required to be trans-mitted to the control center as soon as possible;otherwise it will cause significant losses. Thesame situation exists in the medical systems, thesensor node attached to the patient is generallyused to record the patient’s daily vital signs, but,in an emergency where the patient’s heart ratechanges dramatically, the “alarm” packet of thedata needs to be transmitted to the doctor in
time to take the appropriate first-aid measures[5, 12, 23].Obviously, in such cases, the strategiesproposed for maximizing data fusion are notable to ensure that the delay satisfies the require-ments. Therefore, it is another important issueto make the data fusion under the preconditionof guaranteeing the application delay and reducethe network energy consumption effectively.
(2) The delay or quality of service (QoS) guaranteesfor sensor networks: as an important part of infor-mation infrastructure, sensor based networks oftencollect data for a variety of applications. Differentapplications have different requirements for QoS,and even the same applications may have differentrequirements due to the different events [20, 22],where delay is the basic metrics in data gathering.Generally speaking, delay-sensitive data requires asmall delay to the sink, and delay-tolerant data cantolerate a certain delay. The best way to optimizenetwork performance is to use a differentiated ser-vice to distinguish different transmissions to meetapplication requirements. But, to the best of ourknowledge, there is no research that is able to providedifferentiated services in green communications.
In summary, how to combine the settings of duty cycleswith data fusion technologies and differentiated services toestablish efficient routings to ensure energy-efficient anddelay-guaranteed data gathering is of great significance andalso has broad application prospects. Thus, a delay Differ-entiated Services based Data Routing (DSDR) scheme iscreatively proposed, in which the energy consumption canbe reduced and delay can be guaranteed for applications.Thecontributions of the DSDR scheme are as follows.
(1) The DSDR scheme has high energy efficiency andreduces transmission delay greatly by establishing energy-efficient routing paths (E2RPs). First, multiple E2RPs areestablished in different locations of the network to forwarddata, and the duty cycles of nodes on E2RPs are increasedto 1, so the data is forwarded by E2RPs without the exis-tence of sleeping delay, which greatly reduces transmissionlatency. What is more, the E2RPs are built in the regionwith adequate residual energy, and the residual energy ofnodes on E2RPs is periodically measured, and once theremaining energy is below the threshold, the E2RP where thenode located is immediately removed. Therefore, the DSDRscheme enhances the energy utilization of network effectivelywithout affecting the network lifetime.
(2) The DSDR scheme adopts delay differentiated ser-vices, which makes the scheme have a better performanceunder the premise of guaranteeing the service quality. InDSDR, for delay-sensitive data, the direct-forwarding strat-egy is used to ensure the minimal end-to-end transmissiondelay, while, for delay-tolerant data, the wait-forwardingmethod and data fusion are adopted to reduce energyconsumption.
(3) The DSDR scheme has the capability of global eventdata fusion, which greatly reduces the data amount needed
Wireless Communications and Mobile Computing 3
to be transmitted and improves the energy efficiency of thenetwork. Firstly, E2RPs are naturally data fusion paths, whichcan greatly increase the probability of data fusion. Secondly,the data are all routed through E2RPs, making the data fusionunder DSDR scheme global and the largest possible, whichgreatly reduces data redundancy and energy consumption. Tothe best of our knowledge, the DSDR is the first more perfectcombination of data fusion, differentiated services, and dutycycle setting and integrates an efficient data gathering in anumber of performances far better than the previous studies.
(4) Through our extensive theoretical analysis, wedemonstrate that the DSDR scheme proposed in this paperhas better performances. It realizes synchronous optimiza-tion in latency and energy, reduces the transmission delayof delay-sensitive data by 44.31%, reduces the transmissiondelay of delay-tolerant data by 25.65%, and improves networkenergy utilization by 30.61%. Compared with the previousschemes,DSDRhas obvious advantages in delay optimizationand energy utilization.
The rest of this paper is organized as follows: in Section 2,a literature review related to this work is introduced. Thenthe system model and problem statement are described inSection 3. In Section 4, we proposed an efficient DSDRscheme. The performance analysis of the DSDR schemeis provided in Section 5. Finally, Section 6 presented theconclusion and future perspectives of our work.
2. Related Work
Different applications running on the same network platformmay have different requirements on the service of quality;the basic requirement is network delay [19, 21, 24, 25]. In thissection, we introduce some state-of-the-art researches fordelay differentiated service.
Considering the network delay simply, the duty cycleis the key to reduce delay [26–29]. In WSNs, the node isawake periodically; the longer the node in the waking state,the smaller its sleeping delay, and the smaller the networklatency. Based on this idea, the authors of [14] proposed adistributed duty cycle allocation algorithm. The algorithmuses the network residual energy to gradually increase theduty cycles of nodes in the far-sink region based on thedistance between the node and the sink and makes the delayof the network external nodes decrease. In [16], the authorsalso consider the adjustment of the node duty cycle. However,the adjustment under this study is based on the load of theentire network. This kind of duty cycle adjustment schemehas some innovation, but it increases the complexity of thenetwork system, especially when the network is large and theparameter configuration will be tricky.
In addition, since the data are transmitted to the sinkthroughmultihop relays, reducing the hops of relay can effec-tively reduce the end-to-end delay.The authors of [15] realizethis and propose a communication scheme called T-LOGF toselect the next hop based on the shortest distance.The schemeuses one-step-look-ahead data transmission principle, eachtime selects the node with the smallest distance from the sinkto forward data, so that the total relay hops can beminimized,
and reduces the delay, but the scheme ignores the waitingdelay caused by the sleep/waking mode.
In [30], the authors studied the issue of network latencyrequirements for differential services in content-centric net-working (CCN), while optimizing the content overall trans-mission performance. In this paper, in order to guaranteethe network delay, the authors first proposed a simple andcomprehensive network model; the network delay of routingcontent is characterized to different locations of the client.Ensure that each content provider has optimized contentand latency by combining network locations with contentpopularity. Then, the content distribution model is incorpo-rated into the proposed global network model, and the delayis addressed as the nonlinear integer programming (NIP)problem in the given network resource and traffic accessmode.
The above studies have been considered unilaterally fromthe network latency, but in fact the data integrity is valuedby most applications. In [3], a multipath dynamic routingalgorithm called IDDR is proposed to satisfy these tworequirements simultaneously. In IDDR, according to thesensitivity of the data to delay and integrity, on the basisof weights of each packet and different QoS requirements,the data packets in the network are separated, and differentdata are transferred to the sink through different paths toimprove data fidelity and integrity and minimize the end-to-end transmission latency. This dynamic routing for dataintegrity and delay differentiated service can meet the qualityrequirements of different data, but it is necessary to create aroute for each data transfer, increasing the complexity of thenetwork.
Similar to [3], authors of [31] evaluate the quality ofthe network from the timeliness and reliability. The authorsproposed a packet delivery mechanism called Multipath andMulti-SPEED Routing Protocol (MMSPEED) to improvedata latency and reliability. For timeliness, MMSPEED pro-vides multiple QoS levels to ensure the transmission speedof multiple packets. For reliability, probabilistic multipathforwarding supports the various reliability requirements ofdata. These mechanisms for QoS provisioning are realizedin a localized way without global information by adoptinglocalized geographic packet forwarding augmented withdynamic compensation, which compensates for local deci-sion inaccuracies as a packet travels towards the destination.
In a more complex system, the quality of service ofthe network may involve multiple parameters [32–36]. In[20], the authors proposed RPL for the application of traf-fic prioritization and differentiation for bandwidth, delay,reliability, and security. RPL addresses QoS channel accessthrough queue scheduling mechanism or the priority ofmedia access control (MAC). Specifically, multiple instancesof RPL implement the validity of QoS differences basedon different objective functions. At the same time, threevariants of RPL: standard RPL, multi-instance RPL (RPL-M), andmulti-instance RPLwith prioritized channel backoffs(RPL-M+) along with two distinct traffic classes have beenexamined as data traffic rate and composition was varied.
A three-layer QoS scheduling model is proposed forservice-oriented IoT in [37]; it selects different scheduling
4 Wireless Communications and Mobile Computing
schemes from the application layer, network layer, and sens-ing layer. In application layer, it uses the service of each com-ponent to explore the best QoS-aware service composition.In network layer, the model mainly deals with the schedulingof a heterogeneous network environment. In sensing layer, itis responsible for different service information collection andresource allocation scheduling. The scheme can reduce thecosts of network resources in a certain extent.
WSNs are highly complex systems, and energy consump-tion in resource-constrained WSNs is also an importantparameter to consider when reducing network latency. In-network data fusion and clustering are important tech-nologies to reduce energy consumption in wireless sensornetworks; the authors of [38] proposed a delay-aware networkstructure for WSNS with in-network data fusion by utilizingthis technique, which divides the sensor nodes into differentsize clusters, so that each cluster can communicate withthe fusion center in an interleaved manner. At the sametime, an optimization process is proposed to optimize thecommunication distance within the group. The proposednetwork can reduce the latency of the data aggregationprocess, provided that the data can only be partially fused.
Villas et al. of [22] also use data fusion to achieve theperformance requirements of the network and propose anin-network data aggregation routing strategy. The strategyestablishes routing paths in the nonhotspot area of thenetwork, and then a number of events that occur in differentarea are merged into the path, and when the packets of theseevents go through the same node, data fusion is performed toreduce redundancy. However, this strategy can only be part ofthe local event information together, but no global networkevent information fusion capabilities.
In relatively differentiated services, the network traffic isdivided into a small number of service classes based on theirpackets transmission quality, in terms of per-hop metricsfor queuing delays and packet losses. In [39], the authorsimproved and quantified relatively differentiated services andproposed proportional differentiation model for networkoperators providing “tuning knobs” to adjust the qualityinterval between classes. The model has a strict priority orcapacity differentiation and does not consider the class loadand loss differences.
It can be seen from the above that duty cycle anddata fusion are all key technologies to improve networkperformance.Therefore, in the DSDR scheme, we first reducethe transmission delay of delay-sensitive data by increasingduty cycles of relay nodes and then decrease the energyconsumption of delay-tolerant data by data fusion.
3. The System Model and Problem Statement
3.1. System Model. The network model of this paper is a typ-ical planar periodic data gathering wireless sensor network,which is similar to [14, 40]; its model structure is as follows.
(1)𝑁 homogeneous sensor nodes are randomly deployedin a two-dimensional planar network, the sink is the centerof the entire network, the network radius is 𝑅, the nodecommunication radius is 𝑟, and the node density is 𝜌. Eachnode in the network continuously monitors the surrounding
environment, and once the event of interest is detected, theevent data is immediately sent to the sink via multihop relays.
(2) Sensor nodes sleep/waking work periodically, nodesmonitor the target and transmit the data in the wakingstate. All the monitoring targets are randomly distributed indifferent positions of the network, so the probability that eachnode monitors target and generates data is equal.
(3)The lossless step-by-step multihop aggregation modelis used in this paper [22]. In this model, the result of datafusion of nodes 𝜍𝑖 and 𝜍𝑗 is denoted by Γ𝜍𝑖𝜍𝑗 , which can becalculated as
Γ𝜍𝑖,𝜍𝑗 = max (𝜍𝑖, 𝜍𝑗) + (1 − 𝜆𝑖,𝑗)min (𝜍𝑖, 𝜍𝑗) , (1)
where 𝜆𝑖,𝑗 is the correlation coefficient of 𝜍𝑖 and 𝜍𝑗 and 𝜆𝑖,𝑗can be calculated as
𝜆𝑖,𝑗 = 1𝑒(𝑑2𝑖,𝑗/𝛽) . (2)
𝑑𝑖,𝑗 is the distance between 𝜍𝑖 and 𝜍𝑗 and 𝛽 is the constant ofcorrelation coefficient, while 𝛽 → 0 and 𝜆𝑖,𝑗 → 0, indicatingthere is no correlation between 𝜍𝑖 and 𝜍𝑗, and the larger 𝛽 is,the higher data correlation of them is.
3.2. Network Parameters. A sensor node is composed of asensing unit and a communication unit [17], the sensing unitis responsible for sensing the monitoring event and invokingthe communication unit after sensing the event, and thenthe communication unit initiates its internal communicationmechanism to transmit data to the sink. Due to the factthat the energy of nodes is strictly limited, the sensor nodesuse sleep/waking cycling mode to save energy [15]. In oneunit cycle, the nodes are in the sleeping and waking stateperiodically, and only when the node is in the waking statecan it perceive events and transmit data. In one unit cycle,the ratio of the node in the waking state to the whole cycleis called duty cycle; suppose that 𝜙𝑆 is the sensing duty cycleand 𝜙𝐶 is the communication duty cycle, and then
𝜙𝑆 = T𝑎𝑆
T𝑠𝑆 +T𝑎
𝑆
= T𝑎𝑆
TSEN
𝜙𝐶 = T𝑎𝐶
T𝑠𝐶 +T𝑎
𝐶
= T𝑎𝐶
TCOM,
(3)
whereTSEN is the sensing cycle,TCOM is the communicationcycle, T𝑎
𝑆 is the time that the node is in the waking stateduring the sensing cycle,T𝑠
𝑆 is the time that the node is in thesleeping state during the sensing cycle,T𝑎
𝐶 is the time that thenode is in the waking state during the communication cycle,andT𝑠
𝐶 is the time that the node is in the sleeping state duringthe communication cycle.
The energy consumption model of this paper is similar to[14, 41], and the energy consumption of nodes is composedof event sensing, data transmission, data receiving, and lowpower listening. Therefore, the energy consumption modelcan be expressed as
𝐸𝜍𝑖 = €𝑖Se + €𝑖Td + €𝑖Rd + €𝑖Lp. (4)
Wireless Communications and Mobile Computing 5
Table 1: Network parameters.
Parameter Value Description𝐸Ini 0.5 Initial energy (J)TSEN 15 Sensing cycle (s)TCOM 100 Communication cycle (ms)𝑑Pr 0.26 Preamble duration (ms)𝑑Ac 0.26 Acknowledge window duration (ms)𝑑Da 0.93 Data packet duration (ms)E𝑇 0.0511 Power consumption in transmission (w)E𝑅 0.0588 Power consumption in receiving (w)ESe 0.0036 Power consumption in sensing (w)ESl 2.4 ∗ 10−7 Power consumption in sleeping (w)
Table 1 and the Parameters Related to Calculation list therelevant parameters used in this paper, and the parametersvalues are derived from the internal data tables of theprototype sensor nodes as in [7].
3.3. Problem Statements. The main objective of this paperis to design an efficient communication scheme suitable forwireless sensor networks. In the quality of service, the schemecan meet different delay requirements. In terms of networkperformance, the scheme is able to maintain the networklifetime while strengthening the effective use of energy. It canbe expressed as follows.
(1) Minimize End-to-End Delay for Delay-Sensitive Data. Theend-to-end transmission delay of data refers to the timerequired from the preparation of data at the sender to itsarrival at the sink [17, 42]. Assuming that the transmissiondelay of kth hop is �ℎ𝑘 , and the number of relay hops is �,then the minimized end-to-end delay is expressed as follows:
min (𝐷𝑒2𝑒) = min( ∑1≤𝑘≤�
�ℎ𝑘) . (5)
(2) Balance Energy Consumption and Maximize Energy Uti-lization. All data in the network are transmitted to the sinkvia multihop relays. This sink-centered data gathering modelresults in a large amount of data and energy consumption inthe area that is relatively close to the sink [11, 43, 44], while,in the area far away from the sink, the energy consumptionis very small, which contributed to an imbalance in theenergy consumption. Assuming that there are N nodes inthe network, the energy consumption of node 𝜍𝑖 is 𝐸𝜍𝑖 ,and the equilibrium energy consumption of the network isto minimize the energy difference between the maximumenergy consumption and theminimum energy consumption;that is,
min (𝐸dif) = min(max1≤𝑖≤𝑁
(𝐸𝜍𝑖) − min1≤𝑗≤𝑁
(𝐸𝜍𝑗)) . (6)
Energy utilization is the ratio of the energy consumed bythe network to the initial energy. Assuming that the initial
energy of the node 𝜍𝑖 is𝐸𝑖Ini, themaximized energy utilizationcan be expressed as follows:
max (R𝑒 uti) = max[[(∑1≤𝑖≤𝑁 𝐸𝜍𝑖)(∑1≤𝑖≤𝑁 𝐸𝑖Ini)
]]. (7)
(3) Maximize Network Lifetime. Network lifetime is the datatransmission rounds that have been performed before thedeath of the network, which is defined in most studies as thedeath time of the first node in the network [12, 45, 46]. Inwireless sensor networks, the node is powered by the battery,and when the energy of the node is exhausted, the node dies[47]. Therefore, the network lifetime depends on the maxi-mum energy consumption of the network. Assuming that theenergy consumption of the node 𝜍𝑖 is 𝐸𝜍𝑖 , its initial energyis 𝐸Ini, and there are N nodes in the network. Therefore, themaximized lifetime of the network is tomaximize the lifetimeof the node with the largest energy consumption; that is,
max (Fℓ) = max[ 𝐸Ini
max1≤𝑖≤𝑁 (𝐸𝜍𝑖)] . (8)
In summary, the research objectives are as follows:
min (𝐷𝑒2𝑒) = min( ∑1≤𝑘≤�
�ℎ𝑘)
min (𝐸dif) = min(max1≤𝑖≤𝑁
(𝐸𝜍𝑖) − min1≤𝑗≤𝑁
(𝐸𝜍𝑗))
max (R𝑒 uti) = max[[(∑1≤𝑖≤𝑁 𝐸𝜍𝑖)(∑1≤𝑖≤𝑁 𝐸𝑖Ini)
]]
max (Fℓ) = max[ 𝐸Ini
max1≤𝑖≤𝑁 (𝐸𝜍𝑖)] .
(9)
4. DSDR Scheme
4.1. Research Motivation. Applications running on the samenetwork platform may have different latency requirements
6 Wireless Communications and Mobile Computing
Urgent incidents with strict requirements for transmission delays
Normal network events
Sink
Sensor node Sending node
D
D Normal data packet Urgent data packet
Sa Sx
D
D
D
DD
Figure 1: Traditional data routing for different events.
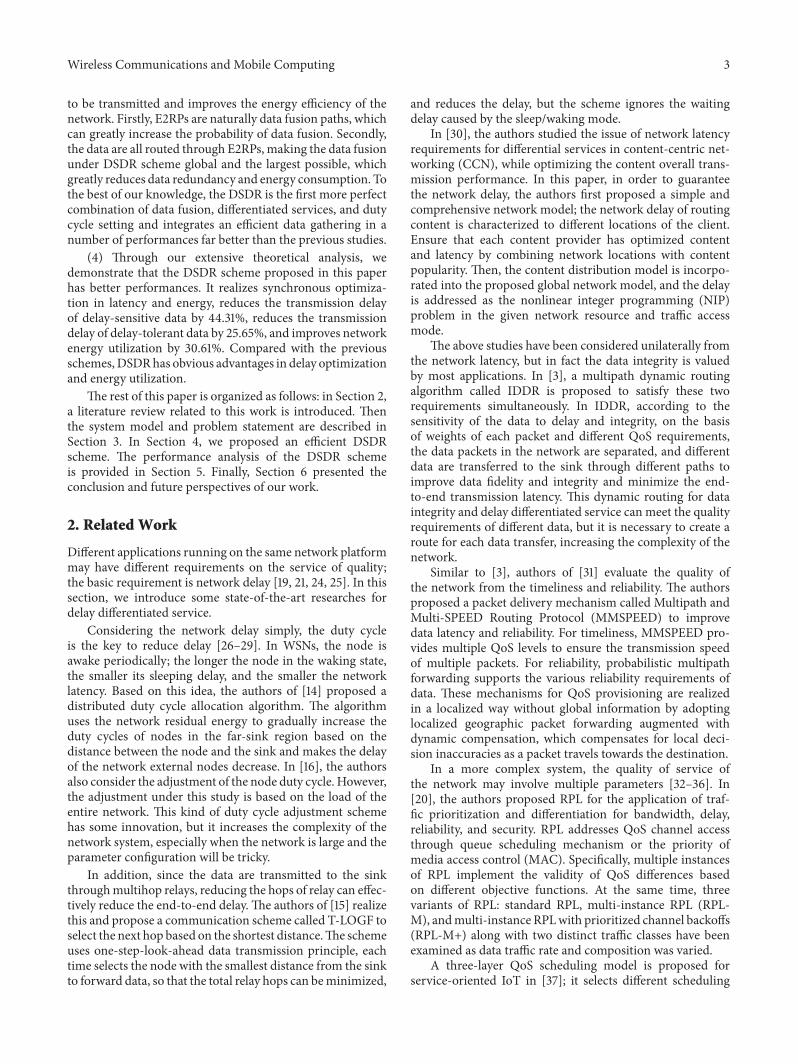
due to the differences in events [3, 48], and most existingschemes cannot intelligently select appropriate data routingbased on the latency sensitivity of the events, thus failing tomeet the requirements of different data. For example, in anetwork applied to biological monitoring, the sensor nodesare usually deployed to record the daily behaviors of theorganism, but if the organism gets into danger and its vitalsigns change dramatically, it is required to transfer the urgentdata to decision-makers as soon as possible in order to takecorresponding rescue measures in time. Therefore, for suchnetworks, the difference of its service quality is embodiedin the following: for delay-sensitive data, it is required totransmit information to the sink as soon as possible througha reliable transmission mechanism, and for delay-tolerantdata only the normal transmission is required. As shown inFigure 1, 𝜍𝑎 and 𝜍𝑥 are two nodes in the network, where 𝜍𝑥senses normal events that carry delay-tolerant data, while 𝜍𝑎senses urgent incidentswhich have strict requirements for thetransmission delay. According to the urgency of the packets,the data sent by 𝜍𝑎 should be transmitted to the sink earlierthan 𝜍𝑥. But, in the wireless sensor networks, the packets arerelayed to the sink through multi hops, and the maximumforwarding distance at each hop for nodes is 𝑟, where 𝑟 isthe communication radius of nodes.Therefore, the farther thedistance between the sending node and the sink is, the morerelay hops the data passes, and the greater the transmissiondelay is, so, in the previous studies, the data of 𝜍𝑎 in Figure 1is muchmore delayed than that of 𝜍𝑥, which conflicts with thelatency requirements of the data.
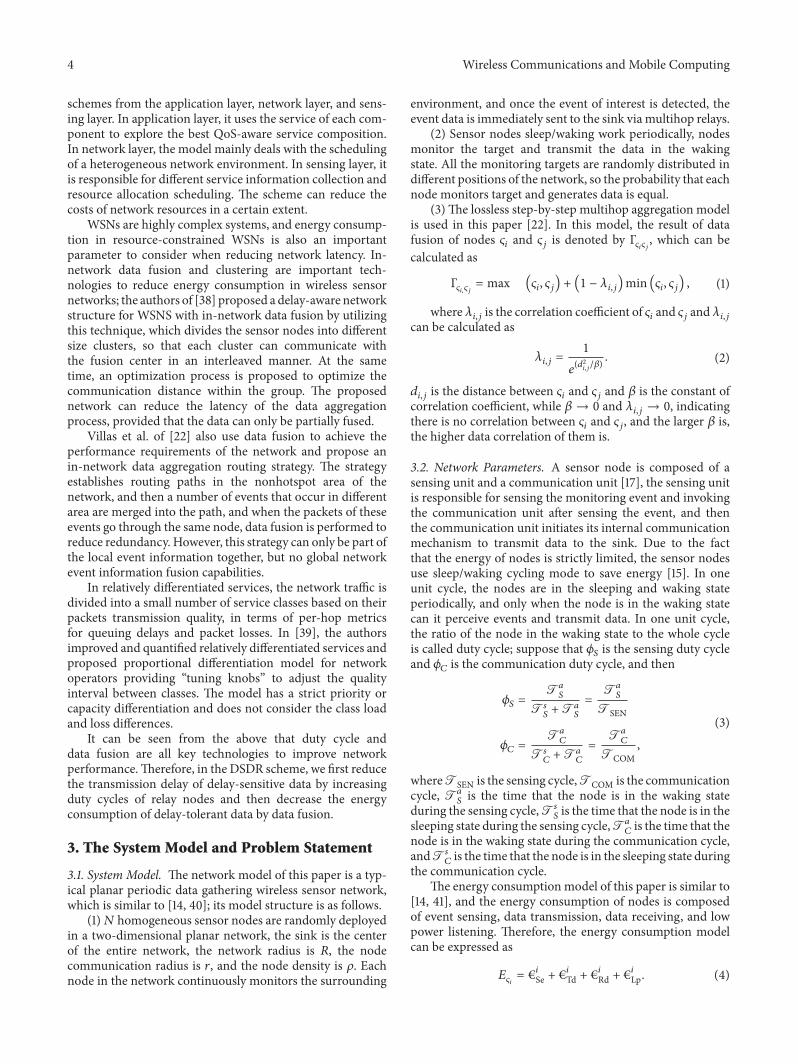
In a sparse network with 𝑅 = 500, 𝑟 = 80, and𝜌 = 0.1, suppose nodes adopt 0-1 communication modeand data transmission adopts multihop routing; then thenetwork performance under different parameter values isshown in Figures 2–6. When the node communication dutycycle is 0.2–0.5, respectively, the end-to-end delay at differentdistances of the network is shown in Figure 2. It can be seenfrom Figure 2 that the transmission delay of data gradually
100 200 300 400 500
20
40
60
80
100
120
140
160
Tran
smiss
ion
delay
(ms)
Distance from sink (m)
C = 0.2
C = 0.3
C = 0.4
C = 0.5
Figure 2: Transmission delay for different distances from the sink.
10 15 20 25 30 35 40 45
15000
20000
25000
30000
35000
40000
45000En
ergy
cons
umpt
ion
(nJ)
Data amount
C = 0.4C = 0.5
C = 0.3
Figure 3: Energy consumption for different data amount.
increases with the distance from the sink, and the delay ofthe far-sink region is much higher than that of the near-sinkregion, which is about 4 times (𝜙𝐶 = 0.2). And the near-sink region refers to the region within one-hop range of thesink, in a network where the network radius is 500 and thenode communication radius is 80, the area whose distancefrom the sink is 0–80 is near-sink region, and nodes locatedin the near-sink area are near-sink nodes. Similarly, the far-sink region refers to the area outside one-hop range of thesink, which is an area whose distance from the sink is 80–500,and the nodes in this area are far-sink nodes. It is clear thatthe far-sink area occupies a large area of the network, sothe probability that the delay-sensitive events are distributedin the far-sink area is much higher than that of the near-sink area, and this raises the requirements for the servicequality of the network, especially the transmission delay in
Wireless Communications and Mobile Computing 7
100 200 300 400 500
15
20
25
30
35
40
45
50
Dat
a am
ount
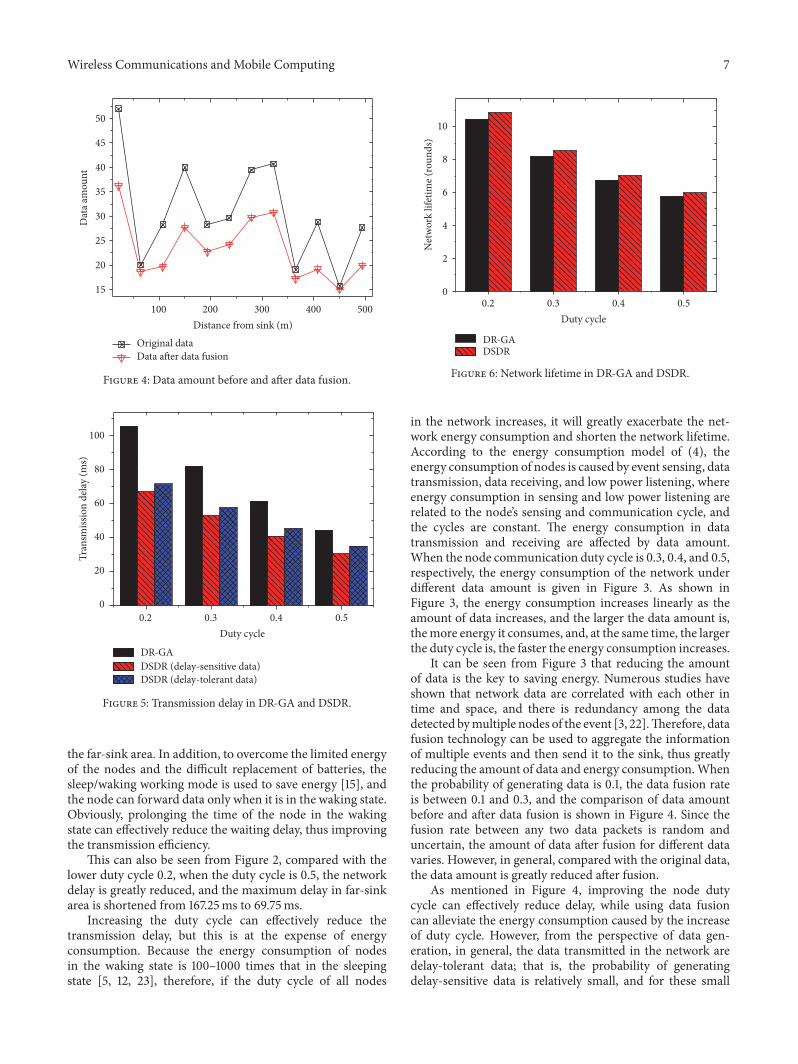
Distance from sink (m)Original data Data after data fusion
Figure 4: Data amount before and after data fusion.
0.2 0.3 0.4 0.50
20
40
60
80
100
Tran
smiss
ion
delay
(ms)
Duty cycle
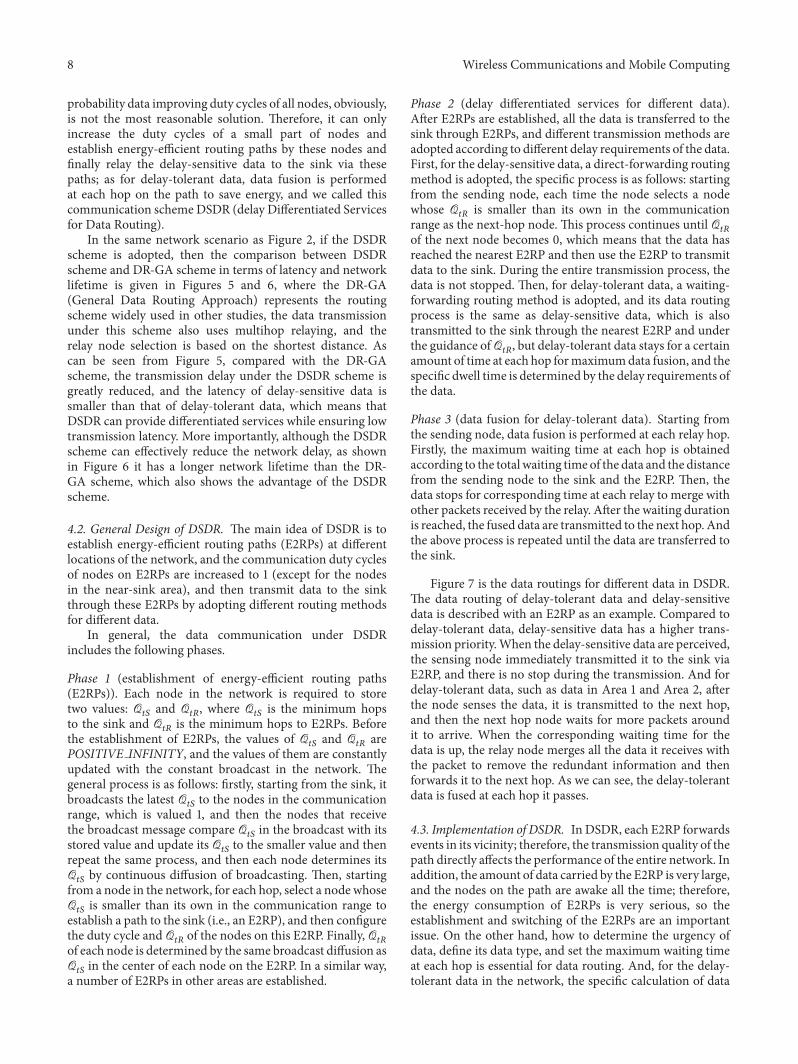
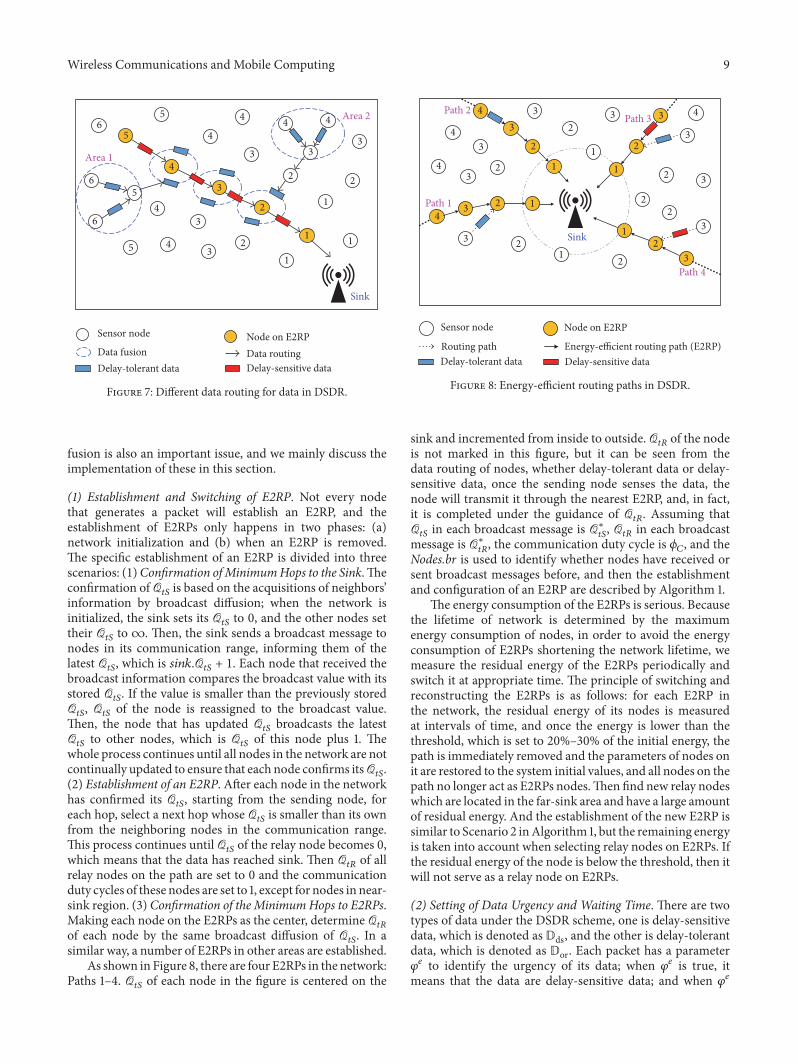
DR-GADSDR (delay-sensitive data)DSDR (delay-tolerant data)
Figure 5: Transmission delay in DR-GA and DSDR.
the far-sink area. In addition, to overcome the limited energyof the nodes and the difficult replacement of batteries, thesleep/waking working mode is used to save energy [15], andthe node can forward data only when it is in the waking state.Obviously, prolonging the time of the node in the wakingstate can effectively reduce the waiting delay, thus improvingthe transmission efficiency.
This can also be seen from Figure 2, compared with thelower duty cycle 0.2, when the duty cycle is 0.5, the networkdelay is greatly reduced, and the maximum delay in far-sinkarea is shortened from 167.25ms to 69.75ms.
Increasing the duty cycle can effectively reduce thetransmission delay, but this is at the expense of energyconsumption. Because the energy consumption of nodesin the waking state is 100–1000 times that in the sleepingstate [5, 12, 23], therefore, if the duty cycle of all nodes
0.2 0.3 0.4 0.50
2
4
6
8
10
Net
wor
k lif
etim
e (ro
unds
)
Duty cycle
DR-GADSDR
Figure 6: Network lifetime in DR-GA and DSDR.
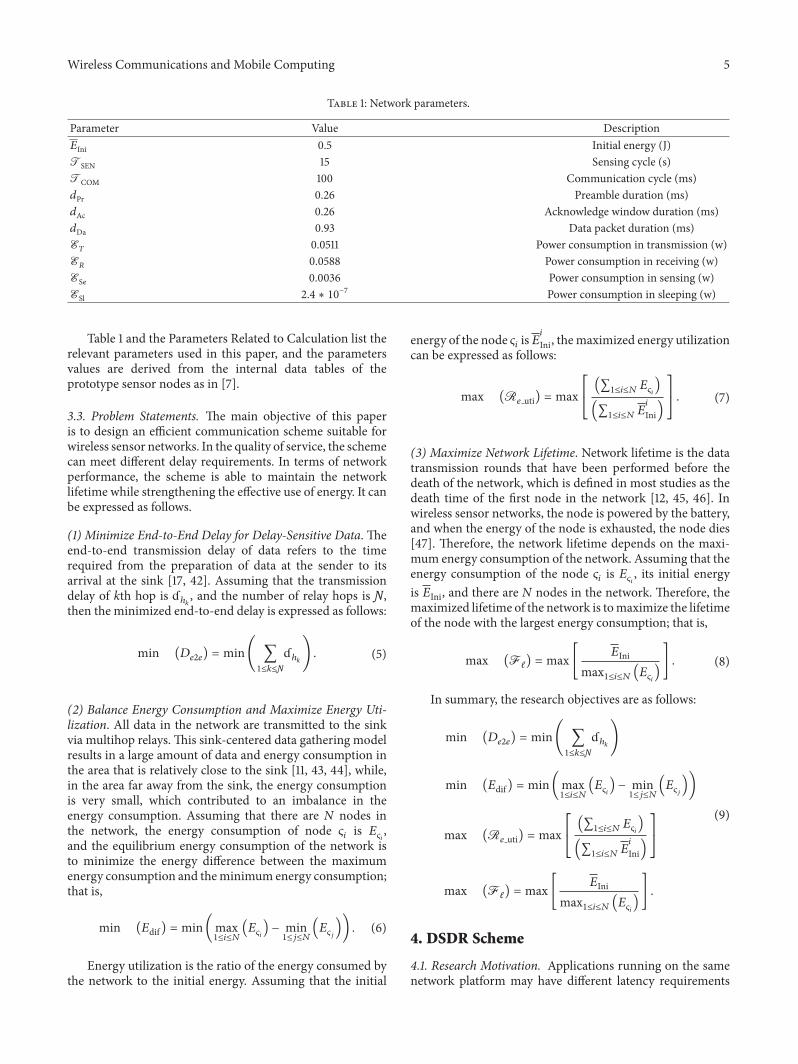
in the network increases, it will greatly exacerbate the net-work energy consumption and shorten the network lifetime.According to the energy consumption model of (4), theenergy consumption of nodes is caused by event sensing, datatransmission, data receiving, and low power listening, whereenergy consumption in sensing and low power listening arerelated to the node’s sensing and communication cycle, andthe cycles are constant. The energy consumption in datatransmission and receiving are affected by data amount.When the node communication duty cycle is 0.3, 0.4, and 0.5,respectively, the energy consumption of the network underdifferent data amount is given in Figure 3. As shown inFigure 3, the energy consumption increases linearly as theamount of data increases, and the larger the data amount is,themore energy it consumes, and, at the same time, the largerthe duty cycle is, the faster the energy consumption increases.
It can be seen from Figure 3 that reducing the amountof data is the key to saving energy. Numerous studies haveshown that network data are correlated with each other intime and space, and there is redundancy among the datadetected bymultiple nodes of the event [3, 22].Therefore, datafusion technology can be used to aggregate the informationof multiple events and then send it to the sink, thus greatlyreducing the amount of data and energy consumption.Whenthe probability of generating data is 0.1, the data fusion rateis between 0.1 and 0.3, and the comparison of data amountbefore and after data fusion is shown in Figure 4. Since thefusion rate between any two data packets is random anduncertain, the amount of data after fusion for different datavaries. However, in general, compared with the original data,the data amount is greatly reduced after fusion.
As mentioned in Figure 4, improving the node dutycycle can effectively reduce delay, while using data fusioncan alleviate the energy consumption caused by the increaseof duty cycle. However, from the perspective of data gen-eration, in general, the data transmitted in the network aredelay-tolerant data; that is, the probability of generatingdelay-sensitive data is relatively small, and for these small
8 Wireless Communications and Mobile Computing
probability data improving duty cycles of all nodes, obviously,is not the most reasonable solution. Therefore, it can onlyincrease the duty cycles of a small part of nodes andestablish energy-efficient routing paths by these nodes andfinally relay the delay-sensitive data to the sink via thesepaths; as for delay-tolerant data, data fusion is performedat each hop on the path to save energy, and we called thiscommunication scheme DSDR (delay Differentiated Servicesfor Data Routing).
In the same network scenario as Figure 2, if the DSDRscheme is adopted, then the comparison between DSDRscheme and DR-GA scheme in terms of latency and networklifetime is given in Figures 5 and 6, where the DR-GA(General Data Routing Approach) represents the routingscheme widely used in other studies, the data transmissionunder this scheme also uses multihop relaying, and therelay node selection is based on the shortest distance. Ascan be seen from Figure 5, compared with the DR-GAscheme, the transmission delay under the DSDR scheme isgreatly reduced, and the latency of delay-sensitive data issmaller than that of delay-tolerant data, which means thatDSDR can provide differentiated services while ensuring lowtransmission latency. More importantly, although the DSDRscheme can effectively reduce the network delay, as shownin Figure 6 it has a longer network lifetime than the DR-GA scheme, which also shows the advantage of the DSDRscheme.
4.2. General Design of DSDR. The main idea of DSDR is toestablish energy-efficient routing paths (E2RPs) at differentlocations of the network, and the communication duty cyclesof nodes on E2RPs are increased to 1 (except for the nodesin the near-sink area), and then transmit data to the sinkthrough these E2RPs by adopting different routing methodsfor different data.
In general, the data communication under DSDRincludes the following phases.
Phase 1 (establishment of energy-efficient routing paths(E2RPs)). Each node in the network is required to storetwo values: Q𝑡𝑆 and Q𝑡𝑅, where Q𝑡𝑆 is the minimum hopsto the sink and Q𝑡𝑅 is the minimum hops to E2RPs. Beforethe establishment of E2RPs, the values of Q𝑡𝑆 and Q𝑡𝑅 arePOSITIVE INFINITY, and the values of them are constantlyupdated with the constant broadcast in the network. Thegeneral process is as follows: firstly, starting from the sink, itbroadcasts the latest Q𝑡𝑆 to the nodes in the communicationrange, which is valued 1, and then the nodes that receivethe broadcast message compare Q𝑡𝑆 in the broadcast with itsstored value and update its Q𝑡𝑆 to the smaller value and thenrepeat the same process, and then each node determines itsQ𝑡𝑆 by continuous diffusion of broadcasting. Then, startingfrom a node in the network, for each hop, select a node whoseQ𝑡𝑆 is smaller than its own in the communication range toestablish a path to the sink (i.e., an E2RP), and then configurethe duty cycle and Q𝑡𝑅 of the nodes on this E2RP. Finally, Q𝑡𝑅
of each node is determined by the same broadcast diffusion asQ𝑡𝑆 in the center of each node on the E2RP. In a similar way,a number of E2RPs in other areas are established.
Phase 2 (delay differentiated services for different data).After E2RPs are established, all the data is transferred to thesink through E2RPs, and different transmission methods areadopted according to different delay requirements of the data.First, for the delay-sensitive data, a direct-forwarding routingmethod is adopted, the specific process is as follows: startingfrom the sending node, each time the node selects a nodewhose Q𝑡𝑅 is smaller than its own in the communicationrange as the next-hop node. This process continues until Q𝑡𝑅
of the next node becomes 0, which means that the data hasreached the nearest E2RP and then use the E2RP to transmitdata to the sink. During the entire transmission process, thedata is not stopped. Then, for delay-tolerant data, a waiting-forwarding routing method is adopted, and its data routingprocess is the same as delay-sensitive data, which is alsotransmitted to the sink through the nearest E2RP and underthe guidance ofQ𝑡𝑅, but delay-tolerant data stays for a certainamount of time at each hop formaximumdata fusion, and thespecific dwell time is determined by the delay requirements ofthe data.
Phase 3 (data fusion for delay-tolerant data). Starting fromthe sending node, data fusion is performed at each relay hop.Firstly, the maximum waiting time at each hop is obtainedaccording to the total waiting time of the data and the distancefrom the sending node to the sink and the E2RP. Then, thedata stops for corresponding time at each relay to merge withother packets received by the relay. After the waiting durationis reached, the fused data are transmitted to the next hop. Andthe above process is repeated until the data are transferred tothe sink.
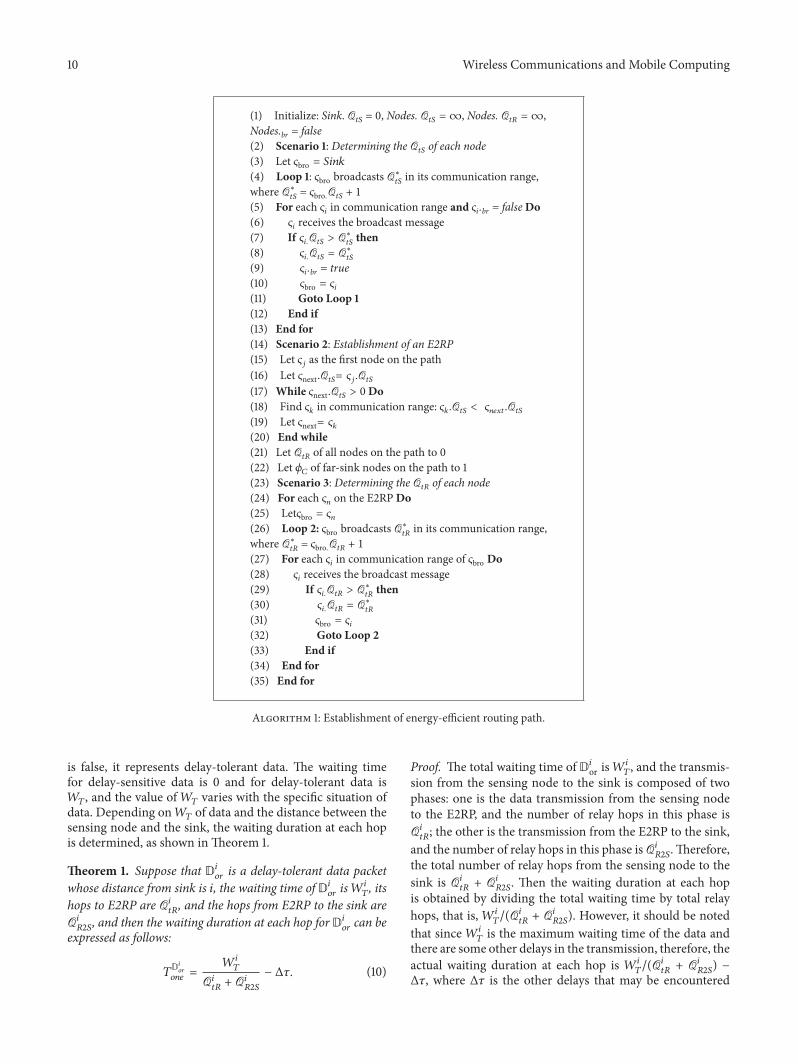
Figure 7 is the data routings for different data in DSDR.The data routing of delay-tolerant data and delay-sensitivedata is described with an E2RP as an example. Compared todelay-tolerant data, delay-sensitive data has a higher trans-mission priority.When the delay-sensitive data are perceived,the sensing node immediately transmitted it to the sink viaE2RP, and there is no stop during the transmission. And fordelay-tolerant data, such as data in Area 1 and Area 2, afterthe node senses the data, it is transmitted to the next hop,and then the next hop node waits for more packets aroundit to arrive. When the corresponding waiting time for thedata is up, the relay node merges all the data it receives withthe packet to remove the redundant information and thenforwards it to the next hop. As we can see, the delay-tolerantdata is fused at each hop it passes.
4.3. Implementation of DSDR. In DSDR, each E2RP forwardsevents in its vicinity; therefore, the transmission quality of thepath directly affects the performance of the entire network. Inaddition, the amount of data carried by the E2RP is very large,and the nodes on the path are awake all the time; therefore,the energy consumption of E2RPs is very serious, so theestablishment and switching of the E2RPs are an importantissue. On the other hand, how to determine the urgency ofdata, define its data type, and set the maximum waiting timeat each hop is essential for data routing. And, for the delay-tolerant data in the network, the specific calculation of data
Wireless Communications and Mobile Computing 9
4
5
4
4
4 4
33
4
Sink
54
56
5
6
Sensor node Node on E2RP
Delay-tolerant data Delay-sensitive data
11
1
22
2
3
3
3
32
1
Data routingData fusion
6
Area 1
Area 2
Figure 7: Different data routing for data in DSDR.
fusion is also an important issue, and we mainly discuss theimplementation of these in this section.
(1) Establishment and Switching of E2RP. Not every nodethat generates a packet will establish an E2RP, and theestablishment of E2RPs only happens in two phases: (a)network initialization and (b) when an E2RP is removed.The specific establishment of an E2RP is divided into threescenarios: (1)Confirmation ofMinimumHops to the Sink.Theconfirmation ofQ𝑡𝑆 is based on the acquisitions of neighbors’information by broadcast diffusion; when the network isinitialized, the sink sets its Q𝑡𝑆 to 0, and the other nodes settheir Q𝑡𝑆 to∞. Then, the sink sends a broadcast message tonodes in its communication range, informing them of thelatest Q𝑡𝑆, which is 𝑠𝑖𝑛𝑘.Q𝑡𝑆 + 1. Each node that received thebroadcast information compares the broadcast value with itsstored Q𝑡𝑆. If the value is smaller than the previously storedQ𝑡𝑆, Q𝑡𝑆 of the node is reassigned to the broadcast value.Then, the node that has updated Q𝑡𝑆 broadcasts the latestQ𝑡𝑆 to other nodes, which is Q𝑡𝑆 of this node plus 1. Thewhole process continues until all nodes in the network are notcontinually updated to ensure that each node confirms itsQ𝑡𝑆.(2) Establishment of an E2RP. After each node in the networkhas confirmed its Q𝑡𝑆, starting from the sending node, foreach hop, select a next hop whose Q𝑡𝑆 is smaller than its ownfrom the neighboring nodes in the communication range.This process continues until Q𝑡𝑆 of the relay node becomes 0,which means that the data has reached sink. Then Q𝑡𝑅 of allrelay nodes on the path are set to 0 and the communicationduty cycles of these nodes are set to 1, except for nodes in near-sink region. (3) Confirmation of the MinimumHops to E2RPs.Making each node on the E2RPs as the center, determine Q𝑡𝑅
of each node by the same broadcast diffusion of Q𝑡𝑆. In asimilar way, a number of E2RPs in other areas are established.
As shown in Figure 8, there are four E2RPs in the network:Paths 1–4. Q𝑡𝑆 of each node in the figure is centered on the
3
2
34
3
4
42
Sink
2
2
Sensor node Node on E2RP
Delay-tolerant data Delay-sensitive data Energy-efficient routing path (E2RP)Routing path
2
2
2 2
2
3 3
3
3
3
4
3
2
3
Path 1
Path 2 Path 3
Path 4
343
2
1 11
1
1
1
Figure 8: Energy-efficient routing paths in DSDR.
sink and incremented from inside to outside.Q𝑡𝑅 of the nodeis not marked in this figure, but it can be seen from thedata routing of nodes, whether delay-tolerant data or delay-sensitive data, once the sending node senses the data, thenode will transmit it through the nearest E2RP, and, in fact,it is completed under the guidance of Q𝑡𝑅. Assuming thatQ𝑡𝑆 in each broadcast message is Q∗
𝑡𝑆, Q𝑡𝑅 in each broadcastmessage is Q∗
𝑡𝑅, the communication duty cycle is 𝜙𝐶, and theNodes.br is used to identify whether nodes have received orsent broadcast messages before, and then the establishmentand configuration of an E2RP are described by Algorithm 1.
The energy consumption of the E2RPs is serious. Becausethe lifetime of network is determined by the maximumenergy consumption of nodes, in order to avoid the energyconsumption of E2RPs shortening the network lifetime, wemeasure the residual energy of the E2RPs periodically andswitch it at appropriate time. The principle of switching andreconstructing the E2RPs is as follows: for each E2RP inthe network, the residual energy of its nodes is measuredat intervals of time, and once the energy is lower than thethreshold, which is set to 20%–30% of the initial energy, thepath is immediately removed and the parameters of nodes onit are restored to the system initial values, and all nodes on thepath no longer act as E2RPs nodes.Then find new relay nodeswhich are located in the far-sink area and have a large amountof residual energy. And the establishment of the new E2RP issimilar to Scenario 2 inAlgorithm 1, but the remaining energyis taken into account when selecting relay nodes on E2RPs. Ifthe residual energy of the node is below the threshold, then itwill not serve as a relay node on E2RPs.
(2) Setting of Data Urgency and Waiting Time. There are twotypes of data under the DSDR scheme, one is delay-sensitivedata, which is denoted as Dds, and the other is delay-tolerantdata, which is denoted as Dor. Each packet has a parameter𝜑𝑒 to identify the urgency of its data; when 𝜑𝑒 is true, itmeans that the data are delay-sensitive data; and when 𝜑𝑒
10 Wireless Communications and Mobile Computing
(1) Initialize: Sink. Q𝑡𝑆 = 0, Nodes. Q𝑡𝑆 = ∞, Nodes. Q𝑡𝑅 = ∞,Nodes.br = false(2) Scenario 1: Determining the Q𝑡𝑆 of each node(3) Let 𝜍bro = 𝑆𝑖𝑛𝑘(4) Loop 1: 𝜍bro broadcasts Q∗
𝑡𝑆 in its communication range,where Q∗
𝑡𝑆 = 𝜍bro.Q𝑡𝑆 + 1(5) For each 𝜍𝑖 in communication range and 𝜍𝑖.br = falseDo(6) 𝜍𝑖 receives the broadcast message(7) If 𝜍𝑖.Q𝑡𝑆 > Q∗
𝑡𝑆 then(8) 𝜍𝑖.Q𝑡𝑆 = Q∗
𝑡𝑆
(9) 𝜍𝑖.br = true(10) 𝜍bro = 𝜍𝑖(11) Goto Loop 1(12) End if(13) End for(14) Scenario 2: Establishment of an E2RP(15) Let 𝜍𝑗 as the first node on the path(16) Let 𝜍next.Q𝑡𝑆= 𝜍𝑗.Q𝑡𝑆
(17) While 𝜍next.Q𝑡𝑆 > 0Do(18) Find 𝜍𝑘 in communication range: 𝜍𝑘.Q𝑡𝑆 < 𝜍𝑛𝑒𝑥𝑡.Q𝑡𝑆
(19) Let 𝜍next= 𝜍𝑘(20) End while(21) Let Q𝑡𝑅 of all nodes on the path to 0(22) Let 𝜙𝐶 of far-sink nodes on the path to 1(23) Scenario 3: Determining the Q𝑡𝑅 of each node(24) For each 𝜍𝑛 on the E2RPDo(25) Let𝜍bro = 𝜍𝑛(26) Loop 2: 𝜍bro broadcasts Q∗
𝑡𝑅 in its communication range,where Q∗
𝑡𝑅 = 𝜍bro.Q𝑡𝑅 + 1(27) For each 𝜍𝑖 in communication range of 𝜍bro Do(28) 𝜍𝑖 receives the broadcast message(29) If 𝜍𝑖.Q𝑡𝑅 > Q∗
𝑡𝑅 then(30) 𝜍𝑖.Q𝑡𝑅 = Q∗
𝑡𝑅
(31) 𝜍bro = 𝜍𝑖(32) Goto Loop 2(33) End if(34) End for(35) End for
Algorithm 1: Establishment of energy-efficient routing path.
is false, it represents delay-tolerant data. The waiting timefor delay-sensitive data is 0 and for delay-tolerant data is𝑊𝑇, and the value of𝑊𝑇 varies with the specific situation ofdata. Depending on𝑊𝑇 of data and the distance between thesensing node and the sink, the waiting duration at each hopis determined, as shown inTheorem 1.
Theorem 1. Suppose that D𝑖𝑜𝑟 is a delay-tolerant data packet
whose distance from sink is 𝑖, the waiting time of D𝑖𝑜𝑟 is𝑊𝑖
𝑇, itshops to E2RP are Q𝑖
𝑡𝑅, and the hops from E2RP to the sink areQ𝑖𝑅2𝑆, and then the waiting duration at each hop forD
𝑖𝑜𝑟 can be
expressed as follows:
𝑇D𝑖𝑜𝑟𝑜𝑛𝑒 = 𝑊𝑖
𝑇
Q𝑖𝑡𝑅 + Q𝑖
𝑅2𝑆
− Δ𝜏. (10)
Proof. The total waiting time of D𝑖or is𝑊𝑖
𝑇, and the transmis-sion from the sensing node to the sink is composed of twophases: one is the data transmission from the sensing nodeto the E2RP, and the number of relay hops in this phase isQ𝑖𝑡𝑅; the other is the transmission from the E2RP to the sink,
and the number of relay hops in this phase isQ𝑖𝑅2𝑆. Therefore,
the total number of relay hops from the sensing node to thesink is Q𝑖
𝑡𝑅 + Q𝑖𝑅2𝑆. Then the waiting duration at each hop
is obtained by dividing the total waiting time by total relayhops, that is,𝑊𝑖
𝑇/(Q𝑖𝑡𝑅 + Q𝑖
𝑅2𝑆). However, it should be notedthat since𝑊𝑖
𝑇 is the maximum waiting time of the data andthere are some other delays in the transmission, therefore, theactual waiting duration at each hop is 𝑊𝑖
𝑇/(Q𝑖𝑡𝑅 + Q𝑖
𝑅2𝑆) −Δ𝜏, where Δ𝜏 is the other delays that may be encountered
Wireless Communications and Mobile Computing 11
4
23
4
4 3
2
4 4
3 34
Sink
23
2
54
5
6
Sensor node Node on E2RP
Delay-tolerant data Delay-sensitive data Energy-efficient routing path (E2RP)Data routing
Data 2
Data 1
Area 1
Data 3 5
5
3
1
1
1
Figure 9: Data routing and waiting time for different data.
on the transmission path, including queuing and possibleretransmission delays. In a sparse network with good linkquality, Δ𝜏 can be ignored.
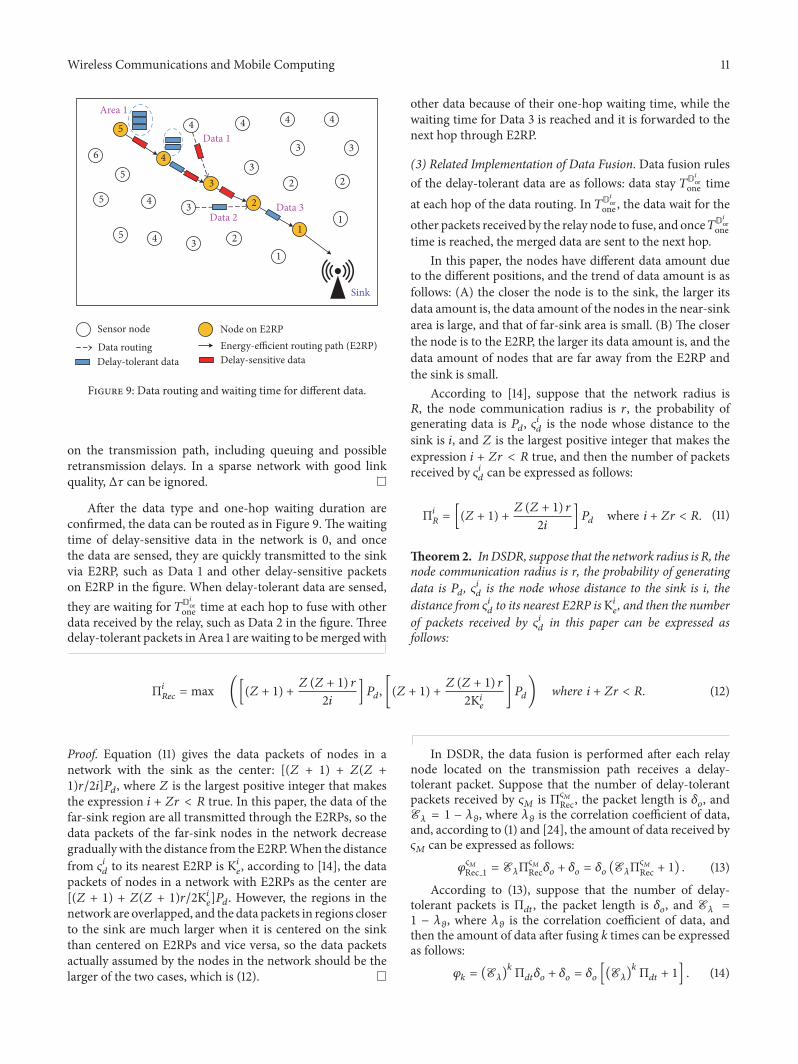
After the data type and one-hop waiting duration areconfirmed, the data can be routed as in Figure 9. The waitingtime of delay-sensitive data in the network is 0, and oncethe data are sensed, they are quickly transmitted to the sinkvia E2RP, such as Data 1 and other delay-sensitive packetson E2RP in the figure. When delay-tolerant data are sensed,they are waiting for 𝑇D𝑖or
one time at each hop to fuse with otherdata received by the relay, such as Data 2 in the figure. Threedelay-tolerant packets in Area 1 are waiting to bemerged with
other data because of their one-hop waiting time, while thewaiting time for Data 3 is reached and it is forwarded to thenext hop through E2RP.
(3) Related Implementation of Data Fusion. Data fusion rulesof the delay-tolerant data are as follows: data stay 𝑇D𝑖or
one timeat each hop of the data routing. In 𝑇D𝑖or
one , the data wait for theother packets received by the relay node to fuse, and once𝑇D𝑖or
onetime is reached, the merged data are sent to the next hop.
In this paper, the nodes have different data amount dueto the different positions, and the trend of data amount is asfollows: (A) the closer the node is to the sink, the larger itsdata amount is, the data amount of the nodes in the near-sinkarea is large, and that of far-sink area is small. (B) The closerthe node is to the E2RP, the larger its data amount is, and thedata amount of nodes that are far away from the E2RP andthe sink is small.
According to [14], suppose that the network radius is𝑅, the node communication radius is 𝑟, the probability ofgenerating data is 𝑃𝑑, 𝜍𝑖𝑑 is the node whose distance to thesink is 𝑖, and 𝑍 is the largest positive integer that makes theexpression 𝑖 + 𝑍𝑟 < 𝑅 true, and then the number of packetsreceived by 𝜍𝑖𝑑 can be expressed as follows:
Π𝑖𝑅 = [(𝑍 + 1) + 𝑍 (𝑍 + 1) 𝑟2𝑖 ] 𝑃𝑑 where 𝑖 + 𝑍𝑟 < 𝑅. (11)
Theorem2. InDSDR, suppose that the network radius is R, thenode communication radius is r, the probability of generatingdata is 𝑃𝑑, 𝜍𝑖𝑑 is the node whose distance to the sink is i, thedistance from 𝜍𝑖𝑑 to its nearest E2RP isΚ𝑖𝑒, and then the numberof packets received by 𝜍𝑖𝑑 in this paper can be expressed asfollows:
Π𝑖𝑅𝑒𝑐 = max ([(𝑍 + 1) + 𝑍 (𝑍 + 1) 𝑟2𝑖 ] 𝑃𝑑, [(𝑍 + 1) + 𝑍 (𝑍 + 1) 𝑟2Κ𝑖𝑒 ]𝑃𝑑) where 𝑖 + 𝑍𝑟 < 𝑅. (12)
Proof. Equation (11) gives the data packets of nodes in anetwork with the sink as the center: [(𝑍 + 1) + 𝑍(𝑍 +1)𝑟/2𝑖]𝑃𝑑, where 𝑍 is the largest positive integer that makesthe expression 𝑖 + 𝑍𝑟 < 𝑅 true. In this paper, the data of thefar-sink region are all transmitted through the E2RPs, so thedata packets of the far-sink nodes in the network decreasegradually with the distance from the E2RP.When the distancefrom 𝜍𝑖𝑑 to its nearest E2RP is Κ𝑖𝑒, according to [14], the datapackets of nodes in a network with E2RPs as the center are[(𝑍 + 1) + 𝑍(𝑍 + 1)𝑟/2Κ𝑖𝑒]𝑃𝑑. However, the regions in thenetwork are overlapped, and the data packets in regions closerto the sink are much larger when it is centered on the sinkthan centered on E2RPs and vice versa, so the data packetsactually assumed by the nodes in the network should be thelarger of the two cases, which is (12).
In DSDR, the data fusion is performed after each relaynode located on the transmission path receives a delay-tolerant packet. Suppose that the number of delay-tolerantpackets received by 𝜍𝑀 is Π𝜍𝑀
Rec, the packet length is 𝛿𝑜, andE𝜆 = 1 − 𝜆𝜗, where 𝜆𝜗 is the correlation coefficient of data,and, according to (1) and [24], the amount of data received by𝜍𝑀 can be expressed as follows:
𝜑𝜍𝑀Rec 1 = E𝜆Π𝜍𝑀Rec𝛿𝑜 + 𝛿𝑜 = 𝛿𝑜 (E𝜆Π𝜍𝑀
Rec + 1) . (13)
According to (13), suppose that the number of delay-tolerant packets is Π𝑑𝑡, the packet length is 𝛿𝑜, and E𝜆 =1 − 𝜆𝜗, where 𝜆𝜗 is the correlation coefficient of data, andthen the amount of data after fusing k times can be expressedas follows:
𝜑𝑘 = (E𝜆)𝑘Π𝑑𝑡𝛿𝑜 + 𝛿𝑜 = 𝛿𝑜 [(E𝜆)𝑘Π𝑑𝑡 + 1] . (14)
12 Wireless Communications and Mobile Computing
0 100 200 300 400 500
10
15
20
25
30
35
40
45
50
55
Dat
a am
ount
Distance from sink (m)
Original dataData fusion once
Data fusion 3 timesData fusion 7 times
Figure 10: Data amount for different data fusion times.
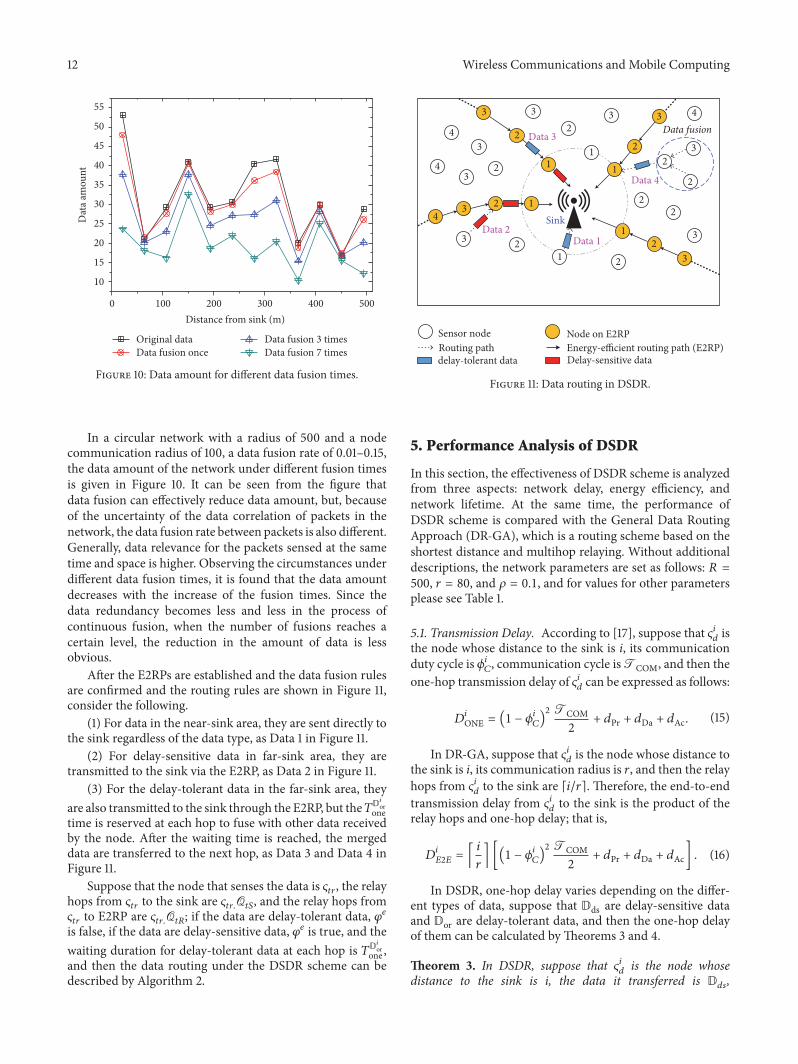
In a circular network with a radius of 500 and a nodecommunication radius of 100, a data fusion rate of 0.01–0.15,the data amount of the network under different fusion timesis given in Figure 10. It can be seen from the figure thatdata fusion can effectively reduce data amount, but, becauseof the uncertainty of the data correlation of packets in thenetwork, the data fusion rate between packets is also different.Generally, data relevance for the packets sensed at the sametime and space is higher. Observing the circumstances underdifferent data fusion times, it is found that the data amountdecreases with the increase of the fusion times. Since thedata redundancy becomes less and less in the process ofcontinuous fusion, when the number of fusions reaches acertain level, the reduction in the amount of data is lessobvious.
After the E2RPs are established and the data fusion rulesare confirmed and the routing rules are shown in Figure 11,consider the following.
(1) For data in the near-sink area, they are sent directly tothe sink regardless of the data type, as Data 1 in Figure 11.
(2) For delay-sensitive data in far-sink area, they aretransmitted to the sink via the E2RP, as Data 2 in Figure 11.
(3) For the delay-tolerant data in the far-sink area, theyare also transmitted to the sink through the E2RP, but the𝑇D𝑖or
onetime is reserved at each hop to fuse with other data receivedby the node. After the waiting time is reached, the mergeddata are transferred to the next hop, as Data 3 and Data 4 inFigure 11.
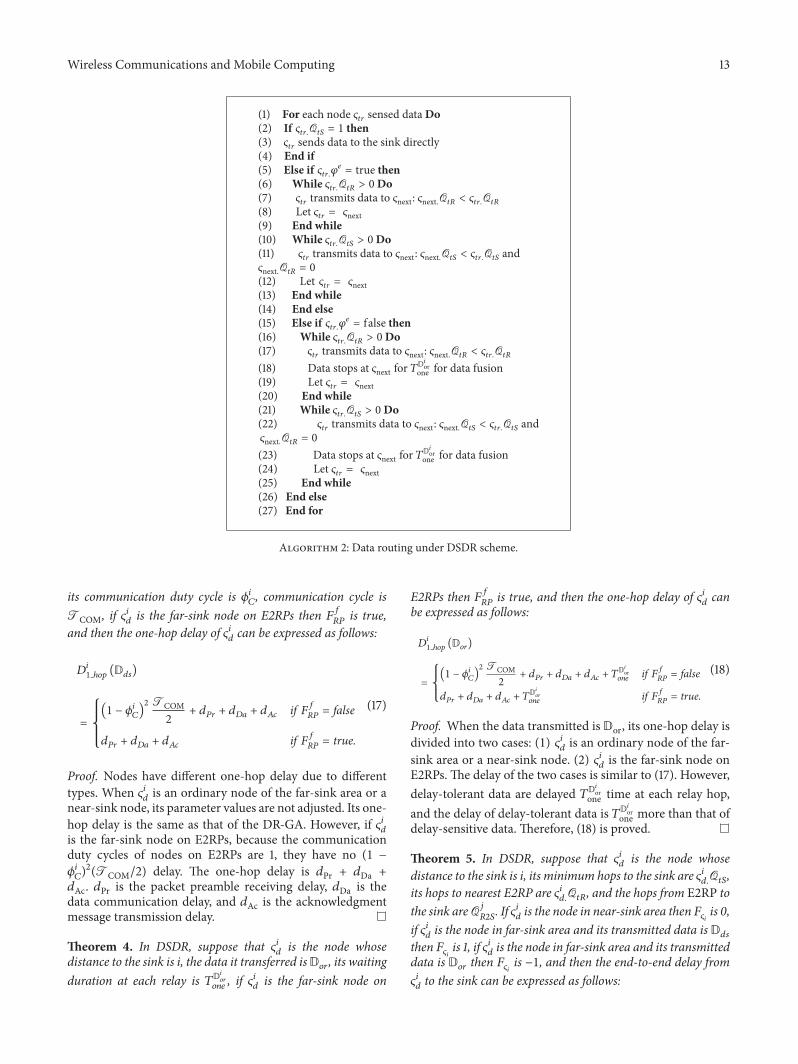
Suppose that the node that senses the data is 𝜍𝑡𝑟, the relayhops from 𝜍𝑡𝑟 to the sink are 𝜍𝑡𝑟.Q𝑡𝑆, and the relay hops from𝜍𝑡𝑟 to E2RP are 𝜍𝑡𝑟.Q𝑡𝑅; if the data are delay-tolerant data, 𝜑𝑒is false, if the data are delay-sensitive data, 𝜑𝑒 is true, and thewaiting duration for delay-tolerant data at each hop is 𝑇D𝑖or
one ,and then the data routing under the DSDR scheme can bedescribed by Algorithm 2.
3
34
3
4
4 2
Sink
2
2
Sensor node Node on E2RP
delay-tolerant data Delay-sensitive data Energy-efficient routing path (E2RP)Routing path
2
2
2 2
2
3 3
3
3
4
3
2
33
2
Data 1
Data 4
Data fusion
23
2
Data 2
Data 3
1
1
1
1
1
1
Figure 11: Data routing in DSDR.
5. Performance Analysis of DSDR
In this section, the effectiveness of DSDR scheme is analyzedfrom three aspects: network delay, energy efficiency, andnetwork lifetime. At the same time, the performance ofDSDR scheme is compared with the General Data RoutingApproach (DR-GA), which is a routing scheme based on theshortest distance and multihop relaying. Without additionaldescriptions, the network parameters are set as follows: 𝑅 =500, 𝑟 = 80, and 𝜌 = 0.1, and for values for other parametersplease see Table 1.
5.1. Transmission Delay. According to [17], suppose that 𝜍𝑖𝑑 isthe node whose distance to the sink is i, its communicationduty cycle is 𝜙𝑖𝐶, communication cycle isTCOM, and then theone-hop transmission delay of 𝜍𝑖𝑑 can be expressed as follows:
𝐷𝑖ONE = (1 − 𝜙𝑖𝐶)2 TCOM2 + 𝑑Pr + 𝑑Da + 𝑑Ac. (15)
In DR-GA, suppose that 𝜍𝑖𝑑 is the node whose distance tothe sink is i, its communication radius is 𝑟, and then the relayhops from 𝜍𝑖𝑑 to the sink are ⌈𝑖/𝑟⌉. Therefore, the end-to-endtransmission delay from 𝜍𝑖𝑑 to the sink is the product of therelay hops and one-hop delay; that is,
𝐷𝑖𝐸2𝐸 = ⌈ 𝑖𝑟⌉ [(1 − 𝜙𝑖𝐶)2 TCOM2 + 𝑑Pr + 𝑑Da + 𝑑Ac] . (16)
In DSDR, one-hop delay varies depending on the differ-ent types of data, suppose that Dds are delay-sensitive dataand Dor are delay-tolerant data, and then the one-hop delayof them can be calculated byTheorems 3 and 4.
Theorem 3. In DSDR, suppose that 𝜍𝑖𝑑 is the node whosedistance to the sink is i, the data it transferred is D𝑑𝑠,
Wireless Communications and Mobile Computing 13
(1) For each node 𝜍𝑡𝑟 sensed dataDo(2) If 𝜍𝑡𝑟.Q𝑡𝑆 = 1 then(3) 𝜍𝑡𝑟 sends data to the sink directly(4) End if(5) Else if 𝜍𝑡𝑟.𝜑𝑒 = true then(6) While 𝜍𝑡𝑟.Q𝑡𝑅 > 0Do(7) 𝜍𝑡𝑟 transmits data to 𝜍next: 𝜍next.Q𝑡𝑅 < 𝜍𝑡𝑟.Q𝑡𝑅
(8) Let 𝜍𝑡𝑟 = 𝜍next(9) End while(10) While 𝜍𝑡𝑟.Q𝑡𝑆 > 0Do(11) 𝜍𝑡𝑟 transmits data to 𝜍next: 𝜍next.Q𝑡𝑆 < 𝜍𝑡𝑟.Q𝑡𝑆 and𝜍next.Q𝑡𝑅 = 0(12) Let 𝜍𝑡𝑟 = 𝜍next(13) End while(14) End else(15) Else if 𝜍𝑡𝑟.𝜑𝑒 = false then(16) While 𝜍𝑡𝑟.Q𝑡𝑅 > 0Do(17) 𝜍𝑡𝑟 transmits data to 𝜍next: 𝜍next.Q𝑡𝑅 < 𝜍𝑡𝑟.Q𝑡𝑅
(18) Data stops at 𝜍next for 𝑇D𝑖orone for data fusion
(19) Let 𝜍𝑡𝑟 = 𝜍next(20) End while(21) While 𝜍𝑡𝑟.Q𝑡𝑆 > 0Do(22) 𝜍𝑡𝑟 transmits data to 𝜍next: 𝜍next.Q𝑡𝑆 < 𝜍𝑡𝑟.Q𝑡𝑆 and𝜍next.Q𝑡𝑅 = 0(23) Data stops at 𝜍next for 𝑇D𝑖or
one for data fusion(24) Let 𝜍𝑡𝑟 = 𝜍next(25) End while(26) End else(27) End for
Algorithm 2: Data routing under DSDR scheme.
its communication duty cycle is 𝜙𝑖𝐶, communication cycle isTCOM, if 𝜍𝑖𝑑 is the far-sink node on E2RPs then 𝐹𝑓𝑅𝑃 is true,and then the one-hop delay of 𝜍𝑖𝑑 can be expressed as follows:
𝐷𝑖1 ℎ𝑜𝑝 (D𝑑𝑠)
= {{{{{(1 − 𝜙𝑖𝐶)2 TCOM2 + 𝑑𝑃𝑟 + 𝑑𝐷𝑎 + 𝑑𝐴𝑐 if 𝐹𝑓𝑅𝑃 = false
𝑑𝑃𝑟 + 𝑑𝐷𝑎 + 𝑑𝐴𝑐 if 𝐹𝑓𝑅𝑃 = true.
(17)
Proof. Nodes have different one-hop delay due to differenttypes. When 𝜍𝑖𝑑 is an ordinary node of the far-sink area or anear-sink node, its parameter values are not adjusted. Its one-hop delay is the same as that of the DR-GA. However, if 𝜍𝑖𝑑is the far-sink node on E2RPs, because the communicationduty cycles of nodes on E2RPs are 1, they have no (1 −𝜙𝑖𝐶)2(TCOM/2) delay. The one-hop delay is 𝑑Pr + 𝑑Da +𝑑Ac. 𝑑Pr is the packet preamble receiving delay, 𝑑Da is thedata communication delay, and 𝑑Ac is the acknowledgmentmessage transmission delay.
Theorem 4. In DSDR, suppose that 𝜍𝑖𝑑 is the node whosedistance to the sink is i, the data it transferred isD𝑜𝑟, its waitingduration at each relay is 𝑇D𝑖𝑜𝑟
𝑜𝑛𝑒 , if 𝜍𝑖𝑑 is the far-sink node on
E2RPs then 𝐹𝑓𝑅𝑃 is true, and then the one-hop delay of 𝜍𝑖𝑑 canbe expressed as follows:
𝐷𝑖1 ℎ𝑜𝑝 (D𝑜𝑟)= {{{
(1 − 𝜙𝑖𝐶)2 TCOM2 + 𝑑𝑃𝑟 + 𝑑𝐷𝑎 + 𝑑𝐴𝑐 + 𝑇D𝑖or𝑜𝑛𝑒 if 𝐹𝑓𝑅𝑃 = false
𝑑𝑃𝑟 + 𝑑𝐷𝑎 + 𝑑𝐴𝑐 + 𝑇D𝑖𝑜𝑟𝑜𝑛𝑒 if 𝐹𝑓𝑅𝑃 = true.
(18)
Proof. When the data transmitted is Dor, its one-hop delay isdivided into two cases: (1) 𝜍𝑖𝑑 is an ordinary node of the far-sink area or a near-sink node. (2) 𝜍𝑖𝑑 is the far-sink node onE2RPs. The delay of the two cases is similar to (17). However,delay-tolerant data are delayed 𝑇D𝑖or
one time at each relay hop,and the delay of delay-tolerant data is 𝑇D𝑖or
one more than that ofdelay-sensitive data. Therefore, (18) is proved.
Theorem 5. In DSDR, suppose that 𝜍𝑖𝑑 is the node whosedistance to the sink is i, its minimum hops to the sink are 𝜍𝑖𝑑.Q𝑡𝑆,its hops to nearest E2RP are 𝜍𝑖𝑑.Q𝑡𝑅, and the hops from E2RP tothe sink areQ𝑗
𝑅2𝑆. If 𝜍𝑖𝑑 is the node in near-sink area then𝐹𝜍𝑖 is 0,if 𝜍𝑖𝑑 is the node in far-sink area and its transmitted data is D𝑑𝑠
then 𝐹𝜍𝑖 is 1, if 𝜍𝑖𝑑 is the node in far-sink area and its transmitteddata is D𝑜𝑟 then 𝐹𝜍𝑖 is −1, and then the end-to-end delay from𝜍𝑖𝑑 to the sink can be expressed as follows:
14 Wireless Communications and Mobile Computing
𝐷𝑖𝑒2𝑒 =
{{{{{{{{{{{{{{{{{{{{{
𝜍𝑖𝑑.Q𝑡𝑆 [(1 − 𝜙𝑖𝐶)2 TCOM2 + 𝜇𝑑] if 𝐹𝜍𝑖 = 0(1 − 𝜙𝑖𝐶)2 (𝜍𝑖𝑑.Q𝑡𝑅 + 1)TCOM2 + 𝜇𝑑 (𝜍𝑖𝑑.Q𝑡𝑅 + Q
𝑗
𝑅2𝑆) if 𝐹𝜍𝑖 = 1(1 − 𝜙𝑖𝐶)2 (𝜍𝑖𝑑.Q𝑡𝑅 + 1)TCOM2 + (𝜍𝑖𝑑.Q𝑡𝑅 + Q
𝑗
𝑅2𝑆) (𝜇𝑑 + 𝑇D𝑖𝑜𝑟𝑜𝑛𝑒 ) if 𝐹𝜍𝑖 = −1,
(19)
where 𝜇𝑑 = 𝑑𝑃𝑟 + 𝑑𝐷𝑎 + 𝑑𝐴𝑐.Proof. In DSDR, the transmission delay of 𝜍𝑖𝑑 is divided intothree situations depending on the network locations and datatypes. (1)When 𝜍𝑖𝑑 is a node in near-sink area, then the data issent directly to the sink regardless of the data type.Therefore,its end-to-end delay is the product of the one-hop delay andrelay hops: 𝜍𝑖𝑑.Q𝑡𝑆[(1 − 𝜙𝑖𝐶)2(TCOM/2) + 𝜇𝑑]. (2)When 𝜍𝑖𝑑 isa node in far-sink area and the data it transferred is Dds, itsdelay is divided into two phases: delay from 𝜍𝑖𝑑 to E2RP anddelay from E2RP to the sink. Delay in the previous phaseis the product of one-hop delay and hops from 𝜍𝑖𝑑 to E2RP:𝜍𝑖𝑑.Q𝑡𝑅[(1 − 𝜙𝑖𝐶)2(TCOM/2) + 𝜇𝑑]. Delay in the latter part isalso divided into two cases. Because the duty cycles of far-sink nodes on the E2RP are 1 and the duty cycles of near-sinknodes remain unchanged, the delay in this phase is dividedinto a partial delay from E2RP to near-sink node (the dutycycle is 1) and the one-hop delay from near-sink node to thesink (the original duty cycle).The delay of the previous part is𝜇𝑑(Q𝑗
𝑅2𝑆−1), followed by a delay of (1−𝜙𝑖𝐶)2(TCOM/2)+𝜇𝑑. (3)When 𝜍𝑖𝑑 is a node in far-sink area and the data it transferredis Dor, its delay is divided into two cases similar to Dds, butdelay-tolerant data wait for 𝑇D𝑖or
one at each relay, so its delay is𝑇D𝑖orone(𝜍𝑖𝑑.Q𝑡𝑅 + Q
𝑗
𝑅2𝑆)more than delay-sensitive data.
Definition 6. Total network delay (denoted as 𝐷tot) refersto the sum of transmission delays of the entire network.Since the transmission delay is distinct for different distancesfrom the sink, hence, 𝐷tot is determined by integrating thetransmission delays of different regions. Suppose that 𝜍𝑖𝑑 is thenode whose distance to the sink is 𝑖, its end-to-end delay is𝐷𝑖𝑒2𝑒, taking an arbitrary annular area with the distance from
the sink 𝑖 | 𝑖 ∈ {0, . . . , 𝑅}, the width of 𝑑𝑖, and the angle of 𝑑𝜃,then the delay of this region is 𝐷𝑖
𝑒2𝑒𝑖𝑑𝑖𝑑𝜃, and, therefore, thedelay of the entire network can be expressed as
𝐷tot = ∫𝑅0∫2𝜋0𝐷𝑖𝑒2𝑒 𝑖 𝑑𝑖 𝑑𝜃. (20)
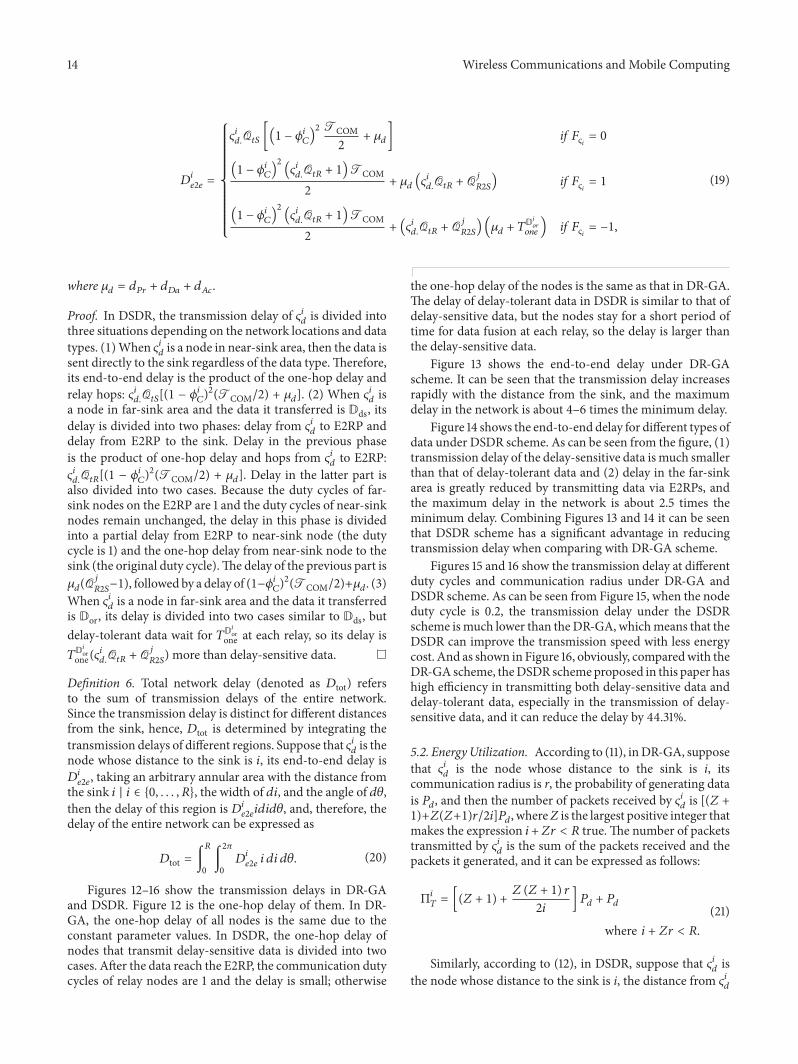
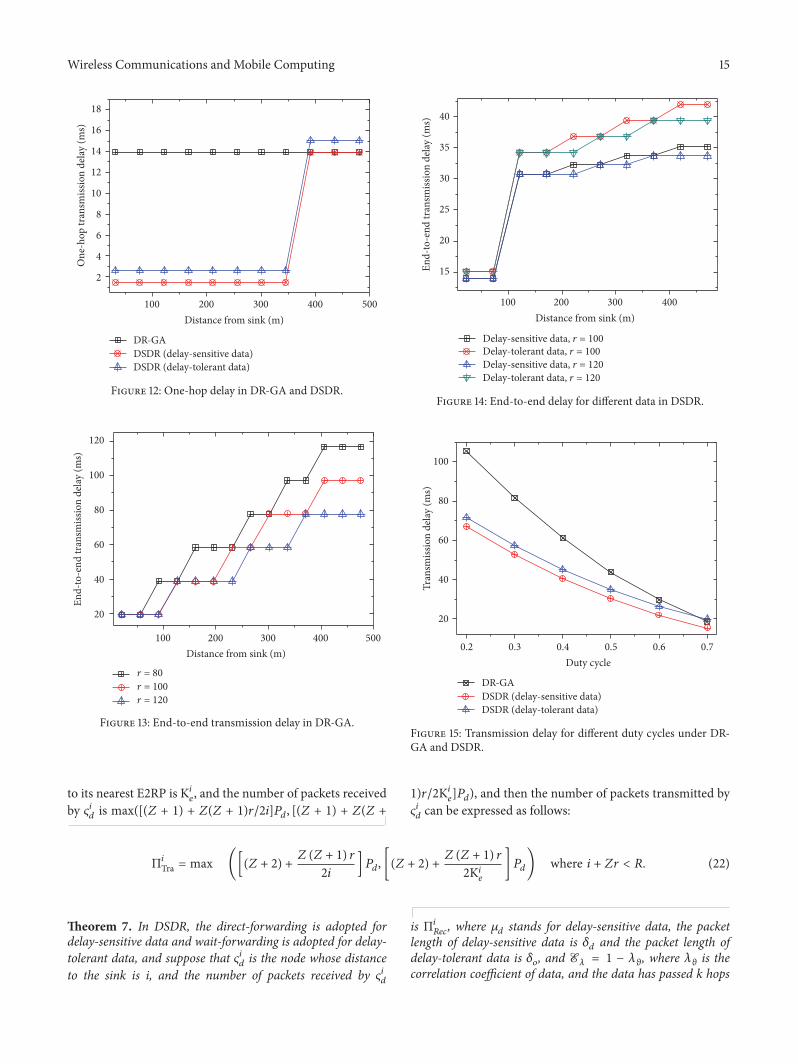
Figures 12–16 show the transmission delays in DR-GAand DSDR. Figure 12 is the one-hop delay of them. In DR-GA, the one-hop delay of all nodes is the same due to theconstant parameter values. In DSDR, the one-hop delay ofnodes that transmit delay-sensitive data is divided into twocases. After the data reach the E2RP, the communication dutycycles of relay nodes are 1 and the delay is small; otherwise
the one-hop delay of the nodes is the same as that in DR-GA.The delay of delay-tolerant data in DSDR is similar to that ofdelay-sensitive data, but the nodes stay for a short period oftime for data fusion at each relay, so the delay is larger thanthe delay-sensitive data.
Figure 13 shows the end-to-end delay under DR-GAscheme. It can be seen that the transmission delay increasesrapidly with the distance from the sink, and the maximumdelay in the network is about 4–6 times the minimum delay.
Figure 14 shows the end-to-end delay for different types ofdata under DSDR scheme. As can be seen from the figure, (1)transmission delay of the delay-sensitive data ismuch smallerthan that of delay-tolerant data and (2) delay in the far-sinkarea is greatly reduced by transmitting data via E2RPs, andthe maximum delay in the network is about 2.5 times theminimum delay. Combining Figures 13 and 14 it can be seenthat DSDR scheme has a significant advantage in reducingtransmission delay when comparing with DR-GA scheme.
Figures 15 and 16 show the transmission delay at differentduty cycles and communication radius under DR-GA andDSDR scheme. As can be seen from Figure 15, when the nodeduty cycle is 0.2, the transmission delay under the DSDRscheme ismuch lower than theDR-GA, whichmeans that theDSDR can improve the transmission speed with less energycost. And as shown in Figure 16, obviously, comparedwith theDR-GA scheme, theDSDR schemeproposed in this paper hashigh efficiency in transmitting both delay-sensitive data anddelay-tolerant data, especially in the transmission of delay-sensitive data, and it can reduce the delay by 44.31%.
5.2. EnergyUtilization. According to (11), inDR-GA, supposethat 𝜍𝑖𝑑 is the node whose distance to the sink is i, itscommunication radius is r, the probability of generating datais 𝑃𝑑, and then the number of packets received by 𝜍𝑖𝑑 is [(𝑍 +1)+𝑍(𝑍+1)𝑟/2𝑖]𝑃𝑑, whereZ is the largest positive integer thatmakes the expression 𝑖 + 𝑍𝑟 < 𝑅 true.The number of packetstransmitted by 𝜍𝑖𝑑 is the sum of the packets received and thepackets it generated, and it can be expressed as follows:
Π𝑖𝑇 = [(𝑍 + 1) + 𝑍 (𝑍 + 1) 𝑟2𝑖 ] 𝑃𝑑 + 𝑃𝑑
where 𝑖 + 𝑍𝑟 < 𝑅.(21)
Similarly, according to (12), in DSDR, suppose that 𝜍𝑖𝑑 isthe node whose distance to the sink is i, the distance from 𝜍𝑖𝑑
Wireless Communications and Mobile Computing 15
100 200 300 400 500
2
4
6
8
10
12
14
16
18
One
-hop
tran
smiss
ion
delay
(ms)
Distance from sink (m)
DR-GADSDR (delay-sensitive data)DSDR (delay-tolerant data)
Figure 12: One-hop delay in DR-GA and DSDR.
100 200 300 400 500
20
40
60
80
100
120
End-
to-e
nd tr
ansm
issio
n de
lay (m
s)
Distance from sink (m)
r = 80r = 100r = 120
Figure 13: End-to-end transmission delay in DR-GA.
to its nearest E2RP is Κ𝑖𝑒, and the number of packets receivedby 𝜍𝑖𝑑 is max([(𝑍 + 1) + 𝑍(𝑍 + 1)𝑟/2𝑖]𝑃𝑑, [(𝑍 + 1) + 𝑍(𝑍 +
100 200 300 400
15
20
25
30
35
40
End-
to-e
nd tr
ansm
issio
n de
lay (m
s)
Distance from sink (m)
Delay-sensitive data, r = 100Delay-tolerant data, r = 100Delay-sensitive data, r = 120 Delay-tolerant data, r = 120
Figure 14: End-to-end delay for different data in DSDR.
0.2 0.3 0.4 0.5 0.6 0.7
20
40
60
80
100
Tran
smiss
ion
delay
(ms)
Duty cycle
DR-GADSDR (delay-sensitive data)DSDR (delay-tolerant data)
Figure 15: Transmission delay for different duty cycles under DR-GA and DSDR.
1)𝑟/2Κ𝑖𝑒]𝑃𝑑), and then the number of packets transmitted by𝜍𝑖𝑑 can be expressed as follows:
Π𝑖Tra = max ([(𝑍 + 2) + 𝑍 (𝑍 + 1) 𝑟2𝑖 ] 𝑃𝑑, [(𝑍 + 2) + 𝑍 (𝑍 + 1) 𝑟2Κ𝑖𝑒 ]𝑃𝑑) where 𝑖 + 𝑍𝑟 < 𝑅. (22)
Theorem 7. In DSDR, the direct-forwarding is adopted fordelay-sensitive data and wait-forwarding is adopted for delay-tolerant data, and suppose that 𝜍𝑖𝑑 is the node whose distanceto the sink is i, and the number of packets received by 𝜍𝑖𝑑
is Π𝑖𝑅𝑒𝑐, where 𝜇𝑑 stands for delay-sensitive data, the packet
length of delay-sensitive data is 𝛿𝑑 and the packet length ofdelay-tolerant data is 𝛿𝑜, and E𝜆 = 1 − 𝜆𝜗, where 𝜆𝜗 is thecorrelation coefficient of data, and the data has passed k hops
16 Wireless Communications and Mobile Computing
80 100 1200
10
20
30
40
50
60
70
80
Tran
smiss
ion
delay
(ms)
Communication radius
DR-GADSDR (delay-sensitive data)DSDR (delay-tolerant data)
Figure 16: Transmission delay for different communication radiusunder DR-GA and DSDR.
before relaying to 𝜍𝑖𝑑, and then the amount of data received by𝜍𝑖𝑑 can be expressed as follows:
𝜑𝑖𝑅𝑒𝑐 = Π𝑖𝑅𝑒𝑐𝜇𝑑𝛿𝑑 + 𝛿𝑜 {(E𝜆)𝑘 [Π𝑖
𝑅𝑒𝑐 (1 − 𝜇𝑑)] + 1} . (23)
Proof. The amount of data received by 𝜍𝑖𝑑 is divided intothe amount of delay-sensitive data and the amount of delay-tolerant data. Since 𝜇𝑑 of Π𝑖
Rec is delay-sensitive data, thenumber of delay-sensitive packets is Π𝑖
Rec𝜇𝑑, the length ofeach delay-sensitive packet is 𝛿𝑑, and, therefore, the amountof delay-sensitive data received by 𝜍𝑖𝑑 isΠ𝑖
Rec𝜇𝑑𝛿𝑑. And delay-tolerant data are fused at each hop, suppose that the data haspassed k hops before it relays to 𝜍𝑖𝑑, then the data packets afterdata fusion can be obtained according to (14), and the amountof delay-tolerant data received by 𝜍𝑖𝑑 is the product of datapackets after data fusion and the length of each packet.
The amount of data transmitted by 𝜍𝑖𝑑 can be obtained byfusing the received delay-tolerant data once again:
𝜑𝑖Tran = Π𝑖Tra𝜇𝑑𝛿𝑑+ 𝛿𝑜 {(E𝜆)𝑘+1 [Π𝑖
Tra (1 − 𝜇𝑑)] + 1} . (24)
Definition 8. Average data amount of an E2RP (denoted as𝜑RP) refers to the average data amount borne by each E2RP,including the receiving data amount and transmitting dataamount. Since E2RPs only forward the data of far-sink area,therefore, 𝜑RP is the quotient of the total data amount of thefar-sink area and the total number of E2RPs. Suppose that thenode from the sink i is 𝜍𝑖𝑑, the data amount of 𝜍𝑖𝑑 is𝜑𝑖, and thereare 𝑁RP E2RPs in the network, taking an arbitrary annulararea with the distance from the sink 𝑖 | 𝑖 ∈ {0, . . . , 𝑅}, thewidth of 𝑑𝑖, and the angle of 𝑑𝜃, and then the data amount
0.2 0.3 0.4 0.5 0.6 0.7 0.80
20
40
60
80
100
120
140
160
Aver
age d
ata a
mou
nt
Probability of generating data
Nodes on E2RPsOrdinary nodes
Figure 17: Data amount for different nodes.
of the far-sink area can be obtained by integrating the areawith the radius of r-R and the angle of 0-2𝜋. Consequently,the average data amount of an E2RP can be expressed as
𝜑RP = ∫𝑅
𝑟∫2𝜋0𝜑𝑖 𝑖 𝑑𝑖 𝑑𝜃𝑁RP
. (25)
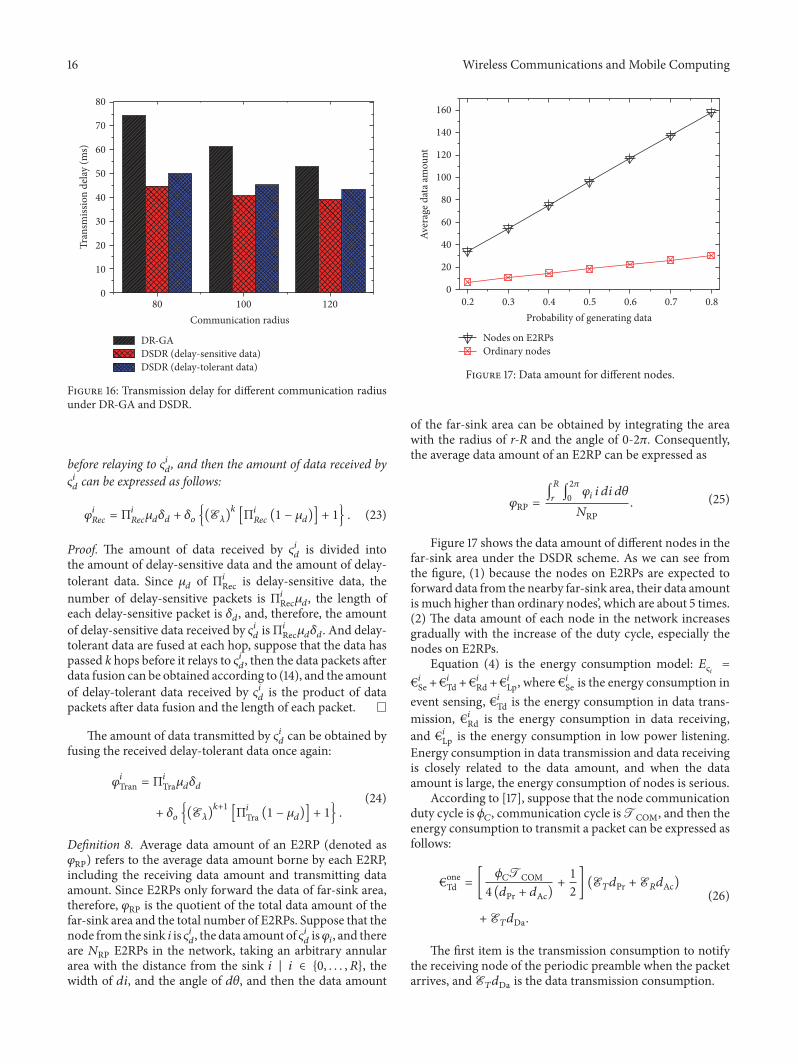
Figure 17 shows the data amount of different nodes in thefar-sink area under the DSDR scheme. As we can see fromthe figure, (1) because the nodes on E2RPs are expected toforward data from the nearby far-sink area, their data amountis much higher than ordinary nodes’, which are about 5 times.(2) The data amount of each node in the network increasesgradually with the increase of the duty cycle, especially thenodes on E2RPs.
Equation (4) is the energy consumption model: 𝐸𝜍𝑖 =€𝑖Se +€𝑖Td +€𝑖Rd +€𝑖Lp, where €𝑖Se is the energy consumption inevent sensing, €𝑖Td is the energy consumption in data trans-mission, €𝑖Rd is the energy consumption in data receiving,and €𝑖Lp is the energy consumption in low power listening.Energy consumption in data transmission and data receivingis closely related to the data amount, and when the dataamount is large, the energy consumption of nodes is serious.
According to [17], suppose that the node communicationduty cycle is 𝜙𝐶, communication cycle isTCOM, and then theenergy consumption to transmit a packet can be expressed asfollows:
€oneTd = [ 𝜙𝐶TCOM4 (𝑑Pr + 𝑑Ac) +
12] (E𝑇𝑑Pr +E𝑅𝑑Ac)+E𝑇𝑑Da.
(26)
The first item is the transmission consumption to notifythe receiving node of the periodic preamble when the packetarrives, and E𝑇𝑑Da is the data transmission consumption.
Wireless Communications and Mobile Computing 17
With the same duty cycle and communication cycle, theenergy consumption to receive a packet can be expressed asfollows:
€oneRd = E𝑅𝑑Pr +E𝑅𝑑Da +E𝑇𝑑Ac, (27)
whereE𝑅𝑑Pr is the energy consumption to receive sequences,E𝑅𝑑Da is the energy consumption to receive data, andE𝑇𝑑Acis the energy consumption to transmit the acknowledgmentmessages to the sending node.
The energy consumption of event sensing is composedof its sleep consumption and sensing consumption. Supposethat the sensing duty cycles of nodes are 𝜙𝑆, the power con-sumption of event sensing isESe, and the power consumptionof sleeping isESl, and then the energy consumption of nodesin a sensing cycle ofTSEN can be expressed as follows:
€TSENSe = [ESe𝜙𝑆 +ESl (1 − 𝜙𝑆)]TSEN. (28)
The energy consumption of low power listening is rela-tively small, according to [14], suppose that 𝜍𝑖𝑑 is the nodewhose distance to the sink is i, its communication duty cycleis 𝜙𝑖𝐶, communication cycle is TCOM, and then the energyconsumption of 𝜍𝑖𝑑 in low power listening can be expressedas follows:
€𝑖Lp = [E𝑅𝜙𝑖𝐶 +ESl (1 − 𝜙𝑖𝐶)]TCOM −I𝑖𝑇 −I
𝑖𝑅. (29)
The energy consumption of nodes in low power listeningconsists of listening consumption and sleeping consumption,that is, [E𝑅𝜙𝑖𝐶 + ESl(1 − 𝜙𝑖𝐶)]TCOM, but it is required tosubtract the consumption of I𝑖
𝑇 and I𝑖𝑅 that have been
calculated in data transmission and receiving.The calculations for I𝑖
𝑇 and I𝑖𝑅 in (29) are given in [14,
43], as shown in
I𝑖𝑇 = {[(1 − 𝜙
𝑖𝐶)TCOM2 + 𝑑Pr + 𝑑Ac]ESl
+E𝑅𝑑Pr} 𝜑𝑖TraTCOM
I𝑖𝑅 = [(𝑑Da + 𝑑Ac)ESl +E𝑅𝑑Pr] 𝜑𝑖Rec
TCOM.
(30)
At this point, the energy consumption of each part for thenode has been given. According to the energy consumptionmodel of this paper, suppose that 𝜍𝑖𝑑 is the node whosedistance to the sink is i, and then the energy consumptionof 𝜍𝑖𝑑 under the DSDR scheme can be expressed as follows:
𝐸𝜍𝑖𝑑= €𝑖Se + €𝑖Td𝜑𝑖Tra + €𝑖Rd𝜑𝑖Rec + €𝑖Lp. (31)
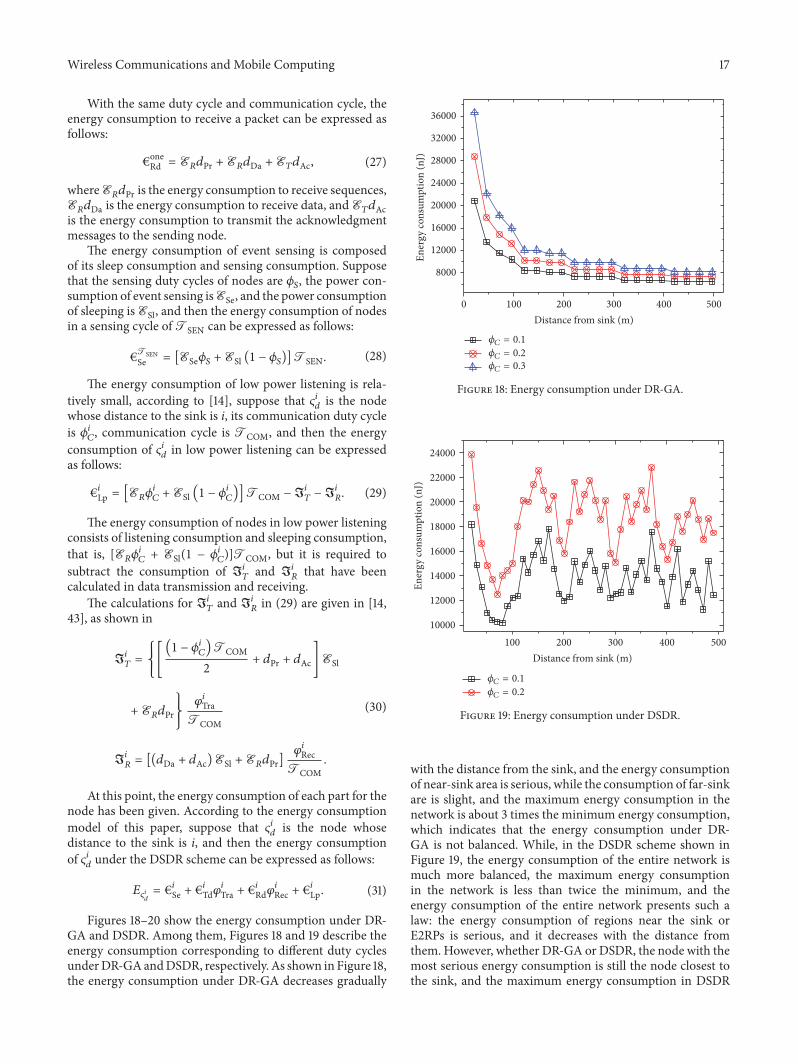
Figures 18–20 show the energy consumption under DR-GA and DSDR. Among them, Figures 18 and 19 describe theenergy consumption corresponding to different duty cyclesunderDR-GAandDSDR, respectively. As shown in Figure 18,the energy consumption under DR-GA decreases gradually
0 100 200 300 400 500
8000
12000
16000
20000
24000
28000
32000
36000
Ener
gy co
nsum
ptio
n (n
J)
Distance from sink (m)
C = 0.2C = 0.3
C = 0.1
Figure 18: Energy consumption under DR-GA.
100 200 300 400 50010000
12000
14000
16000
18000
20000
22000
24000
Ener
gy co
nsum
ptio
n (n
J)
Distance from sink (m)
C = 0.2
C = 0.1
Figure 19: Energy consumption under DSDR.
with the distance from the sink, and the energy consumptionof near-sink area is serious, while the consumption of far-sinkare is slight, and the maximum energy consumption in thenetwork is about 3 times the minimum energy consumption,which indicates that the energy consumption under DR-GA is not balanced. While, in the DSDR scheme shown inFigure 19, the energy consumption of the entire network ismuch more balanced, the maximum energy consumptionin the network is less than twice the minimum, and theenergy consumption of the entire network presents such alaw: the energy consumption of regions near the sink orE2RPs is serious, and it decreases with the distance fromthem. However, whether DR-GA or DSDR, the node with themost serious energy consumption is still the node closest tothe sink, and the maximum energy consumption in DSDR
18 Wireless Communications and Mobile Computing
0 100 200 300 400 500
12000
14000
16000
18000
20000
22000
24000
Ener
gy co
nsum
ptio
n (n
J)
Distance from sink (m)
= [0.1, 0.2]
= [0.2, 0.3]C = 0.2
Figure 20: Energy consumption under different data relevance.
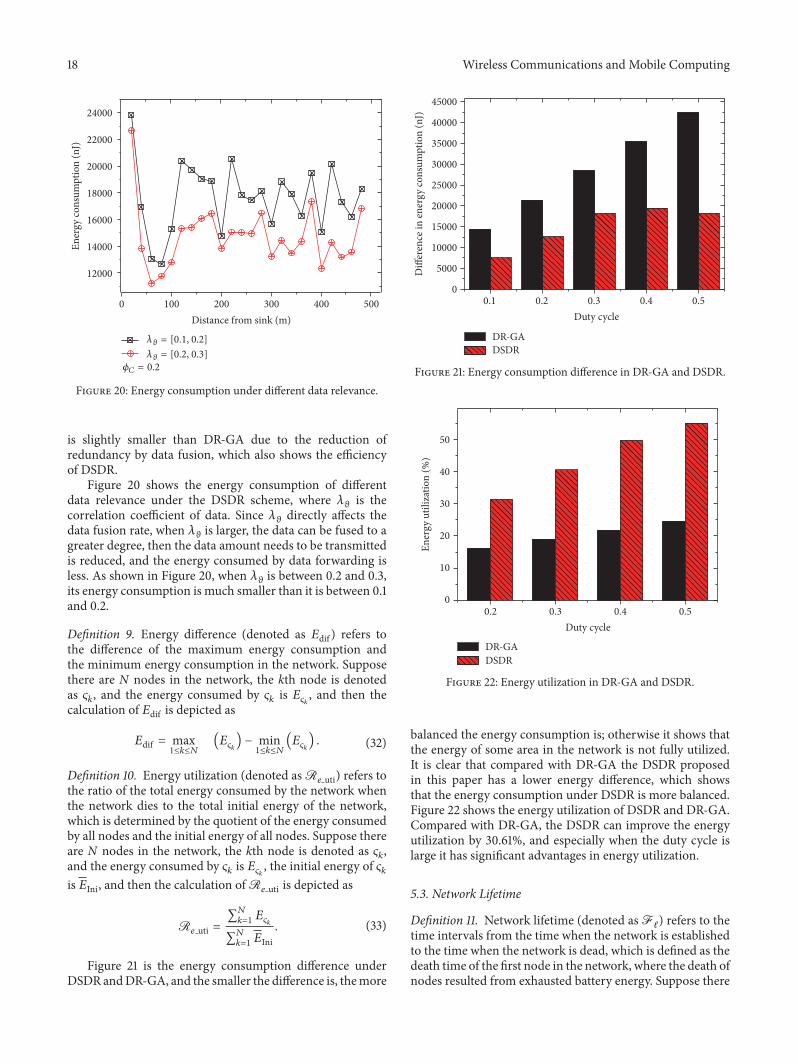
is slightly smaller than DR-GA due to the reduction ofredundancy by data fusion, which also shows the efficiencyof DSDR.
Figure 20 shows the energy consumption of differentdata relevance under the DSDR scheme, where 𝜆𝜗 is thecorrelation coefficient of data. Since 𝜆𝜗 directly affects thedata fusion rate, when 𝜆𝜗 is larger, the data can be fused to agreater degree, then the data amount needs to be transmittedis reduced, and the energy consumed by data forwarding isless. As shown in Figure 20, when 𝜆𝜗 is between 0.2 and 0.3,its energy consumption is much smaller than it is between 0.1and 0.2.
Definition 9. Energy difference (denoted as 𝐸dif ) refers tothe difference of the maximum energy consumption andthe minimum energy consumption in the network. Supposethere are N nodes in the network, the kth node is denotedas 𝜍𝑘, and the energy consumed by 𝜍𝑘 is 𝐸𝜍𝑘 , and then thecalculation of 𝐸dif is depicted as
𝐸dif = max1≤𝑘≤𝑁
(𝐸𝜍𝑘) − min1≤𝑘≤𝑁
(𝐸𝜍𝑘) . (32)
Definition 10. Energy utilization (denoted asR𝑒 uti) refers tothe ratio of the total energy consumed by the network whenthe network dies to the total initial energy of the network,which is determined by the quotient of the energy consumedby all nodes and the initial energy of all nodes. Suppose thereare N nodes in the network, the kth node is denoted as 𝜍𝑘,and the energy consumed by 𝜍𝑘 is 𝐸𝜍𝑘 , the initial energy of 𝜍𝑘is 𝐸Ini, and then the calculation ofR𝑒 uti is depicted as
R𝑒 uti = ∑𝑁𝑘=1 𝐸𝜍𝑘∑𝑁𝑘=1 𝐸Ini
. (33)
Figure 21 is the energy consumption difference underDSDR andDR-GA, and the smaller the difference is, themore
0.1 0.2 0.3 0.4 0.50
5000
10000
15000
20000
25000
30000
35000
40000
45000
Diff
eren
ce in
ener
gy co
nsum
ptio
n (n
J)
Duty cycle
DR-GADSDR
Figure 21: Energy consumption difference in DR-GA and DSDR.
0.2 0.3 0.4 0.50
10
20
30
40
50En
ergy
util
izat
ion
(%)
Duty cycle
DR-GADSDR
Figure 22: Energy utilization in DR-GA and DSDR.
balanced the energy consumption is; otherwise it shows thatthe energy of some area in the network is not fully utilized.It is clear that compared with DR-GA the DSDR proposedin this paper has a lower energy difference, which showsthat the energy consumption under DSDR is more balanced.Figure 22 shows the energy utilization of DSDR and DR-GA.Compared with DR-GA, the DSDR can improve the energyutilization by 30.61%, and especially when the duty cycle islarge it has significant advantages in energy utilization.
5.3. Network Lifetime
Definition 11. Network lifetime (denoted asFℓ) refers to thetime intervals from the time when the network is establishedto the time when the network is dead, which is defined as thedeath time of the first node in the network, where the death ofnodes resulted from exhausted battery energy. Suppose there
Wireless Communications and Mobile Computing 19
0.1 0.2 0.3 0.4 0.5 0.6 0.70
2
4
6
8
10
12
Net
wor
k lif
etim
e (ro
unds
)
Data fusion rate
Figure 23: Network lifetime under different data fusion rate.
0.2 0.3 0.4 0.5 0.60
2
4
6
8
10
Net
wor
k lif
etim
e (ro
unds
)
Duty cycle
DR-GADSDR
Figure 24: Network lifetime in DR-GA and DSDR.
are N nodes in the network, the kth node is denoted as 𝜍𝑘,and the energy consumed by 𝜍𝑘 is 𝐸𝜍𝑘 , the initial energy of 𝜍𝑘is 𝐸Ini, and then theFℓ is depicted as
Fℓ = 𝐸Inimax1≤𝑘≤𝑁𝐸𝜍𝑘 . (34)
Figure 23 shows the network lifetime under different datafusion rate, and the higher the data fusion rate is, the less dataare needed to transmit, the less energy the nodes consume,and the longer the network lifetime is.
Figure 24 is the lifetime comparison of DSDR and DR-GA, although the energy utilization greatly improved underDSDR scheme, the increasing consumption has no impacton network lifetime. What is more, it makes the lifetimehave a certain improvement. This is explained by the factthat, under the DSDR proposed in this paper, we choosedifferent routings for different areas. In the far-sink area weuse E2RPs to transmit data and switch the E2RPs intelligently,so the energy consumption of E2RPs in far-sink area will only
enhance energy utilization and do not affect the maximumenergy consumption of the network. For the near-sink areawe retain the original data routing mode, and the near-sinknodes are often the nodes that affect the entire networklifetime, under the condition that the energy consumptionof these nodes is constant, and the lifetime of the networkremains unchanged. In addition, data redundancy is reducedby data fusion, so the maximum energy consumption underDSDR is smaller than that of DR-GA.
5.4. Effect of Other Parameters on the Performance
(1) The Proportion of Delay-Sensitive Data
Theorem 12. Suppose that there are 𝑁𝑓 nodes in the far-sinkarea of the network, the kth node is denoted as 𝜍𝑘, and the dataamount of 𝜍𝑘 is 𝜑𝜍𝑘 , where 𝜇𝑘𝑑 stands for delay-sensitive data,the transmission delay for delay-sensitive data is 𝐷𝑘
𝑑𝑠, and thetransmission delay for delay-tolerant data is 𝐷𝑘
𝑜𝑟(𝐷𝑘𝑑𝑠 < 𝐷𝑘
𝑜𝑟),and then the average transmission delay of far-sink area can beexpressed as follows:
𝐷𝑓𝑎V𝑔 = ∑1≤𝑘≤𝑁𝑓
[𝜑𝜍𝑘𝜇𝑘𝑑𝐷𝑘𝑑𝑠 + 𝜑𝜍𝑘 (1 − 𝜇𝑘𝑑)𝐷𝑘
𝑜𝑟]𝑁𝑓
. (35)
Proof. The transmission delay of 𝜍𝑘 is composed of the trans-mission delay of delay-sensitive data and the transmissiondelay of delay-tolerant data. Because the delay for the delay-sensitive packet is 𝐷𝑘
ds, and the proportion of the delay-sensitive data to the data amount is𝜇𝑘𝑑, then the delay of delay-sensitive data is 𝜑𝜍𝑘𝜇𝑘𝑑𝐷𝑘
ds. Correspondingly, the delay ofdelay-tolerant data is𝜑𝜍𝑘(1−𝜇𝑘𝑑)𝐷𝑘
or.The average transmissiondelay of far-sink area is obtained by dividing the total delaysinto the number of nodes.
Similar toTheorem 12, suppose that there are𝑁𝑓 nodes inthe far-sink area of the network, the kth node is denoted as 𝜍𝑘,and the data amount of 𝜍𝑘 is 𝜑𝜍𝑘 , where 𝜇𝑘𝑑 stands for delay-sensitive data, the energy consumption to transmit a delay-sensitive packet is €𝑘Td ds, the energy consumption to transmita delay-tolerant packet is €𝑘Td or(€𝑘Td ds > €𝑘Td or), and then theaverage energy consumption of far-sink area can be expressedas follows:
𝐸𝑓avg = ∑1≤𝑘≤𝑁𝑓[𝜑𝜍𝑘𝜇𝑘𝑑€𝑘Td ds + 𝜑𝜍𝑘 (1 − 𝜇𝑘𝑑)€𝑘Td or]𝑁𝑓
. (36)
Figures 25 and 26 show the transmission delay and energyconsumption at different proportion of delay-sensitive dataunder DSDR scheme. In Figure 25, because the delay ofdelay-sensitive data is less than delay-tolerant data, then thehigher the proportion of delay-sensitive data is, the smallerthe average transmission delay of the network is. In Figure 26,the greater the proportion of delay-sensitive data is, the morethe serious energy the network consumes, because the delay-tolerant data are transmitted after data fusion and the dataredundancy is greatly reduced, so energy consumption of
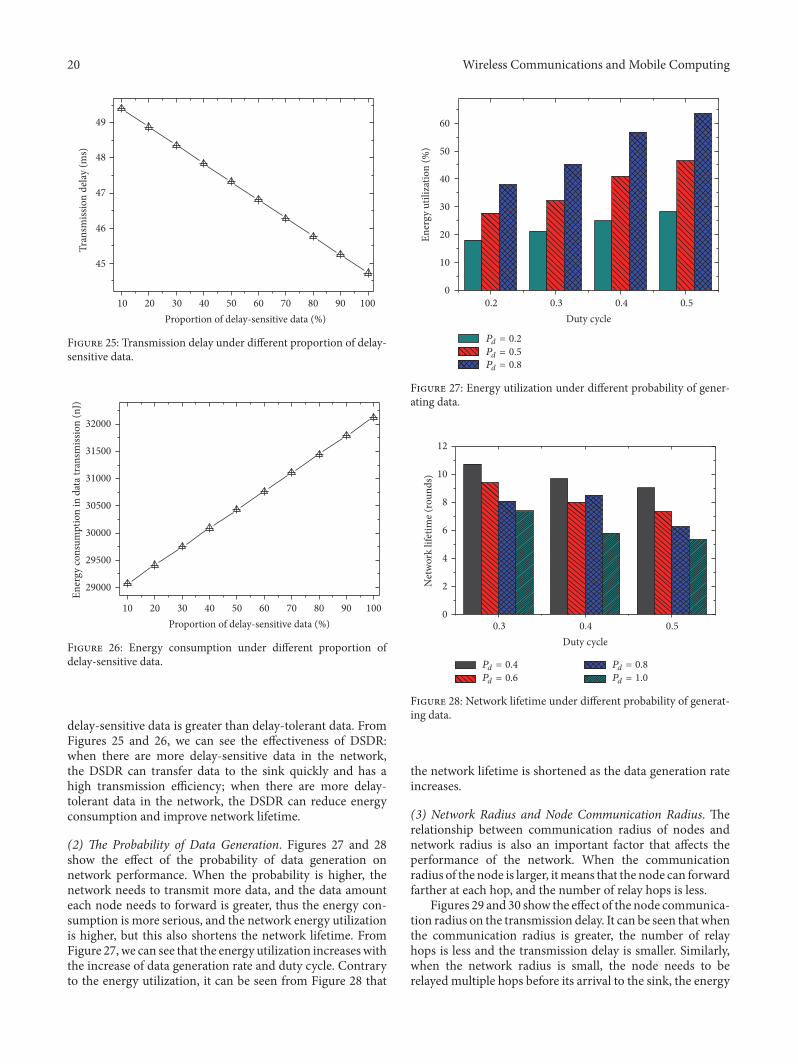
20 Wireless Communications and Mobile Computing
10 20 30 40 50 60 70 80 90 100
45
46
47
48
49
Tran
smiss
ion
delay
(ms)
Proportion of delay-sensitive data (%)
Figure 25: Transmission delay under different proportion of delay-sensitive data.
10 20 30 40 50 60 70 80 90 100
29000
29500
30000
30500
31000
31500
32000
Ener
gy co
nsum
ptio
n in
dat
a tra
nsm
issio
n (n
J)
Proportion of delay-sensitive data (%)
Figure 26: Energy consumption under different proportion ofdelay-sensitive data.
delay-sensitive data is greater than delay-tolerant data. FromFigures 25 and 26, we can see the effectiveness of DSDR:when there are more delay-sensitive data in the network,the DSDR can transfer data to the sink quickly and has ahigh transmission efficiency; when there are more delay-tolerant data in the network, the DSDR can reduce energyconsumption and improve network lifetime.
(2) The Probability of Data Generation. Figures 27 and 28show the effect of the probability of data generation onnetwork performance. When the probability is higher, thenetwork needs to transmit more data, and the data amounteach node needs to forward is greater, thus the energy con-sumption is more serious, and the network energy utilizationis higher, but this also shortens the network lifetime. FromFigure 27, we can see that the energy utilization increaseswiththe increase of data generation rate and duty cycle. Contraryto the energy utilization, it can be seen from Figure 28 that
0.2 0.3 0.4 0.50
10
20
30
40
50
60
Ener
gy u
tiliz
atio
n (%
)
Duty cycle
Pd = 0.2
Pd = 0.5Pd = 0.8
Figure 27: Energy utilization under different probability of gener-ating data.
0.3 0.4 0.50
2
4
6
8
10
12N
etw
ork
lifet
ime (
roun
ds)
Duty cycle
Pd = 0.4
Pd = 0.6
Pd = 0.8
Pd = 1.0
Figure 28: Network lifetime under different probability of generat-ing data.
the network lifetime is shortened as the data generation rateincreases.
(3) Network Radius and Node Communication Radius. Therelationship between communication radius of nodes andnetwork radius is also an important factor that affects theperformance of the network. When the communicationradius of the node is larger, itmeans that the node can forwardfarther at each hop, and the number of relay hops is less.
Figures 29 and 30 show the effect of the node communica-tion radius on the transmission delay. It can be seen that whenthe communication radius is greater, the number of relayhops is less and the transmission delay is smaller. Similarly,when the network radius is small, the node needs to berelayed multiple hops before its arrival to the sink, the energy
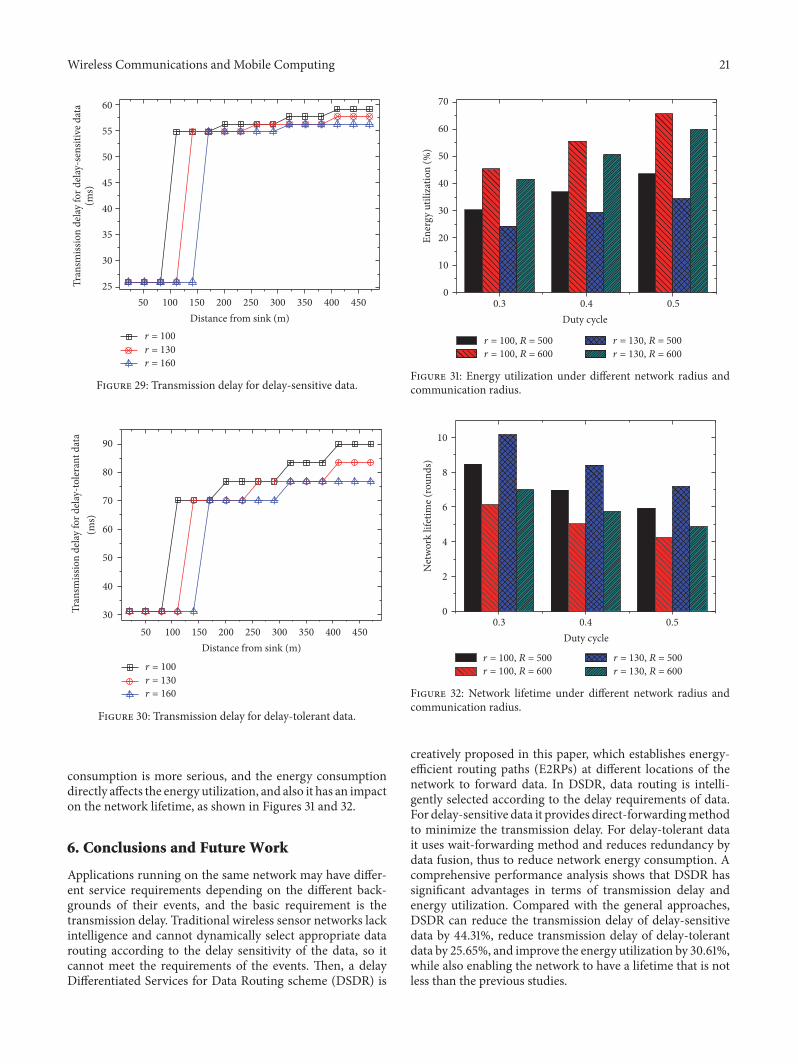
Wireless Communications and Mobile Computing 21
50 100 150 200 250 300 350 400 45025
30
35
40
45
50
55
60(m
s)Tr
ansm
issio
n de
lay fo
r del
ay-s
ensit
ive d
ata
Distance from sink (m)r = 100 r = 130r = 160
Figure 29: Transmission delay for delay-sensitive data.
50 100 150 200 250 300 350 400 45030
40
50
60
70
80
90
(ms)
Tran
smiss
ion
delay
for d
elay
-tole
rant
dat
a
Distance from sink (m)
r = 100r = 130r = 160
Figure 30: Transmission delay for delay-tolerant data.
consumption is more serious, and the energy consumptiondirectly affects the energy utilization, and also it has an impacton the network lifetime, as shown in Figures 31 and 32.
6. Conclusions and Future Work
Applications running on the same network may have differ-ent service requirements depending on the different back-grounds of their events, and the basic requirement is thetransmission delay. Traditional wireless sensor networks lackintelligence and cannot dynamically select appropriate datarouting according to the delay sensitivity of the data, so itcannot meet the requirements of the events. Then, a delayDifferentiated Services for Data Routing scheme (DSDR) is
0.3 0.4 0.50
10
20
30
40
50
60
70
Ener
gy u
tiliz
atio
n (%
)
Duty cycle
r = 100, R = 500r = 100, R = 600
r = 130, R = 500r = 130, R = 600
Figure 31: Energy utilization under different network radius andcommunication radius.
r = 100, R = 500r = 100, R = 600
r = 130, R = 500r = 130, R = 600
0.3 0.4 0.50
2
4
6
8
10N
etw
ork
lifet
ime (
roun
ds)
Duty cycle
Figure 32: Network lifetime under different network radius andcommunication radius.
creatively proposed in this paper, which establishes energy-efficient routing paths (E2RPs) at different locations of thenetwork to forward data. In DSDR, data routing is intelli-gently selected according to the delay requirements of data.For delay-sensitive data it provides direct-forwardingmethodto minimize the transmission delay. For delay-tolerant datait uses wait-forwarding method and reduces redundancy bydata fusion, thus to reduce network energy consumption. Acomprehensive performance analysis shows that DSDR hassignificant advantages in terms of transmission delay andenergy utilization. Compared with the general approaches,DSDR can reduce the transmission delay of delay-sensitivedata by 44.31%, reduce transmission delay of delay-tolerantdata by 25.65%, and improve the energy utilization by 30.61%,while also enabling the network to have a lifetime that is notless than the previous studies.
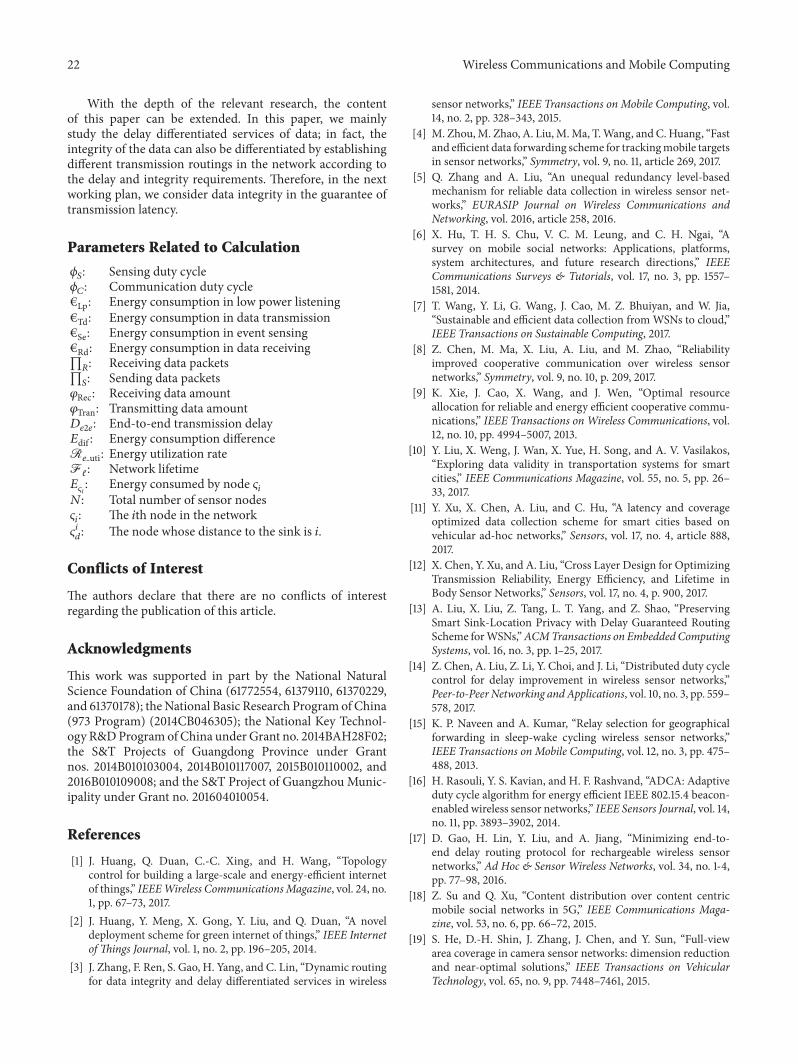
22 Wireless Communications and Mobile Computing
With the depth of the relevant research, the contentof this paper can be extended. In this paper, we mainlystudy the delay differentiated services of data; in fact, theintegrity of the data can also be differentiated by establishingdifferent transmission routings in the network according tothe delay and integrity requirements. Therefore, in the nextworking plan, we consider data integrity in the guarantee oftransmission latency.
Parameters Related to Calculation
𝜙𝑆: Sensing duty cycle𝜙𝐶: Communication duty cycle€Lp: Energy consumption in low power listening€Td: Energy consumption in data transmission€Se: Energy consumption in event sensing€Rd: Energy consumption in data receiving∏𝑅: Receiving data packets∏𝑆: Sending data packets𝜑Rec: Receiving data amount𝜑Tran: Transmitting data amount𝐷𝑒2𝑒: End-to-end transmission delay𝐸dif : Energy consumption differenceR𝑒 uti: Energy utilization rateFℓ: Network lifetime𝐸𝜍𝑖 : Energy consumed by node 𝜍𝑖𝑁: Total number of sensor nodes𝜍𝑖: The 𝑖th node in the network𝜍𝑖𝑑: The node whose distance to the sink is 𝑖.Conflicts of Interest
The authors declare that there are no conflicts of interestregarding the publication of this article.
Acknowledgments
This work was supported in part by the National NaturalScience Foundation of China (61772554, 61379110, 61370229,and 61370178); theNational Basic Research Program of China(973 Program) (2014CB046305); the National Key Technol-ogy R&DProgramof China under Grant no. 2014BAH28F02;the S&T Projects of Guangdong Province under Grantnos. 2014B010103004, 2014B010117007, 2015B010110002, and2016B010109008; and the S&T Project of Guangzhou Munic-ipality under Grant no. 201604010054.
References
[1] J. Huang, Q. Duan, C.-C. Xing, and H. Wang, “Topologycontrol for building a large-scale and energy-efficient internetof things,” IEEEWireless CommunicationsMagazine, vol. 24, no.1, pp. 67–73, 2017.
[2] J. Huang, Y. Meng, X. Gong, Y. Liu, and Q. Duan, “A noveldeployment scheme for green internet of things,” IEEE Internetof Things Journal, vol. 1, no. 2, pp. 196–205, 2014.
[3] J. Zhang, F. Ren, S. Gao, H. Yang, and C. Lin, “Dynamic routingfor data integrity and delay differentiated services in wireless
sensor networks,” IEEE Transactions on Mobile Computing, vol.14, no. 2, pp. 328–343, 2015.
[4] M. Zhou,M. Zhao, A. Liu,M.Ma, T.Wang, and C. Huang, “Fastand efficient data forwarding scheme for trackingmobile targetsin sensor networks,” Symmetry, vol. 9, no. 11, article 269, 2017.
[5] Q. Zhang and A. Liu, “An unequal redundancy level-basedmechanism for reliable data collection in wireless sensor net-works,” EURASIP Journal on Wireless Communications andNetworking, vol. 2016, article 258, 2016.
[6] X. Hu, T. H. S. Chu, V. C. M. Leung, and C. H. Ngai, “Asurvey on mobile social networks: Applications, platforms,system architectures, and future research directions,” IEEECommunications Surveys & Tutorials, vol. 17, no. 3, pp. 1557–1581, 2014.
[7] T. Wang, Y. Li, G. Wang, J. Cao, M. Z. Bhuiyan, and W. Jia,“Sustainable and efficient data collection fromWSNs to cloud,”IEEE Transactions on Sustainable Computing, 2017.
[8] Z. Chen, M. Ma, X. Liu, A. Liu, and M. Zhao, “Reliabilityimproved cooperative communication over wireless sensornetworks,” Symmetry, vol. 9, no. 10, p. 209, 2017.
[9] K. Xie, J. Cao, X. Wang, and J. Wen, “Optimal resourceallocation for reliable and energy efficient cooperative commu-nications,” IEEE Transactions on Wireless Communications, vol.12, no. 10, pp. 4994–5007, 2013.
[10] Y. Liu, X. Weng, J. Wan, X. Yue, H. Song, and A. V. Vasilakos,“Exploring data validity in transportation systems for smartcities,” IEEE Communications Magazine, vol. 55, no. 5, pp. 26–33, 2017.
[11] Y. Xu, X. Chen, A. Liu, and C. Hu, “A latency and coverageoptimized data collection scheme for smart cities based onvehicular ad-hoc networks,” Sensors, vol. 17, no. 4, article 888,2017.
[12] X. Chen, Y. Xu, and A. Liu, “Cross Layer Design for OptimizingTransmission Reliability, Energy Efficiency, and Lifetime inBody Sensor Networks,” Sensors, vol. 17, no. 4, p. 900, 2017.
[13] A. Liu, X. Liu, Z. Tang, L. T. Yang, and Z. Shao, “PreservingSmart Sink-Location Privacy with Delay Guaranteed RoutingScheme forWSNs,”ACMTransactions on Embedded ComputingSystems, vol. 16, no. 3, pp. 1–25, 2017.
[14] Z. Chen, A. Liu, Z. Li, Y. Choi, and J. Li, “Distributed duty cyclecontrol for delay improvement in wireless sensor networks,”Peer-to-Peer Networking and Applications, vol. 10, no. 3, pp. 559–578, 2017.
[15] K. P. Naveen and A. Kumar, “Relay selection for geographicalforwarding in sleep-wake cycling wireless sensor networks,”IEEE Transactions on Mobile Computing, vol. 12, no. 3, pp. 475–488, 2013.
[16] H. Rasouli, Y. S. Kavian, and H. F. Rashvand, “ADCA: Adaptiveduty cycle algorithm for energy efficient IEEE 802.15.4 beacon-enabled wireless sensor networks,” IEEE Sensors Journal, vol. 14,no. 11, pp. 3893–3902, 2014.
[17] D. Gao, H. Lin, Y. Liu, and A. Jiang, “Minimizing end-to-end delay routing protocol for rechargeable wireless sensornetworks,” Ad Hoc & Sensor Wireless Networks, vol. 34, no. 1-4,pp. 77–98, 2016.
[18] Z. Su and Q. Xu, “Content distribution over content centricmobile social networks in 5G,” IEEE Communications Maga-zine, vol. 53, no. 6, pp. 66–72, 2015.
[19] S. He, D.-H. Shin, J. Zhang, J. Chen, and Y. Sun, “Full-viewarea coverage in camera sensor networks: dimension reductionand near-optimal solutions,” IEEE Transactions on VehicularTechnology, vol. 65, no. 9, pp. 7448–7461, 2015.
Wireless Communications and Mobile Computing 23
[20] G. Rajalingham, Y. Gao, Q.-D. Ho, and T. Le-Ngoc, “Quality ofservice differentiation for smart grid Neighbor Area Networksthrough multiple RPL instances,” in Proceedings of the 10thACM Symposium on QoS and Security for Wireless and MobileNetworks, Q2SWinet 2014, pp. 17–24, Canada, September 2014.
[21] J. Gui and K. Zhou, “Flexible adjustments between energy andcapacity for topology control in heterogeneous wireless multi-hop networks,” Journal of Network and Systems Management,vol. 24, no. 4, pp. 789–812, 2016.
[22] L. A. Villas, A. Boukerche, H. S. Ramos, H. A. B. F. De Oliveira,R. B. De Araujo, and A. A. F. Loureiro, “DRINA: A lightweightand reliable routing approach for in-network aggregation inwireless sensor networks,” IEEE Transactions on Computers, vol.62, no. 4, pp. 676–689, 2013.
[23] X. Chen, M. Ma, and A. Liu, “Dynamic Power Managementand Adaptive Packet Size Selection for IoT in e-Healthcare,”Computers & Electrical Engineering, 2017.
[24] Y. Xu, A. Liu, and C. Changqin, “Delay-aware program codesdissemination scheme in internet of everything, mobile infor-mation systems,”Mobile Information Systems, vol. 2016, ArticleID 2436074, 18 pages, 2016.
[25] A. Liu, X. Liu, T. Wei, L. T. Yang, S. Rho, and A. Paul,“Distributed multi-representative re-fusion approach for het-erogeneous sensing data collection,” ACM Transactions onEmbedded Computing Systems, vol. 16, no. 3, Article ID 73, 2017.
[26] J. Wang, A. Liu, T. Yan, and Z. Zeng, “A resource allocationmodel based on double-sided combinational auctions for trans-parent computing,” Peer-to-Peer Networking and Applications,pp. 1–18, 2017.
[27] Z. Su, Q. Xu, H. Zhu, and Y. Wang, “A novel design for contentdelivery over software defined mobile social networks,” IEEENetwork, vol. 29, no. 4, pp. 62–67, 2015.
[28] T. Li, Y. Liu, L. Gao, and A. Liu, “A cooperative-based model forsmart-sensing tasks in fog computing,” IEEE Access, vol. 5, pp.21296–21311, 2017.
[29] A. Liu, Z. Chen, andN.N. Xiong, “AnAdaptiveVirtual RelayingSet Scheme for Loss-and-Delay Sensitive WSNs,” InformationSciences, vol. 424, pp. 118–136, 2018.
[30] W. Chu, L. Wang, H. Xie, Z.-L. Zhang, and Z. Jiang, “Networkdelay guarantee for differentiated services in content-centricnetworking,” Computer Communications, vol. 76, pp. 54–66,2016.
[31] E. Felemban, C.-G. Lee, and E. Ekici, “MMSPEED: multipathmulti-SPEED protocol for QoS guarantee of reliability andtimeliness in wireless sensor networks,” IEEE Transactions onMobile Computing, vol. 5, no. 6, pp. 738–753, 2006.
[32] S. He, J. Chen, X. Li, X. S. Shen, and Y. Sun, “Mobility andintruder prior information improving the barrier coverage ofsparse sensor networks,” IEEE Transactions on Mobile Comput-ing, vol. 13, no. 6, pp. 1268–1282, 2014.
[33] J. Huang, C. Xu, Q. Duan, Y. Ma, and G.-M. Muntean,“Novel end-to-end quality of service provisioning algorithmsfor multimedia services in virtualization-based future internet,”IEEE Transactions on Broadcasting, vol. 58, no. 4, pp. 569–579,2012.
[34] J. Xu, X. Liu, M. Ma, A. Liu, T. Wang, and C. Huang,“Intelligent aggregation based on content routing scheme forcloud computing,” Symmetry, vol. 9, no. 10, 2017.
[35] Q. Xu, Z. Su, and S. Guo, “A game theoretical incentive schemefor relay selection services in mobile social networks,” IEEETransactions on Vehicular Technology, vol. 65, no. 8, pp. 6692–6702, 2016.
[36] X. Liu, G. Li, S. Zhang, and A. Liu, “Big program codedissemination scheme for emergency software-define wirelesssensor networks,” Peer-to-Peer Networking and Applications, pp.1–22, 2017.
[37] L. Li, S. Li, and S. Zhao, “QoS-Aware scheduling of services-oriented internet of things,” IEEE Transactions on IndustrialInformatics, vol. 10, no. 2, pp. 1497–1507, 2014.
[38] C.-T. Cheng, H. Leung, and P. Maupin, “A delay-aware networkstructure for wireless sensor networks with in-network datafusion,” IEEE Sensors Journal, vol. 13, no. 5, pp. 1622–1631, 2013.
[39] C. Dovrolis, D. Stiliadis, and P. Ramanathan, “Proportionaldifferentiated services: delay differentiation and packet schedul-ing,” Computer Communication Review, vol. 29, no. 4, pp. 109–120, 1999.
[40] Q. Liu and A. Liu, “On the hybrid using of unicast-broadcast inwireless sensor networks,” Computers & Electrical Engineering,2017.
[41] K. Xie, X. Wang, J. Wen, and J. Cao, “Cooperative routing withrelay assignment in multi-radio multi-hop wireless networks,”IEEE/ACM Transactions on Networking, vol. 24, no. 2, pp. 859–872, 2016.
[42] H. Xin and X. Liu, “Energy-balanced transmission with accu-rate distances for strip-based wireless sensor networks,” IEEEAccess, vol. 5, pp. 16193–16204, 2017.
[43] Z. Ning, X. Wang, X. Kong, andW. Hou, “A Social-aware groupformation framework for information diffusion in narrowbandinternet of things,” IEEE Internet of Things Journal, 2017.
[44] Z. Su, Q. Xu, M. Fei, and M. Dong, “Game theoretic resourceallocation in media cloud with mobile social users,” IEEETransactions on Multimedia, vol. 18, no. 8, pp. 1650–1660, 2016.
[45] J. Gui, L. Hui, and N. Xiong, “A game-based localized multi-objective topology control scheme in heterogeneous wirelessnetworks,” IEEE Access, vol. 5, pp. 2396–2416, 2017.
[46] H. Dai, G. Chen, C. Wang, S. Wang, X. Wu, and F. Wu,“Quality of energy provisioning for wireless power transfer,”IEEE Transactions on Parallel and Distributed Systems, vol. 26,no. 2, pp. 527–537, 2015.
[47] Y. Liu, A. Liu, S. Guo, Z. Li, Y.-J. Choi, and H. Sekiya, “Context-aware collect data with energy efficient in Cyber-physical cloudsystems,” Future Generation Computer Systems, 2017.
[48] M. Hammoudeh and R. Newman, “Adaptive routing in wirelesssensor networks: QoS optimisation for enhanced applicationperformance,” Information Fusion, vol. 22, pp. 3–15, 2015.

International Journal of
AerospaceEngineeringHindawiwww.hindawi.com Volume 2018
RoboticsJournal of
Hindawiwww.hindawi.com Volume 2018
Hindawiwww.hindawi.com Volume 2018
Active and Passive Electronic Components
VLSI Design
Hindawiwww.hindawi.com Volume 2018
Hindawiwww.hindawi.com Volume 2018
Shock and Vibration
Hindawiwww.hindawi.com Volume 2018
Civil EngineeringAdvances in
Acoustics and VibrationAdvances in
Hindawiwww.hindawi.com Volume 2018
Hindawiwww.hindawi.com Volume 2018
Electrical and Computer Engineering
Journal of
Advances inOptoElectronics
Hindawiwww.hindawi.com
Volume 2018
Hindawi Publishing Corporation http://www.hindawi.com Volume 2013Hindawiwww.hindawi.com
The Scientific World Journal
Volume 2018
Control Scienceand Engineering
Journal of
Hindawiwww.hindawi.com Volume 2018
Hindawiwww.hindawi.com
Journal ofEngineeringVolume 2018
SensorsJournal of
Hindawiwww.hindawi.com Volume 2018
International Journal of
RotatingMachinery
Hindawiwww.hindawi.com Volume 2018
Modelling &Simulationin EngineeringHindawiwww.hindawi.com Volume 2018
Hindawiwww.hindawi.com Volume 2018
Chemical EngineeringInternational Journal of Antennas and
Propagation
International Journal of
Hindawiwww.hindawi.com Volume 2018
Hindawiwww.hindawi.com Volume 2018
Navigation and Observation
International Journal of
Hindawi
www.hindawi.com Volume 2018
Advances in
Multimedia
Submit your manuscripts atwww.hindawi.com