Embed Size (px)
Citation preview
Green Building Market Opportunities
Presented At:
Scrap to Profit SymposiumHotel Solamar, San Diego, CA
Presenter:
Stephen L. KappTechnology Resources Manager
California Center for Sustainable Energy
5/7/08
2
Agenda
� Introductions
� Green Perspectives
� Sustainable Development
� Green Buildings Overview
� Voluntary vs. Mandatory Programs
� USGBC’s LEED Rating System
� Opportunities for Tire Derived Products
� Planning for Success
� Question & Answer
AG
EN
DA
3
Introductions
4
Stephen L. Kapp, CEM, CDSM, LEED®-AP
SP
EA
KE
R� Stephen Kapp is Technology Resources Manager for the California Center for Sustainable Energy (CCSE) with over 20 years experience in the energy, green building, software and Internet industries. He serves as the organization’s expert on energy management, efficiency, resource conservation, renewable energy and green building design. His previous work experience includes building design & drafting, business development, marketing, product management, sales engineering, consulting, and project management.
� He is a Certified Energy Manager (CEM), Certified Demand Side Manager (CDSM) and a LEED™ Accredited Professional. Steve received a Bachelor of Science degree in Environmental Studies at San Jose State University where he completed an Emphasis Program in Energy Resource Management and Solar Architectural Design.
5
Who is CCSE? CC
SE
Vision:Vision:Creating a sustainable energy futureCreating a sustainable energy future
Mission:Mission:To foster public policies and provide To foster public policies and provide programs, services, information and programs, services, information and forums that facilitate the adoption of forums that facilitate the adoption of clean, reliable, renewable, clean, reliable, renewable, sustainable, and efficient energy sustainable, and efficient energy technologies and practices.technologies and practices.
6
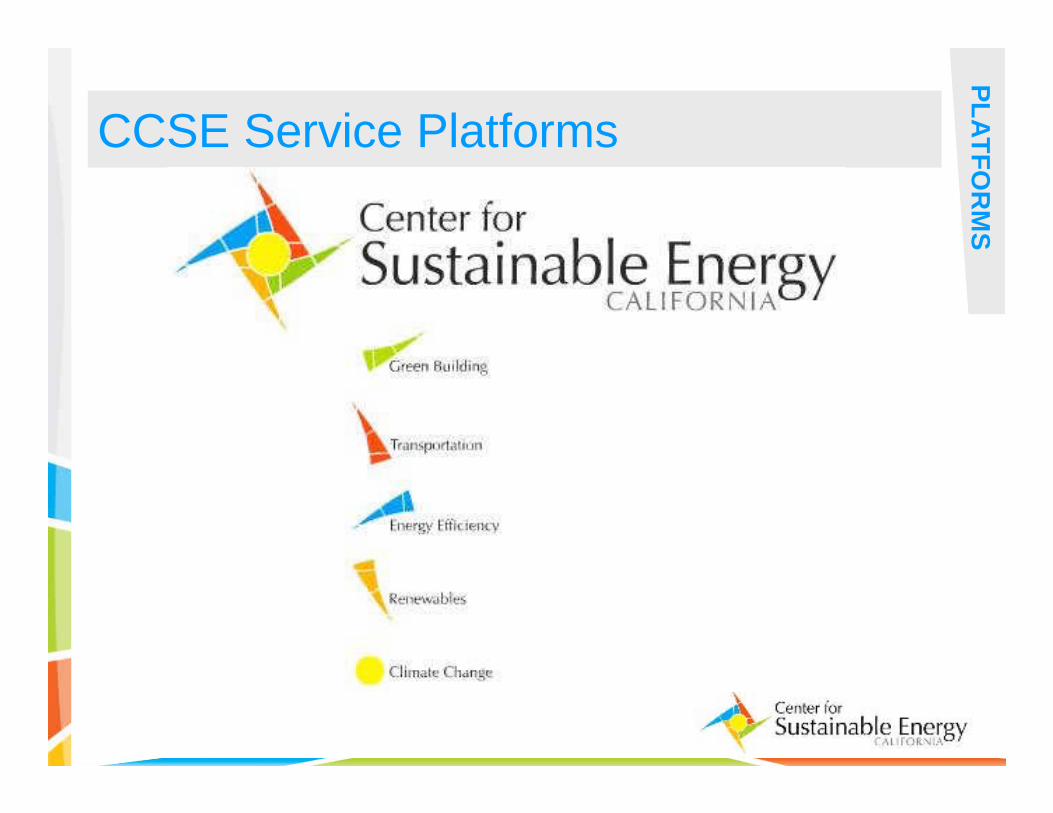
CCSE Service Platforms
PL
AT
FO
RM
S
7
Green Perspectives
8
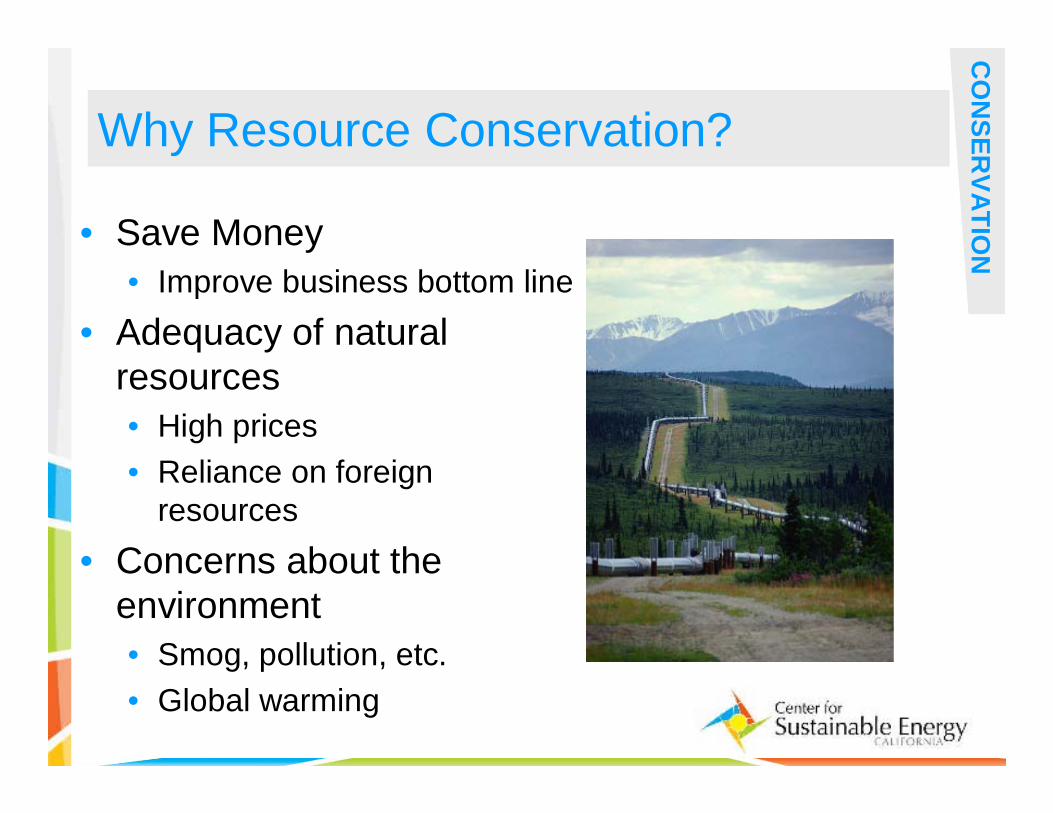
Why Resource Conservation?
CO
NS
ER
VA
TIO
N• Save Money
• Improve business bottom line
• Adequacy of natural resources
• High prices
• Reliance on foreign resources
• Concerns about the environment
• Smog, pollution, etc.
• Global warming
9
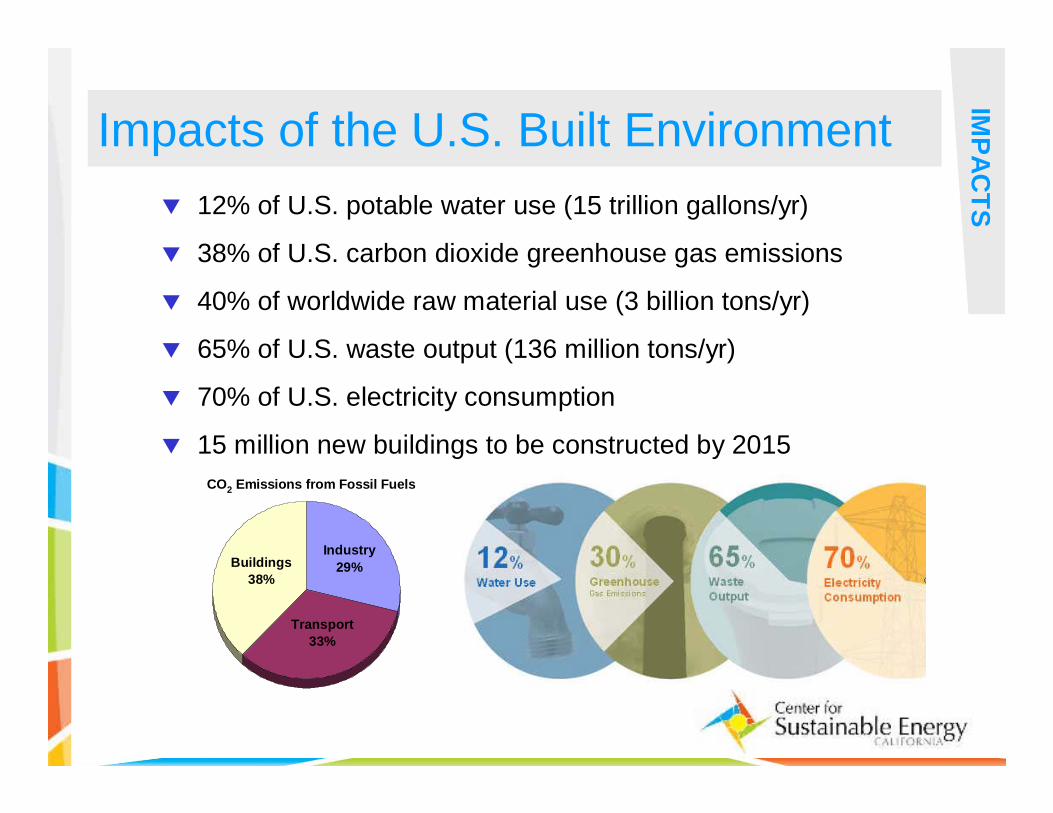
Impacts of the U.S. Built Environment
IMP
AC
TS� 12% of U.S. potable water use (15 trillion gallons/yr)
� 38% of U.S. carbon dioxide greenhouse gas emissions
� 40% of worldwide raw material use (3 billion tons/yr)
� 65% of U.S. waste output (136 million tons/yr)
� 70% of U.S. electricity consumption
� 15 million new buildings to be constructed by 2015
CO2 Emissions from Fossil Fuels
Transport
33%
Buildings
38%
Industry
29%
10
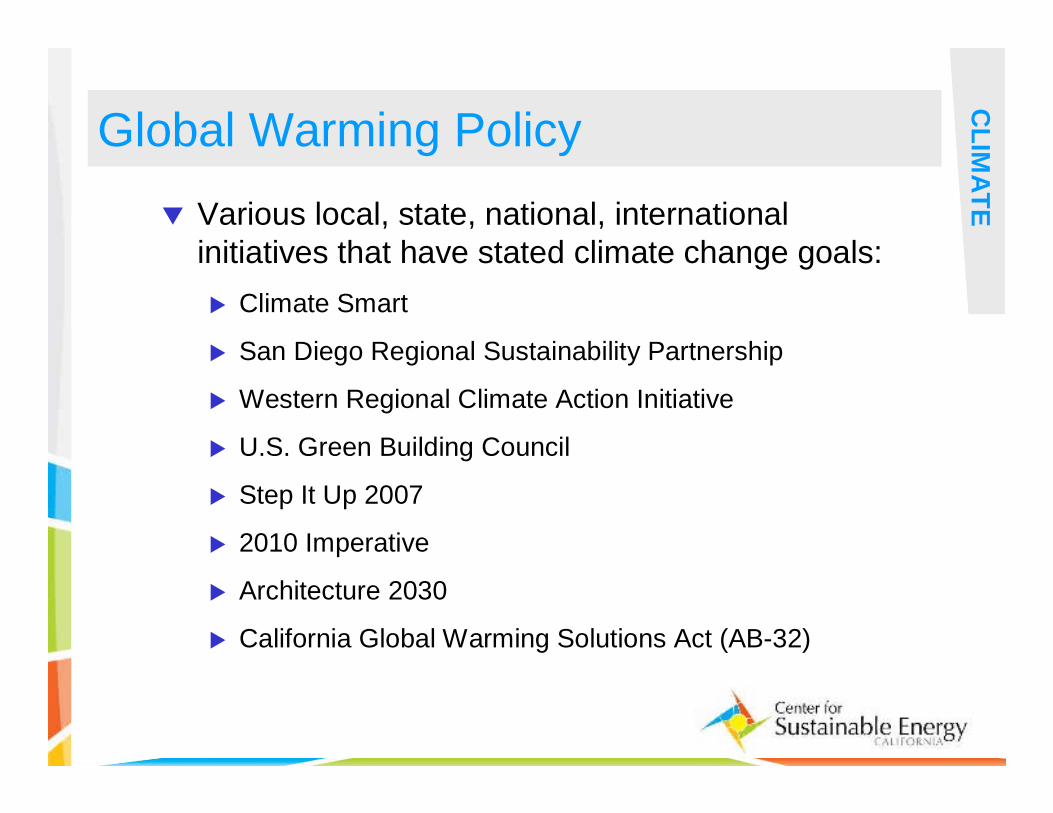
Global Warming Policy
CL
IMA
TE� Various local, state, national, international
initiatives that have stated climate change goals:
� Climate Smart
� San Diego Regional Sustainability Partnership
� Western Regional Climate Action Initiative
� U.S. Green Building Council
� Step It Up 2007
� 2010 Imperative
� Architecture 2030
� California Global Warming Solutions Act (AB-32)
11
Sustainable Development
12
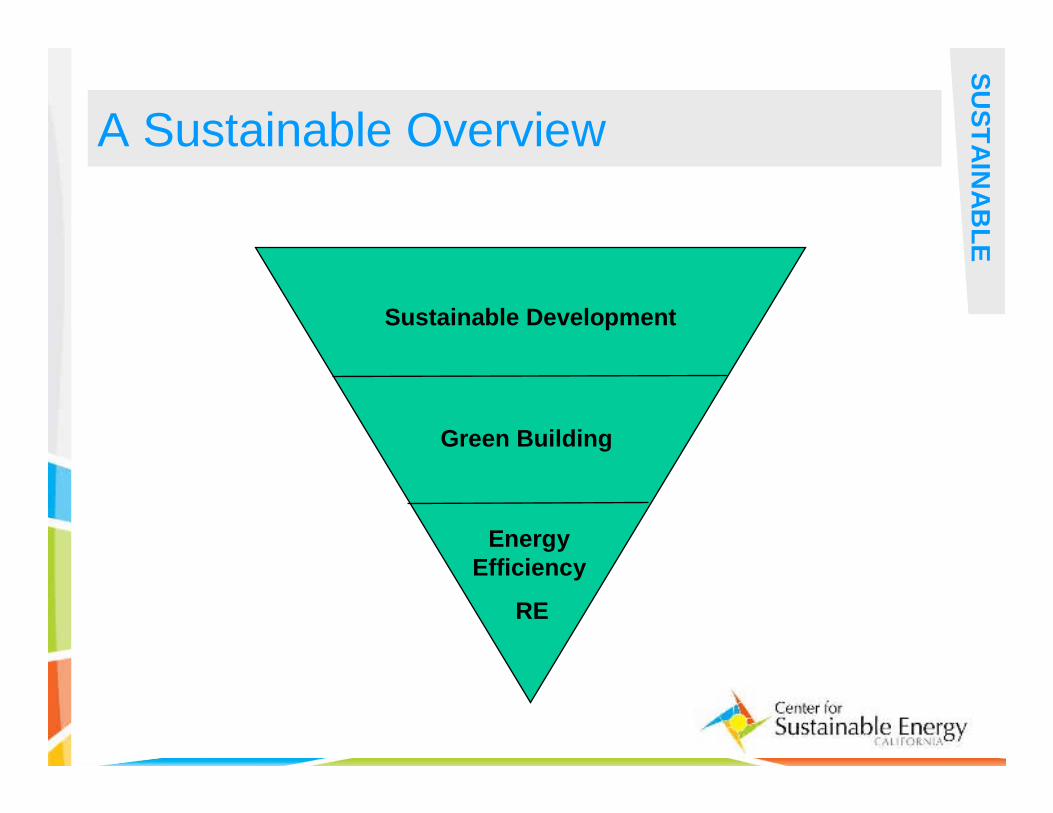
A Sustainable Overview
SU
ST
AIN
AB
LE
Sustainable Development
Green Building
EnergyEfficiency
RE
13
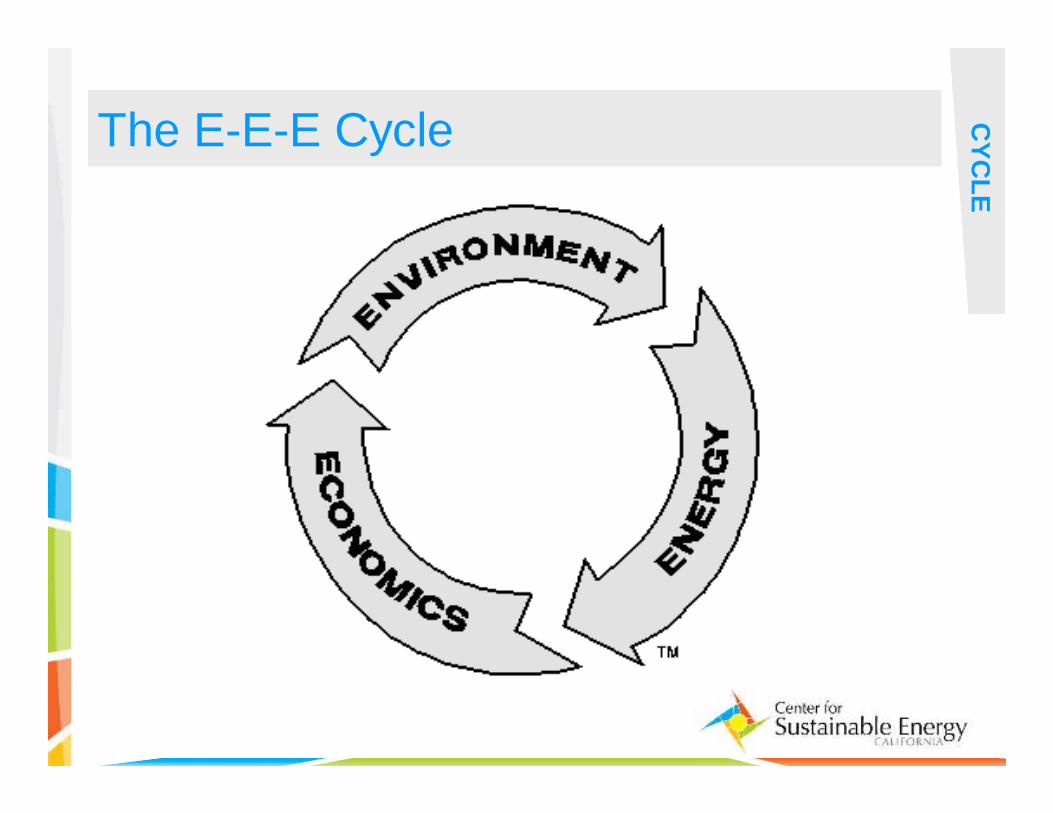
The E-E-E Cycle CY
CL
E
14
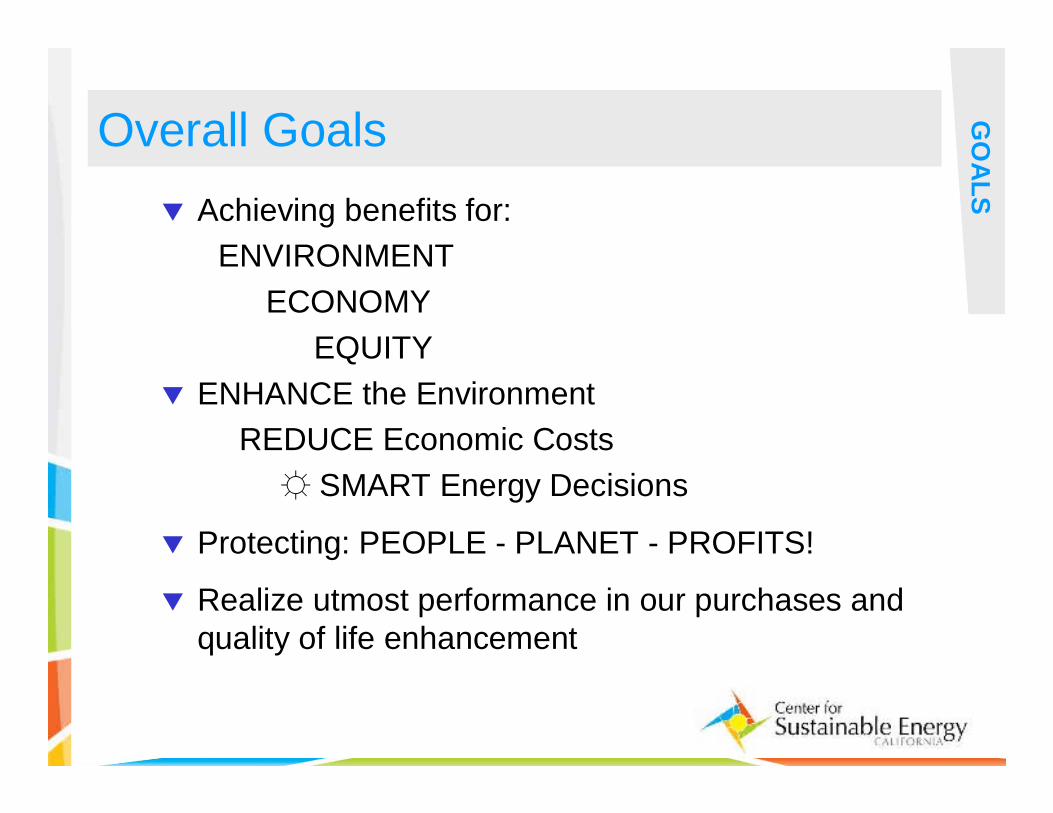
Overall Goals
GO
AL
S
� Achieving benefits for:
ENVIRONMENT
ECONOMY
EQUITY
� ENHANCE the Environment
REDUCE Economic Costs
☼ SMART Energy Decisions
� Protecting: PEOPLE - PLANET - PROFITS!
� Realize utmost performance in our purchases and quality of life enhancement
15
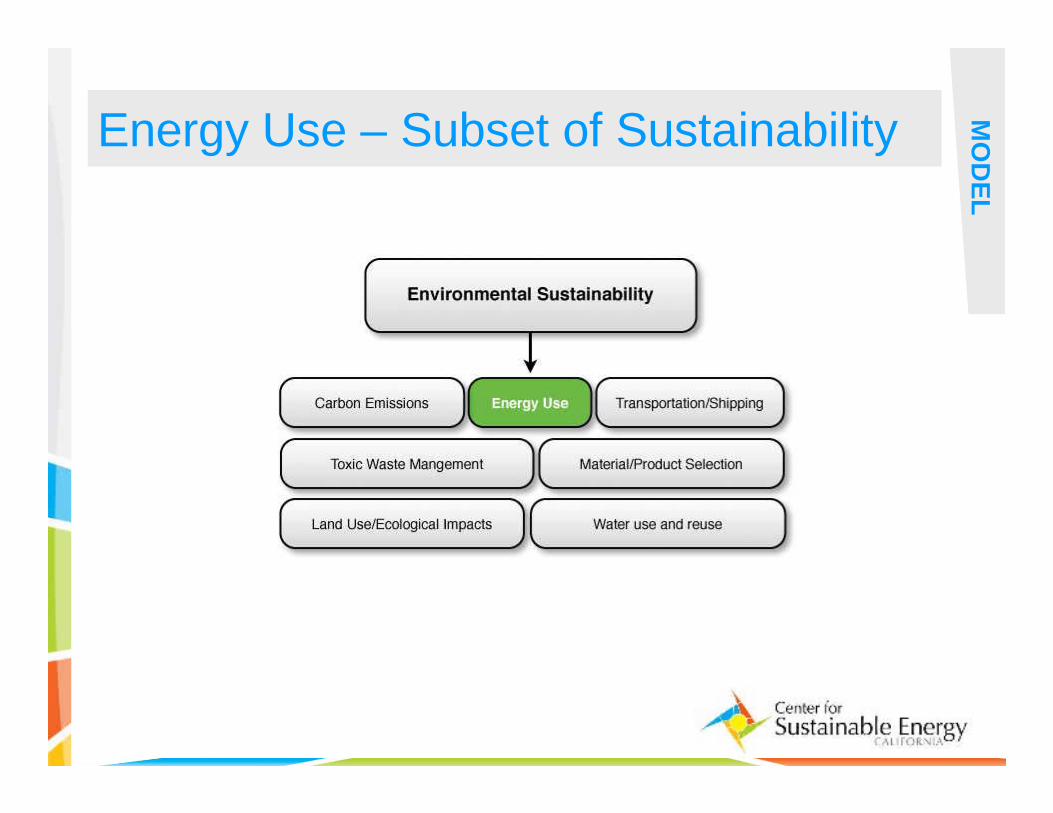
Energy Use – Subset of Sustainability
MO
DE
L
16
Green Buildings Overview
17
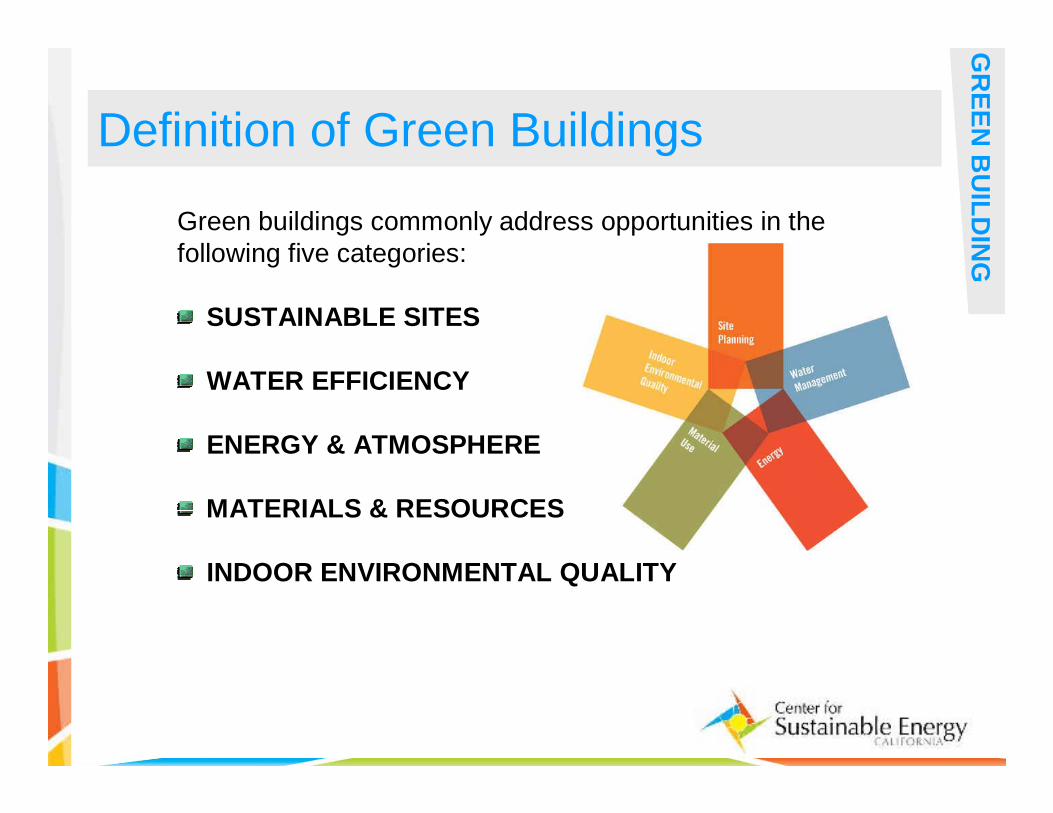
Definition of Green Buildings
GR
EE
N B
UIL
DIN
G
Green buildings commonly address opportunities in the following five categories:
SUSTAINABLE SITES
WATER EFFICIENCY
ENERGY & ATMOSPHERE
MATERIALS & RESOURCES
INDOOR ENVIRONMENTAL QUALITY
18
Definition of Green Buildings
GR
EE
N B
UIL
DIN
G“Green Building” ultimately is a process (not just
products and technologies) to create buildings and supporting infrastructure that…
� Minimize the use of resources
� Minimize harmful effects on the environment
� Create healthier environments for people
19
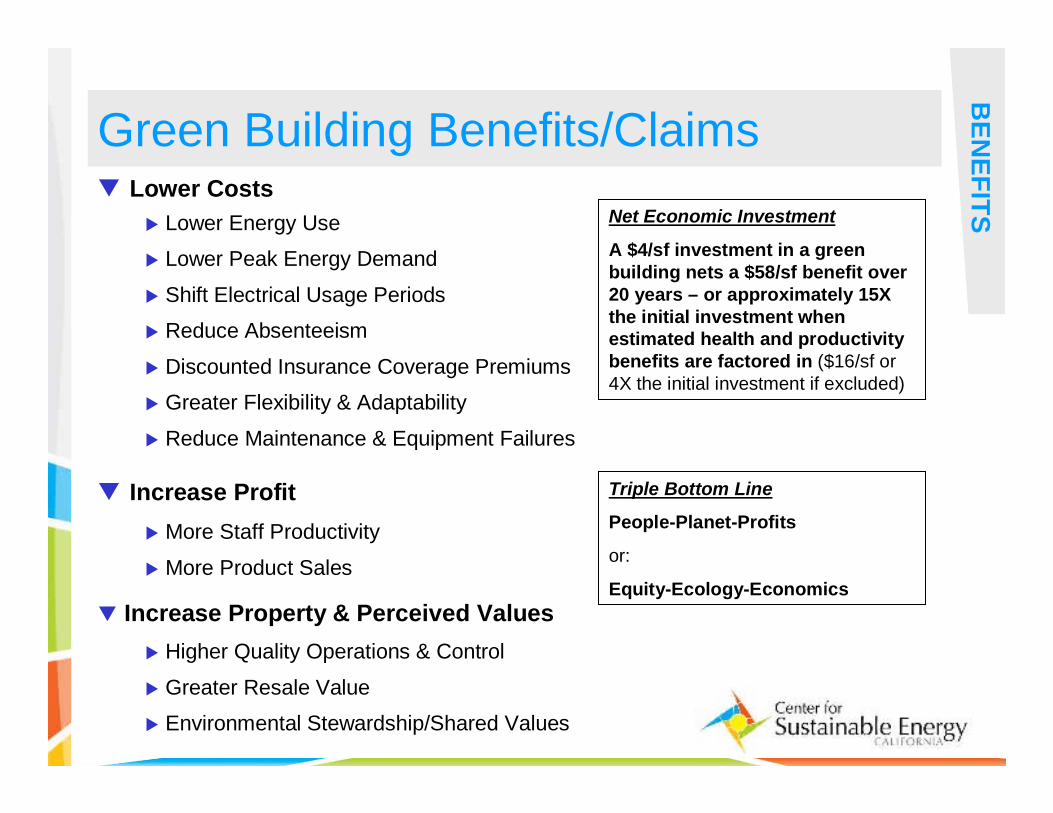
Green Building Benefits/Claims
BE
NE
FIT
S
� Lower Costs
� Lower Energy Use
� Lower Peak Energy Demand
� Shift Electrical Usage Periods
� Reduce Absenteeism
� Discounted Insurance Coverage Premiums
� Greater Flexibility & Adaptability
� Reduce Maintenance & Equipment Failures
� Increase Profit
� More Staff Productivity
� More Product Sales
� Increase Property & Perceived Values
� Higher Quality Operations & Control
� Greater Resale Value
� Environmental Stewardship/Shared Values
Net Economic Investment
A $4/sf investment in a green building nets a $58/sf benefit over 20 years – or approximately 15X the initial investment when estimated health and productivity benefits are factored in ($16/sf or 4X the initial investment if excluded)
Triple Bottom Line
People-Planet-Profits
or:
Equity-Ecology-Economics
20
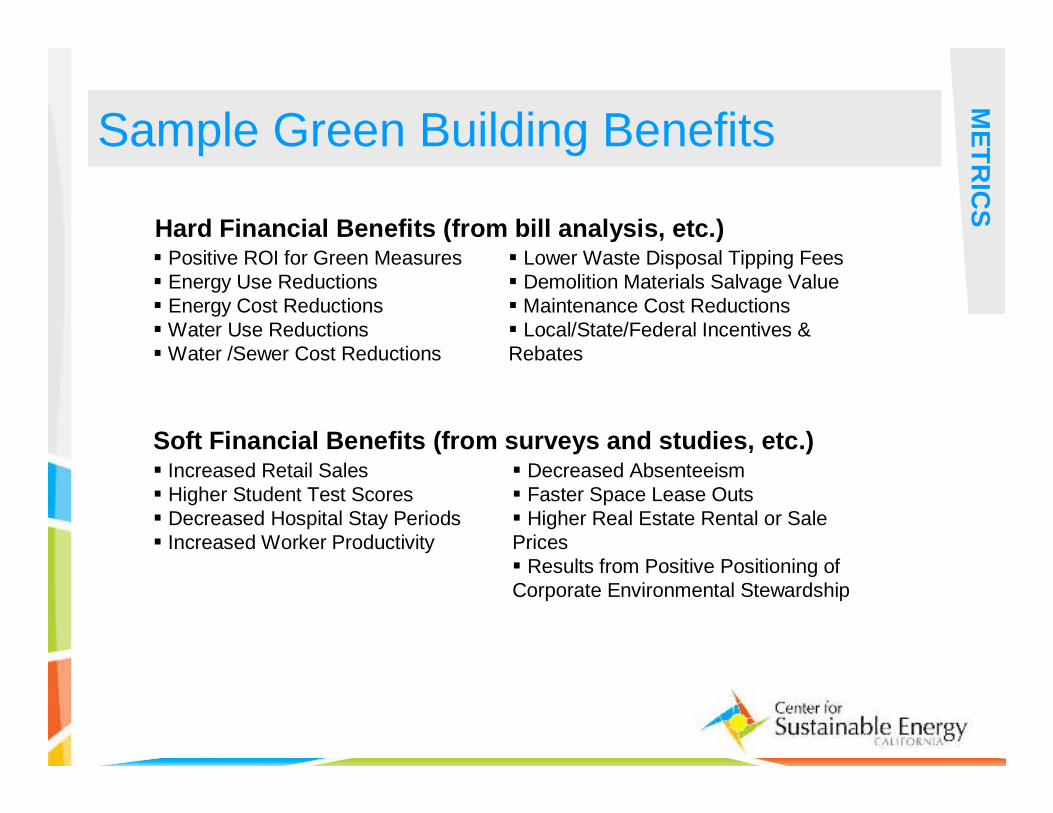
Sample Green Building Benefits
ME
TR
ICS
Hard Financial Benefits (from bill analysis, etc.)� Lower Waste Disposal Tipping Fees� Demolition Materials Salvage Value� Maintenance Cost Reductions� Local/State/Federal Incentives & Rebates
� Positive ROI for Green Measures� Energy Use Reductions� Energy Cost Reductions� Water Use Reductions� Water /Sewer Cost Reductions
Soft Financial Benefits (from surveys and studies, etc.)� Decreased Absenteeism� Faster Space Lease Outs� Higher Real Estate Rental or Sale Prices� Results from Positive Positioning of Corporate Environmental Stewardship
� Increased Retail Sales� Higher Student Test Scores� Decreased Hospital Stay Periods� Increased Worker Productivity
21
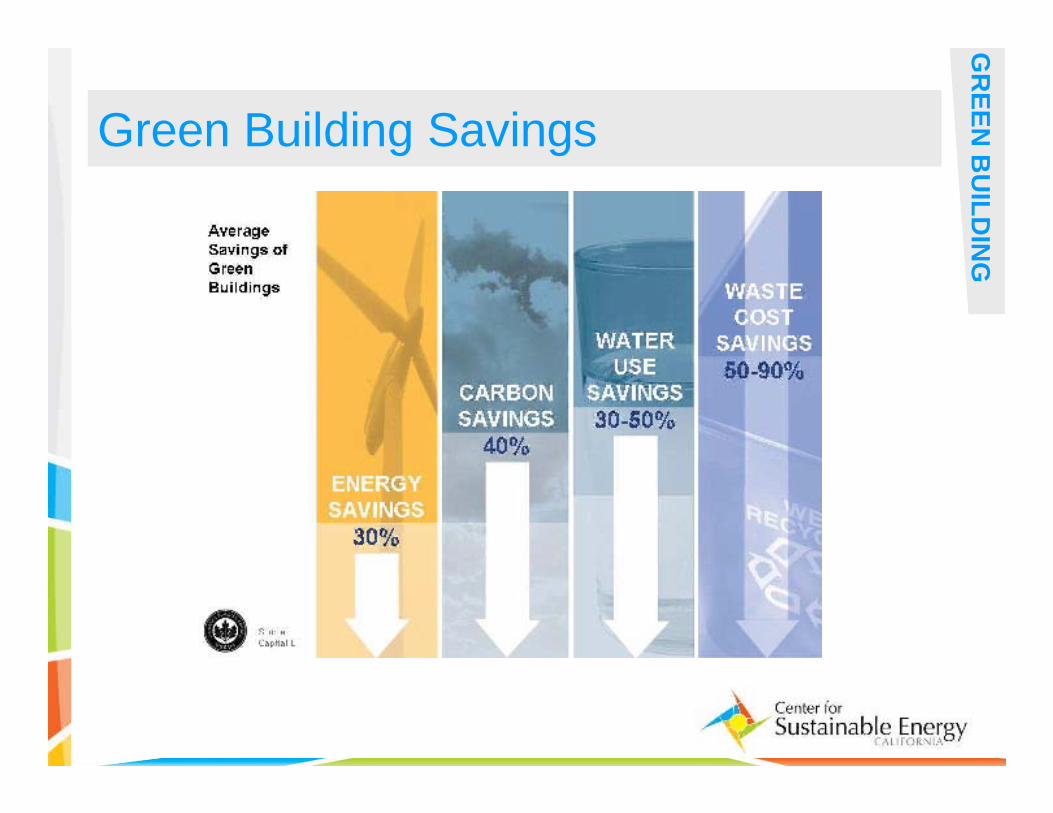
Green Building Savings
GR
EE
N B
UIL
DIN
G
22
Voluntary vs. Mandatory
23
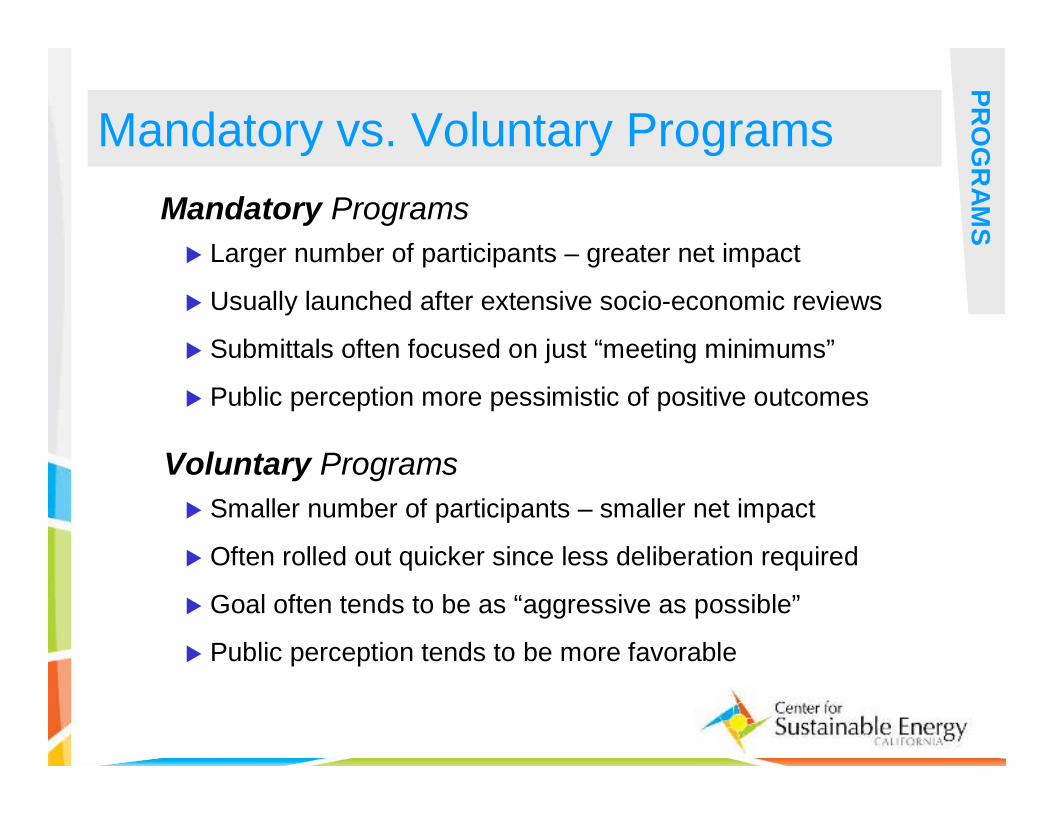
Mandatory vs. Voluntary Programs
PR
OG
RA
MS
� Larger number of participants – greater net impact
� Usually launched after extensive socio-economic reviews
� Submittals often focused on just “meeting minimums”
� Public perception more pessimistic of positive outcomes
Mandatory Programs
� Smaller number of participants – smaller net impact
� Often rolled out quicker since less deliberation required
� Goal often tends to be as “aggressive as possible”
� Public perception tends to be more favorable
Voluntary Programs
24
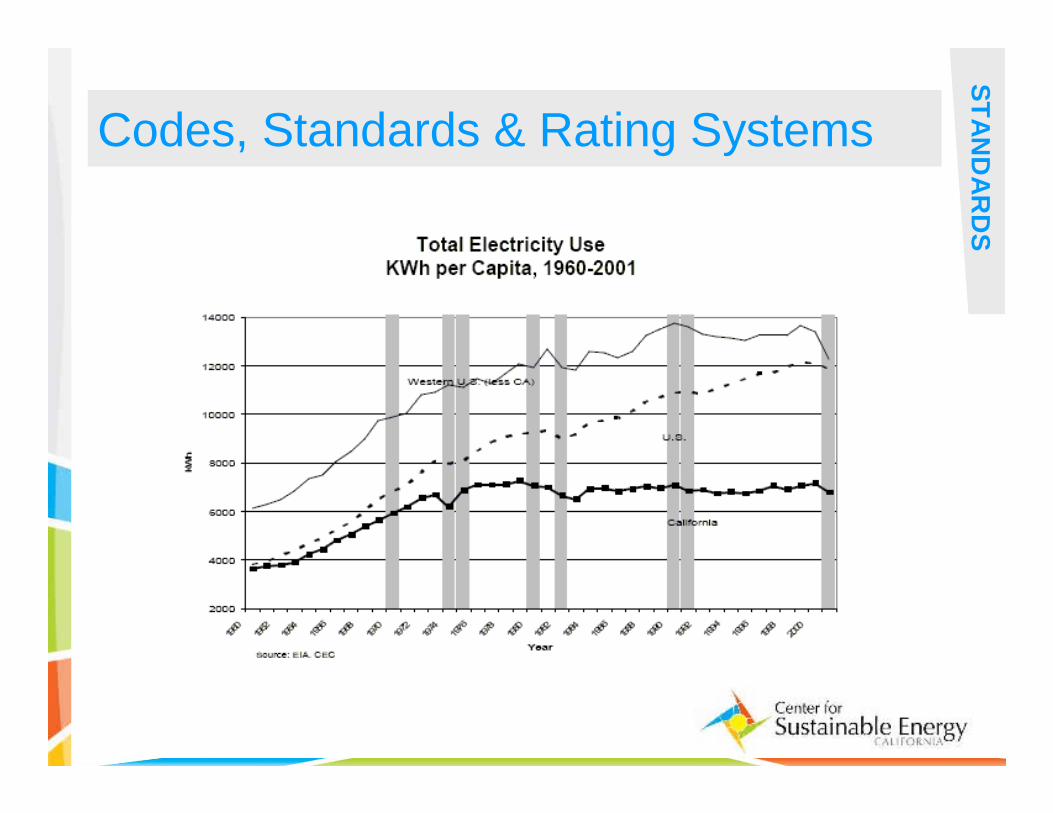
Codes, Standards & Rating Systems
ST
AN
DA
RD
S
25
26
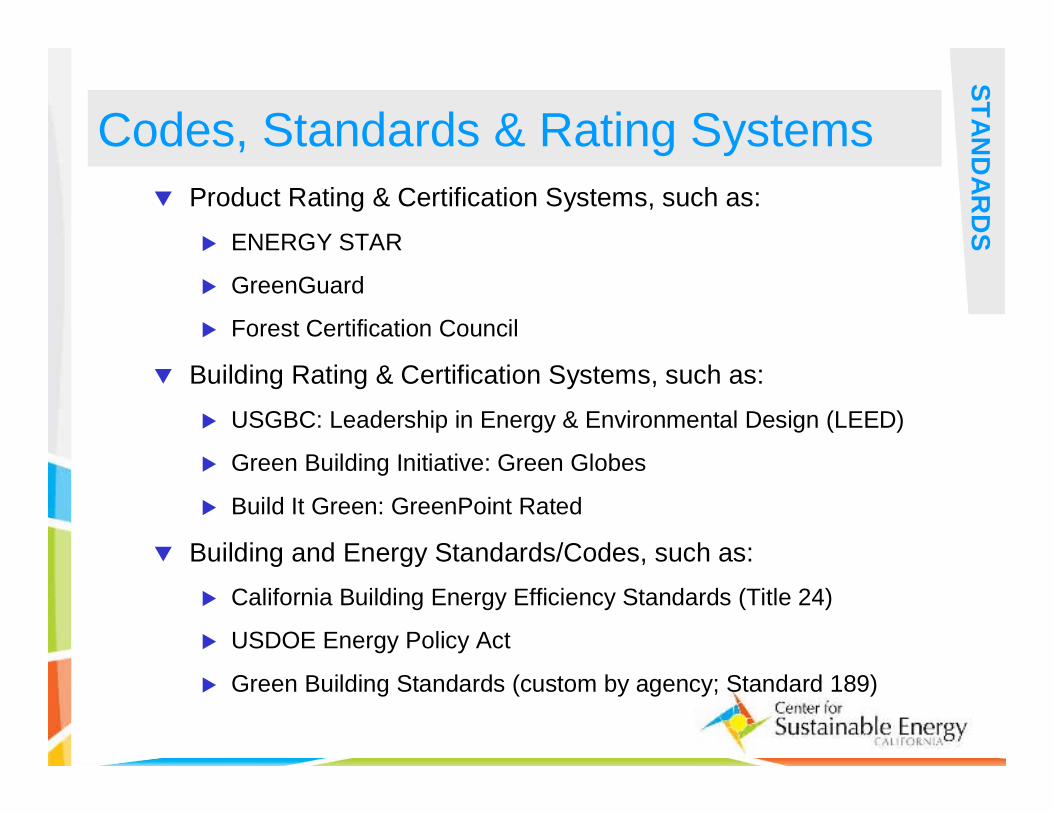
Codes, Standards & Rating Systems
ST
AN
DA
RD
S
� Product Rating & Certification Systems, such as:
� ENERGY STAR
� GreenGuard
� Forest Certification Council
� Building Rating & Certification Systems, such as:
� USGBC: Leadership in Energy & Environmental Design (LEED)
� Green Building Initiative: Green Globes
� Build It Green: GreenPoint Rated
� Building and Energy Standards/Codes, such as:
� California Building Energy Efficiency Standards (Title 24)
� USDOE Energy Policy Act
� Green Building Standards (custom by agency; Standard 189)
27
USGBC LEED® Rating System
28
29
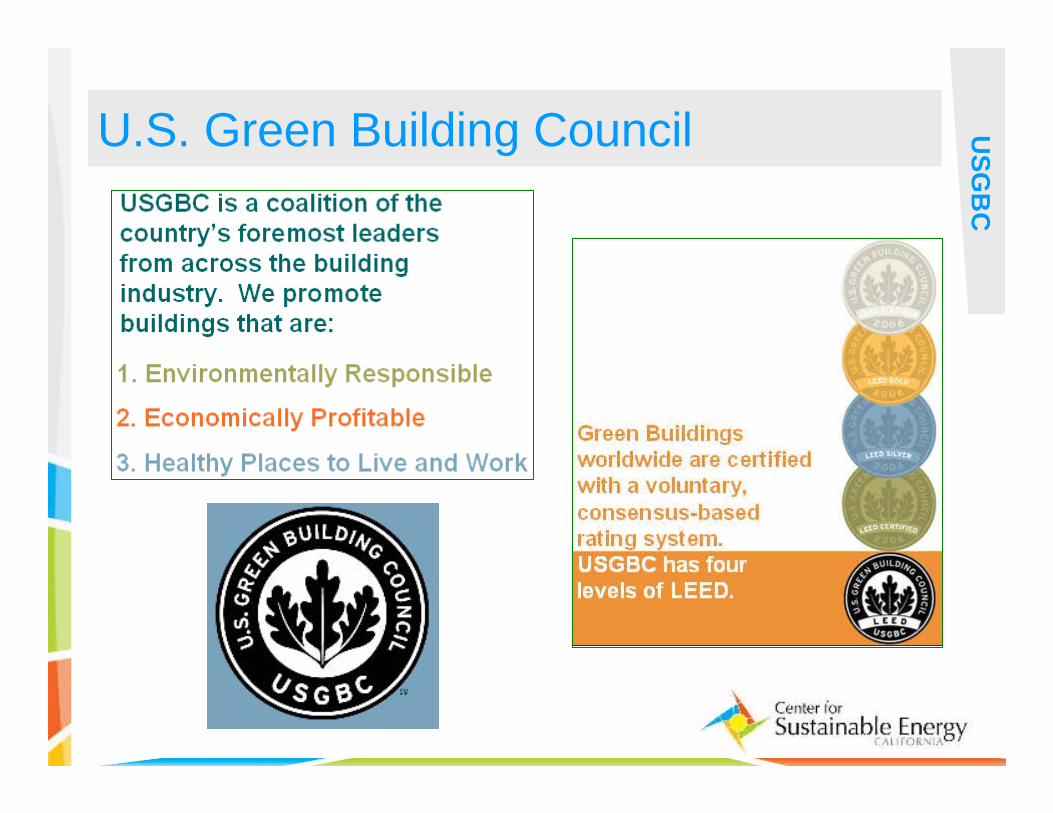
U.S. Green Building Council US
GB
C
30
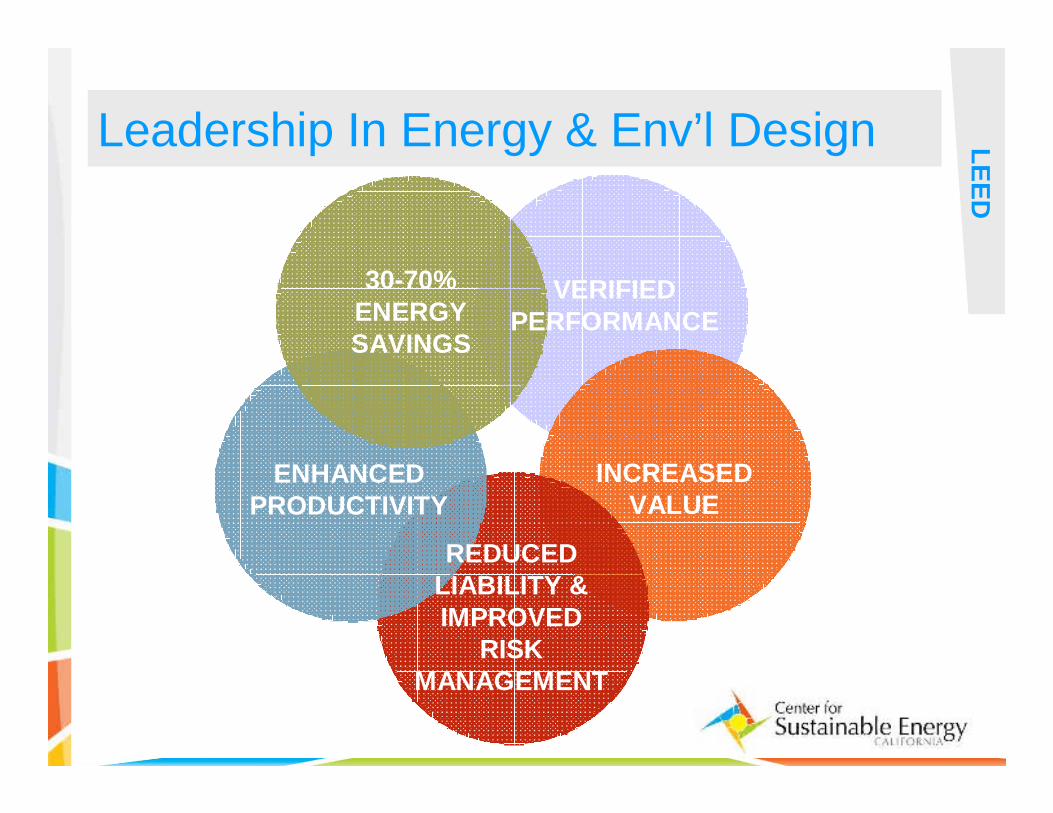
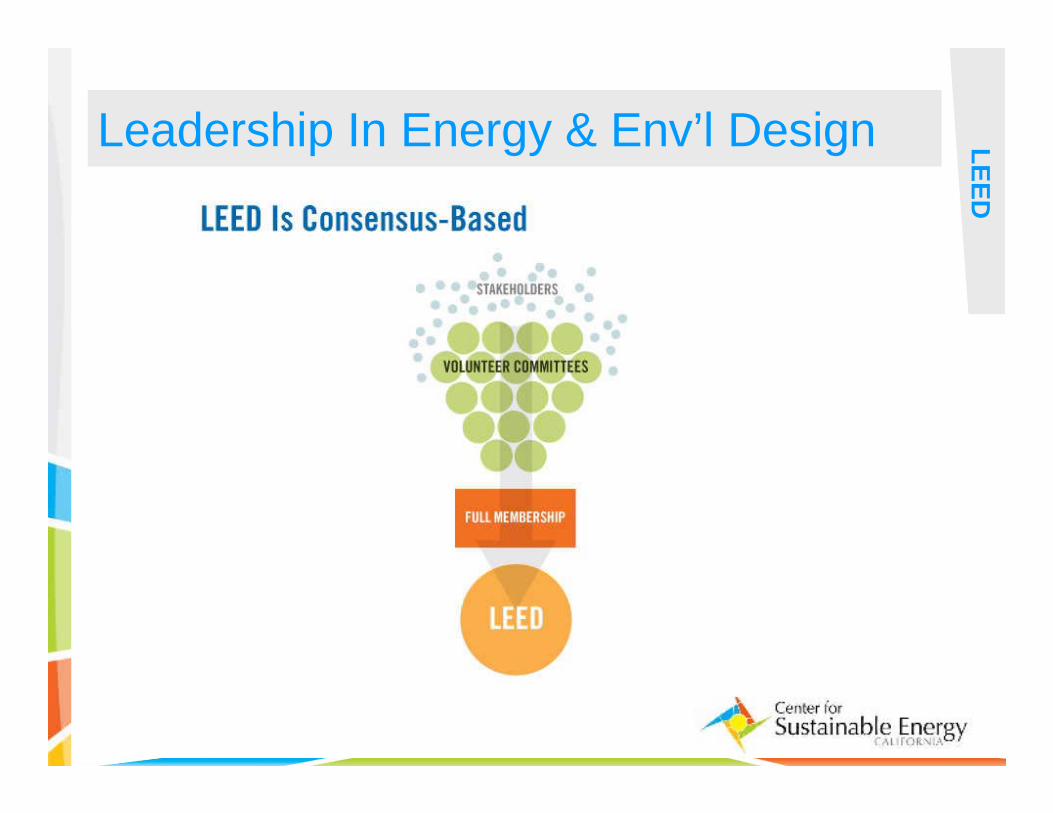
Leadership In Energy & Env’l Design
30-70% ENERGY SAVINGS
VERIFIEDPERFORMANCE
ENHANCEDPRODUCTIVITY
REDUCEDLIABILITY &IMPROVED
RISKMANAGEMENT
INCREASEDVALUE
LE
ED
LE
ED
LE
ED
32
LEED®…U
SG
BC
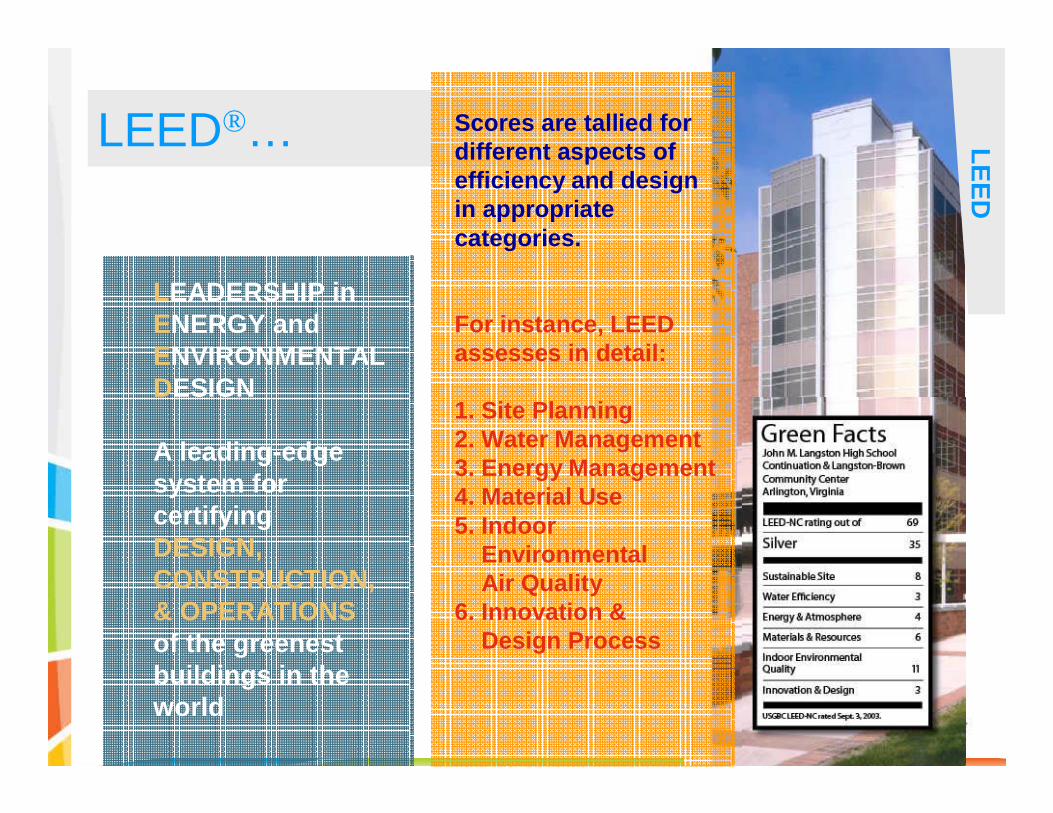
LEADERSHIP inENERGY andENVIRONMENTALDESIGN
A leading-edge system for certifyingDESIGN, CONSTRUCTION, & OPERATIONSof the greenest buildings in the world
Scores are tallied for different aspects of efficiency and design in appropriate categories.
For instance, LEED assesses in detail:
1. Site Planning2. Water Management3. Energy Management4. Material Use5. Indoor
EnvironmentalAir Quality
6. Innovation &Design Process
LE
ED
LE
ED
33
Leadership In Energy & Env’l Design LE
ED
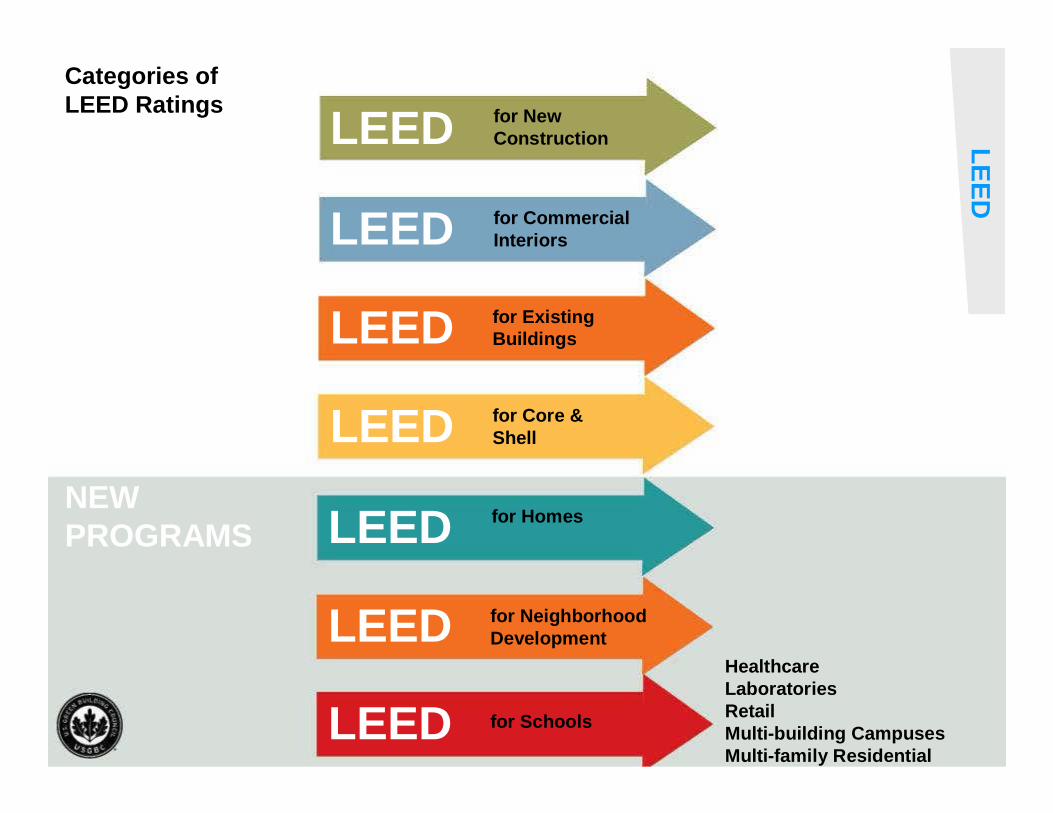
Categories of LEED Ratings
LEED
LEED
LEED
LEED
LEED
LEED
LEED
for NewConstruction
for CommercialInteriors
for ExistingBuildings
for Core &Shell
for Homes
for NeighborhoodDevelopment
for Schools
HealthcareLaboratoriesRetailMulti-building CampusesMulti-family Residential
NEWPROGRAMS
LE
ED
LE
ED

35

36
37
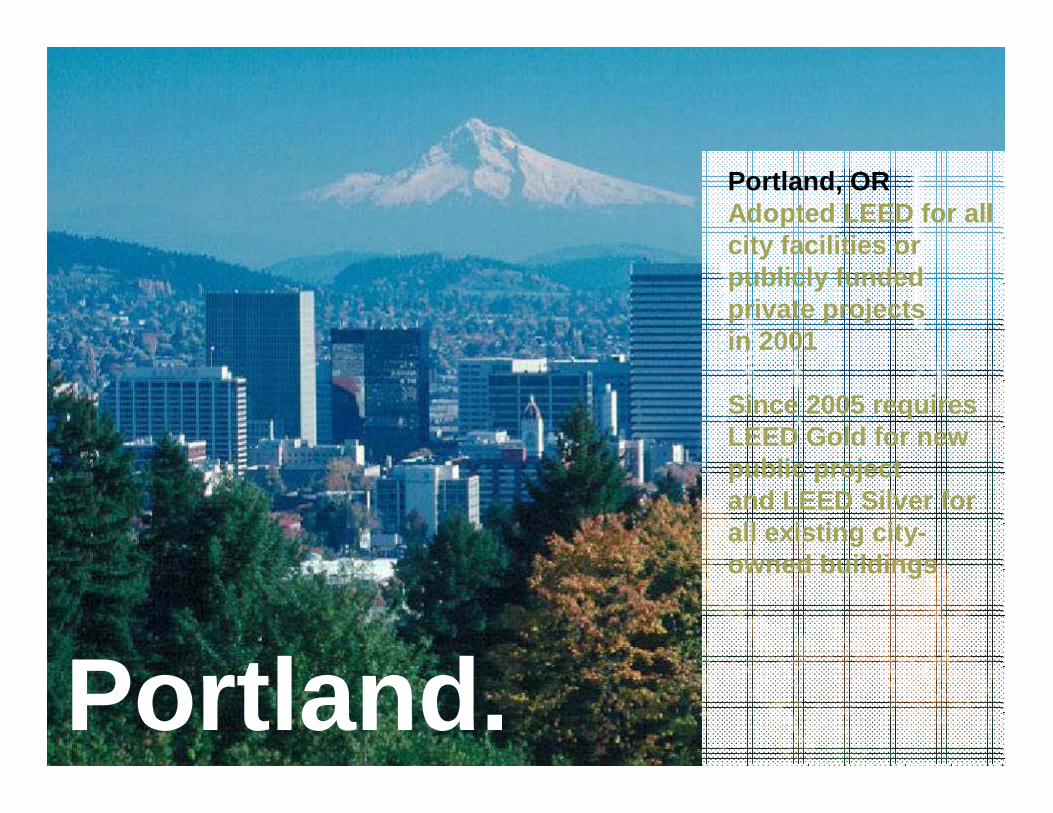
Portland, ORAdopted LEED for all city facilities or publicly funded private projectsin 2001
Since 2005 requires LEED Gold for new public project and LEED Silver for all existing city-owned buildings
Portland.
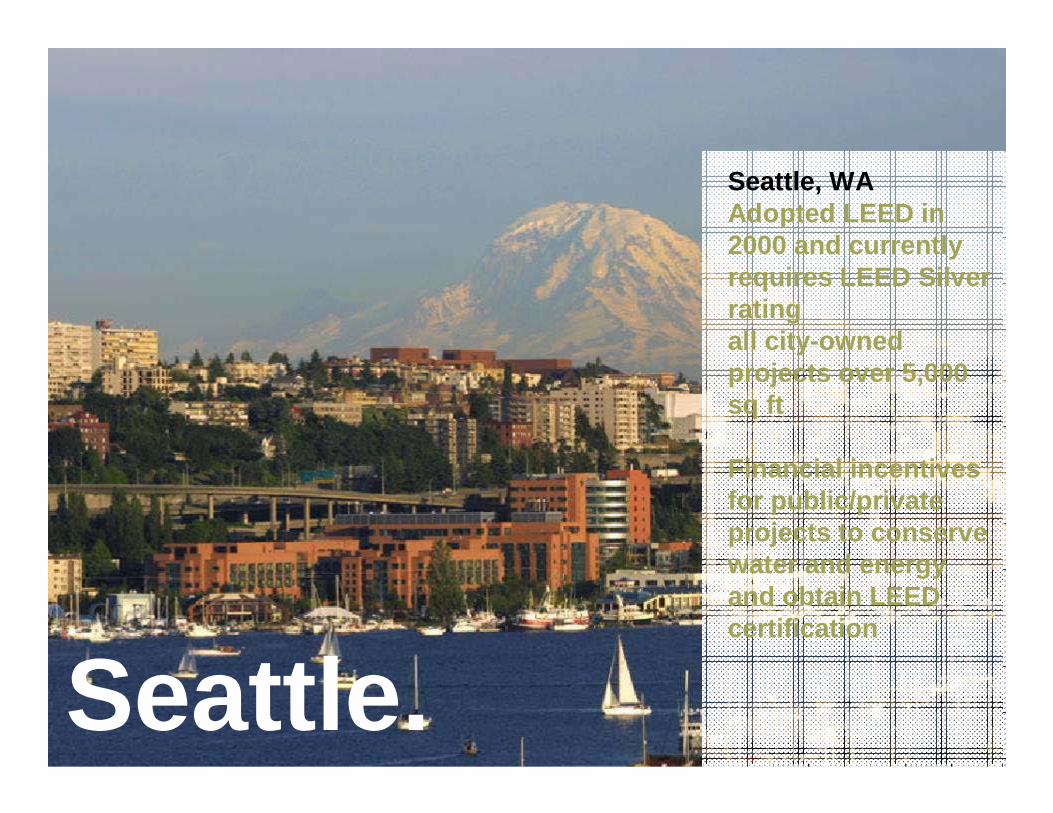
Seattle, WAAdopted LEED in 2000 and currently requires LEED Silver ratingall city-owned projects over 5,000 sq ft
Financial incentives for public/private projects to conserve water and energy and obtain LEED certification
Seattle.
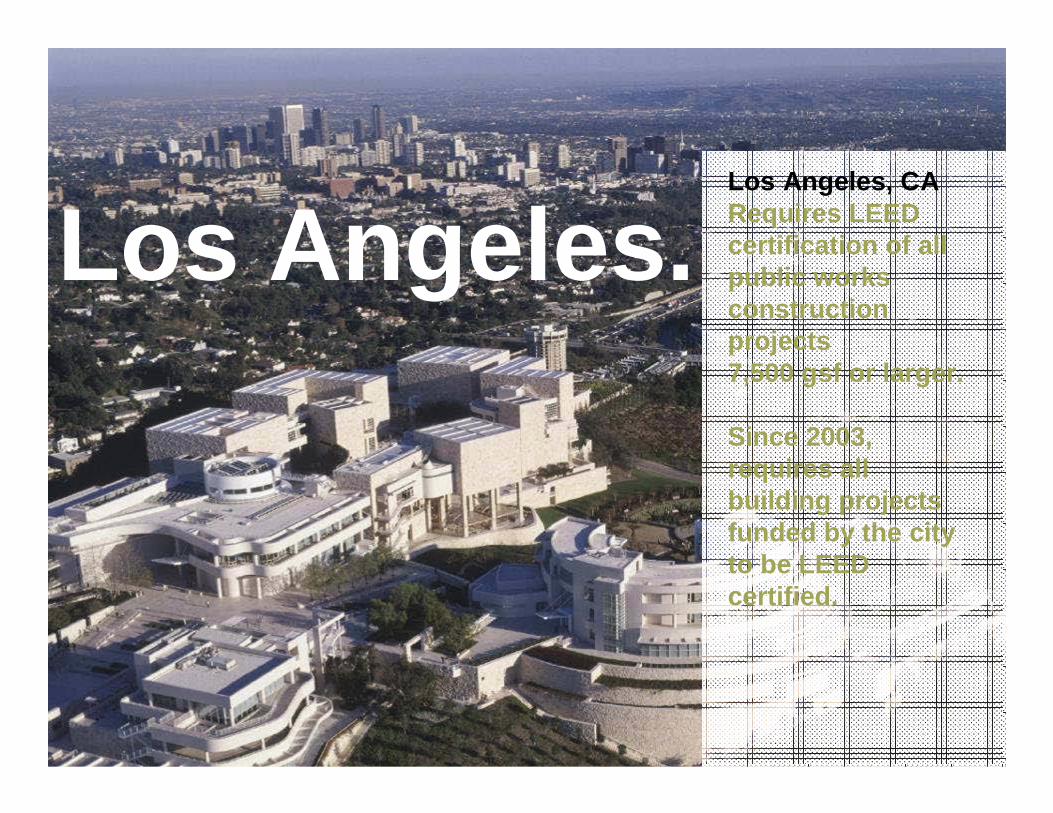
Los Angeles, CARequires LEED certification of all public works construction projects7,500 gsf or larger.
Since 2003, requires all building projects funded by the city to be LEED certified.
Los Angeles.
41
LE
ED
LE
ED

42
LE
ED
LE
ED
43
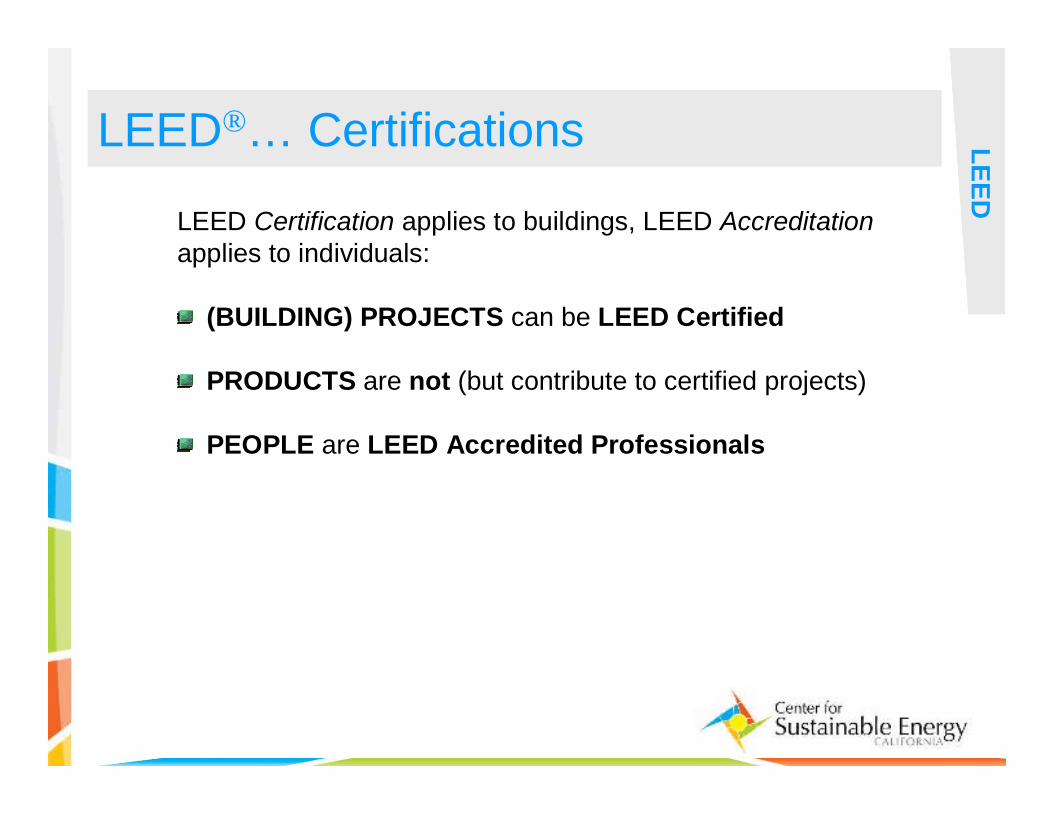
LEED®… Certifications LE
ED
LE
ED
LEED Certification applies to buildings, LEED Accreditation
applies to individuals:
(BUILDING) PROJECTS can be LEED Certified
PRODUCTS are not (but contribute to certified projects)
PEOPLE are LEED Accredited Professionals
44
LE
ED
LE
ED
TDP Opportunities
45
LE
ED
LE
ED
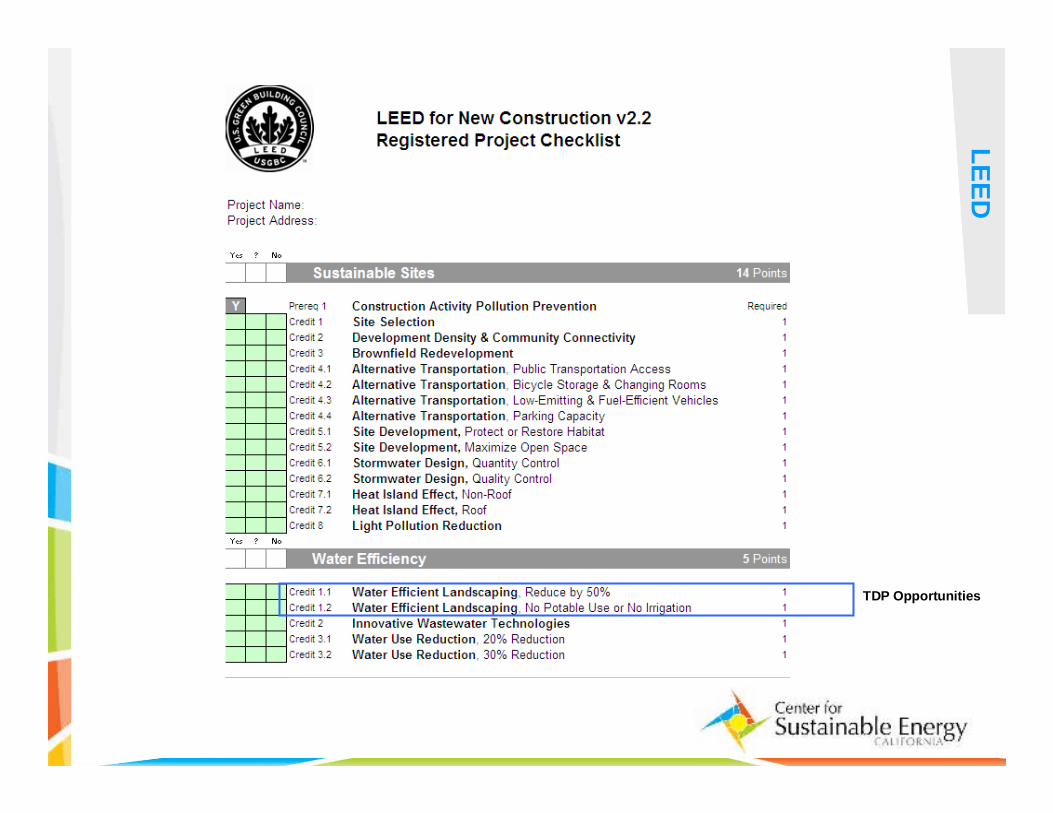
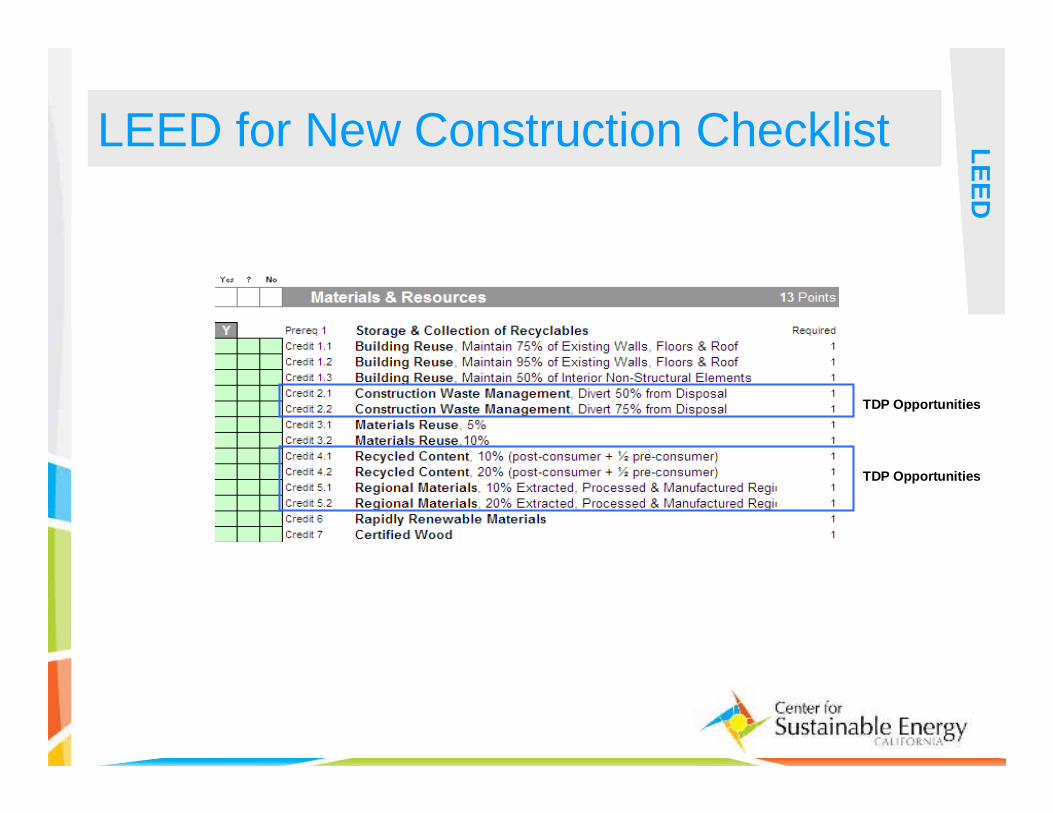
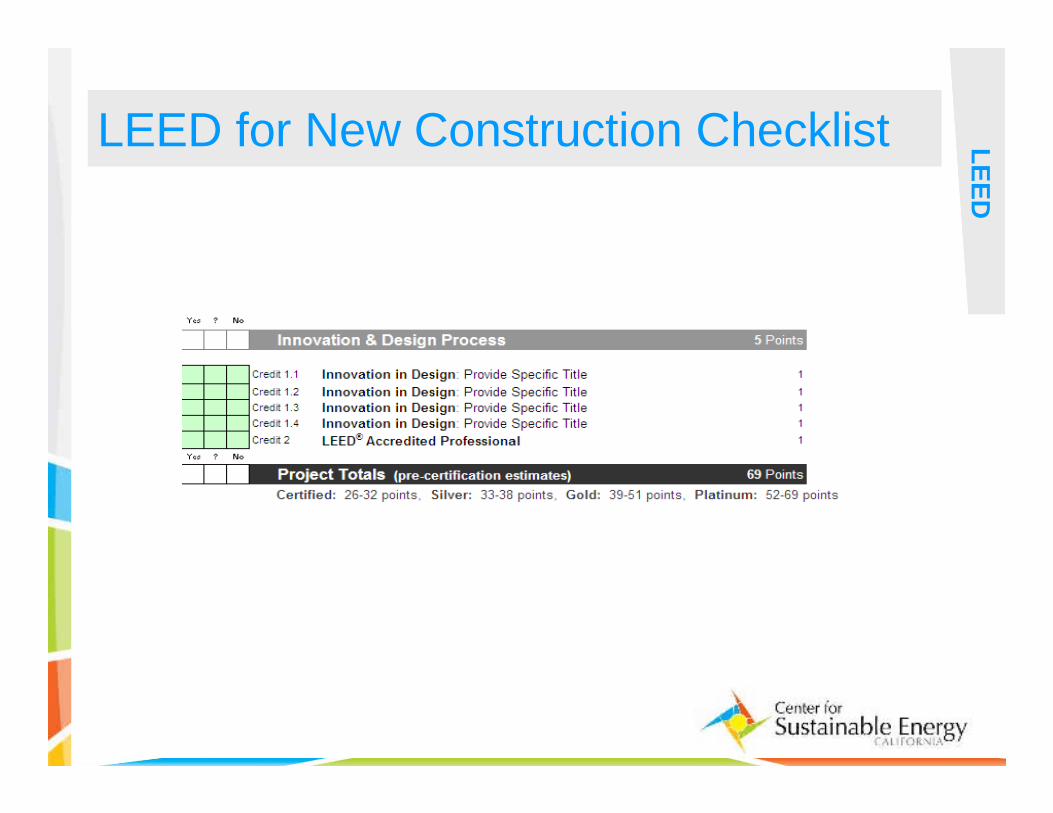
LEED for New Construction Checklist
46
LE
ED
LE
ED
LEED for New Construction Checklist
TDP Opportunities
TDP Opportunities

47
LE
ED
LE
ED
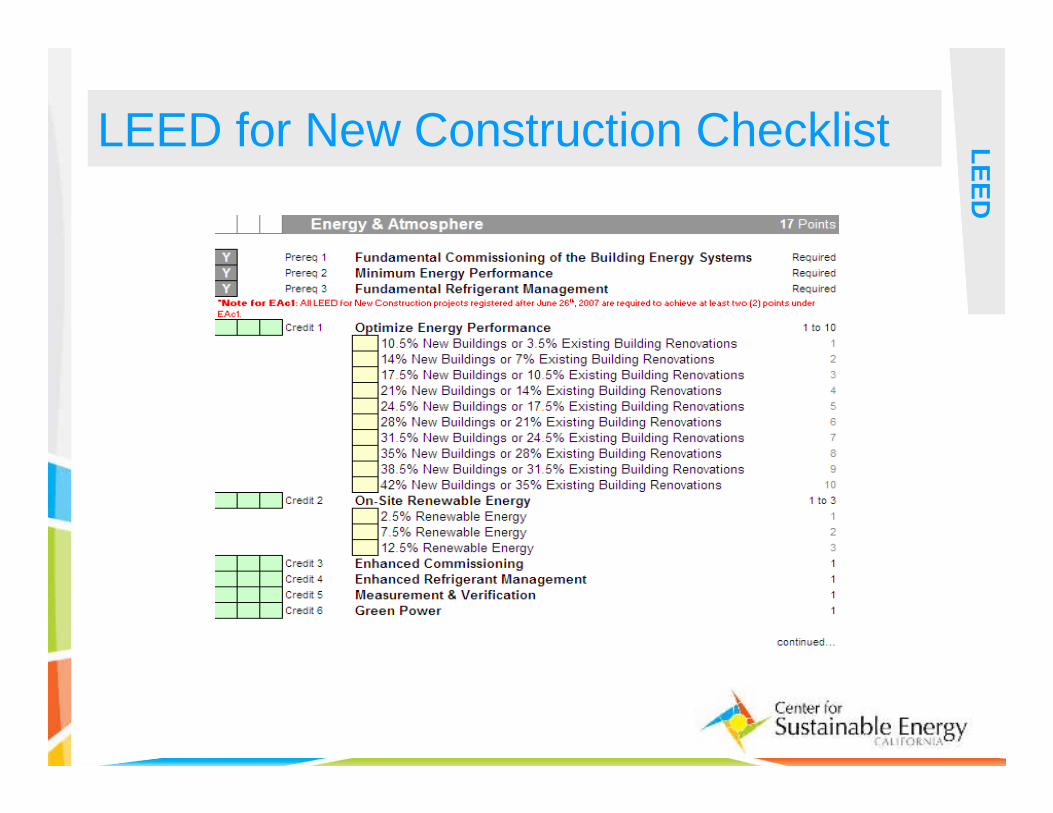
LEED for New Construction Checklist
TDP Opportunities
48
LE
ED
LE
ED
LEED for New Construction Checklist
49
Opportunities for TD Products

50
California Tire Market TD
P
� How many waste tires does California generate?California has more registered vehicles than any other state. Asa result, approximately 40.2 million reusable and waste tires are generated each year. About 1.5 million waste tires are already stockpiled throughout the state, posing a health and safety riskfor the public.
� The California Integrated Waste Management Board (CIWMB) is dedicated to finding new uses for this valuable resource, and to working in cooperation with local governments, industries, and the public towards reaching this goal.
� What happens to reusable and waste tires?CIWMB staff estimates that of the approximately 40.2 million reusable and waste tires generated in 2004, approximately 30 million of the tires (74.6 percent) were diverted through various alternatives, including reuse, retreading, and combustion.
51
California Tire Market TD
P
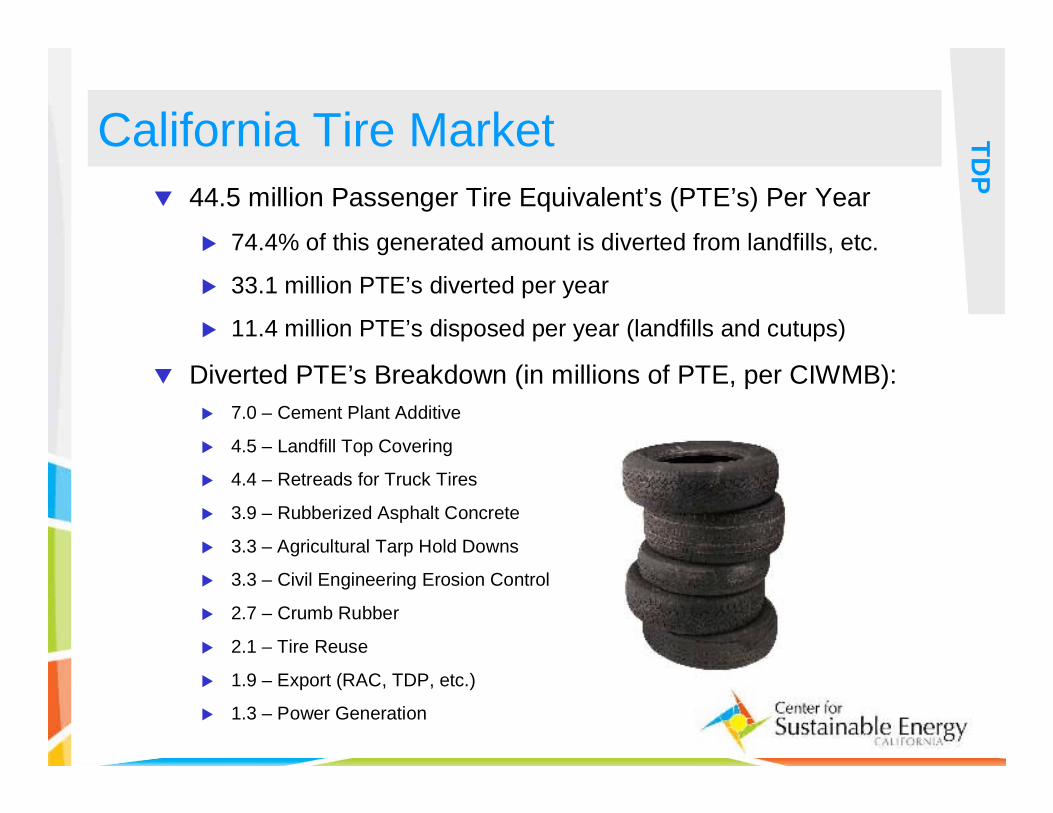
� 44.5 million Passenger Tire Equivalent’s (PTE’s) Per Year
� 74.4% of this generated amount is diverted from landfills, etc.
� 33.1 million PTE’s diverted per year
� 11.4 million PTE’s disposed per year (landfills and cutups)
� Diverted PTE’s Breakdown (in millions of PTE, per CIWMB):
� 7.0 – Cement Plant Additive
� 4.5 – Landfill Top Covering
� 4.4 – Retreads for Truck Tires
� 3.9 – Rubberized Asphalt Concrete
� 3.3 – Agricultural Tarp Hold Downs
� 3.3 – Civil Engineering Erosion Control
� 2.7 – Crumb Rubber
� 2.1 – Tire Reuse
� 1.9 – Export (RAC, TDP, etc.)
� 1.3 – Power Generation
52
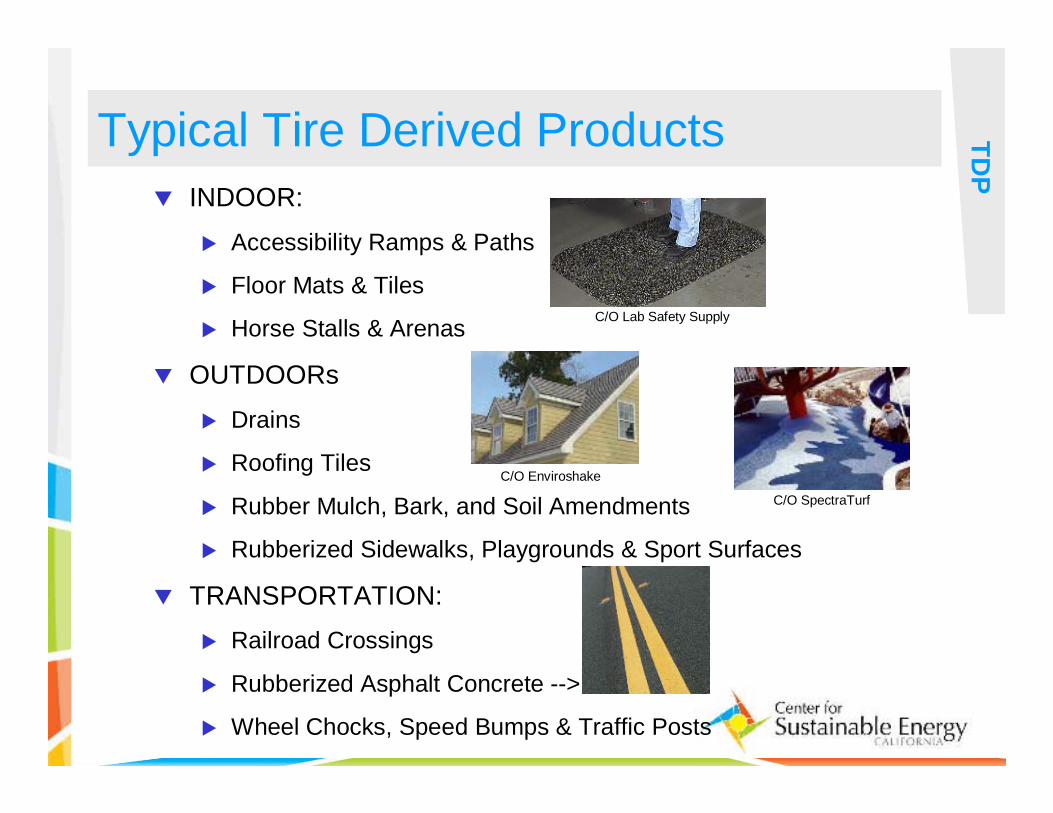
Typical Tire Derived Products TD
P
� INDOOR:
� Accessibility Ramps & Paths
� Floor Mats & Tiles
� Horse Stalls & Arenas
� OUTDOORs
� Drains
� Roofing Tiles
� Rubber Mulch, Bark, and Soil Amendments
� Rubberized Sidewalks, Playgrounds & Sport Surfaces
� TRANSPORTATION:
� Railroad Crossings
� Rubberized Asphalt Concrete -->
� Wheel Chocks, Speed Bumps & Traffic Posts
C/O SpectraTurf
C/O Lab Safety Supply
C/O Enviroshake

53
LE
ED
LE
ED
Example Sustainability Statement
54
LE
ED
LE
ED
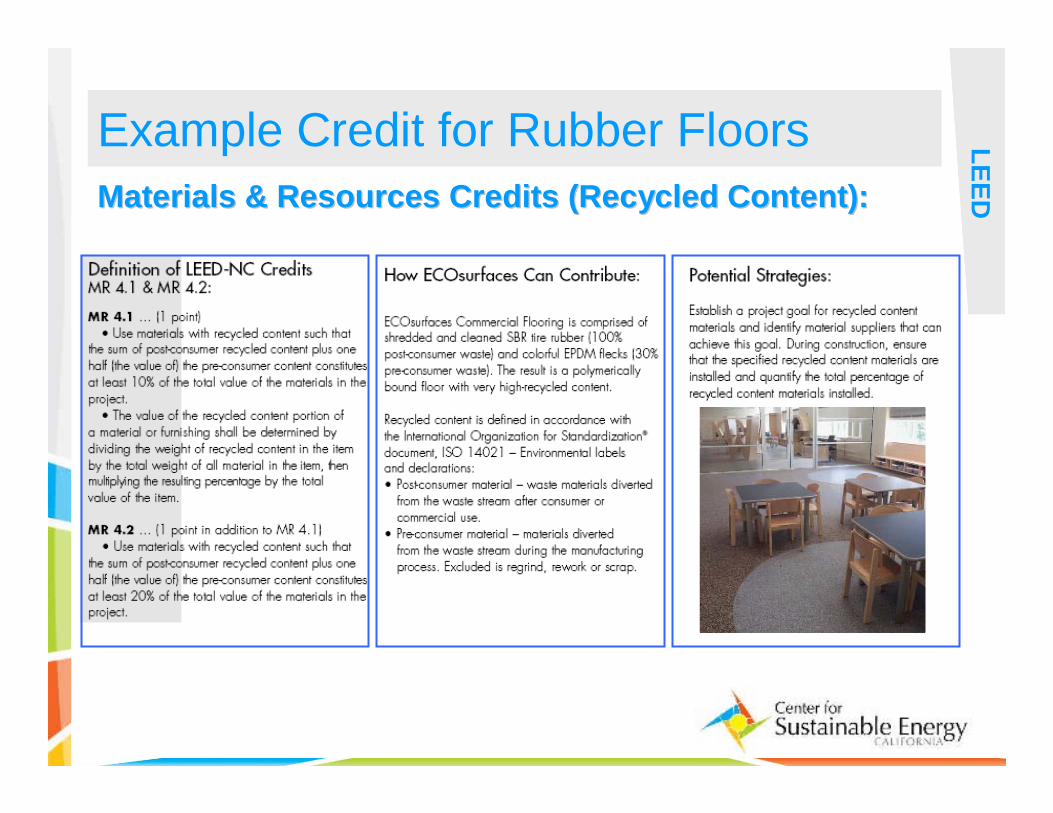
Example Credit for Rubber Floors
Materials & Resources Credits (Recycled Content):Materials & Resources Credits (Recycled Content):
55
LE
ED
LE
ED
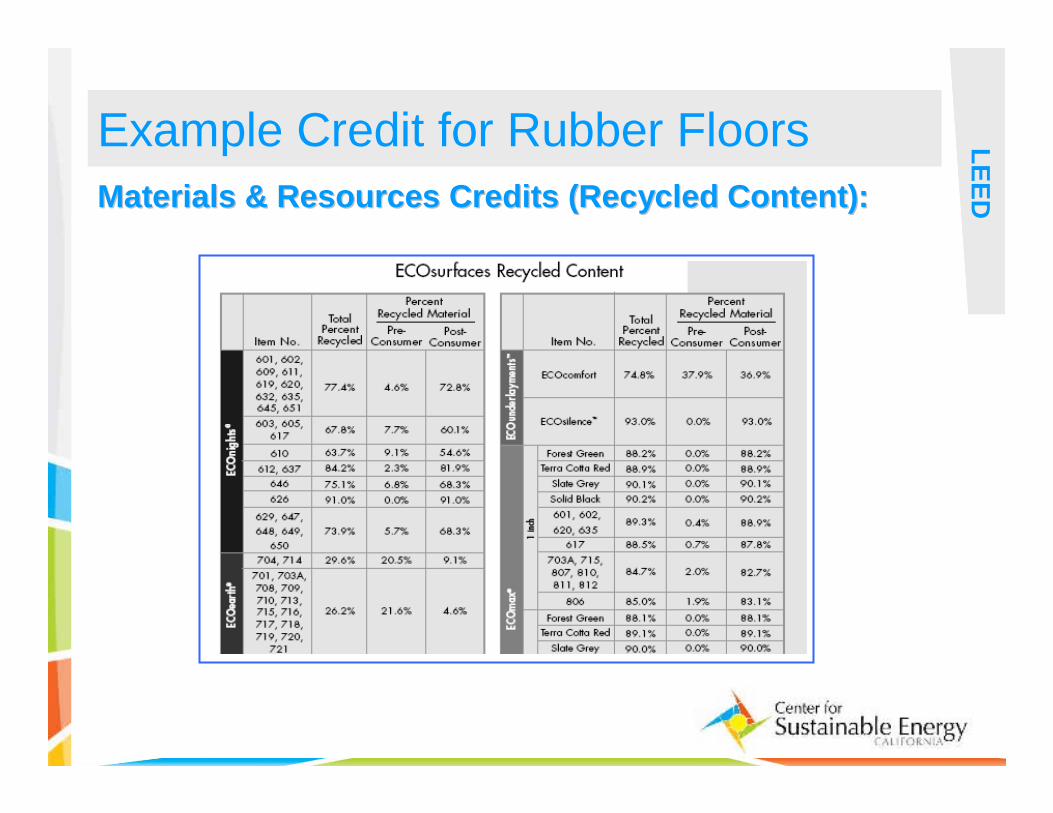
Example Credit for Rubber Floors
Materials & Resources Credits (Recycled Content):Materials & Resources Credits (Recycled Content):
56
LE
ED
LE
ED
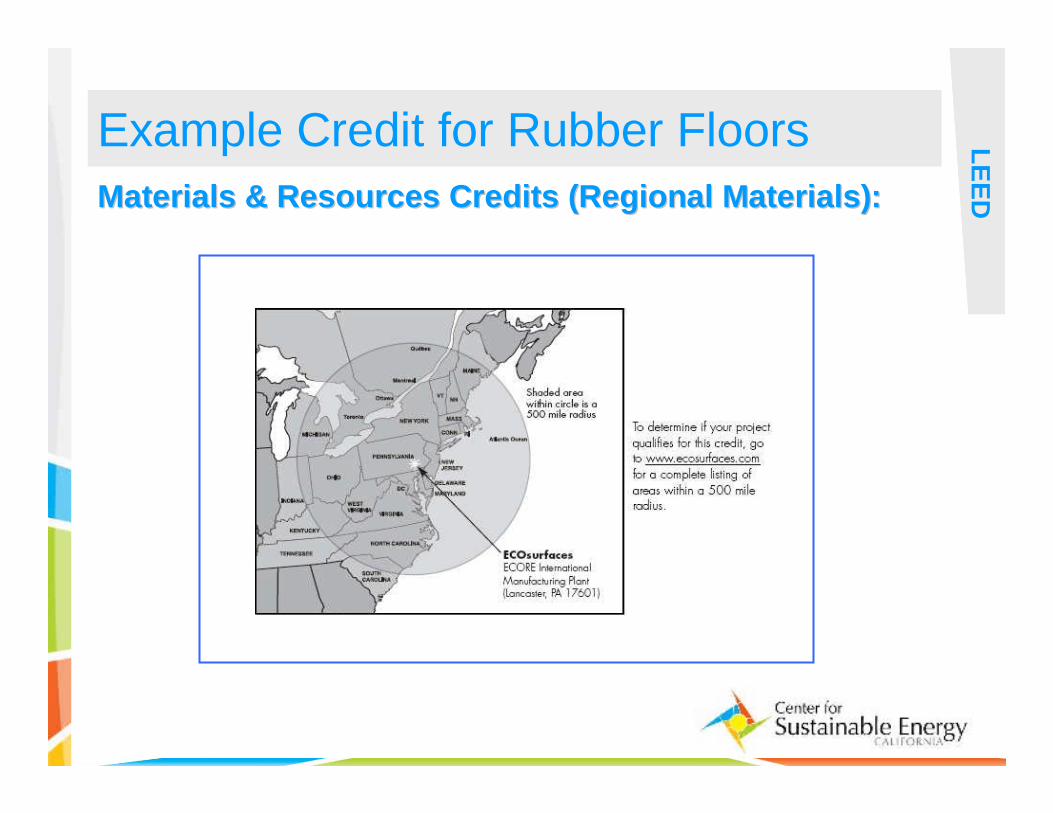
Example Credit for Rubber Floors
Materials & Resources Credits (Regional Materials):Materials & Resources Credits (Regional Materials):
57
LE
ED
LE
ED
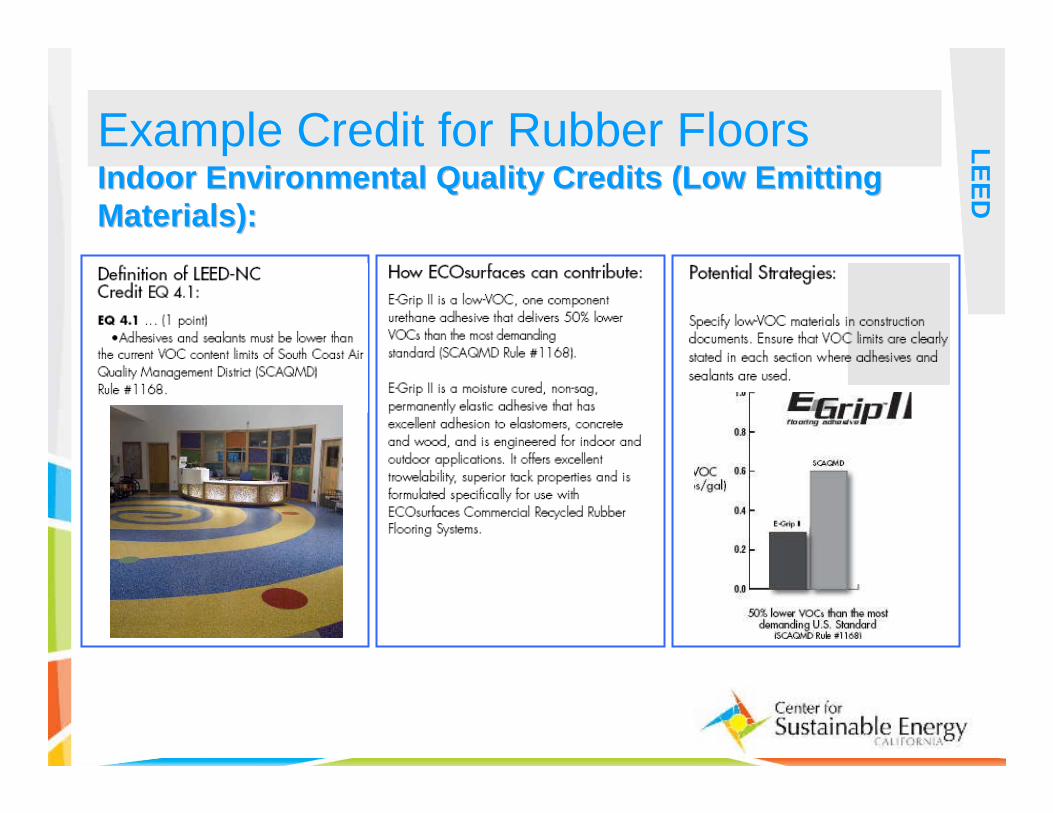
Example Credit for Rubber FloorsIndoor Environmental Quality Credits (Low Emitting Indoor Environmental Quality Credits (Low Emitting
Materials):Materials):
58
LE
ED
LE
ED
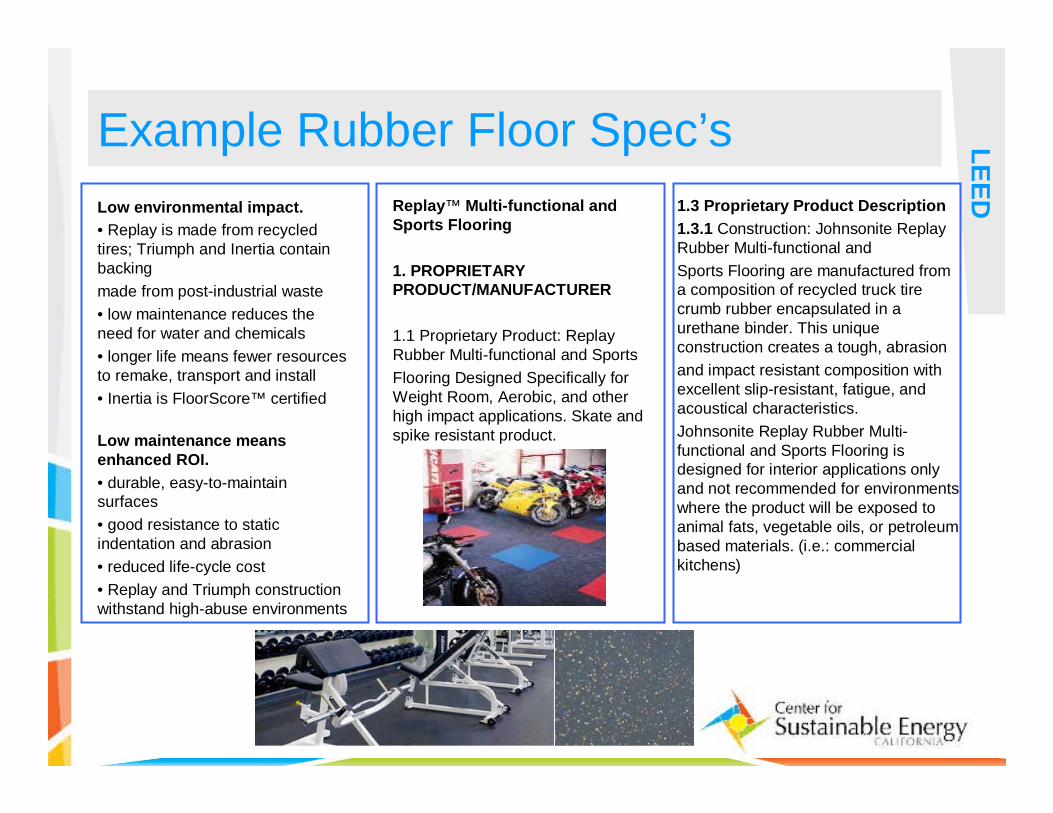
Example Rubber Floor Spec’s
Replay™ Multi-functional and Sports Flooring
1. PROPRIETARY PRODUCT/MANUFACTURER
1.1 Proprietary Product: Replay Rubber Multi-functional and Sports
Flooring Designed Specifically for Weight Room, Aerobic, and other high impact applications. Skate and spike resistant product.
1.3 Proprietary Product Description
1.3.1 Construction: Johnsonite Replay Rubber Multi-functional and
Sports Flooring are manufactured from a composition of recycled truck tire crumb rubber encapsulated in a urethane binder. This unique construction creates a tough, abrasion
and impact resistant composition with excellent slip-resistant, fatigue, and acoustical characteristics.
Johnsonite Replay Rubber Multi-functional and Sports Flooring is designed for interior applications only and not recommended for environments where the product will be exposed to animal fats, vegetable oils, or petroleum based materials. (i.e.: commercial kitchens)
Low environmental impact.
• Replay is made from recycled tires; Triumph and Inertia contain backing
made from post-industrial waste
• low maintenance reduces the need for water and chemicals
• longer life means fewer resources to remake, transport and install
• Inertia is FloorScore™ certified
Low maintenance means enhanced ROI.
• durable, easy-to-maintain surfaces
• good resistance to static indentation and abrasion
• reduced life-cycle cost
• Replay and Triumph construction withstand high-abuse environments
59
LE
ED
LE
ED
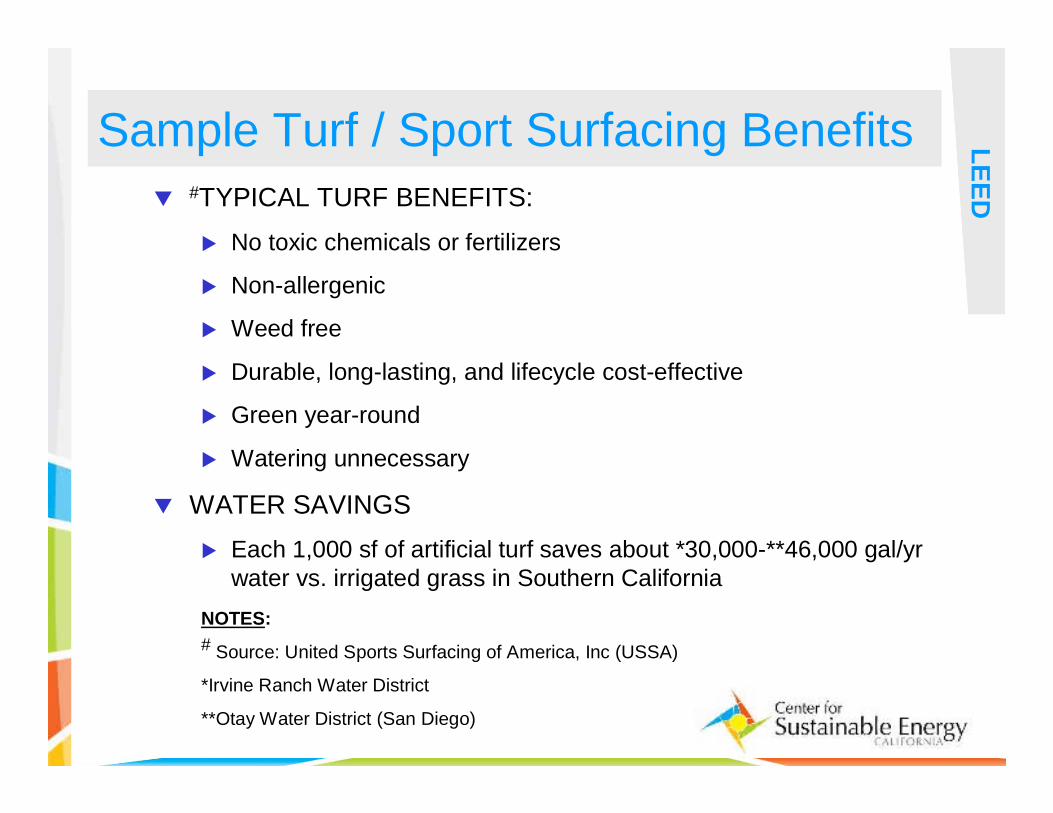
Sample Turf / Sport Surfacing Benefits
NOTES:
# Source: United Sports Surfacing of America, Inc (USSA)
*Irvine Ranch Water District
**Otay Water District (San Diego)
� #TYPICAL TURF BENEFITS:
� No toxic chemicals or fertilizers
� Non-allergenic
� Weed free
� Durable, long-lasting, and lifecycle cost-effective
� Green year-round
� Watering unnecessary
� WATER SAVINGS
� Each 1,000 sf of artificial turf saves about *30,000-**46,000 gal/yr water vs. irrigated grass in Southern California
60
Planning for Success
61
Implementation of Green Projects
GR
EE
N S
UC
CE
SSA commitment to new approaches and valuation
factors opens up opportunities
A commitment to cooperation across disciplines multiplies benefits – in terms of value and volume
A commitment to obtain an equitable balance
amongst competing interests is critical
A commitment to persistence raises chances for success and repeatability
CommitmentCommitment
62
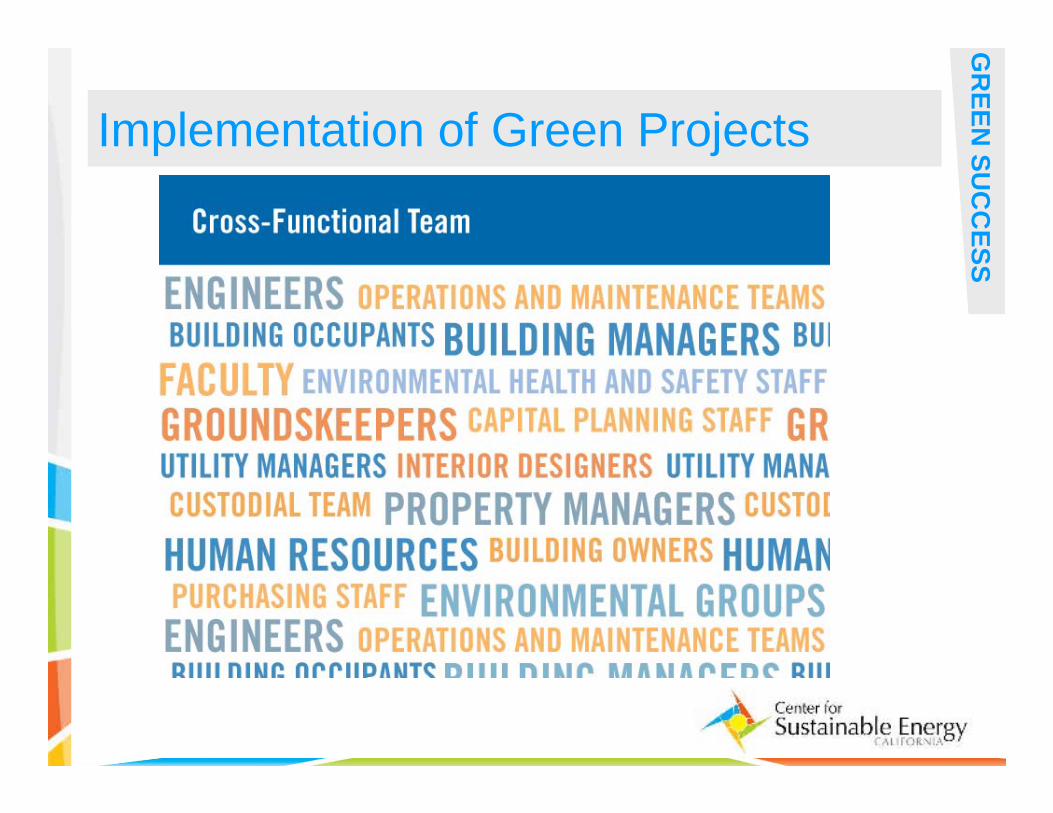
Implementation of Green Projects
GR
EE
N S
UC
CE
SS
CommunicatingCommunicating
63
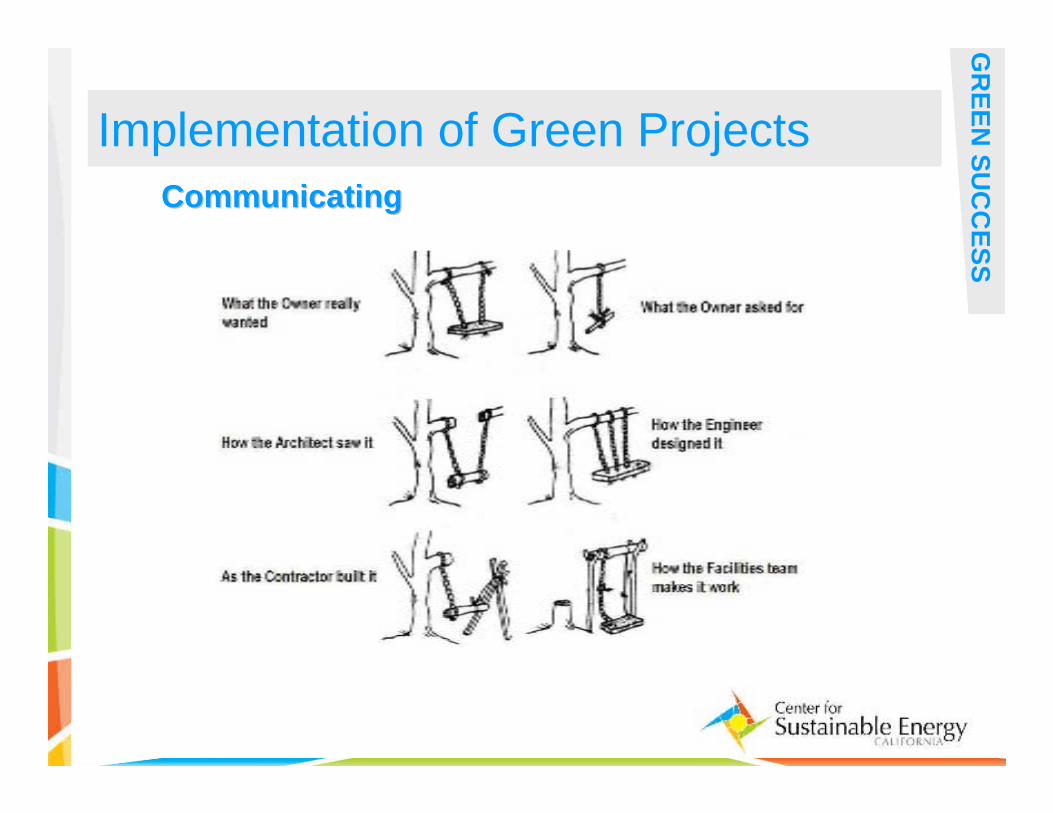
Implementation of Green Projects
GR
EE
N S
UC
CE
SS
CommunicatingCommunicating
64
Implementation of Green Projects
GR
EE
N S
UC
CE
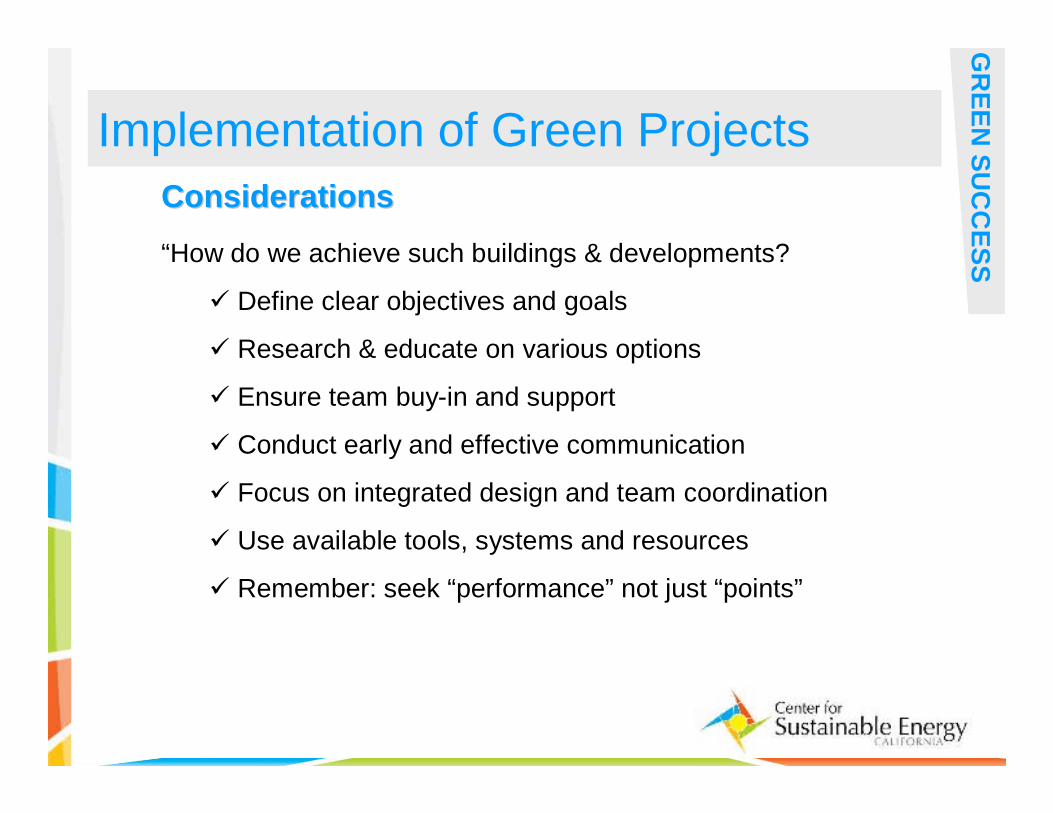
SS“How do we achieve such buildings & developments?
� Define clear objectives and goals
� Research & educate on various options
� Ensure team buy-in and support
� Conduct early and effective communication
� Focus on integrated design and team coordination
� Use available tools, systems and resources
� Remember: seek “performance” not just “points”
ConsiderationsConsiderations
65
Embracing Our Technological Future
TE
CH
NO
LO
GY
Ponder The Possibilities
66
But – Don’t Forget Creativity!
CR
EA
TIV
ITY

67
Contact or Visit Us!
CO
NT
AC
T
For more information, call us at:
1-866-SD-ENERGY
Or visit us on the web at:
http://www.energycenter.org
California Center for Sustainable Energy
8690 Balboa Ave., Suite 100San Diego, CA 92123
68
Question & Answer Period Q&
A