Embed Size (px)
Citation preview
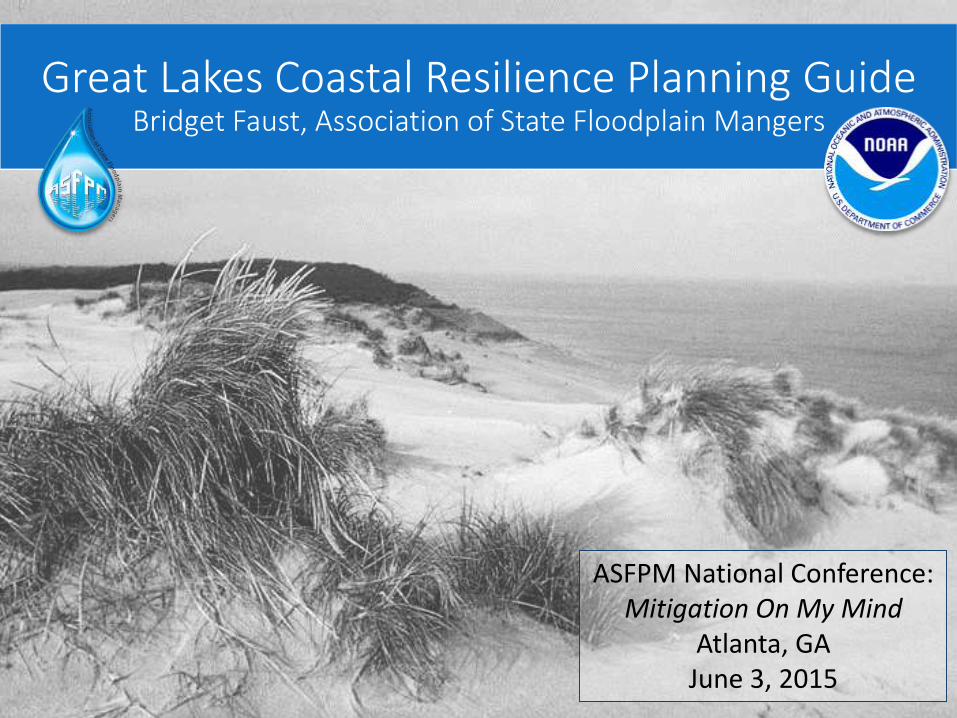
Great Lakes Coastal Resilience Planning GuideBridget Faust, Association of State Floodplain Mangers
ASFPM National Conference: Mitigation On My Mind
Atlanta, GAJune 3, 2015
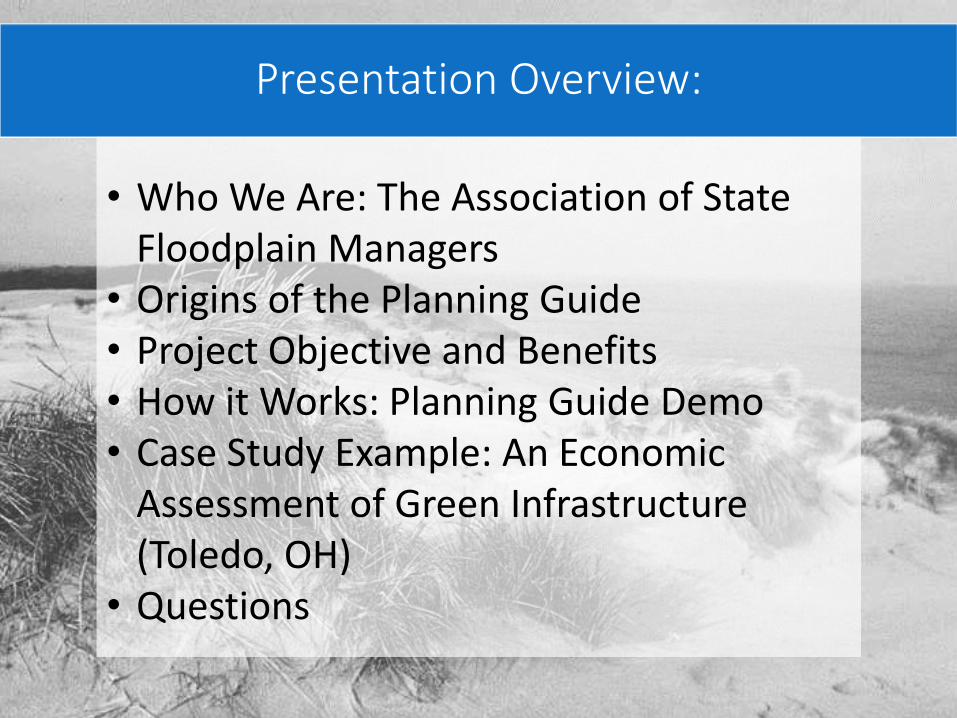
Presentation Overview:
• Who We Are: The Association of State Floodplain Managers
• Origins of the Planning Guide• Project Objective and Benefits• How it Works: Planning Guide Demo• Case Study Example: An Economic
Assessment of Green Infrastructure (Toledo, OH)
• Questions
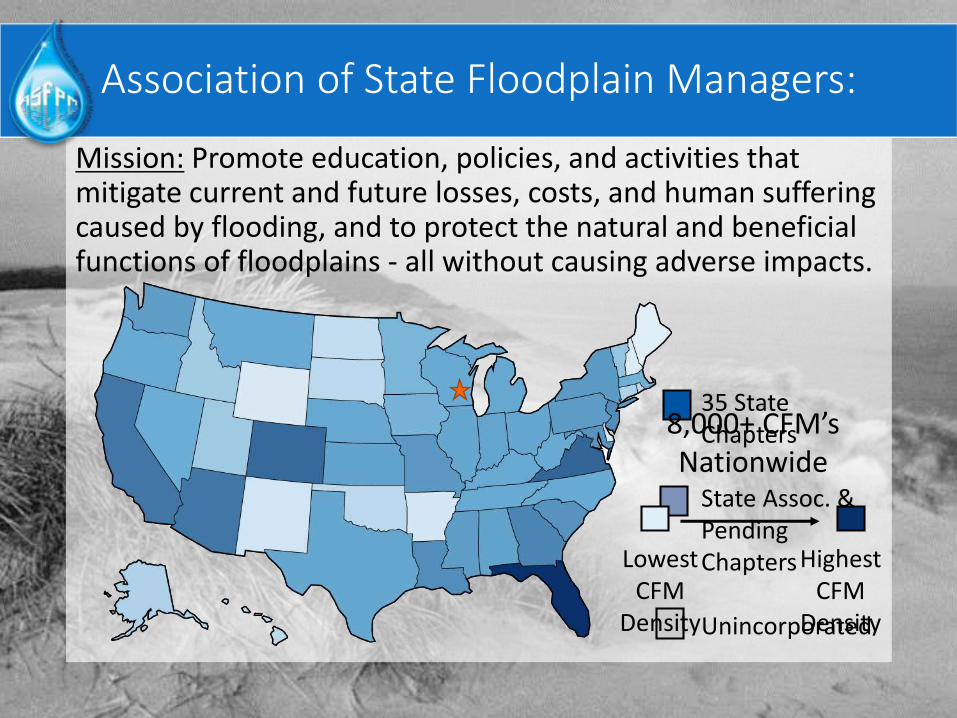
Mission: Promote education, policies, and activities that mitigate current and future losses, costs, and human suffering caused by flooding, and to protect the natural and beneficial functions of floodplains - all without causing adverse impacts.
Association of State Floodplain Managers:
35 State Chapters
State Assoc. & Pending Chapters
Unincorporated
8,000+ CFM’s Nationwide
Lowest CFM
Density
Highest CFM
Density
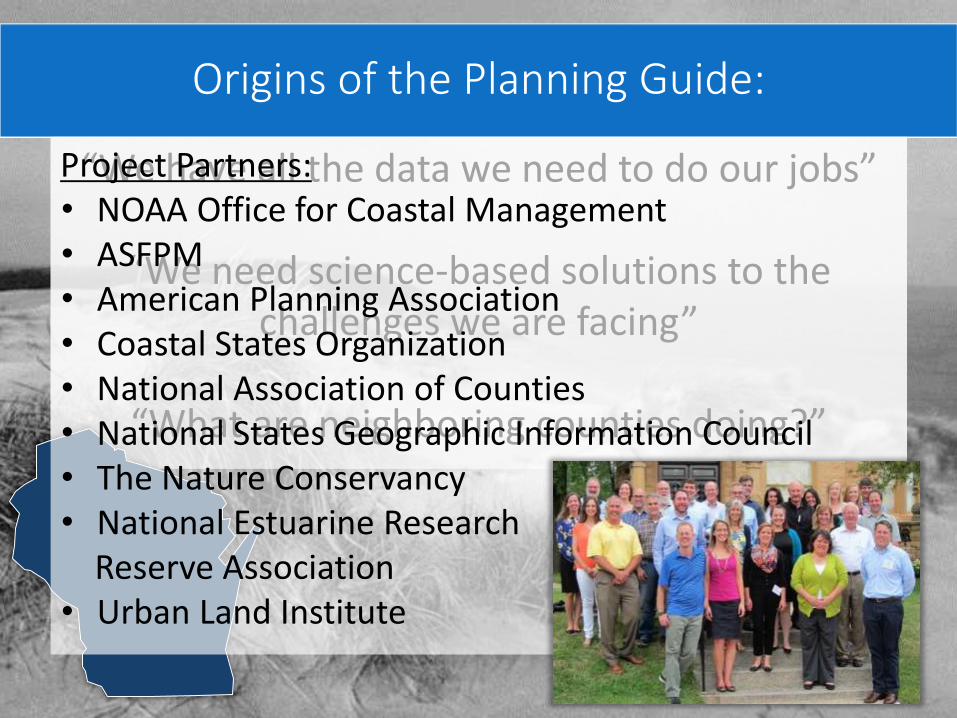
Origins of the Planning Guide:
“We have all the data we need to do our jobs”
“We need science-based solutions to the challenges we are facing”
“What are neighboring counties doing?”
Project Partners:• NOAA Office for Coastal Management• ASFPM• American Planning Association• Coastal States Organization• National Association of Counties• National States Geographic Information Council• The Nature Conservancy• National Estuarine Research
Reserve Association• Urban Land Institute
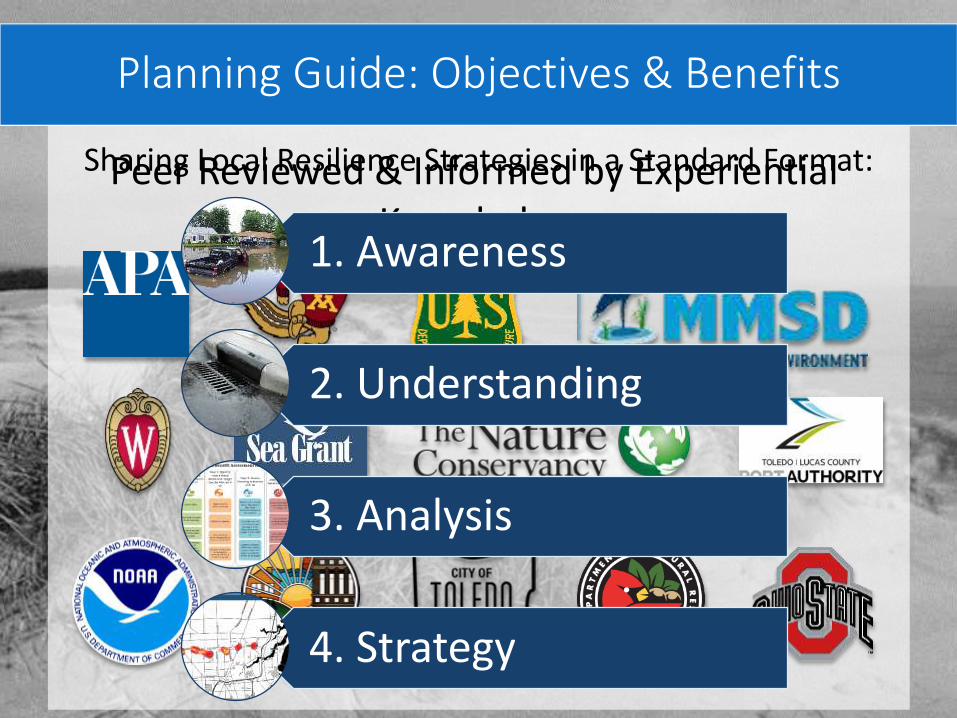
Planning Guide: Objectives & Benefits
Peer Reviewed & Informed by Experiential Knowledge
1. Awareness
2. Understanding
3. Analysis
4. Strategy
Sharing Local Resilience Strategies in a Standard Format:
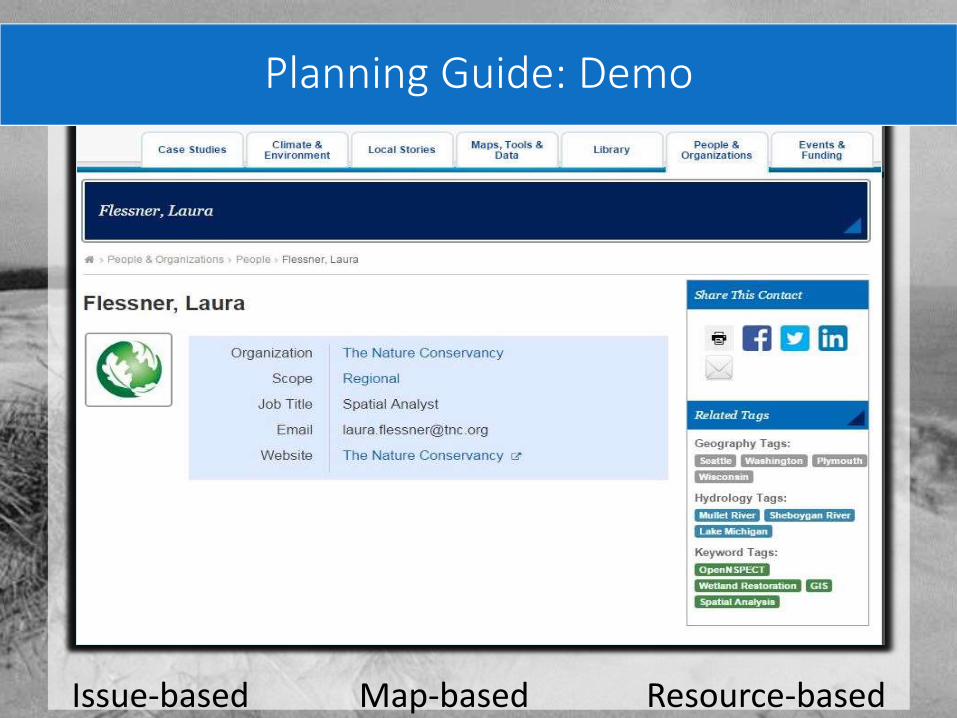
Issue-based Map-based Resource-based
Planning Guide: Demo
A Case in Practice: Economic Assessment of Green Infrastructure (Toledo, OH)
Image Courtesy of: Scott Stults, Flickr Creative Commons
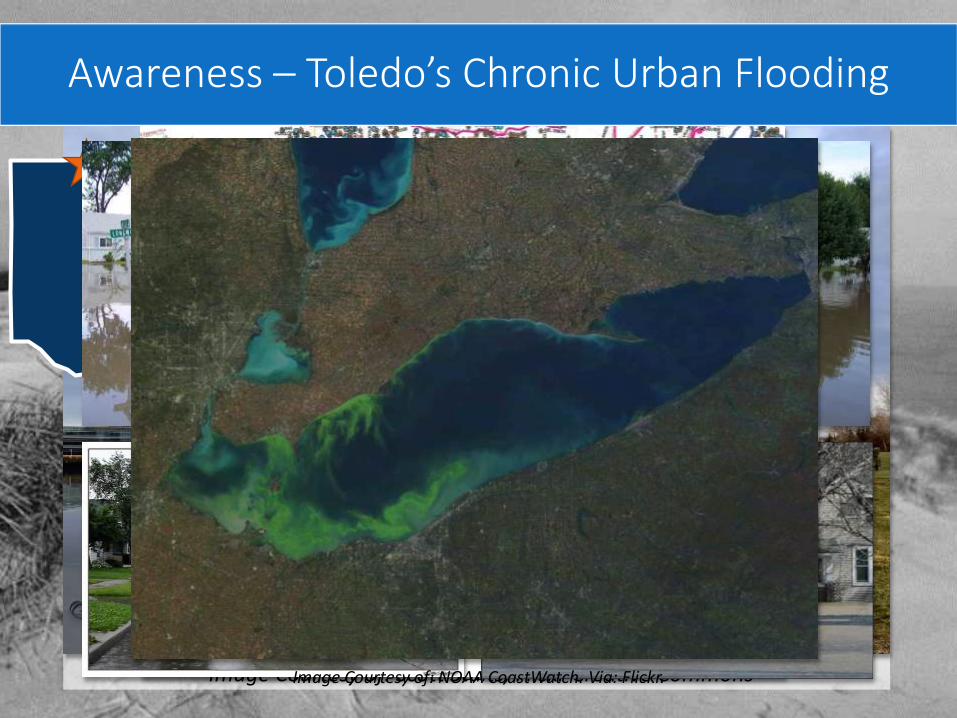
Awareness – Toledo’s Chronic Urban Flooding
Image Courtesy of: NOAA CoastWatch. Via: Flickr.
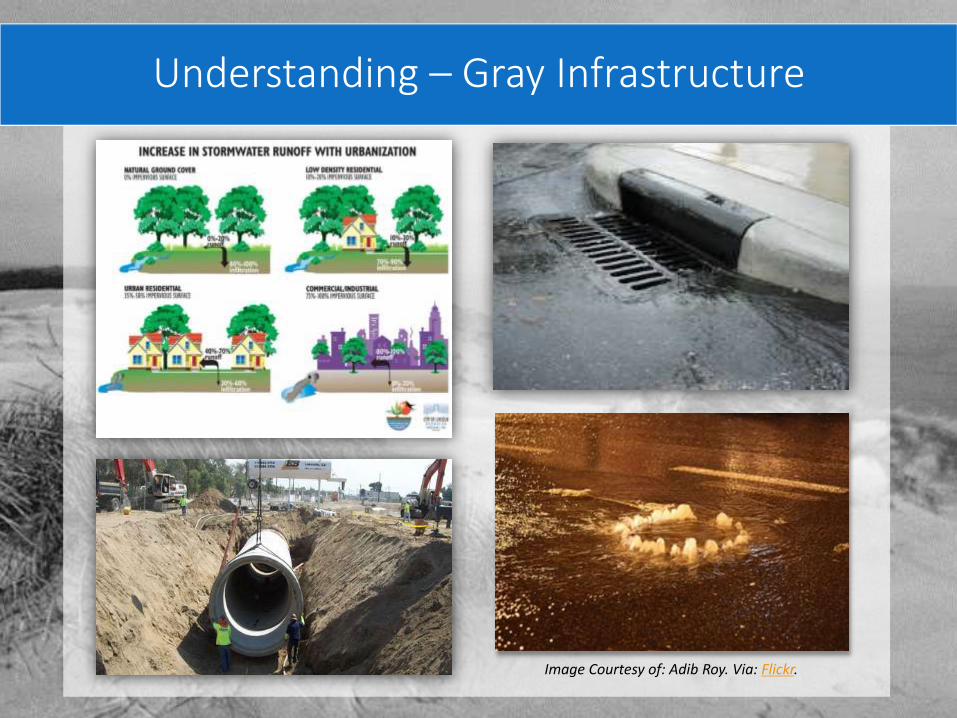
Understanding – Gray Infrastructure
Image Courtesy of: Adib Roy. Via: Flickr.
Understanding – Green Infrastructure
Image Courtesy of: Aaron Volkening. Via: Flickr, Creative Commons.
Retention Ponds
Image Courtesy of: NOAA OCM.
Blue Roofs
Image Courtesy of: Bridget Faust.
Rain Gardens
Image Courtesy of: Jennifer English, Defiance SWCD. Via: Tmacog.org.
Bioswales
Image Courtesy of: NOAA OCM.
Pervious Pavement
Image Courtesy of: Bridget Faust.
Channel Enhancement
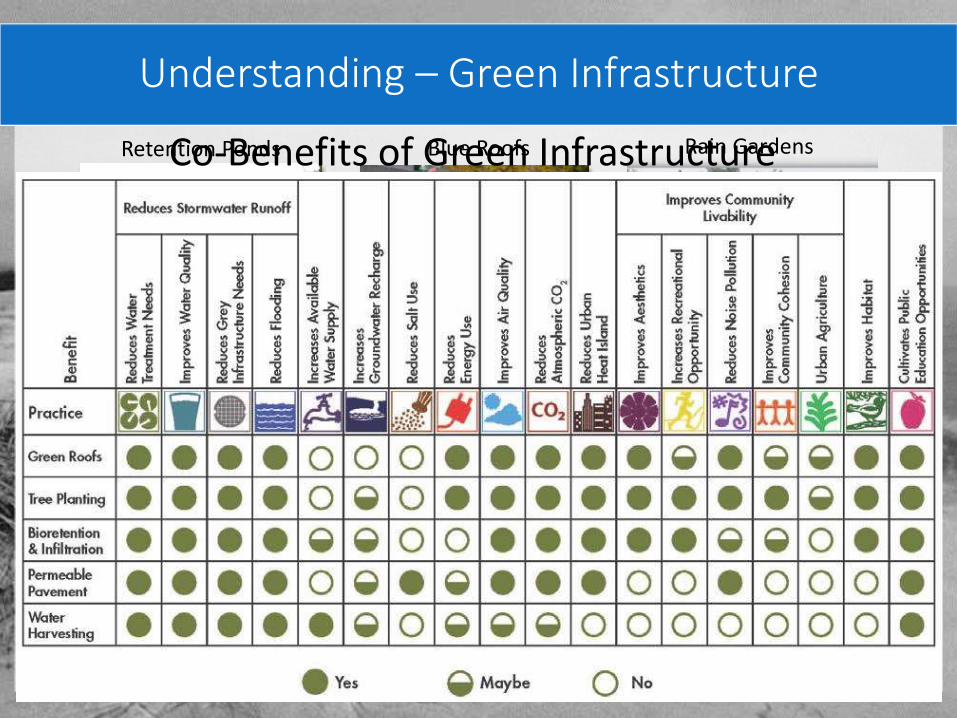
Co-Benefits of Green Infrastructure
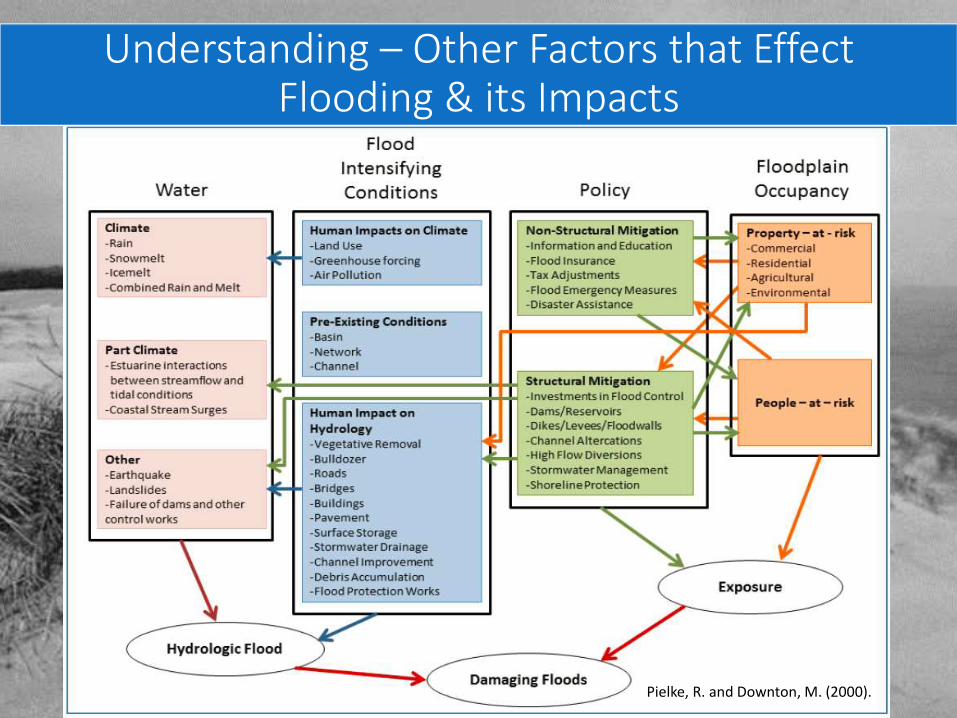
Understanding – Other Factors that Effect Flooding & its Impacts
Pielke, R. and Downton, M. (2000).
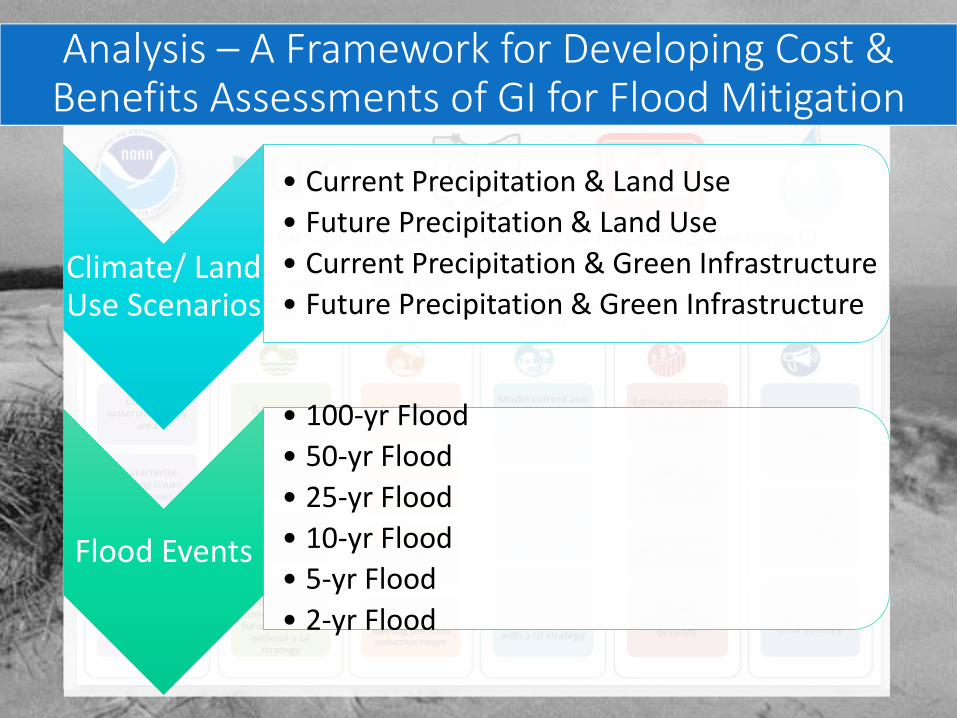
Analysis – A Framework for Developing Cost & Benefits Assessments of GI for Flood Mitigation
Climate/ Land Use Scenarios
• Current Precipitation & Land Use
• Future Precipitation & Land Use
• Current Precipitation & Green Infrastructure
• Future Precipitation & Green Infrastructure
Flood Events
• 100-yr Flood
• 50-yr Flood
• 25-yr Flood
• 10-yr Flood
• 5-yr Flood
• 2-yr Flood
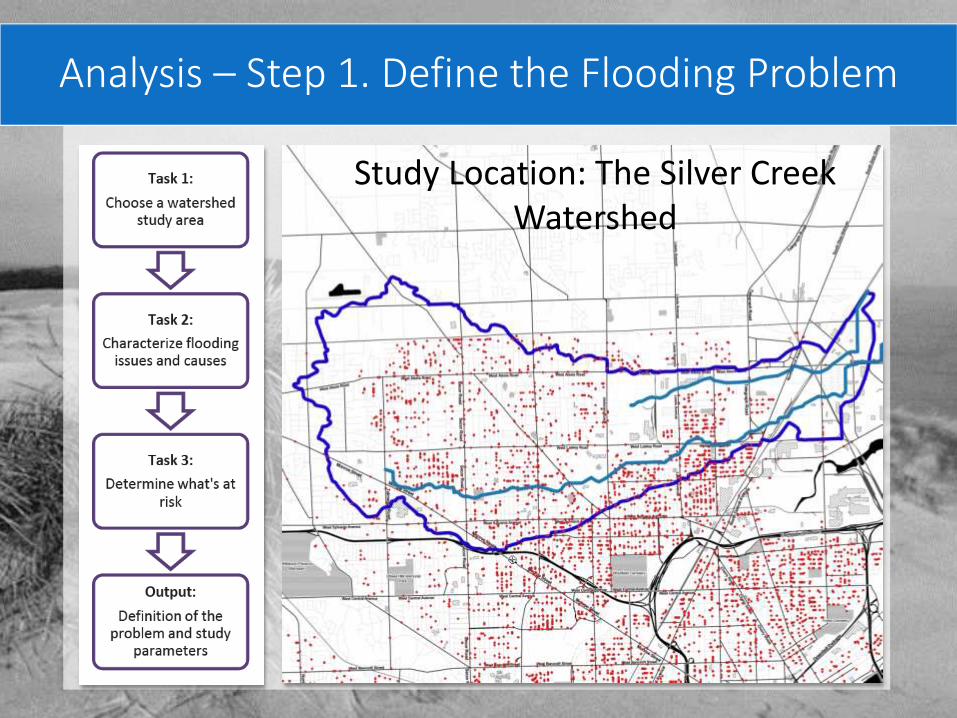
Analysis – Step 1. Define the Flooding Problem
Study Location: The Silver Creek Watershed
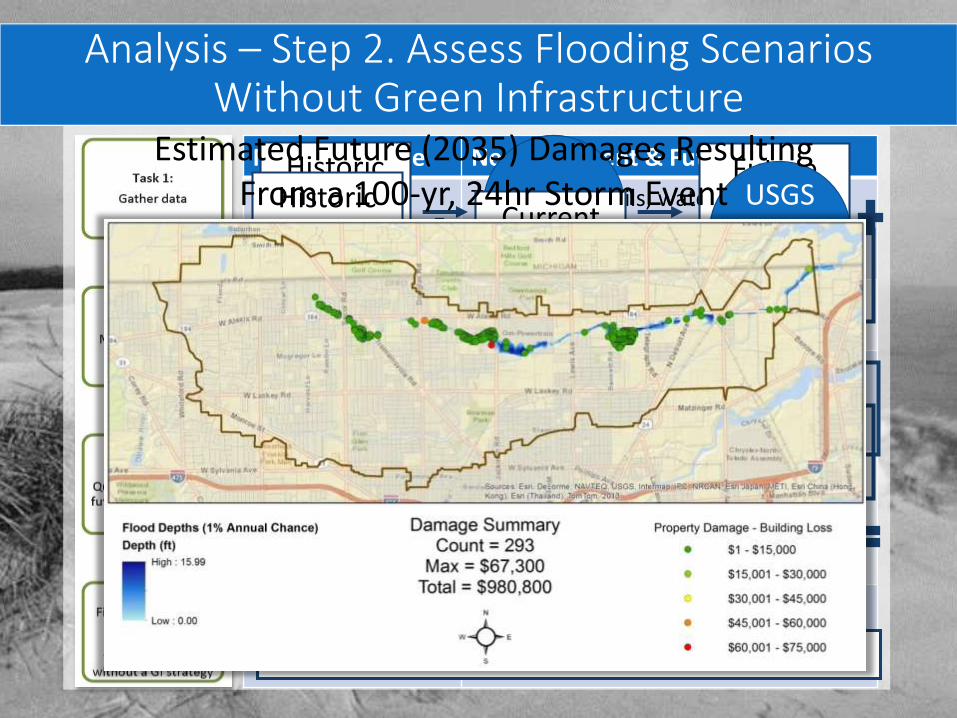
Analysis – Step 2. Assess Flooding Scenarios Without Green Infrastructure
Map/Data Type Needs (Current & Future)
Physical Topography, soils, waterways, wetlands, floodplains, historic flood elevations, watershed boundaries.
Hydrology & Hydraulics
Stream flow, existing or past H&H study data, precipitation data.
Economic FEMA insurance claims, business operation disruption costs, infrastructure costs.
Landuse & Zoning Open space, impervious areas, privately held lands, public rights of way, vacant land, building footprints, stormwater pipelines.
Regulations,Ordinances, & Plans
Comprehensive plans, zoning ordinances, building codes, stormwater permits.
Historic Precipi-tation
Future Precipi-tation
CREAT
Peak Discharge
USGS Reg. Eqn.
Future Landuse
HEC-RAS
Flood Depth Grids
HAZUS
Future Flood Damages: Structural & Business Loss
Historic Precipi-tation
Current Landuse
Peak Discharge
USGS Reg. Eqn.
HEC-RAS
Flood Depth Grids
HAZUSCurrent Flood Damages:
Structural & Business Loss
Estimated Future (2035) Damages Resulting From a 100-yr, 24hr Storm Event
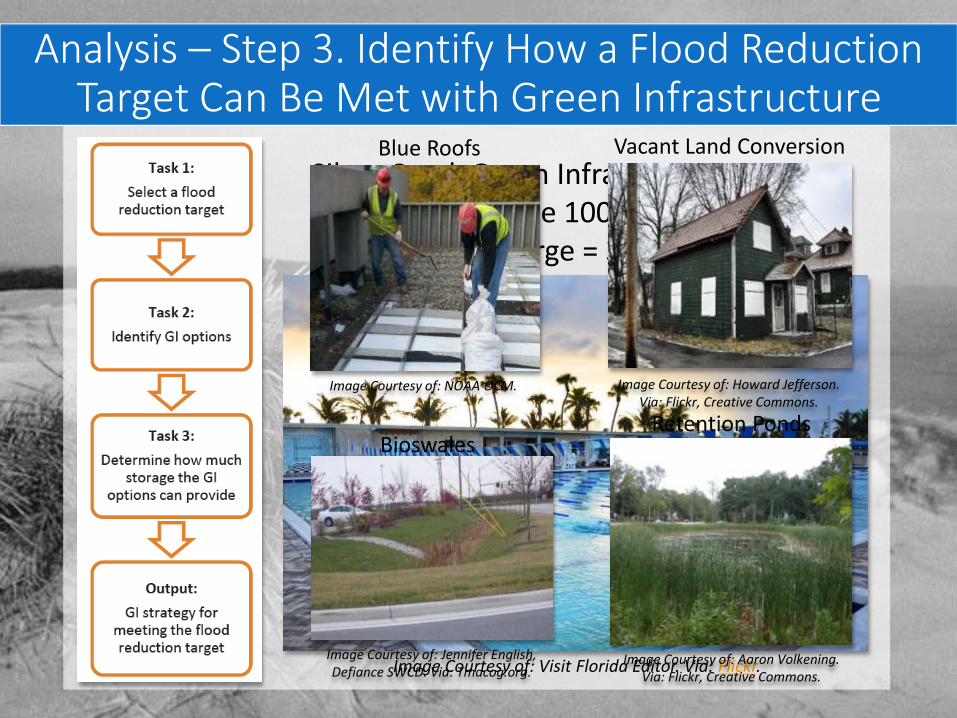
Analysis – Step 3. Identify How a Flood Reduction Target Can Be Met with Green Infrastructure
Image Courtesy of: Visit Florida Editor. Via: Flickr.
Silver Creek Green Infrastructure Storage Target: 10% of the 100-yr storm event’s
peak discharge = 31 acre-feet.
Image Courtesy of: Aaron Volkening. Via: Flickr, Creative Commons.
Retention Ponds
Image Courtesy of: NOAA OCM.
Blue Roofs
Image Courtesy of: Howard Jefferson. Via: Flickr, Creative Commons.
Vacant Land Conversion
Image Courtesy of: Jennifer English, Defiance SWCD. Via: Tmacog.org.
Bioswales
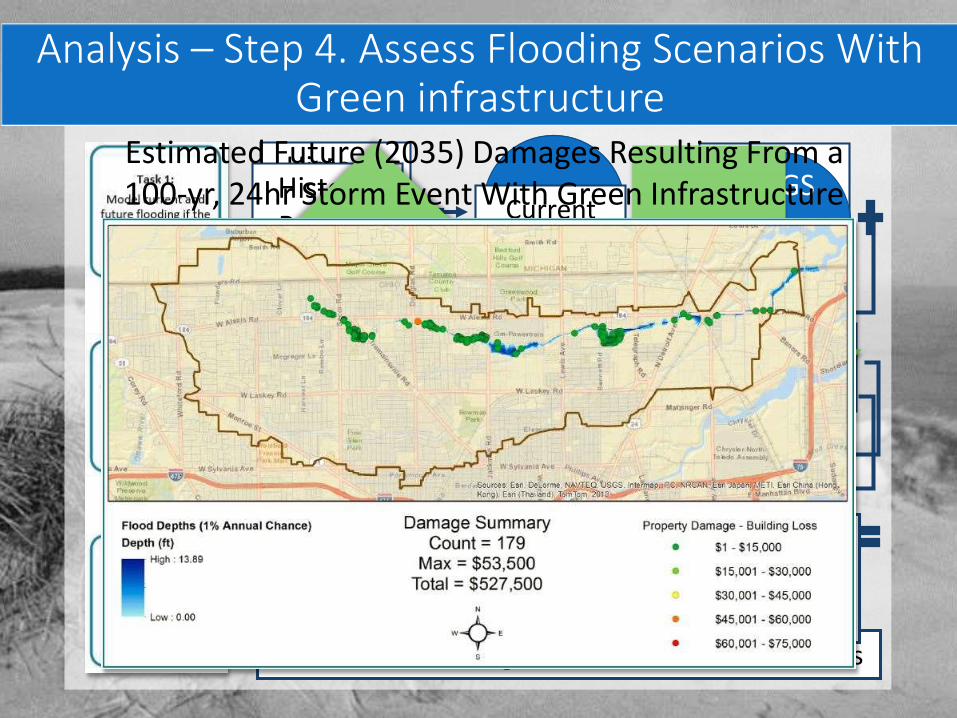
Analysis – Step 4. Assess Flooding Scenarios With Green infrastructure
Historic Precipi-tation
Future Precipi-tation
CREAT
Peak Discharge
USGS Reg. Eqn.
Future Landuse
HEC-RAS
Flood Depth Grids
HAZUS
Future Flood Damages: Structural & Business Loss
Historic Precipi-tation
Current Landuse
Peak Discharge
USGS Reg. Eqn.
HEC-RAS
Flood Depth Grids
HAZUS
Current Flood Damages With Flood Storage: Structural &
Business Loss
10% Peak Discharge Reduction
31 Acre-Feet of Flood
Storage
Estimated Future (2035) Damages Resulting From a 100-yr, 24hr Storm Event With Green Infrastructure
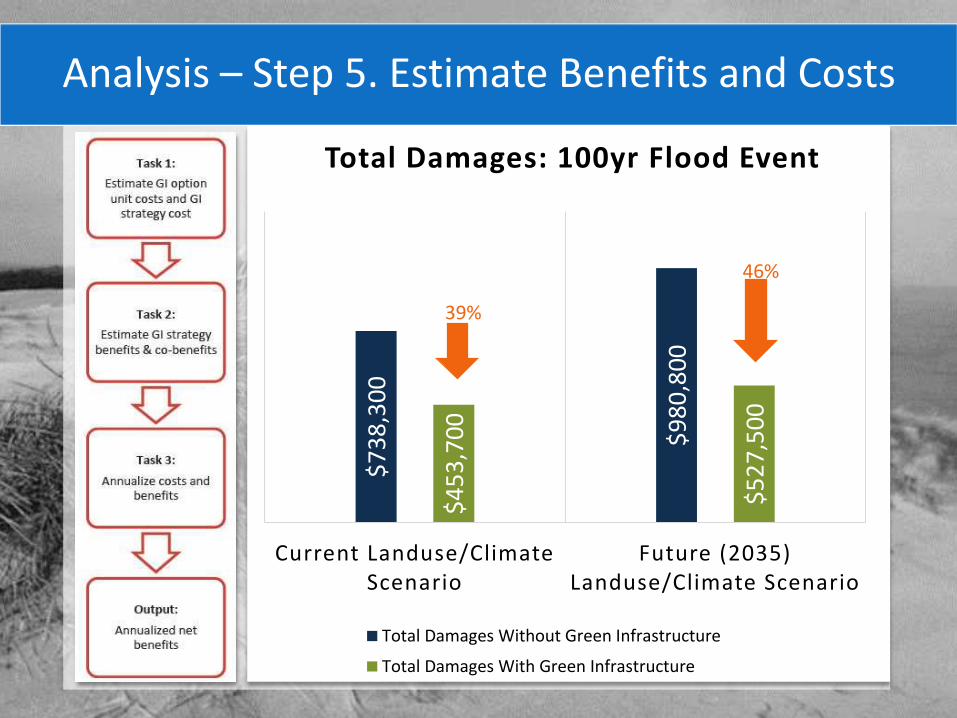
Analysis – Step 5. Estimate Benefits and Costs
$7
38
,30
0
$9
80
,80
0
$4
53
,70
0
$5
27
,50
0
Current Landuse/Climate Scenario
Future (2035) Landuse/Climate Scenario
Total Damages: 100yr Flood Event
Total Damages Without Green Infrastructure
Total Damages With Green Infrastructure
39%
46%
Analysis – Step 5. Estimate Benefits and Costs
BenefitsCosts
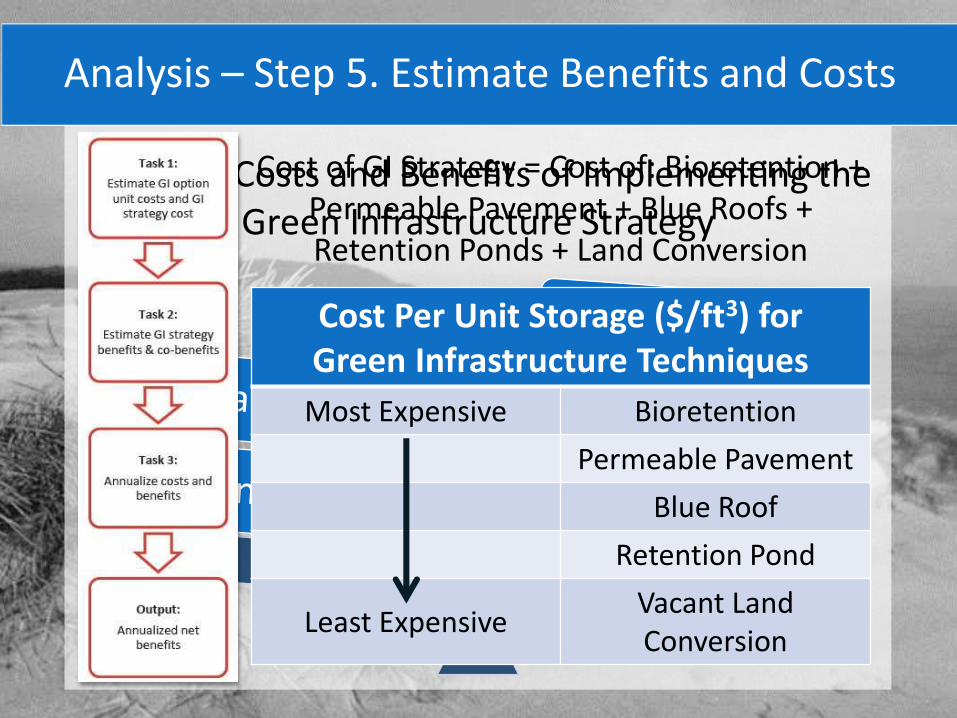
Estimate Costs and Benefits of Implementing the Green Infrastructure Strategy
Cost Per Unit Storage ($/ft3) for Green Infrastructure Techniques
Most Expensive Bioretention
Permeable Pavement
Blue Roof
Retention Pond
Least ExpensiveVacant Land Conversion
Cost of GI Strategy = Cost of: Bioretention + Permeable Pavement + Blue Roofs + Retention Ponds + Land Conversion
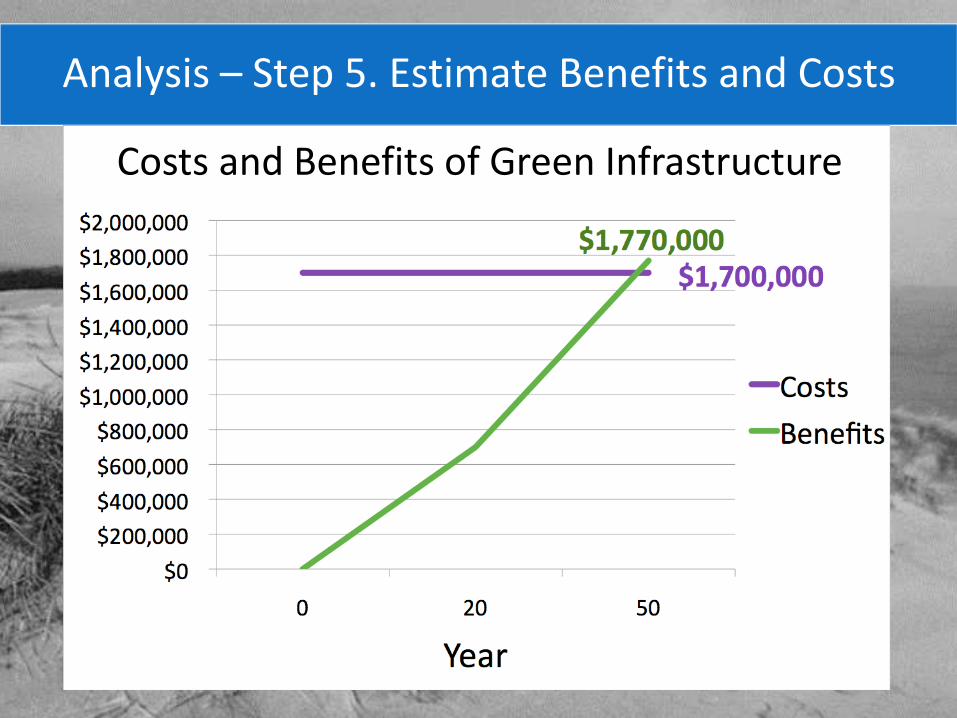
Analysis – Step 5. Estimate Benefits and Costs
Costs and Benefits of Green Infrastructure
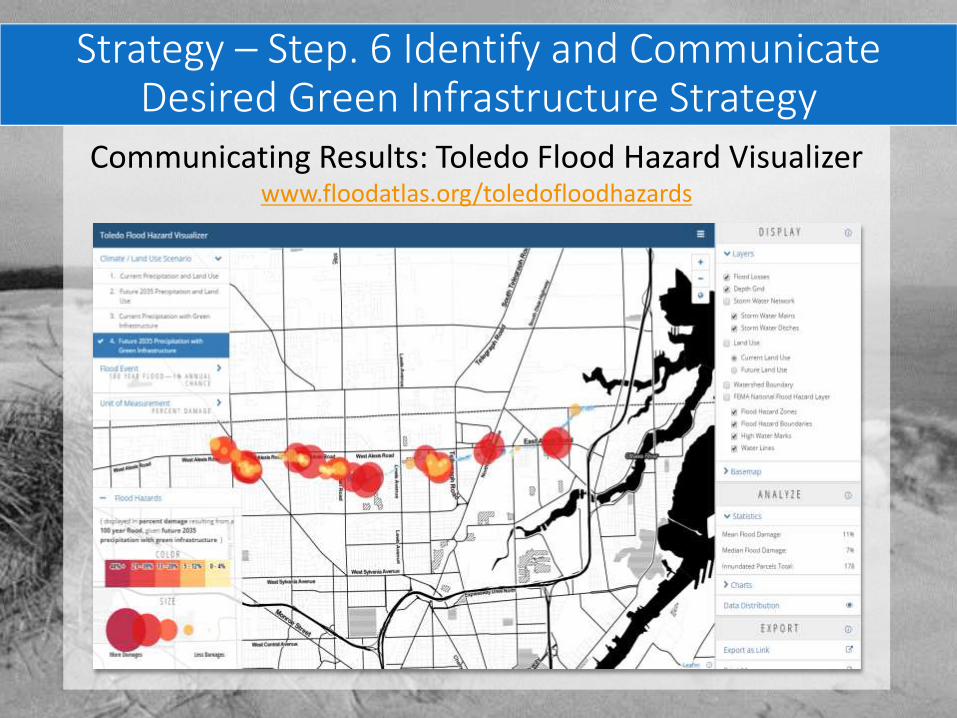
Strategy – Step. 6 Identify and Communicate Desired Green Infrastructure Strategy
Communicating Results: Toledo Flood Hazard Visualizer www.floodatlas.org/toledofloodhazards
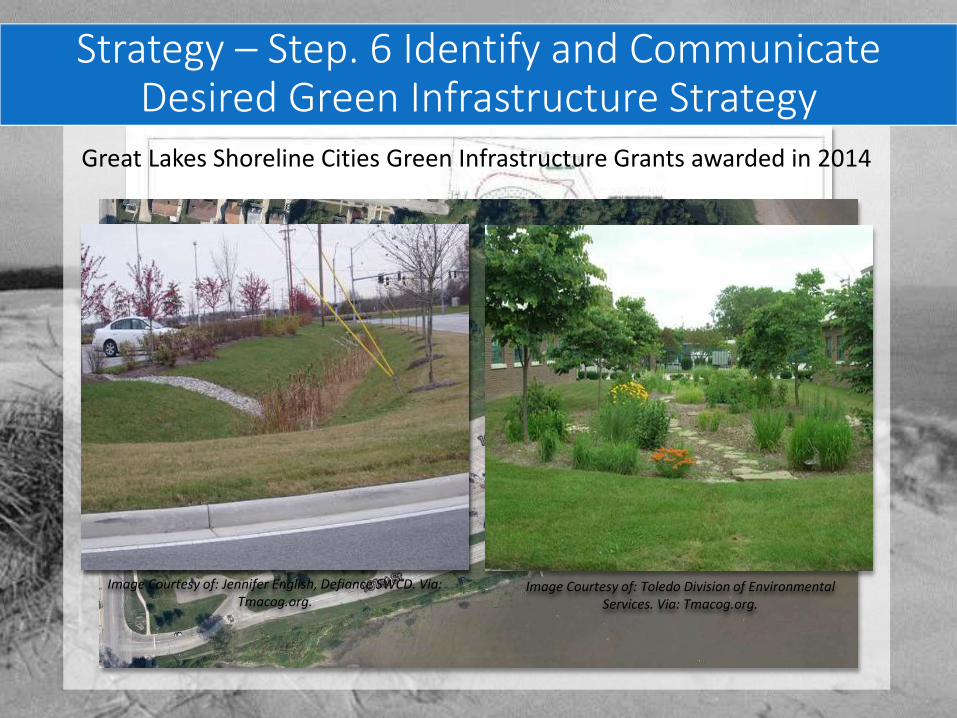
Image Credits: Steven Day, Public Works Officer – Toledo OH. “Green Infrastructure in the City of Toledo.” 2015.
Image Courtesy of: Jennifer English, Defiance SWCD. Via: Tmacog.org.
Image Courtesy of: Toledo Division of Environmental Services. Via: Tmacog.org.
Great Lakes Shoreline Cities Green Infrastructure Grants awarded in 2014
Strategy – Step. 6 Identify and Communicate Desired Green Infrastructure Strategy
Questions?
Bridget Faust, Project Research SpecialistAssociation of State Floodplain Managers
Bridget @floods.org