Embed Size (px)
Citation preview

GRAY WARNINGS:Challenges in the Direct Care Workforce
Neeta Fogg, Paul Harrington,and Nancy Snyder
Center for Labor Markets and PolicyDrexel University
June 2018
Prepared for: The Commonwealth of Massachusetts
Office of the State Auditor


2
Table of Contents
Introduction 4
A Word about the Data 4
The Role of Health Services in Private Sector Employment Growth in the Latter Stages of the Job Market Recovery in Massachusetts 5
The Employment Structure of the Massachusetts Health Care System 6
Employment Developments within the Ambulatory Care and Social Assistance Industries in Massachusetts 8
County Level Health Care Sector Employment Developments 11
Staffing in Home Health Care Agencies and Services to the Elderly and Disabled Industry 13
13 Ambulatory Care
13 Hospitals
13 Nursing Homes and Residential Care Facilities
14 Home Health Care
14 Services to the Elderly and Disabled
Mean Weekly Earnings in the Five Key Health Care Industries 15
16 Health Care Professions
17 Health Care Support Occupations
The Current Employment Situation in the Home Health Care
and Services to Elderly and Disabled Industries in Massachusetts 17
18 Home Health Care
19 Labor Shortages in the Home Health Care Industry
21 Some Evidence of Home Health Care Industry Direct Care Labor Shortages
MassHealth PCA Program Employment 22
Health Care Support and Direct Care Occupations 24
3
Characteristics of Health Care Support and Direct Care Workers in Massachusetts 26
27 Gender
27 Age
29 Race-Ethnicity
30 Nativity Status
30 Educational Attainment
30 Marital Status and Presence of Children under 18 in the Household
Trends in Real Hourly Wages of Health Care Support and Direct Care Workers in Massachusetts 32
Poverty and Public Assistance among Health Care Support and Direct Care Workers 35
36 Poverty and Income Inadequacy
38 Participation in Public Assistance Programs
Hours and Weeks of Work of Health Care Support and Direct Care Workers in Massachusetts 42
45 Hours and Weeks of Work and Participation in Public Assistance Programs
Incidence of Disability by Age and Projections of Population Change in Massachusetts 48
Other Factors that Determine the Growth in Demand for Health Care Support and Direct Care Workers 51
51 Desire to Remain in Current Residence
51 Role of Family Caregivers
54 Technological Alternatives
Insurer and public resource allocation decisions and cost containment
efforts by the federal and state government 55
Changes in Household and Family Incomes 55
Wealth and Long-Term Care Finance 57
Long-Term Care Insurance 59
Current and Projected Long-Term Care Expenditures 61
Employment Outlook for Health Care Support and Direct Care Occupations 62
Projections of the Size of the Massachusetts Labor Force to 2030 66
A Long-Term Labor Supply Problem? 68
Appendix A: Measuring PCA Employment and Establishment Counts over Time 70
Appendix B: Data Source on Pension Plan Measure 72
Endnotes 73

4
description of the incidence of disability and projections of population change in the state. Of special importance in this section is an estimate of the likely increase in the number of residents in the state with two or more limitations in activities of daily living—the trigger for long-term care sup-port under most long-term care finance schemes. We then turn our atten-tion to some other important determinates of demand for direct care work-ers in addition to the rising incidence of disability.
This section examines key factors such as preferences to remain at home, availability of uncompensated care providers, technological change, pri-vate income and wealth, and availability of long-term care insurance to privately finance the rising requirements for LTC. Public finance for long-term care has emerged as the primary way that such services are funded in Massachusetts and the nation. We provide a discussion of trends in LTC public and private finance in Massachusetts and the nation and provide projections of expected trends in the level and sources of LTC finance in the nation over the next decade.
We also use U.S. Bureau of Labor Statistics industry and occupational employment projections and U.S. Department of Health and Human Services projections of employment in direct care occupations to assess the likely growth path of employment in the direct care fields. As we noted earlier, labor force growth can serve as an important constraint on the abil-ity of an industry or occupation (or even an economy) to add jobs. When firms are unable to find labor at prevailing market wages, then those goods and services that consumers are willing and able to purchase at the prevail-ing price level are simply not produced. Over the last several years, a variety of industries in Massachusetts has complained about this sort of labor sup-ply problem.
Our final section presents a set of projections of labor force growth in the state to provide a context for the ability of the state’s labor market to meet the expected growth in direct care labor demand in the coming decade and places these occupations in the context of other occupations outside of health care that might also compete for this labor supply.
A WORD ABOUT THE DATAThe measures of employment and wage trends in health care occupations used in our study of health care support and direct care labor markets are derived from the OES (Occupational Employment Statistics) program, a federal-state co-operative statistical survey conducted by the U.S. Bureau of Labor Statistics (BLS) and the Massachusetts Department of Labor and Workforce Development (DLWD). The OES program measures employ-ment levels in occupations with associated wage rates through a probabil-ity sample survey of business establishments across most non-agricultural industries in Massachusetts. OES uses the Standard Occupational Classification (SOC) system developed by the Office of Management & Budget as the basic framework to measure employment by occupation. Because of its singular focus on occupations, the OES survey taxonomy includes more than 800 occupational titles and definitions.
The OES sample survey responses are used to prepare a set of ratio esti-mates of the distribution of employment across occupations among re-sponding firms. Business establishment responses are aggregated into in-dustry totals and appropriate weights are applied to produce industry wide estimates of employment by occupation. These findings are then bench-marked to Quarterly Census of Employment and Wages (QCEW)
INTRODUCTIONMassachusetts entered a period of extraordinary growth in the size of its elderly and disabled population in 2010 that has already begun to trigger rapid increases in the demand for long-term care support services and for workers who provide these services. Yet since 2010, there has also been a period of very constrained growth in labor supply, with barely any increase in the number of persons actively participating in the state labor market in the foreseeable future. As things stand now, we expect substantially greater levels of need for these services in the state over the next few decades that will place great strain on both household and government finances to pay for rising demand for long-term care (LTC). Expected slow growth in labor supply will mean that either wages will have to increase in order to com-pete effectively for direct care workers or some of those requiring these direct care support services may not receive the level of assistance deemed necessary by health professionals.
This is the last of a series of papers prepared by the authors for the Office of the State Auditor that examines the impact of Chapter 224 cost contain-ment legislation on the Massachusetts health care workforce. In this paper, we examine the connections between demographic change, rising health care expenditures and their influence on consumer health care support requirements and their impact on health care employment developments now and in the future.
The paper begins by examining recent developments in the state econ-omy placing the health care system and its five major components in a context of employment growth across most industries in the state. This section details the extraordinary contribution of two small health care in-dustries engaged in direct care services to the elderly and disabled in re-cent years. It also highlights the central role that the demand for direct care workers in home health aide and personal care attendant occupations play in the delivery of at-home support services to the elderly and disabled and in the delivery of health care services in the state. This section suggests that aging in place and health care and support services delivered outside of hospitals and nursing homes are the hallmarks of employment change in the state’s health care delivery system.
We next turn our attention to the current employment situation in the two most important direct care industries: home health care and services to the elderly and disabled. Both industries experienced very rapid job gains since the end of the recession and have become a very important source of overall new job growth in the state. However, in the last 18 months, the pace of job growth in these industries has diverged. This sec-tion of the paper discusses some of the reasons for this divergence and its potential meaning for the nature of future direct care employment in the state.
The ability of an industry to expand employment levels is constrained by the level of labor supply. This section of the paper begins by examining the occupational requirements for employment in the direct care health occu-pations. We examine the characteristics of workers who are employed in the state’s direct care occupations and the hours of work they supply, along with wages they earn in these fields. Among the most important findings of this discussion is the comparatively low household income of many of those who work in the direct care occupations and the implications of their income on the hours of work that they opt to supply.
The second half of the paper turns to the outlook for direct care employ-ment in the state over the next decade. The discussion begins with a
5
employment data at the appropriate industry and geographic level to pro-duce an estimate of total employment levels for each occupation in a given industry. These occupational estimates are then summed across all indus-tries to provide estimates of total wage and salary employment in a given occupation. BLS publishes estimates of total occupational employment for states in May of each year.
In the following section, we use the findings from the OES survey of Massachusetts business establishments to measure trends in employment levels and hourly wages between 2004 and 2015 in selected health care support and direct care occupations across all industries.1 In subsequent sections of this report, we rely on occupational data derived from the American Community Survey (ACS), a monthly survey of households con-ducted by the U.S. Bureau of the Census that produces data on a variety of demographic, social, economic and housing traits of individuals, families and households. The ACS survey also uses the SOC system as the frame-work to collect occupational information. However, the level of occupa-tional aggregation employed in the ACS is quite different since the ACS’s data collection objectives are far broader than those of the OES program. Occupational employment estimates can differ considerably between the OES program and the ACS program since employer classifications of jobs by occupation used in the OES program may differ from those of household respondents in the ACS program and the occupational level of aggregation that is available from each program differs considerably.
We use the OES survey to provide us with the basic measure of trends in labor demand in health care support and direct care occupations, but rely on ACS based measures to examine the characteristics of persons who are supplying labor to these occupations. It is important to note that this is not an effort to conduct a supply-demand matching process. Rather, our more modest ambition in this paper is to examine trends in the demand for work-ers in these occupations and develop some insight into the characteristics and behavior of persons who supply labor in these same occupations.
Finally, the reader should know that the measure of personal care aides available from the OES survey appears to have a very large downward bias. Personal care attendants funded under the Commonwealth’s MassHealth Office of Long Term Services and Supports were not included within the scope of regular wage and salary workers in any BLS establishment survey, including the OES program, until the beginning of 2013.2 Prior to that time, MassHealth-funded PCAs were classified as domestic household workers (similar to live-in maids or nannies) and not included in the scope of any BLS payroll survey.
Changes in the interpretation of the Fair Labor Standards Act (FLSA) by the U.S. Secretary of Labor have resulted in a series of legal battles that ended in a U.S. Supreme Court decision that had important effects for pub-licly funded PCA and home health workers regarding wage, hour, and over-time protections under the FLSA. One side effect of the re-classification of these workers from FLSA exempt to FLSA covered status is that PCAs were shifted to within the scope of all BLS establishment surveys. At the state level, this meant that MassHealth funded PCAs would be included in the monthly sample survey jobs measures published by DLWD as well as its quarterly census of jobs counts. However, while other BLS business estab-lishment survey programs have made modifications that have brought PCA jobs within the scope of the program, the OES program has not yet been able to include MassHealth funded PCAs in its survey scope3
The omission of the MassHealth PCA jobs from the scope of the OES
survey means that the OES data on the personal care aide employment we rely on in this report substantially understates the number of PCA jobs in the state. The size of this bias may be quite large. We estimate that the MassHealth PCA program financed about 34,000 PCA jobs each month during 2014.4 It is likely that a substantial portion, if not all, of this employ-ment is excluded from the OES estimates we rely on in this paper. In an effort to adjust the OES time trend data, we requested information about PCA employment and wage trends from several state agencies, but at the time of the preparation of this study have not been able to secure any usable data from these organizations.5
Some of the data on wealth included in this paper are based on the Survey of Consumer Finances (SCF). The SCF is a random sample survey spon-sored by the U.S. Federal Reserve Board of Governors in cooperation with the U.S. Treasury Department. Since 1983, the SCF is conducted every three years to access detailed financial and non-financial condition of American households. Unlike other surveys, the supplemental SCF in-cludes an oversample of the nation’s most wealthy families based on Internal Revenue Service records provided by the U.S. Department of the Treasury. It should be noted that for confidentiality, the SCF intentionally excludes all individuals identified as being part of the Forbes Magazine’s 400 wealthiest households.
Apart from demographic and labor force information, the SCF collects a wide array of financial and non-financial information in the calendar year prior to the survey. These information include various types of assets and debts, use of various financial services such as checking deposits, savings accounts, CD’s, stocks, bonds, retirement accounts, life insurance, non-financial assets (vehicles, homes, land, ranches, non-residential property, business equity) and more. Public use data files that exclude any personal identifiable information of respondents are available to researchers on the Federal Reserve Board’s Web site.
THE ROLE OF HEALTH SERVICES IN PRIVATE SECTOR EMPLOYMENT GROWTH IN THE LATTER STAGES OF THE JOB MARKET RECOVERY IN MASSACHUSETTSThe Massachusetts job market recovered smartly from the losses that oc-curred during the Great Recession that took place in the nation between 2008 and 2010. By May 2013, the state recovered all the payroll jobs that it lost during that period. Indeed, Massachusetts was among the nation’s leaders in its rate of jobs recovery from job losses incurred during the pe-riod of decline in economic activity and payroll employment levels.6 Private sector employment in the Commonwealth grew by 231,000 between the first half of 2013 (2013 I&II) and the first half of (2017 I&II), a rise of about 8 percent over the four-year period.7 Except in manufacturing, all other major industry sectors in Massachusetts saw their overall employment levels rise.
The state’s construction sector led all industries in its pace of recovery from the recession. Overall construction sector employment increased by almost 28,000 jobs between 2013 I&II and 2017 I&II, a nearly one quarter rise in payroll employment, while the construction sector accounted for just 4.1 percent of payroll jobs during 2013 I&II, the rapid cyclical rebound in jobs meant that construction employers accounted for about one in eight (12%) of new payroll jobs created in the state in the last four years.

6
health care and social services industry during 2013-II, when the sector’s payroll employment averaged 559,000. By 2017-II, employment in the sec-tor increased to 624,200, a rise of 65,000 jobs, accounting for more than one-quarter of all private sector payroll employment gains in the state. The health care and social services sector in Massachusetts has grown at about 1.5 times the pace of overall payroll employment in the state in recent years. Recent national employment projections suggest that health care and so-cial assistance sector employment will account for one-third of all net new jobs created in the American economy over the next decade. In the sections below, we examine developments in the health care and social service in-dustry during the current economic recovery by examining the various components of the super-sector identifying those elements that are closely tied to health care finance and service delivery and then identifying those parts of the health care sector that are most likely to dominate employment growth in the state.
THE EMPLOYMENT STRUCTURE OF THE MASSACHUSETTS HEALTH CARE SYSTEMBefore we examine detailed employment developments in home health care, it is useful to discuss the data used in this analysis and the way that it is organized. In this way, we can develop insight into the industrial struc-ture of employment within the state’s mammoth health care system and how that structure has changed in recent years—and track the emerging role of the home health care and services to elderly and disabled persons industry in providing long term care (LTC) for a rapidly expanding
The professional and technical services industry also saw its payroll em-ployment levels expand rapidly in recent years. During 2013 I&II, the pro-fessional and technical service producers including engineering firms, computer systems design and development firms, specialized design firms (ranging from interior design to industrial design), management, and ac-counting consultant firms and scientific research providers employed 272,800 payroll workers. Over the next four years, this industry saw its employment level rise to 312,000, an increase of more than 39,000 jobs ac-counting for 17 percent of the net rise in employment in the state over the period.
Employment in the accommodation and food services industry grew at slightly above the overall pace of private sector employment in the state (about 9 percent), but given the sector’s size, this more moderate pace of expansion still resulted in the creation of more than 25,000 jobs, account-ing for 11 percent of net job growth in the state between 2013 I&II and 2017 I&II.
The most important source of new job creation in the state during the latter part of the current jobs recovery has been the health and social ser-vices industry. The health and social services ‘super sector’ is composed of a wide range of health care providers that is combined with private sector social service providers ranging from child care providers to community food and housing relief organizations.8 Employment among health and so-cial service providers was the leading source of new job creation in Massachusetts for two decades, continuing its record dating back to 2000 as the central component of employment stability and job growth through-out the Commonwealth.9 One in five private sector jobs were in the state’s
Table 1. Trends in Covered Private Sector Wage and Salary Employment in Massachusetts, by Major Industry Sector,2013 I&II to 2017 I&II
Source: U.S. Bureau of Labor Statistics, Quarterly Census of Employment and Wages, various quarters, tabulations by authors.
Total, all industries
Agriculture, forestry, fishing and hunting
Mining, quarrying, and oil and gas extraction
Utilities
Construction
Manufacturing
Wholesale trade
Retail trade
Transportation and warehousing
Information
Finance and insurance
Real estate and rental and leasing
Professional and technical services
Management of companies and enterprises
Administrative and waste services
Educational services
Health care and social assistance
Arts, entertainment, and recreation
Accommodation and food services
Other services, except public administration
2,836,713
6,401
836
10,007
115,912
250,139
122,380
342,106
72,293
85,362
164,761
41,010
272,773
63,770
162,746
134,509
559,050
48,139
274,663
109,855
2013Average I & II
3,067,759
7,385
960
11,179
143,852
243,392
124,841
350,079
83,672
91,039
169,385
45,522
311,994
66,823
177,982
142,361
624,262
56,513
299,938
116,581
2017Average I & II
231,046
984
124
1,173
27,940
-6,747
2,461
7,973
11,379
5,677
4,624
4,511
39,222
3,053
15,236
7,851
65,212
8,374
25,276
6,726
AbsoluteChange
8%
15%
15%
12%
24%
-3%
2%
2%
16%
7%
3%
11%
14%
5%
9%
6%
12%
17%
9%
6%
100%
0%
0%
1%
12%
-3%
1%
3%
5%
2%
2%
2%
17%
1%
7%
3%
28%
4%
11%
3%
PercentChange
Contributionto Change
7
treatment and support services, often through short term in- patient care as well as long term residential facilities of various types, but increasingly through a wide range of outpatient service providers.
Social services have not usually been included in the health care services industry as social service providers have largely focused on non-medical social problems including community food and shelter services, emer-gency relief, and more recently childcare services. However, over the past decade the health care delivery system has become increasingly reliant on personal care attendants to provide in-home support to the chronically ill and disabled population.
Our earlier work on the impact of Chapter 224 found a strong connection developing between the healthcare delivery system and the social services system in the state. Personal care attendants emerged as a critical link in health care delivery in their role of providing non-health support services in the activities of daily living of chronically ill and disabled persons unable to manage these activities themselves. In this way, PCA consumers can live independent lives, remain at home, and avoid very costly institutionaliza-tion in nursing homes and hospitals and other medical/healthcare residen-tial facilities. Employment in the state’s social assistance industry is also quite substantial, averaging 136,376 during the second half of 2017, ac-counting for about 22 percent of the overall health care and social assis-tance industry in the state.
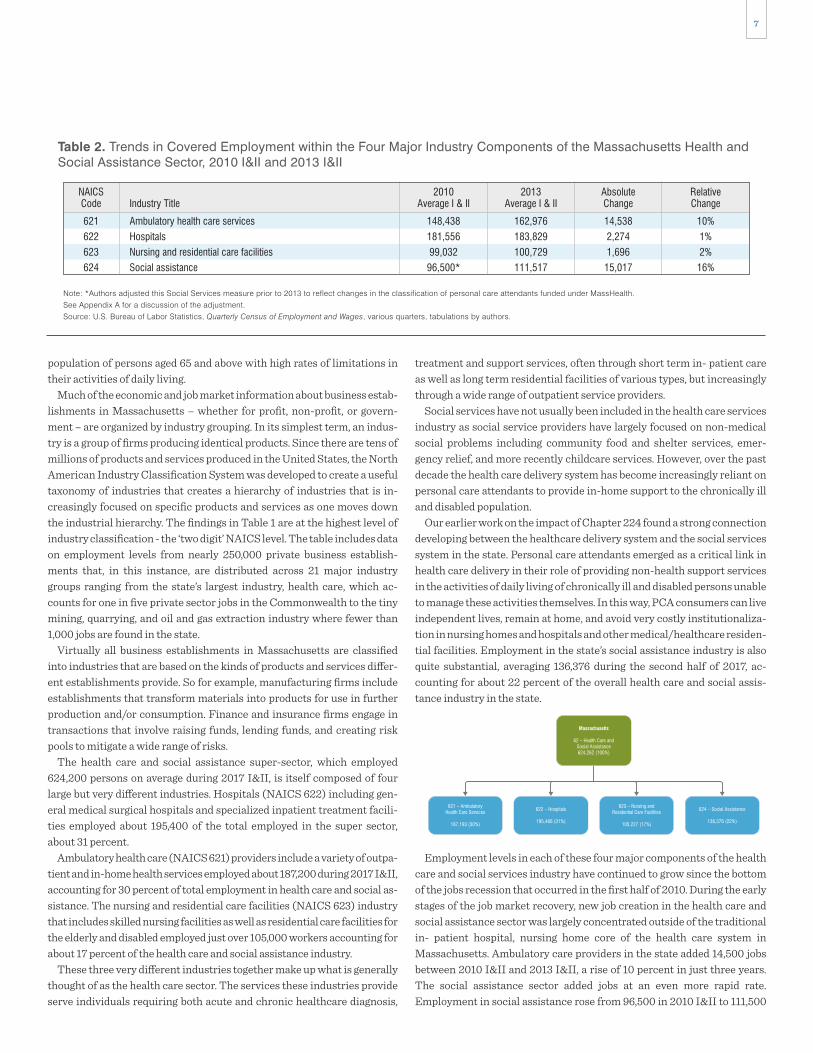
Employment levels in each of these four major components of the health care and social services industry have continued to grow since the bottom of the jobs recession that occurred in the first half of 2010. During the early stages of the job market recovery, new job creation in the health care and social assistance sector was largely concentrated outside of the traditional in- patient hospital, nursing home core of the health care system in Massachusetts. Ambulatory care providers in the state added 14,500 jobs between 2010 I&II and 2013 I&II, a rise of 10 percent in just three years. The social assistance sector added jobs at an even more rapid rate. Employment in social assistance rose from 96,500 in 2010 I&II to 111,500
622 – Hospitals
187,193 (30%) 195,466 (31%) 136,376 (22%)105,227 (17%)
population of persons aged 65 and above with high rates of limitations in their activities of daily living.
Much of the economic and job market information about business estab-lishments in Massachusetts – whether for profit, non-profit, or govern-ment – are organized by industry grouping. In its simplest term, an indus-try is a group of firms producing identical products. Since there are tens of millions of products and services produced in the United States, the North American Industry Classification System was developed to create a useful taxonomy of industries that creates a hierarchy of industries that is in-creasingly focused on specific products and services as one moves down the industrial hierarchy. The findings in Table 1 are at the highest level of industry classification - the ‘two digit’ NAICS level. The table includes data on employment levels from nearly 250,000 private business establish-ments that, in this instance, are distributed across 21 major industry groups ranging from the state’s largest industry, health care, which ac-counts for one in five private sector jobs in the Commonwealth to the tiny mining, quarrying, and oil and gas extraction industry where fewer than 1,000 jobs are found in the state.
Virtually all business establishments in Massachusetts are classified into industries that are based on the kinds of products and services differ-ent establishments provide. So for example, manufacturing firms include establishments that transform materials into products for use in further production and/or consumption. Finance and insurance firms engage in transactions that involve raising funds, lending funds, and creating risk pools to mitigate a wide range of risks.
The health care and social assistance super-sector, which employed 624,200 persons on average during 2017 I&II, is itself composed of four large but very different industries. Hospitals (NAICS 622) including gen-eral medical surgical hospitals and specialized inpatient treatment facili-ties employed about 195,400 of the total employed in the super sector, about 31 percent.
Ambulatory health care (NAICS 621) providers include a variety of outpa-tient and in-home health services employed about 187,200 during 2017 I&II, accounting for 30 percent of total employment in health care and social as-sistance. The nursing and residential care facilities (NAICS 623) industry that includes skilled nursing facilities as well as residential care facilities for the elderly and disabled employed just over 105,000 workers accounting for about 17 percent of the health care and social assistance industry.
These three very different industries together make up what is generally thought of as the health care sector. The services these industries provide serve individuals requiring both acute and chronic healthcare diagnosis,
Table 2. Trends in Covered Employment within the Four Major Industry Components of the Massachusetts Health andSocial Assistance Sector, 2010 I&II and 2013 I&II
Note: *Authors adjusted this Social Services measure prior to 2013 to reflect changes in the classification of personal care attendants funded under MassHealth. See Appendix A for a discussion of the adjustment.Source: U.S. Bureau of Labor Statistics, Quarterly Census of Employment and Wages, various quarters, tabulations by authors.
Ambulatory health care services
Hospitals
Nursing and residential care facilities
Social assistance
621
622
623
624
NAICSCode
148,438
181,556
99,032
96,500*
2010Average I & IIIndustry Title
162,976
183,829
100,729
111,517
2013Average I & II
14,538
2,274
1,696
15,017
10%
1%
2%
16%
AbsoluteChange
RelativeChange
Massachusetts
62 – Health Care andSocial Assistance624,262 (100%)
622 – Hospitals
195,466 (31%)
624 – Social Assistance
136,376 (22%)
621 – AmbulatoryHealth Care Services
187,193 (30%)
623 – Nursing andResidential Care Facilities
105,227 (17%)
8
percent annually and adding more than 24,800 jobs over the 2013 I&II and 2017 I&II period.
Hospital employment levels did begin to grow at a modestly more rapid pace than in the early stages of the recovery, adding 11,600 jobs and growing at just under 2 percent per year.
Nursing home and residential care facilities also saw modest employment growth since 2013 I&II, but much of this slow growth masks sharp differ-ences in employment trends within different elements of this industry.10
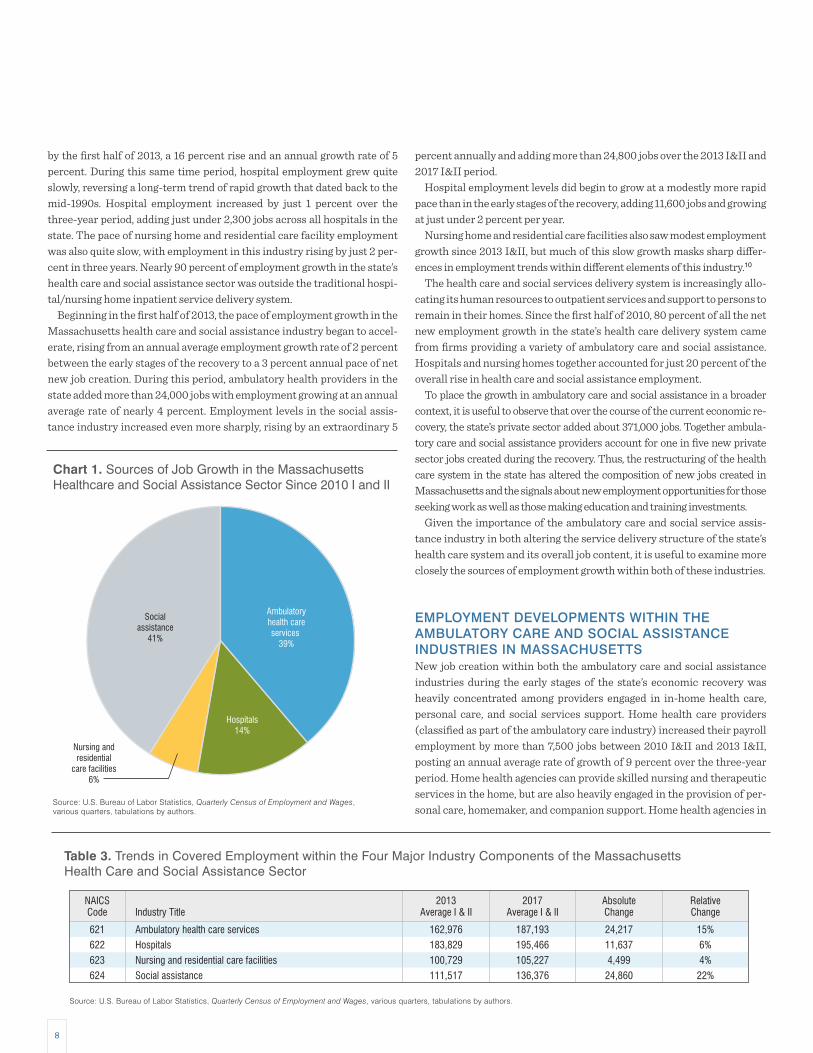
The health care and social services delivery system is increasingly allo-cating its human resources to outpatient services and support to persons to remain in their homes. Since the first half of 2010, 80 percent of all the net new employment growth in the state’s health care delivery system came from firms providing a variety of ambulatory care and social assistance. Hospitals and nursing homes together accounted for just 20 percent of the overall rise in health care and social assistance employment.
To place the growth in ambulatory care and social assistance in a broader context, it is useful to observe that over the course of the current economic re-covery, the state’s private sector added about 371,000 jobs. Together ambula-tory care and social assistance providers account for one in five new private sector jobs created during the recovery. Thus, the restructuring of the health care system in the state has altered the composition of new jobs created in Massachusetts and the signals about new employment opportunities for those seeking work as well as those making education and training investments.
Given the importance of the ambulatory care and social service assis-tance industry in both altering the service delivery structure of the state’s health care system and its overall job content, it is useful to examine more closely the sources of employment growth within both of these industries.
EMPLOYMENT DEVELOPMENTS WITHIN THE AMBULATORY CARE AND SOCIAL ASSISTANCE INDUSTRIES IN MASSACHUSETTSNew job creation within both the ambulatory care and social assistance industries during the early stages of the state’s economic recovery was heavily concentrated among providers engaged in in-home health care, personal care, and social services support. Home health care providers (classified as part of the ambulatory care industry) increased their payroll employment by more than 7,500 jobs between 2010 I&II and 2013 I&II, posting an annual average rate of growth of 9 percent over the three-year period. Home health agencies can provide skilled nursing and therapeutic services in the home, but are also heavily engaged in the provision of per-sonal care, homemaker, and companion support. Home health agencies in
by the first half of 2013, a 16 percent rise and an annual growth rate of 5 percent. During this same time period, hospital employment grew quite slowly, reversing a long-term trend of rapid growth that dated back to the mid-1990s. Hospital employment increased by just 1 percent over the three-year period, adding just under 2,300 jobs across all hospitals in the state. The pace of nursing home and residential care facility employment was also quite slow, with employment in this industry rising by just 2 per-cent in three years. Nearly 90 percent of employment growth in the state’s health care and social assistance sector was outside the traditional hospi-tal/nursing home inpatient service delivery system.
Beginning in the first half of 2013, the pace of employment growth in the Massachusetts health care and social assistance industry began to accel-erate, rising from an annual average employment growth rate of 2 percent between the early stages of the recovery to a 3 percent annual pace of net new job creation. During this period, ambulatory health providers in the state added more than 24,000 jobs with employment growing at an annual average rate of nearly 4 percent. Employment levels in the social assis-tance industry increased even more sharply, rising by an extraordinary 5
Table 3. Trends in Covered Employment within the Four Major Industry Components of the MassachusettsHealth Care and Social Assistance Sector
Source: U.S. Bureau of Labor Statistics, Quarterly Census of Employment and Wages, various quarters, tabulations by authors.
Ambulatory health care services
Hospitals
Nursing and residential care facilities
Social assistance
621
622
623
624
NAICSCode
162,976
183,829
100,729
111,517
2013Average I & IIIndustry Title
187,193
195,466
105,227
136,376
2017Average I & II
24,217
11,637
4,499
24,860
15%
6%
4%
22%
AbsoluteChange
RelativeChange
Source: U.S. Bureau of Labor Statistics, Quarterly Census of Employment and Wages, various quarters, tabulations by authors.
Chart 1. Sources of Job Growth in the MassachusettsHealthcare and Social Assistance Sector Since 2010 I and II
Ambulatoryhealth careservices
39%
Hospitals14%
Nursing andresidential
care facilities6%
Socialassistance
41%

9
is a subset of the individual and family care component of the social assis-tance industry. We focus on the services to the elderly and disabled not only because it is a very rapid source of new job creation in an industry devoted to in-home support services, but also because it is that industry in which the employment of the MassHealth personal care attendants is counted.
Employment in the services to the elderly and the disabled industry rose from about 37,400 jobs during 2010 I&II to 46,746 by 2013 I&II, an increase of more than 9,400 positions in the three-year period, yielding an annual average employment growth rate of 8 percent. The services to the elderly
the state accounted for more than one-half of all new jobs created in the ambulatory care sector during the first three years of job market recovery in the state.
Employment in establishments that provide services to the elderly and disabled has grown at a robust pace during the early stages of the state’s job market recovery. Workers in this industry provide services to improve the quality of life for chronically ill, elderly and disabled persons who are lim-ited in their activities of daily living, by providing personal care assistance and homemaker services. The services to the elderly and disabled industry
Table 4. Trends in Detailed Industry Components of the Ambulatory Care Industry in Massachusetts,2010 I&II to 2013 I&II
Source: U.S. Bureau of Labor Statistics, Quarterly Census of Employment and Wages, various quarters, tabulations by authors.
Offices of physicians
Offices of dentists
Offices of other health practitioners
Outpatient care centers
Medical and diagnostic laboratories
Home health care services
Other ambulatory health care services
Total, all Ambulatory Care
6211
6212
6213
6214
6215
6216
6219
NAICSCode
52,272
22,006
14,612
19,356
4,953
27,662
7,577
148,438
2010Average I & IIIndustry Title
54,193
22,591
16,083
21,743
5,331
35,215
7,819
162,976
2013Average I & II
1,921
586
1,471
2,387
378
7,553
242
14,538
4%
3%
10%
12%
8%
27%
3%
10%
AbsoluteChange
PercentChange
Table 5. Trends in Detailed Industry Components of the Social Assistance Industry in Massachusetts,2010 I&II to 2013 I&II
Source: U.S. Bureau of Labor Statistics, Quarterly Census of Employment and Wages, various quarters, tabulations by authors.
Adjusted Individual and Family care
*Adjusted Services to Elderly and disabled
Emergency and other relief services
Vocational rehabilitation services
Child day care services
Total
6241
62412
6242
6243
6244
NAICSCode
58,809*
37,397*
5,791
8,687
23,283
96,570
2010Average I & IIIndustry Title
71,804
46,746
5,930
9,957
23,825
111,517
2013Average I & II
13,075
9,429
140
1,270
542
15,027
22%
25%
2%
15%
2%
16%
AbsoluteChange
PercentChange
Table 6. Trends in Detailed Industry Components of the Ambulatory Care Industry in Massachusetts,2013 I&II to 2017 I&II
Source: U.S. Bureau of Labor Statistics, Quarterly Census of Employment and Wages, various quarters, tabulations by authors.
Offices of physicians
Offices of dentists
Offices of other health practitioners
Outpatient care centers
Medical and diagnostic laboratories
Home health care services
Other ambulatory health care services
Total
6211
6212
6213
6214
6215
6216
6219
NAICSCode
54,193
22,591
16,083
21,743
5,331
35,215
7,819
162,976
2013Average I & IIIndustry Title
56,809
24,449
19,158
25,088
6,237
46,734
8,718
187,193
2017Average I & II
2,616
1,857
3,075
3,345
906
11,519
899
24,217
5%
8%
19%
15%
17%
33%
11%
15%
AbsoluteChange
PercentChange

10
The services to the elderly and disabled industry also posted extraordi-nary gains in overall payroll employment levels in the last few years. During the first half of 2013, employment in the services to the elderly and disabled industry averaged about 46,700, but by the first half of 2017 employment within the industry had increased by almost 17,500. We suspect that most of this rise was associated with a rapid expansion in the MassHealth per-sonal care attendant program.
The expansion of employment in the home health care and services to the elderly and disabled industries in Massachusetts signals an important change in the direction of the state’s health care delivery system. Since the beginning of the jobs recovery in Massachusetts in the first half of 2010, employment levels in these two industries has skyrocketed. Home health care employment rose by 69 percent (about 19,000 jobs), while employ-ment in the services to the elderly and disabled industry increased payroll employment levels and more rapidly grew by 77 percent over the 7-year period. While just 12 percent of all 2010 health care and social service sec-tor employment was in these industries, together they account for an as-tonishing 46 percent of all new health and social services jobs in
and disabled industry accounted for more than 60 percent of the total em-ployment rise in the social assistance industry. We suspect that much of this growth is the result of a rapid expansion in the size of MassHealth’s personal care attendant program. We will examine this issue more care-fully in a subsequent section of this paper.
We observed earlier that the pace of new job creation accelerated in both the ambulatory care and social assistance industries within the overall health care delivery system in recent years. The findings in Tables 5 and 6 reveal that this job growth was primarily fueled by continued rapid growth in both the home health care and services to elderly and disabled industries.
The findings in Table 6 reveal that total employment in the ambulatory care industry rose by more than 24,200 between 2013 I&II and 2017 I&II, a rise of 15 percent over the period. The home health care industry grew at more than twice the rate of the overall ambulatory care industry, rising by 33 percent and adding more than 11,500 jobs in just four years. Home health care agencies accounted for nearly half (48 percent) of the total em-ployment rise in the ambulatory care industry.
Table 7. Trends in Detailed Industry Components of the Social Assistance Industry in Massachusetts,2013 I&II to 2017 I&II
Source: U.S. Bureau of Labor Statistics, Quarterly Census of Employment and Wages, various quarters, tabulations by authors.
Individual and family services
Services for the elderly and disabled
Emergency and other relief services
Vocational rehabilitation services
Child day care services
Total
6241
62412
6242
6243
6244
NAICSCode
71,804
46,746
5,930
9,957
23,825
111,517
2013Average I & IIIndustry Title
92,693
64,232
6,555
9,772
27,357
136,376
2017Average I & II
20,889
17,486
625
-186
3,532
24,860
29%
37%
11%
-2%
15%
22%
AbsoluteChange
PercentChange
Table 8. The Industry Composition of County Employment in the Five Key Health Industries, Massachusetts, 2017 I-II
Source: U.S. Bureau of Labor Statistics, Quarterly Census of Employment and Wages, various quarters, tabulations by authors.
Barnstable
Berkshire
Bristol
Dukes
Essex
Franklin
Hampden
Hampshire
Middlesex
Nantucket
Norfolk
Plymouth
Suffolk
Worcester
State
County
15,242
8,239
37,740
300
57,637
2,202
47,219
6,971
101,725
204
46,145
29,740
128,965
60,675
543,002
2017 I & IIEmployment
31%
28%
28%
73%
27%
48%
26%
47%
30%
60%
35%
29%
15%
24%
26%
AdjustedAmbulatory Health
Care Services
25%
0%
23%
0%
20%
0%
25%
11%
28%
0%
18%
21%
71%
31%
35%
Hospitals
7%
15%
16%
27%
13%
45%
25%
19%
11%
40%
11%
13%
6%
13%
12%
Services toElderly andDisabled
7%
15%
16%
27%
13%
45%
25%
19%
11%
40%
11%
13%
6%
13%
12%
Nursing andResidential
Care Facilities
9%
9%
7%
0%
17%
7%
7%
6%
10%
0%
13%
11%
3%
8%
9%
100%
100%
100%
100%
100%
100%
100%
100%
100%
100%
100%
100%
100%
100%
100%
Home HealthCare Total
11
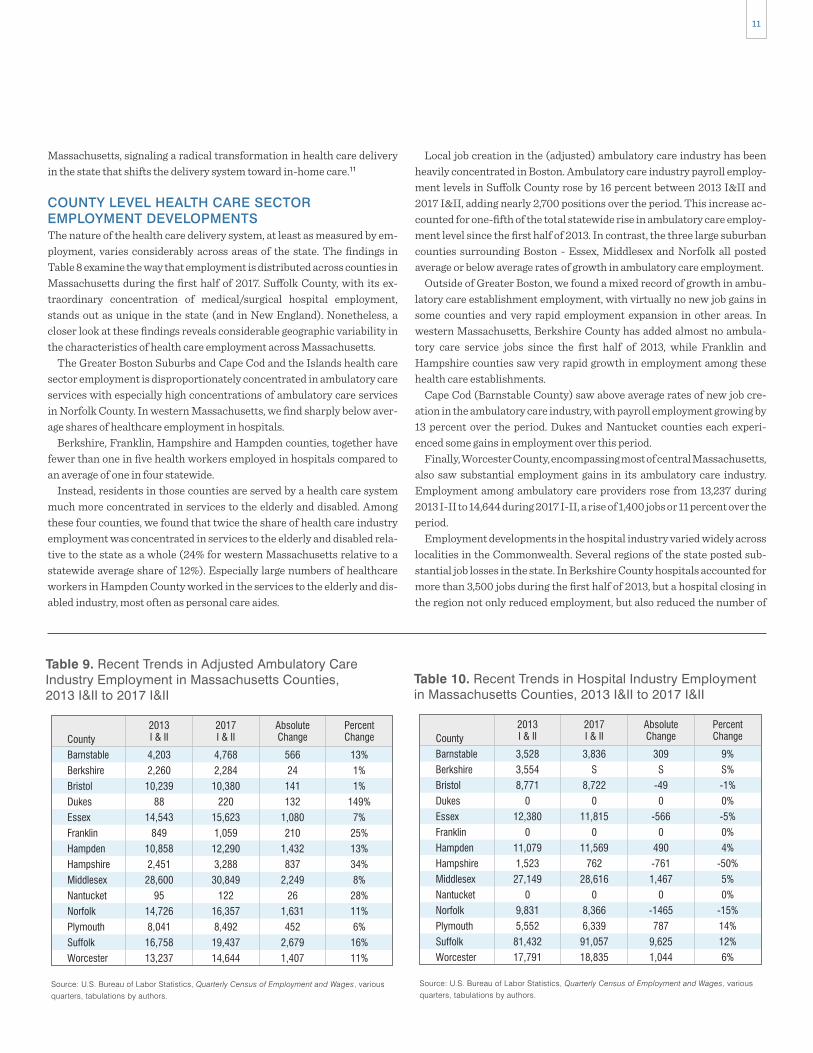
Local job creation in the (adjusted) ambulatory care industry has been heavily concentrated in Boston. Ambulatory care industry payroll employ-ment levels in Suffolk County rose by 16 percent between 2013 I&II and 2017 I&II, adding nearly 2,700 positions over the period. This increase ac-counted for one-fifth of the total statewide rise in ambulatory care employ-ment level since the first half of 2013. In contrast, the three large suburban counties surrounding Boston - Essex, Middlesex and Norfolk all posted average or below average rates of growth in ambulatory care employment.
Outside of Greater Boston, we found a mixed record of growth in ambu-latory care establishment employment, with virtually no new job gains in some counties and very rapid employment expansion in other areas. In western Massachusetts, Berkshire County has added almost no ambula-tory care service jobs since the first half of 2013, while Franklin and Hampshire counties saw very rapid growth in employment among these health care establishments.
Cape Cod (Barnstable County) saw above average rates of new job cre-ation in the ambulatory care industry, with payroll employment growing by 13 percent over the period. Dukes and Nantucket counties each experi-enced some gains in employment over this period.
Finally, Worcester County, encompassing most of central Massachusetts, also saw substantial employment gains in its ambulatory care industry. Employment among ambulatory care providers rose from 13,237 during 2013 I-II to 14,644 during 2017 I-II, a rise of 1,400 jobs or 11 percent over the period.
Employment developments in the hospital industry varied widely across localities in the Commonwealth. Several regions of the state posted sub-stantial job losses in the state. In Berkshire County hospitals accounted for more than 3,500 jobs during the first half of 2013, but a hospital closing in the region not only reduced employment, but also reduced the number of
Massachusetts, signaling a radical transformation in health care delivery in the state that shifts the delivery system toward in-home care.11
COUNTY LEVEL HEALTH CARE SECTOR EMPLOYMENT DEVELOPMENTSThe nature of the health care delivery system, at least as measured by em-ployment, varies considerably across areas of the state. The findings in Table 8 examine the way that employment is distributed across counties in Massachusetts during the first half of 2017. Suffolk County, with its ex-traordinary concentration of medical/surgical hospital employment, stands out as unique in the state (and in New England). Nonetheless, a closer look at these findings reveals considerable geographic variability in the characteristics of health care employment across Massachusetts.
The Greater Boston Suburbs and Cape Cod and the Islands health care sector employment is disproportionately concentrated in ambulatory care services with especially high concentrations of ambulatory care services in Norfolk County. In western Massachusetts, we find sharply below aver-age shares of healthcare employment in hospitals.
Berkshire, Franklin, Hampshire and Hampden counties, together have fewer than one in five health workers employed in hospitals compared to an average of one in four statewide.
Instead, residents in those counties are served by a health care system much more concentrated in services to the elderly and disabled. Among these four counties, we found that twice the share of health care industry employment was concentrated in services to the elderly and disabled rela-tive to the state as a whole (24% for western Massachusetts relative to a statewide average share of 12%). Especially large numbers of healthcare workers in Hampden County worked in the services to the elderly and dis-abled industry, most often as personal care aides.
Table 9. Recent Trends in Adjusted Ambulatory CareIndustry Employment in Massachusetts Counties,2013 I&II to 2017 I&II
Source: U.S. Bureau of Labor Statistics, Quarterly Census of Employment and Wages, various quarters, tabulations by authors.
County
Barnstable
Berkshire
Bristol
Dukes
Essex
Franklin
Hampden
Hampshire
Middlesex
Nantucket
Norfolk
Plymouth
Suffolk
Worcester
4,203
2,260
10,239
88
14,543
849
10,858
2,451
28,600
95
14,726
8,041
16,758
13,237
2013I & II
4,768
2,284
10,380
220
15,623
1,059
12,290
3,288
30,849
122
16,357
8,492
19,437
14,644
2017I & II
566
24
141
132
1,080
210
1,432
837
2,249
26
1,631
452
2,679
1,407
AbsoluteChange
13%
1%
1%
149%
7%
25%
13%
34%
8%
28%
11%
6%
16%
11%
PercentChange
Table 10. Recent Trends in Hospital Industry Employmentin Massachusetts Counties, 2013 I&II to 2017 I&II
Source: U.S. Bureau of Labor Statistics, Quarterly Census of Employment and Wages, various quarters, tabulations by authors.
County
Barnstable
Berkshire
Bristol
Dukes
Essex
Franklin
Hampden
Hampshire
Middlesex
Nantucket
Norfolk
Plymouth
Suffolk
Worcester
3,528
3,554
8,771
0
12,380
0
11,079
1,523
27,149
0
9,831
5,552
81,432
17,791
2013I & II
3,836
S
8,722
0
11,815
0
11,569
762
28,616
0
8,366
6,339
91,057
18,835
2017I & II
309
S
-49
0
-566
0
490
-761
1,467
0
-1465
787
9,625
1,044
AbsoluteChange
9%
S%
-1%
0%
-5%
0%
4%
-50%
5%
0%
-15%
14%
12%
6%
PercentChange

12
medical surgical facilities to three, below the standard that the Bureau of Labor Statistics uses to maintain confidentiality for its reporting employ-ers. Four other counties, Bristol (-1%) Essex (-5%), Hampshire (-50%) and Norfolk (-15%), also experienced employment losses in their hospital in-dustry employment levels.
Six counties posted hospital employment gains between 2013 I&II and 2017 I&II, but the overwhelming share of this increase occurred in Suffolk county where hospital payroll employment increased by more than 9,600 jobs, a 12 percent increase over the four year period. Plymouth and Barnstable County hospitals saw employment rise substantially, by 14 per-cent and 9 percent, respectively. Hampden, Middlesex, and Worcester counties all saw hospital payroll employment rise at more modest rates.
The nursing home and residential care industry, fueled by rapid gains in assisted living and drug and alcohol residential facilities has experienced employment gains in many counties in the state, despite declines in em-ployment in traditional nursing homes. Middlesex, Norfolk, Bristol and Worcester counties together accounted for most of the new job creation in the residential healthcare industry, but most other areas of the state expe-rienced at least some residential care growth. The major exception to this trend is in Hampshire County, where residential care employment fell nearly in half since the first half of 2013.
The home health care industry has been among the most important sources of new job creation in Massachusetts during the course of the cur-rent economic recovery. Since the first half of 2013, most regions of the state have posted substantial gains in employment in this industry, al-though the magnitude of this job creation has varied widely across the Commonwealth. Home health industry employment grew especially rap-idly in Hampden County where the total number of payroll workers in the industry increased from 1,896 during 2013 I&II to 3,529 by 2017 I&II, a rise
Table 11. Recent Trends in Nursing and ResidentialIndustry Employment in Massachusetts Counties,2013 I&II to 2017 I&II
Source: U.S. Bureau of Labor Statistics, Quarterly Census of Employment and Wages, various quarters, tabulations by authors.
County
Barnstable
Berkshire
Bristol
Dukes
Essex
Franklin
Hampden
Hampshire
Middlesex
Nantucket
Norfolk
Plymouth
Suffolk
Worcester
4,166
3,811
9,582
0
12,674
0
7,934
2,208
19,965
0
9,672
7,768
7,295
14,141
2013I & II
4,151
3,931
10,127
0
12,801
0
8,023
1,186
21,244
0
10,504
8,042
7,397
14,872
2017I & II
-15
120
546
0
127
0
90
-1,022
1,279
0
832
274
103
731
AbsoluteChange
0%
3%
6%
0%
1%
0%
1%
-46%
6%
0%
9%
4%
1%
5%
PercentChange
Table 12. Recent Trends in Home Health Care IndustryEmployment in Massachusetts Counties,2013 I&II to 2017 I&II
Source: U.S. Bureau of Labor Statistics, Quarterly Census of Employment and Wages, various quarters, tabulations by authors.
County
Barnstable
Berkshire
Bristol
Dukes
Essex
Franklin
Hampden
Hampshire
Middlesex
Nantucket
Norfolk
Plymouth
Suffolk
Worcester
1,486
666
1,970
110
6,867
325
1,896
253
7,898
0
4,243
2,390
2,976
3,920
2013I & II
1,417
759
2,488
0
10,004
160
3,529
386
10,208
0
6,029
3,148
3,689
4,696
2017I & II
-69
93
518
-110
3137
-165
1,633
133
2,310
0
1,786
758
713
776
AbsoluteChange
-5%
14%
26%
-100%
46%
-51%
86%
53%
29%
0
42%
32%
24%
20%
PercentChange
Table 13. Recent Trends in Services to the Elderly andDisabled Industry Employment in Massachusetts Counties,2013 I&II to 2017 I&II
Source: U.S. Bureau of Labor Statistics, Quarterly Census of Employment and Wages, various quarters, tabulations by authors.
County
Barnstable
Berkshire
Bristol
Dukes
Essex
Franklin
Hampden
Hampshire
Middlesex
Nantucket
Norfolk
Plymouth
Suffolk
Worcester
1,036
839
4,562
34
4,590
744
8,676
1,286
7,273
0
4,285
3,037
4,812
5,027
2013I & II
1,070
1,265
6,023
80
7,395
983
11,807
1,348
10,809
82
4,889
3,718
7,385
7,629
2017I & II
34
426
1,461
46
2,805
239
3,131
62
3,536
82
604
681
2,573
2,602
AbsoluteChange
3%
51%
32%
135%
61%
32%
36%
5%
49%
~
14%
22%
53%
52%
PercentChange

13
professionals with a large proportion of staff engaged in diagnostic and treatment occupations, including a wide range of physicians and dentists, along with staff in a variety of therapeutic and registered nursing fields, along with health technicians and technologists, including dental techni-cians and emergency medical technicians. The OES staffing data finds that 44 percent of employment among ambulatory care providers is concen-trated in a variety of health professional and technologist occupations.
Office and administrative support occupations account for the second largest share of employment in the ambulatory care industry. About one in four persons employed in the state’s ambulatory care industry work in some type of clerical occupation. Medical secretaries, receptionists, and billing clerks are the predominant clerical positions among ambulatory care providers in the state. Clerical staff account for a far greater propor-tion of ambulatory care staff than other sectors of the state’s health care delivery system.
Health care support occupations account for about one-sixth of total em-ployment among ambulatory care providers in Massachusetts. Most of these health care support staff work as either medical assistants or dental assistants; nurses’ aides and phlebotomists account for much of the rest of the health care support workers in the industry.
HospitalsWorkers in the health care professions dominate hospital employment in Massachusetts. Almost one-half (48%) of hospital staff in Massachusetts are employed in a health care professional or technical occupation. Health profession employment in hospitals is dominated by employment in regis-tered nurse occupations, with registered nurses accounting for one-quar-ter of all hospital employment in the state. Physicians and surgeons ac-count for about 5 percent of employment in the industry. Clerical workers account for about one in six hospital workers with substantial shares em-ployed as medical secretaries and customer service representatives.
Healthcare support workers account for slightly more than 10 percent of hospital staff in Massachusetts. Nurses’ aide is by far the largest healthcare support occupation within hospitals, followed by medical assistants. Non-health professional workers largely concentrated in community and social service occupations like social worker account for 9 percent of hospital employment in the state
Nursing Homes and Residential Care FacilitiesThe occupational composition of employment in the nursing home and res-idential care industry in Massachusetts is quite different from that observed in ambulatory care and hospitals where staffing patterns reflect those indus-tries’ focus on the delivery of medical care services. Over the years, employ-ment in the somewhat more medically oriented nursing home industry has fallen sharply, while residential care institutions have seen substantial job growth. Residential treatment facilities for persons with mental illness and substance abuse problems have low shares of health care professionals, in-stead relying on staff in the community and social worker occupations and personal care attendants to provide services. The rapidly growing continu-ing care and retirement community component of nursing home and resi-dential care facilities employs few health care professionals, instead em-ploying large shares of home health aides, personal care attendants, and food service workers. Nursing homes themselves still employ a considerable share of health care professionals primarily as registered nurses and
of 86 percent in just four years. Home health care establishments in Essex County added 3,137 jobs over the same period, a rise of 46 percent. Similarly, large absolute and relative employment gains among home health care em-ployers also occurred in Middlesex (+2,310 jobs) and Norfolk counties (+1,786 jobs).
Unlike the rest of the state, Cape Cod and the Islands (Dukes and Nantucket counties) experienced declines in their home health care indus-tries. Franklin County also posted home health care job losses over the 2013 I&II and 2013 I&II period.
The uniquely organized services to the elderly and disabled industry saw explosive growth in payroll employment over the 2013 I&II and 2017 I&II period. This expansion was, with a few exceptions, spread widely across the state. Essex County expanded employment in the services to the elderly and disabled industry by 61 percent in just four years, adding more than 2,800 jobs to the industry’s payroll employment levels. Berkshire (+51%), Suffolk (+53%), Middlesex (+49%), and Worcester (+52%) counties have all experienced rapid rates of employment gain in this industry, growing by about 50 percent in just four years.
Bristol (+32%), Franklin (+32%) and Hampden (+36%) counties all saw employment levels in the services to the elderly and disabled industry rise by about one-third since the first half of 2013. Cape Cod and the Islands together posted much more modest employment gains in these industries, with total services to elderly and the disabled employment levels in the three- county area rising by about 15 percent between 2013 I&II and 2017 I&II.
STAFFING IN HOME HEALTH CARE AGENCIES AND SERVICES TO THE ELDERLY AND DISABLED INDUSTRYHome health care and services to the disabled and elderly are not only the most rapidly growing elements of the state’s health care service delivery system, but they also provide qualitatively different services compared to most of the rest of the state’s health care providers. One way to discern the unique services that characterize the home health care and elderly and disabled service providers is to examine the nature of their staffing com-pared to that of the rest of the state’s health care system.
The data provided in Table 14 are derived from the U.S. Bureau of Labor Statistics Occupational Employment Statistics program that conducts a large-scale sample of employers to measure the occupational composition of employment in different industries at the state andnational level. Although the OES program can provide detailed occupational data for spe-cific industries, Table 14 presents highly aggregated occupational groupings within the five major health care provider industries in Massachusetts in order to highlight major differences in their occupational staffing patterns.
Ambulatory CareThe ambulatory care industry (all ambulatory care employment less home health care industry employment), hospital and nursing home and resi-dential care industries are composed of staff who work in occupations that are dedicated to the provision of medical services to advance the health status of patients. In contrast, the home health care and services to the el-derly and disabled industry staffing is dominated by occupations that help consumers meet their activities of daily living in their own homes.
Ambulatory health care firms that provide outpatient medical services to patients are characterized by a staff of highly educated health

14
work in registered nurse and various therapy occupations including phys-ical, occupational, and speech language therapy positions.
The home health care industry employs relatively few workers outside of the health care professions and direct care support fields. Indeed, only about 15 percent of the staff in this industry works in jobs that are either not health care service or patient direct care support positions. For the most part, these remaining workers are employed in management and office support positions.
Services to the Elderly and DisabledStaffing in the services to the elderly and disabled industry is unique in com-parison not only to other health care industries in Massachusetts, but also relative to any industry in the state. The personal care and service worker occupations overwhelm the occupational staffing pattern of this industry, accounting for nearly 80 percent of employment within the industry. Such concentration of employment in a single occupation simply does not occur in any other industry in either the state or national economy. Industry staff-ing patterns do vary a lot, but they are always characterized by a broad mix of occupations that are required in the production and distribution of any good or service. Specialization and division of labor explains the regular variabil-ity in staffing observed in virtually every production process in the state.
Certainly, most industries have a disproportionate share of workers who possess skills that are particularly required for production by that industry. Therefore, construction industries employ a disproportionate share of workers in the trades and hospitals are more likely to employ nurses than any other industry. Yet these industries’ staffing patterns are not over-whelming dominated by workers in either the trades or nursing. Instead, their staffing includes a comparatively broad range of workers who bring varied occupational skills to bear on producing goods and service. Our anal-ysis of the OES staffing data finds no other instance in which a major occu-pational group accounts for anywhere near the majority of employment in an industry. Yet we find that in the case of the services to the elderly and disabled industry, the overwhelming preponderance of employment is con-centrated in the personal care occupation.
The services to the elderly and disabled industry has a unique staffing pattern because of the often-uncommon nature of the employer-employee
licensed practical nurses as well has large proportions of healthcare support staff, primarily in the nurses’ aide occupation.
Reflecting this mix of firms in the overall industry, we find that health care professionals account for only about one in five jobs in the nursing home and residential care industry—less than half that observed in ambu-latory care and hospital establishments. Nurses’ aides play a key role in this industry and account for most of the health care support employment in nursing homes and residential care facilities. Personal care occupations, while a tiny share of the staff of hospitals and ambulatory care organiza-tions, account for one in six jobs within this industry.
Home Health CareThe home health care industry has a staffing pattern that is dominated by health care support occupations. The OES survey of Massachusetts estab-lishments in this industry found that 44 percent of total staffing is concen-trated in health care support occupations. Almost all health care support workers in this industry were employed as home health aides. The home health aide occupation covers a variety of job titles commonly found in the home healthcare industry, including homemaker and companion, but the common element of workers in this occupation is that they primarily pro-vide non-medical support to the chronically ill, disabled, and elderly who need support in activities of daily living like bathing and dressing, house-keeping, shopping and related activities.
Home health aides work under the direction of a supervisor, frequently a registered or licensed practical nurse. Home health aides who work for agencies that receive reimbursement from Medicare and Medicaid funds must be certified. The certification requires 75 hours of training, but many workers in the home health field work in job titles that do not require cer-tification, but still engage in typical home health aide job duties.
The home health care industry also employs substantial numbers of per-sonal care workers. Although considered part of a different occupational group, these personal care workers engage in supporting consumers in activities of daily living in a fashion quite similar to those employed as home health aides.
Health care professionals make up the second largest component of the home health care industry’s staffing. These health professionals primarily
Table 14. The Occupational Composition of Employment Within Specific Health Care Services Industries,Massachusetts, 2017 I&II
Source: U.S. Bureau of Labor Statistics, Quarterly Census of Employment and Wages, various quarters, tabulations by authors.
Total
Business and Management Occupations
Non-Health Professional Occupations
Healthcare Practitioners and Technical Occupations
Healthcare Support Occupations
Non-Health Service Occupations
Personal Care and Service Occupations
Office and Administrative Support Occupations
Blue Collar Occupations
140,540
5%
8%
44%
16%
1%
1%
24%
1%
Adjusted AmbulatoryCare (excepthome health)
201,840
8%
9%
48%
11%
6%
2%
14%
1%
HospitalsOccupations
104,990
6%
13%
19%
25%
12%
17%
5%
3%
Nursing Homes &Residential/ Continuing
Care Facilities
47,490
6%
2%
32%
44%
0%
9%
6%
0%
64,060
2%
5%
2%
5%
2%
79%
2%
2%
HomeHealthcare
Services toelderly andDisabled

15
To understand the unique nature of the PCA program employment, it is useful to compare the average number of employees in establishments in the other major components of the state’s health care delivery system. The findings in Table 15 reveal very sharp differences in the average size of es-tablishments within the specific industries that compose the health care delivery system in Massachusetts. Hospital establishments in the state are quite large, averaging 844 staffers in each establishment location. These large establishment sizes imply large gains to scale in the delivery of hospi-tal related services that are not found in other sectors of the state’s health care sector. Most of the other major kinds of health care providers have average employment sizes that are small fractions of those found for hospi-tals. The average employment level for (adjusted) ambulatory care provid-ers was just 14 workers during the first half of 2017 and 45 workers for nursing homes and residential care facilities.
The two health industries that are focused in home care are quite differ-ent with respect to the mean number of workers per establishment. Home health care agencies employ 61 workers per establishment—thus enabling this industry to have a staffing pattern with a wide range of health profes-sional and health support staff in addition to non-health related workers. In contrast, the mean establishment size within the services to elderly and disabled industry is under two workers. The result is an unprecedented level of homogeneity in the occupational structure of the industry. The staffing pattern in the services to elderly and disabled industry is the result of rapid growth in MassHealth’s PCA program.
MEAN WEEKLY EARNINGS IN THE FIVE KEY HEALTH CARE INDUSTRIESThe real (inflation adjusted) earnings of workers employed within the Massachusetts health care delivery system vary quite sharply across each of the five major sources of employment within the state’s health care sec-tor. The distribution of average weekly earnings across these industries largely reflected differences in the staffing patterns within the health care sector. The services to the elderly and disabled industry, dominated by em-ployment in the personal care aide occupation had pay that averaged just $395 per week during the first half of 2017, a rate of pay equal to just 28 per-cent of the average of all private sector employment. The low earnings in the services to elderly and disabled industry are the product of below average hours of work, low education and skill requirements and low hourly pay.
Weekly earnings in the home health care services industry averaged $732 during the first half of 2017, a rate of pay equal to just over one half of the earnings of all private sector workers in the state. The home health indus-try wage structure is itself quite wide ranging. A substantial share of em-ployment within the industry is concentrated in higher skilled health care practitioner occupations including registered nurse and various health therapy occupations including physical therapists and occupational thera-pists. These occupations generally pay above average to average weekly pay. However, as we found earlier, a large share of the home health care in-dustry staff is composed of lower skill health care support occupations in-cluding home health aides and personal care aides (about 44 percent of total industry employment). The earnings of these workers are well below that of other workers in the private sector, again, the result of reduced hours of work and low skill requirements associated with employment in health care support positions.
relationship found in a large share of positions within the industry. This relationship is unusual because of the important role that MassHealth’s personal care attendant program to support individuals with limitations in activities of daily living plays in job creation within this industry.
Employer-employee relationships are typically characterized by an ar-rangement where an employer hires a worker to produce a product or ser-vice in exchange for a wage payment made by the employer. The employer determines the specific day-to-day duties, responsibilities and activities of the employee and is responsible for the supervision and training of the employee.
The MassHealth funded personal care attendant (PCA) program is char-acterized by an atypical employer-employee relationship. Eligible persons with a disability are the employer of record under the program, although PCA wages are paid by taxpayers through MassHealth payroll vendors and the number of hours of work per week provided by PCAs is determined by local third-party vendors also funded by the state. Consumers are responsible for all other aspects of the employer-employee relationship including job duties, tasks, responsibilities, weekly scheduling of allowable hours, reporting of hours worked as well as PCA recruitment, training, hiring and dismissal.
Because of the unique nature of the employer-employee relationship, many employers in the industry have a firm size of just one payroll worker. There are no other staff in each of these economic units or as they are re-ferred to in the labor statistics world - establishments. Consequently, the lion’s share of the employment in the services to the elderly and disabled industry is concentrated in the personal care services occupational area. It is odd to think of personal care attendants as employed in an economic unit instead of a household, and up until the beginning of 2013, PCAs were deemed domestic workers working in private households—and so not cov-ered under the Fair Labor Standards Act (FLSA).
The U.S. Department of Labor determined that the PCA position was no longer a domestic job exempted from the requirements of the FLSA, but instead was a health care occupation that would be covered under that statute. One impact of this change is that beginning in 2013, the QCEW statistical program in Massachusetts no longer counted PCAs as part of the state’s private household employment sector, instead shifting PCA em-ployment to the services for elderly and disabled industry—better reflect-ing the nature of employment as health care or social support workers in these jobs.
Table 15. Mean Ratio of Payroll Employment toEstablishments in the Major Elements of the MassachusettsHealthcare Delivery System, 2017 II
Source: U.S. Bureau of Labor Statistics, Quarterly Census of Employment and Wages, various quarters, tabulations by authors.
Total Private
Ambulatory care
Hospital
Nursing and Residential Care
Home Health Care
Services to the Elderly and Disabled
Industry
13
14
844
45
61
1.7
Average EstablishmentSize

16
The home health care industry experienced no net increase in weekly wages, in part because many firms in this sector offer wages that are con-strained by reimbursement rates for services that have not increased in a decade, thus slow growth in per patient revenue constrains producer will-ingness and ability to raise worker wages, even when faced with severe labor supply problems. The real weekly earnings of workers in the services to the elderly and disabled industry rose by about 9 percent, close to the overall increase in real weekly wages among all private sector workers in the state. Part of this rise is the result of MassHealth providing a substantial rise in hourly wage rates to persons employed as personal care attendants that support Medicaid eligible chronically ill elderly and disabled persons to remain in their homes despite substantial limitations in their ability to perform basic activities of daily living. The state reimbursement rate for personal care attendants under the MassHealth PCA program is a collec-tively bargained wage rate. In 2016, Governor Charlie Baker signed a con-tract with 1199SEIU that would lead to a $15 per hour wage for PCAs by 2018.12
Health Care ProfessionsThe data reveal that the adjusted ambulatory care industry (all ambulatory care employment less home health care industry employment) has a staff-ing pattern heavily skewed toward the health professions. In Massachusetts, we find that 44 percent of all those employed in the adjusted ambulatory care industry work in health care practitioner and health care technology occupations. Health professionals in the ambulatory care fields are heavily concentrated in health diagnostic and treatment occupations including physicians, dentists and pharmacists, additionally considerable numbers of staff in this industry work in health therapeutic and various registered nursing occupations including nurse practitioners.
Weekly earnings in nursing and residential care facilities are also well below the state average pay for private sector workers. Nursing and res-idential care facilities had average weekly pay of $696 during the first half of 2017, equal to just one-half the mean weekly wage rate of all pri-vate sector workers. Staffing in the nursing and residential care industry is heavily oriented toward health care support, non-health care service (largely food service and preparation occupations) and personal care occupations. Employment in these occupations is generally character-ized by lower skill requirements, below average hours of work and lower hourly wage rates.
Staffing patterns in the Commonwealth’s hospital and adjusted ambula-tory care industries are dominated by employment concentrated in health care diagnostic and treatment occupations and to a lesser extent adminis-trative and clerical positions. Average weekly wages in these industries are reflective of this more skill intensive occupational structure. Weekly pay averaged $1,382 in the adjusted ambulatory care sector and $1397 in the state’s hospitals, weekly pay rates that were about equal to the earnings of all private sector workers in the Commonwealth during the first half of 2017 (101% and 102% respectively).
Trends in the real weekly earnings of Massachusetts health care workers are examined in Table 16. Earnings of workers in the health care sector have grown slowly compared to the overall rise in real mean weekly wages among private sector workers in the state. During the latter stages of the economic recovery in Massachusetts (2013 I&II to 2017 I&II) the inflation adjusted mean weekly wages of workers rose by $128, a rise of 10 percent. During the same period, the real mean weekly earnings of all staff em-ployed in the state’s ambulatory care industry increased by $38 or just 3 percent. Hospital weekly wage growth was similarly slow, rising by just 4 percent over the last four years.
$0
$400
$200
$600
$800
$1,000
$1,200
$1,400
$1,600
All PrivateSector
Adjusted AmbulatoryCare Wage
Hospitals Home healthcare services
Nursing and residentialcare facilities
Services for the elderlyand disabled
$1,370 $1,382 $1,397
$732$696
$395
Source: U.S. Bureau of Labor Statistics, Quarterly Census of Employment and Wages, various quarters, tabulations by authors.
Chart 2. Average Weekly Earnings of Workers in the Massachusetts Health Care Sector, 2017 I&II
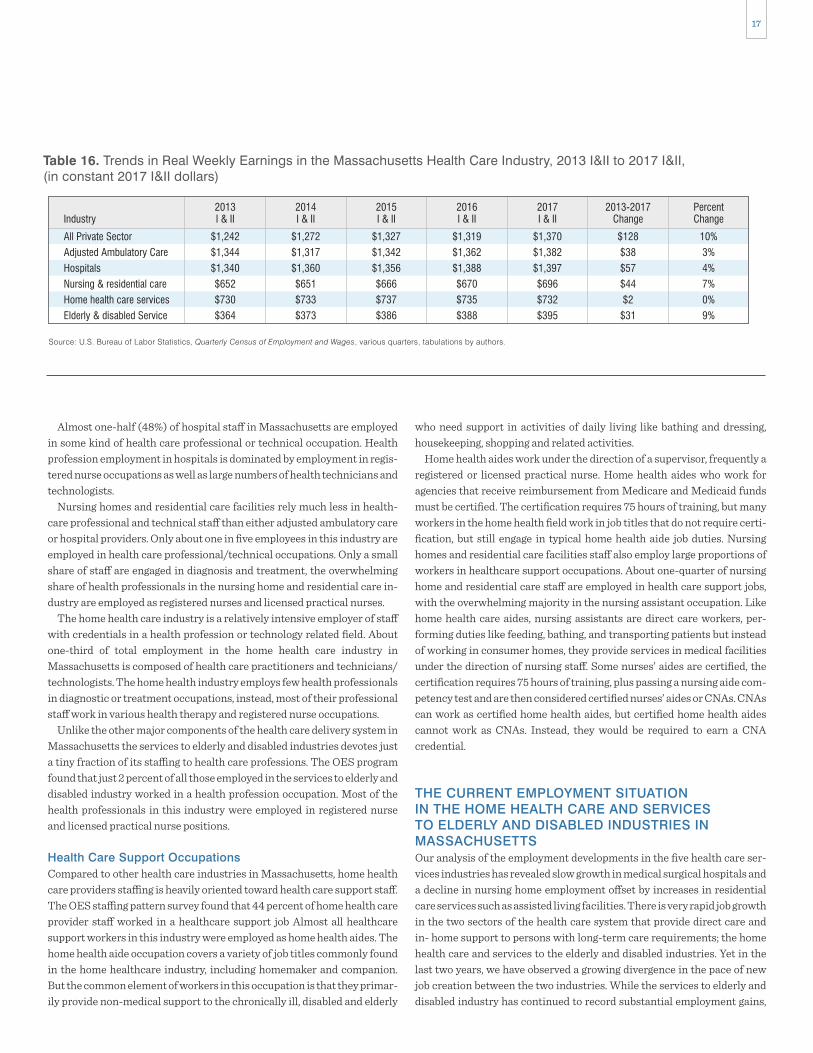
17
who need support in activities of daily living like bathing and dressing, housekeeping, shopping and related activities.
Home health aides work under the direction of a supervisor, frequently a registered or licensed practical nurse. Home health aides who work for agencies that receive reimbursement from Medicare and Medicaid funds must be certified. The certification requires 75 hours of training, but many workers in the home health field work in job titles that do not require certi-fication, but still engage in typical home health aide job duties. Nursing homes and residential care facilities staff also employ large proportions of workers in healthcare support occupations. About one-quarter of nursing home and residential care staff are employed in health care support jobs, with the overwhelming majority in the nursing assistant occupation. Like home health care aides, nursing assistants are direct care workers, per-forming duties like feeding, bathing, and transporting patients but instead of working in consumer homes, they provide services in medical facilities under the direction of nursing staff. Some nurses’ aides are certified, the certification requires 75 hours of training, plus passing a nursing aide com-petency test and are then considered certified nurses’ aides or CNAs. CNAs can work as certified home health aides, but certified home health aides cannot work as CNAs. Instead, they would be required to earn a CNA credential.
THE CURRENT EMPLOYMENT SITUATION IN THE HOME HEALTH CARE AND SERVICES TO ELDERLY AND DISABLED INDUSTRIES IN MASSACHUSETTSOur analysis of the employment developments in the five health care ser-vices industries has revealed slow growth in medical surgical hospitals and a decline in nursing home employment offset by increases in residential care services such as assisted living facilities. There is very rapid job growth in the two sectors of the health care system that provide direct care and in- home support to persons with long-term care requirements; the home health care and services to the elderly and disabled industries. Yet in the last two years, we have observed a growing divergence in the pace of new job creation between the two industries. While the services to elderly and disabled industry has continued to record substantial employment gains,
Almost one-half (48%) of hospital staff in Massachusetts are employed in some kind of health care professional or technical occupation. Health profession employment in hospitals is dominated by employment in regis-tered nurse occupations as well as large numbers of health technicians and technologists.
Nursing homes and residential care facilities rely much less in health-care professional and technical staff than either adjusted ambulatory care or hospital providers. Only about one in five employees in this industry are employed in health care professional/technical occupations. Only a small share of staff are engaged in diagnosis and treatment, the overwhelming share of health professionals in the nursing home and residential care in-dustry are employed as registered nurses and licensed practical nurses.
The home health care industry is a relatively intensive employer of staff with credentials in a health profession or technology related field. About one-third of total employment in the home health care industry in Massachusetts is composed of health care practitioners and technicians/technologists. The home health industry employs few health professionals in diagnostic or treatment occupations, instead, most of their professional staff work in various health therapy and registered nurse occupations.
Unlike the other major components of the health care delivery system in Massachusetts the services to elderly and disabled industries devotes just a tiny fraction of its staffing to health care professions. The OES program found that just 2 percent of all those employed in the services to elderly and disabled industry worked in a health profession occupation. Most of the health professionals in this industry were employed in registered nurse and licensed practical nurse positions.
Health Care Support OccupationsCompared to other health care industries in Massachusetts, home health care providers staffing is heavily oriented toward health care support staff. The OES staffing pattern survey found that 44 percent of home health care provider staff worked in a healthcare support job Almost all healthcare support workers in this industry were employed as home health aides. The home health aide occupation covers a variety of job titles commonly found in the home healthcare industry, including homemaker and companion. But the common element of workers in this occupation is that they primar-ily provide non-medical support to the chronically ill, disabled and elderly
Table 16. Trends in Real Weekly Earnings in the Massachusetts Health Care Industry, 2013 I&II to 2017 I&II,(in constant 2017 I&II dollars)
Source: U.S. Bureau of Labor Statistics, Quarterly Census of Employment and Wages, various quarters, tabulations by authors.
All Private Sector
Adjusted Ambulatory Care
Hospitals
Nursing & residential care
Home health care services
Elderly & disabled Service
Industry
$128
$38
$57
$44
$2
$31
10%
3%
4%
7%
0%
9%
2013-2017Change
$1,370
$1,382
$1,397
$696
$732
$395
2017I & II
$1,319
$1,362
$1,388
$670
$735
$388
2016I & II
$1,327
$1,342
$1,356
$666
$737
$386
2015I & II
$1,272
$1,317
$1,360
$651
$733
$373
2014I & II
$1,242
$1,344
$1,340
$652
$730
$364
2013I & II
PercentChange

18
into this development. It is also important to understand if these differ-ences in the pace of new job creation are a portent of things to come, they may have important implications for the nature of direct care employment growth in the future. We begin by examining the home health care industry in the state, relying on the findings of a recent study funded by Tufts Health Plan Foundation and prepared by Hayley Gleason of the Massachusetts Home Care Aide Council.
Home Health CareThe home care industry in Massachusetts is composed of about 780 busi-ness establishments with an average employment size of each establish-ment of about 60 workers. While specific measures of the size class distri-bution of employment is not available, our meetings with business owners, public officials and others knowledgeable about the industry confirm that the industry is largely composed of small firms that compete in local area markets. Gleason’s study of firms in the home health care industry is con-sistent with this measure but has the advantage of examining the employ-ment size distribution of sample respondents. She found a few large firms with 500 or more staffers, but the vast majority of respondents in her study employed fewer than 100 workers.13
Home health care firms in the state generate revenue from a wide variety of sources. Federal and state resources are important sources of income for these establishment including federal waiver programs (Money Follows the Person (MFTI) and Acquired Brain Injury Traumatic Brain Injury (ABITBI). Only about one-quarter of firms report income from the Medicare program, which makes payments for certain, LTC type supports for a limited period of time after an acute hospital stay. A substantial share of firms reported receiving some type of payments from state funded
employment levels in the home health care industry have remained largely unchanged.
The data in Chart 3 examine recent trends in the payroll employment in the Massachusetts home health care and services to the elderly and dis-abled from the first quarter of 2016 through the third quarter of 2017, the most recent detailed data available from the U.S. Bureau of Labor Statistics. The findings reveal that between the beginning of 2016 and the third quar-ter of 2017, the services to elderly and disabled industry continued its strong record of employment gains. Payroll employment rose from just under 60,000 jobs, on average, during 2016 I to 65,200 by 2017 III, an in-crease of 8.8 percent. In contrast, we found that employment levels in the home health care services industry remained largely unchanged over the same period.
During 2016, I home health care providers averaged 46,246 workers on their payrolls each month during the quarter, rising by 1,000 jobs to 47,270 positions, on average during the next quarter, 2016 II. Since then, the home health care industry in the state essentially stopped adding jobs. With small quarterly fluctuation in employment levels during the remainder of 2016 through 2017 III, the industry has slightly fewer workers on its payroll than it had 18 months prior.
The obvious question is what happened? Why has home health care em-ployment flattened as the services to elderly and disabled industry contin-ued its strong pace of new job creation? The demand for services from these industries is thought to be largely from the same source, the increas-ing need for direct care workers as the number of persons requiring long-term care in the state grows. The answer to this question is not obvious, but it is useful to examine some of the most important differences in the ways these industries are organized and financed to at least gain some insight
40,000
65,000
70,000
55,000
60,000
45,000
50,000
2016 I
59,957
46,246
2016 II
47,270
60,282
2016 IV
47,255
63,877
2016 III
47,579
62,983
2017 II
47,057
64,838
2017 I
46,595
63,938
2017 III
47,138
65,240
Source: U.S. Bureau of Labor Statistics, Quarterly Census of Employment and Wages, various quarters, tabulations by authors.
Chart 3. Recent trends in Employment in the Home Health Care and Services to the Elderly and Disabled Industries inMassachusetts, 2016 I to 2017 III
Services to the elderly and disabled Home health care

19
Labor Shortages in the Home Health Care IndustryEconomists expect labor shortages to manifest themselves through rapidly rising wage rates as employers bid to find labor until a new and higher mar-ket-clearing wage emerges, or by rising job vacancy rates as employers fail to raise wages sufficiently to attract workers to fill job openings. An exam-ple of the former adjustment to rising labor shortages can be found in many computer science labor markets around the nation. In these markets pro-ducers can raise compensation (both wage and benefits) to attract the skills they require. Their wage flexibility is partially the result of their abil-ity to increase prices in the market for their goods and services as demand increases.
In the instance of rising job vacancy rates, the duration of job openings rise as firms are unable to raise prices and revenues sufficient to meet the increase in the level of demand at the current market wage. This sort of problem is especially common when wages are fixed for an extended period by some contractual agreement or regulatory mandate. A good example of this occurs in public elementary and secondary teacher markets where teacher wages are often fixed by seniority and level of educational attain-ment by a negotiated ‘salary matrix’. Under this matrix salary system, teachers with similar experience and credentials are paid the same, regard-less of specialty area. Thus, ceteris paribus, physical education teachers have identical wages to physics, chemistry, and math teachers. The prob-lem is, of course, differences in the relative supply of teachers with skills in each specialty area. Hard science and math teachers have employment al-ternatives not available to gym teachers. The result is excess labor supply in some teaching occupations and considerable shortages in others as the rigid teacher wage structure distorts labor allocation.
The home health agency industry in Massachusetts has considerable limitations in its ability to increase direct care worker compensation levels
0%
20%
10%
30%
40%
50%
60%
70%
80%
Mass Commfor the Blind
MFTP ABITBI SCOMRCMedicare HHOneCare Private Pay
10%14%
22%
57%
26% 26%
45%
74%
Source: Hayley Gleason, Setting the Agenda, Tufts Health Plan Foundation, February, 2018, reproduced with permission from the author.
Chart 4. Revenue Sources of Home Health Provider Organizations in Massachusetts, 2016
programs operated by the Massachusetts Commission for the Blind and the Massachusetts Rehabilitation Commission.
The majority of respondents earned income from providing services under the state’s senior care options program, but nearly three-quarters of firms receive some revenue from private payer households. In these cases, the income to make these payments may come from a variety of sources including household savings/wealth, current household income, or in some cases, a long-term care insurance program.
The sources of finance for long-term care are very important since they have a strong impact on the mean revenue produced per client. Most public funds received by these agencies are capped by a reimbursement rate. Over time, we might expect that both nominal and real wages of the potential labor supply to these occupations change but nominal reimbursement rates remain the same. If this were the case, then we would expect the relative ability of home health care employers relying on public sector rev-enues to compete effectively in a strong job market would diminish. Reimbursement rates for direct care services in Massachusetts have re-mained unchanged for a decade, as the state’s labor market has become among the strongest in the nation.
In our earlier report to the Office of the State Auditor, we found that not only do home health employers compete against one another and with em-ployers across the health care and social service system for direct care workers, but also with retail trade and the rapidly expanding leisure and hospitality industry that includes eating and drinking establishments. Strong demand in these sectors with oftentimes better working conditions and higher wages may leave home health care providers with substantial labor supply problems that inhibit their ability to provide services to what appears to be rapidly rising demand for these services. We explore this issue in detail below.

20
economy relative to a conceptually comparable measure of job openings, both produced by the Bureau of Labor Statistics. These data reveal the ex-pected relationship between the levels of unemployed workers and job va-cancies over the business cycle. For example, at the end of the 1990s dot.com expansion, when Massachusetts posted statewide unemployment rates for several quarters that were below 3 percent (Chart 6), the number of unemployed workers to vacant jobs in the nation was almost equal, reaching a low of 1.2 officially unemployed workers for every vacant job at the end of 2000. On the heels of the dot.com recession in 2001 the state unemployment rate increased to a seasonally adjusted peak of 5.8 percent by mid-2003 and the national U/V ratio rose to 2.8 unemployed workers for every vacant job, signaling widespread excess labor supply in the nation. The ensuing job market recovery, led by health care and especially hospital employment gains, once again reduced the number of unemployed, but the U/V ratio was able to fall to 1.4 unemployed per vacant job. The result in Massachusetts was to reduce the state unemployment rate to 4.5 percent as shortages emerged in key health care occupations, most notably in a va-riety of registered nursing fields, as post-secondary programs were unable to keep up with high volume rapidly rising demand for nurses.15
In the beginning of 2008, the U.S economy experienced a sharp cyclical downturn characterized by job losses not seen since the early 1980s. The Great Recession as it was known resulted in national unemployment levels rising to double-digit highs and the nation’s job vacancy rate to reach his-toric lows. The result was that at the worst of the jobs recession there were nearly seven unemployed workers for every vacant job. During that same period, the rate of job loss was much lower in Massachusetts than in the nation as a whole, yet the state’s unemployment rate still rose to a high of
as aggregate state economic and employment expansion means more em-ployment opportunities and direct care workers become relatively scarce as employers in and outside of direct care labor markets compete more intensively for their hours of labor supply. First, reimbursement rates under most publicly financed direct care programs are established by leg-islative action. Similarly, reimbursements under private long-term care insurance and other financial instruments that can serve as an alternative funding source almost always have strict limitations on daily reimburse-ment rates (as well as limitations on the duration of benefits) that do not change over time.14 Only private payers drawing from their own wealth or income have the flexibility to pay a daily rate premium to ‘jump the queue’ to receive long-term care services as the demand for these services rises.
The evidence of a shortage of direct care workers in Massachusetts can-not be inferred from either data on wages or on job openings. Wages have not increased for direct care workers in Massachusetts, in part because public reimbursement rates to direct care service providers have not been adjusted to reflect market conditions in over a decade. Thus, we do not ex-pect to find evidence of rising wages because of the rigidity in reimburse-ment rates. The option of increasing wage rates appears quite limited for a substantial number of producers in the home health care industry.
Systematic measures of job vacancies are not available in Massachusetts, so a direct measure of labor market imbalances between unemployed workers and vacant jobs in the state is not possible. However, aggregate measures of job vacancies produced by the Bureau of Labor Statistics are available that can help provide context for the employment situation in Massachusetts.
Chart 5 examines the number of unemployed workers in the American
0
4,000
2,000
6,000
8,000
10,000
12,000
16,000
14,000
U:V ratio = 6.40Oct 2009
18,000
Num
bers
Dec.2000
Jul.2001
Feb.2002
Sep.2002
Apr.2003
Nov.2003
Jun.2004
Jan.2005
Aug.2005
Mar.2006
Oct.2006
May2007
Jul.2008
Feb.2009
Sep.2009
Apr.2010
Nov.2010
Jun.2011
Jan.2012
Aug.2012
Mar.2013
Oct.2013
May2014
Dec.2007
Jul.2015
Dec.2014
Nov.2017
Apr.2017
Sep.2016
Feb.2016
Source: U.S. Bureau of Labor Statistics, Job Openings and Labor Turnover Survey (JOLTS), and U.S. Bureau of Labor Statistics, Current Population Survey (CPS), tabulations by authors.
Chart 5. Trends in the Number of Unemployed Workers and Vacant Jobs in the United States, 2000 to 2018,(seasonally adjusted)
U:V ratio = 2.78Jun 2003
U:V ratio = 1.42Apr 2007
Vacant jobs Unemployment

21
Some Evidence of Home Health Care Industry Direct Care Labor ShortagesPart of a previous study prepared for the Office of the State Auditor on health care and direct care workforce developments, included findings from interviews conducted with a number of home health care industry employers as well as a small-scale job opening and labor turnover survey. The study found that employers at that time (2015-16) were reporting a considerable degree of difficulty in hiring and retaining direct care workers and that these labor supply constraints meant that they sometimes had to refuse or delay services (and forego the associated revenue) to consumers. The job openings survey found a high fraction (more than 10 percent of home health direct care jobs) were vacant at that time and that quit rates in these jobs were very high. Indeed, employers reported that quits often oc-curred within the first week of work, so that it often took up to ten hires to find a direct care worker who would remain employed with the firm for any kind of extended duration of time. The low relative pay, the uncertainty of work assignments, sometimes on a daily basis and responsibilities that, in some instances, can be very difficult all contribute to this high quit rate.
A more recent study completed by the Home Health Aide Council exam-ines these issues in much greater detail. The HHAC study found a substan-tial share of home health aide employers reported that they had difficulty finding workers to fill open shifts in a given week.
Unlike many occupations, direct care workers in the home health indus-try are required to work in multiple homes at varied times over the course of even a single week. Moreover, the actual hours a direct care worker is engaged in during a week may be below their desired level of hours of work. In many ways, direct care workers represent a ‘just-in-time’ inventory of potential labor supply that a firm may assign to a consumer depending on transportation distances. The consumer’s need for direct care support over the course of a day (and week) and the availability of a direct care worker to
8.8 percent, an unemployment rate not seen in Massachusetts since 1991.Since the end of the job recession in 2010, the nation’s job market has
steadily made inroads in reducing unemployment, by consistent growth and increasingly diversified job creation across a range of industries and occupations. By the spring of 2018, the nation’s unemployment rate had fallen to below 4 percent. By March of 2018, there were 6.58 million unem-ployed workers and 6.55 million vacant jobs, essentially an equality be-tween active and available job seekers and vacant jobs employers are ready to fill right away. Massachusetts saw its unemployment rate fall below 4 percent much earlier than the nation reaching 3.9 percent in May of 2016, two years before the national rate reached 3.9 percent. Of at least equal importance, the state unemployment rate has remained below 4 percent. Indeed, the state’s monthly unemployment rate has declined further to an average of 3.5 percent during the past five most recent months through April of 2018.16
When we consider the current national unemployment to job vacancy ratio of 1:1 at a 4 percent unemployment rate along with the strong pace of new job creation in Massachusetts, especially compared to other states, especially in the Northeast and Midwest, it seems reasonable to conclude that there is a strong likelihood that the unemployment to job vacancy ratio in Massachusetts is also at the full employment level. That is, it is very likely that in the Bay State there is essentially equality between the number of unemployed workers and vacant jobs. Under such conditions, labor mar-ket imbalances persist with some labor market segments still with excess labor supply, but with many other industries and occupations experiencing substantial labor shortage problems. We suspect that the home care indus-try has been experiencing a labor shortage problem in direct care occupa-tions for an extended period, unable to increase wages much; firms are unable to fill positions and thus forego additional revenue, as they are un-able to meet consumer demand for direct care help.
0
2
1
3
4
5
6
7
9
8
5.8
10
Jan.2000
Sep.2000
May2001
Jan.2002
Sep.2002
May2003
Jan.2004
Sep.2004
May2005
Jan.2006
Sep.2006
May2007
Jan.2008
Sep.2008
May2009
Jan.2010
Sep.2010
May2011
Jan.2012
Sep.2012
May2013
Jan.2014
Sep.2014
May2015
Sep.2016
May2017
Jan.2016
Jan.2018
Source:U.S. Bureau of Labor Statistics, Current Population Survey (CPS), tabulations by authors.
Chart 6. Trends in the Massachusetts Unemployment Rate, 2000 to 2018 (seasonally adjusted)
2.6
4.5
8.8
4.0 3.73.5
22
MASSHEALTH PCA PROGRAM EMPLOYMENTThe organization of the services to the elderly and disabled industry in Massachusetts is unlike most other industries that employ large numbers of wage and salary workers. In most wage and salary jobs in the state, whether public or private sector, profit or non-profit firm, there is a largely exclusionary two-party exchange that occurs between the employer and the employee with no other party directly engaged in that relationship. However, the MassHealth PCA program is unique in that it is in effect a three-party relationship between the employer of record, the PCA em-ployee, and the Commonwealth—who actually pays the PCA wages.
Under the state PCA program the employer-employee relationship is between the consumer of personal attendant services (the employer) and the personal care attendant (the employee), but key aspects of this relation-ship including its finance, the wage rate, and the weeks and hours of work that can be compensated are determined by various PCA program admin-istrative entities.17 The actual wage payment is made by agents of MassHealth (and some other state agencies) known as fiscal intermediar-ies financed by government budget authorizations. The number of weeks and hours of service that PCAs can provide a consumer are restricted by Aging Service Access Points (ASAPs) that are designated by the state to make determinations of the number of hours of service per week and the duration of these services over time.
This organization means that consumers assume the major responsibil-ities of an employer, such as recruitment, hiring, firing, assignment of job duties, and supervisory duties such as on-going worker direction and doc-umentation of hours of work to fiscal intermediaries. As we observed ear-lier, the organization of the MassHealth program makes the services to the elderly and disabled industry the most atomistic industry in the state. Because every consumer is a stand-alone employer, each consumer is also a unique business establishment that is unconnected to the policies and procedures of any other establishment in the industry. Indeed, the services to the elderly and disabled industry has the lowest mean employment size per establishment in the state. The average employment level in the indus-try overall was just 1.7 workers per business establishment during the sec-ond half of 2017. To put this in context, the state had 158,500 business es-tablishments that employed fewer than five workers, the services to elderly and disabled industry accounted for 39,000 or 25 percent of all of the small-est businesses in the Commonwealth. With employment of 64,400, 28 per-cent of the state’s ‘smallest business’ employment was in the services to elderly and disabled industry and a large share of this employment was fi-nanced by MassHealth and related state funding sources through the PCA program for long-term care services to the elderly and disabled.
The high degree of subsidiarity in the PCA program provides consumers with the advantage of self-direction of the LTC services that they receive. This has long been a major policy of the disability rights community, which demands that consumers be able to make their own decisions about their well-being, including the specific role that PCAs will serve to best meet their needs. However, because there is a third-party financing the PCA pro-gram, the price discipline that is normally found in decentralized market allocation systems appears largely absent from the PCA program. As one long-time observer of the PCA program noted, “it’s the wild west out there”. Indeed, until recently, PCAs were not required to participate in any formal training at all; instead, all training was the responsibility of the consumer. In recent years, a limited three-hour training requirement has been put in
commute to the consumer and work the required shift in a given day affect scheduled hours.
The HHCA survey of direct care workers and focus group discussions found that irregular schedules were the central impediment to the employ-ment stability that is a central work value of most wage and salary workers. Inconsistent weekly hours and highly variable shift availability over the course of a week were a source of dissatisfaction with nearly one-half of all direct care workers participating in the survey.
This weekly uncertainty in scheduling is compounded by turnover in a given employer’s consumer population as well. This means that home health care staffing in the direct care occupations is much more complex and difficult and presents a much greater challenge to find workers willing to tolerate this degree of uncertainty in not only total hours of work avail-able in a week, but also in the shift schedule of those hours over the course of the week.
The HHCA employer survey found that among a sample of 58 home health agency employers, nearly 90 percent reported that recruiting and hiring direct care workers was a top challenge to the success of their orga-nization. Indeed, about 47 percent of employers reported that, in a given week, they struggle to meet the scheduling requirements of their daily con-sumer caseloads. In addition to recruitment and hiring difficulties about one-half of employers reported challenges related to communication and related service skills of those persons who were hired in these positions. This latter finding is unsurprising. An important adjustment to labor shortage problems when wages are inflexible is often to weaken hiring standards. As employers try to meet increasing consumer demand for ser-vices they hire less capable workers. Employees participating in the survey reported that wage rates was the top reason they were thinking of leaving their jobs.
A diminished labor supply pool under such circumstances usually means a reduction in the quality of new hires—and this in turn can lead to an in-crease in employee quit rates. As expected, the HHCA survey found that 45 percent of employers saw high direct care turnover rates as a key challenge to the success of their agency in meeting consumer demands. Reflecting this elevated quit rate, the sample of more than 650 direct care workers in the industry found that at the time of the survey about one-third thought it likely they would leave their position as a direct care worker and one in six were actively seeking a new position.
Taken together, these findings suggest that employment levels in the home health care industry in the state have flattened in the last 18 months, not because of diminished growth in consumer demand, but because the relative competitive position of the home health industry in direct care labor markets has declined. A full employment environment, strong job growth, and rising entry level wages in a growing number of competitor industries with occupations that require little education or training means that home health agencies failed to expand payroll employment levels be-cause of severe constraints on their ability to attract labor supply due to the wage rigidity for home care organizations. These constraints mean that the only adjustment available to respond to their declining labor market posi-tion is to accept a reduction in the quality of hires and accept that even this will mean that they are unable to meet rising demand for long- term care services in the Commonwealth.
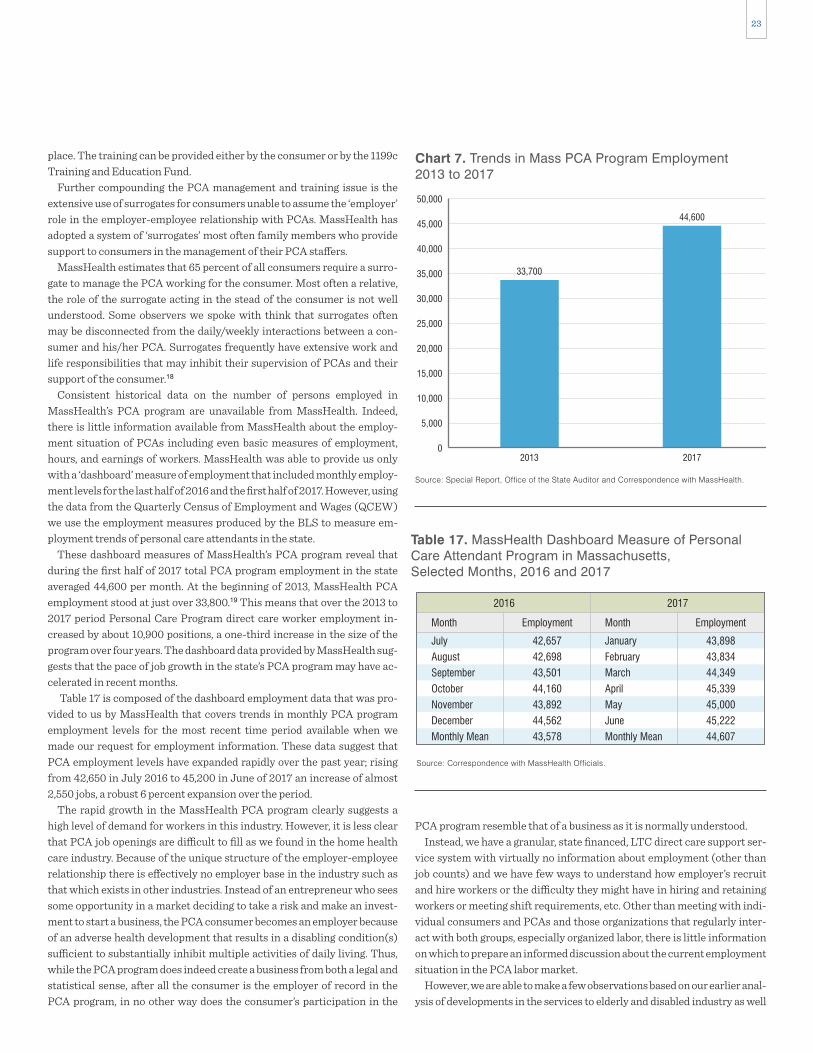
23
PCA program resemble that of a business as it is normally understood.Instead, we have a granular, state financed, LTC direct care support ser-
vice system with virtually no information about employment (other than job counts) and we have few ways to understand how employer’s recruit and hire workers or the difficulty they might have in hiring and retaining workers or meeting shift requirements, etc. Other than meeting with indi-vidual consumers and PCAs and those organizations that regularly inter-act with both groups, especially organized labor, there is little information on which to prepare an informed discussion about the current employment situation in the PCA labor market.
However, we are able to make a few observations based on our earlier anal-ysis of developments in the services to elderly and disabled industry as well
place. The training can be provided either by the consumer or by the 1199c Training and Education Fund.
Further compounding the PCA management and training issue is the extensive use of surrogates for consumers unable to assume the ‘employer’ role in the employer-employee relationship with PCAs. MassHealth has adopted a system of ‘surrogates’ most often family members who provide support to consumers in the management of their PCA staffers.
MassHealth estimates that 65 percent of all consumers require a surro-gate to manage the PCA working for the consumer. Most often a relative, the role of the surrogate acting in the stead of the consumer is not well understood. Some observers we spoke with think that surrogates often may be disconnected from the daily/weekly interactions between a con-sumer and his/her PCA. Surrogates frequently have extensive work and life responsibilities that may inhibit their supervision of PCAs and their support of the consumer.18
Consistent historical data on the number of persons employed in MassHealth’s PCA program are unavailable from MassHealth. Indeed, there is little information available from MassHealth about the employ-ment situation of PCAs including even basic measures of employment, hours, and earnings of workers. MassHealth was able to provide us only with a ‘dashboard’ measure of employment that included monthly employ-ment levels for the last half of 2016 and the first half of 2017. However, using the data from the Quarterly Census of Employment and Wages (QCEW) we use the employment measures produced by the BLS to measure em-ployment trends of personal care attendants in the state.
These dashboard measures of MassHealth’s PCA program reveal that during the first half of 2017 total PCA program employment in the state averaged 44,600 per month. At the beginning of 2013, MassHealth PCA employment stood at just over 33,800.19 This means that over the 2013 to 2017 period Personal Care Program direct care worker employment in-creased by about 10,900 positions, a one-third increase in the size of the program over four years. The dashboard data provided by MassHealth sug-gests that the pace of job growth in the state’s PCA program may have ac-celerated in recent months.
Table 17 is composed of the dashboard employment data that was pro-vided to us by MassHealth that covers trends in monthly PCA program employment levels for the most recent time period available when we made our request for employment information. These data suggest that PCA employment levels have expanded rapidly over the past year; rising from 42,650 in July 2016 to 45,200 in June of 2017 an increase of almost 2,550 jobs, a robust 6 percent expansion over the period.
The rapid growth in the MassHealth PCA program clearly suggests a high level of demand for workers in this industry. However, it is less clear that PCA job openings are difficult to fill as we found in the home health care industry. Because of the unique structure of the employer-employee relationship there is effectively no employer base in the industry such as that which exists in other industries. Instead of an entrepreneur who sees some opportunity in a market deciding to take a risk and make an invest-ment to start a business, the PCA consumer becomes an employer because of an adverse health development that results in a disabling condition(s) sufficient to substantially inhibit multiple activities of daily living. Thus, while the PCA program does indeed create a business from both a legal and statistical sense, after all the consumer is the employer of record in the PCA program, in no other way does the consumer’s participation in the
0
10,000
5,000
25,000
20,000
15,000
30,000
35,000
40,000
45,000
50,000
2013 2017
33,700
44,600
Source: Special Report, Office of the State Auditor and Correspondence with MassHealth.
Chart 7. Trends in Mass PCA Program Employment2013 to 2017
Table 17. MassHealth Dashboard Measure of PersonalCare Attendant Program in Massachusetts,Selected Months, 2016 and 2017
Source: Correspondence with MassHealth Officials.
July
August
September
October
November
December
Monthly Mean
42,657
42,698
43,501
44,160
43,892
44,562
43,578
Employment
2016
Month
January
February
March
April
May
June
Monthly Mean
43,898
43,834
44,349
45,339
45,000
45,222
44,607
Employment
2017
Month

24
working conditions especially with respect to reliability of hours of work, reduced commuting times, and the ability to develop a long-term relation-ship with a single consumer likely reduce the chances of high turnover and associated increases in the volume of unfilled jobs.
HEALTH CARE SUPPORT AND DIRECT CARE OCCUPATIONSHome health aides, personal care aides, community health workers/social, and human service assistants are the backbone of the newly emerging sys-tem of home and community-based care. These workers will shoulder an increasing share of responsibilities for the provision of health care in the state. The services they provide are largely delivered at a client’s home with the specific intent of helping both acutely and chronically ill individuals as well as persons with disabilities remain in their residences.
Home health aides and personal care aides are part of a broader health care support occupational grouping, but the common characteristic of these jobs is that they require little or no formal medical or health educa-tion.20 This is the distinguishing feature of these occupations.
Most other entry-level health care support occupations do require for-mal classroom training and some on-the-job training. Occupational and physical therapy assistants and aides, pharmacy technicians, certified nursing assistants and medical assistants all must engage in a course of study that leads to a certification in the field. Often area colleges and uni-versities offer these certifications with courses taught by their faculty.
Workers in these kinds of certified health care support occupations most often work under the direct supervision and usually in the physical proxim-ity of a professional who has a certification and license as well as some post-secondary education (most often a college degree). Registered nurses and licensed practical or vocational nurses, physical and occupational therapists, pharmacists, and physicians frequently supervise the activities of health support staff. In contrast, home health aides, personal care aides, and community health workers are, in large part, delivering services at a client or patient’s home, by themselves, with no health professional in at-tendance (though in many cases a nurse care manager has been involved in determining the services required by individuals). Their duties largely focus on supporting patients in activities of daily living that might include feeding, toileting, bathing, walking and transferring (e.g. moving from a sitting to standing position), putting on clothes, and grooming.
In some cases, especially in the case of personal care aides who are not employed by a health care agency, duties may go well beyond these activi-ties of daily living and could involve managing finances, shopping, prepar-ing meals, managing and administering medications, and maintaining medical equipment. The MassHealth funded personal care attendant (PCA) program has the unique feature of a direct employer-employee rela-tionship between the client and the attendant. While MassHealth is re-sponsible for setting the rate of compensation and making the wage pay-ment, the patient/consumer/employer is responsible for all other aspects of the relationship, including determining specific job duties and tasks, as well as recruitment, training, hiring, and dismissal.
The specific proficiencies required for employment as a home health aide or personal care aide are not medically oriented. We analyzed data from the U.S. Department of Labor’s Occupational Information Network (O*NET) system that measure the relative importance and level of difficulty for the cognitive abilities, kinds of knowledge, workplace skills and behavioral
as with discussions we have had with consumers and workers within the PCA program, and those who observe developments within that program.
Unlike the home health care industry, where employment has not grown for about 18 months, employment levels in the services to elderly and dis-abled industry have posted strong advances in that time. We found some reasons to believe that the absence of growth in the home health care in-dustry in recent months is associated with agencies’ inability to recruit and hire workers at the prevailing wage rate. A comparison of wages and work-ing conditions suggest that employment as a direct care worker in the MassHealth PCA program has a number of advantages to working as a di-rect care worker in the home health industry.
First, entry-level hourly wage rates are substantially higher for PCAs than those paid to direct care workers in the home health industry. Direct care workers in the PCA program had a starting pay of $14.16 per hour in 2016, rising to $14.58 per hour in 2017, and again rising to $15.00 in July of 2018. Entry-level wages for companions and homemakers in the home health care industry are under $12.00 per hour. Home health aides start at an average of $12.52 per hour. While the PCAs frequently have responsibil-ities of serving as companions and homemakers who help with activities of daily living, their starting wage rate is between $2 and $3 dollars per hour greater than the entry-level wage for direct care workers with similar re-sponsibilities in the home health care industry.
Direct care workers in the home health industry have an average of about five consumers that they serve in a given week, but a direct care worker in the PCA program is most likely to support just one consumer during a week. Thus, the problems and costs of travel time are substantially reduced for PCAs compared to direct care workers in the home health industry. One of the key features of seeking labor supply in the PCA program is that a proportion of those providing PCA services are family members. In re-sponse to an inquiry about the role of family members in supplying labor to consumers in the PCA program officials from MassHealth reported that:
“The number of PCAs with a familial relationship varies month to month; factors include number of new members enrolled in pro-gram, as well as who the new members are hiring as PCAs. Fluctuations in familial relationships range from 70-90% of PCAs being unrelated non-family members.”
This suggests that in any given month somewhere between 10 percent and 30 percent of those supplying labor to consumers participating in the PCA program are family members— offering a source of labor supply that is presumably not readily available to individuals in need of LTC services provided by the home health care industry.
Home health agency providers have reported that they are in direct com-petition with the PCA program for labor supply and even for consumers. Wages and working conditions in the PCA program appear superior for en-try-level direct care workers. Two-thirds of home health care direct care workers reported that they were dissatisfied with their wages. Unsurprisingly, the survey of home health care direct care workers revealed that a substan-tial number of these individuals are seeking employment elsewhere and about one-fifth of these direct care workers who are looking for a new job reported they are seeking a position as a PCA.
The evidence available to us does not lead us to conclude that a shortage of PCAs currently exists in the state. High and rising relative wages, better

25
that something is wrong or likely to go wrong, is also a key ability require-ment for workers in these occupations.
The knowledge requirements also appear somewhat similar, with cus-tomer service and psychology among the most important areas of knowl-edge required for employment in these occupations. The nursing assistant occupation does include knowledge of medicine as an important knowl-edge proficiency; however, medical knowledge is not a top requirement for home health aides or personal care aides.
Skill requirements are also quite similar across all three of these health care support occupations. Active listening, the skill of giving full attention to what other people are saying and asking appropriate questions, is a key skill re-quirement. Service orientation, another important skill across these occupa-tions, is simply the act of looking for ways of helping people and anticipating their needs. Social perceptiveness, or understanding of a client’s/patient’s reactions to a situation or development, is also important for this work.
characteristics of home health aides, personal care aides and nursing assis-tants.21 We also include the proficiency requirements for the nursing assis-tant occupation in order to illustrate that the occupational requirements of home health aide and personal care aide occupations are largely the same as those of nursing aides. The findings in Table 18 present a summary of our analysis of the proficiency requirements of O*NET.
These occupations are all categorized by the O*NET system as part of Job Zone 2, a designation that indicates that in each of these occupations workers’ job duties require that employees have a high school diploma and a few months of mostly on the job training to become productive workers. A closer look at the most important proficiency elements shows that these traits are quite similar across all three occupations. The cognitive ability requirement scores for these occupations indicate that oral expression and oral comprehension are the most important abilities needed to be effective in all three occupations. Problem sensitivity, or the ability to determine
Abilities (Scale 1-35)
Knowledge (Scale 1-35)
Skills (Scale 1-35)
Behavioral Characteristics (Scale 1-5)
Table 18. Top Ability, Knowledge, Skill and Behavioral Requirements for Employment in Home Health Aide,Personal Care Aide and Nursing Assistant Occupations
Source: U.S. Department of Labor O*NET Database, calculations by Center for Labor Markets and Policy, Drexel University
Elements
Oral Expression
Oral Comprehension
Problem Sensitivity
Near Vision
Inductive Reasoning
IMLV
15.1
14.1
13.1
12.3
10.5
Elements
Oral Comprehension
Oral Expression
Problem Sensitivity
Written Comprehension
Deductive Reasoning
IMLV
13.6
12.2
10.5
9.4
9.4
Elements
Oral Comprehension
Oral Expression
Problem Sensitivity
Near Vision
Speech Recognition
IMLV
14.0
13.1
12.7
11.8
11.8
Elements
Customer and Personal Service
English Language
Psychology
Education andTraining
Administration and Management
IMLV
14.5
10.0
7.5
5.8
5.8
Elements
Customer and Personal Service
Psychology
English Language
Education and Training
Administration and Management
IMLV
16.3
10.1
9.0
6.2
5.8
Elements
Customer and Personal Service
Psychology
English Language
Medicine and Dentistry
Education and Training
IMLV
19.0
15.7
12.8
10.7
9.3
Elements
Active Listening
Service Orientation
Social Perceptiveness
Critical Thinking
Reading Comprehension
IMLV
13.6
12.2
11.4
11.0
10.6
Elements
Service Orientation
Social Perceptiveness
Active Listening
Monitoring
Speaking
IMLV
14.6
11.3
10.1
9.7
9.4
Elements
Service Orientation
Social Perceptiveness
Active Listening
Speaking
Monitoring
IMLV
14.0
11.3
10.9
10.6
9.8
Elements
Integrity
Self-Control
Dependability
Concern for Others
Attention to Detail
IMLV
4.6
4.6
4.6
4.5
4.5
Elements
Dependability
Integrity
Concern for Others
Cooperation
Self-Control
IMLV
4.5
4.5
4.5
4.4
4.4
Elements
Dependability
Concern for Others
Cooperation
Stress Tolerance
Self-Control
IMLV
4.8
4.7
4.6
4.6
4.6
Home Health Aides(SOC 31-1011.00)
Personal Care Aides(SOC 39-9021.00)
Nursing Assistants(SOC 31-1014.00)
26
The skill requirements for these occupations are quite similar with social perceptiveness, active listening, as well as speaking skills (conveying infor-mation effectively) topping the skill requirements for both community health workers and social and human service assistants.
The behavioral traits required for both community health workers and social and human service assistants focus on the character traits of integ-rity, dependability and cooperative attitude in the work setting. Community health worker behavioral requirements also emphasize flexibility and in-dependence, since these workers must depend on their own judgement as they work largely outside the purview of a supervisor.
It is quite likely that most any reader of this paper could be hired as a home health aide, personal care aide or community health worker/social and human service assistant.
Little formal specific occupational knowledge is required to be an effec-tive worker in these positions. Instead, these jobs require workers with a set of proficiencies that are sometimes referred to as “soft skills.” Our anal-ysis of employment developments in these occupations in the past decade as well as the future outlook for employment in these occupations suggests that the demand for labor in the health and social services sector will in-creasingly seek workers with these soft skills, but employment in these fields will not require high levels of educational attainment or extensive classroom preparation prior to employment.
Indeed, our assessment of labor market conditions suggests an inade-quate labor supply for these occupations at the prevailing wage rate. Moreover, the available evidence suggests that if some of the current trends continue these occupations will emerge as among the most important sources of new job creation in the Commonwealth over the next decade.
CHARACTERISTICS OF HEALTH CARE SUPPORT AND DIRECT CARE WORKERS IN MASSACHUSETTSThe people who work in health care support and direct care occupations in Massachusetts differ markedly with respect to their demographic and so-cio-economic status compared to those employed in other occupations. Using data derived from the American Community Survey (ACS) Public Use Microdata Sample (PUMS) for Massachusetts from 2015 through 2016 (the most recent PUMS data available) we measure the gender, age, race/ethnicity, educational attainment, nativity status, marital status, presence of children, and income relative to poverty status for persons em-ployed in individual health care support and direct care occupations in Massachusetts as well as for persons who are employed in all other occupa-tions in the Commonwealth.
It is important to note that the ACS occupational classification system and occupational employment measures differs somewhat from occupational employment measures for Massachusetts derived from the Occupational Employment Statistics (OES) survey used to assess employment trends in health care support and direct care occupations in Massachusetts elsewhere in this paper. The ACS is a sample survey of households conducted monthly by the Bureau of the Census. ACS is designed to gather a wide range of demo-graphic, economic, social, housing and other information about households and residents that are used in a variety of ways including allocating federal funds across states and areas. The OES survey is a sample survey of business establishments conducted twice a year to measure employment and wage rates by occupation and industry.
The character traits of integrity or honesty in dealings as well as depend-ability in fulfilling obligations are important traits for these three health care support occupations. Concern for others, that is the sensitivity to oth-ers’ needs and being responsive to them, is also an important behavioral requirement for these health care support positions.
We discuss the community health worker occupation separately since it is a new and emerging field, but one that, based on extensive discussions with workers, employers and insurance providers, is closely associated with the social and human services assistant occupation.22 The commu-nity health workers and social and human service assistants are engaged in set of social service related activities designed to provide support to el-derly, infirm and disabled residents increasingly as part of a larger strategy to help individuals remain at home and avoid hospitalization or admit-tance into nursing homes or other kinds of residential support facilities. These individuals are heavily engaged in assisting clients in accessing the range of social, community and public assistance services that are avail-able to them. They also work to help individuals overcome sometimes seemingly minimal barriers to health care (such as transportation to or even remembering a medical appointment), access social and community supports that are available and more effectively utilize those resources. Community health workers primarily deliver their services in patient’s homes; cultural competency is seen as perhaps the single most important proficiency for employment in this occupation. Indeed, the American Public Health Association defines community health workers in part as:
(A) Frontline worker who is a trusted member of and/or has an unusually close understanding of the community served. This trusting relationship enables workers to serve as a liaison/link/intermediary between health/social services and the community to facilitate access to services to improve the quality and cultural competence of service delivery.23
Social and human service assistants also engage in assisting their clients in identifying and obtaining health, social and community services and assist social workers in their efforts to resolve a range of problems that confront individuals. Social and human service assistants work in a broader range of settings including community-based residential facilities and increasingly in-patient homes. In our interviews with employers, we found that community health worker and social and human service assis-tant were often used interchangeably. A comparison of the proficiencies required to work in these occupations makes clear why these two job titles are closely connected to one another.
The abilities requirements for workers in both of these occupations are quite similar with oral comprehension, oral expression and problem sensitivity among the most important cognitive ability requirements for employment.
Customer service knowledge and psychology are important areas of knowledge required for these occupations, but the proficiency score re-quirement for psychology is much higher for those employed as social and human service assistants compared to community health workers. Social and human service assistants differ in knowledge requirements that em-phasize therapy and counseling, English language, sociology and anthro-pology. In contrast, community health worker knowledge requirements are focused on education and training, administration and management, and clerical functions.
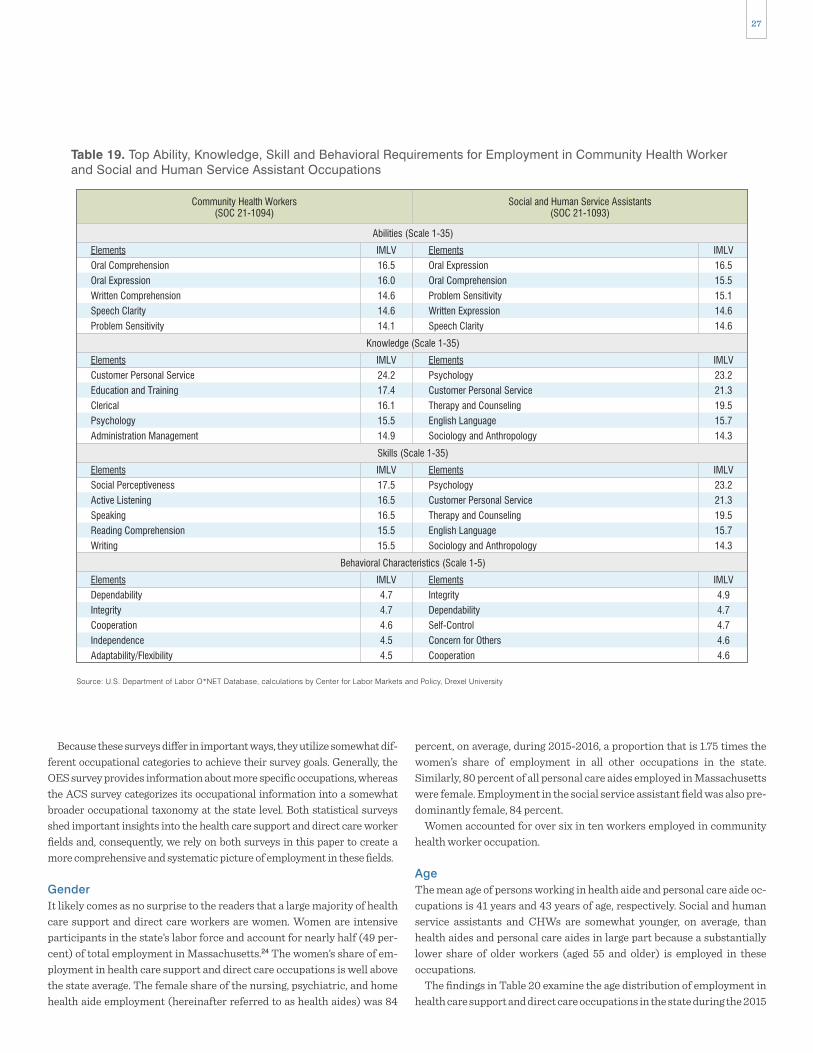
27
percent, on average, during 2015-2016, a proportion that is 1.75 times the women’s share of employment in all other occupations in the state. Similarly, 80 percent of all personal care aides employed in Massachusetts were female. Employment in the social service assistant field was also pre-dominantly female, 84 percent.
Women accounted for over six in ten workers employed in community health worker occupation.
AgeThe mean age of persons working in health aide and personal care aide oc-cupations is 41 years and 43 years of age, respectively. Social and human service assistants and CHWs are somewhat younger, on average, than health aides and personal care aides in large part because a substantially lower share of older workers (aged 55 and older) is employed in these occupations.
The findings in Table 20 examine the age distribution of employment in health care support and direct care occupations in the state during the 2015
Because these surveys differ in important ways, they utilize somewhat dif-ferent occupational categories to achieve their survey goals. Generally, the OES survey provides information about more specific occupations, whereas the ACS survey categorizes its occupational information into a somewhat broader occupational taxonomy at the state level. Both statistical surveys shed important insights into the health care support and direct care worker fields and, consequently, we rely on both surveys in this paper to create a more comprehensive and systematic picture of employment in these fields.
GenderIt likely comes as no surprise to the readers that a large majority of health care support and direct care workers are women. Women are intensive participants in the state’s labor force and account for nearly half (49 per-cent) of total employment in Massachusetts.24 The women’s share of em-ployment in health care support and direct care occupations is well above the state average. The female share of the nursing, psychiatric, and home health aide employment (hereinafter referred to as health aides) was 84
Abilities (Scale 1-35)
Knowledge (Scale 1-35)
Skills (Scale 1-35)
Behavioral Characteristics (Scale 1-5)
Table 19. Top Ability, Knowledge, Skill and Behavioral Requirements for Employment in Community Health Workerand Social and Human Service Assistant Occupations
Source: U.S. Department of Labor O*NET Database, calculations by Center for Labor Markets and Policy, Drexel University
Elements
Oral Comprehension
Oral Expression
Written Comprehension
Speech Clarity
Problem Sensitivity
IMLV
16.5
16.0
14.6
14.6
14.1
Elements
Oral Expression
Oral Comprehension
Problem Sensitivity
Written Expression
Speech Clarity
IMLV
16.5
15.5
15.1
14.6
14.6
Elements
Customer Personal Service
Education and Training
Clerical
Psychology
Administration Management
IMLV
24.2
17.4
16.1
15.5
14.9
Elements
Psychology
Customer Personal Service
Therapy and Counseling
English Language
Sociology and Anthropology
IMLV
23.2
21.3
19.5
15.7
14.3
Elements
Social Perceptiveness
Active Listening
Speaking
Reading Comprehension
Writing
IMLV
17.5
16.5
16.5
15.5
15.5
Elements
Psychology
Customer Personal Service
Therapy and Counseling
English Language
Sociology and Anthropology
IMLV
23.2
21.3
19.5
15.7
14.3
Elements
Dependability
Integrity
Cooperation
Independence
Adaptability/Flexibility
IMLV
4.7
4.7
4.6
4.5
4.5
Elements
Integrity
Dependability
Self-Control
Concern for Others
Cooperation
IMLV
4.9
4.7
4.7
4.6
4.6
Community Health Workers(SOC 21-1094)
Social and Human Service Assistants(SOC 21-1093)

28
0%
20%
40%
60%
80%
100%
Nursing,Psychiatric, &
Home Health Aides
Personal CareAides
All OtherHealthcare Support
Workers
Misc. Community & SocialService Specialists, Incl.,
Health Educators & CommunityHealth Workers
Social andHuman Service
Assistants
All OtherWorkers
84%
61%
80%
86%84%
48%
Source: U.S. Bureau of the Census, American Community Survey, Public Use Microdata Sample Files, 2015-2016, tabulations by authors.
Chart 8. Female Share of Workers in Health Care Support and Direct Care Occupations, Massachusetts, 2015-2016
34
36
38
40
42
44
Nursing,Psychiatric, &
Home Health Aides
Personal CareAides
All OtherHealthcare Support
Workers
Misc. Community & SocialService Specialists, Incl.,
Health Educators & CommunityHealth Workers
Social andHuman Service
Assistants
All OtherWorkers
41
37
43
38
39
42
Source: U.S. Bureau of the Census, American Community Survey, Public Use Microdata Sample Files, 2015-2016, tabulations by authors.
Chart 9. Mean Age of Workers in Health Care Support and Direct Care Occupations, Massachusetts, 2015-2016

29
employment in the health care support and direct care occupations in the state. While Hispanics account for about 9 percent of total Massachusetts employment during 2015-2016, our analysis of the data found that 16 per-cent of all health aides were Hispanic; 1.7 times their proportion of the state’s workforce. We found that in the personal care aide occupation Hispanics held 23 percent of all positions, 2.5 times their share of overall employment in the state. Hispanic workers were also disproportionately employed in social and human service assistant positions and in CHW occupations.
The very high shares of health care support and direct care jobs held by African-American and Hispanic workers means that the White Non-Hispanic and Asian shares of employment in these occupations was well below their share of overall employment in the state. White Non-Hispanic workers accounted for 76 percent of total statewide employment, but they held a much lower share of jobs in the health care support and direct care fields. The share of White workers in health care support and direct care occupations was between 56 and 84 percent of their share of the state’s overall workforce. Asians were also less likely to work in these occupations than their overall share of the state’s employment.
The heavy concentration of African-Americans in these health care sup-port and personal care occupations means that a substantial share of all African-American workers in the state are concentrated in these occupa-tions. Our analysis found that one out of seven employed African- Americans in Massachusetts worked in a health care support and direct care occupation during 2015-2016 and 7 percent of Hispanics worked in these fields. In contrast, just 3 percent of White, non-Hispanic workers and 2 percent of Asian workers were employed in these occupations.
to 2016 period. The data reveal that older workers (55+) accounted for one in five health aides, personal care aides, and social and human service as-sistants in the state, while just one in seven CHWs were older workers.
Teens and young adults comprised 13 percent of personal care aides, 18 percent of health aides and about one-quarter of workers in the social and human service assistant and community health worker occupations. The share of prime age workers, those 25 to 54, was substantially higher (63-64%) among health aides, personal care aides, community health worker occupations and somewhat lower (56%) among social and human assistants.
Race-EthnicityHealth care support and direct care employment in Massachusetts is heav-ily concentrated among African American and Hispanic workers. In 2015-16, 35 percent of all those who worked in health aide occupations in Massachusetts were African-American; and the African-American share of employment in the personal care aide occupation was 22 percent. In contrast, African-Americans accounted for just 6 percent of employment in occupational fields outside the health care support and direct care fields. This means that African-Americans were 5.8 times more likely to be a health aide and 3.7 times more likely to be a personal care aide as they were to be employed in any other occupation in Massachusetts.
African-Americans also accounted for a disproportionate share of em-ployment in the social services and community health care occupations. African-Americans accounted for 23 percent of the community health worker occupation and 11 percent of total employment in the social and human service assistant occupation.
Hispanic workers also account for a disproportionate share of
Table 20. Percentage Distribution of Workers in Health Care Support and Direct Care Occupations, by Age,Massachusetts, 2015-2016
Source: U.S. Bureau of the Census, American Community Survey, Public Use Microdata Sample Files, 2015-2016, tabulations by authors.
16–24
25–54
55+
18%
63%
20%
Nursing, Psychiatric, &Home Health AidesAge
13%
64%
22%
PersonalCare Aides
18%
67%
15%
All Other Health CareSupport Workers
25%
56%
19%
Social and HumanService Assistants
23%
64%
14%
Misc. Community and Social ServiceSpecialists, Incl., Health Educators &
Community Health Workers
16%
60%
24%
All OtherOccupations
Table 21. Percentage Distribution of Workers in Health Care Support and Direct Care Occupations, By Race-Ethnicity,Massachusetts, 2015-2016
Source: U.S. Bureau of the Census, American Community Survey, Public Use Microdata Sample Files, 2015-2016, tabulations by authors.
White, non-Hispanic
African American, non-Hispanic
Asian, non-Hispanic
Hispanic
43%
35%
3%
16%
Nursing, Psychiatric,& Home Health AidesRace-Ethnicity
47%
22%
4%
23%
PersonalCare Aides
64%
9%
7%
19%
All Other Health CareSupport Workers
63%
11%
5%
17%
Social and HumanService Assistants
55%
23%
5%
12%
Misc. Specialists,Incl., Health Educators &
Community Health Workers
76%
6%
6%
9%
All OtherOccupations
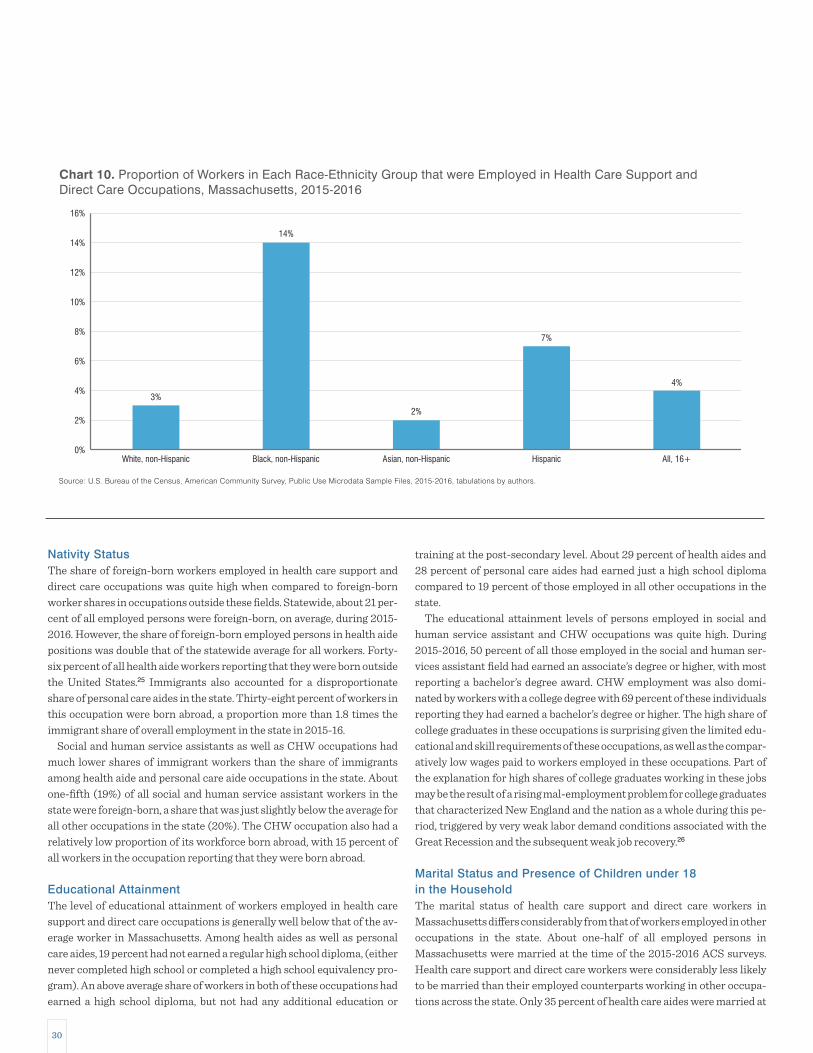
30
training at the post-secondary level. About 29 percent of health aides and 28 percent of personal care aides had earned just a high school diploma compared to 19 percent of those employed in all other occupations in the state.
The educational attainment levels of persons employed in social and human service assistant and CHW occupations was quite high. During 2015-2016, 50 percent of all those employed in the social and human ser-vices assistant field had earned an associate’s degree or higher, with most reporting a bachelor’s degree award. CHW employment was also domi-nated by workers with a college degree with 69 percent of these individuals reporting they had earned a bachelor’s degree or higher. The high share of college graduates in these occupations is surprising given the limited edu-cational and skill requirements of these occupations, as well as the compar-atively low wages paid to workers employed in these occupations. Part of the explanation for high shares of college graduates working in these jobs may be the result of a rising mal-employment problem for college graduates that characterized New England and the nation as a whole during this pe-riod, triggered by very weak labor demand conditions associated with the Great Recession and the subsequent weak job recovery.26
Marital Status and Presence of Children under 18 in the HouseholdThe marital status of health care support and direct care workers in Massachusetts differs considerably from that of workers employed in other occupations in the state. About one-half of all employed persons in Massachusetts were married at the time of the 2015-2016 ACS surveys. Health care support and direct care workers were considerably less likely to be married than their employed counterparts working in other occupa-tions across the state. Only 35 percent of health care aides were married at
Nativity StatusThe share of foreign-born workers employed in health care support and direct care occupations was quite high when compared to foreign-born worker shares in occupations outside these fields. Statewide, about 21 per-cent of all employed persons were foreign-born, on average, during 2015-2016. However, the share of foreign-born employed persons in health aide positions was double that of the statewide average for all workers. Forty-six percent of all health aide workers reporting that they were born outside the United States.25 Immigrants also accounted for a disproportionate share of personal care aides in the state. Thirty-eight percent of workers in this occupation were born abroad, a proportion more than 1.8 times the immigrant share of overall employment in the state in 2015-16.
Social and human service assistants as well as CHW occupations had much lower shares of immigrant workers than the share of immigrants among health aide and personal care aide occupations in the state. About one-fifth (19%) of all social and human service assistant workers in the state were foreign-born, a share that was just slightly below the average for all other occupations in the state (20%). The CHW occupation also had a relatively low proportion of its workforce born abroad, with 15 percent of all workers in the occupation reporting that they were born abroad.
Educational AttainmentThe level of educational attainment of workers employed in health care support and direct care occupations is generally well below that of the av-erage worker in Massachusetts. Among health aides as well as personal care aides, 19 percent had not earned a regular high school diploma, (either never completed high school or completed a high school equivalency pro-gram). An above average share of workers in both of these occupations had earned a high school diploma, but not had any additional education or
0%
14%
12%
10%
8%
6%
4%
2%
16%
White, non-Hispanic Black, non-Hispanic Asian, non-Hispanic Hispanic All, 16+
3%
14%
2%
7%
4%
Source: U.S. Bureau of the Census, American Community Survey, Public Use Microdata Sample Files, 2015-2016, tabulations by authors.
Chart 10. Proportion of Workers in Each Race-Ethnicity Group that were Employed in Health Care Support andDirect Care Occupations, Massachusetts, 2015-2016

31
reported children under the age of 18 lived in their households while 35 percent of personal care aides said they had children.
The CHWs occupation had 44 percent of its workers report the presence of children in their homes. Persons employed as social and human service workers were much less likely to report the presence of children.
Marital status and the presence of children in households can exert im-portant influence on a wide variety of choices related to the level and inten-sity of work activities, the gains to families/households associated with work, as well as determining eligibility for a range of income and benefit transfer programs that exist within the Commonwealth.
the time of the ACS survey, a marriage rate equal to just 71 percent of the statewide marriage rate among employed persons. The marriage rate among personal care aides was also quite low, averaging just 36 percent over the 2015-2016 period, equal to just 73 percent of the overall marriage rate among employed workers in the state. Marriage rates in the social and human service assistant and CHW occupations were well below the aver-age for persons employed in all other occupations.
About one in three employed persons in Massachusetts lives in a house-hold with a child under 18 years old. In most cases, the child is related to the employed person related by blood, marriage or adoption. Workers em-ployed in health care support and direct care occupations were somewhat more likely to report the presence of children in their households than those employed in other occupations. Thirty seven percent of health aides
0%
20%
10%
30%
40%
50%
60%
Nursing,Psychiatric, &
Home Health Aides
Personal CareAides
All OtherHealthcare Support
Workers
Misc. Community & SocialService Specialists, Incl.,
Health Educators & CommunityHealth Workers
Social andHuman Service
Assistants
All OtherWorkers
46%
15%
38%
22%19% 20%
Source: U.S. Bureau of the Census, American Community Survey, Public Use Microdata Sample Files, 2015-2016, tabulations by authors.
Chart 11. Foreign-Born Workers’ Share of Health Care Support and Direct Care Employment inMassachusetts, 2015-2016
Table 22. Percentage Distribution of Workers in Health Care Support and Direct Care Occupations, by Highest Level of Educational Attainment, Massachusetts, 2015-2016
Source: U.S. Bureau of the Census, American Community Survey, Public Use Microdata Sample Files, 2015-2016, tabulations by authors.
No H.S. Diploma
GED/Equivalence
H.S. Diploma
Some College, no diploma
Associate’s Degree
Bachelor’s Degree or higher
12%
7%
29%
33%
8%
11%
Nursing, Psychiatric,& Home Health AidesEducational Attainment
13%
6%
28%
26%
10%
16%
PersonalCare Aides
4%
3%
22%
36%
18%
16%
All Other Health CareSupport Workers
4%
6%
14%
27%
5%
45%
Social and HumanService Assistants
6%
2%
7%
16%
4%
65%
Misc. Specialists,Incl., Health Educators &
Community Health Workers
8%
2%
19%
19%
7%
45%
All OtherOccupations

32
TRENDS IN REAL HOURLY WAGES OF HEALTH CARE SUPPORT AND DIRECT CARE WORKERS IN MASSACHUSETTSThe real (inflation adjusted) earnings of American workers has increased only very slowly for an extended period. Part of the reason for the slow pace of real wage growth in the nation was associated with rising real non-wage com-pensation costs that employers pay as part of the overall compensation pack-age. Measures of non-wage benefit costs are not included in most wage mea-sures available from reliable statistical organizations. According to BLS estimates of employer costs for employee compensation, wages and salaries accounted for about 70 percent of total compensation of private industry workers with the remaining consisting of non-wage benefits such as health insurance, retirement contributions (defined benefit and defined contribu-tion), paid leave and supplemental pay, and other legally required benefits.27
Real total compensation costs of an hour of labor have increased consid-erably over time.
This rise is primarily the product of sharp increases in the cost to em-ployers of providing non- wage benefits to employees, including medical insurance premium costs. Indeed, between 1979 and 2003 total wage and salary compensation costs increased by just 0.7 percent per year. In con-trast, the inflation adjusted annual average rate of increase of non-wage compensation costs was 2.3 percent, a rate of increase in benefit costs that was more than 3 times the rate of increase in real wage gains.28
Real hourly wages of workers in Massachusetts have increased only modestly since the beginning of the state’s recovery from the dot.com re-cession in 2004 (Chart 13). At that time the average hourly wage of wage and salary employees in Massachusetts was $27.85 in real (inflation ad-justed) 2017 dollars. Hourly wages crept up slowly over the next four years
0%
20%
10%
30%
40%
50%
Nursing,Psychiatric, &
Home Health Aides
Personal CareAides
All OtherHealthcare Support
Workers
Misc. Community & SocialService Specialists, Incl.,
Health Educators & CommunityHealth Workers
Social andHuman Service
Assistants
All OtherWorkers
37%
44%
35%
40%
29%32%
Source: U.S. Bureau of the Census, American Community Survey, Public Use Microdata Sample Files, 2015-2016, tabulations by authors.
Chart 12. Percent of Workers in Health Care Support and Direct Care Occupations with Children Under 18 Residing intheir Households, Massachusetts, 2015-2016
Table 23. Percentage Distribution of Workers in Health Care Support and Direct Care Occupations, by Marital Status,Massachusetts, 2015-2016
Source: U.S. Bureau of the Census, American Community Survey, Public Use Microdata Sample Files, 2015-2016, tabulations by authors.
Married
Widowed
Divorced
Separated
Never married
35%
3%
13%
5%
44%
Nursing, Psychiatric,& Home Health AidesMarital Status
36%
4%
15%
4%
40%
PersonalCare Aides
37%
2%
15%
2%
44%
All Other Health CareSupport Workers
30%
3%
13%
1%
53%
Social and HumanService Assistants
35%
0%
4%
2%
60%
Misc. Specialists,Incl., Health Educators &
Community Health Workers
49%
2%
9%
2%
39%
All OtherWorkers
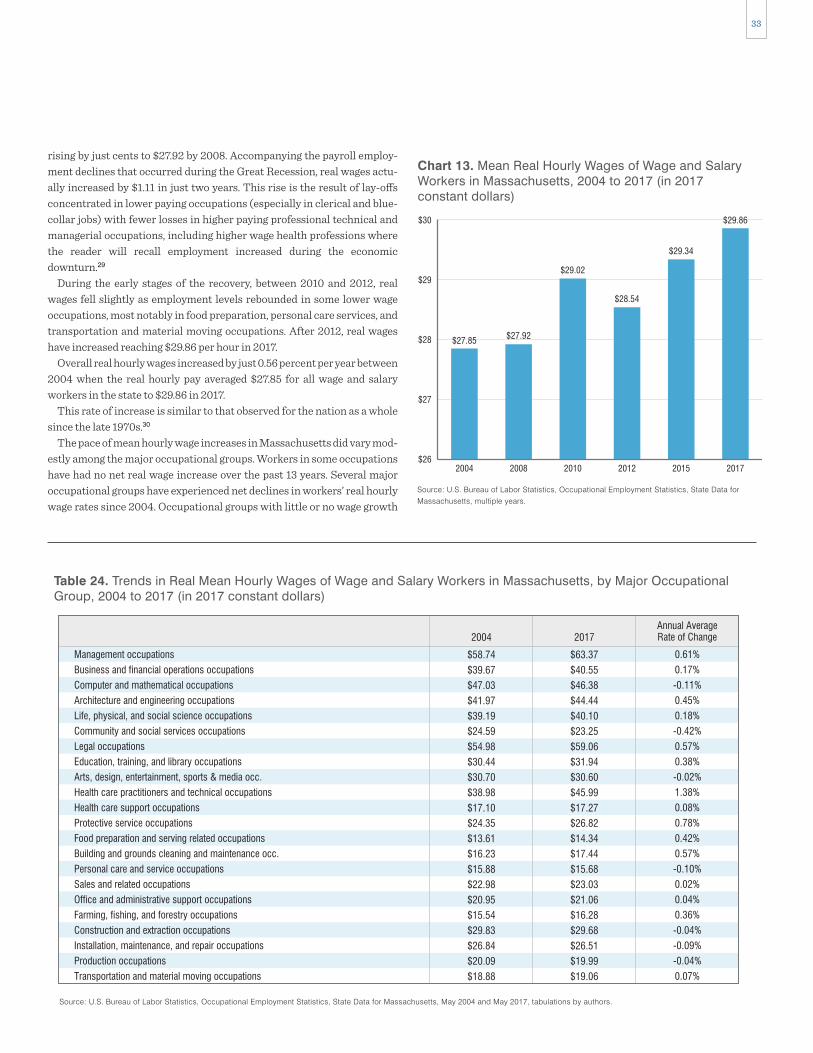
33
rising by just cents to $27.92 by 2008. Accompanying the payroll employ-ment declines that occurred during the Great Recession, real wages actu-ally increased by $1.11 in just two years. This rise is the result of lay-offs concentrated in lower paying occupations (especially in clerical and blue- collar jobs) with fewer losses in higher paying professional technical and managerial occupations, including higher wage health professions where the reader will recall employment increased during the economic downturn.29
During the early stages of the recovery, between 2010 and 2012, real wages fell slightly as employment levels rebounded in some lower wage occupations, most notably in food preparation, personal care services, and transportation and material moving occupations. After 2012, real wages have increased reaching $29.86 per hour in 2017.
Overall real hourly wages increased by just 0.56 percent per year between 2004 when the real hourly pay averaged $27.85 for all wage and salary workers in the state to $29.86 in 2017.
This rate of increase is similar to that observed for the nation as a whole since the late 1970s.30
The pace of mean hourly wage increases in Massachusetts did vary mod-estly among the major occupational groups. Workers in some occupations have had no net real wage increase over the past 13 years. Several major occupational groups have experienced net declines in workers’ real hourly wage rates since 2004. Occupational groups with little or no wage growth
$26
$28
$27
$29
$30
2004 2008 2010 20152012 2017
$27.85
$29.34
$27.92
$29.02
$28.54
$29.86
Source: U.S. Bureau of Labor Statistics, Occupational Employment Statistics, State Data for Massachusetts, multiple years.
Chart 13. Mean Real Hourly Wages of Wage and SalaryWorkers in Massachusetts, 2004 to 2017 (in 2017constant dollars)
Table 24. Trends in Real Mean Hourly Wages of Wage and Salary Workers in Massachusetts, by Major OccupationalGroup, 2004 to 2017 (in 2017 constant dollars)
Source: U.S. Bureau of Labor Statistics, Occupational Employment Statistics, State Data for Massachusetts, May 2004 and May 2017, tabulations by authors.
Management occupations
Business and financial operations occupations
Computer and mathematical occupations
Architecture and engineering occupations
Life, physical, and social science occupations
Community and social services occupations
Legal occupations
Education, training, and library occupations
Arts, design, entertainment, sports & media occ.
Health care practitioners and technical occupations
Health care support occupations
Protective service occupations
Food preparation and serving related occupations
Building and grounds cleaning and maintenance occ.
Personal care and service occupations
Sales and related occupations
Office and administrative support occupations
Farming, fishing, and forestry occupations
Construction and extraction occupations
Installation, maintenance, and repair occupations
Production occupations
Transportation and material moving occupations
$63.37
$40.55
$46.38
$44.44
$40.10
$23.25
$59.06
$31.94
$30.60
$45.99
$17.27
$26.82
$14.34
$17.44
$15.68
$23.03
$21.06
$16.28
$29.68
$26.51
$19.99
$19.06
2017
0.61%
0.17%
-0.11%
0.45%
0.18%
-0.42%
0.57%
0.38%
-0.02%
1.38%
0.08%
0.78%
0.42%
0.57%
-0.10%
0.02%
0.04%
0.36%
-0.04%
-0.09%
-0.04%
0.07%
Annual AverageRate of Change
$58.74
$39.67
$47.03
$41.97
$39.19
$24.59
$54.98
$30.44
$30.70
$38.98
$17.10
$24.35
$13.61
$16.23
$15.88
$22.98
$20.95
$15.54
$29.83
$26.84
$20.09
$18.88
2004

34
may be providing the services, the rate that the agency can charge Medicare may be higher or lower depending on the service. This also makes it difficult to set stable wage rates or provide raises as incentives. The state reim-bursed rate for personal care attendants under the MassHealth PCA pro-gram is a collectively bargained wage rate. In 2016, Governor Charles Baker signed a contract with 1199SEIU that would lead to a $15 per hour wage for PCAs by 2018.31
Overall, real hourly wages levels in Massachusetts increased by about 7.2 percent over the entire 13-year period, yet the mean real hourly wages in the home care support occupations grew by just 1 or 2 percent over the same period. This means that the relative earnings of these caregivers have fallen between 2004 and 2017. The hourly wages of combined community health worker/social and human service assistant workers of $18.29 were equal to about two-thirds of the hourly wages of all wage and salary workers in the state at that time ($27.85). By 2017, the earnings of workers providing social assistance to patients in the community ($19.12) had fallen to just 64 percent of the statewide wage rate ($29.86). Home health aides in 2004 had mean hourly wages that were equal to 52 percent of the statewide mean, but this ratio fell to about 49 percent as their wages increased at a very slow pace. Personal care aides had a mean hourly wage rate that was less than half that of the state mean in 2004 (49%). This ratio fell even further by 2017, when the mean hourly wage of personal care aides fell to just 46 per-cent of the mean wage for the state.
There are two implications of these similar and low wage rates for home health aides and personal care aides that we will discuss in more detail later in this paper. First, the low average wages for these workers, along with other factors that constrain hours worked, leads to a higher than average incidence of public assistance receipt among workers in these occupations. Second, the fact that wages and job duties for these occupations are so sim-ilar to many other occupations leads to increased substitutability among these occupations. We heard from many home care providers and home health trade associations that workers in home health care often work across similar occupations and will also work for different home health agencies in different capacities in order to maximize hours, schedules and wages to meet their specific needs. When asked about aspects of their job that they liked the least, 40 percent of home care aides in the Home Health Aide Council Survey cited pay and a quarter cited benefits as top two as-pects of their jobs that they liked the least.32
The findings in Table 26 examine the distribution of wages across work-ers in each of the health care support and direct care occupations and for all wage and salary workers in the Commonwealth during 2017. The table is
generally (but not always) required lower levels of educational attainment and associated skill proficiencies.
The findings in Table 24 examine trends in the real hourly wages of pay-roll workers in major occupational groups in Massachusetts over the entire 2004 to 2017 period. These data reveal that even in higher-level college labor market occupations real hourly wages have not increased very rap-idly over the past decade. Management, architecture and engineering, legal occupations, and education occupations all had real mean hourly wage growth of less than 1 percent per year over the 13-year period. Workers employed in most blue-collar occupations-- production, construction and extraction, and installation and repair occupations had no real wage gains over the period. Transportation and material moving occupations also saw their real hourly wages remain nearly unchanged over the 13-year period. Low-level service jobs such as food preparation and building and grounds cleaning maintenance occupations had real mean hourly wage growth per year of 0.42 percent and 0.57 percent, respectively.
Health care and social service occupations had a very different pattern of real wage change. Health care practitioners and technicians had the largest real hourly wage increases that averaged 1.4 percent per year over the 13-year period. In contrast, health care support workers saw their wages rise by just 0.08 percent per year over that period. Those employed in commu-nity and social service occupations saw their real wages fall by 0.4 percent between 2004 and 2017.
The earnings in health care support and direct care occupations barely changed between 2004 and 2017. The real hourly pay of workers employed in social and human service assistant and community health occupations increased by $0.83 over the 13-year period, yielding an annual average growth rate of 0.33 percent. The real hourly wages of home health aides rose by $0.23 from $14.55 in 2004 to $14.78 in 2017. Personal care aides’ earnings gains were not much better, rising by just $0.33 over 13 years.
In the interviews that we had conducted for our earlier report for the Office of the State Auditor, home health agencies, hospitals and other home health care providers indicated that they were considerably constrained in their ability to raise wages for these workers by the amount of reimburse-ment they were provided for these services. The floors for these reimburse-ment amounts are primarily set by the Centers for Medicare and Medicaid Services, which set the reimbursement rates for the providers who serve publicly insured elderly, disabled and/or poor individuals. The margins that the home care providers work with are very small.
Each eligible home care service that a patient requires may have a sepa-rate reimbursement rate, so that while in practice one home health aide
Table 25. Trends in Real Mean Hourly Wages of Wage and Salary Workers, Social/Community Health Support, HomeHealth Aide and Personal Care Aide Occupations, Massachusetts 2004 to 2017 (in 2017 constant dollars)
Source: U.S. Bureau of Labor Statistics, Occupational Employment Statistics, State Data for Massachusetts, May 2004 and May 2017, tabulations by authors.
Combined Community Health Worker and Social & Human Services Assistant
Home Health Aides
Personal Care Aides
$19.12
$14.78
$13.85
2017
0.33%
0.12%
0.18%
Annual AverageRate of Change
$18.29
$14.55
$13.52
2004Occupation
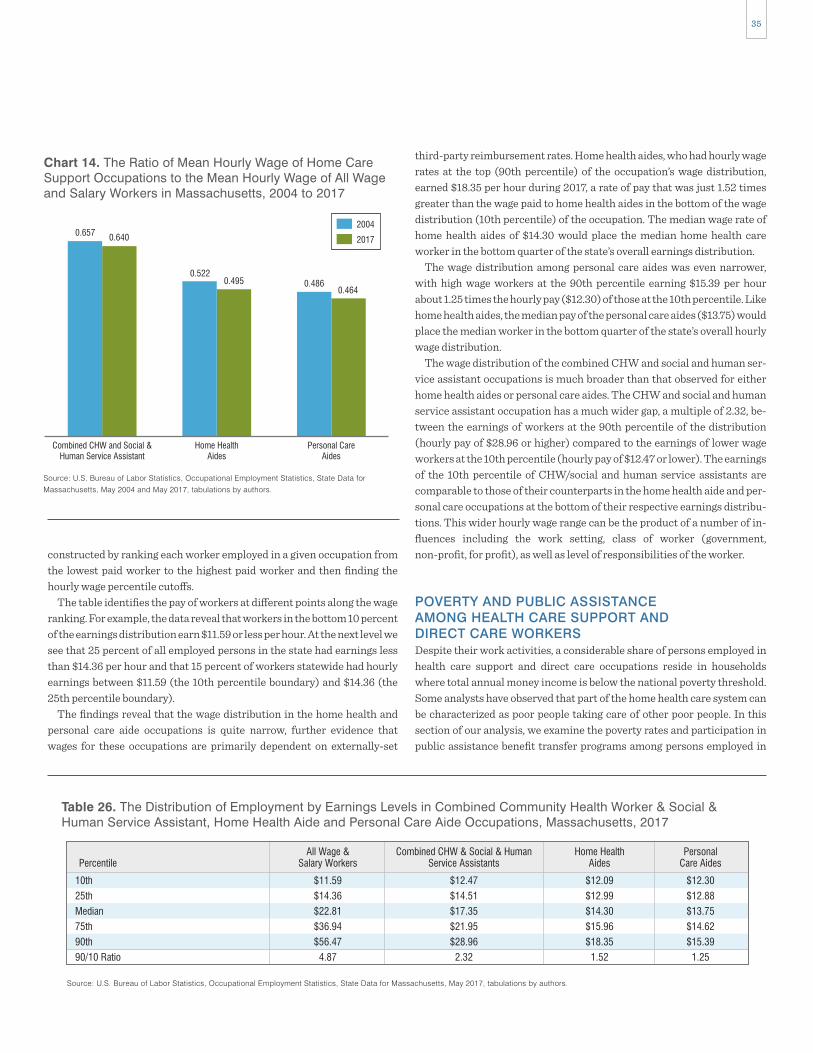
35
third-party reimbursement rates. Home health aides, who had hourly wage rates at the top (90th percentile) of the occupation’s wage distribution, earned $18.35 per hour during 2017, a rate of pay that was just 1.52 times greater than the wage paid to home health aides in the bottom of the wage distribution (10th percentile) of the occupation. The median wage rate of home health aides of $14.30 would place the median home health care worker in the bottom quarter of the state’s overall earnings distribution.
The wage distribution among personal care aides was even narrower, with high wage workers at the 90th percentile earning $15.39 per hour about 1.25 times the hourly pay ($12.30) of those at the 10th percentile. Like home health aides, the median pay of the personal care aides ($13.75) would place the median worker in the bottom quarter of the state’s overall hourly wage distribution.
The wage distribution of the combined CHW and social and human ser-vice assistant occupations is much broader than that observed for either home health aides or personal care aides. The CHW and social and human service assistant occupation has a much wider gap, a multiple of 2.32, be-tween the earnings of workers at the 90th percentile of the distribution (hourly pay of $28.96 or higher) compared to the earnings of lower wage workers at the 10th percentile (hourly pay of $12.47 or lower). The earnings of the 10th percentile of CHW/social and human service assistants are comparable to those of their counterparts in the home health aide and per-sonal care occupations at the bottom of their respective earnings distribu-tions. This wider hourly wage range can be the product of a number of in-fluences including the work setting, class of worker (government, non-profit, for profit), as well as level of responsibilities of the worker.
POVERTY AND PUBLIC ASSISTANCE AMONG HEALTH CARE SUPPORT AND DIRECT CARE WORKERSDespite their work activities, a considerable share of persons employed in health care support and direct care occupations reside in households where total annual money income is below the national poverty threshold. Some analysts have observed that part of the home health care system can be characterized as poor people taking care of other poor people. In this section of our analysis, we examine the poverty rates and participation in public assistance benefit transfer programs among persons employed in
constructed by ranking each worker employed in a given occupation from the lowest paid worker to the highest paid worker and then finding the hourly wage percentile cutoffs.
The table identifies the pay of workers at different points along the wage ranking. For example, the data reveal that workers in the bottom 10 percent of the earnings distribution earn $11.59 or less per hour. At the next level we see that 25 percent of all employed persons in the state had earnings less than $14.36 per hour and that 15 percent of workers statewide had hourly earnings between $11.59 (the 10th percentile boundary) and $14.36 (the 25th percentile boundary).
The findings reveal that the wage distribution in the home health and personal care aide occupations is quite narrow, further evidence that wages for these occupations are primarily dependent on externally-set
Combined CHW and Social &Human Service Assistant
Home HealthAides
Personal CareAides
0.657 0.640
0.5220.495 0.486
0.464
Source: U.S. Bureau of Labor Statistics, Occupational Employment Statistics, State Data for Massachusetts, May 2004 and May 2017, tabulations by authors.
Chart 14. The Ratio of Mean Hourly Wage of Home CareSupport Occupations to the Mean Hourly Wage of All Wageand Salary Workers in Massachusetts, 2004 to 2017
2004
2017
Table 26. The Distribution of Employment by Earnings Levels in Combined Community Health Worker & Social &Human Service Assistant, Home Health Aide and Personal Care Aide Occupations, Massachusetts, 2017
Source: U.S. Bureau of Labor Statistics, Occupational Employment Statistics, State Data for Massachusetts, May 2017, tabulations by authors.
10th
25th
Median
75th
90th
90/10 Ratio
Percentile
$11.59
$14.36
$22.81
$36.94
$56.47
4.87
All Wage &Salary Workers
$12.47
$14.51
$17.35
$21.95
$28.96
2.32
Combined CHW & Social & HumanService Assistants
$12.09
$12.99
$14.30
$15.96
$18.35
1.52
Home HealthAides
$12.30
$12.88
$13.75
$14.62
$15.39
1.25
PersonalCare Aides
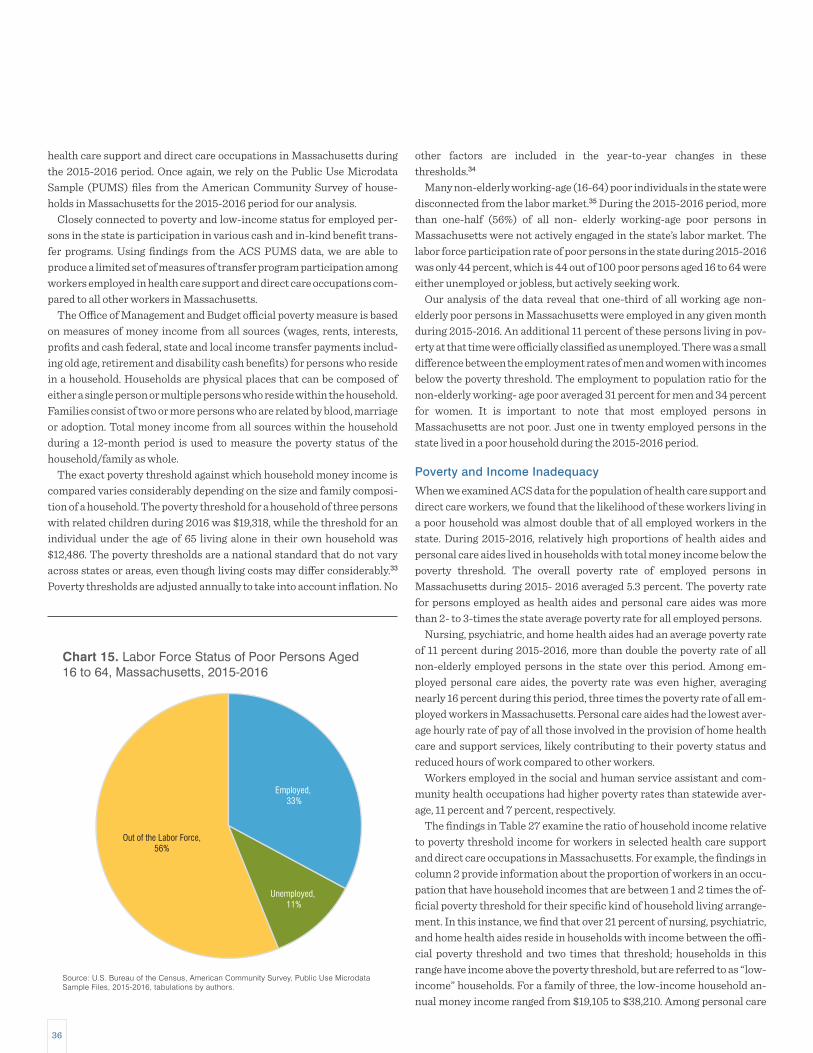
36
other factors are included in the year-to-year changes in these thresholds.34
Many non-elderly working-age (16-64) poor individuals in the state were disconnected from the labor market.35 During the 2015-2016 period, more than one-half (56%) of all non- elderly working-age poor persons in Massachusetts were not actively engaged in the state’s labor market. The labor force participation rate of poor persons in the state during 2015-2016 was only 44 percent, which is 44 out of 100 poor persons aged 16 to 64 were either unemployed or jobless, but actively seeking work.
Our analysis of the data reveal that one-third of all working age non- elderly poor persons in Massachusetts were employed in any given month during 2015-2016. An additional 11 percent of these persons living in pov-erty at that time were officially classified as unemployed. There was a small difference between the employment rates of men and women with incomes below the poverty threshold. The employment to population ratio for the non-elderly working- age poor averaged 31 percent for men and 34 percent for women. It is important to note that most employed persons in Massachusetts are not poor. Just one in twenty employed persons in the state lived in a poor household during the 2015-2016 period.
Poverty and Income Inadequacy
When we examined ACS data for the population of health care support and direct care workers, we found that the likelihood of these workers living in a poor household was almost double that of all employed workers in the state. During 2015-2016, relatively high proportions of health aides and personal care aides lived in households with total money income below the poverty threshold. The overall poverty rate of employed persons in Massachusetts during 2015- 2016 averaged 5.3 percent. The poverty rate for persons employed as health aides and personal care aides was more than 2- to 3-times the state average poverty rate for all employed persons.
Nursing, psychiatric, and home health aides had an average poverty rate of 11 percent during 2015-2016, more than double the poverty rate of all non-elderly employed persons in the state over this period. Among em-ployed personal care aides, the poverty rate was even higher, averaging nearly 16 percent during this period, three times the poverty rate of all em-ployed workers in Massachusetts. Personal care aides had the lowest aver-age hourly rate of pay of all those involved in the provision of home health care and support services, likely contributing to their poverty status and reduced hours of work compared to other workers.
Workers employed in the social and human service assistant and com-munity health occupations had higher poverty rates than statewide aver-age, 11 percent and 7 percent, respectively.
The findings in Table 27 examine the ratio of household income relative to poverty threshold income for workers in selected health care support and direct care occupations in Massachusetts. For example, the findings in column 2 provide information about the proportion of workers in an occu-pation that have household incomes that are between 1 and 2 times the of-ficial poverty threshold for their specific kind of household living arrange-ment. In this instance, we find that over 21 percent of nursing, psychiatric, and home health aides reside in households with income between the offi-cial poverty threshold and two times that threshold; households in this range have income above the poverty threshold, but are referred to as “low- income” households. For a family of three, the low-income household an-nual money income ranged from $19,105 to $38,210. Among personal care
health care support and direct care occupations in Massachusetts during the 2015-2016 period. Once again, we rely on the Public Use Microdata Sample (PUMS) files from the American Community Survey of house-holds in Massachusetts for the 2015-2016 period for our analysis.
Closely connected to poverty and low-income status for employed per-sons in the state is participation in various cash and in-kind benefit trans-fer programs. Using findings from the ACS PUMS data, we are able to produce a limited set of measures of transfer program participation among workers employed in health care support and direct care occupations com-pared to all other workers in Massachusetts.
The Office of Management and Budget official poverty measure is based on measures of money income from all sources (wages, rents, interests, profits and cash federal, state and local income transfer payments includ-ing old age, retirement and disability cash benefits) for persons who reside in a household. Households are physical places that can be composed of either a single person or multiple persons who reside within the household. Families consist of two or more persons who are related by blood, marriage or adoption. Total money income from all sources within the household during a 12-month period is used to measure the poverty status of the household/family as whole.
The exact poverty threshold against which household money income is compared varies considerably depending on the size and family composi-tion of a household. The poverty threshold for a household of three persons with related children during 2016 was $19,318, while the threshold for an individual under the age of 65 living alone in their own household was $12,486. The poverty thresholds are a national standard that do not vary across states or areas, even though living costs may differ considerably.33
Poverty thresholds are adjusted annually to take into account inflation. No
Source: U.S. Bureau of the Census, American Community Survey, Public Use Microdata Sample Files, 2015-2016, tabulations by authors.
Chart 15. Labor Force Status of Poor Persons Aged16 to 64, Massachusetts, 2015-2016
Employed, 33%
Unemployed, 11%
Out of the Labor Force,56%

37
Insurance Program (CHIP). In Massachusetts, CHIP eligibility is limited to those households with annual money income equal to about 3 times the official poverty income threshold. In 2016, households and families with three persons with total money income below $57,315 met the income eligibility requirement under the state’s CHIP program. About 26 percent of all 16- to 64-year old employed persons in Massachusetts lived in households with income under three times the poverty threshold and so met the income eligibility requirements for the state’s CHIP program.36
aides, 23 percent had household/family incomes that place them in the low-income category.
Adding both the officially poor together with the low-income households, we found that 32 percent of health aides lived in a low-income or poor household and 39 percent of all personal care aides were classified as low-income or poor. One in five social and human service assistants and community health workers combined resided in households where money income were at or below the low-income level of 200 percent of the poverty line. Among all workers in the state, nearly one in six non-elderly employed persons resided in households with annual income below 200 percent of the poverty threshold.
Eligibility for participation in various kinds of public assistance programs is usually determined by household and family income means test. Some public assistance programs’ money income limits are set as multiples of the national poverty rates including the Children’s Health
0%
4%
2%
8%
6%
12%
10%
14%
16%
18%
Nursing,Psychiatric, &
Home Health Aides
Personal CareAides
Misc. Community & SocialService Specialists, Incl.,
Health Educators & CommunityHealth Workers
Social andHuman Service
Assistants
All Workers
11.0%
6.6%
15.7%
10.8%
5.3%
Source: U.S. Bureau of the Census, American Community Survey, Public Use Microdata Sample Files, 2015-2016, tabulations by authors.
Chart 16. Poverty Rates of 16- to 64-Year-Old Workers in Selected Health Care Support and Direct Care Occupationsin Massachusetts, 2015-2016
Table 27. Household Income Relative to Poverty Threshold among 16 to 64-Year Old Health Care Support and DirectCare Workers, and All Workers in Massachusetts, 2015-2016
Source: U.S. Bureau of Labor Statistics, Occupational Employment Statistics, State Data for Massachusetts, May 2017, tabulations by authors.
Nursing, Psychiatric & Home Health Aides
Personal Care Aides
Combined: Social & Human Service Assistants & Miscellaneous Community & Social
Service Specialists, Incl., Health Educators & Community Health Workers
All Workers
Occupations
11.0%
15.7%
9.5%
5.3%
BelowPoverty
21.5%
22.8%
9.9%
8.9%
Between 1-2Times Poverty
19.2%
21.7%
14.8%
11.6%
Between 2-3Times Poverty
48.3%
39.8%
65.8%
74.2%
3 Times or Greaterthan Poverty

38
employees who work for home health firms.Second, respondents to household surveys like the ACS under-report
their participation in benefit transfer programs. A careful study of report-ing that compares administrative records with PUMS household survey responses accounts for only about 55 percent of spending on both food stamp and TANF programs and about 82 percent of SSI spending.37
Even with clear evidence of downward bias in the measure of transfer program participation derived from the ACS household survey, we still find very high rates of transfer program participation among those employed in health care support and direct care occupations. These findings are not surprising given the well above average shares of workers in these occupa-tions who live in poor or low-income households.
Nearly one in five (18.5%) employed persons in Massachusetts reported that they participated in one of the four cash or in-kind public assistance transfer programs that were covered in the ACS questionnaire in any given month during the 2015-2016 period. The incidence of public assistance program participation among workers in home health aide and personal care aide occupations was more than twice that of all employed persons in the state. About 44 percent of workers in the home health aide occupation participated in a public assistance program, which was 2.4 times the state average for all workers in Massachusetts.
The incidence of participation in public assistance programs was even higher among persons who worked as a personal care aide. About half of all personal care aides participated in a public assistance program at any given point in time during the 2015 to 2016 period. This means that personal care aides were 2.7 times as likely as all workers in the state to receive benefits from one of the four programs covered by the ACS survey questionnaire.
Social and human service assistants were also somewhat more likely to
Over half (52%) of persons employed in nursing and home health aide occupations and 60 percent of all personal care aides had household in-come below three times the poverty threshold. And over one-third (34%) of non-elderly persons employed in the social and human service assistant and community health occupations lived in households with income below 3 times the poverty threshold for their type of household/family.
Participation in Public Assistance ProgramsThe relatively low levels of family and household incomes of those em-ployed in nursing and home health aide and personal care aide occupations means that the likelihood of members of these households participating in various kinds of cash transfer and especially in-kind benefit programs is much greater than average non-elderly employed persons in the Commonwealth.
The ACS PUMS data files contain some information about participation in some cash and in-kind public assistance programs available to eligible residents of the state. However, it is important to note that these data are limited in at least two key respects: First, the ACS questionnaire asks about participation in just four transfer programs. Two are cash transfer pro-grams including Supplemental Security Income (SSI) and public assis-tance or welfare cash payments (Temporary Assistance for Needy Families or TANF) from state and/or local sources as well as two in-kind benefit programs including food stamps or the Supplemental Nutrition Assistance Program (SNAP) and Medicaid. All other cash income and benefit transfer programs are excluded from the ACS measures of public assistance pro-gram participation, including most importantly public housing and rent subsidy programs. Housing subsidies and access to public housing is thought to be among the most important income transfer program among
Nursing,Psychiatric, &
Home Health Aides
Personal CareAides
Misc. Community & SocialService Specialists, Incl.,
Health Educators & CommunityHealth Workers
Social andHuman Service
Assistants
All Workers
43.7%
15.4%
49.6%
27.3%
18.5%
Source: U.S. Bureau of the Census, American Community Survey, Public Use Microdata Sample Files, 2015-2016, tabulations by authors.
Chart 17. Incidence of Participation in Public Assistance Benefit Transfer Programs Among Workers in SelectedHealth Care Support and Direct Care Occupations in Massachusetts, 2015-2016
0%
20%
10%
30%
40%
50%
60%

39
for the Office of the State Auditor on health care and direct care workforce developments we had organized discussions with about 40 members of the Massachusetts Home Care Aide Council all of whom owned or managed home care agency businesses. We asked this group a variety of questions about the nature of program participation among their home care aide staff. The employer group provided us with their consensus ranking of public assistance benefit programs most often utilized by their staff. The employ-ers listed five programs in descending order that frequently were utilized by their home care staff including:
1. Public housing/housing subsidies2. MassHealth/Medicaid3. Childcare subsidies4. SNAP (Food Stamps)5. Fuel assistance (especially in a bad winter)
Information about just two of these five in-kind public assistance benefit programs was collected as part of the ACS survey: MassHealth participa-tion (Medicaid) and SNAP (food stamps) participation. The employers told us that they believed that public housing and housing subsidies were by far the most important programs for their workforce. Also not included in our ACS measures of public assistance were childcare subsidies and fuel assis-tance—both programs in which employers noted their home care staff also participated. A 2016 survey of about 600 home care aides in Massachusetts conducted by the Home Care Aide Council found that 54 percent of respon-dents participated in one or more public assistance programs;38 ten per-centage points higher than the 44 percent participation in public assis-tance programs among home care aides estimated from ACS data for Massachusetts. Nearly 13 percent of respondents to the Home Care Aide
participate in an income transfer program in Massachusetts during the 2015-2016 period; with a 27 percent participation in a public assistance program, the incidence of participation among these workers was nearly 1.5 times the average incidence of participation of persons employed in all occupations in the state. Public assistance receipt was not as high among community health workers, 15 percent.
Analysis of the type of public assistance receipt reveals that relatively few workers in the health care support and direct care occupations re-ceived cash public assistance. Instead, we found that most of the participa-tion public assistance programs among these workers was assistance pro-grams received money income from a cash public assistance program. A large majority of health care support and direct care workers who received some type of public transfer benefit received food stamps (50 percent) and/or Medicaid (88 percent). Like most associated with the receipt of benefits from non-cash benefit programs. Our analysis of the ACS PUMS files found that among the four health care support and direct care occupations only 4 percent (SSI) and 6 percent (TANF, local aid and all others) of all those en-rolled in public employed persons, health care support and direct care workers are considerably less likely to receive cash public assistance pay-ments with participation in public assistance benefit transfer programs largely restricted to in-kind transfers. We found that among those public assistance beneficiaries employed in all occupations in the state just 4 per-cent received cash public assistance while a sizable share received non-cash benefits in the form of food stamps (41%) or Medicaid (84%).
It is important to stress the limited nature of the information about the actual participation of health care support and direct care workers in the entire range of public assistance programs available to low-income house-holds in Massachusetts. As part of our work for a previous study prepared
Food Stamps Medicaid Other Public Assistance,Cash Income
SSI, Cash Income
50.4%
41.1%
87.7%83.9%
4.0% 3.9% 5.9% 4.3%
Source: U.S. Bureau of the Census, American Community Survey, Public Use Microdata Sample Files, 2015-2016, tabulations by authors.
Chart 18. Program Participation Rates Among Employed Persons who Received Some Public Assistance, HealthCare Support and Direct Care Workers and All Workers, Massachusetts, 2015-2016
0%
20%
40%
60%
80%
100%
Public Assistance Recipients in Health Care Support & Direct Care Occupations
Public Assistance Recipients in All Occupations

40
unmarried health care support and direct care workers. Thirty percent of married home health aides were receiving some type of public assistance during 2015-2016, while 51 percent of unmarried workers in this occupa-tion received a public assistance benefit.
Unmarried personal care aides were about 1.3 times more likely than their married peers to participate in a public assistance program (55% ver-sus 41%). Among workers in social and human services and community health occupations (combined) there was a sizeable difference in the pro-portion of married workers relative to their single counterparts who re-ceived public assistance benefits during 2015-2016; 12 percent among married workers in these occupations versus 29 percent among their un-married counterparts. Overall in the four health care support and direct care occupations combined, we found that nearly one-third (32%) of mar-ried workers received a public assistance benefit while this proportion was exactly one-half among their unmarried counterparts. Thus, unmarried persons employed in these four occupations were collectively about 1.6 times more likely to receive some form of public assistance than their mar-ried counterparts. Furthermore, the reader will recall that workers em-ployed in these four health care support and direct care occupations were less likely to be married than workers employed in other occupations.
The presence of children (under the age of 18) in the household/family of persons employed in health care support and direct care occupations sharply increases the likelihood these workers will participate in a public assistance program. During the 2015-2016 period, 60 percent of employed nursing and home health aides who lived with children under the age of 18 participated in at least one public assistance program during 2015-2016 compared to just 34 percent of their counterparts with no children in their homes. Among personal care aides, 62 percent of those with children par-ticipated in public benefit transfer programs during 2015-2016 compared
Council survey reported receiving Section 8 benefits in the form of public housing or rent subsidy.
Thus, the low-income workers who largely make up the majority of the home health industry workforce are likely to have a very high incidence of participation in a variety of in-kind benefit transfer programs with public housing and housing subsidy transfer programs serving as an important source of public support of living standards in these households. We will examine in detail in a subsequent section some measures of the impact of participation in the in- kind benefit programs on worker decisions to sup-ply hours of work.
The incidence of participation in public assistance programs varied somewhat by the characteristics of persons employed in the health care support and direct care occupations. Men employed in health care support and direct care occupations were somewhat less likely to report participa-tion in a public assistance program. The male to female difference in par-ticipation was largest among home health aide workers where 25 percent of men employed in the occupation received some form of public assis-tance while nearly half (47 percent) of women participated in a public as-sistance program. Slightly more than half of women (52 percent) and 41 percent of men who were employed in the personal care aide occupation received a cash or in-kind public assistance benefit in 2015-2016. Among workers employed in the social and human service assistant and commu-nity health occupations, women were more likely than men to receive some form of public assistance income (24 percent among women and 20 per-cent among men).
The marital status of persons employed in health care support and direct care occupations also influenced the likelihood of participation in a public assistance benefit transfer program. Our analysis of the ACS data found very large public assistance participation differences between married and
Nursing,Psychiatric, &
Home Health Aides
Personal CareAides
All WorkersSocial & Human Service Assistants& Misc. Community & Social
Service Specialists, Incl., Health Educators& Community Health Workers
47%
25%
52%
41%
24%
20% 20%17%
Source: U.S. Bureau of the Census, American Community Survey, Public Use Microdata Sample Files, 2015-2016, tabulations by authors.
Chart 19. Incidence of Participation in Public Assistance Benefit Transfer Programs in Selected Health Care Supportand Direct Care Occupations in Massachusetts, by Gender, 2015-2016
0%
10%
20%
30%
40%
50%
60%
Women
Men
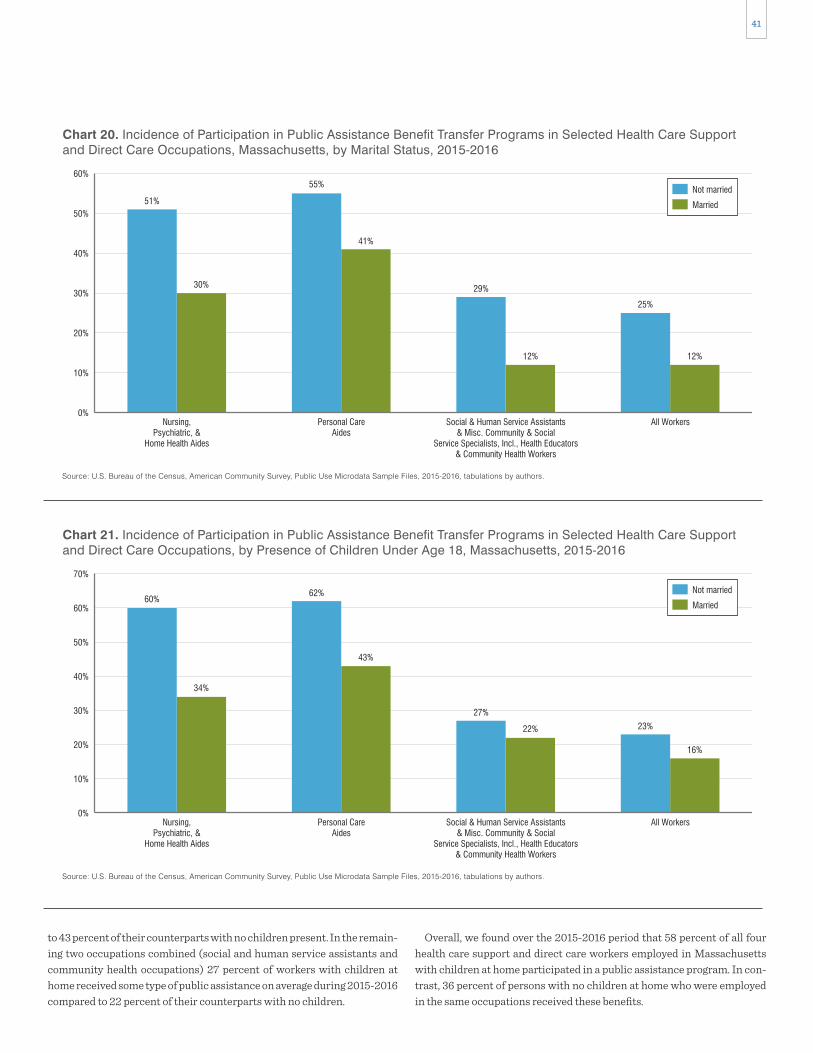
41
Overall, we found over the 2015-2016 period that 58 percent of all four health care support and direct care workers employed in Massachusetts with children at home participated in a public assistance program. In con-trast, 36 percent of persons with no children at home who were employed in the same occupations received these benefits.
to 43 percent of their counterparts with no children present. In the remain-ing two occupations combined (social and human service assistants and community health occupations) 27 percent of workers with children at home received some type of public assistance on average during 2015-2016 compared to 22 percent of their counterparts with no children.
Nursing,Psychiatric, &
Home Health Aides
Personal CareAides
All WorkersSocial & Human Service Assistants& Misc. Community & Social
Service Specialists, Incl., Health Educators& Community Health Workers
51%
30%
55%
41%
29%
12%
25%
12%
Source: U.S. Bureau of the Census, American Community Survey, Public Use Microdata Sample Files, 2015-2016, tabulations by authors.
Chart 20. Incidence of Participation in Public Assistance Benefit Transfer Programs in Selected Health Care Supportand Direct Care Occupations, Massachusetts, by Marital Status, 2015-2016
0%
10%
20%
30%
40%
50%
60%
Not married
Married
Nursing,Psychiatric, &
Home Health Aides
Personal CareAides
All WorkersSocial & Human Service Assistants& Misc. Community & Social
Service Specialists, Incl., Health Educators& Community Health Workers
60%
34%
62%
43%
27%
22% 23%
16%
Source: U.S. Bureau of the Census, American Community Survey, Public Use Microdata Sample Files, 2015-2016, tabulations by authors.
Chart 21. Incidence of Participation in Public Assistance Benefit Transfer Programs in Selected Health Care Supportand Direct Care Occupations, by Presence of Children Under Age 18, Massachusetts, 2015-2016
0%
10%
20%
30%
40%
50%
60%
70%
Not married
Married
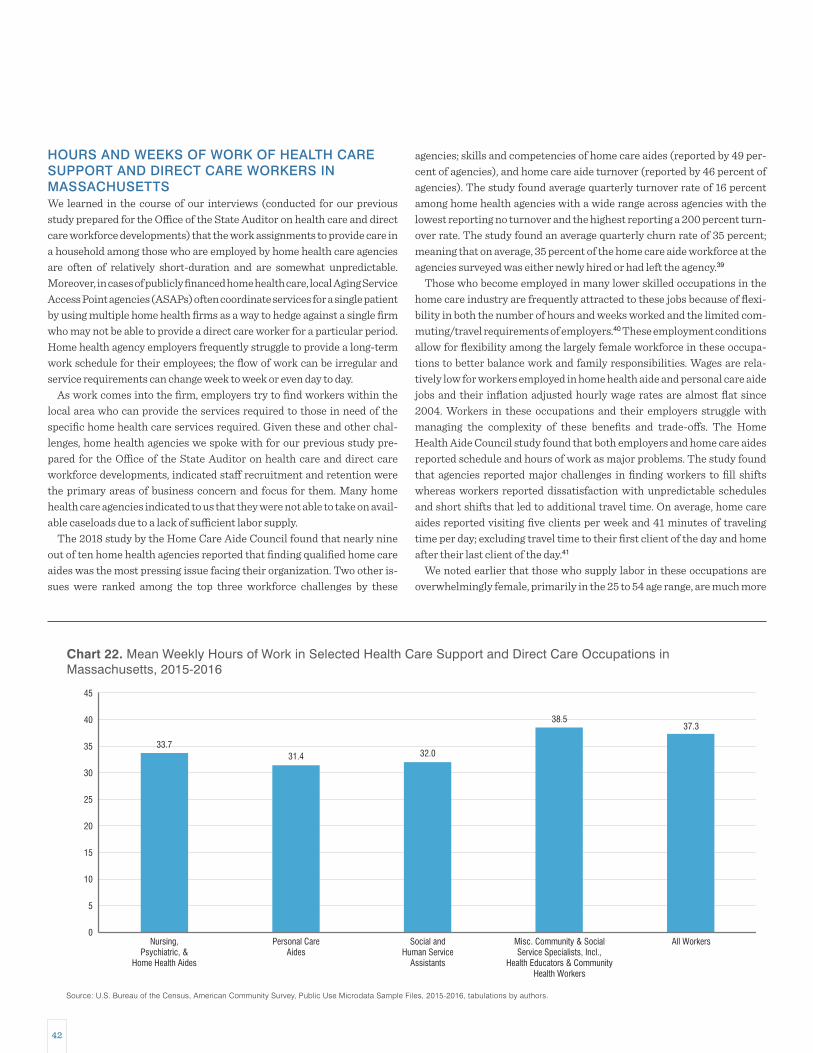
42
agencies; skills and competencies of home care aides (reported by 49 per-cent of agencies), and home care aide turnover (reported by 46 percent of agencies). The study found average quarterly turnover rate of 16 percent among home health agencies with a wide range across agencies with the lowest reporting no turnover and the highest reporting a 200 percent turn-over rate. The study found an average quarterly churn rate of 35 percent; meaning that on average, 35 percent of the home care aide workforce at the agencies surveyed was either newly hired or had left the agency.39
Those who become employed in many lower skilled occupations in the home care industry are frequently attracted to these jobs because of flexi-bility in both the number of hours and weeks worked and the limited com-muting/travel requirements of employers.40 These employment conditions allow for flexibility among the largely female workforce in these occupa-tions to better balance work and family responsibilities. Wages are rela-tively low for workers employed in home health aide and personal care aide jobs and their inflation adjusted hourly wage rates are almost flat since 2004. Workers in these occupations and their employers struggle with managing the complexity of these benefits and trade-offs. The Home Health Aide Council study found that both employers and home care aides reported schedule and hours of work as major problems. The study found that agencies reported major challenges in finding workers to fill shifts whereas workers reported dissatisfaction with unpredictable schedules and short shifts that led to additional travel time. On average, home care aides reported visiting five clients per week and 41 minutes of traveling time per day; excluding travel time to their first client of the day and home after their last client of the day.41
We noted earlier that those who supply labor in these occupations are overwhelmingly female, primarily in the 25 to 54 age range, are much more
HOURS AND WEEKS OF WORK OF HEALTH CARE SUPPORT AND DIRECT CARE WORKERS IN MASSACHUSETTSWe learned in the course of our interviews (conducted for our previous study prepared for the Office of the State Auditor on health care and direct care workforce developments) that the work assignments to provide care in a household among those who are employed by home health care agencies are often of relatively short-duration and are somewhat unpredictable. Moreover, in cases of publicly financed home health care, local Aging Service Access Point agencies (ASAPs) often coordinate services for a single patient by using multiple home health firms as a way to hedge against a single firm who may not be able to provide a direct care worker for a particular period. Home health agency employers frequently struggle to provide a long-term work schedule for their employees; the flow of work can be irregular and service requirements can change week to week or even day to day.
As work comes into the firm, employers try to find workers within the local area who can provide the services required to those in need of the specific home health care services required. Given these and other chal-lenges, home health agencies we spoke with for our previous study pre-pared for the Office of the State Auditor on health care and direct care workforce developments, indicated staff recruitment and retention were the primary areas of business concern and focus for them. Many home health care agencies indicated to us that they were not able to take on avail-able caseloads due to a lack of sufficient labor supply.
The 2018 study by the Home Care Aide Council found that nearly nine out of ten home health agencies reported that finding qualified home care aides was the most pressing issue facing their organization. Two other is-sues were ranked among the top three workforce challenges by these
0
10
5
15
20
25
30
35
40
45
Nursing,Psychiatric, &
Home Health Aides
Personal CareAides
Misc. Community & SocialService Specialists, Incl.,
Health Educators & CommunityHealth Workers
Social andHuman Service
Assistants
All Workers
33.731.4 32.0
38.537.3
Source: U.S. Bureau of the Census, American Community Survey, Public Use Microdata Sample Files, 2015-2016, tabulations by authors.
Chart 22. Mean Weekly Hours of Work in Selected Health Care Support and Direct Care Occupations inMassachusetts, 2015-2016
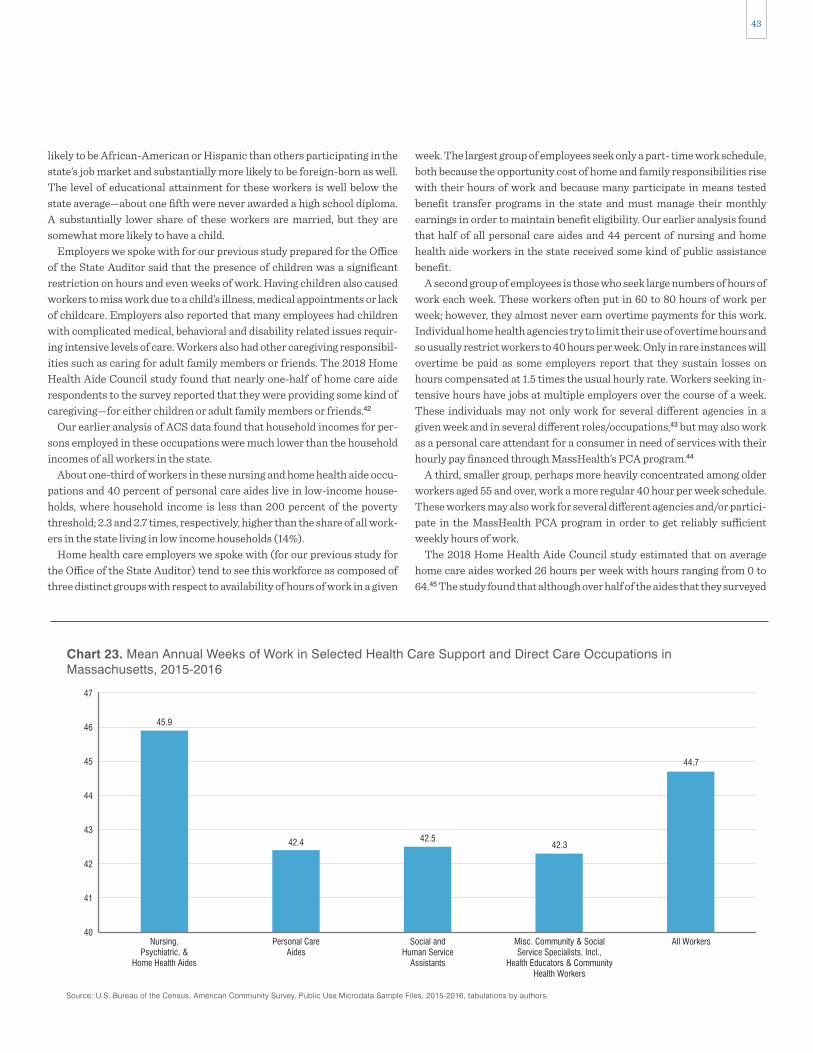
43
week. The largest group of employees seek only a part- time work schedule, both because the opportunity cost of home and family responsibilities rise with their hours of work and because many participate in means tested benefit transfer programs in the state and must manage their monthly earnings in order to maintain benefit eligibility. Our earlier analysis found that half of all personal care aides and 44 percent of nursing and home health aide workers in the state received some kind of public assistance benefit.
A second group of employees is those who seek large numbers of hours of work each week. These workers often put in 60 to 80 hours of work per week; however, they almost never earn overtime payments for this work. Individual home health agencies try to limit their use of overtime hours and so usually restrict workers to 40 hours per week. Only in rare instances will overtime be paid as some employers report that they sustain losses on hours compensated at 1.5 times the usual hourly rate. Workers seeking in-tensive hours have jobs at multiple employers over the course of a week. These individuals may not only work for several different agencies in a given week and in several different roles/occupations,43 but may also work as a personal care attendant for a consumer in need of services with their hourly pay financed through MassHealth’s PCA program.44
A third, smaller group, perhaps more heavily concentrated among older workers aged 55 and over, work a more regular 40 hour per week schedule. These workers may also work for several different agencies and/or partici-pate in the MassHealth PCA program in order to get reliably sufficient weekly hours of work.
The 2018 Home Health Aide Council study estimated that on average home care aides worked 26 hours per week with hours ranging from 0 to 64.45 The study found that although over half of the aides that they surveyed
likely to be African-American or Hispanic than others participating in the state’s job market and substantially more likely to be foreign-born as well. The level of educational attainment for these workers is well below the state average—about one fifth were never awarded a high school diploma. A substantially lower share of these workers are married, but they are somewhat more likely to have a child.
Employers we spoke with for our previous study prepared for the Office of the State Auditor said that the presence of children was a significant restriction on hours and even weeks of work. Having children also caused workers to miss work due to a child’s illness, medical appointments or lack of childcare. Employers also reported that many employees had children with complicated medical, behavioral and disability related issues requir-ing intensive levels of care. Workers also had other caregiving responsibil-ities such as caring for adult family members or friends. The 2018 Home Health Aide Council study found that nearly one-half of home care aide respondents to the survey reported that they were providing some kind of caregiving—for either children or adult family members or friends.42
Our earlier analysis of ACS data found that household incomes for per-sons employed in these occupations were much lower than the household incomes of all workers in the state.
About one-third of workers in these nursing and home health aide occu-pations and 40 percent of personal care aides live in low-income house-holds, where household income is less than 200 percent of the poverty threshold; 2.3 and 2.7 times, respectively, higher than the share of all work-ers in the state living in low income households (14%).
Home health care employers we spoke with (for our previous study for the Office of the State Auditor) tend to see this workforce as composed of three distinct groups with respect to availability of hours of work in a given
40
41
42
43
44
45
46
47
Nursing,Psychiatric, &
Home Health Aides
Personal CareAides
Misc. Community & SocialService Specialists, Incl.,
Health Educators & CommunityHealth Workers
Social andHuman Service
Assistants
All Workers
45.9
42.4 42.542.3
44.7
Source: U.S. Bureau of the Census, American Community Survey, Public Use Microdata Sample Files, 2015-2016, tabulations by authors.
Chart 23. Mean Annual Weeks of Work in Selected Health Care Support and Direct Care Occupations inMassachusetts, 2015-2016

44
data reveals that on average employed persons in the state, including those on part-time and part-year schedules, worked 1,739 hours per year during 2015-2016. About 65 percent of all those employed in Massachusetts during 2015-2016 worked full-time and year-round.
Those employed in health care support and direct care occupations worked fewer hours per year than their counterparts employed in other occupations in the state’s job market. Nursing and home health aides worked an average of 1,590 hours per year, about 9 percent fewer annual hours than the average worker in the state. Personal care aides worked sub-stantially fewer hours supplying an average of just over 1,407 hours of labor per year, almost one-fifth fewer hours of labor supplied relative to mean annual hours of labor among all workers in Massachusetts. Full- time and year-round work was much more prevalent among the state’s workers in the nursing and home health aide occupation than in the personal care aide occupation. Over one-half (51%) of nursing and home health aides in the state worked a full-time and year-round schedule, while just 42 percent of personal care aides were full-time year-round workers in 2015-2016.
The annual earnings of employed persons are influenced by a wide range of human capital traits including academic ability, literacy and numeracy, occupational knowledge, social skills and behavioral characteristics. In addition, access to employment in industries and occupations in which these proficiencies are desired and valued by employers certainly influ-ences the level of annual earnings of workers, as well as the level of lifetime earnings.
However, decisions that workers make about the number of hours and weeks they desire to work, along with the hours and weeks of work offered by employers can substantially influence the annual earnings of workers.
In a previous section of this paper, we examined trends in the real hourly
were satisfied with their current hours of work, 42 percent expressed a desire to work additional hours.
Persons employed in health care support and direct care occupations in Massachusetts worked somewhat fewer hours per week on average com-pared to workers in all other occupations. Weekly hours of work for all employed workers in Massachusetts averaged 37.3 hours per week during 2015-2016. Workers employed in personal care aide positions worked an average of 31.4 hours per week, about one-fifth fewer hours than other workers did during that period. Those employed in nursing and home health aide occupations worked an average of 33.7 hours per week about 7 percent more hours than personal care aides did and about 11 percent fewer hours than all workers in Massachusetts.
Employed persons in Massachusetts worked an average of 44.7 weeks out of the year in 2015-2016. While many people think of their employment as year-round, it is often the case that individuals do not work a year-round schedule for a variety of reasons ranging from schooling, family responsi-bilities, employment in seasonal industries, involuntary lay-off and tempo-rary or even permanent withdrawal from the labor market, to name a few. Our analysis of the ACS data reveals that the mean number of weeks of all workers in the state was about 44.7 weeks per year during 2015-2016. The mean annual weeks of employment among the four health care support and direct care occupations ranged from 45.9 weeks (about 1 week above the statewide average) among nursing and home health aides to 42 weeks (about 3 weeks below the statewide average) among workers employed in personal care aide, social and human service assistant and community health occupations.
The number of weeks and hours of work yield the total number of hours of labor an individual supplies in the labor market. Our analysis of the ACS
0
200
400
600
1,000
1,200
1,600
1,400
1,800
2,000
Nursing,Psychiatric, &
Home Health Aides
Personal CareAides
Misc. Community & SocialService Specialists, Incl.,
Health Educators & CommunityHealth Workers
Social andHuman Service
Assistants
All Workers
1,590
1,4071,463
1,752 1,739
Source: U.S. Bureau of the Census, American Community Survey, Public Use Microdata Sample Files, 2015-2016, tabulations by authors.
Chart 24. Mean Annual Hours of Work in Selected Health Care Support and Direct Care Occupations inMassachusetts, 2015-2016

45
year. Economists think that choices made by individuals to supply hours of work in the labor market are in part governed by the gains in earnings (ac-tually, the goods and services purchased by those earnings) relative to the costs of engaging in any of a wide range of non-work activities. Among these non-work alternatives may be a wide range of family and personal responsibilities. Some of the home health aide employers that we spoke with for our previous study for the Office of the State Auditor, indicated having substantial shares of their staff with children with physical, cogni-tive and emotional disabilities, as well as children engaged in the criminal justice system. The time cost of managing these often-difficult issues can be quite high and may result in difficulty working at a given point in time. Home health agency owners and managers reported these sorts of family issues were important constraints on the ability of their home health aide and personal care aide staff in providing more hours of work and more weeks of work over the course of the year.
Hours and Weeks of Work and Participation in Public Assistance ProgramsFurther complicating the decision about how many hours and weeks of work to supply for a considerable share of health care support and direct care workers is their participation in public assistance benefit transfer pro-grams. Public assistance benefit transfer programs are means tested pro-grams, that is, individual, household and family income levels play a central role in determining eligibility to receive these transfer benefits. Our earlier analysis of the ACS data found that about 44 percent of nursing and home health aide workers and about half of all personal care aides participate in at least one of the four public assistance benefit programs that are captured by the ACS questionnaire.
earnings of workers in the health care support and direct care occupations and found that the hourly pay rates of workers in these occupations are well below the state average hourly pay rate. Below we analyze findings from the ACS PUMS data files to examine the mean annual earnings of health care support and direct care workers. This ACS measure of annual earnings takes into account decisions made by workers about how much labor they supply at the given wage rates, as well as decisions by employers about how many hours of work they will purchase at the prevailing level of compensation.
Persons employed in health care support and direct care occupations have mean annual earnings that are sharply below those of the average annual earnings of all workers in the Commonwealth. Annual earnings of all work-ers in Massachusetts average just under $55,828 during 2015-2016, about 20 percent higher than the mean earnings of all workers in the nation as a whole ($46,584). The annual earnings of nursing and home health aides averaged about $25,700 per year during 2015-2016, less than half the annual average earnings of all workers in the state during that time period.
Those employed in the personal care aide occupation reported annual earnings that averaged just $21,000 during the 2015-2016 period. Sharply lower annual hours of work and low average hourly wage rates combined to provide earnings in a year that were equal to just over one-third of the mean annual earnings of all workers in Massachusetts. The mean annual earn-ings of workers employed as social and human service assistants ($29,600) and CHWs ($39,200) were well above those of nursing and home health aides, largely because of higher hourly rates of pay.
Like all occupations, there is considerable variability in the annual earn-ings of health care support and direct care workers, in part determined by decisions about how many hours of labor workers opt to supply in a given
$0
$10,000
$20,000
$30,000
$40,000
$50,000
$60,000
Nursing,Psychiatric, &
Home Health Aides
Personal CareAides
Misc. Community & SocialService Specialists, Incl.,
Health Educators & CommunityHealth Workers
Social andHuman Service
Assistants
All Workers
$25,658
$21,075
$29,609
$39,183
$55,828
Source: U.S. Bureau of the Census, American Community Survey, Public Use Microdata Sample Files, 2015-2016, tabulations by authors.
Chart 25. Mean Annual Earnings of Employed in Selected Health Care Support and Direct Care Occupations inMassachusetts, 2015-2016
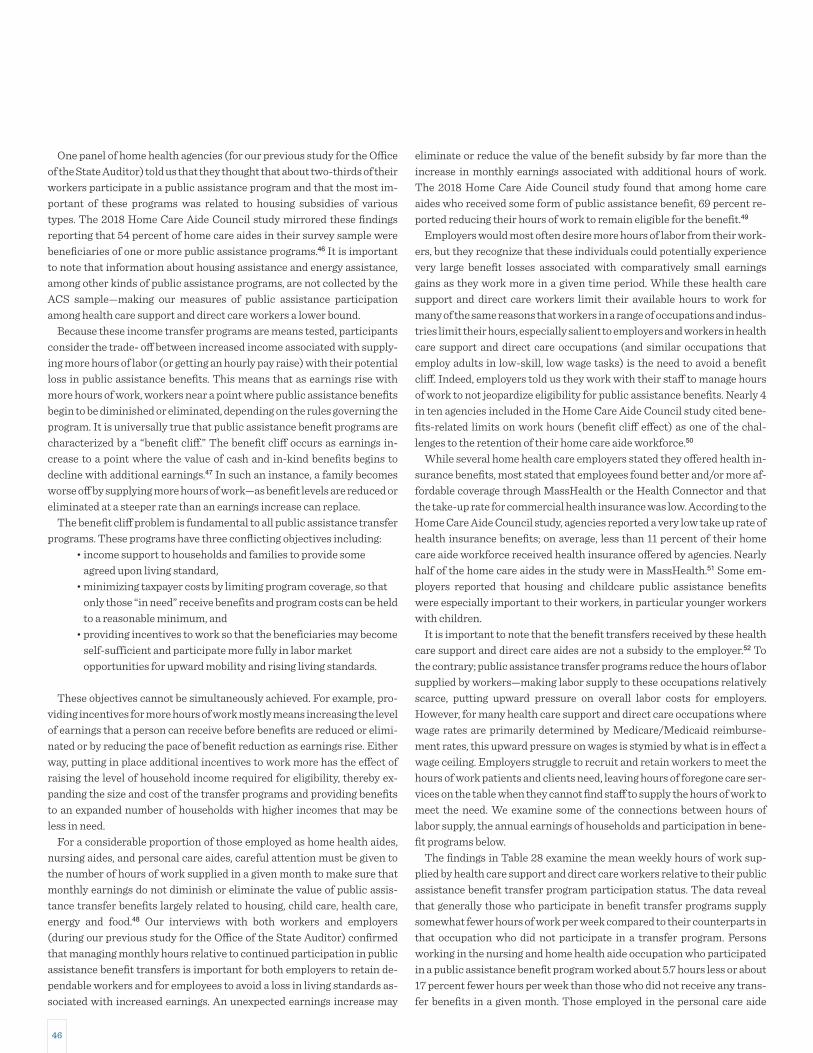
46
eliminate or reduce the value of the benefit subsidy by far more than the increase in monthly earnings associated with additional hours of work. The 2018 Home Care Aide Council study found that among home care aides who received some form of public assistance benefit, 69 percent re-ported reducing their hours of work to remain eligible for the benefit.49
Employers would most often desire more hours of labor from their work-ers, but they recognize that these individuals could potentially experience very large benefit losses associated with comparatively small earnings gains as they work more in a given time period. While these health care support and direct care workers limit their available hours to work for many of the same reasons that workers in a range of occupations and indus-tries limit their hours, especially salient to employers and workers in health care support and direct care occupations (and similar occupations that employ adults in low-skill, low wage tasks) is the need to avoid a benefit cliff. Indeed, employers told us they work with their staff to manage hours of work to not jeopardize eligibility for public assistance benefits. Nearly 4 in ten agencies included in the Home Care Aide Council study cited bene-fits-related limits on work hours (benefit cliff effect) as one of the chal-lenges to the retention of their home care aide workforce.50
While several home health care employers stated they offered health in-surance benefits, most stated that employees found better and/or more af-fordable coverage through MassHealth or the Health Connector and that the take-up rate for commercial health insurance was low. According to the Home Care Aide Council study, agencies reported a very low take up rate of health insurance benefits; on average, less than 11 percent of their home care aide workforce received health insurance offered by agencies. Nearly half of the home care aides in the study were in MassHealth.51 Some em-ployers reported that housing and childcare public assistance benefits were especially important to their workers, in particular younger workers with children.
It is important to note that the benefit transfers received by these health care support and direct care aides are not a subsidy to the employer.52 To the contrary; public assistance transfer programs reduce the hours of labor supplied by workers—making labor supply to these occupations relatively scarce, putting upward pressure on overall labor costs for employers. However, for many health care support and direct care occupations where wage rates are primarily determined by Medicare/Medicaid reimburse-ment rates, this upward pressure on wages is stymied by what is in effect a wage ceiling. Employers struggle to recruit and retain workers to meet the hours of work patients and clients need, leaving hours of foregone care ser-vices on the table when they cannot find staff to supply the hours of work to meet the need. We examine some of the connections between hours of labor supply, the annual earnings of households and participation in bene-fit programs below.
The findings in Table 28 examine the mean weekly hours of work sup-plied by health care support and direct care workers relative to their public assistance benefit transfer program participation status. The data reveal that generally those who participate in benefit transfer programs supply somewhat fewer hours of work per week compared to their counterparts in that occupation who did not participate in a transfer program. Persons working in the nursing and home health aide occupation who participated in a public assistance benefit program worked about 5.7 hours less or about 17 percent fewer hours per week than those who did not receive any trans-fer benefits in a given month. Those employed in the personal care aide
One panel of home health agencies (for our previous study for the Office of the State Auditor) told us that they thought that about two-thirds of their workers participate in a public assistance program and that the most im-portant of these programs was related to housing subsidies of various types. The 2018 Home Care Aide Council study mirrored these findings reporting that 54 percent of home care aides in their survey sample were beneficiaries of one or more public assistance programs.46 It is important to note that information about housing assistance and energy assistance, among other kinds of public assistance programs, are not collected by the ACS sample—making our measures of public assistance participation among health care support and direct care workers a lower bound.
Because these income transfer programs are means tested, participants consider the trade- off between increased income associated with supply-ing more hours of labor (or getting an hourly pay raise) with their potential loss in public assistance benefits. This means that as earnings rise with more hours of work, workers near a point where public assistance benefits begin to be diminished or eliminated, depending on the rules governing the program. It is universally true that public assistance benefit programs are characterized by a “benefit cliff.” The benefit cliff occurs as earnings in-crease to a point where the value of cash and in-kind benefits begins to decline with additional earnings.47 In such an instance, a family becomes worse off by supplying more hours of work—as benefit levels are reduced or eliminated at a steeper rate than an earnings increase can replace.
The benefit cliff problem is fundamental to all public assistance transfer programs. These programs have three conflicting objectives including:
• income support to households and families to provide some agreed upon living standard,• minimizing taxpayer costs by limiting program coverage, so that
only those “in need” receive benefits and program costs can be held to a reasonable minimum, and• providing incentives to work so that the beneficiaries may become
self-sufficient and participate more fully in labor market opportunities for upward mobility and rising living standards.
These objectives cannot be simultaneously achieved. For example, pro-viding incentives for more hours of work mostly means increasing the level of earnings that a person can receive before benefits are reduced or elimi-nated or by reducing the pace of benefit reduction as earnings rise. Either way, putting in place additional incentives to work more has the effect of raising the level of household income required for eligibility, thereby ex-panding the size and cost of the transfer programs and providing benefits to an expanded number of households with higher incomes that may be less in need.
For a considerable proportion of those employed as home health aides, nursing aides, and personal care aides, careful attention must be given to the number of hours of work supplied in a given month to make sure that monthly earnings do not diminish or eliminate the value of public assis-tance transfer benefits largely related to housing, child care, health care, energy and food.48 Our interviews with both workers and employers (during our previous study for the Office of the State Auditor) confirmed that managing monthly hours relative to continued participation in public assistance benefit transfers is important for both employers to retain de-pendable workers and for employees to avoid a loss in living standards as-sociated with increased earnings. An unexpected earnings increase may

47
participated in a public assistance program. The data reveal that nursing and home health aides who receive benefits worked about one-fourth fewer hours over the course of the year compared to their counterparts who did not participate in public assistance programs (1,200 versus 1,600). Personal care aides who received benefits worked an average of 1,013 hours per year, 28 percent fewer annual hours than the 1,413 hours supplied by their coun-terparts who did not receive benefits.
The reduction in the level of supply that appears to be associated with participation in public assistance programs seems to be considerable. Our analysis suggests that about 44 percent of nursing and home health aide workers participate in public assistance benefit programs and that these individuals work about 25 percent fewer hours over the course of a year due to both lower weekly hours of work and fewer weeks of work compared to their counterparts who do not participate in public assistance programs.
One result of these reduced hours of work is a large annual earnings dif-ference between the two groups. Nursing and home health aides who par-ticipated in public assistance income programs had mean annual earnings that were nearly one-third lower than those who did not receive public as-sistance. This very large earnings gap is likely the product of not only fewer hours of work, but also lower hourly pay for those who supply fewer hours. Personal care aides who received transfer benefits had annual earnings that were 44.6 percent below their counterparts who did not receive such benefits. Among all workers in the state, those receiving public assistance benefits earned 58.4 percent less than workers not receiving public assistance.
occupation who received a transfer benefit worked an average of 25.5 hours per week during 2015-2016, about 19 percent fewer hours per week than those who did not participate in a transfer benefit program. Even larger reductions in weekly hours of work were found among those employed in the social and human service assistant occupation in the state. Staff in these occupations who participated in public assistance programs worked 7.9 fewer hours or about 24.5 percent less than their counterparts who did not receive any public assistance in a month.
We also produced a set of measures that examines the number of weeks of employment that are supplied by workers in the health care support and direct care occupations by their public assistance participation status in Massachusetts during the 2015-2016 period. We found that those em-ployed in health care support and direct care occupations who participated in a public assistance program in a given month worked, on average, fewer weeks over the course of the year than their counterparts who did not par-ticipate in these benefit programs.
Nursing and home health aide workers were employed 41.3 weeks per year compared to their counterparts who did not receive any benefits, about 10 percent less. Personal care aides who participated in public assis-tance programs worked about 2.7 fewer weeks per year than their counter-parts who did not receive these benefits. Social and human service assis-tants who participated in public assistance benefit transfer programs worked three fewer weeks over the course of a year (Table 29).
The findings provided in Table 30 examine the combined effect on deci-sions about weekly hours of work and weeks of work over the course of the year on the annual number of hours of employment supplied by a worker. Our analysis of the data found large differences in the annual number of hours of work supplied by health care support and direct care workers who
Table 28. Mean Weekly Hours of Work among Employed Health Care Support and Direct Care Workers inMassachusetts, by Public Assistance Participation, 2015-2016
Source: U.S. Bureau of the Census, American Community Survey, Public Use Microdata Sample Files, 2015-2016, tabulations by authors.
Nursing, Psychiatric & Home Health Aides
Personal Care Aides
Social & Human Service Assistants
All Workers
33.9
31.5
32.3
37.3
Without Any PublicAssistance
28.2
25.5
24.4
32.2
With Any PublicAssistance
-5.7
-6.0
-7.9
-5.1
Difference
-16.8%
-19.0%
-24.5%
-13.7%
PercentDifference
Table 29. Mean Annual Weeks of Work among Employed Health Care Support and Direct Care Workers inMassachusetts, by Public Assistance Participation Status, 2015-2016
Source: U.S. Bureau of the Census, American Community Survey, Public Use Microdata Sample Files, 2015-2016, tabulations by authors.
Nursing, Psychiatric & Home Health Aides
Personal Care Aides
Social & Human Service Assistants
All Workers
46.1
42.4
42.7
44.8
Without Any PublicAssistance
41.3
39.7
39.7
35.3
With Any PublicAssistance
-4.8
-2.7
-3.0
-9.5
Difference
-10.4%
-6.3%
-6.9%
-21.2%
PercentDifference

48
disabilities. The incidence rose to nearly 18 percent among 75- to 79-year olds, 29 percent among 80- to 84-year olds, 45 percent among 85- to 90-year olds, and two-thirds among those who were 90 years or older. One fifth of the state’s residents aged 65 and older and 42 percent of 80-plus year-old residents of the state reported two or more disabilities in 2015-2016.
The incidence of three or more disabilities also rose sharply with age, rising from 11 percent among 75- to 79-year-olds to nearly one-fifth among 80- to 85-year-olds, one-third among 85- to 90-year-olds, and one-half among 90-plus year-old residents of the state.
Most recent available population projections for the Commonwealth produced by the University of Massachusetts reveal a slow growing popu-lation in the future, but sharp differences in the pace of growth across age groups. The population projections use the 2010 decennial Census as the base year upon which projections of population change are developed and present a variety of demographic population projections for five-year inter-vals through 2035.54 We rely on statewide population projections, by age, for the 15-year period between 2015 and 2030.
The total resident population of Massachusetts is projected to rise by about 438,000 persons between 2015 and 2030, a modest increase of 6.5 percent over the 15-year period implying a mean annual population growth rate of about 0.4 percent per year. However, the distribution of this popula-tion varies enormously across age groups. The number of persons under the age of 35 in Massachusetts is projected to decline considerably between 2015 and 2030. The number of school-aged persons under the age of 20 is expected to fall by about 13,000 while the 20 to 34-year old population is forecast to decline by a little over 74,000 persons over the 15-year period. The state’s population of persons aged 35 to 44 is projected to increase by
INCIDENCE OF DISABILITY BY AGE AND PROJECTIONS OF POPULATION CHANGE IN MASSACHUSETTSA variety of financial, demographic and technological factors will influ-ence the demand of health care support and direct care occupations in Massachusetts. Chief among these are two inter-related developments: a strong positive relationship between the incidence of disability and age, and a sharp increase in the number of persons over the age of 65. The like-lihood that a resident of the Commonwealth will have a limitation in one or more activities of daily living rises sharply by the age of that individual. Persons under the age of 35 in the state are not very likely to have disabili-ties, with only about 5 to 6 percent of that population reporting a limitation in activities of daily living that is the result of a physical, mental or emo-tional condition.53 However after the age of 35, likelihood that an individual in Massachusetts will have disabilities begins to rise and the pace of that increase accelerates with age. At ages 60 to 64, the share of residents in the state with a limiting condition rises to 17.4 percent. This proportion dou-bles at ages 75 to 79, to 35 percent, and increases sharply again with 48 percent of persons aged 80 to 84 reporting a physical, mental or emotional limitation. Among those between the ages of 85 and 89 64 percent had one or more disabilities.
The numbers of disabilities increase with age as well. Similar to the inci-dence of disability, the share of Massachusetts residents with two or more disabilities rose sharply with age, particularly after age 70. The incidence of 2 or more disabilities was 5 percent or less among those under age 55 and between 7.6 and 8.6 among residents between the ages of 55 and 69. Over 11 percent of the elderly between the ages of 70 and 74 had two or more
Table 30. Mean Annual Hours of Work among Employed Health Care Support and Direct Care Workers inMassachusetts, by Public Assistance Participation Status, 2015-2016
Source: U.S. Bureau of the Census, American Community Survey, Public Use Microdata Sample Files, 2015-2016, tabulations by authors.
Nursing, Psychiatric & Home Health Aides
Personal Care Aides
Social & Human Service Assistants
All Workers
1,601
1,413
1,478
1,743
Without Any PublicAssistance
1,216
1,013
1,115
1,208
With Any PublicAssistance
-385.6
-400.0
-363.1
-535.0
Difference
-24.1%
-28.3%
-24.6%
-30.7%
PercentDifference
Table 31. Mean Annual Earnings of Employed Health Care Support and Direct Care Workers in Massachusetts, byPublic Assistance Participation Status, 2015-2016
Source: U.S. Bureau of the Census, American Community Survey, Public Use Microdata Sample Files, 2015-2016, tabulations by authors.
Nursing, Psychiatric & Home Health Aides
Personal Care Aides
Social & Human Service Assistants
All Workers
$25,887
$21,233
$30,146
$56,085
Without Any PublicAssistance
$17,784
$11,761
$17,291
$23,358
With Any PublicAssistance
-$8,102
-$9,472
-$12,855
-$32,727
Difference
-31.3%
-44.6%
-42.6%
-58.4%
PercentDifference

49
by more than 156,000 or 64 percent over the 15-year period. The incidence of disabilities was about one-quarter among the state’s residents in this age group. Persons aging into this group are entering the frail elderly age range (those aged 70+), a threshold that is meant to identify persons at height-ened risk of general debility and cognitive impairment.55 The number of frail elderly (age 70 and over) in the state is expected to rise by nearly 425,000 or nearly 60 percent representing an annual rate of increase of nearly 4 percent over the forecast period.
The group of 75- to 79-year old residents is projected to increase by 141,000 between 2015 and 2030, representing an 82 percent increase. The
102,000 while the older group of 45- to 54-year-olds and 55- to 59-year-olds will decline by over 75,000 and 57,000, respectively, and the number of state residents in the 60- to 64-year old age group will see a small increase of 29,000 or 6 percent. Overall, the population of Massachusetts residents under the age of 65 is expected to experience a net decline of 88,000 over the 15-year population projection period.
The population aged 65 and over is forecast to increase by about 527,000 persons from 1.07 million in 2015 to nearly 1.6 million in 2030, representing an increase of 49 percent. The largest increase in the size of this population is projected to be among persons aged 70 to 74. This age group will increase
0%
70%
60%
50%
40%
30%
20%
10%
90%
80%
<16 16-34 35-44 45-54 55-59 60-64 65-69 70-74 75-79 80-84 85-89 90+
5.7% 6.2%
81.1%
63.7%
48.4%
35.2%
24.9%20.3%
17.4%14.5%
10.5%7.2%
Source: U.S. Bureau of the Census, American Community Survey, Public Use Microdata Sample Files, 2015-2016, tabulations by authors.
Chart 26. The Incidence of Disability by Age Group in Massachusetts, 2015-2016 Annual Average
0%
60%
50%
40%
30%
20%
10%
70%
<16 16-34 35-44 45-54 55-59 60-64 65-69 70-74 75-79 80-84 85-89 90+
1.3% 2.5%
65.9%
44.7%
29.1%
17.6%
11.4%8.6%8.4%7.6%
5.2%3.6%
Source: U.S. Bureau of the Census, American Community Survey, Public Use Microdata Sample Files, 2015-2016, tabulations by authors.
Chart 27. Percent of Massachusetts Residents with Two or More Disabilities by Age, 2015-2016 Annual Average
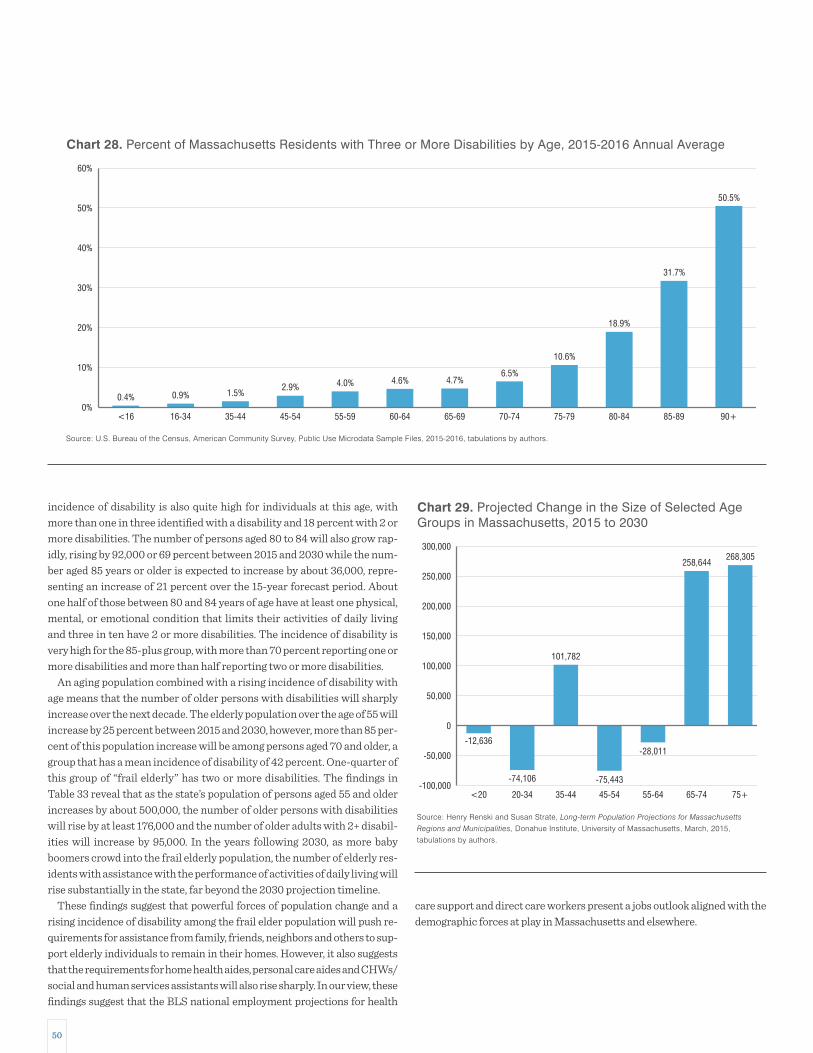
50
care support and direct care workers present a jobs outlook aligned with the demographic forces at play in Massachusetts and elsewhere.
incidence of disability is also quite high for individuals at this age, with more than one in three identified with a disability and 18 percent with 2 or more disabilities. The number of persons aged 80 to 84 will also grow rap-idly, rising by 92,000 or 69 percent between 2015 and 2030 while the num-ber aged 85 years or older is expected to increase by about 36,000, repre-senting an increase of 21 percent over the 15-year forecast period. About one half of those between 80 and 84 years of age have at least one physical, mental, or emotional condition that limits their activities of daily living and three in ten have 2 or more disabilities. The incidence of disability is very high for the 85-plus group, with more than 70 percent reporting one or more disabilities and more than half reporting two or more disabilities.
An aging population combined with a rising incidence of disability with age means that the number of older persons with disabilities will sharply increase over the next decade. The elderly population over the age of 55 will increase by 25 percent between 2015 and 2030, however, more than 85 per-cent of this population increase will be among persons aged 70 and older, a group that has a mean incidence of disability of 42 percent. One-quarter of this group of “frail elderly” has two or more disabilities. The findings in Table 33 reveal that as the state’s population of persons aged 55 and older increases by about 500,000, the number of older persons with disabilities will rise by at least 176,000 and the number of older adults with 2+ disabil-ities will increase by 95,000. In the years following 2030, as more baby boomers crowd into the frail elderly population, the number of elderly res-idents with assistance with the performance of activities of daily living will rise substantially in the state, far beyond the 2030 projection timeline.
These findings suggest that powerful forces of population change and a rising incidence of disability among the frail elder population will push re-quirements for assistance from family, friends, neighbors and others to sup-port elderly individuals to remain in their homes. However, it also suggests that the requirements for home health aides, personal care aides and CHWs/social and human services assistants will also rise sharply. In our view, these findings suggest that the BLS national employment projections for health
0%
50%
40%
30%
20%
10%
60%
<16 16-34 35-44 45-54 55-59 60-64 65-69 70-74 75-79 80-84 85-89 90+
0.4% 0.9%
50.5%
31.7%
18.9%
10.6%
6.5%4.7%4.6%4.0%2.9%
1.5%
Source: U.S. Bureau of the Census, American Community Survey, Public Use Microdata Sample Files, 2015-2016, tabulations by authors.
Chart 28. Percent of Massachusetts Residents with Three or More Disabilities by Age, 2015-2016 Annual Average
-100,000
250,000
200,000
150,000
100,000
50,000
0
-50,000
300,000
<20 20-34 35-44 45-54 55-64 65-74 75+
-12,636
-74,106
268,305258,644
-28,011
-75,443
101,782
Source: Henry Renski and Susan Strate, Long-term Population Projections for Massachusetts
Regions and Municipalities, Donahue Institute, University of Massachusetts, March, 2015, tabulations by authors.
Chart 29. Projected Change in the Size of Selected AgeGroups in Massachusetts, 2015 to 2030

51
Desire to Remain in Current ResidenceThe overwhelming majority, more than 90 percent, of persons aged 65 and older want to live in their current residence “as long as possible.”56 Part of the motivation behind the desire to remain at home is related to attach-ments among networks of family, friends and neighbors.
These networks provide assistance with some activities that help indi-viduals stay at home longer. Engagement with the broader community is thought to improve the quality of life for older persons and assist them in their ability to remain independent for a longer period. It is a relatively safe bet to say that the desire for older persons to age in place will positively influence the demand for health care support and direct care support work-ers in the future.
Role of Family CaregiversFamily caregiving may be the single most important source of home health care for the elderly in the nation. In Massachusetts, an estimated 884,000 persons, about 12 percent of the state’s total population are engaged in un-compensated caregiving activities that support activities of daily living.57 In the future the need for support services provided by uncompensated
OTHER FACTORS THAT DETERMINE THE GROWTH IN DEMAND FOR HEALTH CARE SUPPORT AND DIRECT CARE WORKERSDemographic forces alone will not determine the nature of demand growth in the delivery of care to seniors in the community by compensated non-medical professionals. Some other factors likely to influence demand for health care support and direct care workers might include:
• The extent to which older persons wish to remain in their current residence.
• Changes in the ability of family, friends and neighbors in providing support services to the elderly that can substitute for
employed health care support and direct care workers.• Technological developments that provide aid to the aging population to remain at home.• Impact of federal and state public sector resource allocation decisions including cost containment efforts.• Changes in household and family incomes.• Wealth and long-term care finance.• Long-term care insurance.
Table 32. Projections of the Size of the 55+ Population of Massachusetts, by Age Group, 2015 to 2030
Source: Henry Renski and Susan Strate, Long-term Population Projections for Massachusetts Regions and Municipalities, Donahue Institute, University of Massachusetts, March, 2015, tabulations by authors.
55–59
60–64
65–69
70–74
75–79
80–84
85+
55-Plus
65-Plus
70-Plus
495,496
421,185
351,198
245,527
173,201
133,240
168,805
1,988,652
1,071,971
720,773
Projected2015Age
438,243
450,427
453,589
401,780
314,302
224,909
204,340
2,487,590
1,598,920
1,145,331
Projected2030
-57,253
29,242
102,391
156,253
141,101
91,669
35,535
498,938
526,949
424,558
Change
-11.6%
6.9%
29.2%
63.6%
81.5%
68.8%
21.1%
25.1%
49.2%
58.9%
-0.8%
0.5%
1.9%
4.2%
5.4%
4.6%
1.4%
1.7%
3.3%
3.9%
PercentChange
Annual Rateof Change
Table 33. Projected Change in the Size of the Massachusetts Total Population and Population with a Disability,by Age Group, 2015 (Projected) to 2030 (Projected)
Sources: Henry Renski and Susan Strate, Long-term Population Projections for Massachusetts Regions and Municipalities, Donahue Institute, University of Massachusetts, March, 2015, and U.S. Bureau of the Census, American Community Survey, Public Use Microdata Sample Files, 2015-2016, tabulations by authors.
55–59
60–64
65–69
70–74
75–79
80–84
85+
Total
-57,253
29,242
102,391
156,253
141,101
91,669
35,535
498,938
Projected Changein PopulationAge Group
0.145
0.174
0.203
0.249
0.352
0.484
0.703
0.259
Percent of Populationwith Disabilities
-8,278
5,079
20,833
38,874
49,695
44,376
24,973
175,552
Projected Change inthe Number of
Persons with Disabilities
0.076
0.084
0.086
0.114
0.176
0.291
0.527
0.143
-4,337
2,453
8,835
17,815
24,771
26,639
18,736
94,912
Percent with 2+Activities of Daily Living
Limitations
Projected Change in the Numberof Persons 2+ Activities of Daily
Living Limitations
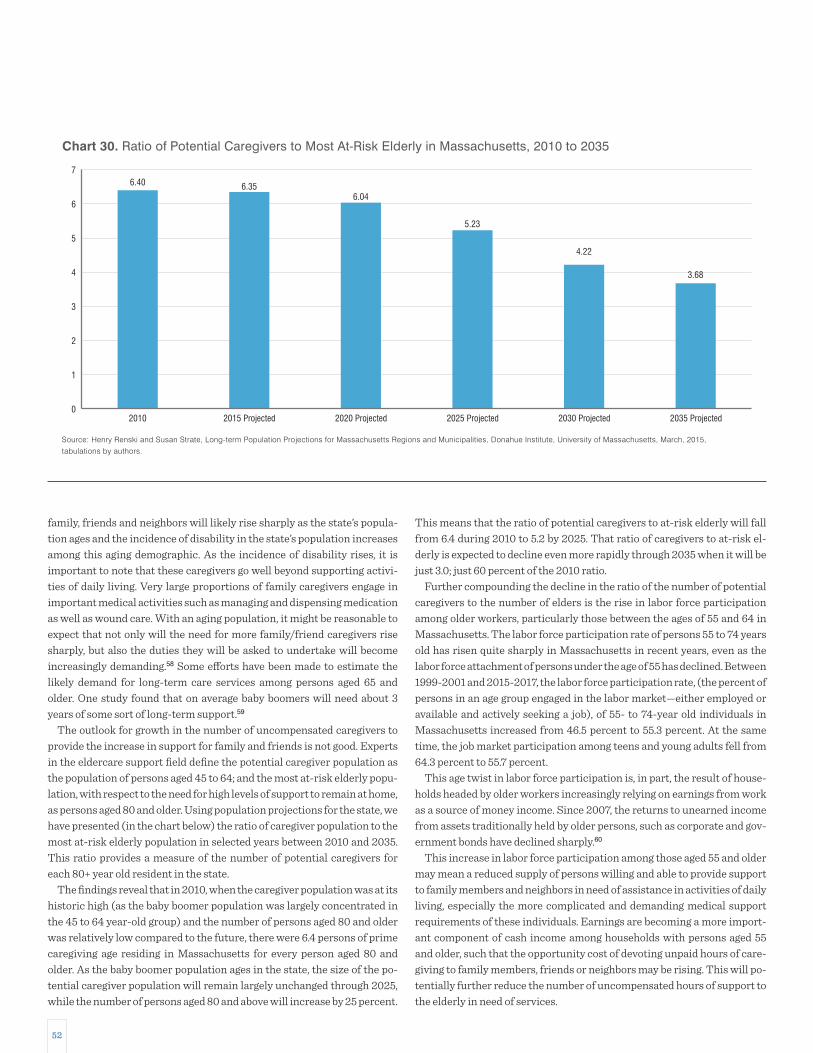
52
This means that the ratio of potential caregivers to at-risk elderly will fall from 6.4 during 2010 to 5.2 by 2025. That ratio of caregivers to at-risk el-derly is expected to decline even more rapidly through 2035 when it will be just 3.0; just 60 percent of the 2010 ratio.
Further compounding the decline in the ratio of the number of potential caregivers to the number of elders is the rise in labor force participation among older workers, particularly those between the ages of 55 and 64 in Massachusetts. The labor force participation rate of persons 55 to 74 years old has risen quite sharply in Massachusetts in recent years, even as the labor force attachment of persons under the age of 55 has declined. Between 1999-2001 and 2015-2017, the labor force participation rate, (the percent of persons in an age group engaged in the labor market—either employed or available and actively seeking a job), of 55- to 74-year old individuals in Massachusetts increased from 46.5 percent to 55.3 percent. At the same time, the job market participation among teens and young adults fell from 64.3 percent to 55.7 percent.
This age twist in labor force participation is, in part, the result of house-holds headed by older workers increasingly relying on earnings from work as a source of money income. Since 2007, the returns to unearned income from assets traditionally held by older persons, such as corporate and gov-ernment bonds have declined sharply.60
This increase in labor force participation among those aged 55 and older may mean a reduced supply of persons willing and able to provide support to family members and neighbors in need of assistance in activities of daily living, especially the more complicated and demanding medical support requirements of these individuals. Earnings are becoming a more import-ant component of cash income among households with persons aged 55 and older, such that the opportunity cost of devoting unpaid hours of care-giving to family members, friends or neighbors may be rising. This will po-tentially further reduce the number of uncompensated hours of support to the elderly in need of services.
family, friends and neighbors will likely rise sharply as the state’s popula-tion ages and the incidence of disability in the state’s population increases among this aging demographic. As the incidence of disability rises, it is important to note that these caregivers go well beyond supporting activi-ties of daily living. Very large proportions of family caregivers engage in important medical activities such as managing and dispensing medication as well as wound care. With an aging population, it might be reasonable to expect that not only will the need for more family/friend caregivers rise sharply, but also the duties they will be asked to undertake will become increasingly demanding.58 Some efforts have been made to estimate the likely demand for long-term care services among persons aged 65 and older. One study found that on average baby boomers will need about 3 years of some sort of long-term support.59
The outlook for growth in the number of uncompensated caregivers to provide the increase in support for family and friends is not good. Experts in the eldercare support field define the potential caregiver population as the population of persons aged 45 to 64; and the most at-risk elderly popu-lation, with respect to the need for high levels of support to remain at home, as persons aged 80 and older. Using population projections for the state, we have presented (in the chart below) the ratio of caregiver population to the most at-risk elderly population in selected years between 2010 and 2035. This ratio provides a measure of the number of potential caregivers for each 80+ year old resident in the state.
The findings reveal that in 2010, when the caregiver population was at its historic high (as the baby boomer population was largely concentrated in the 45 to 64 year-old group) and the number of persons aged 80 and older was relatively low compared to the future, there were 6.4 persons of prime caregiving age residing in Massachusetts for every person aged 80 and older. As the baby boomer population ages in the state, the size of the po-tential caregiver population will remain largely unchanged through 2025, while the number of persons aged 80 and above will increase by 25 percent.
0
1
2
3
5
4
6
7
2010 2015 Projected 2025 Projected 2030 Projected2020 Projected 2035 Projected
6.40 6.356.04
5.23
3.68
4.22
Source: Henry Renski and Susan Strate, Long-term Population Projections for Massachusetts Regions and Municipalities, Donahue Institute, University of Massachusetts, March, 2015, tabulations by authors.
Chart 30. Ratio of Potential Caregivers to Most At-Risk Elderly in Massachusetts, 2010 to 2035

53
A look at the labor force participation rates of 45- to 54-year old (poten-tial caregiver age) Massachusetts residents between 2010 and 2026 pre-sented in the chart below reveal that almost all of the rise in labor force participation is projected to occur among women.61 Between 2010 and 2026, the labor force participation rate of 45- to 54-year old men is pro-jected to remain relatively flat, while the participation rate among their female counterparts, is expected to increase from under 81 percent in 2010 to 82.3 percent in 2026; an increase of 1.5 percentage points in the already high rate of labor force participation among women in this age group. In the pre-retirement age of 55 to 64, the male participation rate is again expected to remain relatively flat at 77 percent while the female rate of labor force participation is projected to increase from under 67 percent in 2010 to 73 percent in 2026.
Not only is the labor force participation rate but when this group of the state’s workers is employed, their mean hours of work reflect a full-time and year-round work schedule. The mean annual hours of employment among workers in this age group was 2,040 hours (2,240 hours among men and 1,830 hours among women) among 45- to 54-year-olds and 1,980 hours among pre-retirement age (55-64) workers (2,120 hours among men and 1,820 hours among women) in Massachusetts.
High rates of engagement in the labor market means that the ratio of po-tential caregivers to the number of most at-risk elderly (80+ years old) in the state’s population (presented above) is likely an overestimate of the number of potential caregivers per most at-risk elderly resident.
Residents between the ages of 45 and 64 who are not engaged in the labor force present a more realistic measure of potential caregivers. The ratio of
0%
20%
10%
50%
40%
30%
60%
70%
80%
90%
100%
16-24
55.7%
64.3%
55-74
55.3%
46.5%
25-54
83.7%85.5%
Source: U.S. Bureau of Labor Statistics, Labor Force Status from the Current Population Survey, various years, tabulations by authors.
Chart 31. Trends in the Labor Force Participation Rate ofthe Civilian Non-Institutional Population in Massachusetts,1999-2001 to 2015-2017 Annual Averages
1999-2001
2015-2017
0.00
1.00
0.20
0.40
0.60
0.80
1.20
1.40
1.60
2015 2020 2025 2030 2035
1.46
1.29
1.06
0.84
0.72
Sources: i) Henry Renski and Susan Strate, Long-term Population Projections for Massachusetts Regions and Municipalities, Donahue Institute, University of Massachusetts, March, 2015; ii) U.S. Bureau of the Census, American Community Survey, Public Use Microdata Sample Files, 2015; iii) U.S. Bureau of Labor Force Statistics, Employment Projections, 2016-2026, tabulations by authors.
Chart 33. Ratio of the Number of Out of Labor ForcePotential Caregivers to the Number of Most At-Risk Elderlyin Massachusetts, 2015 to 2035
50%
60%
70%
80%
90%
100%
55%
65%
75%
85%
95%
2010
66.7%
77.0%
80.9%
88.5%
2026
73.1%
76.9%
82.3%
88.0%
2020
69.7%
76.7%
80.7%
88.7%
2015
67.0%
76.6%
79.5%
86.8%
Sources: i) U.S. Bureau of the Census, American Community Survey, 2010 and 2015; ii) U.S. Bureau of Labor Statistics, Employment Projections, 2016-2026, tabulations by authors.
Chart 32. Labor Force Participation Rates of Men andWomen in Care-Giving Age (45-54 and 55-64),Massachusetts, 2010-2026
Male, 45-54 Female, 45-54
Male, 55-64 Female, 55-64

54
replaced it entirely. Chain restaurants now often have tabletop devices for ordering or to ring the wait staff, grocery stores have self- checkout lanes, and deposits can be made from smartphones to name a few examples. Self- driving vehicles and humanoid robots may seem like the makings of a fu-turistic movie, but significant advances are being made in both technolo-gies to make them safe and efficient which will soon bring these machines to the home.69 Bloomberg reported in April 2018 that Amazon has plans to build a domestic robot which would be tested in employees’ homes by the end of 2018 and could be in the homes of consumers as early as 2019.70 Though the exact tasks to be performed by the robot are not yet clear, this type of progress is promising.
Many of those baby boomers choosing to age in place will eventually need assistance with the activities of daily living. Robots like Amazon’s expected release might be able to help with these activities. There are already exper-imental robots to lift people into bed, help them stand up, fold laundry, cook, and manage medications.71 A major draw to machines like this, as pointed out by current literature, is that robots can work 24 hours per day unlike human employees who work in the home. Replacing human staff with ro-bots may be in the future but there may be some benefits such as the ability of a robot to work 24 hours per day. Some other issues that could be ad-dressed with robots could be personality conflicts between clients and caregivers and perhaps an elimination of caregiver turn over – those aging in place will not have to adjust to any changes in staff aside from, possibly, upgrades in technology.
For now, the work of direct care workers has begun to be complimented by devices such as bracelet, watch, and necklace-style wearable alert sys-tems that monitor falls, alert the consumer to take medication or eat, and monitor physiological data such as heart rate. There are also devices that will turn off a stove that has been left on longer than a set period of time as well as automatic pill dispensers that sell for under $300 on Amazon to help with medication adherence.
However, in some cases, home health care can be entirely replaced by artificial intelligence. Companies such as Electronic Caregiver and Alarm.com offer subscription services for as low as $45 per month where motion sensors are installed throughout the home that monitor how the person goes about a typical day and reports to say, the consumer’s son, if there are any changes in activity. The Electronic Caregiver also monitors if a person is taking their prescription on time and the Alarm.com Wellness system can go as far as to alert to changes in eating habits. These technologies can cost as little as $540 per year compared to upwards of $45,000 per year for an aide in the home.
In addition to in home services, ridesharing companies have been explor-ing ways in which to keep the elderly mobile. Well-known businesses such as Uber and Lyft are constantly trying to find a better way to make their services more accessible to the elderly. Rides can now be booked through Uber for someone other than the app user, meaning rides can be scheduled for seniors even if their caregiver is not with them.72 Carnegie Mellon University’s Robotics Institute is working to develop a robot that would make public transportation easier to navigate for people with disabilities.73 They say they would not like to replace human employees, but rather have robots provide additional assistance. In their example their robot working in a train station would greet the disabled (or perhaps elderly) and guide the rider to the appropriate platform. The Robotics Institute team is also work-ing on issues related to autonomous vehicles.
this (more realistic) measure of potential caregivers to 80+ years old se-niors reveals that for every 100 elderly residents aged 80 or older in the state, in 2015 there were 146 residents between the ages of 45 and 64 who were not in the labor force (OLF). This ratio is projected to fall to 129 OLF potential caregivers per 100 seniors 80+ year old in 2020 and further down to 106 per 100 seniors in 2025, 84 per 100 seniors in 2030 and only 73 per 100 most at-risk seniors in 2035.
Given this discussion, we think it unlikely that unpaid family members, friends and neighbors will increase their aggregate hours of service to meet the growing need for services to the elderly required to stay at home. Instead, as the ratio of potential caregivers to those in need of care declines and pressures for persons 55 to 74 to remain in the labor force continue, we suspect that this source of uncompensated services will not be able to grow much over the next decade. Thus, we do not expect uncompensated work by family, friends and neighbors to serve as a substitute for growth of em-ployment in home health aide, personal care aide and CHW/social and human service assistant occupations in the foreseeable future.
Technological AlternativesTechnology of various sorts has proven to be a very efficient substitute for labor in the American economy. Cyber-based technologies have been de-veloped that have proven very useful in replacing routine manufacturing jobs with algorithms and hardware to produce output.62 Increasingly these new technologies are being adapted to undertake more complex, non-rou-tine, non-repetitive tasks including driving automobiles, trucks and buses.63 Indeed, a recent study suggests that up to one half of all current employment in the U.S. is in occupations that could utilize various technol-ogies to replace labor inputs to production, including occupations in which tasks are not routine or repetitive.64
The potential market for home health services in the U.S. is substantial (estimated to be
$68 billion in revenue and growing by 9 percent per year), with labor ac-counting for the lion’s share of costs.65 This robust market has caught the attention of technology firms who are working to develop a variety of prod-ucts that can assist elderly individuals to live at home while still getting the kind of monitoring and care they require.
Every day since January 1 2011, ten thousand baby boomers have turned 65-years-old and this trend will continue until 2030.66 According to a re-cent study, only 3.2 percent of the 65 and older U.S. population moved out of their homes between 2015 and 2016 and AARP reports that 90 percent of seniors would like to stay in their homes as they grow older.67, 68 These folks them to do so in a number of ways right now with many more innova-tions on the horizon. As technology advances at rapid speed, it is not un-likely that the elderly will be able to stay in their own homes indefinitely.
To care for those choosing to age in place, direct care workers such as home health aides and personal care attendants have been typically hired to assist these folks within their homes with the activities of daily living. Some of the tasks currently carried out by direct care workers include helping patients move, bathing, maintain records, administer medications and other treatments, cook meals, and provide some companionship. Due to the physicality of some of these tasks, it seems that only a real, live per-son can do that job, but that may not be true for much longer.
In the last year or so, we have seen many instances in the day-to-day in which technology has either supplemented the American workforce or

55
rise in real income among older workers might suggest that the ability of households to privately purchase certain home health care services, in-cluding the services of home health aides, personal care aides and related workers has increased over time. However, even after the 29 percent in-crease, the 2014-16 median money income of elder-headed households ($40,100) was just half of the median income of households headed by someone under the age of 65 ($80,500).
Most financial advisors use the following rule-of-thumb measure for in-come adequacy in retirement: that income in retirement should be at least 70 percent of the level of income in pre- retirement years. Using the median income of households headed by 45- to 64-year old householders to repre-sent pre-retirement income and the median income of elder-headed households as retirement income, Bankrate produced the ratio of retire-ment to pre-retirement incomes for each state in the nation and found only three states in the nation where the retirement to pre-retirement income ratio met the 70 percent threshold for adequate income in retirement.75 Massachusetts was ranked last among all states with the ratio of retire-ment to pre-retirement income of just 49 percent. Of course, many seniors are mobile and choose to relocate in other parts of the country after retire-ment and it is likely a disproportionate share of affluent seniors selected to move out of the Bay State. However, senior households in the state do have considerably lower incomes compared to households headed by house-holders under 65 years old.
We have used 2015-2016 ACS data to compute the ratio of retirement to pre-retirement income for each county in the state (Table 34). The retire-ment to pre-retirement income ratio appears to be much worse in urban-ized areas of the state. Aside from Nantucket County, no county has a me-dian household retirement income levels that meets the 70 percent of pre-retirement income rule of thumb. Cape Cod (Barnstable County) and Martha’s Vineyard (Dukes County) come close with median household
With the number of technological aids being developed at such a high rate and at low costs, the need for a direct care worker may decrease signifi-cantly as baby boomers choose to age in place.
INSURER AND PUBLIC RESOURCE ALLOCATION DECISIONS AND COST CONTAINMENT EFFORTS BY THE FEDERAL AND STATE GOVERNMENTThird-party insurers and federal and state resource allocation and regula-tory decisions will likely have an important impact on the growth in de-mand for home health care. One of the most striking developments in Massachusetts health care labor markets has been the marked decline of employment levels in the nursing home industry. Between 2010 and 2017 payroll employment levels in nursing homes in the state declined by 11 per-cent as employment in the home health care and individual and social ser-vices industry (the industry where most personal care aides and social and human services assistants are employed) increased sharply.
Our discussions with a variety of health care policy makers, analysts, for-profit and not- for-profit executives and managers, as well as leaders of organized labor (for our previous study prepared for the Office of the State Auditor on health care and direct care workforce developments) have led us to conclude that this decline was the result of efforts on the part of insur-ers as well as the legislature to reduce resources devoted to high cost nurs-ing home (and hospital) care and shift more private and public health care resources to the provision of services to patients at home. Even prior to the enactment of both the Affordable Care Act (ACA) at the federal level and Chapter 224 cost containment legislation in Massachusetts, efforts were undertaken by private insurers to reduce health care costs, including re-duced utilization of hospitals and nursing care facilities. Chapter 224 leg-islation for health care cost containment enacted in Massachusetts and the enactment of the ACA has added further impetus to shifting more re-sources toward the provision of a variety of services designed to help el-derly and disabled persons to remain at home.
We think it likely that as more cost containment provisions of the ACA are implemented over the next few years, that federal and state policy is likely to continue to support aging in place efforts as part of a broader man-aged care system. CMS recently announced the addition of non-skilled home care services as a supplemental benefit for Medicare Advantage plans in 2019.74 We suspect that public social and health care spending at the federal and state level will strongly support expansion of lower cost aging in place efforts including the increased utilization of health care sup-port and direct care workers in the future. Home health care is likely to play a central role in cost mitigating efforts to restrain the growth in aggregate health care spending in the nation and in the Commonwealth.
CHANGES IN HOUSEHOLD AND FAMILY INCOMESAn important influence on demand for home health care services will of course be related to developments in money income among older house-holds. Money income for households headed by persons under the age of 65 as well as those headed by householders aged 65 and over has increased in inflation adjusted terms between 1998-00 and 2014-16. The median household income increased by 29 percent (inflation-adjusted) for el-der-headed households compared to an increase of 9 percent in the median income of households where the householder was under the age of 65. This
$0
$10,000
$20,000
$30,000
$40,000
$50,000
$60,000
$70,000
$80,000
$90,000
Under 65 Years Old
$80,553
$73,841
65 Years and Over
$40,063
$31,079
Source: U.S. Bureau of Labor Statistics, Current Population Survey, various years, tabulations by authors.
Chart 34. Trends in Real Median Household Income Levelsin Massachusetts, by Age of Householder, 1998-2000and 2014-2016 Annual Averages (constant 2016 dollars)
1998-2000
2014-2016

56
future income requirements and thus are not engaging in savings programs that defer current consumption with the expectation that a store of wealth may be created to help finance consumption during retirement.
Efforts to estimate the chances of continued increases in real incomes among households headed by older persons in the future are speculative. Modeling efforts using panel income measures to predict future change in the median incomes of retirees suggest declining real incomes at least for the median retirees in the nation.76 Indeed there appears to be little consen-sus about the likely future growth path of incomes among experts in these areas. Some observers see very rapid growth in the number of persons who are financially unprepared for retirement as growing shares of retirees rely only on Social Security, old age and retirement benefits.77 However, other observers argue that the income measures commonly used in these studies do not properly account for some very important sources of income, partic-ularly withdrawals from defined contribution assets and therefore these “retirement crisis” studies underestimate income levels and growth in money income among retired persons.78
The Kaiser Family Foundation recently released a study of the income and assets of Medicare beneficiaries.79 The study found that in 2016, the median per capita income80 of Medicare beneficiaries was $26,200, the bottom quarter of Medicare beneficiaries had incomes below $15,250; and only 1 percent had incomes above $183,000. The study found median savings81 of $74,500 among Medicare beneficiaries, the lowest quarter of Medicare beneficiaries had savings below $14,450 (this includes 8 per-cent with zero savings), 5 percent had savings above $1.4 million, and the top 1 percent of the beneficiaries had savings above $4.0 million. In 2016, one quarter of Medicare beneficiaries had no home equity and the me-dian per capita home equity of Medicare beneficiaries was just $71,000. Similar to income and savings, there was a substantial concentration of home equity among a few beneficiaries; 5 percent of beneficiaries had home equity in excess of $466,000 and 1 percent had home equity above $873,000 (Table 36).
These findings from the Kaiser study reveal that most Medicare benefi-ciaries have very modest means and only a small share has high levels of incomes, savings and equity in their homes.82 A comparison of the income and assets of Medicare beneficiaries between 2010 and 2016 (presented in this study) found a modest growth with most of the growth concentrated among those with high incomes and assets. The study also presented pro-jections of income and asset levels to 2035 that indicate a continuation of the trend that they estimated over the 2010 to 2016 period; that is, a modest growth with most of the increase in income and assets to be realized among the most affluent Medicare beneficiaries. The study provides important insights on the modest levels and modest projected growth of income and assets of most retirees that will greatly limit their ability to pay for health care costs.
Given the slow growth in output and income in the American economy combined with a dramatic slowdown in productivity growth, incomes may not rise very rapidly among retirees in the coming years as projected by the Kaiser study. If this is the case, then slow or no income growth will, all else equal, tend to reduce the increase in private demand for various home health services.
retirement income equal to 62 and 60 percent of pre- retirement median income levels, respectively. Similarly, western Massachusetts also had above average ratios of retirement to pre-retirement income compared to the statewide average.
Berkshire, Franklin, Hampshire and Hampden counties all had retire-ment to pre-retirement income ratios above the state average. However, Greater Boston, Worcester and the South Coast region all had ratios well below the state average.
Retirement income from company-sponsored pension plans can often be an important source of income for individuals aged 65 and older. However, for many private sector workers in Massachusetts, employ-er-based pension plans that include a wide range of defined contribution plans and in fewer instances defined benefit plans are unavailable. In Massachusetts, fewer than half (43 percent) of adult workers aged 25 to 64 are employed by a firm that offers a retirement program of some type. However, the take-up rate among employees in these retirement programs is much lower, averaging about 30 percent, thus just one in three employed residents aged 25 to 64 participate in the plan offered by their employer. The Commonwealth ranks just 39th out of 50 states in the share of private sector workers employed by a firm that makes a retirement program avail-able to them. Similarly, the state ranks 40th among all states in the share of employed adults who actually participate in a pension plan.
While these findings, by themselves do not suggest that Massachusetts residents are ill- prepared for adequate retirement income, it is of some concern that in a high wage-high income state like Massachusetts, the shares of employers that offer retirement/pension plans and the share of employed workers that participate in an employer retirement/pension program are below average. Indeed, these findings may be indicative that a considerable share of residents in the state are not sufficiently focused on
Table 34. Median Household Income, by Age ofHouseholder and County, 2015-16
Source: U.S. Bureau of the Census, American Community Survey, 2015-2016, American FactFinder, tabulations by authors.
Nantucket
Berkshire
Barnstable
Dukes
Franklin
Hampshire
Hampden
Plymouth
Essex
Middlesex
Norfolk
Bristol
Worcester
Suffolk
$101,026
61,945
78,038
81,077
65,802
80,307
66,211
94,507
88,554
106,526
108,401
75,083
82,996
63,159
Median Income ofHouseholds headedby 45-64 Year Olds
$77,632
39,974
48,645
48,646
39,215
44,333
33,801
46,479
42,396
49,766
49,792
34,151
37,702
27,881
Median Income ofHouseholds headedby 65+Year Olds
77%
65%
62%
60%
60%
55%
51%
49%
48%
47%
46%
45%
45%
44%
Ratio of MedianHousehold Income
65+/45-64County
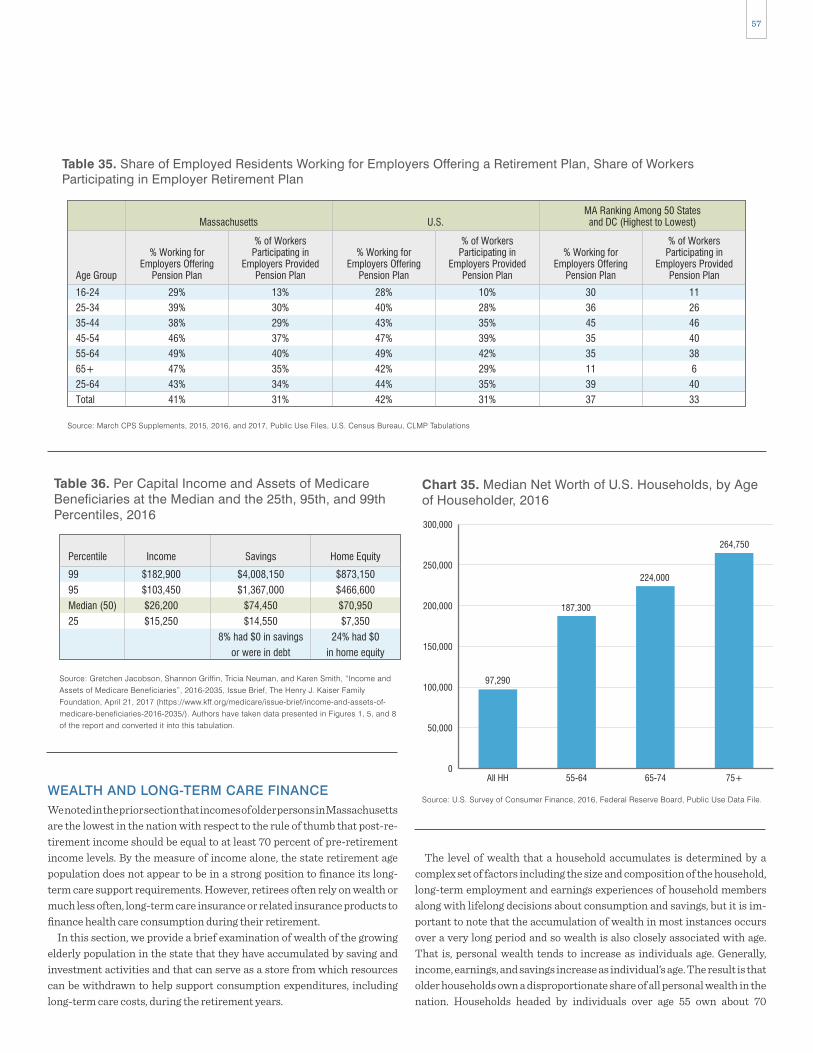
57
The level of wealth that a household accumulates is determined by a complex set of factors including the size and composition of the household, long-term employment and earnings experiences of household members along with lifelong decisions about consumption and savings, but it is im-portant to note that the accumulation of wealth in most instances occurs over a very long period and so wealth is also closely associated with age. That is, personal wealth tends to increase as individuals age. Generally, income, earnings, and savings increase as individual’s age. The result is that older households own a disproportionate share of all personal wealth in the nation. Households headed by individuals over age 55 own about 70
WEALTH AND LONG-TERM CARE FINANCEWe noted in the prior section that incomes of older persons in Massachusetts are the lowest in the nation with respect to the rule of thumb that post-re-tirement income should be equal to at least 70 percent of pre-retirement income levels. By the measure of income alone, the state retirement age population does not appear to be in a strong position to finance its long-term care support requirements. However, retirees often rely on wealth or much less often, long-term care insurance or related insurance products to finance health care consumption during their retirement.
In this section, we provide a brief examination of wealth of the growing elderly population in the state that they have accumulated by saving and investment activities and that can serve as a store from which resources can be withdrawn to help support consumption expenditures, including long-term care costs, during the retirement years.
Table 35. Share of Employed Residents Working for Employers Offering a Retirement Plan, Share of WorkersParticipating in Employer Retirement Plan
Source: March CPS Supplements, 2015, 2016, and 2017, Public Use Files, U.S. Census Bureau, CLMP Tabulations
16-24
25-34
35-44
45-54
55-64
65+
25-64
Total
29%
39%
38%
46%
49%
47%
43%
41%
Massachusetts U.S.MA Ranking Among 50 Statesand DC (Highest to Lowest)
Age Group
% Working forEmployers Offering
Pension Plan
13%
30%
29%
37%
40%
35%
34%
31%
% of WorkersParticipating in
Employers ProvidedPension Plan
28%
40%
43%
47%
49%
42%
44%
42%
% Working forEmployers Offering
Pension Plan
10%
28%
35%
39%
42%
29%
35%
31%
% of WorkersParticipating in
Employers ProvidedPension Plan
30
36
45
35
35
11
39
37
% Working forEmployers Offering
Pension Plan
11
26
46
40
38
6
40
33
% of WorkersParticipating in
Employers ProvidedPension Plan
Source: Gretchen Jacobson, Shannon Griffin, Tricia Neuman, and Karen Smith, “Income and Assets of Medicare Beneficiaries”, 2016-2035, Issue Brief, The Henry J. Kaiser Family Foundation, April 21, 2017 (https://www.kff.org/medicare/issue-brief/income-and-assets-of- medicare-beneficiaries-2016-2035/). Authors have taken data presented in Figures 1, 5, and 8 of the report and converted it into this tabulation.
Table 36. Per Capital Income and Assets of MedicareBeneficiaries at the Median and the 25th, 95th, and 99thPercentiles, 2016
99
95
Median (50)
25
Percentile
$873,150
$466,600
$70,950
$7,350
24% had $0
in home equity
Home Equity
$4,008,150
$1,367,000
$74,450
$14,550
8% had $0 in savings
or were in debt
Savings
$182,900
$103,450
$26,200
$15,250
Income
0
50,000
100,000
150,000
200,000
250,000
300,000
All HH 55-64 65-74 75+
97,290
187,300
224,000
264,750
Source: U.S. Survey of Consumer Finance, 2016, Federal Reserve Board, Public Use Data File.
Chart 35. Median Net Worth of U.S. Households, by Ageof Householder, 2016

58
Households headed by older workers and retirees have median wealth that is much greater than other households in the nation. Households headed by a person aged 55 to 64 had median wealth of $187,300 more than double the national median level of household wealth. The median wealth of households headed by a person aged 65 to 74 is valued at $224,000 and the median value of wealth for households headed by a person aged 75 and older is $264,750. While these sums are quite substantial, when placed in the context of the expected value of the cost of long-term care, they appear much less so.
The likelihood that a person will use a nursing home at some point after age 65 is quite high and the mean duration of stays in nursing homes (among those ever admitted) is quite lengthy. Using measures on the likelihood of nursing home admission and mean durations of admission developed by Boston College’s Center for Retirement Research, we have made some esti-mates of the expected value of nursing home costs for 65-year-old persons in the future. The expected value is calculated by multiplying the mean monthly cost of an admission by the mean duration of the admission and them multi-plying this product by the probability of the individual ever being admitted to a nursing home. The results suggest that the expected value of the future cost of nursing care would consume a large share of median household wealth.
The median annual cost for a semi-private room at a Massachusetts nursing home in 2017 was $140,525, but for a 65-year-old man the expected value of nursing home costs after the age of 65 is much lower than this fig-ure at $54,411. Men who reach the age of 65 are less likely to be admitted to a nursing home in the future. However, the expected value of future nursing home costs for women who reach the age of 65 is $117,366, double that of men. The explanation for this large disparity is straightforward. Women at age 65, on average will live more years than their male counterparts, but as these women age, the chance of experiencing limitations in activities of daily living skyrockets, thus substantially increasing the chance of admis-sion into a nursing home for women relative to men.
When median net wealth is placed in the context of the expected value of future nursing home costs, it means that the median 65+ household can expect to spend between 20 percent and 25 percent of their net wealth on nursing care. The share of net wealth required to fund the expected value of a woman’s admission to a nursing home is between 45 and 52 percent of the net wealth of the median household. The extraordinary share of median household wealth that is likely required to finance expected long-term care costs leads to “the most common funding scheme for LTC expenses…per-sonal asset spend-down followed by Medicaid qualification.”84
The findings in Table 37 examine the distribution of wealth among households by the age of the householder. The data in the table is produced by ranking all households within an age group from the wealthiest to the least wealthy and then dividing this ranking into 10 equal sized groups of households. The values in each cell are measures of the average wealth level in each age/decile group. For example, decile 1 is composed of the 10 percent of least wealthy households in the nation. The mean wealth level for such households with a householder aged 65 to 74 was actually nega-tive, that is, these households, on average, had net debt of over $7,100.
A look at the table helps us get an approximation of the ability of households to finance the expected value of nursing home costs. The findings reveal that the bottom 30 percent of households had assets insufficient to cover the costs of the expected value of nursing home costs of a man at age 65. More than 40 percent of elderly households have insufficient assets to cover the expected nursing home costs of a woman at age 65. When we consider that these assets
percent of the total value of household wealth in the nation, while account-ing for just 44 percent of all households in the nation.
The Federal Reserve System conducts the Survey of Consumer Finance (SCF) that includes measures of household wealth at a point in time, by key characteristics of the householder. These data are not available at the state level, so we provide a discussion of national household wealth based on the SCF findings for 2016.83 Our hope is that this analysis will prove instructive as to the stock of private household wealth that may be available to finance potentially quite substantial long-term care assistance for a population in the Commonwealth that is becoming increasingly aged and disabled.
The median value of U.S. household net wealth was $97,290 during 2016. Median wealth refers to the level of net wealth owned by households that are exactly in the middle of the distribution of all households when all households are ranked from the lowest to the highest level of net wealth. In other words, median wealth is also the value of wealth held by households ranked at the 50th percentile of the household wealth distribution.
The median measure is sometimes thought of as an indicator of the net wealth held by a typical American household. The mean level of net house-hold wealth in the nation stood at $689,509 during 2016, seven times larger than the median household. The large difference between mean and me-dian household wealth is an indication of a highly skewed distribution of wealth in the nation, with a relatively small share of households accumu-lating a large share of wealth over their lifetimes.
Large differences in net wealth accumulation among older households have important implications for long-term care finance and the level and characteristics of long-term care that may be provided. This, in turn will influence the level and nature of job growth in two industries in the state: home health care and services to the elderly and disabled.
0
20,000
60,000
40,000
80,000
120,000
100,000
140,000
160,000
Expected Value Men Expected Value Women Median Annual Costs
54,411
117,366
140,525
Sources: Expected values calculated by the authors data from Frieburg et al, (2014) Boston College Center for Retirement Research, and Genworth Cost of Care Survey, 2017.
Chart 36. Expected Value of Lifetime Nursing Home Costsfor Men and Women and Median Annual Nursing HomeCosts, Massachusetts, 2017

59
costs of long-term care services stood at $138,100.85
Like our findings for Massachusetts nursing home costs, HHS found large gender differences in the expected value of long-term care costs for persons at age 65. Men at age 65 can expect to spend $91,100 on long term-care services and women can expect to spend a total of $182,000 in long-term care costs. It is important to note that the expected values for long-term care costs are not the same as the expected value costs. For persons who actually use long-term care (remember, the expected value measure is weighted to reflect the probability of using LTC) the average total costs are $266,000, community care costs for those who use them average $140,000 and nursing home costs for users average $126,000.
When we consider the actual mean care costs for persons who must use long-term care in the context of the distribution of wealth, it is clear that the wealth required to finance these costs are out of reach for close to 60 percent of households and that for many more individuals who have accu-mulated wealth above this level, the costs of such services would consume a large share of their net assets.
·
LONG-TERM CARE INSURANCELong-term care insurance is an alternative way that some households opt to provide a financing hedge against the risk of long-term care support needs associated with limitations in activities of daily living. Long-term care insurance (LTC) can provide payments for both institutional care in-cluding skilled nursing home care as well as care in assisted living facilities. LTC insurance also pays for in-home services included skilled nursing care as well as personal care most often supplied by home health aides and per-sonal care aides. The nature of services (as well as the duration of services) provided under these policies vary considerably. Generally, consumers can expect that high cost policies offer a wider range of benefits for longer time periods. LTC insurance policies in Massachusetts cover individuals for a minimum of two years.
While persons can be refused coverage for a variety of pre-existing con-ditions, insurers must guarantee renewal of the policy each year, regardless of changes in health, as long as the beneficiary pays the LTC policy pre-mium. Premium costs vary considerably according to the age of the insured individual at the time of initial purchase of the coverage. Persons who buy LTC insurance when they are younger pay lower annual premiums since they have low risk profiles for more years than persons who purchase cov-erage later in life. State laws and regulations also require that the initial premium for a new individual buyer be determined in a way that the ex-pected future premiums will not increase for life. In this way, individual buyers have reasonable expectations of future costs—especially during the retirement years when incomes are likely below pre-retirement levels. Premium certainty is an especially important feature of LTC insurance since individual policyholders who fail to pay their premiums will lose LTC coverage entirely- regardless of the number of years in which they paid a premium and were covered.
Insurers are permitted to increase premiums for groups of policyhold-ers upon state regulatory approval.86 Such approval may be granted by state officials when the actual experience of insurers with respect to pre-mium payments, premium revenue, and investment returns are mark-edly different from the actuarially based pricing assumptions at the time the policy is sold in a state. The premium pricing performance of insurers
may have a wide variety of alternative and potentially very important uses (including the finance of acute care, drug costs and other health care costs) it is very clear that large numbers of households are simply not prepared to face the substantial likelihood of a nursing home admission.
The expected value of cost presented above is for the costs of nursing home care in Massachusetts for a person aged 65. However, nursing home costs are only one element of long- term care costs confronting older Americans. The Office of Disability and Aging of the U.S. Department of Health and Human Services (HHS) has produced measures of the overall expected value of the costs of long-term care for a person at age 65. The HHS findings are sobering: for the nation as a whole the expected value of
$0
$300,000
$250,000
$200,000
$150,000
$100,000
$50,000
Total
$266,000
$138,100
Nursing Facility
$126,000
$65,300
Community Based
$140,000
$72,800
Source: Department of Health and Human Services, Office of Disability, Aging and Long-Term Care Policy, Washington, DC, 2015.
Chart 37. Expected Value of Long-Term Care and ActualAverage Expenditures of Users of Long-Term Care inthe U.S., 2015
Expected Value of Long-Term Care
Average Expenditures of Users
Table 37. Decile Distribution of the Net Worth of U.S.Households, by Age of Householder, 2016,Mean Decile Values
Source: U.S. Survey of Consumer Finance, 2016, Federal Reserve Board, Public Use Data File
1
2
3
4
5
6
7
8
9
10
Total
-$12,364
$7,130
$33,196
$85,485
$150,170
$239,754
$392,692
$699,922
$1,413,272
$8,616,055
$1,164,374
55-64
-$7,153
$14,948
$52,878
$108,847
$183,465
$273,098
$422,166
$711,456
$1,272,473
$7,550,556
$1,058,924
65-74
-$1,762
$32,193
$85,253
$145,868
$227,078
$317,133
$450,491
$712,877
$1,350,848
$7,276,769
$1,064,700
75+Wealth Decile

60
but it also results in a substantial share of persons who had originally pur-chased that coverage to allow their polices to lapse. More than one-quarter of persons who purchase LTC insurance at age 65 will lapse their coverage before death.97 Sadly, persons who lapse are considerably more likely to utilize long-term care than those individuals who maintain their insurance coverage. Unsurprisingly, household income and wealth are both nega-tively associated with the risk of lapsing. Persons with lower income and lower wealth are substantially more likely to let their LTC coverage lapse.98 The share of all middle-income households with LTC insurance has fallen from by about one-fifth between 1995 and 2010.99
Dimitris Karapiperis and Edward Nordman of the National Association of Insurance Commissioners and the Center for Insurance Policy and Research observed:100
“As baby boomers enter their golden years they will be confronted with one of the largest financial risks in the history of their generation. It is expected the overwhelming majority of elderly Americans will require long-term care (LTC) at some point in their lives. The potential large LTC expenditures, often exceeding the retirement income and savings of a large portion of middle-class retirees, could increase the financial stress for them and their families jeopardizing their standard of living and quality of life. For the more financially vulnerable among the elderly, the need for costly LTC could actually prove an insurmountable challenge. It is only after exhausting all their assets that they could turn to social programs like Medicaid for help. Although Medicaid is currently the largest payer for LTC, rising costs could place federal and state budgets under serious and increasing financial strain.”
For persons with modest income and few assets, it does not appear that LTC insurance is very attractive. Like most financial decisions, there are no hard and fast rules about when it makes sense to purchase LTC insurance. Indeed, from a strict perspective of the expected returns individuals might be better off simply self-insuring since their expected rate of return is the same as the LTC insurers and they would not have to pay any transaction costs of insurance. Indeed, most of the advice out there suggests that per-sons with substantial assets are likely better off self-insuring. With suffi-cient wealth, these households can both protect against the risk of decline in living standards, while diverting unspent LTC insurance premiums to investment activities that can build additional wealth.
Persons with few or no assets are also expected to be better off if they do not purchase LTC insurance. The availability of means-tested LTC cover-age means that for many older individuals they are better off self-insuring until they spend down their assets and become eligible for Medicaid cover-age. In these instances, the value of assets to be protected is simply not high enough to justify purchasing LTC insurance, since when these assets are exhausted they become eligible for Medicaid-financed LTC care. In be-tween these two groups of low asset and very high asset elderly households are those households with sufficient assets to protect with LTC insurance, but insufficient to self-insure and still maintain pre-retirement living stan-dards. This middle ground is known as the LTC sweet spot. It is made up of those households with substantial assets that are capable of maintaining pre-retirement living standards in the absence of a health event that neces-sitates LTC services, but insufficient to maintain living standards in the event of the need for LTC services.
has been poor and LTC premiums have risen considerably over time. Indeed, many insurance providers have exited the market as actuarial assumptions around initial premiums proved faulty and insurers saw little chance of adjusting their products design and pricing in a way to make LTC insurance profitable.87
LTC benefit eligibility generally begins when an insured individual has two or more limitations in activities of daily living. Often, LTC policies have a waiting period or a deductible cost that requires beneficiaries to pay out of pocket for some of their LTC costs. Benefit payments begin after the waiting period or deductible costs are met by the consumer.88 Individuals tend to purchase this insurance later in life, with a national median age of 59 at the time of first purchase.89 The motives for such purchases are asso-ciated with asset protection, with the primary objective of maintaining living standards through retirement and the lesser objective of preserva-tion of assets for heirs.90
Individual LTC costs are considerable. For a two person household aged 65, the 2015 premium averaged $5,544 providing considerable nursing home and home care benefits.91 These premiums alone would consume about 14 percent of the median income of the elderly population in the Commonwealth. These high premium costs mean that the take-up rate among the population of older residents is quite low. The share of persons aged 60 and older who own a current long-term care insurance policy is quite low; findings from the Health and Retirement longitudinal study re-veal that just 13.8 percent of older persons in the U.S are covered, although there are some indications that this share has increased over time.92 Median personal income for individuals covered by any LTC insurance was $87,500 in 2010, more than double the median income level for Massachusetts elderly households. In 2010, the median wealth of persons who owned any LTC insurance was $325,000 compared to $225,000 me-dian wealth of 65-74 year old households in 2016. Finally, more than 70 percent of LTC policyholders were college educated.
LTC insurance products appear to be out of the financial reach of many households and instead are sold to a higher income and wealthier population.93
The share of Massachusetts residents aged 60 and above who own LTC insurance coverage is thought to be lower, about 10 percent.94 The number of new policies sold in the nation has plunged in recent years as premiums have risen. In Massachusetts, the number of firms that actively sell LTC insurance is quite low—around five, but even some of these have very low new sales volumes. Low coverage rates are the result of both an unrealisti-cally low expectation among potential consumers of the likelihood of ever using long-term care as well as consumer concerns about the costs of LTC insurance relative to their household income.95
Since 2008, the number of persons in the U.S. with long-term care insur-ance of any type has remained almost unchanged at around 7.2 million, even as the nation’s population aged 60 and older has risen by about 12 percent over that time-period. The national volume of new sales of long-term care insurance coverage has fallen from 754,000 new individual pol-icies issued in 2002 to just 129,000 new individual policies in 2014.96 Using a simple back-of-the-envelope calculation, we suspect that the number of new individual LTC insurance policies written in Massachusetts during 2014 was likely under 3,000.
The decreasing affordability of LTC insurance associated with high and rising premiums not only seems to reduce the purchases of new coverage,

61
support are high. A recent analysis by the BC Center for Retirement Research found that about 44 percent of men and 58 percent of women would need to use a nursing home during their retirement years. For men, the mean duration of stay(s) is about 101/2 months, but for women the mean duration rises to about 16.5 months.106
When we compare the median costs of these services with the median annual income of households headed by a person aged 65 and over, the ex-traordinary nature of these expenses becomes clear. The findings in Table 39 examine the relationship to median annualized costs of four different types of long-term care support services in Massachusetts to the median annual income of households headed by person aged 65 and older. The findings reveal that the share of annual income required to finance even the least costly alternative is quite high. The lowest cost care service, adult day care, had an annual cost equal to 42 percent of the median income for households with a householder over the age of 65. Annualized home care costs and assisted living costs would consume 1.44 and 1.68 times the me-dian annual household level income for older residents in the state. Median
One rule of thumb is that net assets of between $200,000 and $2 million places a household in the LTC sweet spot.101 Other rules of thumb suggest that the LTC sweet spot begins at a much higher asset level at $1 million and ends at $6 million.102 While these rules of thumb vary considerably, they do make clear that a very large share of households in the nation have not accumulated assets sufficient to finance LTC services. Household as-sets are accumulated over decades, mostly through earnings and savings.
For most elderly persons, the ability to substantially increase their net assets is quite limited—especially in Massachusetts where the ratio of re-tirement to pre- retirement income was among the lowest in the nation. Our findings on wealth and income indicate that private payments- either in the form of insurance coverage or simply out-of-pocket payments from wealth and income will not play a substantial role in financing the expected increase in the demand for LTC services. As we discuss in the following section, it is clear that state and federal government funds will finance the overwhelming share of long-term care services delivered in the Commonwealth for the foreseeable future.
CURRENT AND PROJECTED LONG-TERM CARE EXPENDITURESThe long-term care (LTC) market is massive in size, with LTC expendi-tures exceeding $250 billion in the nation during 2016.103 In 2014 total ex-penditures on long-term care in Massachusetts totaled $9.6 billion, repre-senting about 13 percent of total health care expenditures (public and private) in the Commonwealth at that time.104 Much of the growth in long-term care expenditures in the state has been concentrated in the purchase of home health care services.
Between 2006 and 2014 (the last year for which state data are available) nominal health care expenditures in Massachusetts increased by $16.1 bil-lion, a 29 percent rise. Over the same period long-term care expenditures increased by $2.9 billion, a 44 percent rise. Most of this increase in long-term care spending in the Commonwealth was on home health care. Spending on home health care more than doubled in the 8 years between 2006 and 2014, rising by $2.4 billion. Expenditures in the nursing home and residential care component of the long-term care delivery system grew by just 11 percent between 2006 and 2014. By 2014, the spectacular 14.4 percent annual average rate of growth in home health care expenditures in the state resulted in that industry accounting for nearly half of all long-term care expenditures, up from about one- third in 2006.
Individual consumer costs for long-term care services are also quite high, at least relative to the mean income of persons aged 65 and above. The Genworth Cost of Care Survey conducted in 2017 provides measures of median service costs for various kinds of long-term care services at the national and state level based on responses from about 15,000 long-term care provider organizations.105 Monthly costs of long-term care vary sharply by the type of service that is purchased. The median monthly cost of adult care in the state during 2017 was $1,408.
However, many persons with multiple limitations in activities of daily living require services that are more intensive. Median cost of homemaker/home healthcare was $4,814 per month while median assisted living cost was $5,599 per month. Nursing home care is quite costly in the state, with a median monthly price tag for nursing home care of $11,710.
For persons aged 65 and older, the chances of needing long-term care
Table 38. Trends in Total and Long-Term Care Expendituresin Massachusetts, 2006 to 2014(in millions of nominal dollars)
Source: National Health Expenditure Survey, Center for Medicare & Medicaid Services, 2016
Total Spending
All Long-Term Care
Home Health Care
Nursing Home and Residential Care
$55,554
$6,486
$2,089
$4,397
2006
$71,724
$9,363
$4,503
$4,860
2014
$16,170
$2,877
$2,414
$463
29%
44%
116%
11%
ChangePercentChange
$0
$14,000
$12,000
$10,000
$8,000
$6,000
$4,000
$2,000
Home Care Adult Day Care Assisted Living Nursing Homes
$4,814
$1,408
$5,599
$11,710
Source: Genworth Long Term Care Costs Across the United States, 2017
Chart 38. Median Monthly Costs of Long-term CareServices in Massachusetts, 2017

62
The Center for Medicare and Medicaid (CMS) prepared a set of health care expenditure projections for the nation covering the 2016 to 2026 pe-riod in total and by specific expenditure category. The CMS expects contin-ued rapid growth in health care expenditures relative to growth in eco-nomic activity over the projections period. CMS expects that health expenditures as a share of gross domestic product will rise from 17.9 per-cent in 2016 to 19.7 percent by 2026. The CMS projection indicates that increases in health care spending will account for 24 percent of the total projected gain in the value of GDP in the nation over the next decade. The magnitude of this increase is extraordinary. It means that per capita spend-ing on health care will rise from $10,348 during 2016 to $16,168 by 2026.
Medicare and Medicaid are expected to account for a rising share of total health care expenditures. In the case of Medicare, this is a product of sharp rise in enrollment growth as the baby-boom population surges into the re-tirement years. Medicaid expenditures will rise as it accounts for an in-creasing share of aged and enrollees with disabilities, requiring long-term care.107 Over the projections period, out-of-pocket and private spending will grow more slowly, while Medicaid and especially Medicare expendi-tures are forecast to grow at an above average pace.
Long-term care expenditures are expected to increase by about $178.5 billion between 2016 and 2026, an increase of 70 percent, about the same as the overall pace of increase in health care expenditures in the nation. Medicare payments for long-term care service are expected to rise quite sharply, more than doubling from $74.9 billion in 2016 to $158.1 billion by 2026.108 About 80 percent of the increase in long-term care expenditures during the next decade is expected to be financed from various federal and state sources.
Medicare expenditures for nursing home and residential care services are forecast to rise by $42.9 billion accounting for 24 percent of the total rise in long-term care expenditures along with a $40.3 billion increase in home health care spending through 2026. Medicaid will increase its spending on nursing home and residential care by $20.9 billion (about 12% of the total increase in long-term care costs) and raise its program spending on home health care costs by percent, equal to 16 percent of the rise in total long-term care expenditures. Overall, federal and state government will finance about
annualized nursing home care costs in Massachusetts were $140,520, 3.5 times the median annual income for the state’s elderly households.
Given the extraordinary burden that long-term care costs place on households, it is not surprising to see that federal and state governments provide very heavy subsidies to elderly persons in need of long-term care service. During 2016, a total of $75 billion in private payments were made for long-term care services in the nation, about two-thirds of this expendi-ture from out-of-pocket sources (including income, wealth and other fam-ily members) and about one-third, or $24.4 billion, was paid by private in-surance. The lion’s share of long-term care expenditures were made by Medicaid programs that together spent $159 billion purchasing long-term care services.
The sources of expenditures on long-term care services did vary some-what between home health care and nursing and residential care services. While the shares of out-of-pocket payments were the same in both kinds of care settings, out-of-pocket payments were a much smaller share of home health care payments where they accounted for just 9 percent of expendi-tures, compared to nursing and residential care where they accounted for 20 percent of total outlays on those services during 2016.
Table 39. Ratio of Median Long-Term Care Costs inMassachusetts to Median Income among HouseholdsHeaded by a Person 65 and Older Living in Massachusetts
Source: Genworth Long Term Care Costs Across the United States, 2017. U.S. Bureau of the Census, American Community Survey, Public Use Microdata Sample, 2015-2016, Tabulations by CLMP
Home Care
Adult Day Care
Assisted Living
Nursing Homes
Median HH Income (2016)
$4,814
$1,408
$5,599
$11,710
Median MonthlyCost (2017)Service
$57,768
$16,896
$67,188
$140,520
$40,063
AnnualizedCosts
1.44
0.42
1.68
3.51
Ratio of Cost toMedian HH Income
Table 40. Sources of Long Term Care Expenditures in the United States, 2016 (Expenditures in Billions ofNominal Dollars)
Source: National Health Expenditure Survey, Center for Medicare & Medicaid
Total
Out-of-Pocket Payments
Private Health Insurance
Medicare
Medicaid
Other Health Insurance Programs
Other Third Party Payers
92.4
8.1
9.6
37.4
34.0
0.7
2.6
Home HealthNursing Home andResidential Care
Total,Long-Term Care
Expenditures
100%
9%
10%
40%
37%
1%
3%
PercentDistribution
162.7
43.8
14.8
37.5
50.0
5.1
11.6
Expenditures
100%
27%
9%
23%
31%
3%
7%
PercentDistribution
255.1
51.9
24.4
74.9
84.0
5.8
14.2
Expenditures
100%
20%
10%
29%
33%
2%
6%
PercentDistribution

63
health care support and direct care occupations over the next decade? Is it likely to accelerate as the number of persons with physical, cognitive and emotional limitations increases to levels never seen in the state over the next twenty years? In this section of the report, we explore the potential future growth path of employment in these occupations by examining two sets of projections including:
• National employment projections for home health care and direct care support occupations prepared in 2017 by the U.S. Bureau of Labor Statistics,• Massachusetts population projections by age, prepared by Henry Renski, University of Massachusetts, Amherst, and Susan
Strate, UMass Donahue Institute, Population Estimates Program.
The U.S. Bureau of Labor Statistics occupational projections rely in part on the data derived from the occupational staffing patterns of industries produced by the federal-state OES program that we used in the prior sec-tion to discuss recent occupational employment trends.110 It is important to note that the basic constraint on economic activity in a state or region is population and labor force growth. The overall pace of new job creation forecast for both the U.S. and Massachusetts is quite slow. This is a result of the slow projected rate of growth in the size of the nation’s (and the state’s) labor force due to an aging population and declining labor force en-gagement among young people.
It is also useful to note that BLS assumes that the economy will move toward a full- employment level of labor force utilization. This assumption is made because BLS has no way of forecasting what actual business cycle conditions will be in the target year of 2026, thus the simplifying assump-tion of full employment. This means that industry and occupational pro-jections should be viewed as a speculation about the likely future path of industry and occupational employment growth assuming continued long-term economic growth that is ultimately constrained by the availability of future labor supply.
Employment projections should be thought of as a starting point to un-derstanding the likely future path of job opportunities in the nation and state, not as some sort of precise scientific/mathematical prediction. While occupational projections abound, we find the BLS projections to be by far the most empirically sound; relying on a variety of large scale historical databases, careful thinking about the impact of demography, technology,
80 percent of the total rise in long-term care spending through 2026.
EMPLOYMENT OUTLOOK FOR HEALTH CARE SUPPORT AND DIRECT CARE OCCUPATIONSThe pace of new job creation in the health care support and direct care oc-cupations has been extraordinary in recent years with all of this growth oc-curring as the oldest members of the aging baby-boom cohort celebrate their 72nd birthday this year. The incidence of diminished physical, mental and emotional ability that limits activities of daily living like walking, dressing, bathing or running errands is closely associated with age, with rates of dis-ability skyrocketing for those over the age of 65.109 In Massachusetts, nearly 35 percent of persons aged 65 and older have such a limitation and one in five elderly residents (65-plus years old) have limitations on performing at least two (or more) such activities of daily living (ADL).
The size of this population is growing quite rapidly. In addition, the in-crease in this population is typically accompanied with an increase in the need for home health and direct care services particularly with increasing focus at the federal and state level to support and expand aging in place policies that are designed to help the elderly and persons with disabilities to remain at home. What does this mean for the pace of job creation in the
Table 42. Source of Finance for the Projected Increase in Long Term Care Spending in the United States
Source: National Health Expenditure Projections, 2016 to 2026, Center for Medicare and Medicaid.
Medicare
Medicaid
Other Government
Private
Total
42.9
20.9
6.8
27.6
98.2
Nursing Home and Residential Care Home HealthSource of Finance
Expenditure Change
24%
12%
4%
15%
55%
Share of LongTerm Care Change
40.3
28.8
2.7
8.3
80.1
Expenditure Change
23%
16%
2%
5%
45%
Share of LongTerm Care Change
Table 41. Projections of Total Long-Term Care Expendituresin the U.S., by Source of Finance, 2016 to 2026(Expenditures in Billions of Nominal Dollars)
Source: National Health Expenditure Projections, 2016 to 2026, Center for Medicare and Medicaid
Total
Out-of-Pocket Payments
Private Health Insurance
Medicare
Medicaid
Other Health Insurance Programs
Other Third Party Payers
$255.1
$51.9
$24.4
$74.9
$84
$5.8
$14.2
2016
$433.6
$74.4
$37.8
$158.1
$133.7
$8.8
$20.7
2026
$178.5
$22.5
$13.4
$83.2
$49.7
$3
$6.5
Change
70%
43%
55%
111%
59%
52%
46%
PercentChange

64
foreign competition, a host of other factors related to productivity, output and employment, and ultimately solid judgements by their analysts in in-terpreting the measures of labor market trends that are produced by the projections program.111
The national projections of employment in the home health/direct care worker occupations prepared by the U.S. Bureau of Labor Statistics suggest a promising job outlook and are consistent with some of the historical em-ployment trends we observed in Massachusetts for these same occupa-tions. Indeed, the BLS projections rank the home health aide occupation as the third and the personal care aide occupation as the fourth most rapidly growing occupations in the nation’s labor market over the 2016-2026 pe-riod. These two home health/direct care worker occupations accounted for nearly half (45% in 2016 and 48% in 2026) of all employment in the BLS ranking of the 30 most rapidly growing occupations in the nation.
The BLS projections forecast significant annual growth rates for the health care support and direct care occupations for the 2016 to 2026 pe-riod. In the case of the CHW/social & human service assistant occupations the BLS projected the pace of new job creation is 1.7 percent per year, about 2.4 times the overall pace of expected new job creation in the nation (0.7 percent per year).
BLS projects that home health aide employment will increase by 4.7 per-cent per year between 2016 and 2026 and over the same 10-year period, the personal care aide occupation is projected to grow at mean annual rate of 3.9 percent per year.
If we assume these national BLS annual job growth rates in health care support and direct care occupations in the state for the 2017 to 2027 period, the expected job creation from the four health care support and direct care occupations (home health aides, personal care aides, community health workers and social and human service assistants) is likely to be substantial. The findings in Table 43 provide employment projections for the health care support and direct care occupations assuming that the 2017 Massachusetts baseline employment measure for each occupation would increase at the
0%
5%
4%
3%
2%
1%
Community HealthWorkers & Social &
Human ServiceAssistants, Combined
Home HealthAides
Personal CareAides
Total, AllOccupations
1.7%
4.7%
3.9%
0.7%
Source: U.S. Bureau of Labor Statistics, Employment Projections Program, Table 1.2, Employment by Detailed Occupation, 2016 and projected 2026 (https://www.bls.gov-/emp/ep_table_102.htm), tabulations by authors.
Chart 39. BLS Projections of Annual Average Rate ofChange in Employment in Health Care Support and DirectCare Occupations, U.S., 2016 to 2026
Table 43. Projected 2017-2027 Employment Growth in Massachusetts Using National BLS 2016-2026 ProjectedGrowth Rates for the Selected Health Care Support and Direct Care Occupations
Source: (i) 2017 Base Year Massachusetts occupational employment from: U.S. Bureau of Labor Statistics, Occupational Employment Statistics Data, May 2017 (https://www.bls.gov/oes/tables.htm); (ii) National Projected Rates of Employment Growth from: U.S. Bureau of Labor Statistics, Employment Projections Program, Table 1.2, Employment by Detailed Occupation, 2016 and projected 2026 (https://www.bls.gov/emp/ep_table_102.htm), tabulations by authors.
Community Health Worker & Social & Human Services Assistant, Combined
Home Health Aides
Personal Care Aides
Total employment
Projected Employment Change 2017-2027
Projected employment change from 4 occupations combined
Percent of projected employment change from 4 occupations combined
Projected employment change from home health aide and personal care aide occupations combined
Percent of projected employment change from home health aide and personal care aide occupations combined
Occupation
18,490
25,160
73,950
3,528,080
2017 Massachusetts BaseYear Employment (i)
21,633
37,062
102,475
3,788,479
3,143
11,902
28,525
260,399
260,399
43,571
16.7%
40,428
15.5%
Projected 2027Massachusetts Employment
Based on National BLSProjected Rates of Growth (ii)
Projected EmploymentChange, 2017 to 2027

65
national annual average rate of increase that was forecast for that occupa-tion by BLS.
These “adjusted” statewide employment projections suggest that health care support and direct care occupations may be amongst the largest indi-vidual occupational sources of new job creation in the Commonwealth over the next decade. These “adjusted” employment projections for the state in-dicate that job growth in the four occupations combined will account for 16.7% percent of the total employment growth in the state and job growth in just the two direct care occupations—home health aide and personal care aide—will account for 15.5 percent of the state’s job growth over the next decade.
Nationally, projections of employment in the health care support and di-rect care occupations suggest that they will be among the most important sources of new job creation in the nation over the next decade. The personal care aide occupation is expected to be the largest single source of new job creation in the nation between 2016 and 2026, adding 777,700 jobs over the period. The home health aide occupation ranks fourth among all occupa-tions as a source of new job creation in the U.S. between 2016 and 2026.
Together, these two occupations are expected to account for 10.5 percent or a little over one of every 10 new jobs created in the U.S. over the next decade. Clearly, BLS expects the home health care system to be a center-piece of economic and employment growth in the coming years. One useful way to discern the likely growth path of employment in these areas is to examine some of the forces that are likely to shape the future demand for health support services that are provided at home.
Another source of employment projections suggest continued growth in the demand for home health aides and personal care aides through 2030. The National Center for Health Workforce Analysis of the U.S. Department of Health and Human Services (HHS) recently prepared a set of projec-tions of employment growth in full-time equivalent positions in the home health aide and personal care aide occupations. Like the Bureau of Labor Statistics, the HHS forecasts also suggest a very rapid expansion in the pace of new job creation in these two occupations.
The HHS forecasts that employment in the number of FTE personal care aides will rise by 3.1 percent per year while FTE employment in the home
Table 44. Ten Occupations with the Most Employment Growth in the U.S., 2016 to 2026 (Numbers in thousands)
Source: U.S. Bureau of Labor Statistics, Employment Projections, Table 1.4 Occupations with the most job growth, 2016 and projected 2026. Retrieved from https://www.bls.gov/emp/ep_table_104.htm
Total, all occupations
Personal care aidesCombined food preparation and serving workers, including fast food
Registered nurses
Home health aidesSoftware developers, applications
Janitors and cleaners, except maids and housekeeping cleaners
General and operations managers
Laborers and freight, stock, and material movers, hand
Medical assistants
Waiters and waitresses
156,063.8
2,016.13,452.2
2,955.2
911.5831.3
2,384.6
2,263.1
2,628.4
634.4
2,600.5
2016
167,582.3
2,793.84,032.1
3,393.2
1,342.71,086.6
2,621.2
2,468.3
2,828.1
818.4
2,783.0
2026
11,518.6
777.7579.9
438.1
431.2255.4
236.5
205.2
199.7
183.9
182.5
Absolute ChangeOccupations
7.4%
38.6%16.8%
14.8%
47.3%30.7%
9.9%
9.1%
7.6%
29.0%
7.0%
Relative Change
0%
5%
4%
3%
2%
1%
Personal Care Aides
3.1%
3.9%
Home Health Aides
3.4%
4.7%
Sources: i) U.S. Bureau of Labor Statistics, Employment Projections, Table 1.4 Occupations with the most job growth, 2016 and projected 2026. Retrieved from (https://www.bls.gov/emp/ep_table_104.htm) and ii) National Center for Health Workforce Analysis, Health Resources and Services Administration, U.S. Department of Health and Human Services, Washington DC, March, 2018.
Chart 40. Projected Annual Average Rates of New JobCreation in the Personal Care Aides and Home HealthAides Occupations, BLS Total Employment and HHSFTE Employment
BLS 10 Year Total Employment HHS 15 Year FTE Employment

66
health aide occupation is expected to rise at an annual rate of 3.4 percent. At first glance, it may appear that HHS is forecasting a slower pace of new job creation than BLS, but this is not the case. The BLS projections include all jobs regardless of weekly hours of work. Thus, the BLS projections in-clude new employment growth in both full-time and part-time positions. In contrast, the HHS projections are for full-time equivalents jobs. However, the majority of jobs in both personal care and home health aides are part-time. In Massachusetts, personal care aides work an average of just 30 hours per week and home health aides work an average of 35 hours per week. The HHS projections define a full-time equivalent as a job of 40 hour per week. Adjusting for hours of work this implies that the HHS pro-jection suggest an annual average rate of job growth of 4.1 percent for per-sonal care aidesthrough 2030 and a 3.9 percent annual rate of growth in home health aide employment over the same period.
PROJECTIONS OF THE SIZE OF THE MASSACHUSETTS LABOR FORCE TO 2030The size of an area’s labor force growth is a crucial factor in that area’s abil-ity to increase employment levels over a given period. For example, the latest round of U.S. Bureau of Labor Statistics employment projections suggests that if the economy were to continue operating at near full em-ployment labor market conditions, the number of jobs in the nation would increase by 11.5 million or about 7 percent between 2016 and 2026, a rise of just 7 percent. During the same span of years, the BLS forecasts that the nation’s labor force (that is the number of persons actively supplying labor) will increase by just 10.5 million workers.
National employment growth through 2026 is constrained by the pace of labor supply expansion. Employment will only rise by 7 percent because it is limited by the pace of labor force growth and the expectation that the unem-ployment rate will decline to a near full employment level in 2026 from its somewhat elevated level in 2016. Simply put, employers, in aggregate, are un-able to add jobs if the labor supply is not available at the prevailing wage rate. Today, the national economy is at near full employment, with the ratio of un-employed workers to job vacancies reaching an historic low of 1:1. The result of this low ratio is labor supply constraint on producer output and employ-ment that is occurring in a variety of industries. While Massachusetts does not conduct a state job vacancy survey, an unemployment rate that has re-mained below 4 percent for the last two years suggests a high likelihood of the development of relative labor supply constraints on output, sales, and employ-ment in a number of industries in the state, including the home health care industry and, potentially, the services to the elderly and disabled industry.
We have prepared a set of labor force projections for the state of Massachusetts to 2030. Using state population projections, current and historical state labor force participation measures, and national labor force projections data we have created projections of the likely size and nature of changes in the state’s labor force in the future.
The pace of growth in the size of the Massachusetts working-age population (persons aged 16 and older) is expected to be quite slow between 2016 and 2030. The number of working- age residents in the state is expected to in-crease by about 407,000 persons, a rise of just 7 percent over the entire 14-year period. However, much of this increase will be concentrated among persons aged 65 and older who, as we shall see, are much less likely to be actively en-gaged in the job market than prime age workers (25- to 54-years-old).
-150,000
-100,000
250,000
200,000
150,000
100,000
50,000
0
-50,000
350,000
300,000
16-19 20-24 35-4425-34 45-54 55-64 65-74 75+
-37,371
-72,052-95,590
282,048
242,447
-26,696-35,219
149,637
Source: Henry Renski and Susan Strate, Long-term Population Projections for Massachusetts Regions and Municipalities, Donahue Institute, University of Massachusetts, March, 2015, tabulations by authors.
Chart 41. Projections of Change in the Size of Age Groupswithin the Massachusetts Working-Age Population,2016 to 2030
0%
100%
90%
80%
70%
60%
50%
40%
30%
20%
10%
16-19 20-24 65-7455-64 75+25-34 35-44 45-54 Total
43%
76%
86%86%
72%
84%
67.4%
8%
33%
Source: U.S. Bureau of the Census, American Community Survey, Public Use Microdata Sample Files, 2015-2016, tabulations by authors.
Chart 42. The Labor Force Participation Rate of theMassachusetts Working-Age Population,by Age Group, 2016

67
ticipation among older individuals, particularly those over the age of 65.Our projections suggest that the labor force attachment of teens and
young adults will continue their long-term decline. Among teens, we expect a large decline of 8 percentage points, a one-sixth reduction in the teen labor force participation rate. We expect that the labor force participation of young adults will fall from 76 percent to 70 percent, an 8 percent relative decline in their job market participation.
In marked contrast, we expect the job market attachment of older work-ers to continue to rise in the next decade-especially among those who have reached the retirement years. We project that by 2030 nearly 40 percent of persons aged 65 to 74 will be engaged in the job market, by either delaying retirement or re-entering the labor force after some period of disconnec-tion, a sharp relative rise from the 33 percent participation rate among these individuals. More remarkable, we expect the population of persons aged 75 and older to increase their labor force participation rate to dou-ble-digit levels by 2030, rising from 8 percent in 2016 to 13 percent in 2030. We expect that the large declines in the labor force attachment of young people will not be completely offset by the rise in labor force attachment of persons in the traditional pre-retirement and retirement years. Consequently, our projections indicate that the overall labor force partici-pation rate among the working age population will decline from 67.4 per-cent during 2016 to 64.3 percent by 2030.
The combination of an aging and slow growing working-age population that will likely grow in size by just 0.5 percent per year through 2030, along with a decline in the labor force attachment of the working-age population will result in a very slow growth in the size of the overall labor force in the state. Between 2016 and 2030, we project that the size of the state’s labor force will rise from 3.775 million to 3.865 million participants, an increase of just under 90,000, a mere 2 percent increase in the size of the state’s labor supply over a 14-year period.
The increase in the size of the state’s labor force will come from two sources:
• the number of persons aged 35 to 44 participating in the job market will increase from about 711,700 in 2016 to 839,900 by
2030. This increase will come from an increase in the number of
The population of teens and young adults in Massachusetts is expected to decline by about 110,000 persons, while the size of the ‘prime working age’ population (those aged 25 to 54) will increase by just under 19,000 per-sons. Only substantial growth in the size of the state’s ‘echo’ generation (children of the baby-boomers aged 35 to 44 in 2030) will permit even this very modest rise in the number of potential workers in the prime years where work is most often likely to be individuals’ primary life activity. Most of the growth in the state’s working population is projected to be among persons 65 and older. Between 2016 and 2030, the number of persons aged 65 and above is expected to rise by about 525,000 persons.
A change in the size of the working-age population is not the only factor that determines the size of labor force growth in the state. Individual deci-sions about participating in the labor market also determine the size of the labor force. A variety of factors influence the choice to participate in the labor market. In developing our projections, we created 18 age-gender cat-egories to produce our measure of labor force attachment now and in the future. The findings in Chart 42 examine the actual pattern of labor force attachment in the state, by age category. (We did not include measures of participation by age-gender to keep the chart understandable).
The chart reveals that, on average, about 67 percent of the working age population was actively engaged in the job market in the state of Massachusetts during 2016, but the choice to participate varied consider-ably by age. Teens and young adults were substantially less likely to partic-ipate in the job market than their prime age adult counterparts. However, persons over the age of 55 had sharply reduced labor force attachment. This pattern of labor force activity suggests that as a larger proportion of the working age population enters the pre-retirement and retirement years, the overall level of labor force attachment would fall as a greater share of the population withdraws from the world of work.
However, it is unlikely that the 2016 pattern of labor force participation in Massachusetts will remain unchanged; instead, we expect a continua-tion of the age-twist phenomenon we observed after 2000 to continue in the future. The age-twist is the result of a marked decrease in the labor force participation among young people, especially teens, but also among young adults aged 20 to 24; and, an increase in the rate of labor force par-
Table 45. Actual and Projected Labor Force ParticipationRates of the Working-Age Population in Massachusetts,by Age, 2016 to 2030
Source: 2016 labor force participation rates from U.S. Bureau of the Census, American Community Survey, Public Use Microdata Sample Files, 2015-2016, tabulations by authors. 2030 labor force participation rates estimated by authors
16-19
20-24
25-34
35-44
45-54
55-64
65-74
75+
Total
43%
76%
86%
86%
84%
72%
33%
8%
67.4%
2016Age
36%
70%
85%
86%
85%
75%
39%
13%
64.3%
2030
-8%
-6%
-1%
0%
1%
3%
6%
5%
-3.1%
PercentagePoint Change
-17%
-8%
-1%
0%
1%
4%
18%
67%
-5%
RelativeChange
Table 46. Actual and Projected Labor Force inMassachusetts, by Age, 2016-2030
Source: 2016 labor force participation rates from U.S. Bureau of the Census, American Community Survey, Public Use Microdata Sample Files, 2015-2016, tabulations by authors. 2030 labor force participation rates estimated by authors
16-19
20-24
25-34
35-44
45-54
55-64
65-74
75+
Total
163,669
377,479
815,162
711,730
810,786
661,220
199,425
35,898
3,775,369
2016Age
121,798
296,544
728,231
839,937
786,957
665,607
329,696
96,430
3,865,200
2030
-41,871
-80,935
-86,931
128,207
-23,829
4,387
130,271
60,532
89,831
AbsoluteChange
-26%
-21%
-11%
18%
-3%
1%
65%
169%
2%
RelativeChange

68
programs act as an implicit tax on the earnings of these individuals, such that additional hours of work in a month may raise earnings above the in-come eligibility requirements of these programs boost their marginal tax rate to sky-high levels as they potentially lose benefits or even completely lose eligibility for means-tested benefits. The phenomenon, also called the benefit cliff, seems to sharply reduce annual hours of work for a substantial share of the state’s direct care workforce.
Our labor force projections suggest little labor force growth between now and 2030. Continued declines in the labor force attachment of teens and young adults and a bulge in the share of the working-age population aged 65 and over combine to create an expected net increase in the size of the state’s labor force of just 2 percent over a 14-year period. This means that efforts to expand payroll employment will be stymied across all industries as long the state’s economy is able to maintain a full-employment or near full-em-ployment condition.
We expect the demand for LTC services to rise very sharply in the next decade. Moreover, we expect that a large share of this increase will be fi-nanced by federal and state sources as private incomes, wealth, and LTC insurance prove insufficient to finance LTC needs for a large share of senior households in the state.
While employment growth in the home health care industry has been frustrated in recent years by labor supply constraints, the services for the elderly and disabled industry, largely fueled by public sector funding, has continued to post strong rates of new job creation. We suspect that the unique employer-employee relationship in this industry and the resultant highly atomistic employment structure create an unusually flexible set of employment features that make employment as a personal care attendant
persons in that age group, but the labor force participation rate for this group will remain unchanged.
• The number of older workers aged 55 and above will increase by more than 195,000 persons. This is a result of both a sharp increase in the size of the population 55-years-old and older by 2030, as well as by expected large increases in labor force
participation rates among this emerging cohort of elderly individuals.
The number of young people aged 16 to 34 who participate in the labor force is expected to decline sharply in the future. The labor supply available from young people under age 34 is forecast to fall by 210,000 by 2030, a decline of 15 percent in 14 years. Similarly, we expect a small net decline in the number of persons aged 45 to 54, who participate in the job market.
With the slow overall growth in the size of the state’s labor force, but the rapid expansion in the supply of labor among persons aged 65 and older, older workers will become an increasingly important source of labor sup-ply in the Commonwealth, including to business establishments engaged in the delivery of health care services.
A LONG-TERM LABOR SUPPLY PROBLEM?Massachusetts labor markets have been at full-employment levels for sev-eral years. Employers in many industries in the state have stepped up re-cruiting and improved wage offers at the entry-level as they seek increas-ingly scarce labor resources. The employment situation for new high school and college graduates is the best it has been in two decades. However, as economic conditions in the state have continued to improve, labor sup-ply conditions have become a constraint on further job creation.
Our analysis of the current employment situation in the state found that after years of very rapid expansion, employment levels in the home health industry have plateaued. Even as demand for direct care services from these firms rises, these businesses seem to have substantial shares of their jobs unfilled.
The improved employment situation in the state has meant not only greater difficulty in hiring workers across the board, but as the number of job openings increase, employers find their quit rates rising as incumbent workers seek better opportunities in different firms in the same industry (or occupation) and entry-level workers simply find an entry-level job that pays better in another industry entirely.
In the case of the home health industry, competing in this market has proven very difficult. Indeed, home health agencies compete not only with one another and with the services to elderly and disabled industry, but also with hospitals, nursing homes, and assisted living centers. Indeed, these firms are in competition for workers in industries far removed from health care including retail sales, hospitality and eating and drinking establish-ments. All of these industries are seeking workers with strong behavioral and social skills, but have minimal need for workers with strong academic proficiency or occupational preparation. A good work ethic and an ability to interact effectively with consumers are the hallmarks of successful hires in most entry-level occupations.112
A hallmark of those employed in direct care occupations is that a sub-stantial proportion live in poor or near poor households and are therefore eligible to participate in means-tested benefit programs including Medicaid, SNAP, and housing voucher programs. Participation in these
-150,000
-100,000
100,000
50,000
0
-50,000
150,000
16-19 20-24 35-4425-34 45-54 55-64 65-74 Total75+
-41,871
-80,935 -86,931
89,831
60,532
130,271
4,387
-23,829
128,207
Source: 2016 labor force participation rates from U.S. Bureau of the Census, American Community Survey, Public Use Microdata Sample Files, 2015-2016, tabulations by authors. 2030 labor force participation rates estimated by authors.
Chart 43. Projected Change in the Size of theMassachusetts Labor Force, by Age Group,2016 to 2030

69
more attractive. The record of rapid and consistent job creation in the ser-vices to elderly and disabled industry even with the state at full employ-ment suggests that employment conditions in the services to the elderly and disabled industry are attractive relative to many other entry-level po-sitions in the state.
The strong likelihood of growing reliance of public resources to finance long-term care in the state suggests that the PCA program and the services to the elderly and disabled industry is likely to become an even more essen-tial element to providing non-medical long-term care to theelderly and dis-abled population in the state. While new technologies will become available to support an aging-in-place strategy, these gains will be offset, at least in part, by declines in the numbers of family members and friends able to pro-vide uncompensated care for those in need of LTC services. The capacity of the state’s current and projected labor supply to meet this rising demand for LTC services, and still permit growth in other sectors of the state economy is in question. A labor force that only increases by fewer than 10,000 persons per year in a state the size of Massachusetts, means that labor supply will reach near full utilization without much new job creation, leaving open the question of how new labor resources become available to meet the long-term care requirements of the state’s baby-boom generation.
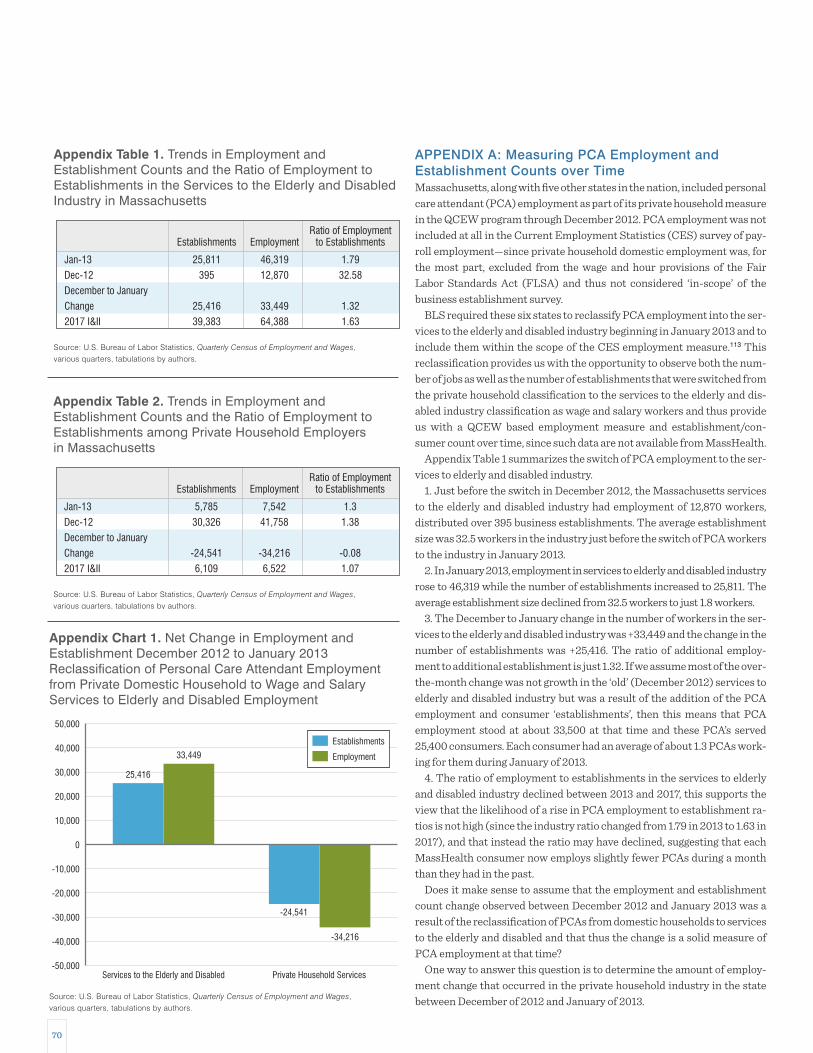
70
APPENDIX A: Measuring PCA Employment and Establishment Counts over TimeMassachusetts, along with five other states in the nation, included personal care attendant (PCA) employment as part of its private household measure in the QCEW program through December 2012. PCA employment was not included at all in the Current Employment Statistics (CES) survey of pay-roll employment—since private household domestic employment was, for the most part, excluded from the wage and hour provisions of the Fair Labor Standards Act (FLSA) and thus not considered ‘in-scope’ of the business establishment survey.
BLS required these six states to reclassify PCA employment into the ser-vices to the elderly and disabled industry beginning in January 2013 and to include them within the scope of the CES employment measure.113 This reclassification provides us with the opportunity to observe both the num-ber of jobs as well as the number of establishments that were switched from the private household classification to the services to the elderly and dis-abled industry classification as wage and salary workers and thus provide us with a QCEW based employment measure and establishment/con-sumer count over time, since such data are not available from MassHealth.
Appendix Table 1 summarizes the switch of PCA employment to the ser-vices to elderly and disabled industry.
1. Just before the switch in December 2012, the Massachusetts services to the elderly and disabled industry had employment of 12,870 workers, distributed over 395 business establishments. The average establishment size was 32.5 workers in the industry just before the switch of PCA workers to the industry in January 2013.
2. In January 2013, employment in services to elderly and disabled industry rose to 46,319 while the number of establishments increased to 25,811. The average establishment size declined from 32.5 workers to just 1.8 workers.
3. The December to January change in the number of workers in the ser-vices to the elderly and disabled industry was +33,449 and the change in the number of establishments was +25,416. The ratio of additional employ-ment to additional establishment is just 1.32. If we assume most of the over-the-month change was not growth in the ‘old’ (December 2012) services to elderly and disabled industry but was a result of the addition of the PCA employment and consumer ‘establishments’, then this means that PCA employment stood at about 33,500 at that time and these PCA’s served 25,400 consumers. Each consumer had an average of about 1.3 PCAs work-ing for them during January of 2013.
4. The ratio of employment to establishments in the services to elderly and disabled industry declined between 2013 and 2017, this supports the view that the likelihood of a rise in PCA employment to establishment ra-tios is not high (since the industry ratio changed from 1.79 in 2013 to 1.63 in 2017), and that instead the ratio may have declined, suggesting that each MassHealth consumer now employs slightly fewer PCAs during a month than they had in the past.
Does it make sense to assume that the employment and establishment count change observed between December 2012 and January 2013 was a result of the reclassification of PCAs from domestic households to services to the elderly and disabled and that thus the change is a solid measure of PCA employment at that time?
One way to answer this question is to determine the amount of employ-ment change that occurred in the private household industry in the state between December of 2012 and January of 2013.
Appendix Table 2. Trends in Employment andEstablishment Counts and the Ratio of Employment toEstablishments among Private Household Employersin Massachusetts
Source: U.S. Bureau of Labor Statistics, Quarterly Census of Employment and Wages, various quarters, tabulations by authors.
Jan-13
Dec-12
December to January
Change
2017 I&II
5,785
30,326
-24,541
6,109
Establishments
7,542
41,758
-34,216
6,522
Employment
1.3
1.38
-0.08
1.07
Ratio of Employmentto Establishments
-50,000
-40,000
-30,000
-20,000
-10,000
0
10,000
20,000
30,000
40,000
50,000
Services to the Elderly and Disabled
33,449
25,416
Private Household Services
-34,216
-24,541
Source: U.S. Bureau of Labor Statistics, Quarterly Census of Employment and Wages, various quarters, tabulations by authors.
Appendix Chart 1. Net Change in Employment andEstablishment December 2012 to January 2013Reclassification of Personal Care Attendant Employmentfrom Private Domestic Household to Wage and SalaryServices to Elderly and Disabled Employment
Establishments
Employment
Appendix Table 1. Trends in Employment andEstablishment Counts and the Ratio of Employment toEstablishments in the Services to the Elderly and DisabledIndustry in Massachusetts
Source: U.S. Bureau of Labor Statistics, Quarterly Census of Employment and Wages, various quarters, tabulations by authors.
Jan-13
Dec-12
December to January
Change
2017 I&II
25,811
395
25,416
39,383
Establishments
46,319
12,870
33,449
64,388
Employment
1.79
32.58
1.32
1.63
Ratio of Employmentto Establishments
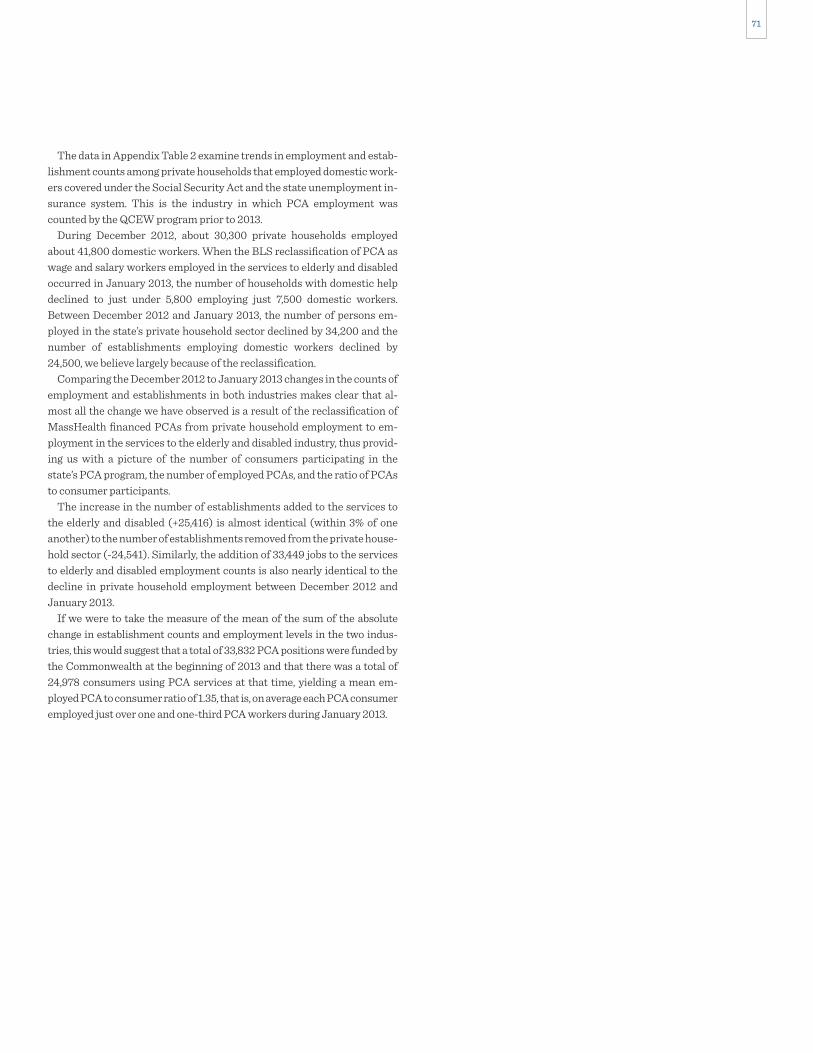
71
The data in Appendix Table 2 examine trends in employment and estab-lishment counts among private households that employed domestic work-ers covered under the Social Security Act and the state unemployment in-surance system. This is the industry in which PCA employment was counted by the QCEW program prior to 2013.
During December 2012, about 30,300 private households employed about 41,800 domestic workers. When the BLS reclassification of PCA as wage and salary workers employed in the services to elderly and disabled occurred in January 2013, the number of households with domestic help declined to just under 5,800 employing just 7,500 domestic workers. Between December 2012 and January 2013, the number of persons em-ployed in the state’s private household sector declined by 34,200 and the number of establishments employing domestic workers declined by 24,500, we believe largely because of the reclassification.
Comparing the December 2012 to January 2013 changes in the counts of employment and establishments in both industries makes clear that al-most all the change we have observed is a result of the reclassification of MassHealth financed PCAs from private household employment to em-ployment in the services to the elderly and disabled industry, thus provid-ing us with a picture of the number of consumers participating in the state’s PCA program, the number of employed PCAs, and the ratio of PCAs to consumer participants.
The increase in the number of establishments added to the services to the elderly and disabled (+25,416) is almost identical (within 3% of one another) to the number of establishments removed from the private house-hold sector (-24,541). Similarly, the addition of 33,449 jobs to the services to elderly and disabled employment counts is also nearly identical to the decline in private household employment between December 2012 and January 2013.
If we were to take the measure of the mean of the sum of the absolute change in establishment counts and employment levels in the two indus-tries, this would suggest that a total of 33,832 PCA positions were funded by the Commonwealth at the beginning of 2013 and that there was a total of 24,978 consumers using PCA services at that time, yielding a mean em-ployed PCA to consumer ratio of 1.35, that is, on average each PCA consumer employed just over one and one-third PCA workers during January 2013.

72
APPENDIX B: Data Source on Pension Plan MeasureEvery month, the Current Population Survey (CPS) is conducted between the 19th and 25th of the month with a nationally representative sample of approximately 60,000 households.114 The CPS survey is conducted by the U.S. Census Bureau for the U.S. Bureau of Labor Statistics and is the official source of the monthly labor force, employed, and the unemployed work-ing-age population in the U.S.
During specific months of the year, supplementary questions are added to the monthly CPS survey on a variety of subjects to collect data on a vari-ety of subjects such as income and poverty, health insurance, volunteering, voting and registration, job tenure/occupational mobility, contingent workers, child support, tobacco use, fertility, volunteers, computer and in-ternet use, etc. These are called CPS supplements. One of the CPS Supplements is the March CPS Supplement also known as “Annual Social and Economic Supplement (ASEC)”. The March CPS survey contains a supplementary sets of questions that collect information from respon-dents 16 years and older on income received in the preceding calendar year from different sources (earnings, unemployment compensation, workers’ compensation, Social Security, supplemental security income, public as-sistance, veterans’ payments, survivor benefits, disability benefits, pension or retirement income (including income from IRAs, Keoghs, and DC plans), interest, dividends, rents, royalties, estates, trusts, educational as-sistance, alimony, child support, and financial assistance from outside of the household.
Additionally, the March CPS supplement questionnaire, asks respon-dents who had worked in the previous calendar year prior to the March CPS survey whether their employers offer any pension plan other than Social Security for employees. If the employers offer a pension plan, work-ers are asked again whether he/she has participated in the pension plan.115 In our analysis, we have selected private sector wage and salary workers 16 or older who worked in the previous year prior to the ASEC 2015, 2016, and 2017 to examine the availability and use of pension plans by workers in Massachusetts and the U.S. Massachusetts’ ranking on pension plan avail-ability and use are also compared with other states and the District of Columbia.
The ASEC survey also asks workers to report the numbers of employees (in all locations) of their employer. The ASEC question is as follows:
“Counting all locations where (this employer/(name/you)) (operates/operate), what is the total number of persons who work for ((name’s/your) employer)/name/you))?
Data on responses to this question are provided in the following catego-ries of employer size:
1. Under 10 2. 10-493. 50-994. 100-4995. 500-9996. 1,000+
We have used data on employer size to estimate availability and use of pension plans by employer size.

73
17 The PCA hourly wage rate is determined by a negotiated agreement between the PCA Quality Home Care Workforce Council and the Service Employees International Union 1199. Effective July 2018, the PCA hourly wages will rise to $15.00.
18 Our understanding is that surrogates do not receive any training in their roles and responsibilities.
19 Commonwealth Corporation and Center for Labor Markets and Policy, Drexel University, Special Topics Report: Selected Health Care Support and Direct Care Occupations in Massachusetts, Office of the State Auditor, Boston, 2016.
20 Home health aides are required to complete a minimum of 75 hours of training, including a practicum of 16 hours covering specific topics per federal Centers for Medicare and Medicaid Services regulation and certification of home care agencies. For more detail: (http://c.ymcdn.com/sites/hcacouncil.org/resource/resmgr/2013mhcaidecareerladder.pdf ).
21 For a more detailed discussion of the measures we use in Table 18, see Neeta Fogg, Paul Harrington and Anja Petrovich, Building Blocks of Labor Market Success, Commonwealth Corporation, Boston, April 2013.
22 The Commonwealth of Massachusetts Department of Public Health is working on issuing regulations for certification and training of community health workers. For more information: (www.mass.gov/dph/communityhealthworkers) and (http://www.machw.org/index.php?option=com_content&view=article&id=4&Itemid104).
23 Community Health Workers, American Public Health Association, (https://www.apha.org/apha- communities/member-sections/community health-workers).
24 The female share of employment in Massachusetts is just slightly greater than the national average of 48 percent of total employment.
25 We define foreign-born persons as all individuals who were born outside the United States (outside of the 50 states and the District of Columbia). Individuals who were born outside the United States but of American parents are not included among the foreign-born.
26 i) Neeta Fogg and Paul Harrington, “Rising Mal-Employment and the Great Recession: The Growing Disconnection between Recent College Graduates and the College Labor Market”, Continuing Higher Education Review, V75, Fall 2011; ii) Paul Harrington and Andrew Sum, “College Labor Shortages in 2018?” New England Journal of Higher Education, November 2010.
27 U.S. Bureau of Labor Statistics, Employer Costs for Employee Compensation, December 2017, News Release, March 20, 2018 (https://www.bls.gov/news.release/pdf/ecec.pdf).
28 Joseph Meisenheimer II, “Real Compensation, 1979 to 2003: Analysis from Several Data Sources”, Monthly Labor Review, May 2005.
29 For a useful discussion of the way that the composition of employed persons can influence wage measures over time, see Mary C, Daly, Bart Hobjin and Benjamin Pyle, “What’s Up with Wage Growth”, FRBSF Economic Letter, Federal Reserve Bank of San Francisco, March 2016.
30 Drew DeSilver, “For Most Workers, Real Wages have Barely Budged for Decades”, Fact Tank Pew Research Center, October 2014.
31 “Massachusetts Home Care Workers First in Nation to Win $15/Hour Starting Wage” (http://www.1199seiu.org/massachusetts/massachusetts_home_care_workers_first_in_nation_to_win_15_hour_starting_wage).
32 Op. Cit., Hayley Gleason, 2018.
33 U.S Bureau of the Census. “Poverty Thresholds”, (http://www.census.gov/data/tables/time-series/demo/income- poverty/historical-poverty-thresholds.html).
34 Jessica L. Semega, Kayla R. Fontenot, and Melissa A. Kollar, Income and Poverty in the United States: 2016, Current Population Reports, U.S. Bureau of the Census, September, 2017 (https://www.census.gov/content/dam/Census/library/publications/2017/demo/P60-259.pdf).
35 We include all persons under the age of 65 in the working age population. Those 65 and older are excluded since the labor force attachment of persons aged 65 and older (although increasing) is much lower than that of persons under the age of 65. Persons 65 and older are most often retired and permanently withdrawn from the labor force; their poverty rates are well below the average since income transfer programs, including old age insurance, provide income floors for most elderly residents of the state.
ENDNOTES
1 Elsewhere in our study of the health care workforce, we have focused on employment only in the industries we define as health care: ambulatory health care services (NAICS 621), hospitals (NAICS 622), nursing and residential care facilities (NAICS 623) and individual and family services (NAICS 6241). Here, we look at the home health and direct care worker occupations across any industry. While most would be captured within our health care industry definition, we want a complete occupational picture and so include any occupational employment for these fields that may be identified in non-health industry sectors.
2 For a description of the MassHealth Personal Care Attendant Program, see: The Personal Care Attendant Quality Home Care Workforce Council, 2014 Performance Review Report to the Governor and the General Court, undated. (http://www.mass.gov/pca/docs/annual-review-report-2014.pdf).
3 Occupational Employment Statistics Survey Program, Survey Methods and Reliability Statement of the May 2015 Occupational Employment Statistics Survey, U.S. Bureau of Labor Statistics, (http://www.bls.gov/oes/current/methods_statement.pdf).
4 This estimate is based on our analysis of the month-to-month change of employment in the individual and family services industry from the Quarterly Census of Employment and Wages as the MassHealth PCAs were brought into the scope of the QCEW between 2012 and 2013. See: Commonwealth Corporation and the Center for Labor Markets and Policy, Drexel University, Health Care Employment, Structure and Trends in Massachusetts: Chapter 224 Baseline Study, Office of the State Auditor, Commonwealth of Massachusetts, July 2014. Also see: Op Cit. “2014 Performance Review” that estimates about 34,000 PCA jobs were financed by MassHealth during 2014.
5 Our final report on the impact of Chapter 224 will include data on health care industry employment trends that do include MassHealth financed PCA jobs, however, similar occupational data are not available as of this writing.
6 Massachusetts lost about 125,000 jobs between May 2008 and February 2010. By the beginning of 2013, all the jobs were recovered.
7 Achieving an annual average rate of new job creation that placed Massachusetts among the most rapidly growing states in the nation.
8 Super sectors are designations made by the U.S. Bureau of Labor Statistics that are simply further aggregations of already aggregated industry employment. In this instance, aggregating health services and social services into a super sector of health and social services is done to simplify reporting.
9 Paul Harrington and Neeta Fogg, Healthcare Employment Expansion in the Context of Long Term Economic Turbulence: The Massachusetts Experience, Center for Labor Markets and Policy, Drexel University, October 2011.
10 Between 2013 I&II and 2017 I&II, employment within this industry went in very different directions. Massachusetts nursing home employment fell by 4,300 jobs, about eight percent. At the same time, employment in residential health facilities (including substance abuse residences) rose by 3,100 jobs, about 15 percent, and community care facilities (including assisted living) saw employment rise by 4,300 jobs, a 25 percent rise in just four years.
11 The home health care and services to the elderly and disabled industries also played an important role in the overall recovery of the Massachusetts job market. These two industries created one of every eight new private sector jobs created between 2010 I&II and 2017 I&II.
12 “Massachusetts Home Care Workers First in Nation to Win $15/hour Starting Wage” (http://www.1199seiu.org/massachusetts/massachusetts_home_care_workers_first_in_nation_to_win_15_hour_start ing_wage).
13 Hayley Gleason, Setting the Agenda, Tufts Health Plan Foundation, February 2018.
14 Commonwealth of Massachusetts, Long-Term Care and Your Options for Financing It: A Massachusetts Guide, Division of Insurance, Boston, 2016.
15 Commonwealth of Massachusetts, Evaluation of the 2012 Health Care Cost Containment Law in Massachusetts: Chapter 4, Office of the State Auditor, Boston, 2017.
16 The 3.5 percent unemployment rate in the state during the first quarter of 2018 is the lowest rate of unemployment achieved in the state since mid-2001.

74
58 Susan Reinhard, Carol Levine and Sarah Samis, Home Alone: Family Caregivers Providing Complex Chronic Care, AARP Public Policy Institute, October 2012.
59 Peter Kemper, Harriet Komisar and Lisa Alecxih, “Long-Term Care Over an Uncertain Future: What Can Current Retirees Expect?”, Inquiry, Winter 2005-2006.
60 Ke Bin Wu, Sources of Income for Older Americans, 2012, Fact Sheet, AARP Public Policy Institute, undated.
61 Projected labor force participation rates for Massachusetts were estimated by making adjustments to the 2016 labor force participation rate of age-gender groups of Massachusetts residents that is proportionate to the change in the U.S. labor force participation rates of the same age-gender groups between 2016 and 2020 (projected) and between 2016 and 2026 (projected).
62 Frank Levy and Richard Murnane, The New Division of Labor: How Computers are creating the Next Job Market, Princeton University Press, 2004.
63 Mike Collas, “Delphi, Mobileye Join Forces to Develop Self-Driving System,” Wall Street Journal, August 23, 2016.
64 Carl Frey and Michael Osborne, “The Future of Employment: How Susceptible are Jobs to Computerization?” Journal of Economic Literature, July 2013.
65 Basel Kayyali, Zeb Kimmel and Steve van Kuiken, “Spurring the Market for High-Tech Home Health care.” McKinsey & Co, September 2011.
66 Cohn, D’Vera and Paul Taylor, “Baby Boomers Approach 65 – Glumly”, Pew Research Center, December 20, 2010 (http://www.pewsocialtrends.org/2010/12/20/baby-boomers-approach-65-glumly/).
67 Golant, S. M. “Self-reliant older baby boomers: Are now better connected to goods, services, and care. Generations, 41(2), 2017, pp. 79-87.
68 Savoy, Tim, “Technology that can foster aging in place” The Washington Post, February 26, 2018 (https://www.washingtonpost.com/news/where-we live/wp/2018/02/26/technology-that-can-foster-ag-ing-in- place/?noredirect=on&utm_term=.d8bda7fb1f0e).
69 Eckhouse, Brian, “Self-Driving Car Pioneers Are Slowing Down After Crashes”, Bloomberg, May 2, 2018 (https://www.bloomberg.com/news/articles/2018-05-02/self-driving-car-pioneers-seen-slowing-their-roll-after- crashes).
70 Gurman, Mark and Brad Stone. “Amazon Has a Top-Secret Plan to Build Home Robots”, Bloomberg, April 23, 2018 (https://www.bloomberg.com/news/articles/2018-04-23/amazon-is-said-to-be-working-on-another-big-bet- home-robots).
71 Matuszek, Cynthia. “How Robots Could Help the Elderly Age in Their Homes” Smithsonian, August 29, 2017 (https://www.smithsonianmag.com/innovation/how-robots-could-help-elderly-age-in-their-homes-180964650/).
72 Lien, Tracey. “Now you can book Uber rides for people without accounts or smartphones – making it easier for seniors”, Los Angeles Times June 27, 2017 (http://www.latimes.com/business/technology/la-fi-tn-uber-seniors- 20170627-story.html).
73 “Meet the researcher building robots to help disabled people travel safer,” Silicon Republic, April 25, 2018 (https://www.siliconrepublic.com/machines/robotics-disabled-travel-aaron-steinfeld).
74 Tim Mullaney, “CMS Officially Adds Non-Skilled In-Home Care as Medicare Advantage Benefit,” Home Health Care News, April 2, 2018 (https://homehealthcarenews.com/2018/04/cms-officially-adds-non-skilled-in-home-care- as-medicare-advantage-benefit/).
75 Jill Cornfield, “Bankrate study: Seniors’ Income in 47 states don’t go far enough,” May 23, 2016 (https://www.bankrate.com/retirement/bankrate-study-seniors-incomes-in-47-states-dont-go-far-enough/).
76 Barbara Butrica and Howard Iams, “Projecting Retirement Income of Future Retirees with Panel Data: Results from the Modeling Income in the Near Term (MINT) Project,” Social Security Bulletin, Vol. 62, No. 4, 1999.
77 Keith Miller et. al., The Reality of the Retirement Crisis, Center for American Progress, January 26, 2015.
78 Andrew Biggs and Sylvester Scheiber, “Is there a Retirement Crisis?”, National Affairs, Summer 2014.
36 For a family of three, CHIP eligibility for uninsured children aged 0 to 18 is 305 percent of the national poverty threshold. See: “Medicaid and CHIP Income Eligibility Limits for Children as a Percent of Federal Poverty Level,”State Health Facts, Kaiser Family Foundation, January, 2016 (http://kff.org/health-reform/state-indicator medicaid- and-chip-income-eligibility-limits-for-children-as-a-percent-of-the-federal-poverty-level/).
37 Bruce D. Meyer, Wallace K. Mok and James X. Sullivan, The Under-Reporting of Transfers in Household Surveys: Its Nature and Consequences, National Bureau of Economic Research, Working Paper 15181, Cambridge, July 2009.
38 Op. Cit., Hayley Gleason, 2018.
39 Op. Cit., Hayley Gleason, 2018.
40 Most employers try to match clients with staff who live nearby. However, we did hear from some workers and employers that travel time and costs can be a burden for workers. Additionally, some employers stated that there are some regions of the state where it is difficult to serve clients because of the lack of workers nearby with adequate transportation.
41 Op. Cit., Hayley Gleason, 2018.
42 Ibid.
43 There are several different levels of home care worker that have different tasks, training requirements, and reimbursement and pay rates. We heard from both workers and employers that workers are allocated to different roles based on client need. For more information see: (http://c.ymcdn.com/sites/hcacouncil.org/resource/resmgr/2013mhcaidecareerladder.pdf).
44 Since these individuals spread their weekly hours over several employers and rarely work for a single employer for more than forty hours per week, they seldom if ever receive overtime pay. Like any “moonlighters” who work more than 40 hours per week, these individuals do not receive overtime pay for hours worked on their second or third job.
45 Op. Cit., Hayley Gleason, 2018.
46 Op. Cit., Hayley Gleason, 2018.
47 Gary D. Alexander. Statement of Gary D. Alexander, Secretary of Public Welfare, Commonwealth of Pennsylvania Before the Senate Budget Committee, United States Senate, February 2013.
48 As we observed in a prior section, only a very small share of workers employed in these occupations receive cash public assistance payments. Most of the public assistance benefits received by these workers are in the form of in- kind subsidies, which unlike cash assistance, have very restricted uses.
49 Op. Cit., Hayley Gleason, 2018.
50 Op. Cit., Hayley Gleason, 2018.
51 Ibid.
52 Gary Burtless, Does the Government Subsidize Low-Wage Employers? Brookings Institution, Real Clear Markets, July 15, 2015.
53 It is important to note that the definition of disability is not connected to employment status. Indeed, more than one-third of all persons aged 16-64 with disabilities are employed. See: Neeta Fogg, Paul Harrington and Brian McMahon, “The Impact of the Great Recession upon the Unemployment of Americans with Disabilities”, Journal of Vocational Rehabilitation, vol. 33, June 2010.
54 Henry Renski and Susan Strate, Long-term Population Projections for Massachusetts Regions and Municipalities, Donahue Institute, University of Massachusetts, March 2015.
55 For a discussion of elder frailty, see Frank Lally and Peter Crome, “Understanding Frailty,” Postgraduate Medical Journal, January 2007.
56 Andrew Kochera, Audrey Straight and Thomas Guterbock, Beyond 50.05: A Report to the Nation on Livable Communities: Creating Environments for Successful Aging, American Association for Retired Persons, undated.
57 Susan Reinhard et. al., “Valuing the Invaluable: 2015 Update,” Insight on the Issues, AARP Public Policy Institute, July 2015.

75
98 Ibid.
99 Marc Cohen, “Economic Benefits of Private Long-Term Care Insurance,” The State of Long-Term Care Insurance: The Market, Challenges and Future Innovations, Eric C. Nordman (ed.), National Association of Insurance Commissioners & the Center for Insurance Research, May 2016.
100 Dimitris Karapiperis and Eric Nordman, “Forward” in The State Of Long-Term Care Insurance: The Market, Challenges and Future Innovations, Eric C. Nordman (ed.), National Association of Insurance Commissioners & The Center for Insurance Research, May 2016, p. 2.
101 Dan Kadlec, “Do You Really Need a Long-Term Care Plan?” Money Magazine”, May 2014.
102 Gregory D. Singer and Michael Schmid, “The Financial Sweet Spot for Long-Term Care Insurance,” Trusts and Estates, June 24, 2014.
103 National Health Expenditures Historical Tables, Centers for Medicare and Medicaid, Tables 14 and Table 15, various years.
104 National Health Expenditures Data, State Residence Tables, Center for Medicare and Medicaid, Table 1, Table 6 and Table 7, various years.
105 Long Term Care Costs Across the United States, Genworth Cost Care Survey, 2017. (https://www.genworth.com/aging-and-you/finances/cost-of-care.html).
106 Leora Frieberg, Wenliang Hou, Wei Sun and Anthony Web, “Long-Term Care: How Big a Risk”, Center for Retirement Research, Boston College, November 2014.
107 Center for Medicare and Medicaid, National Health Expenditure Projections, 2017-2026: Forecast Summary (https://www.cms.gov/Research-Statistics-Data-and-Systems/Statistics-Trends-and-Reports/NationalHealthExpendData/Downloads/ForecastSummary.pdf).
108 CMS recently announced that beginning in 2019, non-medical care can be provided under Medicare Advantage programs. Details as to how this will work are not yet available.
109 Wan He and Luke J. Larsen, Older Americans with a Disability: 2008-2012, U.S. Bureau of the Census, American Community Survey Reports, ACS-29, U.S. Government Printing Office, Washington, DC, 2014.
110 The BLS occupational projections program is part of a much larger employment projections program that includes national labor force projections, national gross domestic product projections, employment by industry projections as well as the occupational projections. For a description of the most recent round of national projections see: Lacey, Alan T., Mitra Toossi, Kevin S. Dubina, and Andrea B. Gensler, “Projections Overview and highlights: 2016-26”, Monthly Labor Review, October 2017. 111 U.S. Bureau of Labor Statistics, Employment Projections, Chapter 13, Handbook of Methods, Washington DC undated (http://www.bls.gov/opub/hom/about.htm).
112 Neeta Fogg, Paul Harrington and Anja Petrovich, “Building Blocks of Labor Market Success: Evidence from O*NET Job Analysis Surveys”, Commonwealth Corporation, April 2013.
113 For a complete discussion of this topic, see Wade Petty and Patrick Hu, “BLS Establishment Survey National Estimates Revised to Incorporate March 2013: Special Notice: Historical Reconstruc-tion for Services for the Elderly and Disabled and Fund and Trusts and Other Financial Vehicles,” CES-National Benchmark Article, U.S. Bureau of Labor Statistics, February 7, 2014. “The Quarterly Census of Employment and Wages (QCEW) program determined that UI records from a number of state programs that provide funding for Services for the elderly and disabled, North American Industry Classification System (NAICS) 624120, were incorrectly coded as being in Private households, NAICS 814. With the first quarter of 2013, QCEW began coding this employment under NAICS 624120. This change moved the employment from a previously out of-scope industry to in-scope for the CES program, prompting a historical reconstruction to account for the employment in these state administered programs.”
114 For detail, see U.S. Census Bureau. “Current Population Survey: Interviews Reference Manual”, April 2015, http://www2.census.gov/programssurveys/cps/methodology/intman/CPS_Manual_April2015.pdf.
115 These two pension plan-related questions are: q74a. Other than Social Security did (ANY) employer or union that (name/you) worked for in 20XX have a pension or other type of retirement plan for any of its employees? 1. Yes 2. No., and q74b. (Were/Was) included in that plan? 1 Yes 2 No.
79 Gretchen Jacobson, Shannon Griffin, Tricia Neuman, and Karen Smith, “Income and Assets of Medicare Beneficiaries, 2016-2035, Issue Brief, The Henry J. Kaiser Family Foundation, April 21, 2017 (https://www.kff.org/medicare/issue-brief/income-and-assets-of-medicare-beneficiaries-2016-2035/).
80 Income included social security, pensions, earnings, and other income sources, including income from assets, rental income, and retirement account withdrawals. The study presents income per person; for married couples, income is equally divided between spouses to calculate per capita income.
81 Total savings include retirement account holdings (IRAs, 401K), and other financial assets, including savings accounts, bonds, and stocks. Similar to incomes, savings are presented on a per capital basis; for married couples savings are equally divided between spouses to calculate per capita savings.
82 Gretchen Jacobson, Shannon Griffin, Tricia Neuman, and Karen Smith, April 2017, Op. Cit.
83 A state study of wealth was undertaken in recent years, but in our view, the number of observations available in that study was insufficient to prepare reliable measures of wealth in the Commonwealth. We believe the SCF national findings provide more reliable and therefore useful insight into considerations of net wealth, its distribution and meaning for LTC finance in Massachusetts.
84 Vincent Bodnar, “The Long-Term Care Insurance Puzzle: The Lack of Private Penetration”, in The State of Long Term Care Insurance: The Markets, Challenges and Future Innovations, Eric C. Nordman (ed), National Association of Insurance Commissioners and the Center for Insurance Research Policy, May 2016.
85 Marissa Favreault and Judith Dey, Long-Term Services and Supports for Older Americans: Risks and Financing, Issue Brief, Department of Health and Human Services, Office of Disability, Aging and Long-Term Care Policy, Washington, DC, 2015.
86 Vincent Bodnar, “Insurer In-Force Long-Term Care Management,” The State Of Long-Term Care Insurance: The Market, Challenges and Future Innovations, Eric C. Nordman (ed.), National Association of Insurance Commissioners & The Center for Insurance Research, May 2016 (http://www.naic.org/documents/cipr_current_study_160519_ltc_insurance.pdf).
87 Marc A. Cohen, Ramandeep Kaur, and Bob Darnell, Exiting the Market: Understanding the Factors Behind Carriers’ Decision to leave the Long-Term Care Insurance Market,’ Office of the Assistant Secretary for Planning and Evaluation, U.S. Department of Health and Human Services, July 2013.
88 Long-Term Care and Your Options for Financing It: A Massachusetts Guide, Division of Insurance, Commonwealth of Massachusetts, Boston, 2016.
89 Marc A. Cohen, “The State of the Long-Term Care Insurance Market”, The State of Long-Term
Care Insurance: The Market, Challenges and Future Innovations, Eric C. Nordman (ed.), National Association of Insurance Commissioners & The Center for Insurance Research, May 2016.
90 Kevin M. McCarthy, “State Regulator Views on LCTI: Florida,” The State of Long-Term Care Insurance: The Market, Challenges and Future Innovations, Eric C. Nordman (ed.), National Association of Insurance Commissioners & The Center for Insurance Research, May 2016.
91 Ibid.
92 Jeffrey Brown and Amy Finkelstein, “Insuring Long-Term Care in the United States,” Journal of Economic Perspectives, Number 4, Fall 2011.
93 Mark A. Cohen, op. cit., May 2016.
94 Authors interview with officials of the Massachusetts Division of Insurance.
95 Vincent Bodnar, “The Long-Term Care Puzzle,” The State of Long-Term Care Insurance: The Market, Challenges and Future Innovations, Eric C. Nordman (ed.), National Association of Insurance Commissioners & The Center for Insurance Research, May 2016; Joseph M. Weiner, et al., Findings from the Survey of Long-Term Care and Awareness and Planning, Research Brief, Office of the Assistant Secretary for Planning and EvaluationU.S. Department of Health and Human Services, 2015.
96 Ibid, Vincent Bodnar, May 2016.
97 Wenliang Hou, Wei Sun and Anthony Webb, “Why Do People Lapse Their Long-Term Care Coverage?” Center for Retirement Research at Boston College, Number 15-17, October 2015.