Embed Size (px)
Citation preview
FEATURE ARTICLE
GRAVITY'S ROLE IN A MODERN EXPLORATION PROGRAM
By Gene Greene
INTRODUCTION In this age of 3-D seismic surveys, seismic inversion,
depth migration, AVO analysis and personal work stations, can gravity data contribute t o a modern exploration pro- gram? The answer is definitely yes!
The following is a n attempt t o define the role of gravity in oil and gas exploration, especially in the Gulf Coast , explaining its strengths and limitations.
Much has been written about integrated exploration programs which incorporate all geological and geophysical data available, but in practice most prospects presented to management o r to prospective investors consist only of subsurface geological information and seismic data. Many prospect generators don't realize the existence of, o r take the time and effort to use gravity data already in their files, or readily available for purchase. Most prospects can be enhanced and better defined by including information derived from a gravity survey.
Most geologic features in the sedimentary section associated with the accumulation of oil and gas are directly related to horizontal density changes of magnitudes large enough t o be mapped by a n accurate gravity survey. A partial list of such features are: anticlines, synclines, reefs, faults, and horizontal change in the thickness of salt beds, which of course include salt domes, pillows and ridges.
The map resulting from a gravity survey is a Bouguer map. A Bouguer gravity map consists of gravity values (the vertical component of the earth's gravity) which have been corrected for latitude, elevation and terrain. In the Gulf Coast these maps are reduced t o a sea level datum. The Bouguer map is the response of all the horizontal changes in density, over the mapped area, from the surface to the center of the earth. T o derive the maximum information from these data they must be "processed" and interpreted.
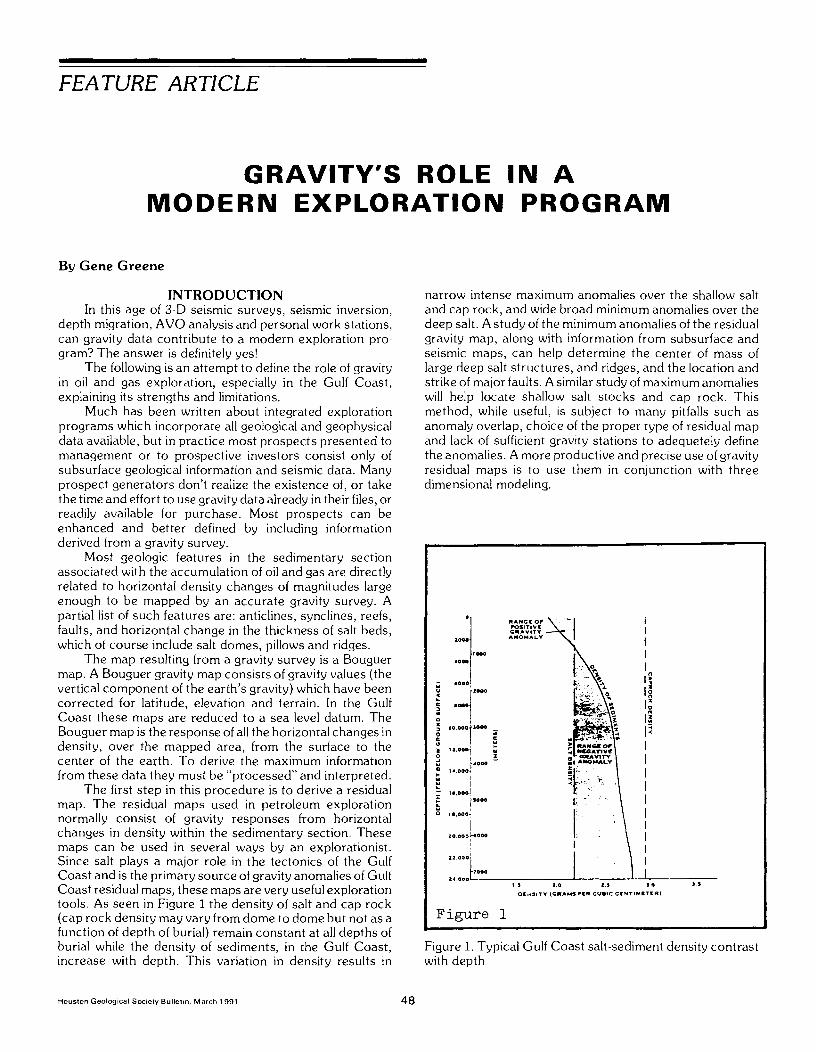
The first s t ep in this procedure is to derive a residual map. The residual maps used in petroleum exploration normally consist of gravity responses from horizontal changes in density within the sedimentary section. These maps can be used in several ways by an explorationist. Since salt plays a major role in the tectonics of the Gulf Coast and is the primary source of gravity anomalies of Gulf Coast residual maps, these maps are very useful exploration tools. As seen in Figure 1 the density of salt and cap rock (cap rock density may vary from dome t o dome but not a s a function of depth of burial) remain constant at all depths of burial while the density of sediments, in the Gulf Coast , increase with depth. This variation in density results in
narrow intense maximum anomalies over the shallow salt and cap rock, and wide broad minimum anomalies over the deep salt. A study of the minimum anomalies of the residual gravity map, along with information from subsurface and seismic maps, can help determine the center of mass of large deep salt structures, and ridges, and the location and strike of major faults. A similar study of maximum anomalies will help locate shallow salt stocks and cap rock. This method, while useful, is subject to many pitfalls such a s anomaly overlap, choice of the proper type of residual map and lack of sufficient gravity stations t o adequetely define the anomalies. A more productive and precise use of gravity residual maps is to use them in conjunction with three dimensional modeling.
Figure 1
Figure 1. Typical Gulf Coast salt-sediment density contrast with depth
Houston Geolog~cal Socnety Bullelm. March 1991 48
THE ANATOMY OF A GOOD GRAVITY SURVEY T h e following s t eps must be taken to design and
implement a gravity survey which will produce a n accura te Bouguer gravity map:
1. De te rmine t h e s h o r t e s t wavelength anomaly (smallest diameter) that will be encountered in the area t o be surveyed. This must include both the desired sedimentary anomalies and the unwanted "noise" anomalies, such a s minimum readings from near surface limestone sinks present in a reas with karst topography. This wavelength will govern the station spacing of t he entire survey. At least two samples per wavelength a r e needed t o prevent aliasing and adequately define a n anomaly. O n c e the station spacing has been determined, the entire survey should b e metered o n a square grid of this spacing.
2. T h e accuracy of the survey is dependent o n three primary factors; the proper location of the station, the measurement of t he elevation of the station and the accuracy o f the gravity meter . If we assume a ca se where the accuracy o f the gravity meter is plus o r minus ,025 milligals (.25 gravity units), the elevation accuracy must be less than plus o r minus six inches because a n error of o n e foot of elevation will c rea te a n er roneous elevation correction of .5 t o .8 gravity units. T o maintain this degree of accuracy the er ror in location of the station must b e held t o less than fifty feet.
THREE DIMENSIONAL MODELING The most powerful tool available t o the gravity inter-
preter is a three dimensional gravity modeling program designed around a n accurate and versatile calculation algorithm such a s the Talwani-Ewing (Geophysics 1960). A gravity interpreter, using constraints from subsurface and seismic da ta and sedimentary density da ta from density logs c a n construct detailed models of salt domes . Employing these models o n e can detect the presence of, a n d map, unusual shapes and overhang of a dome. The modeling program c a n be used not only t o model single structures but many s t ruc tures over a n extended a rea of d e e p sea ted salt pillows and ridges, including both the top and base of the salt. Reefs, faults, anticlines, synclines a n d igneous plugs can also be modeled by similar techniques.
T h e following is our method of employing three dimen- sional gravity modeling to obtain a n accura te map of the salt :
1. A contour map of the t op and base of the salt over the mapped a rea is drawn using all constraints from seismic and geological data.
2. Each contour of the salt s tructure map is digitized.
3. The gravity contrast between the sediments and salt, obtained from density logs, is used t o calculate the gravity response of the salt a t e ach contour level.
4. T h e gravity response from all contour levels is integrated over the entire modeled structure a n d a calculated gravity m a p is produced which has grid points identical t o the grid points of t he residual map.
5. T h e calculated map is subt rac ted from the residual map producing a difference map which shows the location and amplitude of t he misfit between the
gravity response of the models a n d the gravity response of the structures.
6. The modeled structures a r e altered and recalculated to obtain a bet ter fit between the calculated and the residual map.
7. This procedure is repeated through several itera- tions until a best fit is found, while remaining within the constraints of the seismic and subsurface da ta .
This procedure results in a structural interpretation that is the best fit of the seismic, gravity and subsurface geological data.
THE USE OF THREE-DIMENSIONAL MODELING IN THE GULF COAST
Natural a n d man-made obstacles along with permit problems prevent the explorationist f rom obtaining a n ideal gravity map. Nevertheless, in a mature area such a s the Gulf Coas t , we have the necessary information for the employ- ment of gravity modeling a s a productive exploration and exploitation tool.
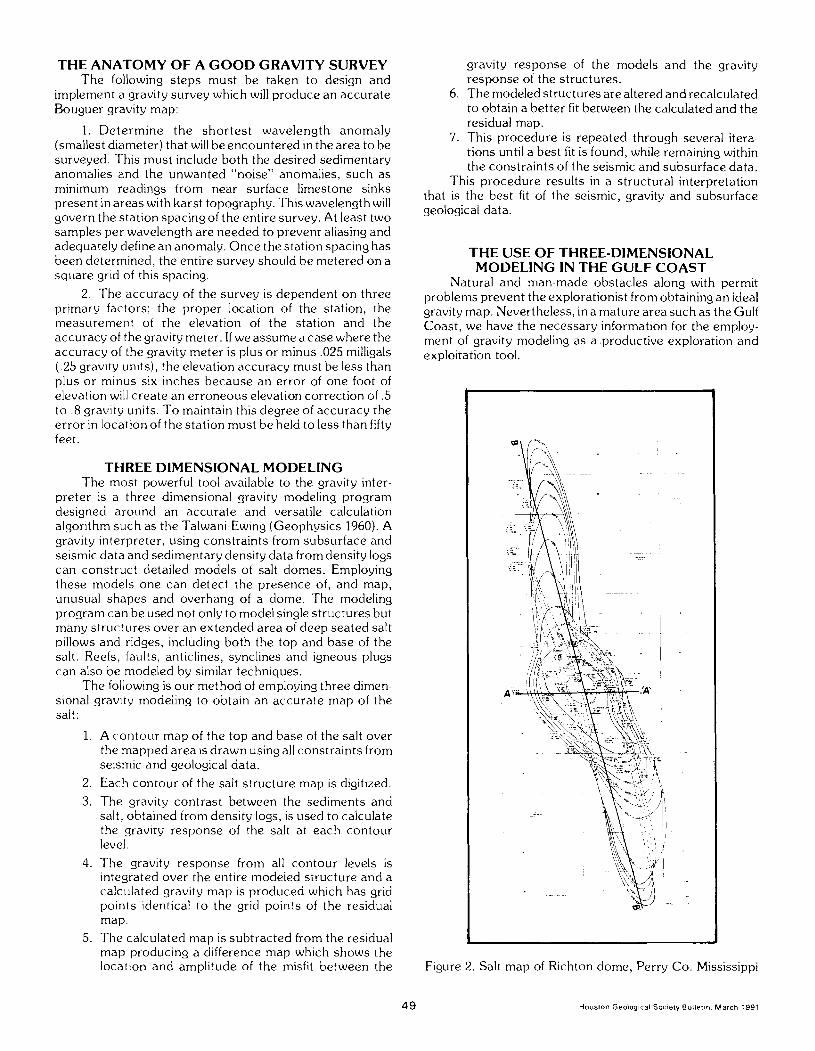
Figure 2. Salt map of Richton dome, Perry Co. Mississippi
49 Houston Geologtcal Soclely Bullatln. March 1991
Gravity maps of sufficient accuracy and station spacing for three-dimensional modeling of Gulf Coast salt domes and other structures are available for purchase. If in a particular case the station spacing is inadequate, additional gravity stations can be run at a reasonable cost. The well control is generally dense enough to provide adequate information about the depth to salt; top, thickness and density of the caprock; approximate location and depth to the domal flanks; and local variations of sedimentary densities. Seismic lines across the domes can also be used to establish constraints of their size and depth.
Salt domes Over the last few years I have modeled many of the
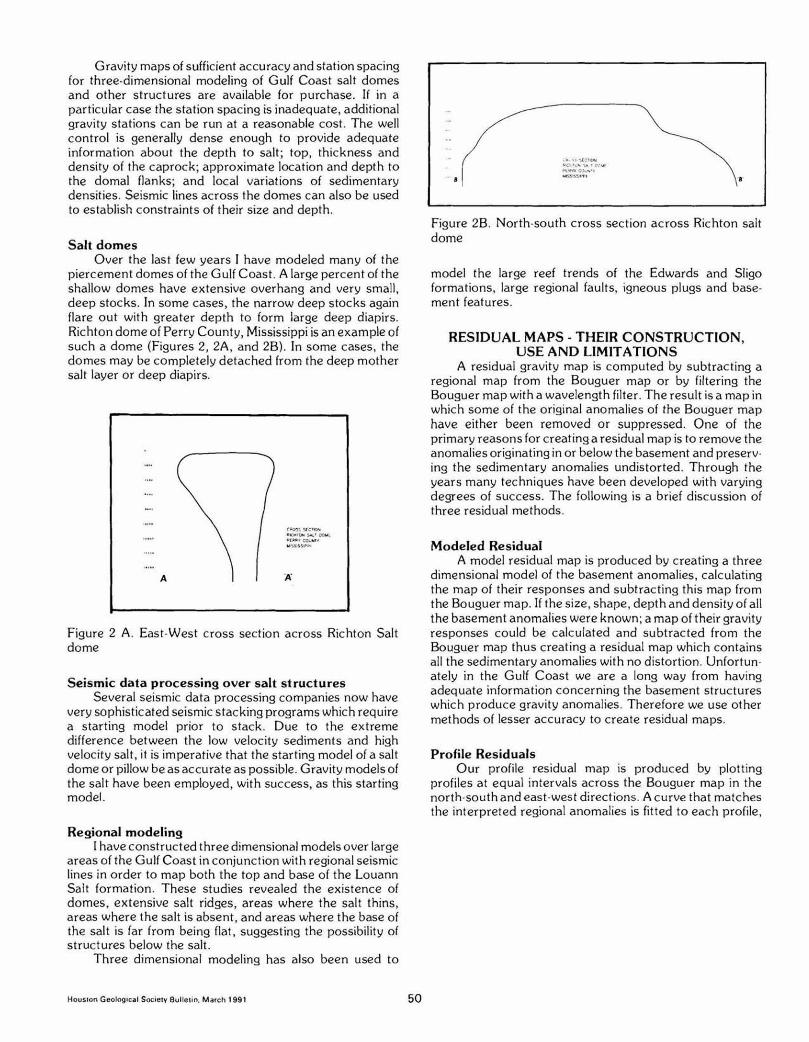
piercement domes of the Gulf Coast. A large percent of the shallow domes have extensive overhang and very small. deep stocks. In some cases, the narrow deep stocks again flare out with greater depth to form large deep diapirs. Richtondomeof Perry County, Mississippi isanexampleof such a dome (Figures 2, 2A, and 28). In some cases, the domes may be completely detached from the deep mother salt layer or deep diapirs.
Figure 2 A. East-West cross section across Richton Salt dome
Seismic da ta processing over salt s t ructures Several seismic data processing companies now have
very sophisticated seismic stacking programs which require a starting model prior to stack. Due to the extreme difference between the low velocity sediments and high velocity salt, i t is imperative that the starting model of a salt dome or pillow be asaccurate as possible. Gravity modelsof the salt have been employed. with success, as this starting model.
Regional modeling I have constructed threedimensional models over large
areas of the Gulf Coast inconiunction with reeonal seismic lines in order to map both the top and base 3 the Louann Salt formation. These studies revealed the existence of domes, extensive salt ridges, areas where the salt thins, areas where the salt is absent, and areas where the base of the salt is far from being flat, suggesting the possibility of structures below the salt.
Three dimensional modeling has also been used to
Figure 29. North-south cross section across Richton salt dome
model the large reef trends of the Edwards and Sligo formations, large regional faults, igneous plugs and base- ment features.
RESIDUAL MAPS - THEIR CONSTRUCTION, USE AND LIMITATIONS
A residual gravity map is computed by subtracting a regional map from the Bouguer map or by filtering the Bouguer map with a wavelength filter. The result is a map in which some of the original anomalies of the Bouguer map have either been removed or suppressed. One of the primary reasonsfor creatingaresidual mapis to remove the anomalies originatingin or below the basement and preserv- ing the sedimentary anomalies undistorted. Through the years many techniques have been developed with varying degrees of success. The following is a brief discussion of three residual methods.
Modeled Residual A model residual map is produced by creating a three
dimensional model of the basement anomalies, calculating the map of their responses and subtracting this map from the Bouguer map. If the size, shape, depthanddensity of all the basement anomalies were known; a map of their gravity responses could be calculated and subtracted from the Bouguer map thus creating a residual map which contains all the sedimentary anomalies with no distortion. Unfortun- ately in the Gulf Coast we are a long way from having adequate information concerning the basement structures which produce gravity anomalies. Therefore we use other methods of lesser accuracy to create residual maps.
Profile Residuals Our profile residual map is produced by plotting
~rofiles at eaual intervals across the Boucluer map in the north-southandeast-west directions. ~ c u ~ v e that matches the interpreted regional anomalies is fitted to each profile.
and all the curves from the intersecting profiles a re fitted, adjusted and combined to create a-regional map. Values from the regional map a r e then subtracted, a t each gravity station, from the Bouguer map t o create the residual map. The pitfall of this method is in determing the exact shape of the regional anomalies. In the Gulf Coas t we are fortunate that the basement over the majority of the area is deep and its resulting anomalies a r e smooth , broad and of very long wavelengths. Even in the areas where the basement is shallow, such a s the Jackson dome a n d the Sabine uplift, the basement anomalies appear t o be broad and smooth. Even though there is some overlap between sedimentary a n d basement anomalies, a profile residual constructed by a n interpreter, who is knowledgeable in the regional geology of an a rea , can produce a reliable residual map. This map will consist of sedimentary anomalies having a minimum distortion of shape a n d amplitude. We have found these residual maps ideal for modeling salt and other structures.
Wavelength Filtered and Ring Residuals Maps Prior t o the use of digital computers, gravity interpre-
te rs calculated residual maps by the ring residual method. The process was slow a n d labor intensive. The Bouguer map is gridded o n a square grid, a n d a value is recorded at each grid point. T h e interpreter then places a template of rings around each grid point a n d reads off t he gravity values around each ring. The values of each ring are average, a n d the difference between the averase value and the value a t t he center grid point is recorded a s t h e residual value for the grid point. This method is sensitive t o the dimensions of the circles used. For example a poor choice of grid spacing will distort t he residual map by either filtering out small anomalies o r by smoothing several small anomalies into a single large anomaly.
With the advent of the computer , many gravity inter- preters adopted the ring residual method a n d renamed it wavelength filtering. Many times grid points a r e created by computer gridding programs in areas where there a r e very few o r no gravity stations. In some cases the resulting residual maps a re produced without t he original gravity station location shown. Such maps contain false or badly distorted anomalies subject t o misinterpretation.
By using several rings a n d weighting factors, interpre- ters can apply the ring residual (wavelength filter) method t o more complex calculations such a s second vertical deriva- tive and upward continuation techniques.
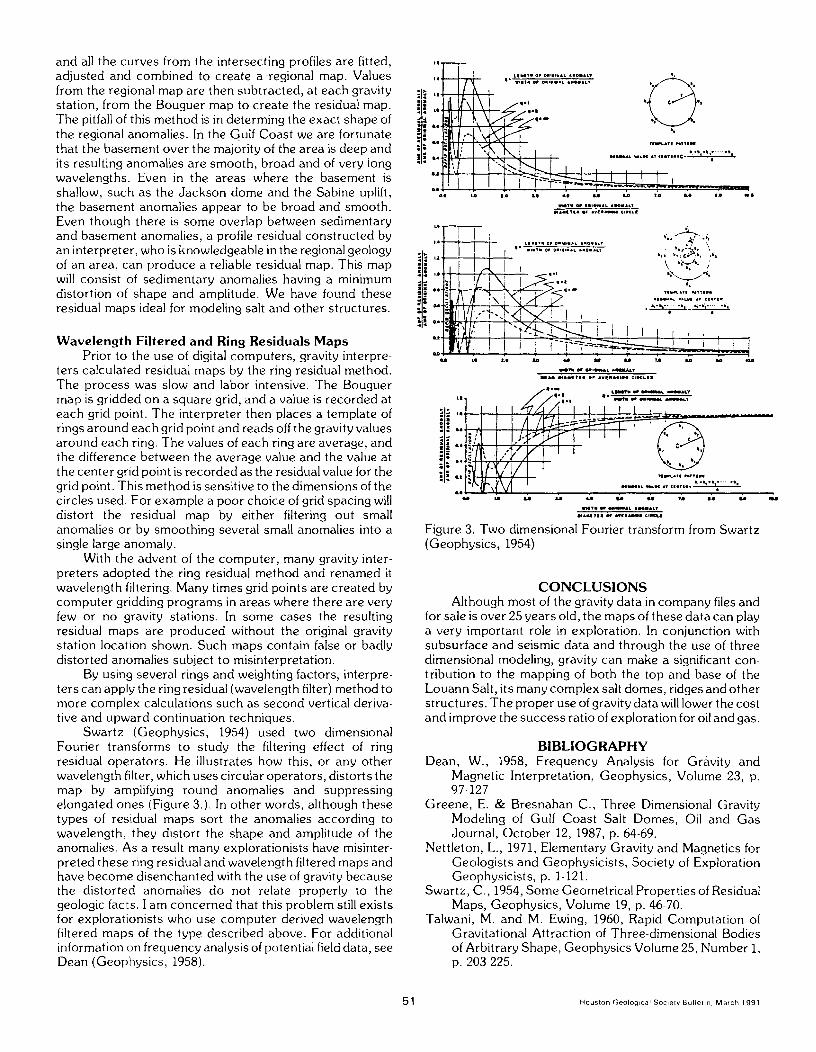
Swartz (Geophysics, 1954) used two dimensional Fourier transforms t o study the filtering effect of ring residual operators. He illustrates how this, or any o ther wavelength filter, which uses circular operators, distorts the map by amplifying round anomalies a n d suppressing elongated ones (Figure 3.). In other words, although these types of residual maps sort t he anomalies according t o wavelength, they distort the shape and amplitude of the anomalies. As a result many explorationists have misinter- preted these ring residual a n d wavelength filtered maps a n d have become disenchanted with the use of gravity because the distorted anomalies d o not relate properly to the geologic facts. I a m concerned that this problem still exists for explorationists who use computer derived wavelength filtered maps of t he type described above. For additional information on frequency analysis of potential field da ta , see Dean (Geophysics, 1958).
. . : : g.0 . . 0 0 . . . . n. a ., . . ;: .. : z I; * = :: n;
U U Y " Y . . U * . U U I U
-7 . a n m u *..,,I. Y....Y.'1.I,;
Figure 3. Two dimensional Fourier transform from Swartz (Geophysics, 1954)
CONCLUSIONS Although most of the gravity da ta in company files and
for sale is over 25 years old, t he maps of these da t a can play a very important role in exploration. In conjunction with subsurface a n d seismic data and through the use of three dimensional modeling, gravity can make a significant con- tribution t o the mapping of both the top a n d base of the Louann Salt, its many complex salt domes, ridges and other structures. T h e proper use of gravity da ta will lower the cost a n d improve the success ratio of exploration for oil and gas.
BIBLIOGRAPHY Dean, W., 1958, Frequency Analysis for Gravity and
Magnetic Interpretation, Geophysics, Volume 23, p. 97-127
Greene , E. & Bresnahan C . , Three Dimensional Gravity Modeling of Gulf Coas t Salt Domes, Oil and G a s Journal, October 12, 1987, p. 64-69.
Nettleton, L., 1971, Elementary Gravity and Magnetics for Geologists a n d Geophysicists, Society of Exploration Geophysicists, p. 1-121.
Swartz, C . , 1954, S o m e Geometrical Properties of Residual Maps, Geophysics, Volume 19, p. 46-70.
Talwani, M. a n d M. Ewing, 1960, Rapid Computation of Gravitational Attraction of Three-dimensional Bodies of Arbitrary Shape, Geophysics Volume 25, Number 1, p. 203-225.
5 1 Houston Geolog~cal Society Bul ler~n March 1991
GENE GREENE-Biographical Sketch Gene Greene is a partner in Gene Greene and
Associates, a firm specializing in the integration ol seismic, gravity and subsurface geological data. He has 37 years experience as a geophysicist in the Gulf Coast, Mid- Continent and overseas. While with Texaco, he supervised The Technical Development Group in the Bellaire Geo- physical processing and interpretation of seismic, gravity, magnetic and geological data. He served on the Technical
Advisory Board for Law Engineering Testing Company's study of the salt domes of the Gulf Coast for the National Waste Terminal Program. As Regional Geophysicist with Anadarko Production Co. he supervised all geophysical operations in the MidContinent and Gulf Coast both onshore and offshore. During the last ten years as a consullant he has mapped and made detailed three dimensional model studies ol over 150salt domes in the Gull Coast.