Embed Size (px)
Citation preview

Marine Geophysical Researches (2003) 24: 113–127 © Springer 2005DOI 10.1007/s11001-004-1336-2
Gravity analysis offshore the Canary Islands from a systematic survey
A. Carbo1, A. Muñoz-Martın1,∗, P. Llanes1, J. Alvarez1 & EEZ Working Group∗∗1Universidad Complutense de Madrid. Facultad de Ciencias Geologicas. Departamento de Geodinamica.28040 Madrid (Spain) ∗Corresponding Author (Phone: +34-913944834; Fax: +34-913944631; E-mail:[email protected])
Key words: Bouguer anomaly, Canary Islands, free air anomaly, geodynamics, gradient zone, marine gravity
Abstract
As part of a systematic mapping program of the Hydrographic and Oceanographic Research Plan for the SpanishExclusive Economic Zone (EEZ), gravity surveys were carried out offshore the Canary Islands. Using the gravitydata collected during cruises between 1998 and 2000 aboard the RV Hesperides and satellite and land data, weconstruct free air and Bouguer anomaly maps and discuss the geodynamic implications.
Using maps of Bouguer anomaly, free air anomaly, vertical derivative, long wavelength Bouguer anomaly andshort wavelength anomaly, a detailed description of the gravity characteristics of the archipelago is presented,describing gravity anomalies from a geologic point of view. The character of the crust throughout the studiedarea has been defined, as well as high gradient zones that limit crustal blocks of different density. High gradientzones have been mapped for the first time and interpreted as fracture zones, taking into account geophysical andgeological information. Gravity highs and lows have been studied and related to crustal, mantle and volcaniceffects.
Introduction
In 1995, the ‘Instituto Español de Oceanografía’ andthe ‘Instituto Hidrográfico de la Marina’ undertooka geologic and oceanographic research study of theSpanish Exclusive Economic Zone (EEZ). The mainobjectives of this research were to map the EEZ inorder to obtain bathymetric charts and to perform ageophysical survey, consisting of gravity, magneticand other information compatible with a 10 knot shipvelocity. The EEZ program involved the coopera-tion of the ‘Real Observatorio de la Armada’, whichwas responsible for magnetic data, and the ‘Departa-mento de Geodinámica, Universidad Complutense deMadrid’, responsible for gravity data. The investiga-tions of the EEZ program were carried out offshore theCanary Archipelago (Figures 1 and 2), during cruisesEEZ-1998, EEZ-1999 and EEZ-2000.
These cruises constituted the first systematic grav-ity survey performed in the Canary Islands region,providing data acquired using the same self-consistentacquisition system along quasi-regularly spaced sur-
vey tracks. The purpose of this paper is to presentconsistent, regional gravity maps of the Canary Islandsregion, and to interpret some of the geodynamic impli-cations they provide. The publication of these maps isof great interest for tectonic and geodynamics studies.Among other applications, these maps, combined withother geological and geophysical information, provideconstraints on the different tectonic models proposedto explain the origin of the Canary Islands (e.g., An-guita and Hernán, 2000; Carracedo et al., 1998), onthe structure of the island crust and upper mantle (e.g.Watts et al., 1997), on the thermal and mechanicalproperties of the oceanic lithosphere underneath thearchipelago (e.g. Canales and Dañobeitia, 1998), andon the nature of the ocean-continent transition in theregion (Watts and Marr, 1995).
Geological setting and previous geophysical work
The Canary Islands are an intraplate volcanicarchipelago formed of seven volcanic islands located
114
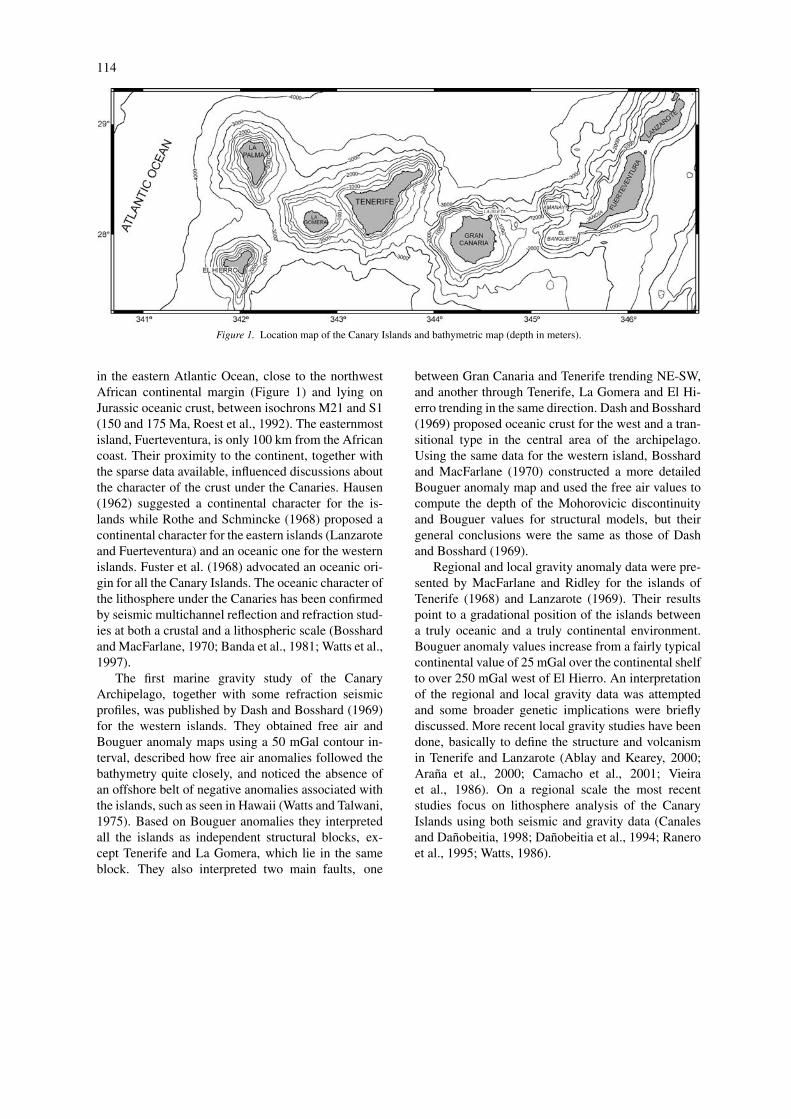
Figure 1. Location map of the Canary Islands and bathymetric map (depth in meters).
in the eastern Atlantic Ocean, close to the northwestAfrican continental margin (Figure 1) and lying onJurassic oceanic crust, between isochrons M21 and S1(150 and 175 Ma, Roest et al., 1992). The easternmostisland, Fuerteventura, is only 100 km from the Africancoast. Their proximity to the continent, together withthe sparse data available, influenced discussions aboutthe character of the crust under the Canaries. Hausen(1962) suggested a continental character for the is-lands while Rothe and Schmincke (1968) proposed acontinental character for the eastern islands (Lanzaroteand Fuerteventura) and an oceanic one for the westernislands. Fuster et al. (1968) advocated an oceanic ori-gin for all the Canary Islands. The oceanic character ofthe lithosphere under the Canaries has been confirmedby seismic multichannel reflection and refraction stud-ies at both a crustal and a lithospheric scale (Bosshardand MacFarlane, 1970; Banda et al., 1981; Watts et al.,1997).
The first marine gravity study of the CanaryArchipelago, together with some refraction seismicprofiles, was published by Dash and Bosshard (1969)for the western islands. They obtained free air andBouguer anomaly maps using a 50 mGal contour in-terval, described how free air anomalies followed thebathymetry quite closely, and noticed the absence ofan offshore belt of negative anomalies associated withthe islands, such as seen in Hawaii (Watts and Talwani,1975). Based on Bouguer anomalies they interpretedall the islands as independent structural blocks, ex-cept Tenerife and La Gomera, which lie in the sameblock. They also interpreted two main faults, one
between Gran Canaria and Tenerife trending NE-SW,and another through Tenerife, La Gomera and El Hi-erro trending in the same direction. Dash and Bosshard(1969) proposed oceanic crust for the west and a tran-sitional type in the central area of the archipelago.Using the same data for the western island, Bosshardand MacFarlane (1970) constructed a more detailedBouguer anomaly map and used the free air values tocompute the depth of the Mohorovicic discontinuityand Bouguer values for structural models, but theirgeneral conclusions were the same as those of Dashand Bosshard (1969).
Regional and local gravity anomaly data were pre-sented by MacFarlane and Ridley for the islands ofTenerife (1968) and Lanzarote (1969). Their resultspoint to a gradational position of the islands betweena truly oceanic and a truly continental environment.Bouguer anomaly values increase from a fairly typicalcontinental value of 25 mGal over the continental shelfto over 250 mGal west of El Hierro. An interpretationof the regional and local gravity data was attemptedand some broader genetic implications were brieflydiscussed. More recent local gravity studies have beendone, basically to define the structure and volcanismin Tenerife and Lanzarote (Ablay and Kearey, 2000;Araña et al., 2000; Camacho et al., 2001; Vieiraet al., 1986). On a regional scale the most recentstudies focus on lithosphere analysis of the CanaryIslands using both seismic and gravity data (Canalesand Dañobeitia, 1998; Dañobeitia et al., 1994; Raneroet al., 1995; Watts, 1986).

115
Figure 2. Track lines map. Line 1 is used in the spectral analysis of Figure 6.
Figure 3. Block diagram that shows the parameters used in ‘sea bottom corrections’ (left) and variables used in calculations (right).
Data Collection
An area of more than 124 000 km2 offshore the Ca-naries is studied here. The marine gravity data werecollected during the EEZ cruises, where a total of338,421 useful readings were obtained (Figure 2).Satellite-altimetry-derived gravity data (Sandwell andSmith, 1997) as well as data from a cruise previousto the EEZ project (Teide-95) were used to completethe study area. Land gravity data from the ‘InstitutoGeográfico Nacional’ database, distributed over theseven major islands (I.G.N., 1996), were also used toavoid border errors inside the studied area. The loca-tions of track lines together with land and satellite dataare shown in Figure 2.
The acquisition of marine gravity data was carriedout aboard the RV Hespérides using a ±1 mGal ac-curacy Bell Aerospace BGM-3 gravity system, withan automatic pitch and roll elimination. The gravitymeter used for the land link was a ±0.01 mGal accu-racy LaCoste & Romberg. The offshore gravity dataset was corrected for instrumental drift and tied intothe land network throughout the ‘Instituto GeográficoNacional’ gravity bases of Cartagena (SE of IberianPeninsula) and Las Palmas (Gran Canaria).
Ship navigation data was obtained by two simul-taneous differential GPS (DGPS) systems integratedwith RV Hespérides’ central navigation system. A lo-cal DGPS base station and a second system based ona regional base station network were used, resulting

116
in better than 5 m navigation accuracy. Water depthwas recorded with both a multi-beam echosounderSimrad EM-12S and single beam echosounder SimradEA-500.
Data Processing
Ship gravity data was merged with navigation data(date, time, ship’s speed, water depth, course, latitudeand longitude), and the Eötvos effect was corrected.Gravity data were reduced to the 1967 Geodetic Ref-erence System (GRS), the water slab was corrected us-ing a density of 1.03 g/cm3 and Free-Air and Bougueranomalies were calculated following the procedure ofNettleton (1976). Land gravity data were also reducedto the 1967 GRS using a density of 2.67 g/cm3 for theBouguer correction.
A total of 397 processed track lines, containingthe data described above, were included in a georef-erenced database. Spikes were corrected in each lineand, due to the regional character of the map, highfrequency anomalies were eliminated by a low passfilter (anomalies under 1.5 km of wavelength).
Sea bottom correction
Nettleton (1976, Chapter 5) described how to correctthe effect produced by the water slab and irregularitiesof the ocean floor. This author calls the result of ap-plying these corrections ‘Bouguer anomalies’, thoughthe corrections at sea are not exactly equal to thoseapplied on land. It should be remembered that the cor-rection for the water slab is done with a slab of watersituated below the reference level. Also, the gravityeffect produced by sea bottom irregularities, treated aspositive and negative spikes above the lower limit ofthe slab of water, are computed at sea level and canbe positive or negative. When working in areas closeto the continental slope, or in archipelagos with largebathymetric variations, these corrections should be ap-plied so that the map of gravity anomalies, obtained atsea level, reflects the distribution of the densities at thesea bottom and is not heavily affected by bathymetricirregularities.
The correction of these effects was performed foreach point at which a reading was taken, using an orig-inal computer programme (LANZADAF). The pro-gramme can be explained as follows (Figure 3). Theprogramme uses two matrixes: appearing in the first
data matrix (DM) are the geographic coordinates ofthe reading points to be corrected, their bathymetryand the free air anomaly; in the second prism matrix(PM) are the geographic coordinates of each regularprism into which the study area has been divided andtheir average depths. It is first necessary to divide thesea bottom into regular prisms with the sides definedand the altitudes equal to the average bathymetry at thebase of each prism.
The flux of the programme is carried out followingthree levels described as follows and by repeating theprocess for each reading point.(1) Bouguer slab correction. This is done in the clas-
sic way, though the density under consideration isthe negative contrast arising from the presence ofseawater and the thickness of the slab is the depthof the reading point.
(2) Creation of a residual prism matrix (RPM) withthe same geometrical disposition as in the PM. Thenew geographic coordinates and their altitude willbe established by the difference between those ofthe PM and those of the point to be corrected. Itis evident that the altitudes defined in this way willbe positive when the bottom surface in the positionof the prisms is greater than the lower limit of theslab of water used for the Bouguer correction andnegative in the opposite case (Figure 3).
(3) The sum of all the effects generated by the prismsof the RPM above the reading point and the elab-oration of a departure matrix in the appropriateformat to execute the mapping of Bouguer anom-alies. The operation will be broadened to a distanceat which the calculated effects will be irrelevant.The relative X and Y coordinates, the slab correc-tion, the depth correction, the free air anomaly andthe Bouguer anomaly are included in the departurematrix. The gravity effect of a regular prism, witha density δ over a point (Figure 3), is expressed by:
gz = γ σ
x2∫
x1
dx
y2∫
y1
dy
z2∫
z1
zdz(x2 + y2 + z
) 32
where γ is the constant of universal gravitation and σthe density of the prisms.
As a base of calculation for programming, wehave used the solution of this integral proposed byNagy (1966), because of its simplicity and appropri-ateness for the programming of the problem, althoughthere have been a great many further advances (e.g.,Plouff, 1976; Danés, 1982, Ma and Watts, 1994). In

117
Figure 4. Histogram of sea bottom terrain values obtained for allthe data.
Figure 5. Histogram of differences between calculated Bouguergravity anomalies at cross-over ship’s tracks.
a complimentary way, Nagy (1966) also executes aclassic topographical correction for nearby land ele-vations, breaking down the topography into straightprisms. This correction is necessary in cases like theCanary Islands, where altitudes of nearby emergedland reach 3500 meters above sea level.
The prism used was 2 km wide and the sea-bottom correction was extended to 22 km. The digitalelevation model used included satellite sea-bottomdata (Smith and Sandwell, 1997) and land data(ETOPO30). Statistical analysis of the sea-bottom cor-rected values showed a mean value of −1.92 mGal anda standard deviation of 6.64 mGal (Figure 4).
Levelling correction
To estimate the overall accuracy of the gravity mea-surements obtained during four different cruises,differences between gravity anomalies observed at
intersecting ships’ tracks were examined, since this isconsidered the best method to evaluate uncertainties inmarine gravity data (Talwani, 1971; Wessel and Watts,1988). The statistical cross-over analysis shows than84% of the values have differences below 10 mGaland 64% of the cross-over errors are under 5 mGal(Figure 5).
The levelling correction method used was a sta-tistical levelling that corrects errors by modelling atrend surface to the intersection errors and removingthe trend from the tie line data. To level the tie lineswe assumed that the difference between the tie lineand all crossing survey lines can be used as an esti-mate of the error along the tie line. It is reasonableto assume that the tie line should, on average, matchthe crossing lines. Any single line may be out of level,but the average of all lines should follow the correcttie line. The statistical levelling was first applied toindividual cruises and later to all the cruises togetherbecause there are some lines that cross groups of linesof other cruises.
Coherence analysis
Because interpolation of the anomaly maps includedboth ship gravity data and satellite gravity data (ERS-1, Geosat and Topex-Poseidon, from Sandwell andSmith, 1997) (Figure 6 a, b), a spectral analysis of thecoherence between both kind of data was done. Theobjective of this analysis was to check the precisionand the existence of a cut-off frequency that marked alower limit in the satellite data accuracy. The longestship track (495 km length), with an E-W direction,was selected for the analysis (Line 001, Figure 3). Inthat line, the auto- and cross-spectrum were calculatedfor free air anomaly values obtained by both ship andsatellite (Figures 6a,b). Because the sample intervalwas different in each case, about 50 m for the shipand 3500 m for the satellite, the larger sample inter-val was chosen for the analysis. To avoid aliasing, theship data were low-pass filtered before re-sampling tothe coarser interval. For that interval, we have calcu-lated the spectral density by Welch’s method (1967)of ensemble averaging of multiple overlapped win-dows, using the standard error estimates of Bendat andPiersol (1986) and following the Wessel and Smith(1995) procedure. Finally, we have plotted the spec-tra for the two sources and the coherence betweenthem. Power values are equivalent in both types ofdata (Figure 6c). The coherence has values near 1for long wave-lengths >20 km (Figure 6d), while for

118
Figure 6. Coherence analysis of free air anomaly values. a) Representation of ship and satellite free air anomaly data for Line 001, samplinginterval 3500 m. b) Ship bathymetry profile for Line 001 (located in Figure 2), sampling interval 50 m. c) Comparison of power spectrum ofship and satellite data along the line. d) Coherence analysis between ship and satellite gravity data along the line.
wavelengths shorter than 15 km, there is low coher-ence between both data sets, as also suggested by thepower values (Figures 6c,d). These data agree with theresolution of satellite data established at 22–30 km inprevious works (Yale et al., 1995). The good resultsof the coherence analysis may be due to the system-atic character and quality of the gravity data used. Thespectrum also shows that satellite data are sparse be-tween 6 and 12 km wavelength. Below this value onlythe ship data have a significant signal level. Becauseof the regional character of the research area, it ispossible to use both kinds of data to get a synthesizedmap, knowing that, for satellite data only wavelengthsabove 15 km are reliable. On the other hand, results ofthe spectral analysis of the coherence indicate that forhigh resolution studies the use of ship gravity data isessential.
Gravity maps
Map construction
All filtered offshore gravity data were merged withgravity data onshore to construct free air and Bougueranomaly maps. The combined data were interpolatedusing a Kriging algorithm that divides the search areainto six sectors. After trying different grid cell sizesand taking into account the results of the spectralanalysis, a 6 km grid cell size was chosen as themost suitable for this study. The final maps includethe anomaly contours over an illuminated coloured im-age computed from a directional derivative in the 310◦direction and were drawn using GMT software (Wes-sel and Smith, 1995). The free air anomaly map wascontoured at 10 mGal, while the Bouguer anomaly

119
Figure 7. (a) Free air anomaly map (contour interval = 10 mGal). (b) Bouguer anomaly map (contour interval = 5 mGal, except to the eastof Fuerteventura and Lanzarote where the contour interval = 10 mGal). The colour palette range has been emphasized for anomalies between125–225 mGal.
map was contoured at 5 mGal, except in the area eastof Fuerteventura and Lanzarote, where steep gravitygradients occur and a 10 mGal contour was chosen(Figures 7a and 7b).
Free air anomaly map
The free air anomaly map is shown in Figure 7a. Val-ues above 100 mGal occur above sea level, reaching asmuch as +400 mGal on the highest island. Values be-tween +100 and +50 mGal mark the submarine flanksof the islands with steep slopes. The 0 mGal representsdeep seafloor with less island influence. Minimumvalues of −75 mGal appear east of Tenerife, NE ofGran Canaria and west of Fuerteventura. Looking atthe gradual distribution, from positive values on the
island to negative values in deep areas, there is a clearcorrelation with bathymetry. This is expected, sincefree air anomalies are dominated by the large densitycontrast at the seafloor (Lin et al., 1990). As free airanomaly values have a dependence on the topographyand bathymetry, it is not possible to derive a correct in-terpretation, even qualitatively, without taking accountof bathymetry. For geological interpretations Bougueranomaly values are more useful, especially when asea bottom terrain correction is done, because theanomalies can be interpreted in terms of density vari-ations below the water slab and depth of the sourcesthat generate these variations. This allows us to makean detailed description and to be able to discuss thegravity data based on the Bouguer anomaly map.

120
Bouguer anomaly map
The Bouguer anomaly map with both sea-bottom ter-rain and topography corrections is shown in Figure 7b.The Bouguer gravity values range from +315 mGal inthe westernmost side to +30 mGal in the easternmostone. This change takes place in a steep and discon-tinuous way, shaped by three major elongated highgradient zones: near the eastern coast of Fuerteventuraand Lanzarote, across Tenerife island (both with a NE-SW orientation) and just to the west of La Palma andEl Hierro islands, with a N-S orientation. These highgradient zones separate four areas with different grav-ity responses. It is clearly observed that the CanaryIslands occupy the two zones of intermediate Bougueranomaly values (160–240 mGal). The mean value ofthe western islands is higher (220 mGal) than the east-ern ones (180 mGal). In addition to the high gradientzones, there are other effects that disturb the generalprogressive variation in the Bouguer anomaly valuesfrom east to west, such as the presence of more localhighs and lows and high gradient zones (Figures 7band 8).
There are some gravity highs of special relevancebecause of their signal amplitude: Two of them arerelated to Gran Canaria and another is centred onLa Gomera. Other gravity highs, located SW ofFuerteventura, have shorter wavelengths but consider-able amplitude (40–50 mGal).
There are some gravity lows west of Lanzarote andFuerteventura, and it is remarkable that the axis ofminimum values has a N-S direction in the channelbetween Fuerteventura and Gran Canaria. The biggestgravity lows, because of their amplitude values, arerelated to La Palma and El Hierro.
The map shows different kinds of signals, due tothe small grid side and the large size of the studiedarea. This characteristic makes it necessary to applyfrequency separation techniques to analyse the differ-ent anomalies and to avoid possible distortion due totheir superposition.
Gravity data filtering and transformation
The Bouguer anomaly map shows a combination oflong- and short-wavelength features. In order to betterdetermine gravity gradients that may indicate geologi-cal contacts between bodies of different density, and todistinguish between deeper and shallower sources, we
have applied the following filtering and transformationtechniques: A) vertical derivative maps, by taking the2-D Forward Fast Fourier Transform; and B) filteringof the Bouguer anomaly map in different wavelengthsby applying Fourier analysis (cut-off wavelength val-ues have been obtained by the 2-D spectral analysis ofthe Bouguer anomaly map described later in the text).
First vertical derivative map
The first vertical derivative enhances shorter wave-lengths, suppresses longer wavelengths and is ac-complished by multiplying the Fourier transform ofa potential field map by the wavenumber. The ef-fect is to enhance anomalies caused by abrupt lateralchanges in near-surface densities at the expense ofbroader anomalies caused by deeper or more gradualdensity changes. For this reason, the map is useful forcomparison of anomalies associated with geologicalbodies exposed at the surface. Suppression of longerwavelengths also helps in comparing and distinguish-ing trends and anomaly fabrics in various domains(Simpson et al., 1986; Jachens et al., 1989). As thefirst vertical derivative map (Figure 9) has consider-able similarities with the short wavelength Bougueranomaly map, we will discuss both maps togetherbelow.
Bouguer anomaly filtered maps
The Fourier analysis was done with the regularly-spaced Bouguer anomaly grid shown in Figure 7b.Figure 10 represents the radial-averaged power spec-trum of the Bouguer anomaly grid. It consists of anumber of linear trends, which can be interpreted interms of the mean depth to the major density contrastswithin the lithosphere following the method of Karnerand Watts (1983). We recognize two linear segmentsof differentiated slope. The steeper one is related todeep sources (mean depth = 65 km), responsible oflong wavelength anomalies (between 200 and 40 km),while the other represents the shallower sources (meandepth = 20 km), responsible for short wavelengthanomalies (between 40 and 12 km).
Using the spectral analysis results we have ob-tained two maps of filtered Bouguer anomalies, oneof long wavelengths that show deep density variationsand/or crustal flexures, and another of short wave-lengths, from which the noise has been eliminated,that represents local density variations of crustal scale.

121
Figure 8. Interpreted Bouguer anomaly map (contour interval = 5 mGal, except to the east of Fuerteventura and Lanzarote where the contourinterval = 10 mGal). Black solid lines show linear high gravity gradients. Gravity highs are represented with + symbols and gravity lows with− symbols. Dashed black line labelled as A-A′ represent an axis of gravity lows. See text for explanation.
Figure 9. First vertical derivative of the Bouguer anomaly map.
Figure 10. Radial-averaged power spectrum of Bouguer anomalymap and depth estimation for the density interfaces contributing tothe long and short wavelengths.
Long wavelength Bouguer anomaly map
The description of the long wavelength Bougueranomalies refers to the map of Figure 11a. It hassome similarities with the Bouguer anomaly map (Fig-ure 7b). As was mentioned previously, the changefrom low Bouguer anomalies in the east to highBouguer anomalies in the west takes place in a steepand discontinuous way, allowing us to define foursectors separated by three major high gradient zones:– Lanzarote – Fuerteventura Gradient Zone (LFGZ).The easternmost gradient zone is located to the east ofLanzarote and Fuerteventura. It runs in a general NE-SW direction, although near Fuerteventura it takes aNNE-SSW direction. The maximum gradient valuesare reached near Lanzarote (12 mGal/km).

122
– Tenerife Gradient Zone (TGZ). Crossing Tenerife ina NE-SW direction, there is a stronger gradient on thenorth side of the island than on the southern edge.– La Palma - El Hierro Gradient Zone (PHGZ). This isthe westernmost gradient trending N-S, and it passeswest of La Palma and through El Hierro. In areaswhere it is not modified by wavelengths related toother anomalies, it reaches a 3.5 mGal/km.
Some differentiated anomalies seen in the generalmap appear to have an overlap effect as a unique longwavelength anomaly, while there are others whoseeffects seem to be absent.
The two independent gravity highs of Lanzaroteand Fuerteventura that are seen in the unfiltered gen-eral map (Figure 7b) have a reflection as a uniqueand elongated gravity high (Figure 11a). This trendsparallel to Fuerteventura’s west coast in the long wave-length map (H1) and includes the Amanay and ElBanquete gravity highs. The various individual grav-ity highs observed in the general map in relation toGran Canaria have a unique reflection (H2). The longwavelength of this high suggests a deep source.
The gravity lows west of Lanzarote and Fuerteven-tura that appear in the general Bouguer map (Fig-ure 7b) have a possible reflection as a single gravitylow anomaly of low amplitude and a NE-SW orien-tation (L1), with its position displaced towards thenorthwest (Figure 11a).
The gravity lows located south of La Palma andeast of El Hierro are clearly visible in the long wave-length map (L2 and L3, Figure 11a) as isolated gravitylows displaced eastwards respect to their position inthe general map (Figure 7b).
Short wavelength Bouguer anomaly map
The description of the short wavelength Bougueranomalies refers to the map of Figure 11b. In this map,as well as in the vertical derivative one (Figure 9),gravity anomalies caused by shallow bodies and highgradient zones are clearly visible. A detailed descrip-tion of the most significant gradient zones, gravityhighs and gravity lows is given here:– Gradient Zone G1. This zone is an E-W trending gra-dient, located between Lanzarote and Fuerteventura.It clearly separates the gravity highs located off bothislands. The associated gradient, of at least 50 mGal,seems to separate and displace both gravity highs in adextral sense.– Gradient Zone G2. This zone is located westof Fuerteventura, separating the high values of
Fuerteventura’s west flank of some gravity lows lo-cated to the west with a NE-SW direction. A changeof 70 mGal is observed over a distance of less than15 km.– Gradient Zone G3. On the eastern flank of GranCanaria there is a high gradient zone with N-S direc-tion and a minimum Bouguer anomaly variation of 50mGal.– Gradient Zone G4. Zone G4 is located east ofTenerife and has an ENE-WSW orientation. Basedon morphological criteria, a fault has been interpretedas occurring in the same place and having the samedirection (Llanes et al., this issue). The fact that adensity contrast is observed across the fault supportsthis interpretation.– Gradient Zones G5, G6 and G7. There are threegradients with a NW-SE direction located betweenTenerife and Gran Canaria. G4 and G5 are limited onthe north and south, respectively, by a gravity highextending from Gran Canaria to Tenerife. Runningbetween Tenerife and La Gomera there is a NW-SEaxis of maximum values with a large longitudinalmanifestation whose southern limit is the G7 gradientzone.– Gradient Zone G8 is located south of La Palma andLa Gomera with a NW-SE orientation. It separates agravity high area to the south from an area of variousgravity lows to the north with a change of 20 mGal in10 km. In the northern area of gravity lows there is anisolated gravity high associated with La Gomera.– Gravity highs H9 and H10. To the SE of Lanzarotethere is a gravity high (H9) that has no continuationeither towards the north or towards Fuerteventura. Incontrast to the high located to the east, Fuerteventurahas a gravity high on the west coast and its subma-rine flank (H10). Both highs are separated by the highgradient zone G1 described above.– Gravity highs H3, H4 and H5. SW of Fuerteventurawe find three closed gravity highs. H3 is located in thesubmarine flank of the Jandía Peninsula and the othertwo gravity highs (H4 and H5) are associated with the‘Amanay’ and ‘El Banquete’ seamounts, respectively.– Gravity highs H6, H7 and H8. There are three grav-ity highs associated with Gran Canaria. The larger one,at the NW of the island (H6), is limited by gradientsG4 and G5, and shows attenuation towards Tenerife.Another gravity high is located at the submarine con-tinuation of ‘La Isleta’ peninsula (H7) and extends ina NW-SE direction. The third one appears at the southof the island (H8) with a strong gradient that reaches75 mGal in just 10 km.

123
Figure 11. Low- and high-pass filtered maps. Black solid lines show linear high gravity gradients (LFGZ, TGZ and PHGZ). Gravity highs aremarked as H and gravity lows as L. a) Long wavelength anomaly map (λ > 40 km). b) Short wavelength anomaly map (12 km < λ < 40 km).Dashed black lines (labelled as A1 to A4) represents axes of gravity highs. See text for explanation.
– Gravity high H9. La Gomera has a very well definedgravity high that is located at the north side of theisland.– Gravity lows L4 and L5. Located near La Palma,there are two remarkable gravity lows, one in the northand the other in the southern region. The southern oneexhibits a larger geographic extent and amplitude thanthe northern one.– Gravity lows L6 and L7. Two gravity lows, close toeach other, are associated with El Hierro, one towardsthe NE and the other towards the SW.
Other features that were not observed in theBouguer anomaly unfiltered map appear clearly afterfiltering. For example in the SE area of the map, near-est to the African continent, a net aspect is seen withtwo principal orthogonal directions, NE-SW (A1 andA2) and NW-SE (A3 and A4).
Geodynamic discussion of the gravity data
The new gravity data available and its qualitativeand quantitative interpretation, together with othergeologic and geophysical data, allow us to discussdifferent aspects of geodynamic interest. The mainfeatures observed in the Bouguer anomaly maps arefundamentally linked to three characteristics:– The change shown in the Bouguer anomaly values,which oscillate between 30 mGals in the eastern edgeto 320 mGal in the occidental one.– The discontinuous way this change takes place,clearly conditioned by the three high gradient zonespreviously described: LFGZ, TGZ and PHGZ (Fig-ures 8 and 11a).– The general orientation of the Bouguer anomaly con-tours. There is a NE-SW trend in the eastern area

124
(nearest to the Africa continent) which progressivelychanges to a N-S direction towards the western edge,as we advance to more ‘oceanic’ areas.
Anomaly values under 40 mGals located in the SEedge of the research area seem to indicate the presenceof continental crust. Between the values of 40 mGalsand east of Fuerteventura and Lanzarote, where valuesof 140 mGal are found, the crust has a transitionalcharacter. In this area, with values around 140 mGalto the west, change takes place abruptly at the LFGZ.
All of the study area located west of LFGZ hasBouguer anomaly values between 140 and 320 mGal,which typically correspond to oceanic crust (e.g. Tal-wani et al., 1965). The evolution of the anomalies inthis area is not defined in a continuous way. Thereare areas of small increments, limited by narrow highgradient zones (TGZ and PHGZ).
The Canary Islands are located between two highgradient zones, LFGZ and PHGZ (140–250 mGal)and there is a high gradient zone (TGZ) that dividesthe archipelago into two areas. The eastern islands(Lanzarote, Fuerteventura, Gran Canaria and part ofTenerife) are located in an area of lower Bougueranomaly values than the western islands (La Gomera,La Palma, El Hierro, and probably part of Tener-ife). From the PHGZ towards the west, high Bougueranomaly values are higher than 250 mGal, and couldcorrespond to normal oceanic lithosphere not affectedby hotspot volcanism.
The closer to the continent, the more pronouncedthe NE-SW orientation of the gravity anomaly con-tours becomes, hile in the west, they become moreN-S oriented. In this sense, the variation in the highgradient zones orientation confirms an increase of theoceanic influence towards the west, because they aremore parallel to the fabric of the oceanic crust.
In the island area, between LFGZ and PHGZ, thereare some closed anomalies, several tens of km indiameter. Important differences have been observedbetween them. In the western islands the anomaliesare gravity lows (L1 and L2, Figure 11a), while inthe eastern islands they are gravity highs (H1 and H2,Figure 11a). In the central islands (Tenerife and LaGomera) these types of anomalies are absent. Thedisplaced position of the gravity lows of the westernislands with respect to the centre of the islands and itshigh wavelengths suggest the influence of the uppermantle as a source for these anomalies. The gravityhighs observed in the eastern islands are eccentric forFuerteventura and centred on Gran Canaria. In thefirst case the sources can be related to crustal density
changes, flexures in the crust (as it is located near thetransitional area) and upper mantle related effects. ForGran Canaria the source of the anomaly can be associ-ated with crustal density variations and mantle relatedeffects. The absence of this kind of anomaly in relationwith Tenerife and La Gomera is of special interest.
Smaller gravity anomalies and high gradient zonesoverlie the main features, indicating the presence ofmore localized structures near the surface. Some ofthese gradients have a rectilinear layout which to-gether with other geophysical and geological informa-tion, allow us to interpret them as fracture zones: a)The E-W gravimetric gradient (G1, Figure 11b) thatseparates and displaces in a dextral sense the grav-ity highs of Lanzarote and Fuerteventura. On bothsides of this gradient the crust has different thicknessand seismic velocity characteristics (Dañobeitia andCanales, 2000); b) Another gravity gradient is theN-S oriented structure located east of Gran Canaria(G3, Figure 11b) which limits an axis of minima witha N-S orientation (Figure 8). In this area there is astrong structural control to the orientation of subma-rine canyons that sharply changes its direction to N-S,as can be seen in bathymetric maps (Llanes, 2000;Acosta et al., this issue); c) The channel betweenTenerife and Gran Canaria is structured by gravimetricgradients of NW-SE direction (G5, G6 and G7, Fig-ure 11b) and a strong structural control in this directioncan be also inferred from the morphology when look-ing at detailed bathymetry (Acosta et al., this issue).An important NE-SW fracture has been tradition-ally interpreted in this channel (Dash and Bosshard,1969; Bosshard and MacFarlane, 1970; Mezcúa et al.,1992), but there is no gravimetric evidence relatedto it. This is the area with the highest seismic activ-ity within the instrumented period. An earthquake of5.2 magnitude (09/05/1989) was provisionally inter-preted as being related to a strike-slip fault of possibleNE-SW direction (Mezcúa et al., 1992). However,there is another solution calculated for the same earth-quake (CMT Catalogue, Dziewoinski et al., 1981)as a reverse strike-slip focal mechanism that impliesthe possible presence of an E-W or a NW-SE fault.There are gravimetric gradients with both directionsin the channel, but none with a NE-SW orientation;d) The last gravimetric gradient interpreted as a faultis located between Tenerife and La Gomera with aNW-SE direction (G7). The detailed bathymetry alsoshows a strong structural control with the same direc-tion (Acosta et al., this issue). In this location, Dashand Bosshard (1969) and Bosshard and MacFarlane
125
(1970) interpreted a fault running from El Hierro toLa Gomera and Tenerife, perpendicular to the oneproposed here (G7). However, no gravity evidence tosupport this has been found on our Bouguer anomalymaps.
The gravity highs located in Fuerteventura and LaGomera (H2 and H9) are interpreted here as beingproduced by the presence of the Basal Complex thatoutcrops on both islands. The Basal Complex (Bravo,1952; Fúster et al., 1968, Ancoechea et al., 2003) isa thick Upper Cretaceous sedimentary sequence over-laid by submarine volcanoes and intruded by an in-tense NNE-SSW trending sheeted dyke swarm, whichformed in association with the location of alkalineplutons. Their outcrops have been found on three is-lands: Fuerteventura, La Gomera and La Palma. On LaPalma, the Basal Complex outcrops in the central areaof the island, where a relative gravity high is observed,but it is partially masked by two gravity lows (L4 andL5, Figure 11b). When comparing the described grav-ity highs related to the Basal Complex with that onGran Canaria, we found some similarities. Two of thedescribed gravity highs related to it (H6 and H8) havevery high relative values of Bouguer anomalies, whichcould suggest the possible presence of the Basal Com-plex near the surface (although there is no outcrop onthe island). There are also some positive anomalies ofshort wavelength and high amplitude in the submarineextension of Fuerteventura (H3, H4 and H5) that weinterpret as high density intrusive bodies.
Conclusions
From a methodology point of view it is necessary tostudy Bouguer anomaly maps and not only free airanomaly maps, in order to avoid water influence andto have enough resolution for marine geological inter-pretation. This is because Bouguer anomalies enhancesub-seafloor density changes.
From a geodynamic point of view it is remark-able that the Canary Islands have complex gravitycharacteristics. The explanation is the superpositionof different effects. The following conclusions can bedrawn on the basis of this study:– Bouguer anomaly values above 140 mGal have beenobserved for all the islands in the Canary Archipelago,which suggests an oceanic crustal character.– Two areas are differentiated by their Bouguer anom-aly values, one between 140 and 320 mGal that corre-sponds to oceanic crust, and the other under 140 mGalrelated with the transition and continental crust. The
oceanic crust, located to the west, is separated fromthe transitional crust by the high gradient zone LFGZ.– The area of oceanic crust can be divided into threebands limited by two high gradient zones, TGZ andPHGZ.– The orientation of the high gradient zones LFGZ,TGZ and PHGZ progressively varies from NE-SE, inthe eastern edge, to N-S in the western edge. This vari-ation reflects an increasing oceanic influence towardsthe east.– Circular anomalies with various tens of km in di-ameter located in the eastern and western islands mayhave different origins. The gravity lows observed inwestern islands may be related to upper mantle effects,while the gravity highs observed in the eastern islandsmay be related to mantle and crustal effects. In thecentral islands (Tenerife and La Gomera) these kindof anomalies are absent.– The gravity highs of Fuerteventura, La Gomeraand La Palma are related with the Basal Complex.The gravity highs of Gran Canaria and the areasof ‘Amanay Bank’ and ‘El Banquete Bank’, locatedsouthwest of Fuerteventura, are produced by highdensity intrusive bodies.– There are some high gravity gradients that presenta linear layout and their study, together with othergeophysical and geological information, allows us tointerpret them as fracture areas. These fracture areashave not been correctly interpreted until now or wereassigned to a different structural direction.
Acknowledgements
This work was funded by the EEZ project (Oceano-graphic and Hydrographic Research of the Span-ish Economic Exclusive Zone) and the ‘UniversidadComplutense de Madrid’. We thank the ‘Conserjeríade Educación de la Comunidad de Madrid y FondoSocial Europeo’ for pre-doctoral grants awarded toPilar Llanes and Juan Álvarez. We also thank the cap-tain, officers and crew of RV Hespérides on cruisesEEZ-98, EEZ-99 and EEZ-2000 for their cooperationat sea. Finally, we are grateful for the efforts of re-viewers whose comments have helped improved themanuscript.
References
Ablay, G.J. and Kearey, P., 2000. Gravity constraints on the structureand volcanic evolution of Tenerife, Canary Islands, J. Geophys.Res. 105 (B3): 5783–5796.

126
Acosta, J., Palomo, C., Uchupi, E., Muñoz, A., Escartin, J., Her-ranz, P. and Sanz, J.L., 1997. Morphology and seismic characterof north slope of Tenerife, Canary Island. Evidence for episodicmassive landslides, J. Geophys. Res. 102: 20325–20342.
Acosta, J., Uchupi, E., Muñoz, A., Herranz, P., Palomo, C., Balles-teros, M. and EEZ Working Group, this issue. Geologic evolutionof the Older Canary Islands: Lanzarote, Fuerteventura, Gran Ca-naria and La Gomera, with a Brief description of the avalancheson the Younger Islands: Tenerife, La Palma and El Hierro, Mar.Geophys. Res..
Ancochea, E., Fúster, J.M., Ibarrola, E., Cendrero, A., Coello, J.,Hernan, F., Cantagrel, J.M. and Jamond, C., 1990. Volcanic evo-lution of the island of Tenerife (Canary Islands) in the light ofnew K-Ar data, J. Volcanol. Geotherm. Res. 44: 231–249.
Ancochea, E., Brändle, J.L., Huertas, M.J., Cubas, C.R. and Hernán,F., 2003. The felsic dikes of La Gomera (Canary Islands): iden-tification of cone sheet and radial dike swarms, J. Volcanol.Geotherm. Res. 120: 197–206.
Anguita, F. and Hernán, F., 2000. The Canary Islands origin: aunifying model, J. Volcanol. Geotherm. Res. 103 (1–4): 1–26.
Araña, V., Camacho, A.G., García, A., Montesinos, F.G., Blanco,I., Vieira, R. and Felpeto, A., 2000. Internal structure of Tenerife(Canary Islands) based on gravity, aeromagnetic and volcanolog-ical data, J. Volcanol. Geotherm. Res. 103 (1–4): 4364.
Banda, E., Dañobeitia, J.J., Surinach, E. and Ansorge, J., 1981. Fea-tures of crustal structure under the Canary Islands, Earth Planet.Sci. Lett. 55: 11–24.
Bendat, J.S. and Piersol, A.G., 1986. Random data, 2nd revised ed.,John Wiley and Sons.
Blakely, R.J., Potential theory in gravity and magnetic applications,Cambridge University Press, Cambridge, 1–441, 1995.
Bosshard, E. and MacFarlane, D.J., 1970. Crustal structure of thewestern Canary Islands from seismic refraction and gravity data,J. Geophys. Res. 75: 4901–4918.
Bravo, T., 1952. Aportación al estudio geomorfológico y geológicode la costa de la fosa tectónica del valle de la Orotava, Bol. R.Soc. Esp. Hist. Nat., Tomo L, 1–30.
Camacho, A.G., Montesinos, F.G., Vieira, R. and Arnoso, J., 2001.Modelling of crustal anomalies of Lanzarote (Canary Islands) inlight of gravity data, Geophys. J. Int. 147: 403–414.
Canales, J.P. and Dañobeitia, J.J., 1998. The Canary Islands swell:a coherence analysis of bathymetry and gravity, Geophys. J. Int.132: 479–488.
Carracedo, J.C., Day, S.J., Guillou, H., Rodriguez Badiola, E.,Canas, J.A. and Pérez Torrado, F.J., 1998. Hotspot volcanismclose to a passive continental margin: the Canary Islands, Geol.Mag. 135 (5): 591–604.
Dañobeitia, J.J., Canales, J.P. and Dehghani, G.A., 1994. An esti-mation of the elastic thickness of the lithosphere in the CanaryArchipelago using admittance function, Geophys. Res. Lett. 21:2649–2652.
Danés, Z.F., 1982. Short note: An analityc method for the de-termination of distant terrain corrections, Geophysics 47 (10):1453–1455.
Dañobeitia, J.J. and Canales, J.P., 2000. Magmatic underplating inthe Canary Archipelago, J. Volc. Geother. Res. 103: 27–41.
Dash, B.P. and Bosshard, E., 1969. Seismic and gravity investiga-tions around the Western Canary Islands, Earth Planet. Sci. Lett.7: 169–177.
Dziewoinski, A.M., Chou, T.A. and Woodhouse, J.H., 1981. Deter-mination of earthquakes source parameters from waveform datafor studies of global and regional seismicity, J. Geophys. Res. 86:2825–2852.
Hausen H., 1962. New contributions to the geology of Gran Canary(Gran Canaria, Canary Islands), Soc. Sci. Finnica, Comment.Phys.–Math. 27 (1): 418.
I.G.N. (Instituto Geográfico Nacional de España), 1996. Banco dedatos gravimétricos de España. Ministerio de Fomento. InternalRepport.
Jachens, R.C., Simpson, R.W. and Blakely, R.J., 1989. Isostaticresidual gravity and crustal geology of the United States, Geol.Soc. Am. Bull. 172: 405–423.
Jin, Y., McNutt, M.K. and Zhu, Y., 1994. Evidence from gravity andtopography data for folding of Tibet, Nature 371: 669–674.
Karner, G.D. and Watts, A.B., 1983. Gravity anomalies and flexureof the lithosphere at Mountain Ranges, J. Geophys. Res. 88 (B–12), 10449–10477.
Lin, J., Purdy, G.M., Schouten, H., Sempere, J.C. and Zervas,C., 1990. Evidence from gravity data for focused magmaticaccretion along the Mid-Atlantic Ridge, Nature 344: 627–632.
Llanes, P., 2000. Análisis morfoestructural basado en técnicas ge-ofísicas del margen submarino centro-oriental del archipiélagoCanario, Bachelor Thesis, Universidad Complutense de Madrid,133 p.
MacFarlane, D.J. and Ridley, W.I., 1968. An interpretation of grav-ity data for Tenerife, Canary Islands, Earth Planet. Sci. Lett. 4:481–486.
MacFarlane, D.J. and Ridley, W.I., 1969. An interpretation of grav-ity data for Lanzarote, Canary Islands, Earth Planet. Sci. Lett. 6:431–436.
Mezcua, J., Buforn, E., Udías, A. and Rueda, J., 1992. Short note:Seismotectonics of the Canary Islands, Tectonophysics 208: 447–452.
Nettleton, L.L., 1976. Gravity and magnetics in oil exploration.New York, Mac Graw-Hill.
Plouff, D., 1976. Gravity and magnetic fields of polygonal prismsand application to magnetic terrain corrections, Geophysics 41:727–741.
Ranero, C.R., Torné, M. and Banda, E., 1995. Gravity andmultichannel seismic reflection constraints on the lithosphericstructure of the Canary swell, Mar. Geophys. Res. 17, 519–534.
Russo, R.M. and Speed, R.C., 1994. Spectral analysis of grav-ity anomalies and the architecture of tectonic wedging, NEVenezuela and Trinidad, Tectonics 13 (3): 613–622.
Roest, W.R., Dañobeitia, J.J., Verhoef, J. and Collete, B.J., 1992.Magnetic anomalies in the Canary Basin and the Mesozoic evo-lution of the Central North Atlantic, Mar. Geophys. Res. 14:1–24.
Rothe, P. and Schmincke, H.V., 1968. Contrasting origins of theeastern and western islands of the Canarian Archipelago, Nature218: 1152.
Sandwell, D.T. and Smith, W.H.F., 1997. Marine gravity anomalyform Geosat and ERS 1 satellite altimetry, J. Geophys. Res. 102(B-5), 10039–10054.
Smith, W.H.F. and Sandwell, D.T., 1997. Global seafloor topogra-phy from satellite altimetry and ship depth soundings, Science277: 1957–1962.
Simpson R.W., Jachens, R.C. and Blakely, R.J., 1986. A new isosta-tic residual gravity map of the Conterminous United States witha discussion on the significance of isostatic residual anomalies,J. Geophys. Res. 91 (B-8), 8348–8372.
Stillman, C.J., Fuster, J.M., Bennell-Baker, M.J., Muñoz, M.,Smewing, J.D. and Sagredo, J., 1975. Basal complex ofFuerteventura (Canary Islands) is an oceanic intrusive complexwith rift-system affinities, Nature 257: 469–470.

127
Talwani, M., Le Pichon, X. and Ewing, M., 1965. Crustal structureof the mid-ocean ridges 2. Computed from gravity and seismicrefraction data, J. Geophys. Res. 70: 341–352.
Talwani, M., 1971. Gravity in the Sea, 4 (1), edited by A. Maxwell,251–297, John Wiley, New York.
Vieira, R., Toro, C. and Araña, V., 1986. Microgravimetric surveyin the Caldera of Teide, Tenerife, Canary Islands, Tectonophysics130: 249–257.
Watts, A.B., 1994. Crustal structure, gravity anomalies and flexureof the lithosphere in the vicinity of the Canary Islands, Geophys.J. Int. 119: 648–666.
Watts, A.B. and Talwani, M., 1975. Gravity Field of the NorthwestPacific Ocean Basin and its Margin: Hawaii and Vicinity, TheGeological Society of America, Inc., Map and Chart Series MC-9.
Watts, A.B. and Marr, C., 1995. Gravity anomalies and the thermaland mechanical structure of rifted continental margins, in RiftedOcean-Continent Boundaries, NATO Science Series II: Mathe-matics, Physics and Chemistry, 463, edited by E. Banda et al.,Kluwer Academic Publishers, Dordrecht, 65–94.
Watts, A.B., Pierce, C., Collier, J., Dalwood, R., Canales, J.P. andHenstock, T.J., 1997. A seismic study of lithosphere flexure inthe vicinity of Tenerife, Canary Islands. Earth Planet. Sci. Lett.146: 431–447.
Welch, P.D., 1967. The use of Fast Fourier Transform for the esti-mation of power spectra: a method based on time averaging overshort, modified peridograms, IEEE Transactions on Audio andElectroacoustics, vol. AU-15, 2.
Wessel, P. and Watts, A.B., 1988. On the Accuracy of MarineGravity Measurements, J. Geophys. Res. 93 (B-1): 393–413.
Wessel P. and Smith, W.H.F., 1995. New Version of the GenericMapping Tools (GMT), http:/www.agu.org/eos_els, AmericanGeophysical Union.
Yale, M.M., Sandwell, D.T. and Smith, W.H.F., 1995. Comparisonof along-track resolution of stacked Geosat, ERS 1, and TOPEXsatellite altimeters, J. Geophys. Res. 100 (B-8), 15117–15127.
Ye, S., Canales, J.P., Rihm, R., Dañobeitia, J.J. and Gallart, J., 1999.A crustal transect through the northern and northeastern part ofthe volcanic edifice of Gran Canaria, Canary Islands, J. Geodyn.28: 3–26.