Embed Size (px)
Citation preview

Graves - Chapple
Research Center
2011 Annual Report
Northwest Missouri Demonstration Site
http://extension.missouri.edu/atchison/Graves/Main%20page.htm
Page 2
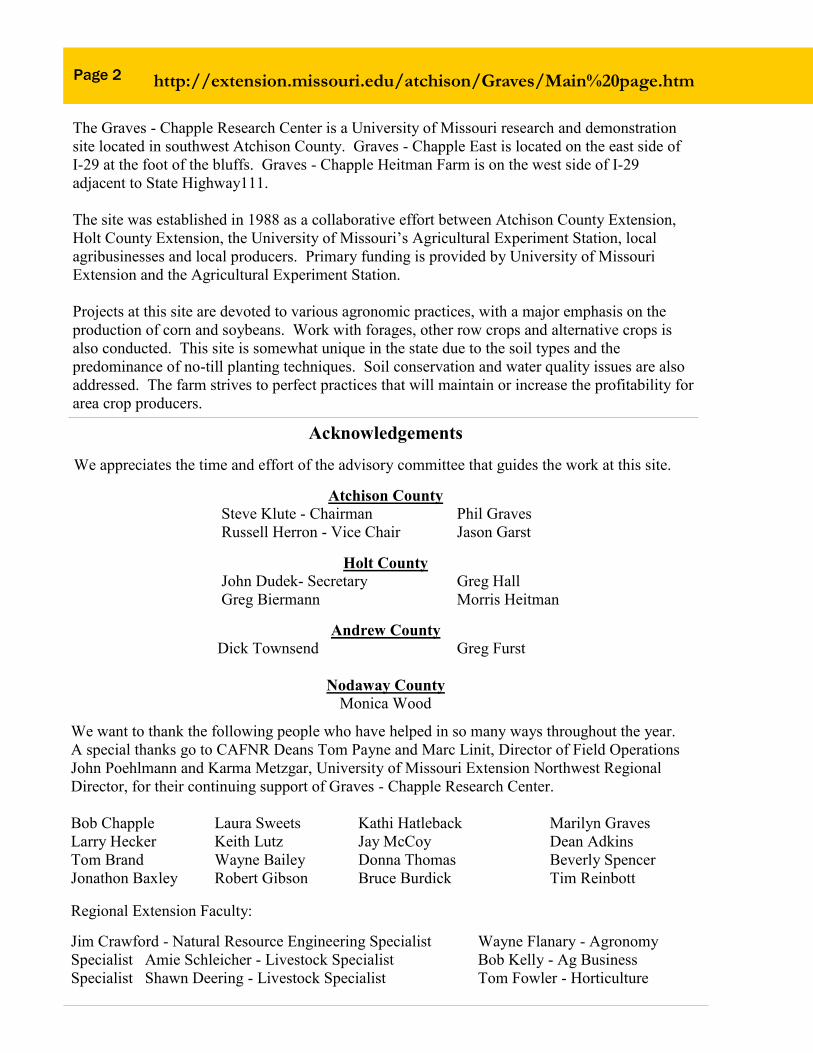
The Graves - Chapple Research Center is a University of Missouri research and demonstration
site located in southwest Atchison County. Graves - Chapple East is located on the east side of
I-29 at the foot of the bluffs. Graves - Chapple Heitman Farm is on the west side of I-29
adjacent to State Highway111.
The site was established in 1988 as a collaborative effort between Atchison County Extension,
Holt County Extension, the University of Missouri’s Agricultural Experiment Station, local
agribusinesses and local producers. Primary funding is provided by University of Missouri
Extension and the Agricultural Experiment Station.
Projects at this site are devoted to various agronomic practices, with a major emphasis on the
production of corn and soybeans. Work with forages, other row crops and alternative crops is
also conducted. This site is somewhat unique in the state due to the soil types and the
predominance of no-till planting techniques. Soil conservation and water quality issues are also
addressed. The farm strives to perfect practices that will maintain or increase the profitability for
area crop producers.
Acknowledgements
We appreciates the time and effort of the advisory committee that guides the work at this site.
Atchison County
Steve Klute - Chairman Phil Graves
Russell Herron - Vice Chair Jason Garst
Holt County
John Dudek- Secretary Greg Hall
Greg Biermann Morris Heitman
Andrew County
Dick Townsend Greg Furst
Nodaway County
Monica Wood
Regional Extension Faculty:
Jim Crawford - Natural Resource Engineering Specialist Wayne Flanary - Agronomy
Specialist Amie Schleicher - Livestock Specialist Bob Kelly - Ag Business
Specialist Shawn Deering - Livestock Specialist Tom Fowler - Horticulture
We want to thank the following people who have helped in so many ways throughout the year.
A special thanks go to CAFNR Deans Tom Payne and Marc Linit, Director of Field Operations
John Poehlmann and Karma Metzgar, University of Missouri Extension Northwest Regional
Director, for their continuing support of Graves - Chapple Research Center.
Bob Chapple Laura Sweets Kathi Hatleback Marilyn Graves
Larry Hecker Keith Lutz Jay McCoy Dean Adkins
Tom Brand Wayne Bailey Donna Thomas Beverly Spencer
Jonathon Baxley Robert Gibson Bruce Burdick Tim Reinbott
http://extension.missouri.edu/atchison/Graves/Main%20page.htm

Page 3
Topic Page
From the Staff ........................................................................................................................ 4
Farm Sponsors ....................................................................................................................... 5
Tillage Systems in Corn ......................................................................................................... 6
Tillage Systems in Soybeans ................................................................................................. 8
Effect of Quadris Fungicide on Yield of Different Corn Hybrids ........................................ 10
The Influence of Different Corn Planting Populations at Two Yield Environments ........... 11
The Effect of Different Nitrogen Application Timings on Corn Yield ................................. 12
Effect of Different Nitrogen Products on Corn Yield ........................................................... 14
The Effect of Different Nitrogen Application Timings on Corn Yield ................................. 16
The Value of Narrow Row Spacing with a June Soybean Planting Date ............................. 17
Field Day .............................................................................................................................. 18
FFA Student Field Day ......................................................................................................... 22
2011 Graves - Chapple Research Center Daily Precipitation Data ....................................... 26
2011 Graves - Chapple Research Center Daily Temperature Data ....................................... 27
Index

Page 4
As everyone involved with agriculture knows, raising crops can be a challenge and 2011 was
no different. Parts of Northwest Missouri saw record floods while other parts received devastating
hail and wind storms. At the center, we were not spared from Mother Nature as our west side plots
were under flood water for over 3 months. While the flood waters provided excellent weed control, it
also presented us with a variety of other challenges and opportunities.
In 1988, one of the major changes occurring was the promotion of the no-till farming system.
No-till was seen as a way to reduce input costs and reduce erosion on our agricultural ground.
Agriculture was being singled out as the major source of pollution in our nations lakes and rivers.
The concept of not tilling the soil was so foreign to most farmers that the concept was thought to be
impractical in Northwest Missouri. “It will not work up here” was a common refrain. Under that
premise, the Graves-Chapple Farm was founded and has proven over the years that no-till is a viable,
profitable and environmentally friendly farming process for Northwest Missouri.
Why do we give you this background? Because the Graves-Chapple Research Center is here
to provide research based information to area producers under local conditions. While the flood was
devastating, we have chosen to look at it as an opportunity to conduct research on restoring flooded
ground to production. We are using the 2011 flood of our plots to develop information on the
impacts to the soil and how best to resume productive agriculture in these situations.
Another change in 2011 was in the name of the farm. The College of Agriculture, Food and
Natural Resources conducts research at outlying locations throughout the state. For the sake of
consistency across the state, all research locations were renamed Research Centers to more closely
represent the activities taking place at these locations. The name may have changed, but the quality
of research and demonstrations you have come to expect has not diminished.
Visitors are always welcome whether you are attending a field day, special tour, meeting, or
just passing through the area. We are pleased that you have picked up this copy of the annual report.
The information in this report is a brief overview for some of the current research and demonstrations
at the farm and we hope that you find the information beneficial to your operation.
If you are not on our mailing list or email list for flyers or meetings and would like to be,
please let us know. We encourage you to ask questions. You are the reason this center exists and
sometimes your questions or suggestions become an entire experiment or demonstration that benefits
many people.
We would also like to thank the members of our Advisory Board for their support and
guidance. Their time and efforts are greatly appreciated.
Jim Crawford Wayne Flanary
Farm Superintendent Agronomist
From the Staff

Page 5
Ag Choice, Rock Port
AgriGold Hybrids
American Family Insurance, Rock Port
Atchison County Extension Council
Atchison County Farm Bureau
Atchison-Holt Electric Coop
Burrus Power Hybrids
Citizens Bank & Trust, Rock Port
Citizens Bank of Oregon
Craig Grain
Cunningham Farms, Inc.
Danny Burke
Lois Dodd Trust
Douglas Garrison
Exchange Bank of Fairfax
Fairfax Agency
Farmers State Bank, Mound City
Farmers Supply Ag Service, Burlington
Junction
FCS Financial
Garst Seed
Grebe Farm & Home
Helena Chemical Company
Hoegemeyer Hybrids
Holt County Extension Council
Steve Joesten
Julie Joesten
Keith Lutz
Kelly’s Welding and Repair
KFEQ Radio
Supporters
KMA Radio
Larry Hecker
McCoy Repair
MFA Enterprises
MFA, Fairfax
Missouri Corn Growers Association
Missouri Valley Tractor Club
MO Valley Ag
Morning Sun Seed
Morris Heitman
Mycogen Seeds
Nodaway Bank, Mound City
Phil Graves
Pioneer Hybrids
Producers Hybrids
R&L Fine Meats
River Valley AG
Robert Gibson
Rock Port Rotary
Scheib Drainage
Scott Milne Pioneer Seed, Oregon
St. Joseph News-Press
Sur-Gro, Savannah
Sur-Gro Forest City
Syngenta
Tarkio Co-op
Taylor Seed Farms
Teresa Kurtz
Willcross Seed
Wyffels Seed
Yocum Fertilizer
We would like to thank the following companies and individuals for their contributions to this
year’s work. Their assistance is greatly appreciated.
Page 6
Objective
Methods & Materials
The objective of this demonstration is
to evaluate the effect of different tillage
systems on corn yields and profitability of the
enterprise. This is the 20th year for this
demonstration.
The four most common tillage systems
practiced in this region were used for this
demonstration. The tillage systems used
were:
Fall & Spring Disk
Spring Disk
No-till
Fall Chisel & Spring Disk
Each plot consisted of eight rows
spaced 30 inches apart and 250 feet long.
Yield results were taken from the center six
rows of each plot. The plots were planted on
May 4, 2011 with a population of 32,401
seeds/acre into a field that raised soybeans in
2010. Harvest was conducted on October 6,
2011.
Tillage Systems in Corn
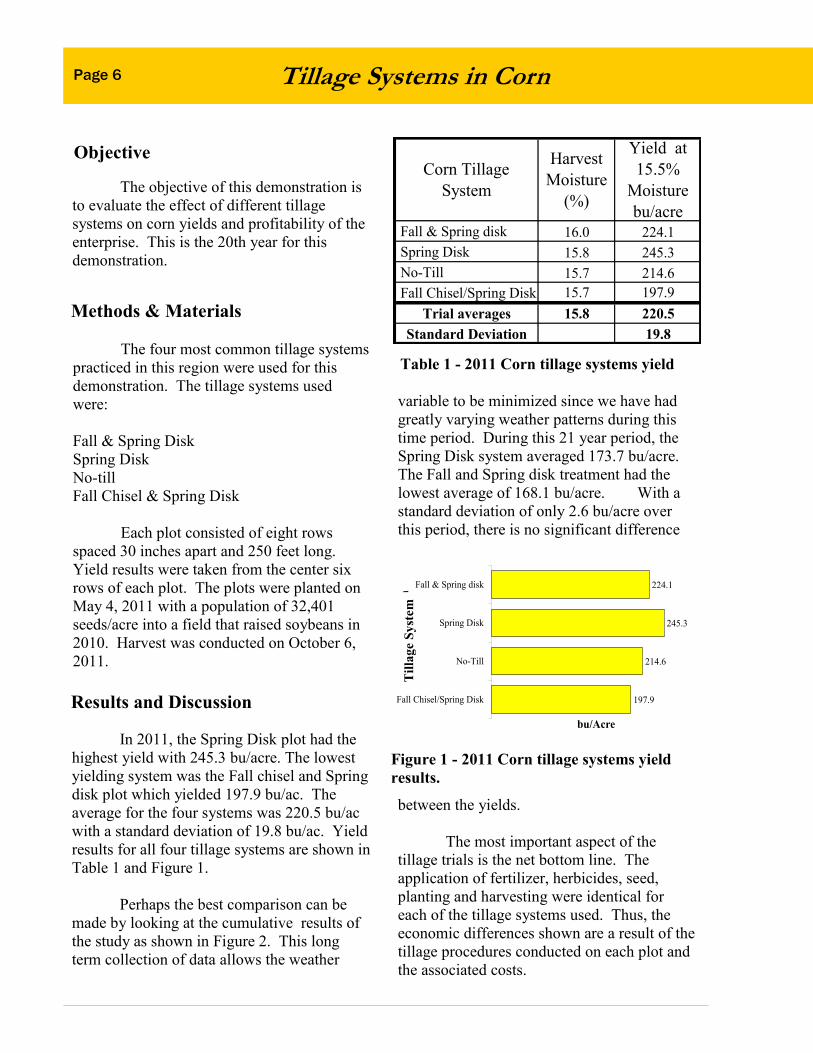
Results and Discussion
In 2011, the Spring Disk plot had the
highest yield with 245.3 bu/acre. The lowest
yielding system was the Fall chisel and Spring
disk plot which yielded 197.9 bu/ac. The
average for the four systems was 220.5 bu/ac
with a standard deviation of 19.8 bu/ac. Yield
results for all four tillage systems are shown in
Table 1 and Figure 1.
Perhaps the best comparison can be
made by looking at the cumulative results of
the study as shown in Figure 2. This long
term collection of data allows the weather
variable to be minimized since we have had
greatly varying weather patterns during this
time period. During this 21 year period, the
Spring Disk system averaged 173.7 bu/acre.
The Fall and Spring disk treatment had the
lowest average of 168.1 bu/acre. With a
standard deviation of only 2.6 bu/acre over
this period, there is no significant difference
between the yields.
The most important aspect of the
tillage trials is the net bottom line. The
application of fertilizer, herbicides, seed,
planting and harvesting were identical for
each of the tillage systems used. Thus, the
economic differences shown are a result of the
tillage procedures conducted on each plot and
the associated costs.
Figure 1 - 2011 Corn tillage systems yield
results.
197.9
214.6
245.3
224.1
Fall Chisel/Spring Disk
No-Till
Spring Disk
Fall & Spring disk
bu/Acre
Til
lag
e S
yst
em
Til
lag
e S
yst
em
Table 1 - 2011 Corn tillage systems yield
Corn Tillage
System
Harvest
Moisture
(%)
Yield at
15.5%
Moisture
bu/acre Fall & Spring disk 16.0 224.1
Spring Disk 15.8 245.3
No-Till 15.7 214.6
Fall Chisel/Spring Disk 15.7 197.9
Trial averages 15.8 220.5
Standard Deviation 19.8
Page 7
It is very difficult to estimate tillage
costs as each grower’s operating costs will be
different. Age and size of the equipment, field
shape and size as well as soil type will all
effect the tillage costs. A large variable most
seasons is fuel cost. To come up with a
standard comparison value, we used the rates
from the MU Custom Rates guidesheet for the
various tillage operations performed. These
values are based on data collected from
producers across Missouri. The most recent
guide was updated in 2009. There is no
assurance that these rates would cover a
particular producers costs. However, this is
the best estimate we can find for a comparison
One factor not considered in the
economic analysis is labor. It is almost
impossible to place a value on a producer’s
labor per hour. Therefore, no labor costs are
included in the analysis.
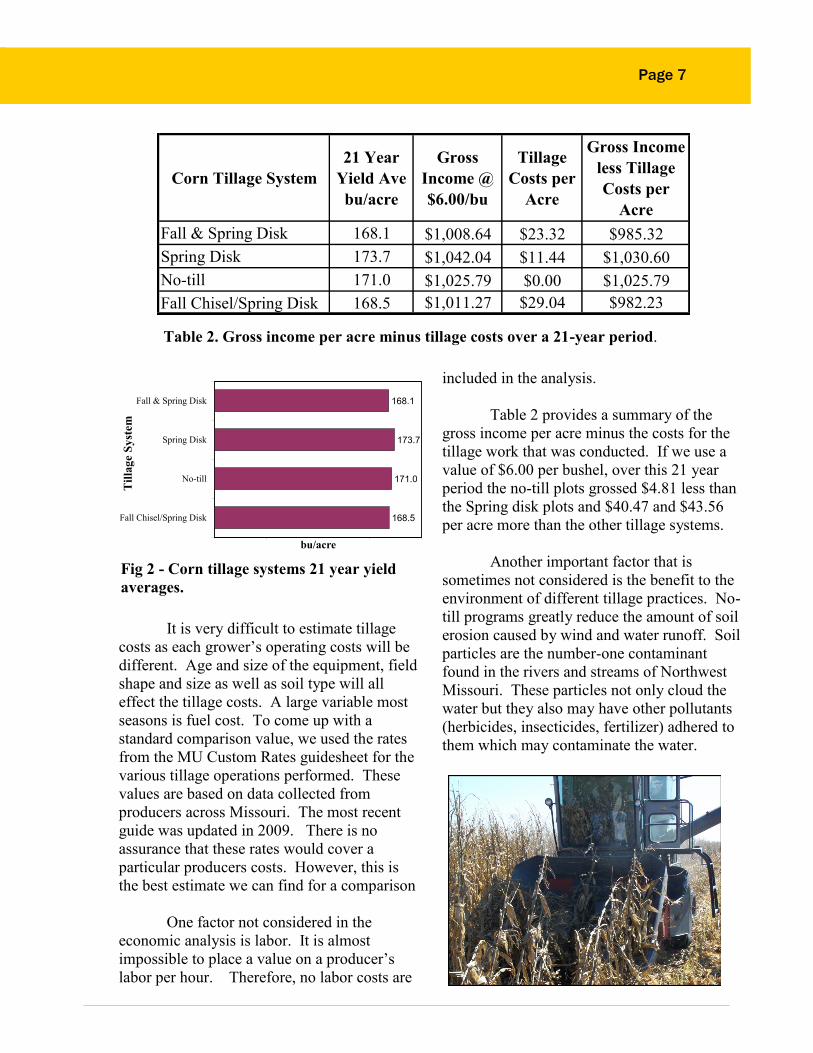
Table 2 provides a summary of the
gross income per acre minus the costs for the
tillage work that was conducted. If we use a
value of $6.00 per bushel, over this 21 year
period the no-till plots grossed $4.81 less than
the Spring disk plots and $40.47 and $43.56
per acre more than the other tillage systems.
Another important factor that is
sometimes not considered is the benefit to the
environment of different tillage practices. No-
till programs greatly reduce the amount of soil
erosion caused by wind and water runoff. Soil
particles are the number-one contaminant
found in the rivers and streams of Northwest
Missouri. These particles not only cloud the
water but they also may have other pollutants
(herbicides, insecticides, fertilizer) adhered to
them which may contaminate the water.
Fig 2 - Corn tillage systems 21 year yield
averages.
168.5
171.0
173.7
168.1
Fall Chisel/Spring Disk
No-till
Spring Disk
Fall & Spring Disk
bu/acre
Til
lage
Syst
em
Corn Tillage Trial - 21 Year Averages
Til
lag
e S
yst
em
Table 2. Gross income per acre minus tillage costs over a 21-year period.
Corn Tillage System
21 Year
Yield Ave
bu/acre
Gross
Income @
$6.00/bu
Tillage
Costs per
Acre
Gross Income
less Tillage
Costs per
Acre
Fall & Spring Disk 168.1 $1,008.64 $23.32 $985.32
Spring Disk 173.7 $1,042.04 $11.44 $1,030.60
No-till 171.0 $1,025.79 $0.00 $1,025.79
Fall Chisel/Spring Disk 168.5 $1,011.27 $29.04 $982.23

Page 8 Tillage Systems in Soybeans
Disk treatment had the lowest average yield
for any of the treatments with an average of
55.5 bu/ac per year. These yields are shown
in Figure 2.
With eleven years of data, you can see
a trend developing in the yields for each
tillage method. This longer term collection of
data allows the weather variable to be
minimized since we had varying weather
patterns during this time period. The ten year
average for all the plots is 56.5 bu/acre with
only a 0.7 bu/acre standard deviation. This is
not a significant variation between the various
tillage systems.
Objective
Methods & Materials
The objective of this demonstration is
to evaluate the effect of different tillage
systems on soybean yields and profitability.
This is the tenth year for this demonstration.
The four most common tillage systems
practiced in this region were used for this
demonstration. The tillage systems used
were:
Fall Chisel & Spring Disk
No-till
Spring Disk
Fall & Spring Disk
Each plot consisted of eight rows
spaced 30 inches apart and 250 feet long.
Yield results were taken from the center six
rows of each plot. The plots were planted on
May 18, 2011 with a population of 175,402
seeds/acre into a field that was planted in corn
in 2010. Harvest was conducted on October
26, 2011.
In 2011, the highest yielding system
was the No-till plot with a yield of 68.1 bu/ac.
The lowest yielding system was the Fall and
Spring Disk plot which yielded 57.1 bu/ac.
The average yield for the four systems was
59.8 bu/ac with a standard deviation of 5.5 bu/
ac. Yield results for all four tillage systems
are shown in Table 1 and Figure 1.
If you compare the data obtained over
the eleven years of the study, the No-till
treatment has had the highest average yield for
any of the tillage methods with an average of
57.3 bu/acre per year. The Fall Chisel/Spring
Results and Discussion
Table 1 - Soybean tillage systems yield
results for 2011.
Soybean Tillage
System
Harvest
Moisture
(%)
Yield at
13.0%
Moisture
bu/acre
Fall Chisel/Spring Disk 8.5 57.8
No-till 8.5 68.1
Spring Disk 8.5 56.4
Fall & Spring Disk 8.5 57.1
Trial averages 8.5 59.8
Standard Deviation 5.5
Fig 1 - 2011 Soybean tillage systems yield
results.
57.8
68.1
56.4
57.1
Fall Chisel/Spring Disk
No-till
Spring Disk
Fall & Spring Disk
Bu/Acre
Til
lag
e S
yst
em
2010 Soybean Tillage System Yields
Til
lag
e S
yst
em

Page 9
The economic analysis follows the
trend we have seen in the corn tillage
demonstrations. The application of the
fertilizer, herbicides, seed, planting and
harvesting were identical for each of the
tillage methods used. With only a 0.6 bu/acre
variation between the treatments, the
economic difference is a result of the tillage
procedures conducted on each plot and the
associated costs. It is very difficult to
estimate tillage costs as producer's operating
costs will be different. Age and size of the
equipment, field shape and size, and soil type
will all effect the tillage costs. As with the
corn tillage demonstration, we used the 2009
MU Custom Rates guidesheet to estimate the
tillage costs for each system used.
One factor not considered in the
economic analysis is labor. It is almost
impossible to place a value on a producer’s
labor per hour. Therefore, no labor costs are
included in the analysis.
Table 2 provides a summary of the
gross income per acre minus the costs for the
tillage work that was conducted. The No-till
plots grossed between $18.10 and $49.59 per
acre more than the other tillage systems
assuming a price of $12.00 per bushel for
soybeans.
Another important factor that is
sometimes not considered is the benefit to the
environment of different tillage practices. No-
till programs greatly reduce the amount of soil
erosion caused by wind and water runoff. Soil
particles are the number-one contaminant
found in the rivers and streams of Northwest
Missouri. These particles not only cloud the
water but they also may have other pollutants
(herbicides, insecticides, fertilizer) adhered to
them which may contaminate the water.
Figure 2 - Soybean tillage eleven year yield
averages.
56.1
56.7
57.3
55.5
Fall & Spring Disk
Spring Disk
No-till
Fall Chisel/Spring Disk
bu/acre
Til
lage S
yst
em
Soybean Tillage Trial - 11 Year Averages
Til
lag
e S
yst
em
Table 2 - Gross income per acre minus tillage costs over a eleven year period.
Soybean Tillage System
11 Year
Yield Ave
bu/acre
Gross Income
@ $12.00/bu
Tillage
Costs per
Acre
Gross Income
Less Tillage
Costs per Acre
Fall Chisel/Spring Disk 55.5 $666.52 $29.04 $637.48
No-till 57.3 $687.06 $0.00 $687.06
Spring Disk 56.7 $680.41 $11.44 $668.97
Fall & Spring Disk 56.1 $672.98 $23.32 $649.66
Page 10 Effect of Quadris Fungicide on Yield of
Different Corn Hybrids
Introduction
Methods & Materials
The effect of fungicides on corn yields
has been hybrid specific. University research
indicates that if hybrids are resistant to a
particular disease, there will be little or no
benefit to treating the hybrid with a fungicide.
Check with your seed dealer regarding the
disease package of your hybrid.
Results and Discussion
An off-set boom was fabricated and
attached to the loader bucket of our spray
tractor to apply fungicides to corn after tassel.
Six rows of corn and soybeans were planted
alternating allowing one to drive in the
soybeans and reach over the corn to apply the
spray. The carrier was water applied at 23
GPA. Quadris was applied July 11th at a rate
of 1 pint per acre.
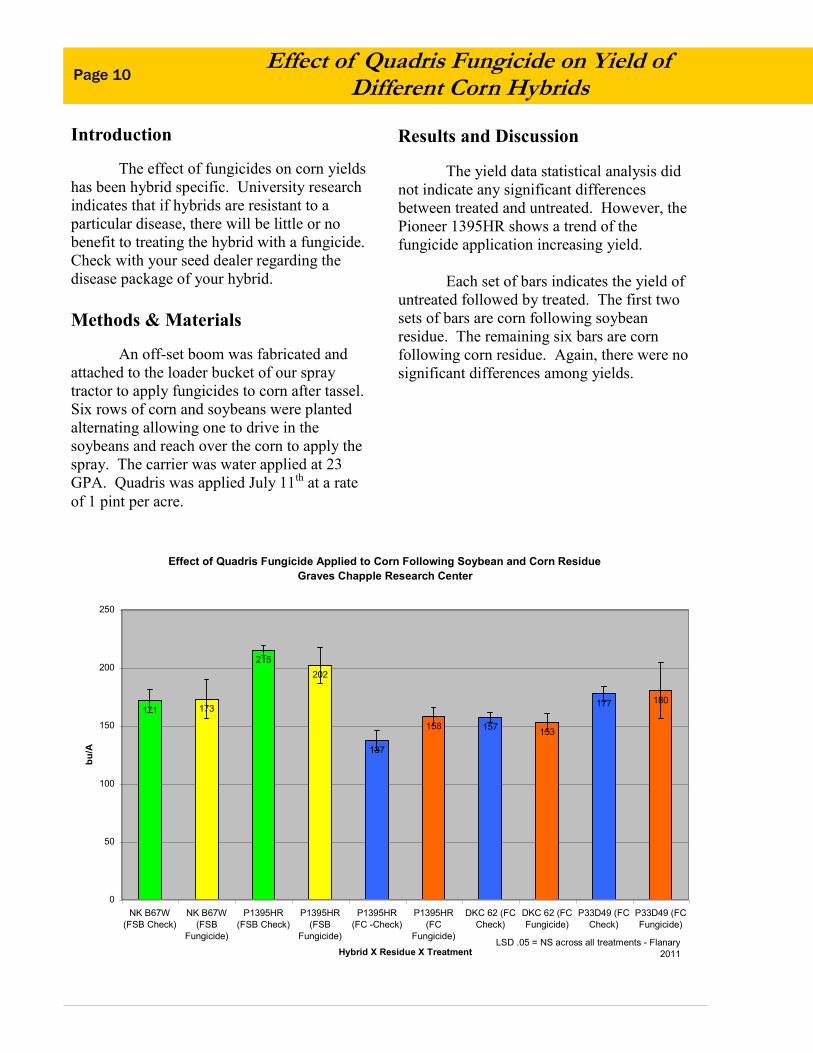
The yield data statistical analysis did
not indicate any significant differences
between treated and untreated. However, the
Pioneer 1395HR shows a trend of the
fungicide application increasing yield.
Each set of bars indicates the yield of
untreated followed by treated. The first two
sets of bars are corn following soybean
residue. The remaining six bars are corn
following corn residue. Again, there were no
significant differences among yields.
Effect of Quadris Fungicide Applied to Corn Following Soybean and Corn Residue
Graves Chapple Research Center
171 173
215
202
137
158 157153
177 180
0
50
100
150
200
250
NK B67W
(FSB Check)
NK B67W
(FSB
Fungicide)
P1395HR
(FSB Check)
P1395HR
(FSB
Fungicide)
P1395HR
(FC -Check)
P1395HR
(FC
Fungicide)
DKC 62 (FC
Check)
DKC 62 (FC
Fungicide)
P33D49 (FC
Check)
P33D49 (FC
Fungicide)
Hybrid X Residue X Treatment
bu
/A
LSD .05 = NS across all treatments - Flanary
2011
Page 11 The Influence of Different Corn Planting Populations at Two Yield Environments
Introduction
Methods & Materials
Growers are using precision
agriculture technologies to adjust corn seeding
rates. However, determining the correct
seeding rate and what criteria should be used
to change corn seeding rates is a challenge.
Issues are what criteria should be used to drive
population changes and also what should be
the magnitude of such changes
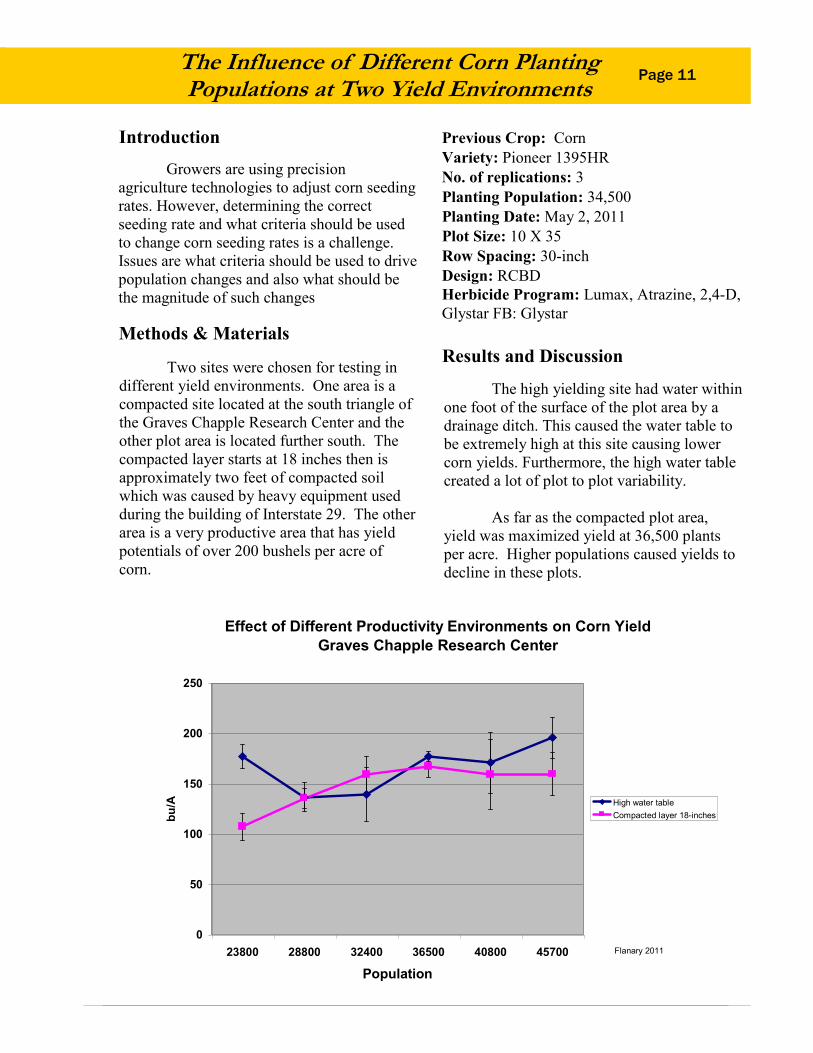
Effect of Different Productivity Environments on Corn Yield
Graves Chapple Research Center
0
50
100
150
200
250
23800 28800 32400 36500 40800 45700
Population
bu
/A High water table
Compacted layer 18-inches
Flanary 2011
The high yielding site had water within
one foot of the surface of the plot area by a
drainage ditch. This caused the water table to
be extremely high at this site causing lower
corn yields. Furthermore, the high water table
created a lot of plot to plot variability.
As far as the compacted plot area,
yield was maximized yield at 36,500 plants
per acre. Higher populations caused yields to
decline in these plots.
Results and Discussion Two sites were chosen for testing in
different yield environments. One area is a
compacted site located at the south triangle of
the Graves Chapple Research Center and the
other plot area is located further south. The
compacted layer starts at 18 inches then is
approximately two feet of compacted soil
which was caused by heavy equipment used
during the building of Interstate 29. The other
area is a very productive area that has yield
potentials of over 200 bushels per acre of
corn.
Previous Crop: Corn
Variety: Pioneer 1395HR
No. of replications: 3
Planting Population: 34,500
Planting Date: May 2, 2011
Plot Size: 10 X 35
Row Spacing: 30-inch
Design: RCBD
Herbicide Program: Lumax, Atrazine, 2,4-D,
Glystar FB: Glystar
Page 12 The Effect of Different Nitrogen Application
Timings on Corn Yield
Introduction
Methods & Materials
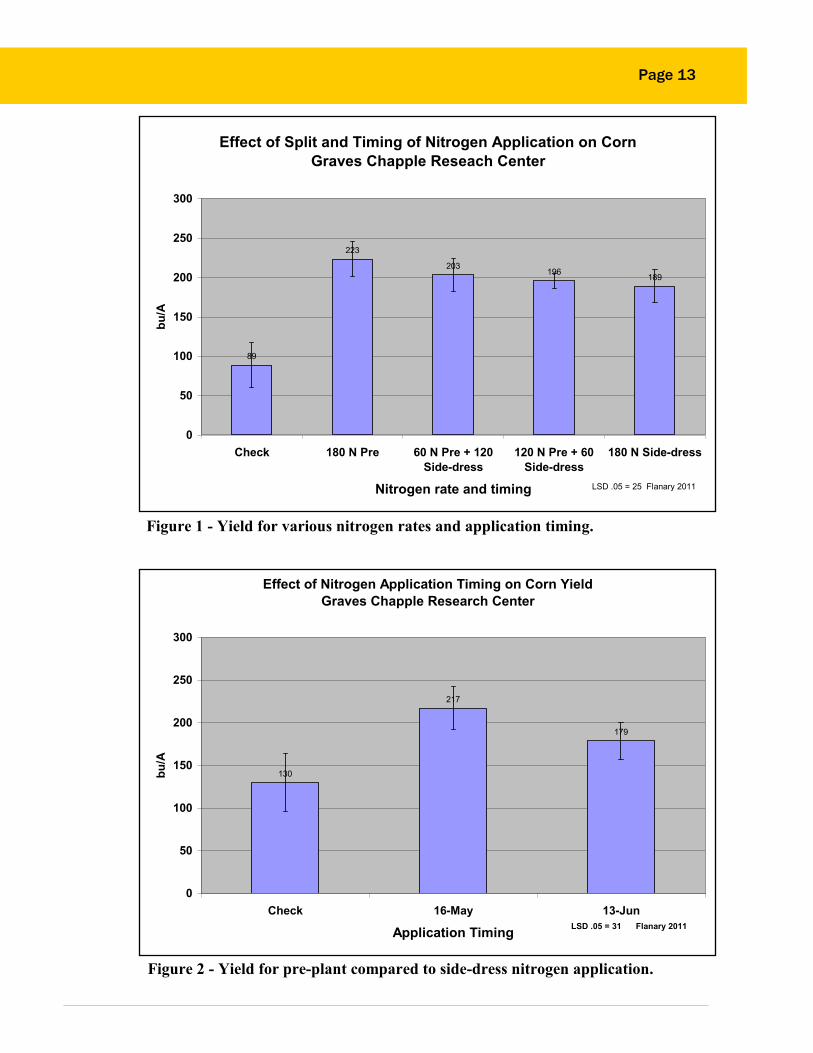
The objective is to measure impact of
split, pre and side-dress application timings of
nitrogen on corn yield. Nitrogen application
timing, given the wet springs, has created
attention with many growers adding
supplemental nitrogen to nitrogen deficient
corn and obtaining excellent responses.
Growers question whether they should split
nitrogen, or if they split nitrogen, what rates of
splits should be used.
The pre-plant nitrogen yielded
significantly better than the side-dress
application. This is the same result as in
2010. The 60 pound pre-plant followed by
120 pounds was not significantly different
from the pre-plant treatment. These results
are shown in Figure 1.
The standard deviation indicated
variability with this treatment however. We
continue to find in loess derived soils with
good drainage, that pre-plant nitrogen
applications at the time of planting perform
better than later side-dress treatments.
In another experiment looking at pre-
plant compared to side-dress nitrogen
application, the same results were found as
shown in Figure 2.
Results and Discussion
Urea treated with Agrotain was used as
the source of nitrogen. Pre-plant nitrogen
was applied May 16th and side-dress
application made June 13th. The corn planting
date was May 16th.
Previous Crop: Soybean
Variety: Pioneer 1395HR
No of treatments: 5
No. of replications: 5
Planting Population: 34,500
Planting Date: May 16, 2011
Plot Size: 10 X 35
Row Spacing: 30-inch
Design: RCBD
Herbicide Program: Lumax, Atrazine, 2,4-D,
Glystar fb Glystar
Treatments: Nitrogen applied May 17, 2011
Nitrogen Side-dressed May 17, 2011
Page 13
Effect of Split and Timing of Nitrogen Application on Corn
Graves Chapple Reseach Center
89
223
203196
189
0
50
100
150
200
250
300
Check 180 N Pre 60 N Pre + 120
Side-dress
120 N Pre + 60
Side-dress
180 N Side-dress
Nitrogen rate and timing
bu
/A
LSD .05 = 25 Flanary 2011
Figure 1 - Yield for various nitrogen rates and application timing.
Effect of Nitrogen Application Timing on Corn Yield
Graves Chapple Research Center
130
217
179
0
50
100
150
200
250
300
Check 16-May 13-Jun
Application Timing
bu
/A
LSD .05 = 31 Flanary 2011
Figure 2 - Yield for pre-plant compared to side-dress nitrogen application.
Page 14
Page 14
Objective Methods & Materials
Measure the effect of different
nitrogen fertilizer products on corn yield.
A urease inhibitor is used to prevent
volatilization. Thiophosphoric triamide,
commonly referred to as NBPT, has the trade
name Agrotain. This product inhibits the
urease enzyme that converts urea to ammonia.
The addition of this product reduces the
potential volatilization of surface applied urea
containing products.
Nitrification inhibitors retard the
conversion of ammonium to nitrate. The
nitrate form of nitrogen is susceptible to losses
by denitrification or leaching. The benefit
from using an inhibitor varies. Soil
conditions, time of year, type of soil,
geographic location, rate of nitrogen
application, and weather conditions that occur
after the nitrogen is applied and before it is
absorbed by the crop affect the value of
nitrification inhibitors.
Super U contains the urease inhibitor
Agrotain and a nitrification inhibitor DCD
(dicyandiamide).
ESN stands for Environmentally Smart
Nitrogen and is manufactured by Agrium.
Polymer coated urea has a special polymer
coating. Water moves through coating to
dissolve urea. The nitrogen diffuses through
the porous polymer membrane.
Nitrogen products were applied at the
rate of 180 pounds of nitrogen per acre. ESN
was applied with ammonium nitrate per the
recommendation by manufacturer. This is to
insure that enough nitrate nitrogen would be
available soon enough for early season crop
growth. The mix was 75% ESN plus 25%
ammonium nitrate.
The products Super U, urea, urea plus
Agrotain, ESN and ammonium nitrate were
tested. The check did not have any nitrogen
applied.
Plot Size: 10 x 35
Previous Crop: Corn
Variety: Pioneer 1395
Planting Population: 34,500 seeds/acre
Row Spacing: 30-inch
No. of treatments: 6
No. of replications: 5
Treatments: Applied at planting
Design: RCBD
Planting Date: Corn - April 28, 2011
Herbicide Program: Lumax, Atrazine, 2,4-D,
Glystar fb Glystar
Harvest Date: October 18, 2011
Effect of Different Nitrogen Products on Corn Yield

Page 15 Page 15
Results and Discussion
There was a significant difference between
urea and urea applied with the additive
Agrotain. Also ammonium nitrate performed
significantly better than urea alone. The
mixture of ESN and ammonium nitrate
performed significantly better than urea along.
The LSD was 19 bushels to be statistically
significant at the 95% probability level. The
second set of plots, located west of Interstate
Effect of Different Nitrogen Additives and Products on Corn
Yield - Graves Chapple Research Center
227 223232
220
202
101
0
50
100
150
200
250
300
75% ESN +
25% Nitrate
Nitrate Urea +
Agrotain
Super U Urea Check
Products and Additives
bu
/A
LSD .05 = 19 Flanary 2011
Page 16
The Effect of Different Nitrogen Application Timings on Corn Yield
Objective
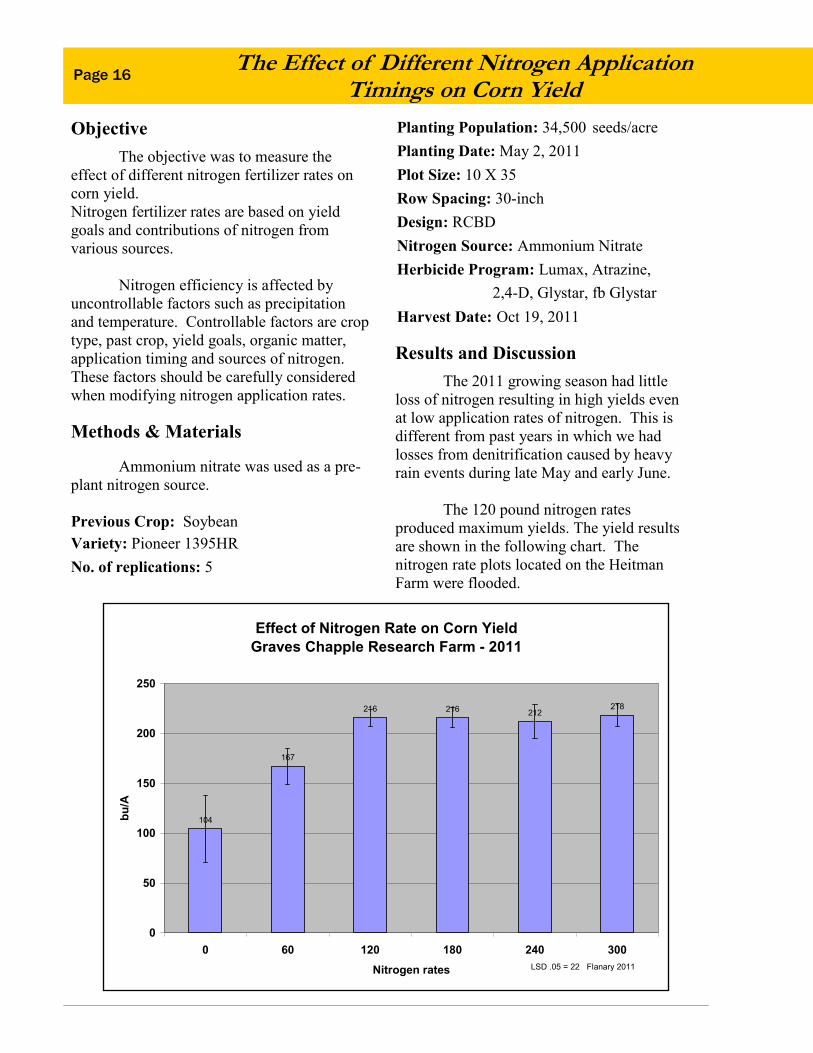
The objective was to measure the
effect of different nitrogen fertilizer rates on
corn yield.
Nitrogen fertilizer rates are based on yield
goals and contributions of nitrogen from
various sources.
Nitrogen efficiency is affected by
uncontrollable factors such as precipitation
and temperature. Controllable factors are crop
type, past crop, yield goals, organic matter,
application timing and sources of nitrogen.
These factors should be carefully considered
when modifying nitrogen application rates.
Methods & Materials
Ammonium nitrate was used as a pre-
plant nitrogen source.
Previous Crop: Soybean
Variety: Pioneer 1395HR
No. of replications: 5
Results and Discussion
The 2011 growing season had little
loss of nitrogen resulting in high yields even
at low application rates of nitrogen. This is
different from past years in which we had
losses from denitrification caused by heavy
rain events during late May and early June.
The 120 pound nitrogen rates
produced maximum yields. The yield results
are shown in the following chart. The
nitrogen rate plots located on the Heitman
Farm were flooded.
Planting Population: 34,500 seeds/acre
Planting Date: May 2, 2011
Plot Size: 10 X 35
Row Spacing: 30-inch
Design: RCBD
Nitrogen Source: Ammonium Nitrate
Herbicide Program: Lumax, Atrazine,
2,4-D, Glystar, fb Glystar
Harvest Date: Oct 19, 2011
Effect of Nitrogen Rate on Corn Yield
Graves Chapple Research Farm - 2011
104
167
216 216 212218
0
50
100
150
200
250
0 60 120 180 240 300
Nitrogen rates
bu
/A
LSD .05 = 22 Flanary 2011
Page 17 The Value of Narrow Row Spacing with a
June Soybean Planting Date
Objective
The objective was to demonstrate the
yield advantage of 15-inch row spacing
compared to 30-inch when seeding later
planted soybeans. The Extension Service
recommends using narrow row spacing during
delayed planting. When planting late, the time
for vegetative growth is shorter and this
reduces the canopy development. By
narrowing the row spacing, the crop can
compensate by producing more pods per area.
Methods & Materials
Ten foot wide plots were planted and
the center rows were harvested. Each variety
was an individual test comparing the 30-inch
row spacing with 15-inch.
Previous Crop: Corn
Variety: Various
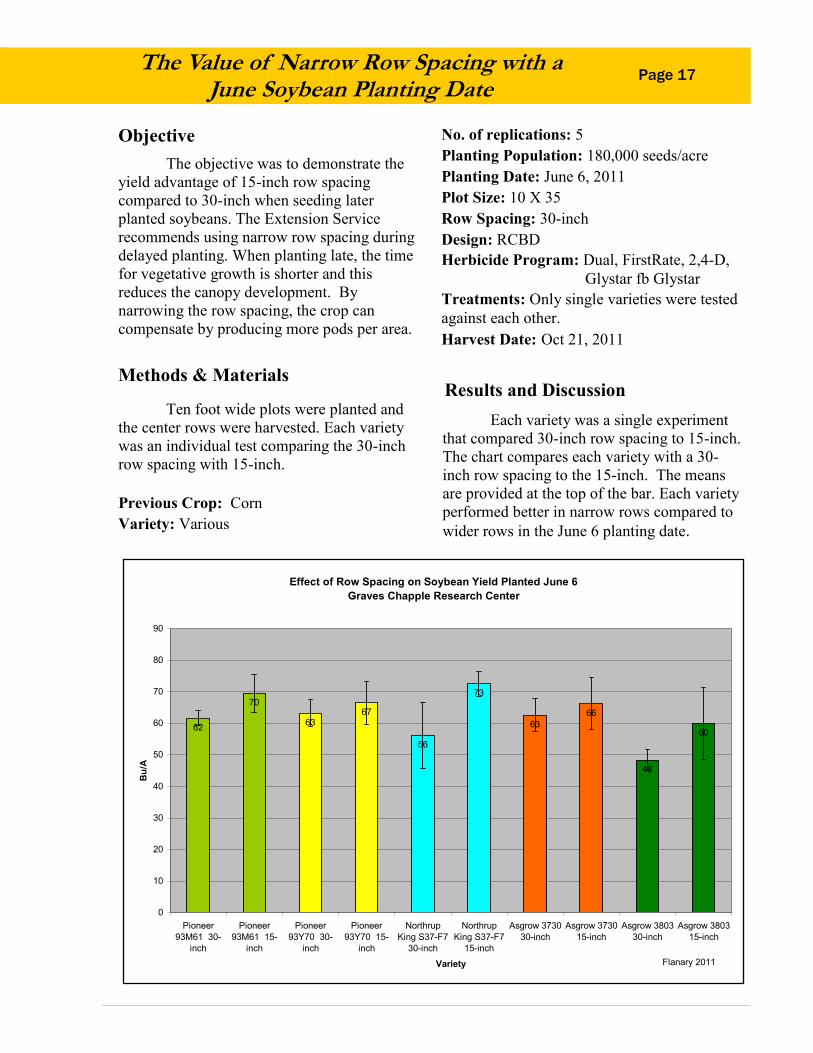
Results and Discussion
Each variety was a single experiment
that compared 30-inch row spacing to 15-inch.
The chart compares each variety with a 30-
inch row spacing to the 15-inch. The means
are provided at the top of the bar. Each variety
performed better in narrow rows compared to
wider rows in the June 6 planting date.
No. of replications: 5
Planting Population: 180,000 seeds/acre
Planting Date: June 6, 2011
Plot Size: 10 X 35
Row Spacing: 30-inch
Design: RCBD
Herbicide Program: Dual, FirstRate, 2,4-D,
Glystar fb Glystar
Treatments: Only single varieties were tested
against each other.
Harvest Date: Oct 21, 2011
Effect of Row Spacing on Soybean Yield Planted June 6
Graves Chapple Research Center
62
70
6367
56
73
63
66
48
60
0
10
20
30
40
50
60
70
80
90
Pioneer
93M61 30-
inch
Pioneer
93M61 15-
inch
Pioneer
93Y70 30-
inch
Pioneer
93Y70 15-
inch
Northrup
King S37-F7
30-inch
Northrup
King S37-F7
15-inch
Asgrow 3730
30-inch
Asgrow 3730
15-inch
Asgrow 3803
30-inch
Asgrow 3803
15-inch
Variety
Bu
/A
Flanary 2011
Page 18 2011 Field Day
The 23rd annual Graves - Chapple Research
Center Field Day was held on August 23, 2011.
Over 150 participants registered at the event.
A pre-field day breakfast was held to thank
the many individuals, organizations and
agribusinesses that make the farm possible. One
hundred and ten attendees enjoyed breakfast and
fellowship before the 2011 Supporters of Graves-
Chapple Farm were recognized. Russell Herron was
recognized as outstanding individual supporters.
Scott Milne of Milne Pioneer Seed was recognized as
the outstanding agribusiness supporter.
The field day tours and lunch were made
possible through the assistance of many local
organizations. Atchison-Holt REA provided
doughnuts and coffee to the attendees in the morning.
A pork loin lunch was sponsored by Kent Fisher
Insurance with ice cream sandwiches provided by
MO Valley Ag. KMA Radio from Shenandoah and
KFEQ Radio from St. Joseph conducted live remote
broadcasts from the farm during the event.
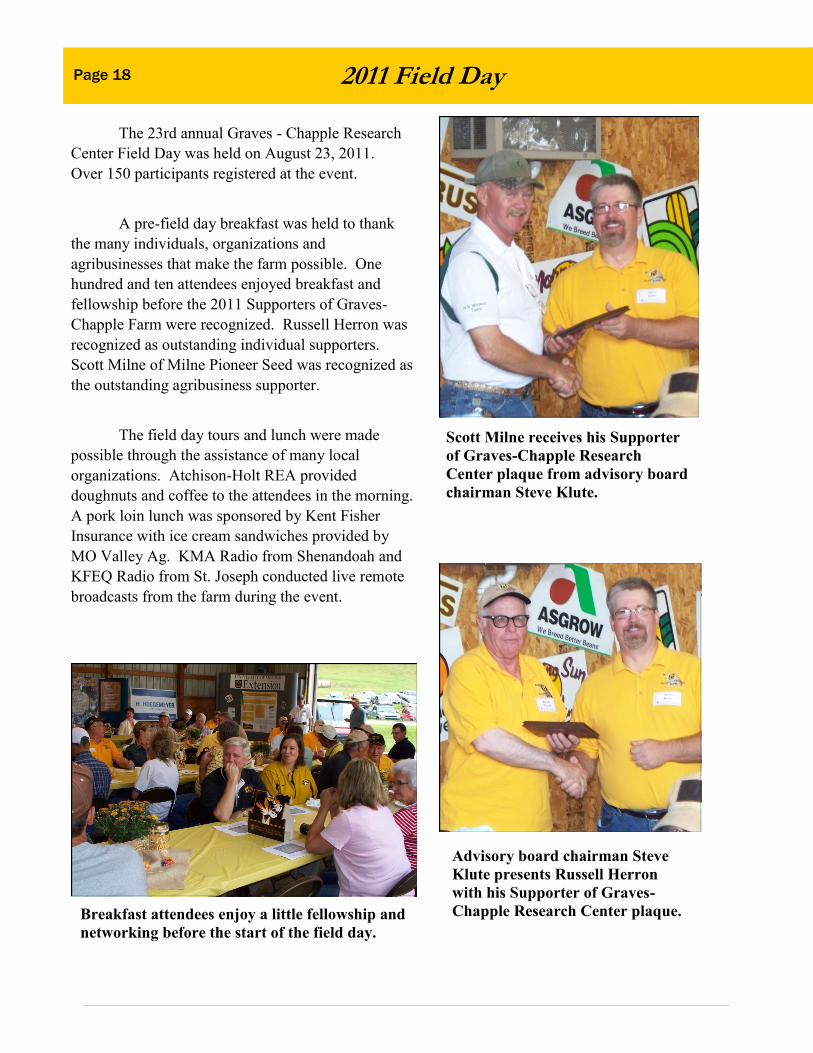
Scott Milne receives his Supporter
of Graves-Chapple Research
Center plaque from advisory board
chairman Steve Klute.
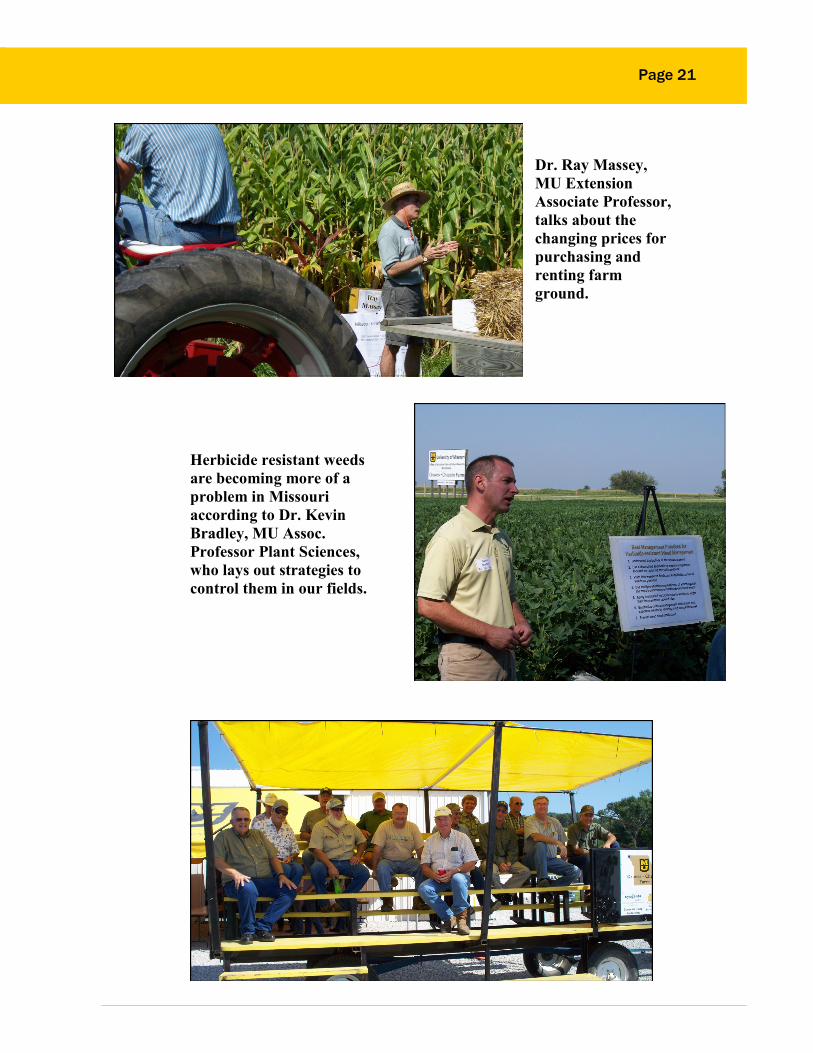
Advisory board chairman Steve
Klute presents Russell Herron
with his Supporter of Graves-
Chapple Research Center plaque. Breakfast attendees enjoy a little fellowship and
networking before the start of the field day.

Page 19
Attendees could participate in three
tours that highlighted some of the work being
conducted on the farm. These tours were:
Red Tour – Pest Management
Stop 1 - Identification and Management of
Emerging Soybean Insect Pests
Dr. Wayne Bailey
MU Assoc. Professor of Entomology
Stop 2 - Glyphosate Influences Biology of the
Soil and Crop Growth Environment
Dr. Robert Kremer
MU Adjunct Professor Soil Science
Stop 3 - Nematode Update
Dr. Laura Sweets
MU Extension Associate Professor
Plant Sciences
Stop 4 - What to Do With All These Resistant
Weeds
Dr. Kevin Bradley
MU Assoc. Professor Plant Sciences
White Tour – Crop Management
Stop 1 - Automated Weather Monitoring at
Graves– Chapple Farm
Pan Guinan
MU Extension Associate
Stop 2 - Cover Crops, Soil Conservation, and
Winter Pasture
Dr. Rob Kallenbach
MU Assistant Professor Agronomy
Stop 3 - What is Happening in Land Markets?
Dr. Ray Massey
MU Extension Associate Professor
Blue Tour – Nutrient Management
Stop 1 - Assessing N Management
Using a Stalk Nitrate Test
Dr. John Lory
MU Extension Assistant Professor
Plant Sciences
Stop 2 - Phosphorus Enhancing Products
and Strip-tilling
Chris Dudenhoeffer
MU Graduate Student, Soil Science
Stop 3 - Nitrogen Fertilizer Management
Dr. Peter Scharf
MU Assoc. Professor Plant Sciences
Stop 4 - The Need for Sulfur and Zinc
Wayne Flanary
MU Extension Regional Agronomist
Dr. Peter Scharf , MU Assoc. Professor
Plant Sciences talks to producers about
managing their nitrogen fertilizer during
Dr. Wayne Bailey, MU Assoc. Professor
of Entomology, shows producers insect
pests for which they should be on the
lookout in 2011 and beyond.

Page 20 2011 Field Day
Dr. John Lory, MU
Extension Assistant
Professor Plant
Sciences, explains the
process for Nitrogen
management using a
stalk nitrate test.
Chris Dudenhoeffer,
MU Graduate Student,
Soil Science, talks to a
tour wagon regarding
phosphorus enhancing
products and strip-
tilling.
Page 21
Dr. Ray Massey,
MU Extension
Associate Professor,
talks about the
changing prices for
purchasing and
renting farm
ground.
Herbicide resistant weeds
are becoming more of a
problem in Missouri
according to Dr. Kevin
Bradley, MU Assoc.
Professor Plant Sciences,
who lays out strategies to
control them in our fields.

Page 22 FFA Student Field Day
Two hundred fifty four high school
students from 8 area schools attended the
annual Student Field Day at the Graves-
Chapple Research Center on September 16.
The goal for the event is to show some of the
various aspects of agriculture to demonstrate
to our youth that there is more to agriculture
than planting crops.
Each learning station was designed to
provide hands on learning opportunities for
the students on some of the cutting edge
technology and practices used in today’s
agriculture and how it affects their everyday
lives.
The learning stations were:
1) Is Ugly Only Skin-deep? The Relationship
Between Log and Lumber Defects - Using
a portable sawmill they demonstrate why
some timber is more valuable for wood.
2) Representative from MU with
opportunities in ag at MU
3) Conducting an Energy Audit - With the
rising
cost of energy, the need for and how to
conduct energy audits.
4) Precision Ag - How the use of technology
can reduce input cost, maximize yield and
make producers more efficient.
5) Wind and Solar Energy - As energy costs
increase, more people are looking at
installing alternative energy sources to
generate their own electricity.
6) Composting/vermiculture – Composting
can help reduce the materials added to
landfills and produce a valuable product.
7) Biomass Energy Production - The
Renewable Energy Standards of 2006
make the production of ethanol from
biomass a mandate.
8) Turf grass Management - One of the
fastest growing industries is the care of
turf grass in both lawns and public spaces.
9) GPS and Community Resource Mapping -
How the use of handheld GPS devices can
be a useful tool for people in urban
settings.
10) Field tour to show some of the projects
and research being conducted at the farm.
A lunch of hotdogs and hamburgers
was provided by the research center and local
area businesses and prepared by the Rock Port
Rotary club. Volunteers from the Atchison
County Extension council helped serve the
meal.
Assignments were given to each class
to do a simple energy assessment of their
farms and/or homes in order to evaluate what
the students learned at the field day. They
were asked to identify energy saving
Dr. Brad Fresenburg, Assistant Extension
Professor and turf grass specialist explains
some of the differences in varieties using the
turf grass plots at the Graves-Chapple
Research Center.
Handheld GPS devices can benefit us in
everyday life according to Charlie Ellis,
MU Extension Natural Resource Engineer.
Page 23
opportunities and to list the energy saving
changes they and their parents were likely to
install as a result of their assessment.
Many of the students identified
changing light bulbs as an opportunity for
saving energy. Others identified changing to
Energy Star appliances, turning off lights, and
alternative fuels. Some said they would raise
the temperature in the home in the summer
and lower it in the winter.
Students were asked to rate their
knowledge on four subjects before and after
the field day using the following scale: No
knowledge, Some knowledge, Average
knowledge, Above average knowledge,
Excellent knowledge
1) Why energy conservation is important.
Before the field day averaged 3.2
After averaged 4.5.
2) Knowledge of increasing energy
efficiency on farms.
Before the field day averaged 2.4
After averaged 4.1.
3) Knowledge of how to calculate energy
savings and simple payback.
Before the field day averaged 1.65
After averaged 3.4.
4) Knowledge of sources of energy assistance
Before the field day averaged 2.5
After averaged 4.1.
From these figures, the attendees
increased their knowledge on all the subjects
as a result of the presentations made at the
field day.
The Department of Energy developed
metrics for farm energy field days. Based on
these metrics we would expect energy saving
from this field day of 12936 million Btu’s of
energy. There would be a reduction of 235
metric tons of carbon. Electricity reduction
would be 726 megawatts and reduction of
6759 gallons of propane use would be
achieved.
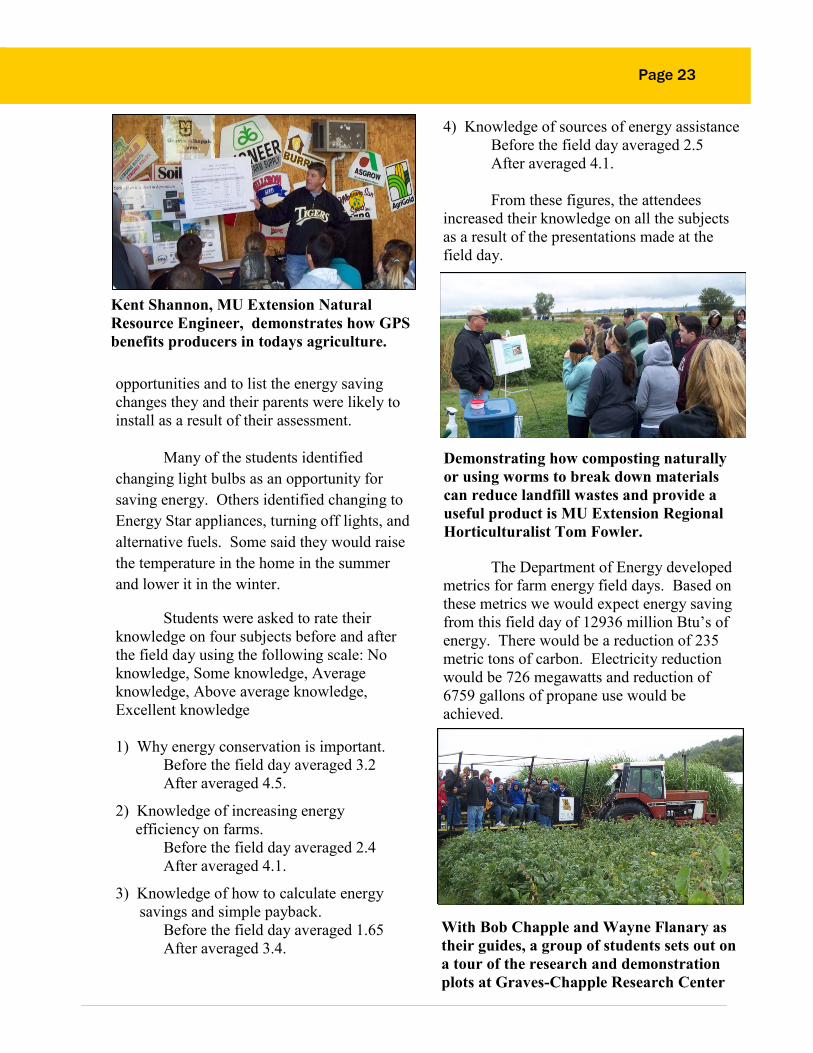
Kent Shannon, MU Extension Natural
Resource Engineer, demonstrates how GPS
benefits producers in todays agriculture.
With Bob Chapple and Wayne Flanary as
their guides, a group of students sets out on
a tour of the research and demonstration
plots at Graves-Chapple Research Center
Demonstrating how composting naturally
or using worms to break down materials
can reduce landfill wastes and provide a
useful product is MU Extension Regional
Horticulturalist Tom Fowler.

Page 24 FFA Student Field Day
Dusty Walter, MU Natural
Resource Research Assis-
tant, explains the value that
can be obtained when tim-
ber is properly managed.
Demonstrating differ-
ent types of biomass
and their production is
Tim Reinbott,
Superintendent of the
MU Bradford Research
Center.
Susan Brown, Vice President
of Brightenergy Solar
Solutions, talks to the
students about the current
state of photovoltaic and
wind generated electricity
systems for homes and
businesses.

Page 25
Another group of
students heads out on
a field tour.
CeCe Leslie, Director of
Student Recruitment for
CAFNR, explains some of
the opportunities offered
by the College of
Agriculture, Food and
Natural Resources at the
University of Missouri.
Wayne Flanary, MU
Extension agronomist,
explains some of the
research and
demonstration projects
taking place at the
research center.

Page 26 2011 Graves - Chapple Research Center
Daily Precipitation Data, April - September 2011
Daily Precipitation in Inches
Day April May June July August September
1 0.01
2 0.05
3 1.23 0.02
4
5 0.09 0.12 0.17
6
7 1.11 1.65 0.14
8 0.14
9 0.45 0.02
10 0.39 .
11 2.12
12 0.01 0.05 1.01
13
14 1.24 0.03
15 0.54 0.01 0.28
16 0.58 0.02 0.14
17 0.01
18 1.32 1.37 0.07
19 0.44 0.01 0.23 0.01
20 0.28 0.46 0.39
21 0.01 0.02
22 0.13 0.77 0.37
23 0.02
24 0.71 1.95
25 0.09 0.35
26 0.04 1.15 0.02
27 0.83 0.01
28 0.08 0.05
29 0.02 0.02
30 0.75
31
TOTAL 3.61 3.25 5.68 5.83 4.94 0.29

Page 27 2011 Graves - Chapple Research Center
Daily Temperature Data , April - September 2011
Daily Temperature in °Fahrenheit
Day April May June July August September
Max/Min Max/Min Max/Min Max/Min Max/Min Max/Min
1 65/36 65/40 87/55 95/77 96/80 96/78
2 74/31 62/33 87/68 90/70 98/78 92/76
3 90/46 65/32 95/74 83/66 90/75 84/65
4 53/33 75/39 91/73 87/68 86/74 76/56
5 75/28 68/46 96/70 89/72 87/73 75/50
6 70/49 78/41 99/74 90/69 91/68 74/49
7 55/46 84/53 96/76 85/68 88/68 77/50
8 63/44 87/58 93/76 86/68 88/68 79/50
9 87/54 97/72 86/63 88/74 86/69 83/59
10 85/50 97/73 70/62 92/76 81/65 83/56
11 67/42 89/62 78/57 96/75 82/62 85/59
12 73/36 80/59 77/62 92/73 84/63 91/65
13 80/55 61/48 78/64 86/70 83/63 76/60
14 75/54 55/46 89/65 89/73 82/61 67/43
15 59/39 60/43 86/61 92/78 76/66 60/42
16 65/36 69/37 81/64 93/79 81/67 56/48
17 66/38 70/39 89/68 95/81 88/72 58/51
18 56/42 69/49 84/63 95/80 88/65 66/53
19 44/38 67/59 88/69 95/79 88/65 84/51
20 57/38 72/61 89/64 97/81 84/67 81/55
21 58/42 83/63 78/62 94/78 87/67 72/48
22 69/46 82/64 75/61 97/73 88/67 72/44
23 56/41 86/58 77/58 97/77 96/74 72/43
24 62/36 75/61 82/58 9272 92/64 73/48
25 53/48 76/54 8062 91/71 84/58 70/40
26 57/41 71/48 87/65 93/76 85/64 75/42
27 63/42 63/52 81/62 97/77 91/65 80/49
28 73/44 77/53 79/58 90/77 79/63 86/52
29 79/42 90/62 88/67 87/74 83/63 76/53
30 71/50 86/74 94/77 88/74 84/67 72/43
31 --- 84/61 93/75 90/70 ---

For additional copies or for more information contact:
University of Missouri Extension Center
201 East HWY 136
Rock Port, MO 64482
Phone: (660) 744-6231
Email: [email protected]
http://extension.missouri.edu/atchison/Graves/Main%20page.htm
University of Missouri, Lincoln University, U.S. Department of Agriculture and Local Extension Councils Cooperating
EQUAL OPPORTUNITY/ADA INSTITUTIONS