Embed Size (px)
Citation preview

.
.
Basic Sine and Cosine CurvesIn this section, you will study techniques for sketching the graphs of the sine andcosine functions. The graph of the sine function is a sine curve. In Figure 47, theblack portion of the graph represents one period of the function and is called onecycle of the sine curve. The gray portion of the graph indicates that the basic sinecurve repeats indefinitely in the positive and negative directions. The graph of thecosine function is shown in Figure 48.
Recall from the “Trigonometric Functions: The Unit Circle” section that thedomain of the sine and cosine functions is the set of all real numbers. Moreover,the range of each function is the interval and each function has a periodof Do you see how this information is consistent with the basic graphs shownin Figures 47 and 48?
FIGURE 47
FIGURE 48
Note in Figures 47 and 48 that the sine curve is symmetric with respect tothe origin, whereas the cosine curve is symmetric with respect to the -axis.These properties of symmetry follow from the fact that the sine function is oddand the cosine function is even.
y
Range:1 1− ≤ ≤y
Period: 2π
y x= cos
−1
1
π−π 32π3
2− π
2π 5
2π
y
x2π
Range:1 1− ≤ ≤y
y x= sin
−1
1
2
Period: 2π
− π ππ 32π3
2− π
2π
2− π 5
2π
y
x
2�.��1, 1�,
What you should learn• Sketch the graphs of basic sine
and cosine functions.
• Use amplitude and period tohelp sketch the graphs of sineand cosine functions.
• Sketch translations of thegraphs of sine and cosinefunctions.
• Use sine and cosine functionsto model real-life data.
Why you should learn itSine and cosine functions areoften used in scientific calcula-tions. For instance, in Exercise 73, you can use a trigonometricfunction to model the airflow ofyour respiratory cycle.
Graphs of Sine and Cosine Functions
Video
Video

To sketch the graphs of the basic sine and cosine functions by hand, it helpsto note five key points in one period of each graph: the intercepts, maximumpoints, and minimum points (see Figure 49).
Using Key Points to Sketch a Sine Curve
Sketch the graph of on the interval
SolutionNote that
indicates that the -values for the key points will have twice the magnitude ofthose on the graph of Divide the period into four equal parts to getthe key points for
Intercept Maximum Intercept Minimum Intercept
and
By connecting these key points with a smooth curve and extending the curve in both directions over the interval you obtain the graph shown inFigure 50.
FIGURE 50
Now try Exercise 35.
1
2
3
−2
−
y = 2 sin x
y = sin x 25π
27π
23π
2π
y
x
���, 4��,
�2�, 0��3�
2, �2�,��, 0�,��
2, 2�,�0, 0�,
y � 2 sin x.2�y � sin x.
y
y � 2 sin x � 2�sin x�
���, 4��.y � 2 sin x
Period: 2
(0, 0)
( )
( )
π
ππ
2
2( , 0)
π(2 , 0)
InterceptMaximum Intercept InterceptMinimum
Quarterperiod
Halfperiod
Three-quarterperiod
Fullperiod
3
y x= sin, 1
, 1−
π
y
x
FIGURE 49
Period: 2
(0, 1)
( ) ( )π π
π
π
2 2
( , 1)−
(2 , 1)MaximumIntercept InterceptMinimum Maximum
Quarterperiod
Halfperiod
Three-quarterperiod
Fullperiod
3
y x= cos
, 0 , 0
π
x
y
Example 1
When using a graphing utility tograph trigonometric functions,pay special attention to the view-ing window you use. For instance,try graphing inthe standard viewing window in radian mode. What do youobserve? Use the zoom feature to find a viewing window that displays a good view of the graph.
y � [sin�10x�]/10
Techno logy

.
.
Amplitude and PeriodIn the remainder of this section you will study the graphic effect of each of theconstants and in equations of the forms
and
A quick review of the transformations you studied in the “Transformations ofFunctions” section should help in this investigation.
The constant factor in acts as a scaling factor—a verticalstretch or vertical shrink of the basic sine curve. If the basic sine curveis stretched, and if the basic sine curve is shrunk. The result is that thegraph of ranges between and instead of between and 1. Theabsolute value of is the amplitude of the function The range of thefunction for is
Scaling: Vertical Shrinking and Stretching
On the same coordinate axes, sketch the graph of each function.
a. b.
Solutiona. Because the amplitude of is the maximum value is and the
minimum value is Divide one cycle, into four equal parts toget the key points
Maximum Intercept Minimum Intercept Maximum
and
b. A similar analysis shows that the amplitude of is 3, and the keypoints are
Maximum Intercept Minimum Intercept Maximum
and
The graphs of these two functions are shown in Figure 51. Notice that the graphof is a vertical shrink of the graph of and the graph of
is a vertical stretch of the graph of
Now try Exercise 37.
y � cos x.y � 3 cos xy � cos xy �
12 cos x
�2�, 3�.�3�
2, 0�,��, �3�,��
2, 0�,�0, 3�,
y � 3 cos x
�2�, 12�.�3�
2, 0�,��, �
12�,��
2, 0�,�0,
12�,
0 ≤ x ≤ 2�,�12.
12
12,y �
12 cos x
y � 3 cos xy �1
2 cos x
�a ≤ y ≤ a.a > 0y � a sin xy � a sin x.a
�1a�ay � a sin xa < 1,
a > 1,y � a sin xa
y � d � a cos�bx � c�.
y � d � a sin�bx � c�
dc,b,a,
Definition of Amplitude of Sine and Cosine CurvesThe amplitude of and represents half the distancebetween the maximum and minimum values of the function and is given by
Amplitude � a.
y � a cos xy � a sin x
Example 2y x= 3 cos
y x= cos
−1
−2
−3
3
2π
y x= cos12
y
x
FIGURE 51
Sketch the graph of for 2, and 3. How doesthe value of affect the graph?How many complete cyclesoccur between 0 and foreach value of b?
2�
bb �
12,
y � cos bx
Exploration
Video
Video

The graph of is a reflection in the -axis of the graph of For instance, the graph of is a reflection of the graph of
as shown in Figure 52.Because completes one cycle from to it follows
that completes one cycle from to
Note that if the period of is greater than and represents a horizontal stretching of the graph of Similarly, if the period of is less than and represents a horizontal shrinkingof the graph of If is negative, the identities and
are used to rewrite the function.
Scaling: Horizontal Stretching
Sketch the graph of
SolutionThe amplitude is 1. Moreover, because the period is
Substitute for
Now, divide the period-interval into four equal parts with the values and to obtain the key points on the graph.
Intercept Maximum Intercept Minimum Intercept
and
The graph is shown in Figure 53.
FIGURE 53
Now try Exercise 39.
y = sin x y = sin x2
−
Period: 4
−1
1
π
π
π
y
x
�4�, 0��3�, �1�,�2�, 0�,��, 1�,�0, 0�,
3�2�,�,�0, 4��
b.2�
b�
2�12
� 4�.
b �12,
y � sin x
2.
cos��x� � cos xsin��x� � �sin xby � a sin x.
2�y � a sin bxb > 1,y � a sin x.
2�y � a sin bx0 < b < 1,
x � 2�b.x � 0y � a sin bxx � 2�,x � 0y � a sin x
y � 3 cos x,y � �3 cos x
y � f �x�.xy � �f �x�
Period of Sine and Cosine FunctionsLet be a positive real number. The period of and is given by
Period �2�
b.
y � a cos bxy � a sin bxb
Example 3
y y= 3 cos x = −3 cos x
1
−3
3
2πππ−
y
x
FIGURE 52
Sketch the graph of
where and How does the value of affectthe graph?
c�4.c � ��4, 0,
y � sin�x � c�
Exploration
In general, to divide a period-interval into four equalparts, successively add“period/4,” starting with the leftendpoint of the interval. Forinstance, for the period-interval
of length you would successively add
to get andas the -values for the key
points on the graph.x�2
��6, 0, �6, �3,
2�34
��
6
2�3,���6, �2�

.
.
Translations of Sine and Cosine CurvesThe constant in the general equations
and
creates a horizontal translation (shift) of the basic sine and cosine curves.Comparing with you find that the graph of
completes one cycle from to Bysolving for you can find the interval for one cycle to be
Left endpoint Right endpoint
Period
This implies that the period of is and the graph ofis shifted by an amount The number is the phase shift.
Horizontal Translation
Sketch the graph of
SolutionThe amplitude is and the period is By solving the equations
and
you see that the interval corresponds to one cycle of the graph.Dividing this interval into four equal parts produces the key points
Intercept Maximum Intercept Minimum Intercept
and
The graph is shown in Figure 54.
Now try Exercise 45.
�7�
3, 0�.�11�
6, �
12�,�4�
3, 0�,�5�
6,
12�,��
3, 0�,
��3, 7�3�
x �7�
3 x �
�
3� 2�
x ��
3 x �
�
3� 0
2�.12
y �1
2 sin�x �
�
3�.
cbcb.y � a sin bx2�b,y � a sin�bx � c�
c
b≤ x ≤
c
b�
2�
b .
x,bx � c � 2�.bx � c � 0y � a sin�bx � c�
y � a sin�bx � c�,y � a sin bx
y � a cos�bx � c�y � a sin�bx � c�
c
Graphs of Sine and Cosine FunctionsThe graphs of and have the followingcharacteristics. (Assume )
Amplitude Period
The left and right endpoints of a one-cycle interval can be determined bysolving the equations and bx � c � 2�.bx � c � 0
�2�
b� a
b > 0.y � a cos�bx � c�y � a sin�bx � c�
12
321
Period: 2
y = sin x −
π
π
π 2π 83π2
3π 5
3π
( )y
x
FIGURE 54
Example 4
Simulation
Video

Horizontal Translation
Sketch the graph of
SolutionThe amplitude is 3 and the period is By solving the equations
and
you see that the interval corresponds to one cycle of the graph.Dividing this interval into four equal parts produces the key points
Minimum Intercept Maximum Intercept Minimum
and
The graph is shown in Figure 55.
Now try Exercise 47.
The final type of transformation is the vertical translation caused by theconstant in the equations
and
The shift is units upward for and units downward for In otherwords, the graph oscillates about the horizontal line instead of about the -axis.
Vertical Translation
Sketch the graph of
SolutionThe amplitude is 3 and the period is The key points over the interval are
and
The graph is shown in Figure 56. Compared with the graph of the graph of is shifted upward two units.
Now try Exercise 53.
y � 2 � 3 cos 2xf �x� � 3 cos 2x,
��, 5�.�3�
4, 2�,��
2, �1�,��
4, 2�,�0, 5�,
�0, ���.
y � 2 � 3 cos 2x.
xy � d
d < 0.dd > 0d
y � d � a cos�bx � c�.
y � d � a sin�bx � c�
d
��1, �3�.��54
, 0�,��32
, 3�,��74
, 0�,��2, �3�,
��2, �1�
x � �1
2�x � �2�
2�x � 4� � 2�
x � �2
2�x � �4�
2�x � 4� � 0
2�2� � 1.
y � �3 cos�2�x � 4��.
Period 1
1−2
2
3
−3
π πy
x
y = −3 cos(2 x + 4 )
FIGURE 55
−−1
1
5
Period
y = 2 + 3 cos 2x
π
ππ
y
x
FIGURE 56
Example 5
Example 6

.
Mathematical ModelingSine and cosine functions can be used to model many real-life situations, includ-ing electric currents, musical tones, radio waves, tides, and weather patterns.
Finding a Trigonometric Model
Throughout the day, the depth of water at the end of a dock in Bar Harbor, Mainevaries with the tides. The table shows the depths (in feet) at various times duringthe morning. (Source: Nautical Software, Inc.)
a. Use a trigonometric function to model the data.
b. Find the depths at 9 A.M. and 3 P.M.
c. A boat needs at least 10 feet of water to moor at the dock. During what timesin the afternoon can it safely dock?
Solutiona. Begin by graphing the data, as shown in Figure 57. You can use either a sine
or cosine model. Suppose you use a cosine model of the form
The difference between the maximum height and the minimum height of thegraph is twice the amplitude of the function. So, the amplitude is
The cosine function completes one half of a cycle between the times at whichthe maximum and minimum depths occur. So, the period is
which implies that Because high tide occurs 4 hours aftermidnight, consider the left endpoint to be so Moreover,because the average depth is it follows that So,you can model the depth with the function given by
b. The depths at 9 A.M. and 3 P.M. are as follows.
9 A.M.
3 P.M.
c. To find out when the depth is at least 10 feet, you can graph the model withthe line using a graphing utility, as shown in Figure 58. Using theintersect feature, you can determine that the depth is at least 10 feet between2:42 P.M. and 5:18 P.M.
Now try Exercise 77.
�t � 17.3�.�t � 14.7�
y � 10y
� 10.57 feet
y � 5.6 cos�0.524 � 15 � 2.094� � 5.7
� 0.84 foot
y � 5.6 cos�0.524 � 9 � 2.094� � 5.7
y � 5.6 cos�0.524t � 2.094� � 5.7.
d � 5.7.12 �11.3 � 0.1� � 5.7,
c � 2.094.cb � 4,b � 2�p � 0.524.
� 12� 2�10 � 4� p � 2��time of min. depth� � �time of max. depth��
� 5.6.�12
�11.3 � 0.1� a �1
2��maximum depth� � �minimum depth��
y � a cos�bt � c� � d.
Example 7
Time4 A.M. 8 A.M. Noon
t
y
2
4
6
8
10
12
Changing Tides
Dep
th (
in f
eet)
FIGURE 57
00 24
12
y = 10
y = 5.6 cos(0.524t − 2.094) + 5.7
(14.7, 10) (17.3, 10)
FIGURE 58
Time, t Depth, y
Midnight 3.4
2 A.M. 8.7
4 A.M. 11.3
6 A.M. 9.1
8 A.M. 3.8
10 A.M. 0.1
Noon 1.2
Simulation

The symbol indicates an exercise in which you are instructed to use graphing technology or a symbolic computer algebra system.
Click on to view the complete solution of the exercise.
Click on to print an enlarged copy of the graph.
Click on to view the Make a Decision exercise.
Exercises
In Exercises 1–14, find the period and amplitude.
1. 2.
3. 4.
5. 6.
7. 8.
9. 10.
11. 12.
13.
14.
In Exercises 15–22, describe the relationship between thegraphs of and Consider amplitude, period, and shifts.
15. 16.
17. 18.
19. 20.
21. 22.
In Exercises 23–26, describe the relationship between thegraphs of and Consider amplitude, period, and shifts.
23. 24.
25. 26.
34
2
2
g
f
22
y
x
321
32
gf
22
y
x
32
32
g
f
y
x
3
32 g
f
y
x
g.f
g�x� � �2 � cos 4xg�x� � 3 � sin 2x
f �x� � cos 4xf �x� � sin 2x
g�x� � sin 3xg�x� � cos 2x
f �x� � sin xf �x� � cos x
g�x� � sin��3x�g�x� � �cos 2x
f �x� � sin 3xf �x� � cos 2x
g�x� � cos�x � ��g�x� � sin�x � ��f �x� � cos xf �x� � sin x
g.f
y �2
3 cos
�x
10
y �1
4 sin 2�x
y �5
2 cos
x
4y �
1
2 cos
2x
3
y �13 sin 8xy � 3 sin 10x
y � �cos 2x
3y � �2 sin x
2
2
y
x
1
12
y
x
y �3
2 cos
�x
2y �
1
2 sin
�x
3
4
2
4
y
x
3
23
2
y
x
y � �3 sin x
3y �
5
2 cos
x
2
123
y
x123
y
x
y � 2 cos 3xy � 3 sin 2x
VOCABULARY CHECK: Fill in the blanks.
1. One period of a sine or cosine function function is called one ________ of the sine curve or cosine curve.
2. The ________ of a sine or cosine curve represents half the distance between the maximum and minimum values of the function.
3. The period of a sine or cosine function is given by ________.
4. For the function given by represents the ________ ________ of the graph of the function.
5. For the function given by represents a ________ ________ of the graph of the function.dy � d � a cos�bx � c�,
cb
y � a sin�bx � c�,
Glossary

In Exercises 27–34, graph and on the same set of coor-dinate axes. (Include two full periods.)
28.
29. 30.
31.
33. 34.
In Exercises 35–56, sketch the graph of the function.(Include two full periods.)
35. 36.
37. 38.
39. 40.
41. 42.
43. 44.
45. 46.
47. 48.
49. 50.
51. 52.
53.
54.
55. 56.
In Exercises 57– 62, use a graphing utility to graph thefunction. Include two full periods. Be sure to choose anappropriate viewing window.
57. 58.
59.
60.
61.
62.
Graphical Reasoning In Exercises 63– 66, find and for the function such that the graph of matches the figure.
63. 64.
65. 66.
Graphical Reasoning In Exercises 67–70, find and for the function such that the graph of
matches the figure.
67. 68.
69. 70.
In Exercises 71 and 72, use a graphing utility to graph and in the interval Use the graphs to findreal numbers such that
71. 72.
y2 � �1y2 � �12
y1 � cos xy1 � sin x
y1 � y2.x[�2�, 2�].y2
y1
3
2
2 4
23
y
x
f
32
123
x
y
f
3
123
y
x
f
3
1
y
x
f
ff �x� � a sin�bx � c�
ca, b,
12
5
1
y
x
f
2
468
10
y
x
f
34
2
y
x
f
1
1
4
22
y
x
f
ff �x� � a cos x � dda
y �1
100 sin 120�t
y � �0.1 sin��x
10� ��
y � 3 cos��x
2�
�
2� � 2
y � cos�2�x ��
2� � 1
y � �4 sin�2
3x �
�
3�y � �2 sin�4x � ��
y � �3 cos�6x � ��y �2
3 cos�x
2�
�
4�
y � 4 cos�x ��
4� � 4
y � 3 cos�x � �� � 3
y � 2 cos x � 3y � 2 �110 cos 60�x
y � �3 � 5 cos �t
12y � 2 � sin
2�x
3
y � 4 cos�x ��
4�y � 3 cos�x � ��
y � sin�x � ��y � sin�x ��
4�
y � �10 cos �x
6y � �sin
2�x
3
y � sin �x
4y � cos 2�x
y � sin 4xy � cosx2
y � 4 cos xy �13 cos x
y �14 sin xy � 3 sin x
g�x� � �cos�x � ��g�x� � 2 cos�x � ��f �x� � �cos xf �x� � 2 cos x
g�x� � 3 �1
2 sin
x
2
f �x� � �1
2 sin
x
2
g�x� � �cos 4xg�x� � 1 � cos x
f �x� � 2 cos 2xf �x� � cos x
g�x� � sin x
3
f �x� � sin x
gf
27.
g�x� � 4 sin x
f �x� � �2 sin x
32.
g�x� � 4 sin �x � 3
f �x� � 4 sin �x

73. Respiratory Cycle For a person at rest, the velocity (inliters per second) of air flow during a respiratory cycle (thetime from the beginning of one breath to the beginning of
the next) is given by where is the time (in
seconds). (Inhalation occurs when and exhalationoccurs when )
(a) Find the time for one full respiratory cycle.
(b) Find the number of cycles per minute.
(c) Sketch the graph of the velocity function.
74. Respiratory Cycle After exercising for a few minutes, aperson has a respiratory cycle for which the velocity of air
flow is approximated by where is the
time (in seconds). (Inhalation occurs when andexhalation occurs when )
(a) Find the time for one full respiratory cycle.
(b) Find the number of cycles per minute.
(c) Sketch the graph of the velocity function.
75. Data Analysis: Meteorology The table shows the maxi-mum daily high temperatures for Tallahassee andChicago (in degrees Fahrenheit) for month with corresponding to January. (Source: National ClimaticData Center)
(a) A model for the temperature in Tallahassee is given by
Find a trigonometric model for Chicago.
(b) Use a graphing utility to graph the data points and themodel for the temperatures in Tallahassee. How welldoes the model fit the data?
(c) Use a graphing utility to graph the data points and themodel for the temperatures in Chicago. How well doesthe model fit the data?
(d) Use the models to estimate the average maximumtemperature in each city. Which term of the models didyou use? Explain.
(e) What is the period of each model? Are the periods whatyou expected? Explain.
(f) Which city has the greater variability in temperaturethroughout the year? Which factor of the modelsdetermines this variability? Explain.
76. Health The function given by
approximates the blood pressure (in millimeters) ofmercury at time (in seconds) for a person at rest.
(a) Find the period of the function.
(b) Find the number of heartbeats per minute.
77. Piano Tuning When tuning a piano, a technician strikesa tuning fork for the A above middle C and sets up a wavemotion that can be approximated by where is the time (in seconds).
(a) What is the period of the function?
(b) The frequency is given by What is thefrequency of the note?
f � 1�p.f
ty � 0.001 sin 880�t,
tP
P � 100 � 20 cos 5� t
3
T�t� � 77.90 � 14.10 cos��t
6� 3.67�.
t � 1t,CT
v < 0.v > 0,
tv � 1.75 sin �t
2,
v < 0.v > 0,
tv � 0.85 sin �t
3,
v
78. Data Analysis: Astronomy The percent of themoon’s face that is illuminated on day of the year2007, where represents January 1, is shown inthe table. (Source: U.S. Naval Observatory)
(a) Create a scatter plot of the data.
(b) Find a trigonometric model that fits the data.
(c) Add the graph of your model in part (b) to thescatter plot. How well does the model fit the data?
(d) What is the period of the model?
(e) Estimate the moon’s percent illumination forMarch 12, 2007.
x � 1x
y
Model It
x y
3 1.0
11 0.5
19 0.0
26 0.5
32 1.0
40 0.5
Month, t Tallahassee, T Chicago, C
1 63.8 29.6
2 67.4 34.7
3 74.0 46.1
4 80.0 58.0
5 86.5 69.9
6 90.9 79.2
7 92.0 83.5
8 91.5 81.2
9 88.5 73.9
10 81.2 62.1
11 72.9 47.1
12 65.8 34.4

79. Fuel Consumption The daily consumption (in gal-lons) of diesel fuel on a farm is modeled by
where is the time (in days), with corresponding toJanuary 1.
(a) What is the period of the model? Is it what youexpected? Explain.
(b) What is the average daily fuel consumption? Whichterm of the model did you use? Explain.
(c) Use a graphing utility to graph the model. Use thegraph to approximate the time of the year whenconsumption exceeds 40 gallons per day.
80. Ferris Wheel A Ferris wheel is built such that the height(in feet) above ground of a seat on the wheel at time (in
seconds) can be modeled by
(a) Find the period of the model. What does the period tellyou about the ride?
(b) Find the amplitude of the model. What does the ampli-tude tell you about the ride?
(c) Use a graphing utility to graph one cycle of the model.
Synthesis
True or False? In Exercises 81– 83, determine whether thestatement is true or false. Justify your answer.
81. The graph of the function given by translates the graph of exactly one period tothe right so that the two graphs look identical.
82. The function given by has an amplitude thatis twice that of the function given by
83. The graph of is a reflection of the graph ofin the -axis.
84. Writing Use a graphing utility to graph the function givenby for several different values of
and Write a paragraph describing the changes in thegraph corresponding to changes in each constant.
Conjecture In Exercises 85 and 86, graph and on thesame set of coordinate axes. Include two full periods. Makea conjecture about the functions.
85.
86.
87. Exploration Using calculus, it can be shown that the sine and cosine functions can be approximated by the polynomials
and
where is in radians.
(a) Use a graphing utility to graph the sine function and itspolynomial approximation in the same viewingwindow. How do the graphs compare?
(b) Use a graphing utility to graph the cosine function andits polynomial approximation in the same viewingwindow. How do the graphs compare?
(c) Study the patterns in the polynomial approximations ofthe sine and cosine functions and predict the next termin each. Then repeat parts (a) and (b). How did theaccuracy of the approximations change when an addi-tional term was added?
88. Exploration Use the polynomial approximations for thesine and cosine functions in Exercise 87 to approximate thefollowing function values. Compare the results with thosegiven by a calculator. Is the error in the approximation thesame in each case? Explain.
(a) (b) (c)
(d) (e) (f)
Skills Review
In Exercises 89–92, use the properties of logarithms towrite the expression as a sum, difference, and/or constantmultiple of a logarithm.
89. 90.
91. 92.
In Exercises 93–96, write the expression as the logarithm ofa single quantity.
93. 94.
95.
96.
97. Make a Decision To work an extended applicationanalyzing the normal daily maximum temperature andnormal precipitation in Honolulu, Hawaii, click on theMake a Decision button. (Data Source: NOAA)
12�ln 2x � 2 ln x� � 3 ln x
ln 3x � 4 ln y
2 log2 x � log2�xy�12�log10 x � log10 y�
ln zz2 � 1
ln t 3
t � 1
log2x2�x � 3��log10 x � 2
cos �
4cos 1cos��0.5�
sin �
6sin 1sin
1
2
x
cos x � 1 �x 2
2!�
x4
4!sin x � x �
x3
3!�
x5
5!
f �x� � sin x, g�x� � �cos�x ��
2�
f �x� � sin x, g�x� � cos�x ��
2�
gf
d.c,b,a,y � d � a sin�bx � c�,
xy � sin�x � ��2�y � �cos x
y � cos x.y �
12 cos 2x
f �x� � sin xf �x� � sin�x � 2��
h�t� � 53 � 50 sin� �
10t �
�
2�.
th
t � 1t
C � 30.3 � 21.6 sin�2�t
365� 10.9�
C

What you should learn• Sketch the graphs of tangent
functions.
• Sketch the graphs of cotangent functions.
• Sketch the graphs of secantand cosecant functions.
• Sketch the graphs of dampedtrigonometric functions.
Why you should learn itTrigonometric functions canbe used to model real-life situations such as the distancefrom a television camera to a unitin a parade as in Exercise 76.
Graphs of Other Trigonometric Functions
Graph of the Tangent FunctionRecall that the tangent function is odd. That is, Consequently,the graph of is symmetric with respect to the origin. You also knowfrom the identity that the tangent is undefined for values atwhich Two such values are
As indicated in the table, tan increases without bound as approaches fromthe left, and decreases without bound as approaches from the right. So,the graph of has vertical asymptotes at and asshown in Figure 59. Moreover, because the period of the tangent function is vertical asymptotes also occur when where is an integer. Thedomain of the tangent function is the set of all real numbers other than
and the range is the set of all real numbers.
FIGURE 59
Sketching the graph of is similar to sketching the graph ofin that you locate key points that identify the intercepts and
asymptotes. Two consecutive vertical asymptotes can be found by solving theequations
and
The midpoint between two consecutive vertical asymptotes is an -intercept ofthe graph. The period of the function is the distance betweentwo consecutive vertical asymptotes. The amplitude of a tangent function is notdefined. After plotting the asymptotes and the -intercept, plot a few additionalpoints between the two asymptotes and sketch one cycle. Finally, sketch one ortwo additional cycles to the left and right.
x
y � a tan�bx � c�x
bx � c ��
2.bx � c � �
�
2
y � a sin�bx � c�y � a tan�bx � c�
1
2
3
−3
y = tan x
x
y
π2
3π π2
π2−π
23−
x � ��2 � n�,
nx � ��2 � n�,�,
x � ���2,x � ��2y � tan x���2x
��2xx
x � ±��2 � ±1.5708.cos x � 0.tan x � sin x�cos x
y � tan xtan��x� � �tan x.
PERIOD:DOMAIN: ALL
RANGE:VERTICAL ASYMPTOTES: x �
�2 � n�
���, ��x �
�2 � n�
�
x 0 1.5 1.57
Undef. 0 1 14.1 1255.8 Undef.�1�14.1�1255.8tan x
�
2�
4�
�
4�1.5�1.57�
�
2

.
Sketching the Graph of a Tangent Function
Sketch the graph of
SolutionBy solving the equations
and
you can see that two consecutive vertical asymptotes occur at and Between these two asymptotes, plot a few points, including the -intercept,as shown in the table. Three cycles of the graph are shown in Figure 60.
Now try Exercise 7.
Sketching the Graph of a Tangent Function
Sketch the graph of
SolutionBy solving the equations
and
you can see that two consecutive vertical asymptotes occur at andBetween these two asymptotes, plot a few points, including the -inter-
cept, as shown in the table. Three cycles of the graph are shown in Figure 61.
Now try Exercise 9.
By comparing the graphs in Examples 1 and 2, you can see that the graph ofincreases between consecutive vertical asymptotes when
and decreases between consecutive vertical asymptotes when Inother words, the graph for is a reflection in the -axis of the graph for a > 0.xa < 0
a < 0.a > 0,y � a tan�bx � c�
xx � ��4.x � ���4
x ��
4x � �
�
4
2x ��
22x � �
�
2
y � �3 tan 2x.
xx � �.x � ��
x � �x � ��
x
2�
�
2
x
2� �
�
2
y � tan x
2.
1
2
3
−3
y = tan x2y
xπ3π−π
FIGURE 60
6
−6
−4
−2
y = −3 tan 2x
π2
π2
−
y
xπ3π
4 4π34
π4
−−
FIGURE 61
Example 1
x 0
Undef. 3 0 Undef.�3�3 tan 2x
�
4�
8�
�
8�
�
4
x 0
Undef. 0 1 Undef.�1tan x2
��
2�
�
2��
Example 2
Video

.
Some graphing utilities have difficulty graphing trigonometricfunctions that have verticalasymptotes. Your graphing utilitymay connect parts of the graphsof tangent, cotangent, secant, andcosecant functions that are notsupposed to be connected. Toeliminate this problem, changethe mode of the graphing utilityto dot mode.
Techno logy
1
2
3
y = 2 cot
4−2
x3y
xππππ 63π
FIGURE 63
Graph of the Cotangent FunctionThe graph of the cotangent function is similar to the graph of the tangent function.It also has a period of However, from the identity
you can see that the cotangent function has vertical asymptotes when is zero,which occurs at where is an integer. The graph of the cotangent func-tion is shown in Figure 62. Note that two consecutive vertical asymptotes of thegraph of can be found by solving the equations and
Sketching the Graph of a Cotangent Function
Sketch the graph of
SolutionBy solving the equations
and
you can see that two consecutive vertical asymptotes occur at and Between these two asymptotes, plot a few points, including the -intercept, asshown in the table. Three cycles of the graph are shown in Figure 63. Note thatthe period is the distance between consecutive asymptotes.
Now try Exercise 19.
3�,
xx � 3�.x � 0
x � 3�x � 0
x
3� 3�
x
3� 0
y � 2 cot x
3.
bx � c � �.bx � c � 0y � a cot�bx � c�
nx � n�,sin x
y � cot x �cos x
sin x
�.
ππ
1
2
3
y = cot x
22π32
−
y
xπ2π−π
FIGURE 62
PERIOD:DOMAIN: ALL
RANGE:VERTICAL ASYMPTOTES: x � n�
���, ��x � n�
�
x 0
Undef. 2 0 Undef.�22 cot x3
3�9�
43�
23�
4
Example 3Video

.
.
.
.
Graphs of the Reciprocal FunctionsThe graphs of the two remaining trigonometric functions can be obtained fromthe graphs of the sine and cosine functions using the reciprocal identities
and
For instance, at a given value of the -coordinate of sec is the reciprocal ofthe -coordinate of cos Of course, when the reciprocal does notexist. Near such values of the behavior of the secant function is similar to thatof the tangent function. In other words, the graphs of
and
have vertical asymptotes at where is an integer, and the cosineis zero at these -values. Similarly,
and
have vertical asymptotes where —that is, at To sketch the graph of a secant or cosecant function, you should first make a
sketch of its reciprocal function. For instance, to sketch the graph of first sketch the graph of Then take reciprocals of the -coordinates toobtain points on the graph of This procedure is used to obtain thegraphs shown in Figure 64.
In comparing the graphs of the cosecant and secant functions with those ofthe sine and cosine functions, note that the “hills” and “valleys” are interchanged.For example, a hill (or maximum point) on the sine curve corresponds to a valley (a relative minimum) on the cosecant curve, and a valley (or minimum point) onthe sine curve corresponds to a hill (a relative maximum) on the cosecant curve,as shown in Figure 65. Additionally, -intercepts of the sine and cosine functionsbecome vertical asymptotes of the cosecant and secant functions, respectively(see Figure 65).
x
y � csc x.yy � sin x.
y � csc x,
x � n�.sin x � 0
csc x �1
sin xcot x �
cos x
sin x
xnx � ��2 � n�,
sec x �1
cos xtan x �
sin x
cos x
x,cos x � 0,x.y
xyx,
sec x �1
cos x.csc x �
1
sin x
3
4
2
1
−1
−2
−3
−4
πSine:maximum
Sine:minimum
Cosecant:relativemaximum
Cosecant:relativeminimum
π2
y
x
FIGURE 65
2
3
−1π
y = csc x
y = sin x
y
xπ−π
PERIOD:DOMAIN: ALL
RANGE:VERTICAL ASYMPTOTES:SYMMETRY: ORIGIN
FIGURE 64
x � n�
�1, ������, �1�x � n�
2�
x
3
2
−1
−2
−3
π ππ
y = sec x
y = cos x
2−
y
2π
PERIOD:DOMAIN: ALL
RANGE:VERTICAL ASYMPTOTES:SYMMETRY: -AXISy
x ��2 � n�
�1, ������, �1�x �
�2 � n�
2�
Video
Video
Video
Simulation

Sketching the Graph of a Cosecant Function
Sketch the graph of
SolutionBegin by sketching the graph of
For this function, the amplitude is 2 and the period is By solving the equations
and
you can see that one cycle of the sine function corresponds to the interval fromto The graph of this sine function is represented by the
gray curve in Figure 66. Because the sine function is zero at the midpoint andendpoints of this interval, the corresponding cosecant function
has vertical asymptotes at etc. The graph ofthe cosecant function is represented by the black curve in Figure 66.
Now try Exercise 25.
Sketching the Graph of a Secant Function
Sketch the graph of
SolutionBegin by sketching the graph of as indicated by the gray curve inFigure 67. Then, form the graph of as the black curve in the figure.Note that the -intercepts of
correspond to the vertical asymptotes
of the graph of Moreover, notice that the period of andis
Now try Exercise 27.
�.y � sec 2xy � cos 2xy � sec 2x.
x �3�
4, . . .x �
�
4,x � �
�
4,
�3�
4, 0�, . . .��
4, 0�,��
�
4, 0�,
y � cos 2xxy � sec 2x
y � cos 2x,
y � sec 2x.
x � ���4, x � 3��4, x � 7��4,
� 2� 1sin�x � ���4���
y � 2 csc�x ��
4�
x � 7��4.x � ���4
x �7�
4x � �
�
4
x ��
4� 2�x �
�
4� 0
2�.
y � 2 sin�x ��
4�.
y � 2 csc�x ��
4�.
Example 4
Example 5
π
π
π
1
3
4
2
y = 2 csc x +4( ) πy = 2 sin x +
4( )y
x
FIGURE 66
π−π ππ22
y = sec 2x y = cos 2x
3
−2
−3
−1−
y
x
FIGURE 67

.
.
Damped Trigonometric GraphsA product of two functions can be graphed using properties of the individualfunctions. For instance, consider the function
as the product of the functions and Using properties of absolutevalue and the fact that you have Consequently,
which means that the graph of lies between the lines andFurthermore, because
at
and
at
the graph of touches the line or the line at andhas -intercepts at A sketch of is shown in Figure 68. In the function
the factor is called the damping factor.
Damped Sine Wave
Sketch the graph of
SolutionConsider as the product of the two functions
and
each of which has the set of real numbers as its domain. For any real number you know that and So, which meansthat
Furthermore, because
at
and
at
the graph of touches the curves and at and has intercepts at A sketch is shown in Figure 69.
Now try Exercise 65.
x � n��3.x � ��6 � n��3y � e�xy � �e�xf
x �n�
3f �x� � e�x sin 3x � 0
x ��
6�
n�
3f �x� � e�x sin 3x � ±e�x
�e�x ≤ e�x sin 3x ≤ e�x.
e�x sin 3x ≤ e�x,sin 3x ≤ 1.e�x ≥ 0x,
y � sin 3xy � e�x
f �x�
f �x� � e�x sin 3x.
xf �x� � x sin x,fx � n�.x
x � ��2 � n�y � xy � �xf
x � n�f �x� � x sin x � 0
x ��
2� n�f �x� � x sin x � ±x
y � x.y � �xf �x� � x sin x
�x ≤ x sin x ≤ x0 ≤ xsin x ≤ x.sin x ≤ 1,
y � sin x.y � x
f �x� � x sin x
Example 6
π
−ππ
π
π3
π−3
2
π−2
f(x) = x sin x
yy = −x = x
y
x
FIGURE 68
π ππ3 3
2
6
4
−4
−6
y = e−x
y = −e−x
f(x) = e−x sin 3x y
x
FIGURE 69
Do you see why the graph oftouches the lines
at andwhy the graph has -interceptsat Recall that the sinefunction is equal to 1 at
odd multiplesof and is equal to 0 at
multiples of ��.�3�, . . .2�,�,��2�
�5��2, . . . 3��2,��2,
x � n�?x
x � ��2 � n�y � ±xf �x� � x sin x
Simulation
Video

Figure 70 summarizes the characteristics of the six basic trigonometric functions.
y = sin x
π π−π ππ−2 22
3
2
1
−2
y
x
DOMAIN: ALL REALS
RANGE:PERIOD: 2�
��1, 1�
y = cos x
π ππ− 2
2
−1
−2
y
x
DOMAIN: ALL REALS
RANGE:PERIOD: 2�
��1, 1�
y = tan x
π
2
3
1
y
xπ52
π2
3π2
π2−
DOMAIN: ALL
RANGE:PERIOD: �
���, ��x �
�2 � n�
y = csc x =
π2
2
3
1
1sin xy
x−π π π2
DOMAIN: ALL
RANGE:PERIOD:FIGURE 70
2�
�1, ������, �1�x � n�
π ππ
3
−2
−3
2−
y = sec x = 1cos xy
xπ2
3π2
− π2
DOMAIN: ALL
RANGE:PERIOD: 2�
�1, ������, �1�x �
�2 � n�
y x == cot
2
3
1
tan x1y
xπ π2
DOMAIN: ALL
RANGE:PERIOD: �
���, ��x � n�
W RITING ABOUT MATHEMATICS
Combining Trigonometric Functions Recall from the “Combinations of Functions:Composite Functions” section that functions can be combined arithmetically.This also applies to trigonometric functions. For each of the functions
and
(a) identify two simpler functions and that comprise the combination, (b) use atable to show how to obtain the numerical values of from the numerical valuesof and and (c) use graphs of and to show how may be formed.
Can you find functions
and
such that for all x?f �x� � g�x� � 0
g�x� � d � a cos�bx � c�f �x� � d � a sin�bx � c�
hgfg�x�,f �x�h�x�
gf
h�x� � cos x � sin 3xh�x� � x � sin x

The symbol indicates an exercise in which you are instructed to use graphing technology or a symbolic computer algebra system.
Click on to view the complete solution of the exercise.
Click on to print an enlarged copy of the graph.
Click on to view the Make a Decision exercise.
Exercises
In Exercises 1–6, match the function with its graph. Statethe period of the function. [The graphs are labeled (a), (b),(c), (d), (e), and (f).]
(a) (b)
(c) (d)
(e) (f)
1. 2.
3. 4.
5. 6.
In Exercises 7–30, sketch the graph of the function. Includetwo full periods.
7. 8.
9. 10.
11. 12.
13. 14.
15. 16.
17. 18.
19. 20.
21. 22.
23. 24.
25. 26.
27. 28.
29. 30.
In Exercises 31– 40, use a graphing utility to graph thefunction. Include two full periods.
31. 32.
33. 34.
35. 36.
37. 38.
39. 40. y �1
3 sec��x
2�
�
2�y � 0.1 tan��x
4�
�
4�y � 2 sec�2x � ��y � �csc�4x � ��
y �1
4 cot�x �
�
2�y � tan�x ��
4�y � sec �xy � �2 sec 4x
y � �tan 2xy � tan x
3
y � 2 cot�x ��
2�y �1
4 csc�x �
�
4�y � �sec� x � 1y � 2 sec�x � ��y � csc�2x � ��y � csc�� � x�
y � tan�x � ��y � tan �x
4
y � �12 tan xy �
12 sec 2x
y � 3 cot �x
2y � cot
x
2
y � csc x
3y � csc
x
2
y � �2 sec 4x � 2y � sec �x � 1
y � 3 csc 4xy � csc �x
y �14 sec xy � �
12 sec x
y � �3 tan �xy � tan 3x
y �14 tan xy �
13 tan x
y � �2 sec �x
2y �
1
2 sec
�x
2
y � �csc xy �1
2 cot �x
y � tan x
2y � sec 2x
3
1
y
x
4
2
y
x
3
2
32 2
3
y
x
34
12
2
34
23
y
x
2
1
y
x
1
2
1
y
x
VOCABULARY CHECK: Fill in the blanks.
1. The graphs of the tangent, cotangent, secant, and cosecant functions all have ________ asymptotes.
2. To sketch the graph of a secant or cosecant function, first make a sketch of its corresponding ________ function.
3. For the functions given by is called the ________ factor of the function
4. The period of is ________.
5. The domain of is all real numbers such that ________.
6. The range of is ________.
7. The period of is ________.y � csc x
y � sec x
y � cot x
y � tan x
f �x�.g�x�f �x� � g�x� � sin x,
Glossary

In Exercises 41– 48, use a graph to solve the equation on theinterval
41.
42.
43.
44.
45.
46.
47.
48.
In Exercises 49 and 50, use the graph of the function todetermine whether the function is even, odd, or neither.
49. 50.
51. Graphical Reasoning Consider the functions given by
and
on the interval
(a) Graph and in the same coordinate plane.
(b) Approximate the interval in which
(c) Describe the behavior of each of the functions as approaches How is the behavior of related to thebehavior of as approaches
52. Graphical Reasoning Consider the functions given by
and
on the interval
(a) Use a graphing utility to graph and in the sameviewing window.
(b) Approximate the interval in which
(c) Approximate the interval in which How doesthe result compare with that of part (b)? Explain.
In Exercises 53–56, use a graphing utility to graph the twoequations in the same viewing window. Use the graphs todetermine whether the expressions are equivalent. Verifythe results algebraically.
53.
54.
55.
56.
In Exercises 57– 60, match the function with its graph.Describe the behavior of the function as approacheszero. [The graphs are labeled (a), (b), (c), and (d).]
(a) (b)
(c) (d)
57.
58.
59.
60.
Conjecture In Exercises 61–64, graph the functions andUse the graphs to make a conjecture about the
relationship between the functions.
61.
62.
63.
64.
In Exercises 65–68, use a graphing utility to graph thefunction and the damping factor of the function in thesame viewing window. Describe the behavior of thefunction as increases without bound.
65. 66.
67. 68.
Exploration In Exercises 69–74, use a graphing utility tograph the function. Describe the behavior of the functionas approaches zero.
69. 70. x > 0y �4x
� sin 2x,x > 0y �6
x� cos x,
x
h�x� � 2�x2�4 sin xf �x� � 2�x�4 cos �x
f �x� � e�x cos xg�x� � e�x2�2 sin x
x
g�x� �1
2�1 � cos � x�f �x� � cos2
�x
2,
g�x� �12�1 � cos 2x�f �x� � sin2 x,
g�x� � 2 sin xf �x� � sin x � cos�x ��
2�,
g�x� � 0f �x� � sin x � cos�x ��
2�,
g.f
g�x� � �x� cos x
g�x� � �x� sin x
f �x� � x sin x
f �x� � �x cos x�
1
2
2
4
1
3
y
x
4
2
2
4
y
x
4
2
2 23
4
y
x
6
2
122
345
y
x
x
y2 � tan2 xy1 � sec2 x � 1,
y2 � cot xy1 �cos x
sin x,
y2 � tan xy1 � sin x sec x,
y2 � 1y1 � sin x csc x,
2f < 2g.
f < g.
gf
��1, 1�.
g�x� �1
2 sec
�x
2f �x� � tan
�x
2
�?xfg�.
x
f > g.
gf
�0, ��.
g�x� �1
2 csc xf �x� � 2 sin x
f �x� � tan xf �x� � sec x
csc x � �2�3
3
csc x � �2
sec x � 2
sec x � �2
cot x � 1
cot x � ��33
tan x � �3
tan x � 1
[�2�, 2� ].

71. 72.
73. 74.
75. Distance A plane flying at an altitude of 7 miles above aradar antenna will pass directly over the radar antenna (seefigure). Let be the ground distance from the antenna tothe point directly under the plane and let be the angle ofelevation to the plane from the antenna. ( is positive as theplane approaches the antenna.) Write as a function of and graph the function over the interval
76. Television Coverage A television camera is on areviewing platform 27 meters from the street on which aparade will be passing from left to right (see figure). Writethe distance from the camera to a particular unit in theparade as a function of the angle and graph the functionover the interval (Consider asnegative when a unit in the parade approaches from theleft.)
78. Sales The projected monthly sales (in thousands ofunits) of lawn mowers (a seasonal product) are modeled by
where is the time (inmonths), with corresponding to January. Graph thesales function over 1 year.
79. Meterology The normal monthly high temperatures (in degrees Fahrenheit) for Erie, Pennsylvania are approximated by
and the normal monthly low temperatures are approxi-mated by
where is the time (in months), with correspondingto January (see figure). (Source: National Oceanic andAtmospheric Administration)
(a) What is the period of each function?
(b) During what part of the year is the difference betweenthe normal high and normal low temperatures greatest?When is it smallest?
(c) The sun is northernmost in the sky around June 21, butthe graph shows the warmest temperatures at a laterdate. Approximate the lag time of the temperaturesrelative to the position of the sun.
Month of year
Tem
pera
ture
(in
degr
ees
Fah
renh
eit)
1 2 3 4 5 6 7 8 9 10 11 12
20
40
60
80
t
H(t)
L(t)
t � 1t
L�t� � 39.36 � 15.70 cos � t
6� 14.16 sin
� t
6
L
H�t� � 54.33 � 20.38 cos � t
6� 15.69 sin
� t
6
H
t � 1tS � 74 � 3t � 40 cos��t�6�,
S
xd
Camera
27 m
Not drawn to scale
x���2 < x < ��2.x,
d
x
7 mi
d
Not drawn to scale
0 < x < �.xd
dx
d
h�x� � x sin 1
xf �x� � sin
1
x
f �x� �1 � cos x
xg�x� �
sin x
x
77. Predator-Prey Model The population of coyotes (apredator) at time (in months) in a region is estimatedto be
and the population of rabbits (its prey) is estimated tobe
R
C � 5000 � 2000 sin � t12
tC
Model It
Model It (cont inued)
(a) Use a graphing utility to graph both models in thesame viewing window. Use the window setting
(b) Use the graphs of the models in part (a) to explainthe oscillations in the size of each population.
(c) The cycles of each population follow a periodicpattern. Find the period of each model and describeseveral factors that could be contributing to thecyclical patterns.
0 ≤ t ≤ 100.
R � 25,000 � 15,000 cos � t
12.

80. Harmonic Motion An object weighing pounds issuspended from the ceiling by a steel spring (see figure).The weight is pulled downward (positive direction) fromits equilibrium position and released. The resulting motionof the weight is described by the function
where is the distance (in feet) and is the time (in seconds).
(a) Use a graphing utility to graph the function.
(b) Describe the behavior of the displacement function forincreasing values of time
Synthesis
True or False? In Exercises 81 and 82, determine whetherthe statement is true or false. Justify your answer.
81. The graph of can be obtained on a calculator bygraphing the reciprocal of
82. The graph of can be obtained on a calculator bygraphing a translation of the reciprocal of
83. Writing Describe the behavior of as approaches from the left and from the right.
84. Writing Describe the behavior of as approaches from the left and from the right.
85. Exploration Consider the function given by
(a) Use a graphing utility to graph the function and verifythat there exists a zero between 0 and 1. Use the graphto approximate the zero.
(b) Starting with generate a sequence where For example,
What value does the sequence approach?
86. Approximation Using calculus, it can be shown that thetangent function can be approximated by the polynomial
where is in radians. Use a graphing utility to graph thetangent function and its polynomial approximation in thesame viewing window. How do the graphs compare?
87. Approximation Using calculus, it can be shown that thesecant function can be approximated by the polynomial
where is in radians. Use a graphing utility to graph thesecant function and its polynomial approximation in thesame viewing window. How do the graphs compare?
88. Pattern Recognition
(a) Use a graphing utility to graph each function.
(b) Identify the pattern started in part (a) and find afunction that continues the pattern one more term.Use a graphing utility to graph
(c) The graphs in parts (a) and (b) approximate the periodicfunction in the figure. Find a function that is a betterapproximation.
Skills Review
In Exercises 89–92, solve the exponential equation. Roundyour answer to three decimal places.
89. 90.
91. 92.
In Exercises 93–98, solve the logarithmic equation. Roundyour answer to three decimal places.
93. 94.
95. 96.
97.
98. log6 x � log6�x2 � 1� � log6 64x
log8 x � log8�x � 1� �13
ln �x � 4 � 5ln�x2 � 1� � 3.2
ln�14 � 2x� � 68ln�3x � 2� � 73
�1 �0.15365 �
365t
� 5300
1 � e�x � 100
83x � 98e2x � 54
3
1
y
x
y4
y3.y3
y2 �4
��sin �x �1
3 sin 3�x �
1
5 sin 5�x�
y1 �4
��sin �x �1
3 sin 3�x�
x
sec x 1 �x 2
2!�
5x4
4!
x
tan x x �2x3
3!�
16x 5
5!
�
x3 � cos�x2�x2 � cos�x1�x1 � cos�x0�x0 � 1
xn � cos�xn�1�.x3, . . . ,x1, x2,x0 � 1,
f �x� � x � cos x.
�xf �x� � csc x
��2xf �x� � tan x
y � sin x.y � sec x
y � sin x.y � csc x
t.
Equilibrium
y
ty
t > 0y �1
2e�t�4 cos 4t,
W

Inverse Sine FunctionRecall from the “Inverse Functions” section that, for a function to have an inversefunction, it must be one-to-one—that is, it must pass the Horizontal Line Test.From Figure 71, you can see that does not pass the test because differ-ent values of yield the same -value.
FIGURE 71
However, if you restrict the domain to the interval (corresponding to the black portion of the graph in Figure 71), the followingproperties hold.
1. On the interval the function is increasing.
2. On the interval takes on its full range of values,
3. On the interval is one-to-one.
So, on the restricted domain , has a unique inversefunction called the inverse sine function. It is denoted by
or
The notation is consistent with the inverse function notation Thearcsin notation (read as “the arcsine of ”) comes from the association of acentral angle with its intercepted arc length on a unit circle. So, arcsin meansthe angle (or arc) whose sine is Both notations, arcsin and arecommonly used in mathematics, so remember that denotes the inversesine function rather than The values of arcsin lie in the interval
The graph of is shown in Example 2.y � arcsin x���2 ≤ arcsin x ≤ ��2.x1�sin x.
sin�1 xsin�1 x,xx.
xxx
f �1�x�.sin�1 x
y � sin�1 x.y � arcsin x
y � sin x���2 ≤ x ≤ ��2
y � sin x����2, ��2�,�1 ≤ sin x ≤ 1.
y � sin x����2, ��2�,y � sin x����2, ��2�,
���2 ≤ x ≤ ��2
1
−1
on this interval.sin x has an inverse function
y = sin x
ππ−
y
x
yxy � sin x
What you should learn• Evaluate and graph the
inverse sine function.
• Evaluate and graph the other inverse trigonometricfunctions.
• Evaluate and graph the compositions oftrigonometric functions.
Why you should learn itYou can use inverse trigonometricfunctions to model and solve real-life problems. For instance,in Exercise 92, an inverse trigono-metric function can be used tomodel the angle subtended by a television camera x meters froma space shuttle launch.
Inverse Trigonometric Functions
Definition of Inverse Sine FunctionThe inverse sine function is defined by
if and only if
where and The domain of isand the range is ����2, ��2�.��1, 1�,
y � arcsin x���2 ≤ y ≤ ��2.�1 ≤ x ≤ 1
sin y � xy � arcsin xWhen evaluating the inverse sinefunction, it helps to rememberthe phrase “the arcsine of isthe angle (or number) whosesine is x.”
x

.
.
Evaluating the Inverse Sine Function
If possible, find the exact value.
a. b. c.
Solution
a. Because for it follows that
Angle whose sine is
b. Because for it follows that
Angle whose sine is
c. It is not possible to evaluate when because there is no anglewhose sine is 2. Remember that the domain of the inverse sine function is
Now try Exercise 1.
Graphing the Arcsine Function
Sketch a graph of
SolutionBy definition, the equations and are equivalent for
So, their graphs are the same. From the intervalyou can assign values to in the second equation to make a table
of values. Then plot the points and draw a smooth curve through the points.
The resulting graph for is shown in Figure 72. Note that it is thereflection (in the line ) of the black portion of the graph in Figure 71. Besure you see that Figure 72 shows the entire graph of the inverse sine function.Remember that the domain of is the closed interval and therange is the closed interval
Now try Exercise 17.
����2, ��2�.��1, 1�y � arcsin x
y � xy � arcsin x
y����2, ��2�,���2 ≤ y ≤ ��2.
sin y � xy � arcsin x
y � arcsin x.
��1, 1�.
x � 2y � sin�1 x
�3�2sin�1 �3
2�
�
3.
��
2≤ y ≤
�
2,sin
�
3 �
�3
2
�12arcsin��
1
2� � ��
6.
��
2≤ y ≤
�
2,sin��
�
6� � �1
2
sin�1 2sin�1 �3
2arcsin��
1
2�
As with the trigonometricfunctions, much of the workwith the inverse trigonometricfunctions can be done by exactcalculations rather than by cal-culator approximations. Exactcalculations help to increaseyour understanding of theinverse functions by relatingthem to the right triangledefinitions of the trigonometricfunctions.
1
y = arcsin x
2
2
(0, 0)
2
621
−−
( )
( )
−1,
,
π
2( )1, π
621 −−( ), π
π
π
π 422 −− )( , π
422( ), π
y
x
FIGURE 72
Example 1
Example 2
y 0
0 1�22
12
�12
��22
�1x � sin y
�
2�
4�
6�
�
6�
�
4�
�
2
Simulation
Video

Other Inverse Trigonometric FunctionsThe cosine function is decreasing and one-to-one on the interval asshown in Figure 73.
FIGURE 73
Consequently, on this interval the cosine function has an inverse function—theinverse cosine function—denoted by
or
Similarly, you can define an inverse tangent function by restricting the domainof to the interval The following list summarizes thedefinitions of the three most common inverse trigonometric functions. Theremaining three are defined in Exercises 101–103.
The graphs of these three inverse trigonometric functions are shown inFigure 74.
����2, ��2�.y � tan x
y � cos�1 x.y � arccos x
−1
cos x has an inverse functionon this interval.
y = cos x
ππ π2
π− 2
y
x
0 ≤ x ≤ �,
1−1
y x= arcsin
2π
2π−
y
x
DOMAIN:RANGE:FIGURE 74
���2, �2�
��1, 1�
1−1
y x= arccos
π
2π
y
x
DOMAIN:RANGE: �0, ��
��1, 1�
1 2−1
−
−2
2
2
π
π
y x= arctan
y
x
DOMAIN:RANGE: ���
2, �2����, ��
Definitions of the Inverse Trigonometric FunctionsFunction Domain Range
if and only if
if and only if
if and only if ��
2< y <
�
2�� < x < �tan y � xy � arctan x
0 ≤ y ≤ ��1 ≤ x ≤ 1cos y � xy � arccos x
��
2≤ y ≤
�
2�1 ≤ x ≤ 1sin y � xy � arcsin x

.
Evaluating Inverse Trigonometric Functions
Find the exact value.
a. b.
c. d.
Solutiona. Because and lies in it follows that
Angle whose cosine is
b. Because and lies in it follows that
Angle whose cosine is
c. Because and 0 lies in it follows that
Angle whose tangent is 0
d. Because and lies in it follows that
Angle whose tangent is
Now try Exercise 11.
Calculators and Inverse Trigonometric Functions
Use a calculator to approximate the value (if possible).
a.
b.
c.
SolutionFunction Mode Calculator Keystrokes
a. Radian 8.45
From the display, it follows that
b. Radian 0.2447
From the display, it follows that
c. Radian 2
In real number mode, the calculator should display an error message becausethe domain of the inverse cosine function is
Now try Exercise 25.
In Example 4, if you had set the calculator to degree mode, the displayswould have been in degrees rather than radians. This convention is peculiar tocalculators. By definition, the values of inverse trigonometric functions arealways in radians.
��1, 1�.
arccos 2
sin�1 0.2447 0.2472103.
sin�1 0.2447
arctan��8.45� �1.453001.
arctan��8.45�
arccos 2
sin�1 0.2447
arctan��8.45�
�1tan�1��1� � ��
4.
����2, ��2�,���4tan����4� � �1,
arctan 0 � 0.
����2, ��2�,tan 0 � 0,
�1cos�1��1� � �.
�0, ��,�cos � � �1,
�2�2arccos �2
2�
�
4.
�0, ��,��4cos���4� � �2�2,
tan�1��1�arctan 0
cos�1��1�arccos �2
2
It is important to remember thatthe domain of the inverse sinefunction and the inverse cosinefunction is as indicatedin Example 4(c).
��1, 1�,
Example 3
Example 4
TAN�1 �� � ENTER
SIN�1 ENTER
COS�1 ENTER
�
�
Video

Compositions of FunctionsRecall from the “Inverse Functions” section that for all in the domains of and
inverse functions have the properties
and
Keep in mind that these inverse properties do not apply for arbitrary valuesof and For instance,
In other words, the property
is not valid for values of outside the interval
Using Inverse Properties
If possible, find the exact value.
a. b. c.
Solutiona. Because lies in the domain of the arctan function, the inverse property
applies, and you have
b. In this case, does not lie within the range of the arcsine function,However, is coterminal with
which does lie in the range of the arcsine function, and you have
c. The expression is not defined because is not defined.Remember that the domain of the inverse cosine function is
Now try Exercise 43.
��1, 1�.cos�1 �cos�cos�1 ��
arcsin�sin 5�
3 � � arcsin�sin�� �
3� � ��
3.
5�
3� 2� � �
�
3
5��3���2 ≤ y ≤ ��2.5��3
tan�arctan��5�� � �5.
�5
cos�cos�1 ��arcsin�sin 5�
3 �tan�arctan��5��
����2, ��2�.y
arcsin�sin y� � y
arcsin�sin 3�
2 � � arcsin��1� � ��
2�
3�
2.
y.x
f �1� f �x�� � x.f � f �1�x�� � x
f �1,fx
Inverse Properties of Trigonometric FunctionsIf and then
and
If and then
and
If is a real number and then
and arctan�tan y� � y.tan�arctan x� � x
���2 < y < ��2,x
arccos�cos y� � y.cos�arccos x� � x
0 ≤ y ≤ �,�1 ≤ x ≤ 1
arcsin�sin y� � y.sin�arcsin x� � x
���2 ≤ y ≤ ��2,�1 ≤ x ≤ 1
Example 5

.
Example 6 shows how to use right triangles to find exact values ofcompositions of inverse functions. Then, Example 7 shows how to use righttriangles to convert a trigonometric expression into an algebraic expression. Thisconversion technique is used frequently in calculus.
Evaluating Compositions of Functions
Find the exact value.
a. b.
Solutiona. If you let then Because is positive, is a first-
quadrant angle. You can sketch and label angle as shown in Figure 75.Consequently,
b. If you let then Because is negative, is afourth-quadrant angle. You can sketch and label angle as shown in Figure76. Consequently,
Now try Exercise 51.
Some Problems from Calculus
Write each of the following as an algebraic expression in
a. b.
SolutionIf you let then where Because
you can sketch a right triangle with acute angle as shown in Figure 77. Fromthis triangle, you can easily convert each expression to algebraic form.
a.
b.
Now try Exercise 59.
In Example 7, similar arguments can be made for values lying in theinterval ��1
3, 0�.x-
0 ≤ x <1
3cot�arccos 3x� � cot u �
adj
opp�
3x
�1 � 9x2,
0 ≤ x ≤1
3sin�arccos 3x� � sin u �
opp
hyp� �1 � 9x2,
u,
cos u �adj
hyp�
3x
1
�1 ≤ 3x ≤ 1.cos u � 3x,u � arccos 3x,
0 ≤ x <1
3cot�arccos 3x�,0 ≤ x ≤
1
3sin�arccos 3x�,
x.
cos�arcsin��3
5� � cos u �adj
hyp�
4
5.
uusin usin u � �
35.u � arcsin��3
5�,
tan�arccos 2
3� � tan u �opp
adj�
�5
2.
uucos ucos u �
23.u � arccos 23,
cos�arcsin��3
5� tan�arccos 2
3�
Example 6
Example 7
2
3 3 − 2 5=2 2
u = arccos
y
x
23
Angle whose cosine is FIGURE 75
23
52 − −32 = 4( )
5−3
y
xu = arcsin − 3
5( (
Angle whose sine is FIGURE 76
�35
3x
11 − (3x)2
u = arccos 3x
Angle whose cosine is FIGURE 77
3x
Video

The symbol indicates an exercise in which you are instructed to use graphing technology or a symbolic computer algebra system.
Click on to view the complete solution of the exercise.
Click on to print an enlarged copy of the graph.
Click on to view the Make a Decision exercise.
Exercises
In Exercises 1–16, evaluate the expression without using acalculator.
1. 2.
3. 4.
5. 6.
7. 8.
9. 10.
11. 12.
13. 14.
15. 16.
In Exercises 17 and 18, use a graphing utility to graph and in the same viewing window to verify geometri-cally that is the inverse function of (Be sure to restrictthe domain of properly.)
17.
18.
In Exercises 19–34, use a calculator to evaluate the expres-sion. Round your result to two decimal places.
19. 20.
21. 22.
23. 24.
25. 26.
27. 28.
29. 30.
31. 32.
33. 34.
In Exercises 35 and 36, determine the missing coordinatesof the points on the graph of the function.
35. 36.
In Exercises 37–42, use an inverse trigonometric function towrite as a function of 37. 38.
39. 40.
41. 42.
In Exercises 43–48, use the properties of inverse trigono-metric functions to evaluate the expression.
43. 44.
45. 46.
47. 48. arccos�cos 7�
2 �arcsin�sin 3��
sin�arcsin��0.2��cos�arccos��0.1��tan�arctan 25�sin�arcsin 0.3�
x2 1
x 1
x + 3
2x
x + 1
10
x + 25
4
x
4
x
x.�
1 22 1
21
4
,( )6,( )
y = arccos x( 1, )
y
x
1 2 323
6
2
4
,( )( )3,
4,( )
y = arctan xy
x
tan�1��957 �tan�1 72
arccos��13�arcsin 34
arctan 2.8arctan 0.92
arcsin��0.125�arccos��0.41�cos�1 0.26sin�1 0.31
arctan 15arctan��3�arccos��0.7�arcsin��0.75�arcsin 0.45arccos 0.28
g�x� � arctan xf �x� � tan x,
g�x� � arcsin xf �x� � sin x,
ff.g
y � xf, g,
cos�1 1tan�1 0
tan�1���3
3 �sin�1 �3
2
arcsin �2
2arccos�� 1
2�arctan �3arctan���3 �
sin�1���2
2 �cos�1���3
2 �arctan��1�arctan
�3
3
arccos 0arccos 12
arcsin 0arcsin 12
VOCABULARY CHECK: Fill in the blanks.
Function Alternative Notation Domain Range
1. __________ __________
2. __________ __________
3. __________ __________ __________y � arctan x
�1 ≤ x ≤ 1y � cos�1 x
��
2≤ y ≤
�
2y � arcsin x
Glossary

In Exercises 49–58, find the exact value of the expression.(Hint: Sketch a right triangle.)
49. 50.
51. 52.
53. 54.
55. 56.
57. 58.
In Exercises 59–68, write an algebraic expression that isequivalent to the expression. (Hint: Sketch a right triangle,as demonstrated in Example 7.)
59. 60.
61. 62.
63. 64.
65.
66.
67.
68.
In Exercises 69 and 70, use a graphing utility to graph andin the same viewing window to verify that the two
functions are equal. Explain why they are equal. Identifyany asymptotes of the graphs.
69.
70.
In Exercises 71–74, fill in the blank.
71.
72.
73.
74.
In Exercises 75 and 76, sketch a graph of the function andcompare the graph of with the graph of
75. 76.
In Exercises 77–82, sketch a graph of the function.
77.
78.
79.
80.
81.
82.
In Exercises 83– 88, use a graphing utility to graph thefunction.
83.
84.
85.
86.
87.
88.
In Exercises 89 and 90, write the function in terms of thesine function by using the identity
Use a graphing utility to graph both forms of the function.What does the graph imply?
89.
90.
91. Docking a Boat A boat is pulled in by means of a winchlocated on a dock 5 feet above the deck of the boat (see fig-ure). Let be the angle of elevation from the boat to thewinch and let be the length of the rope from the winch tothe boat.
(a) Write as a function of
(b) Find when feet and feet.s � 20s � 40�
s.�
5 fts
θ
s�
f �t� � 4 cos � t � 3 sin � t
f �t� � 3 cos 2t � 3 sin 2t
A cos �t � B sin �t � �A2 � B2 sin�t � arctan AB.
f �x� ��
2� cos�1�1
��
f �x� � � � sin�1�23�
f �x� � �3 � arctan��x�f �x� � arctan�2x � 3�f �x� � � arcsin�4x�f �x� � 2 arccos�2x�
f �x� � arccos x
4
h�v� � tan�arccos v�
f �x� ��
2� arctan x
f �x) � arctan 2x
g�t� � arccos�t � 2�y � 2 arccos x
g�x� � arcsin x
2g�x� � arcsin�x � 1�
f �x� � arcsin x.g
x � 2 ≤ 2arccos x � 2
2� arctan���,
arccos 3
�x 2 � 2x � 10� arcsin���
0 ≤ x ≤ 6arcsin �36 � x 2
6� arccos���,
x � 0arctan 9
x� arcsin���,
g�x� ��4 � x 2
xf �x� � tan�arccos
x
2�,
g�x� �2x
�1 � 4x2f �x� � sin�arctan 2x�,
gf
cos�arcsin x � h
r �
csc�arctan x�2�
cot�arctan 1
x�
tan�arccos x
3�sec�arcsin�x � 1��sin�arccos x�sec�arctan 3x�cos�arcsin 2x�sin�arctan x�cot�arctan x�
cot �arctan 58�sin�arccos��23��
tan�arcsin��34��sec�arctan��3
5��csc�arctan�� 5
12��cos�arcsin 513�
sin�cos�1 �5
5 �cos�tan�1 2�
sec�arcsin 45�sin�arctan 34�

92. Photography A television camera at ground level is film-ing the lift-off of a space shuttle at a point 750 meters fromthe launch pad (see figure). Let be the angle of elevationto the shuttle and let be the height of the shuttle.
(a) Write as a function of
(b) Find when meters and meters.
94. Granular Angle of Repose Different types of granularsubstances naturally settle at different angles when storedin cone-shaped piles. This angle is called the angle ofrepose (see figure). When rock salt is stored in a cone-shaped pile 11 feet high, the diameter of the pile’s base isabout 34 feet. (Source: Bulk-Store Structures, Inc.)
(a) Find the angle of repose for rock salt.
(b) How tall is a pile of rock salt that has a base diameterof 40 feet?
95. Granular Angle of Repose When whole corn is stored ina cone-shaped pile 20 feet high, the diameter of the pile’sbase is about 82 feet.
(a) Find the angle of repose for whole corn.
(b) How tall is a pile of corn that has a base diameter of100 feet?
96. Angle of Elevation An airplane flies at an altitude of 6miles toward a point directly over an observer. Consider and as shown in the figure.
(a) Write as a function of
(b) Find when miles and mile.
97. Security Patrol A security car with its spotlight on isparked 20 meters from a warehouse. Consider and asshown in the figure.
(a) Write as a function of
(b) Find when meters and meters.x � 12x � 5�
x.�
x
20 m
Not drawn to scale
θ
x�
x � 1x � 7�
x.�
x
6 mi
Not drawn to scale
θ
x�
17 ft
11 ft
θ
�
s � 1200s � 300�
s.�
s
750 mNot drawn to scale
θ
s�
93. Photography A photographer is taking a picture of athree-foot-tall painting hung in an art gallery. The cam-era lens is 1 foot below the lower edge of the painting(see figure). The angle subtended by the camera lens
feet from the painting is
(a) Use a graphing utility to graph as a function of
(b) Move the cursor along the graph to approximatethe distance from the picture when is maximum.
(c) Identify the asymptote of the graph and discuss itsmeaning in the context of the problem.
�
x.�
1 ft
3 ft
x
θαβ
Not drawn to scale
x > 0.� � arctan 3x
x 2 � 4,
x�
Model It

Synthesis
True or False? In Exercises 98–100, determine whetherthe statement is true or false. Justify your answer.
98.
99.
100.
101. Define the inverse cotangent function by restricting thedomain of the cotangent function to the interval and sketch its graph.
102. Define the inverse secant function by restricting thedomain of the secant function to the intervals and and sketch its graph.
103. Define the inverse cosecant function by restricting thedomain of the cosecant function to the intervals
and and sketch its graph.
104. Use the results of Exercises 101–103 to evaluate eachexpression without using a calculator.
(a) (b)
(c) (d)
105. Area In calculus, it is shown that the area ofthe region bounded by the graphs of
and is given by
(see figure). Find the area for the following values of and
(a) (b)
(c) (d)
106. Think About It Use a graphing utility to graph the functions
and
For it appears that Explain why you knowthat there exists a positive real number such that for Approximate the number
107. Think About It Consider the functions given by
and
(a) Use a graphing utility to graph the composite functions and
(b) Explain why the graphs in part (a) are not the graphof the line Why do the graphs of and
differ?
108. Proof Prove each identity.
(a)
(b)
(c)
(d)
(e)
Skills Review
In Exercises 109–112, evaluate the expression. Round yourresult to three decimal places.
109. 110.
111. 112.
In Exercises 113–116, sketch a right triangle correspondingto the trigonometric function of the acute angle Use thePythagorean Theorem to determine the third side. Thenfind the other five trigonometric functions of
113. 114.
115. 116.
117. Partnership Costs A group of people agree to shareequally in the cost of a $250,000 endowment to a college.If they could find two more people to join the group, eachperson’s share of the cost would decrease by $6250. Howmany people are presently in the group?
118. Speed A boat travels at a speed of 18 miles per hour instill water. It travels 35 miles upstream and then returns tothe starting point in a total of 4 hours. Find the speed ofthe current.
119. Compound Interest A total of $15,000 is invested in anaccount that pays an annual interest rate of 3.5%. Find thebalance in the account after 10 years, if interest is compounded (a) quarterly, (b) monthly, (c) daily, and (d) continuously.
120. Profit Because of a slump in the economy, a departmentstore finds that its annual profits have dropped from$742,000 in 2002 to $632,000 in 2004. The profit followsan exponential pattern of decline. What is the expectedprofit for 2008? (Let represent 2002.)t � 2
sec � � 3cos � �56
tan � � 2sin � �34
�.
�.
16�2��1.1�50
10�14��2�8.2�3.4
arcsin x � arctan x
�1 � x 2
arcsin x � arccos x ��
2
x > 0arctan x � arctan 1
x�
�
2,
arctan��x� � �arctan x
arcsin��x� � �arcsin x
f �1 f
f f �1y � x.
f �1 f.f f �1
f �1�x� � arcsin x.f �x� � sin x
a.x > a.g < fa
g > f.x > 0,
g�x� � 6 arctan x.f �x� � �x
x2 2
1
a b
y = 1x + 12
y
a � �1, b � 3a � 0, b � 3
a � �1, b � 1a � 0, b � 1
b.a
Area � arctan b � arctan a
x � bx � a,y � 1��x 2 � 1�,y � 0,
arccsc 2arccot���3�arcsec 1arcsec �2
�0, ��2�,����2, 0�
���2, ��,�0, ��2�
�0, ��,
arctan x �arcsin xarccos x
arctan 1 �5�
4tan
5�
4� 1
arcsin 1
2�
5�
6sin
5�
6�
1
2

.
Applications Involving Right TrianglesIn this section, the three angles of a right triangle are denoted by the letters and (where is the right angle), and the lengths of the sides opposite theseangles by the letters and (where is the hypotenuse).
Solving a Right Triangle
Solve the right triangle shown in Figure 78 for all unknown sides and angles.
FIGURE 78
SolutionBecause it follows that and To solve for use the fact that
So, Similarly, to solve for use the fact that
So,
Now try Exercise 1.
Finding a Side of a Right Triangle
A safety regulation states that the maximum angle of elevation for a rescue ladderis A fire department’s longest ladder is 110 feet. What is the maximum saferescue height?
SolutionA sketch is shown in Figure 79. From the equation it follows that
So, the maximum safe rescue height is about 104.6 feet above the height of thefire truck.
Now try Exercise 15.
� 104.6.� 110 sin 72�a � c sin A
sin A � a�c,
72�.
c �19.4
cos 34.2�� 23.46.
c �b
cos A.cos A �
adj
hyp�
b
c
c,a � 19.4 tan 34.2� � 13.18.
a � b tan A.tan A �opp
adj�
a
b
a,B � 90� � 34.2� � 55.8�.A � B � 90�C � 90�,
A C34.2°
ac
b = 19.4
B
ccb,a,CC
B,A,
What you should learn• Solve real-life problems
involving right triangles.
• Solve real-life problems involving directional bearings.
• Solve real-life problems involving harmonic motion.
Why you should learn itRight triangles often occur inreal-life situations. For instance,in Exercise 62, right triangles areused to determine the shortestgrain elevator for a grain storagebin on a farm.
Applications and Models
Example 2
72°
c = 110 ft
A
B
C
a
b
FIGURE 79
Example 1
Video

Finding a Side of a Right Triangle
At a point 200 feet from the base of a building, the angle of elevation to thebottom of a smokestack is whereas the angle of elevation to the top is as shown in Figure 80. Find the height of the smokestack alone.
SolutionNote from Figure 80 that this problem involves two right triangles. For thesmaller right triangle, use the fact that
to conclude that the height of the building is
For the larger right triangle, use the equation
to conclude that So, the height of the smokestack is
Now try Exercise 19.
Finding an Acute Angle of a Right Triangle
A swimming pool is 20 meters long and 12 meters wide. The bottom of the poolis slanted so that the water depth is 1.3 meters at the shallow end and 4 meters atthe deep end, as shown in Figure 81. Find the angle of depression of the bottomof the pool.
SolutionUsing the tangent function, you can see that
So, the angle of depression is
Now try Exercise 25.
� 7.69�.
� 0.13419 radian
A � arctan 0.135
� 0.135.
�2.7
20
tan A �opp
adj
� 125.4 feet.
� 200 tan 53� � 200 tan 35�
s � 200 tan 53� � a
a � s � 200 tan 53º.
tan 53� �a � s
200
a � 200 tan 35�.
tan 35� �a
200
s53�,35�,
Example 3
Example 4
53°
35°
200 ft
a
s
FIGURE 80
1.3 m2.7 m
20 m
AAngle ofdepression
FIGURE 81
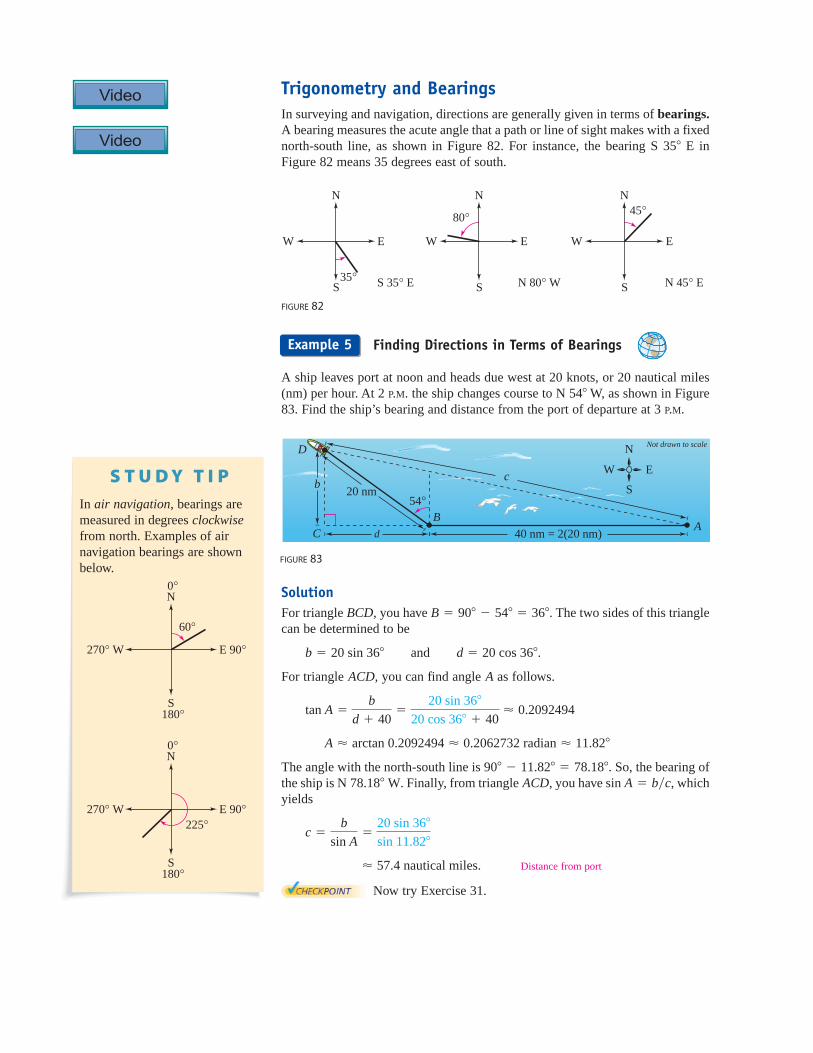
.
.
Trigonometry and BearingsIn surveying and navigation, directions are generally given in terms of bearings.A bearing measures the acute angle that a path or line of sight makes with a fixednorth-south line, as shown in Figure 82. For instance, the bearing S E inFigure 82 means 35 degrees east of south.
FIGURE 82
Finding Directions in Terms of Bearings
A ship leaves port at noon and heads due west at 20 knots, or 20 nautical miles(nm) per hour. At 2 P.M. the ship changes course to N W, as shown in Figure83. Find the ship’s bearing and distance from the port of departure at 3 P.M.
SolutionFor triangle you have The two sides of this trianglecan be determined to be
and
For triangle you can find angle as follows.
The angle with the north-south line is So, the bearing ofthe ship is Finally, from triangle you have whichyields
Distance from port
Now try Exercise 31.
� 57.4 nautical miles.
c �b
sin A�
20 sin 36�
sin 11.82�
sin A � b�c,ACD,N 78.18� W.90� � 11.82� � 78.18�.
A � arctan 0.2092494 � 0.2062732 radian � 11.82�
tan A �b
d � 40�
20 sin 36�
20 cos 36� � 40� 0.2092494
AACD,
d � 20 cos 36�.b � 20 sin 36�
B � 90� � 54� � 36�.BCD,
54�
W E
S
45°
N 45° E
N
W E
S
80°
N 80° W
N
W E
S35° S 35° E
N
35�
40 nm = 2(20 nm)d
b
D
CA
B
c20 nm
54°
Not drawn to scale
S
EW
N
FIGURE 83
Example 5
In air navigation, bearings aremeasured in degrees clockwisefrom north. Examples of airnavigation bearings are shownbelow.
N
180°
225°
S
0°
E 90°270° W
N
180°
60°
S
E 90°
0°
270° W
Video
Video

Harmonic MotionThe periodic nature of the trigonometric functions is useful for describing themotion of a point on an object that vibrates, oscillates, rotates, or is moved bywave motion.
For example, consider a ball that is bobbing up and down on the end of aspring, as shown in Figure 84. Suppose that 10 centimeters is the maximumdistance the ball moves vertically upward or downward from its equilibrium (atrest) position. Suppose further that the time it takes for the ball to move from itsmaximum displacement above zero to its maximum displacement below zero andback again is seconds. Assuming the ideal conditions of perfect elasticityand no friction or air resistance, the ball would continue to move up and down ina uniform and regular manner.
FIGURE 84
From this spring you can conclude that the period (time for one completecycle) of the motion is
its amplitude (maximum displacement from equilibrium) is
and its frequency (number of cycles per second) is
Motion of this nature can be described by a sine or cosine function, and is calledsimple harmonic motion.
Frequency �14
cycle per second.
Amplitude � 10 centimeters
Period � 4 seconds
Equilibrium Maximum negativedisplacement
Maximum positivedisplacement
10 cm 10 cm
−10 cm −10 cm
0 cm 0 cm
10 cm
−10 cm
0 cm
t � 4

Simple Harmonic Motion
Write the equation for the simple harmonic motion of the ball described in Figure84, where the period is 4 seconds. What is the frequency of this harmonicmotion?
SolutionBecause the spring is at equilibrium when you use the equation
Moreover, because the maximum displacement from zero is 10 and the period is4, you have
Consequently, the equation of motion is
Note that the choice of or depends on whether the ball initially moves up or down. The frequency is
cycle per second.
Now try Exercise 51.
One illustration of the relationship between sine waves and harmonic motioncan be seen in the wave motion resulting when a stone is dropped into a calmpool of water. The waves move outward in roughly the shape of sine (or cosine)waves, as shown in Figure 85. As an example, suppose you are fishing and yourfishing bob is attached so that it does not move horizontally. As the waves moveoutward from the dropped stone, your fishing bob will move up and down insimple harmonic motion, as shown in Figure 86.
�14
���2
2�
Frequency ��
2�
a � �10a � 10
d � 10 sin �
2t.
� ��
2.Period �
2�
�� 4
Amplitude � �a� � 10
d � a sin �t.
t � 0,�d � 0�
Definition of Simple Harmonic MotionA point that moves on a coordinate line is said to be in simple harmonicmotion if its distance from the origin at time is given by either
or
where and are real numbers such that The motion has amplitudeperiod and frequency ���2��.2���,�a�,
� > 0.�a
d � a cos �td � a sin �t
td
Example 6
x
y
FIGURE 86
FIGURE 85
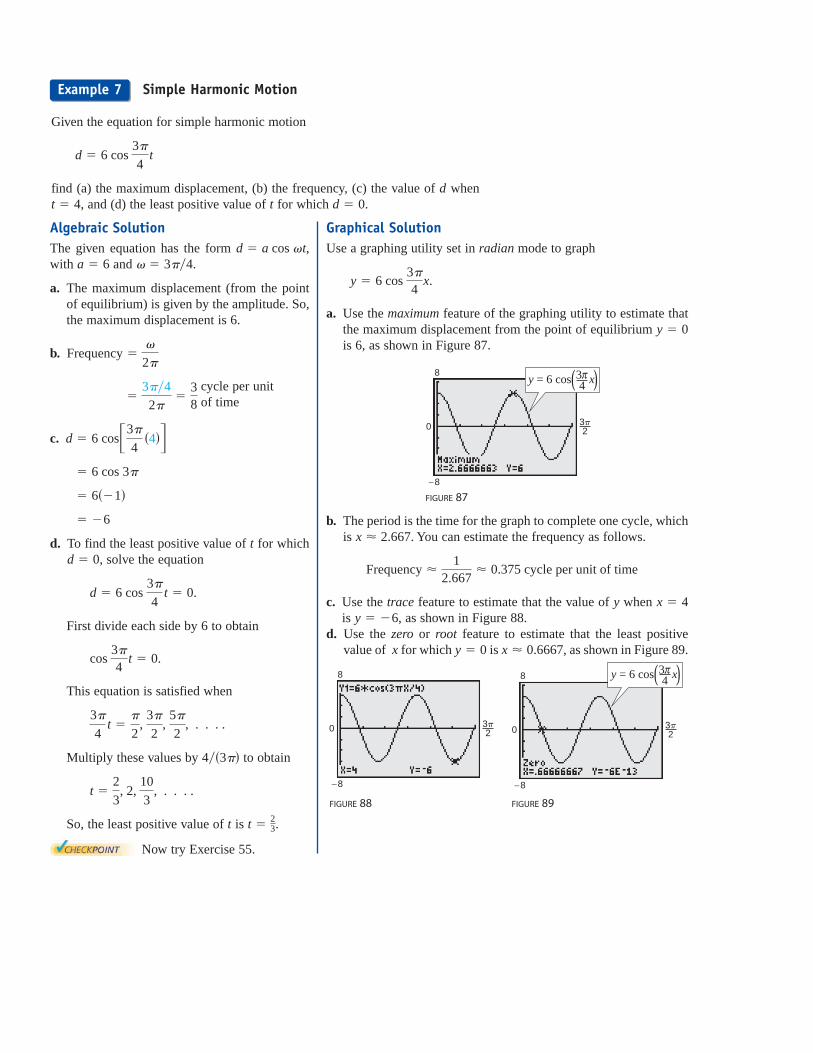
Simple Harmonic Motion
Given the equation for simple harmonic motion
find (a) the maximum displacement, (b) the frequency, (c) the value of whenand (d) the least positive value of for which d � 0.tt � 4,
d
d � 6 cos 3�
4t
Example 7
Algebraic SolutionThe given equation has the form with and
a. The maximum displacement (from the pointof equilibrium) is given by the amplitude. So,the maximum displacement is 6.
b.
c.
d. To find the least positive value of for whichsolve the equation
First divide each side by 6 to obtain
This equation is satisfied when
Multiply these values by to obtain
So, the least positive value of is
Now try Exercise 55.
t �23.t
t �2
3, 2,
10
3, . . . .
4��3��
3�
4t �
�
2,
3�
2,
5�
2, . . . .
cos 3�
4t � 0.
d � 6 cos 3�
4t � 0.
d � 0,t
� �6
� 6��1�
� 6 cos 3�
d � 6 cos�3�
4�4��
�38
�3��4
2�
Frequency ��
2�
� � 3��4.a � 6d � a cos �t,
Graphical SolutionUse a graphing utility set in radian mode to graph
a. Use the maximum feature of the graphing utility to estimate thatthe maximum displacement from the point of equilibrium is 6, as shown in Figure 87.
FIGURE 87
b. The period is the time for the graph to complete one cycle, whichis You can estimate the frequency as follows.
c. Use the trace feature to estimate that the value of when is as shown in Figure 88.
d. Use the zero or root feature to estimate that the least positivevalue of for which is as shown in Figure 89.
FIGURE 88 FIGURE 89
−8
0 3�2
8 ( )y = 6 cos x3π4
−8
0 3�2
8
x � 0.6667,y � 0x
y � �6,x � 4y
Frequency �1
2.667� 0.375 cycle per unit of time
x � 2.667.
−8
0 3�2
8 ( )y = 6 cos x3π4
y � 0
y � 6 cos 3�
4x.
cycle per unit of time

The symbol indicates an exercise in which you are instructed to use graphing technology or a symbolic computer algebra system.
Click on to view the complete solution of the exercise.
Click on to print an enlarged copy of the graph.
Click on to view the Make a Decision exercise.
Exercises
In Exercises 1–10, solve the right triangle shown in thefigure. Round your answers to two decimal places.
1. 2.
3. 4.
5. 6.
7. 8.
9.
10.
FIGURE FOR 1–10 FIGURE FOR 11–14
In Exercises 11–14, find the altitude of the isosceles triangleshown in the figure. Round your answers to two decimalplaces.
11. inches
12. meters
13. inches
14. feet
15. Length The sun is above the horizon. Find the lengthof a shadow cast by a silo that is 50 feet tall (see figure).
16. Length The sun is above the horizon. Find the lengthof a shadow cast by a building that is 600 feet tall.
17. Height A ladder 20 feet long leans against the side of ahouse. Find the height from the top of the ladder to theground if the angle of elevation of the ladder is 80 .
18. Height The length of a shadow of a tree is 125 feet whenthe angle of elevation of the sun is Approximate theheight of the tree.
19. Height From a point 50 feet in front of a church, theangles of elevation to the base of the steeple and the top ofthe steeple are and respectively.
(a) Draw right triangles that give a visual representation ofthe problem. Label the known and unknown quantities.
(b) Use a trigonometric function to write an equationinvolving the unknown quantity.
(c) Find the height of the steeple.
20. Height You are standing 100 feet from the base of aplatform from which people are bungee jumping. Theangle of elevation from your position to the top of theplatform from which they jump is From what heightare the people jumping?
21. Depth The sonar of a navy cruiser detects a submarinethat is 4000 feet from the cruiser. The angle between thewater line and the submarine is (see figure). How deepis the submarine?
22. Angle of Elevation An engineer erects a 75-foot cellulartelephone tower. Find the angle of elevation to the top ofthe tower at a point on level ground 50 feet from its base.
4000 ft
34°
Not drawn to scale
34�
51�.
40�,47�35�
33�.
�
20�
25°
50 ft
25�
b � 11� � 27�,
b � 46� � 41�,
b � 10� � 18�,
b � 4� � 52�,
bAC
a
b
c
B
a � 14.2B � 65� 12�,
c � 430.5A � 12� 15�,
c � 9.45b � 1.32,c � 52b � 16,
c � 35a � 25,b � 10a � 6,
a � 40.5A � 8.4�,b � 24B � 71�,
c � 15B � 54�,b � 10A � 20�,
VOCABULARY CHECK: Fill in the blanks.
1. An angle that measures from the horizontal upward to an object is called the angle of ________,whereas an angle that measures from the horizontal downward to an object is called the angle of ________.
2. A ________ measures the acute angle a path or line of sight makes with a fixed north-south line.
3. A point that moves on a coordinate line is said to be in simple ________ ________ if its distance from the origin at time is given by either or d � a cos � t.d � a sin � tt
d
Glossary

23. Angle of Elevation The height of an outdoor basketballbackboard is feet, and the backboard casts a shadow
feet long.
(a) Draw a right triangle that gives a visual representationof the problem. Label the known and unknown quantities.
(b) Use a trigonometric function to write an equationinvolving the unknown quantity.
(c) Find the angle of elevation of the sun.
24. Angle of Depression A Global Positioning System satel-lite orbits 12,500 miles above Earth’s surface (see figure).Find the angle of depression from the satellite to the horizon. Assume the radius of Earth is 4000 miles.
25. Angle of Depression A cellular telephone tower that is150 feet tall is placed on top of a mountain that is 1200 feetabove sea level. What is the angle of depression from thetop of the tower to a cell phone user who is 5 horizontalmiles away and 400 feet above sea level?
26. Airplane Ascent During takeoff, an airplane’s angle ofascent is and its speed is 275 feet per second.
(a) Find the plane’s altitude after 1 minute.
(b) How long will it take the plane to climb to an altitudeof 10,000 feet?
27. Mountain Descent A sign on a roadway at the top of amountain indicates that for the next 4 miles the grade is
(see figure). Find the change in elevation over thatdistance for a car descending the mountain.
28. Mountain Descent A roadway sign at the top of a moun-tain indicates that for the next 4 miles the grade is 12%.Find the angle of the grade and the change in elevation overthe 4 miles for a car descending the mountain.
29. Navigation An airplane flying at 600 miles per hour hasa bearing of After flying for 1.5 hours, how far northand how far east will the plane have traveled from its pointof departure?
30. Navigation A jet leaves Reno, Nevada and is headedtoward Miami, Florida at a bearing of The distancebetween the two cities is approximately 2472 miles.
(a) How far north and how far west is Reno relative toMiami?
(b) If the jet is to return directly to Reno from Miami, atwhat bearing should it travel?
31. Navigation A ship leaves port at noon and has a bearingof The ship sails at 20 knots.
(a) How many nautical miles south and how many nauticalmiles west will the ship have traveled by 6:00 P.M.?
(b) At 6:00 P.M., the ship changes course to due west. Findthe ship’s bearing and distance from the port of depar-ture at 7:00 P.M.
32. Navigation A privately owned yacht leaves a dock inMyrtle Beach, South Carolina and heads toward Freeportin the Bahamas at a bearing of The yacht averagesa speed of 20 knots over the 428 nautical-mile trip.
(a) How long will it take the yacht to make the trip?
(b) How far east and south is the yacht after 12 hours?
(c) If a plane leaves Myrtle Beach to fly to Freeport, whatbearing should be taken?
33. Surveying A surveyor wants to find the distance across aswamp (see figure). The bearing from to is N W.The surveyor walks 50 meters from and at the point the bearing to is N W. Find (a) the bearing from to
and (b) the distance from to
34. Location of a Fire Two fire towers are 30 kilometersapart, where tower is due west of tower A fire isspotted from the towers, and the bearings from and areE N and W N, respectively (see figure). Find thedistance of the fire from the line segment
Ad
B14° 34°30 km
S
EW
N
Not drawn to scale
AB.d34�14�
BAB.A
A
B
C
50 m
S
EW
N
B.ACA68�B
CA,32�BA
S 1.4� E.
S 29� W.
100�.
52�.
10.5°
4 mi
Not drawn to scale
10.5�
18�
4,000 mi
12,500 mi
Angle ofdepression
GPSsatellite
Not drawn to scale
1713
1212

35. Navigation A ship is 45 miles east and 30 miles south of port. The captain wants to sail directly to port. Whatbearing should be taken?
36. Navigation An airplane is 160 miles north and 85 mileseast of an airport. The pilot wants to fly directly to theairport. What bearing should be taken?
37. Distance An observer in a lighthouse 350 feet above sealevel observes two ships directly offshore. The angles ofdepression to the ships are and (see figure). How farapart are the ships?
38. Distance A passenger in an airplane at an altitude of 10kilometers sees two towns directly to the east of the plane.The angles of depression to the towns are and (seefigure). How far apart are the towns?
39. Altitude A plane is observed approaching your home andyou assume that its speed is 550 miles per hour. The angleof elevation of the plane is at one time and oneminute later. Approximate the altitude of the plane.
40. Height While traveling across flat land, you notice amountain directly in front of you. The angle of elevation tothe peak is After you drive 17 miles closer to themountain, the angle of elevation is Approximate theheight of the mountain.
Geometry In Exercises 41 and 42, find the angle between two nonvertical lines and The angle satisfies the equation
where and are the slopes of and respectively.(Assume that )
41.
42.
43. Geometry Determine the angle between the diagonal of acube and the diagonal of its base, as shown in the figure.
FIGURE FOR 43 FIGURE FOR 44
44. Geometry Determine the angle between the diagonal of acube and its edge, as shown in the figure.
45. Geometry Find the length of the sides of a regular penta-gon inscribed in a circle of radius 25 inches.
46. Geometry Find the length of the sides of a regular hexa-gon inscribed in a circle of radius 25 inches.
47. Hardware Write the distance across the flat sides of ahexagonal nut as a function of as shown in the figure.
48. Bolt Holes The figure shows a circular piece of sheetmetal that has a diameter of 40 centimeters and contains 12equally spaced bolt holes. Determine the straight-linedistance between the centers of consecutive bolt holes.
30°
35 cm40 cm
60°
x
y
r
r,y
a a
a
a
a
L1:
L2: 2x � y �
x � 5y �
8
�4
L1:
L2: 3x � 2y � 5
x � y � 1
m1m2 � �1.L2,L1m2m1
tan � � � m2 � m1
1 � m2 m1��L2.L1
�
9�.2.5�.
57�16�
28°55°
10 km
Not drawn to scale
55�28�
6.5° 4°350 ft
Not drawn to scale
6.5�4�

Trusses In Exercises 49 and 50, find the lengths of all theunknown members of the truss.
49.
50.
Harmonic Motion In Exercises 51–54, find a model for simple harmonic motion satisfying the specifiedconditions.
Displacement Amplitude Period
51. 0 4 centimeters 2 seconds
52. 0 3 meters 6 seconds
53. 3 inches 3 inches 1.5 seconds
54. 2 feet 2 feet 10 seconds
Harmonic Motion In Exercises 55–58, for the simpleharmonic motion described by the trigonometric function,find (a) the maximum displacement, (b) the frequency,(c) the value of when and (d) the least positivevalue of for which Use a graphing utility to verifyyour results.
55.
56.
57.
58.
59. Tuning Fork A point on the end of a tuning fork movesin simple harmonic motion described by Find given that the tuning fork for middle C has a fre-quency of 264 vibrations per second.
60. Wave Motion A buoy oscillates in simple harmonicmotion as waves go past. It is noted that the buoy moves atotal of 3.5 feet from its low point to its high point (see figure), and that it returns to its high point every 10 seconds. Write an equation that describes the motion ofthe buoy if its high point is at
FIGURE FOR 60
61. Oscillation of a Spring A ball that is bobbing up anddown on the end of a spring has a maximum displacementof 3 inches. Its motion (in ideal conditions) is modeled by
where is measured in feet and isthe time in seconds.
(a) Graph the function.
(b) What is the period of the oscillations?
(c) Determine the first time the weight passes the point ofequilibrium �y � 0�.
tyy �14 cos 16t �t > 0�,
3.5 ft
Equilibrium
Low point
High point
t � 0.
�d � a sin � t.
d �164 sin 792 t
d �116 sin 120t
d �12 cos 20t
d � 4 cos 8t
d � 0.tt � 5,d
�t � 0�
36 ft9 ft
6 ft
6 ft
bc
a
35° 35°10101010
ab
62. Numerical and Graphical Analysis A two-meter-high fence is 3 meters from the side of a grain storagebin. A grain elevator must reach from ground leveloutside the fence to the storage bin (see figure). Theobjective is to determine the shortest elevator thatmeets the constraints.
(a) Complete four rows of the table.
3 m
2 mL1
L2
θ
θ
Model It
0.1 23.0
0.2 13.13
cos 0.22
sin 0.2
3cos 0.1
2sin 0.1
L1 � L2L2L1�

63. Numerical and Graphical Analysis The cross section ofan irrigation canal is an isosceles trapezoid of which threeof the sides are 8 feet long (see figure). The objective is tofind the angle that maximizes the area of the crosssection. Hint: The area of a trapezoid is
(a) Complete seven additional rows of the table.
(b) Use a graphing utility to generate additional rows ofthe table. Use the table to estimate the maximum cross-sectional area.
(c) Write the area as a function of
(d) Use a graphing utility to graph the function. Use thegraph to estimate the maximum cross-sectional area.How does your estimate compare with that of part (b)?
64. Data Analysis The table shows the average sales (inmillions of dollars) of an outerwear manufacturer for eachmonth where represents January.
(a) Create a scatter plot of the data.
(b) Find a trigonometric model that fits the data. Graph themodel with your scatter plot. How well does the modelfit the data?
(c) What is the period of the model? Do you think it isreasonable given the context? Explain your reasoning.
(d) Interpret the meaning of the model’s amplitude in thecontext of the problem.
Synthesis
True or False? In Exercises 65 and 66, determine whetherthe statement is true or false. Justify your answer.
65. The Leaning Tower of Pisa is not vertical, but if you knowthe exact angle of elevation to the 191-foot tower whenyou stand near it, then you can determine the exact distanceto the tower by using the formula
66. For the harmonic motion of a ball bobbing up and down onthe end of a spring, one period can be described as thelength of one coil of the spring.
67. Writing Is it true that N E means 24 degrees north ofeast? Explain.
68. Writing Explain the difference between bearings used innautical navigation and bearings used in air navigation.
Skills Review
In Exercises 69 –72, write the slope-intercept form of theequation of the line with the specified characteristics.Thensketch the line.
69. passes through
70. passes through
71. Passes through and
72. Passes through and ��12, 13��1
4, �23�
�3, 2���2, 6��1
3, 0�m � �12,
��1, 2�m � 4,
24�
tan � �191d
.
d
�
t � 1t,
S
�.A
8 ft 8 ft
8 ft
�h�2��b1 � b2�.���
Model It (cont inued)
(b) Use a graphing utility to generate additional rowsof the table. Use the table to estimate the minimumlength of the elevator.
(c) Write the length as a function of
(d) Use a graphing utility to graph the function. Usethe graph to estimate the minimum length. Howdoes your estimate compare with that of part (b)?
�.L1 � L2
Base 1 Base 2 Altitude Area
8 22.1
8 42.58 sin 20�8 � 16 cos 20�
8 sin 10�8 � 16 cos 10�
Time, t 1 2 3 4 5 6
Sales, s 13.46 11.15 8.00 4.85 2.54 1.70
Time, t 7 8 9 10 11 12
Sales, s 2.54 4.85 8.00 11.15 13.46 14.3

The symbol indicates an exercise in which you are instructed to use graphing technology or a symbolic computer algebra system.
Click on to view the complete solution of the exercise.
Click on to print an enlarged copy of the graph.
Click on to view the Make a Decision exercise.
Exercises
In Exercises 1 and 2, estimate the angle to the nearest one-half radian.
1. 2.
In Exercises 3 –10, (a) sketch the angle in standard position,(b) determine the quadrant in which the angle lies, and (c)determine one positive and one negative coterminal angle.
3. 4.
5. 6.
7. 8.
9. 10.
In Exercises 11–14, convert the angle measure from degreesto radians. Round your answer to three decimal places.
11. 12.
13. 14.
In Exercises 15–18, convert the angle measure from radiansto degrees. Round your answer to three decimal places.
15. 16.
17. 18.
19. Arc Length Find the length of the arc on a circle with aradius of 20 inches intercepted by a central angle of
20. Arc Length Find the length of the arc on a circle with aradius of 11 meters intercepted by a central angle of
21. Phonograph Compact discs have all but replaced phono-graph records. Phonograph records are vinyl discs thatrotate on a turntable. A typical record album is 12 inches indiameter and plays at 33 revolutions per minute.
(a) What is the angular speed of a record album?
(b) What is the linear speed of the outer edge of a recordalbum?
22. Bicycle At what speed is a bicyclist traveling when his27-inch-diameter tires are rotating at an angular speed of
radians per second?
23. Circular Sector Find the area of the sector of a circlewith a radius of 18 inches and central angle
24. Circular Sector Find the area of the sector of a circlewith a radius of 6.5 millimeters and central angle
In Exercises 25–28, find the point on the unit circlethat corresponds to the real number
25. 26.
27. 28.
In Exercises 29–32, evaluate (if possible) the six trigono-metric functions of the real number.
29. 30.
31. 32.
In Exercises 33–36, evaluate the trigonometric functionusing its period as an aid.
33. 34.
35. 36.
In Exercises 37–40, use a calculator to evaluate the trigono-metric function. Round your answer to four decimal places.
37. 38.
39. 40.
In Exercises 41–44, find the exact values of the six trigono-metric functions of the angle shown in the figure.
41. 42.
43. 44.
95
84
6
6
5
4
θ
�
sin���
9�sec 12�
5
csc 10.5tan 33
cos��13�
3 �sin��17�
6 �
cos 4�sin 11�
4
t � 2�t � �2�
3
t ��
4t �
7�
6
t � �4�
3t �
5�
6
t �3�
4t �
2�
3
t.�x, y�
� � 5��6.
� � 120�.
5�
13
60�.
138�.
5.7�3.5
�11�
65�
7
196� 77��33º 45�
�127.5�480�
�405��110�
280�70�
�23�
3�
4�
3
2�
911�
4

In Exercises 45– 48, use the given function value and trigonometric identities (including the cofunction identities)to find the indicated trigonometric functions.
45. (a) csc (b) cos
(c) sec (d) tan
46. (a) cot (b) sec
(c) cos (d) csc
47. (a) sin (b) cos
(c) sec (d) tan
48. (a) sin (b) cot
(c) tan (d) sec
In Exercises 49– 54, use a calculator to evaluate the trigono-metric function. Round your answer to four decimal places.
49.
50.
51.
52.
53.
54.
55. Railroad Grade A train travels 3.5 kilometers on astraight track with a grade of (see figure). What isthe vertical rise of the train in that distance?
56. Guy Wire A guy wire runs from the ground to the top ofa 25-foot telephone pole. The angle formed between thewire and the ground is How far from the base of thepole is the wire attached to the ground?
In Exercises 57– 64, the point is on the terminal side of anangle in standard position. Determine the exact values ofthe six trigonometric functions of the angle
57.
58.
59.
60.
61.
62.
63.
64.
In Exercises 65–70, find the values of the six trigonometricfunctions of .
Function Value Constraint
65.
66.
67.
68.
69.
70.
In Exercises 71–74, find the reference angle and sketchand in standard position.
71. 72.
73. 74.
In Exercises 75– 82, evaluate the sine, cosine, and tangent ofthe angle without using a calculator.
75. 76.
77. 78.
79. 80.
81. 82.
In Exercises 83– 88, use a calculator to evaluate the trigono-metric function. Round your answer to four decimal places.
83. 84.
85. 86.
87. 88.
In Exercises 89–96, sketch the graph of the function.Include two full periods.
89. 90.
91. 92.
93. 94.
95. 96.
97. Sound Waves Sound waves can be modeled by sinefunctions of the form where is measured inseconds.
(a) Write an equation of a sound wave whose amplitude is2 and whose period is second.
(b) What is the frequency of the sound wave described inpart (a)?
1264
xy � a sin bx,
g�t� � 3 cos�t � ��g�t� �52 sin�t � ��
y � �4 � cos �xy � 2 � sin x
f �x� � 8 cos��x4�f �x� � 5 sin
2x5
y � cos xy � sin x
tan��25�
7 �sin12�
5
cot��4.8�sin��3.2�tan 3sin 4
315��240�
�150�495�
�5�
4�
7�
3
�
4�
3
� �17�
3� � �
6�
5
� � 635�� � 264�
�����,
cos � > 0sin � � �24
sin � > 0cos � � �25
cos � < 0tan � �54
cos � < 0sin � �38
cos � < 0csc � �32
tan � < 0sec � �65
�
x > 0��2x, �3x�,x > 0�x, 4x�,
�0.3, 0.4���0.5, 4.5���10
3 , �23�
�23, 52�
�3, �4��12, 16�
�.�
52�.
1°10′
3.5 km
Not drawn to scale
1� 10�
cos 78� 11� 58
cot 15� 14�
sec 79.3�
sin 34.2�
csc 11�
tan 33�
�90� � ���
��csc � � 5
��
��csc � � 4
��
��tan � � 4
��
��sin � �13
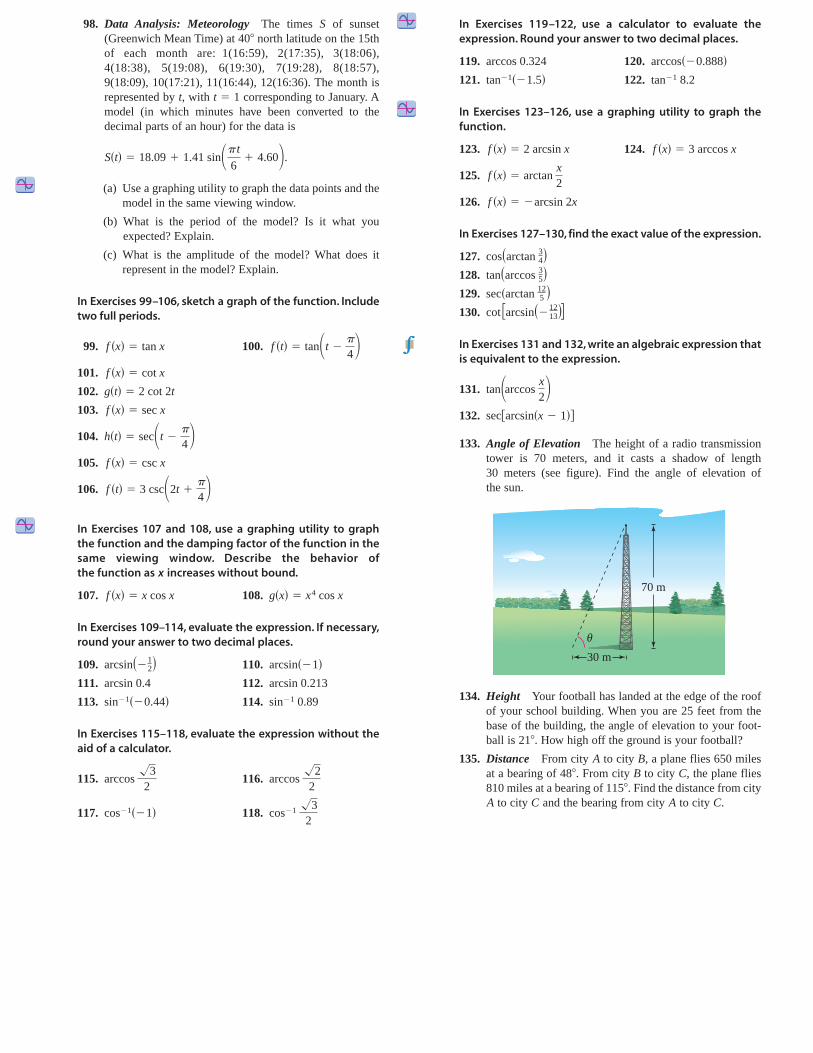
98. Data Analysis: Meteorology The times of sunset(Greenwich Mean Time) at 40 north latitude on the 15thof each month are: 1(16:59), 2(17:35), 3(18:06),4(18:38), 5(19:08), 6(19:30), 7(19:28), 8(18:57),9(18:09), 10(17:21), 11(16:44), 12(16:36). The month isrepresented by with corresponding to January. Amodel (in which minutes have been converted to thedecimal parts of an hour) for the data is
(a) Use a graphing utility to graph the data points and themodel in the same viewing window.
(b) What is the period of the model? Is it what youexpected? Explain.
(c) What is the amplitude of the model? What does itrepresent in the model? Explain.
In Exercises 99–106, sketch a graph of the function. Includetwo full periods.
99. 100.
101.
102.
103.
104.
105.
106.
In Exercises 107 and 108, use a graphing utility to graph the function and the damping factor of the function in thesame viewing window. Describe the behavior of the function as increases without bound.
107. 108.
In Exercises 109–114, evaluate the expression. If necessary,round your answer to two decimal places.
109. 110.
111. 112.
113. 114.
In Exercises 115–118, evaluate the expression without theaid of a calculator.
115. 116.
117. 118.
In Exercises 119–122, use a calculator to evaluate theexpression. Round your answer to two decimal places.
119. 120.
121. 122.
In Exercises 123–126, use a graphing utility to graph thefunction.
123. 124.
125.
126.
In Exercises 127–130, find the exact value of the expression.
127.
128.
129.
130.
In Exercises 131 and 132, write an algebraic expression thatis equivalent to the expression.
131.
132.
133. Angle of Elevation The height of a radio transmissiontower is 70 meters, and it casts a shadow of length 30 meters (see figure). Find the angle of elevation of the sun.
134. Height Your football has landed at the edge of the roofof your school building. When you are 25 feet from thebase of the building, the angle of elevation to your foot-ball is How high off the ground is your football?
135. Distance From city to city a plane flies 650 milesat a bearing of From city to city the plane flies810 miles at a bearing of . Find the distance from city
to city and the bearing from city to city C.ACA115�
C,B48�.B,A
21�.
70 m
30 m
θ
secarcsin�x � 1�
tan�arccos x2�
cot arcsin��1213�
sec�arctan 125 �
tan�arccos 35�cos�arctan 34�
f �x� � �arcsin 2x
f �x� � arctan x2
f �x� � 3 arccos xf �x� � 2 arcsin x
tan�1 8.2tan�1��1.5�arccos��0.888�arccos 0.324
cos�1 �32
cos�1��1�
arccos �22
arccos �32
sin�1 0.89sin�1��0.44�arcsin 0.213arcsin 0.4
arcsin��1�arcsin��12�
g�x� � x4 cos xf �x� � x cos x
x
f �t� � 3 csc�2t ��
4�f �x� � csc x
h�t� � sec�t ��
4�f �x� � sec x
g�t� � 2 cot 2t
f �x� � cot x
f �t� � tan�t ��
4�f �x� � tan x
S�t� � 18.09 � 1.41 sin�� t
6� 4.60�.
t � 1t,
�S

136. Wave Motion Your fishing bobber oscillates in simpleharmonic motion from the waves in the lake where youfish. Your bobber moves a total of 1.5 inches from its highpoint to its low point and returns to its high point every 3 seconds. Write an equation modeling the motion of yourbobber if it is at its high point at time
Synthesis
True or False? In Exercises 137–140, determine whetherthe statement is true or false. Justify your answer.
137. The tangent function is often useful for modeling simpleharmonic motion.
138. The inverse sine function arcsin cannot be definedas a function over any interval that is greater than theinterval defined as
139. is not a function because
140. Because tan
In Exercises 141–144, match the function withits graph. Base your selection solely on your interpretationof the constants and Explain your reasoning. [Thegraphs are labeled (a), (b), (c), and (d).]
(a) (b)
(c) (d)
141. 142.
143. 144.
145. Writing Describe the behavior of at thezeros of Explain your reasoning.
146. Conjecture
(a) Use a graphing utility to complete the table.
(b) Make a conjecture about the relationship between
and
147. Writing When graphing the sine and cosine functions,determining the amplitude is part of the analysis. Explainwhy this is not true for the other four trigonometric functions.
148. Oscillation of a Spring A weight is suspended from aceiling by a steel spring. The weight is lifted (positivedirection) from the equilibrium position and released. Theresulting motion of the weight is modeled by
where is the distance in feet from equilibrium and isthe time in seconds. The graph of the function is shown inthe figure. For each of the following, describe the changein the system without graphing the resulting function.
(a) is changed from to
(b) is changed from to
(c) is changed from 6 to 9.
149. Graphical Reasoning The formulas for the area of a circular sector and arc length are and respectively. ( is the radius and is the angle measuredin radians.)
(a) For write the area and arc length asfunctions of What is the domain of each function?Use a graphing utility to graph the functions. Use thegraphs to determine which function changes morerapidly as increases. Explain.
(b) For centimeters, write the area and arc lengthas functions of What is the domain of eachfunction? Use a graphing utility to graph and identifythe functions.
150. Writing Describe a real-life application that can berepresented by a simple harmonic motion model and isdifferent from any that you’ve seen in this chapter.Explain which function you would use to model yourapplication and why. Explain how you would determinethe amplitude, period, and frequency of the model foryour application.
�.r � 10
r
r.� � 0.8,
�rs � r�,A �
12 r2�
t
5
0.1
0.2
0.1
0.2
y
b
13.1
10k
13.1
5A
ty
y � Ae�kt cos bt �15e�t�10 cos 6t
�cot �.tan�� ��
2�
g��� � cos �.f ��� � sec �
y � 2 sin x2
y � 2 sin �x
y � �3 sin xy � 3 sin x
2
23
1
y
x
3
321
y
x
3
321
21
y
x
22
y
x
b.a
y � a sin bx
arctan��1� � 3��4.3��4 � �1,
sin 30� � sin 150�.y � sin �
���2 ≤ y ≤ ��2.
xy �
t � 0.
0.1 0.4 0.7 1.0 1.3
�cot �
tan�� ��
2��