Embed Size (px)
Citation preview

Supplementary Information
Graphitic Domain Layered Titania Nanotube Arrays for Separation and Shuttling of Solar-Driven Electrons
Dong Ki Lee a, Kyu Sung Han a, Weon Ho Shin a, Jung Woo Lee a, Jung Hoon Choi a, Kyung
Min Choi a, Yeob Lee a, Hyoung-il Kimd, Wonyoung Choid and Jeung Ku Kang *a,b,c
a Department of Materials Science & Engineering, bGraduated School of EEWS (WCU), and c
NanoCentury KAIST Institute, Korea Advanced Institute of Science and Technology (KAIST),
291 Daehak-ro, Yuseong-gu, Daejon 305-701, Republic of Korea,
*E-mail: [email protected]
d School of Environmental Science and Engineering, Pohang University of Science and
Technology (POSTECH), Pohang, 790-784, Korea
Contents Experimental
Table S1. The experimental conditions of various samples
Figure S1. Supplementary FE-SEM images
Figure S2. Supplementary HR-TEM images
Figure S3. Supplementary XPS carbon 1s spectra
Figure S4. Supplementary Raman spectra
Figure S5. Diffused UV-Vis. absorbance spectra
Figure S6. Hydrogen evolution of GDN-5
Table S2. Tri-exponential function fitted fluorescence lifetime decay data
Table S3. EIS parameters from the equivalent electrical circuit model
Electronic Supplementary Material (ESI) for Journal of Materials Chemistry AThis journal is © The Royal Society of Chemistry 2013

Experimental
Fabrication of anodized TiO2 NTs: Ti foil (99.7%, ALDRICH) was ultrasonically cleaned with acetone,
ethanol, and water for 1 hour, respectively, and was dried in nitrogen flow. Anodization was performed in
a two-electrode configuration with Ti foil (1 1 cm2) as the cathode and Ni foil (99.9%, ALDRICH) as
the anode with mild stirring at room temperature. The electrolyte was prepared using an ethylene glycol
solution with 0.25 wt% NH4F (99.99%, ALDRICH) and 1 vol.% of water. The anodic growth of the TiO2
NTs was carried out for 4 hour at 60V with direct current (DC) power supply (AGILENT E3612A). The
obtained NTs were annealed at 650°C for 2 hours to obtain the anatase phase. Heating and cooling rates
were 1°Cmin-1
Formation of graphitic domains: Prepared bare TiO2 NT arrays were first immersed in a 70 mL
aqueous solution of certain concentration glucose (99.5%, SIGMA) for 5 hours. Subsequently, the
mixture containing TiO2 NT arrays was transferred to a 100 mL Teflon-lined stainless steel autoclave and
heated at 180°C for 5 hours for polymerization. After rinsing with ethanol and water several times,
samples were dried in a 70°C vacuum oven for at least one day. Then, samples were pyrolyzed at 650°C
under argon (99.999%) flow at 300 torr for 3 hours. Heating and cooling rates were 2°C/min.
Characterizations: The microscopic features of the samples were observed by JEOL JSM-7401F and a
HITACHI S-4800 SEM, and JEOL JEM-ARM200F TEM and STEM. The EELS profiles are collected
with GATAN Quantum SE. The energy dispersive spectrometer (EDS) images were observed by using a
BRUKER QUANTAX EDS for TEM. The crystal structures were measured by thin film XRD patterns
which were carried out using a RIGAKU D/MAX-2500 with monochromatized Cu Kα radiation, and
scanning at a 2°min-1 with an angular resolution of 0.01°. Raman spectra were acquired with a LabRAM
HR UV/Vis/NIR (Horiba Jobin Yvon) high resolution dispersive Raman microscope using an argon ion
Electronic Supplementary Material (ESI) for Journal of Materials Chemistry AThis journal is © The Royal Society of Chemistry 2013

laser (514.5 nm). XPS analysis was carried out a THERMO SCIENTIFIC Sigma Probe. The
monochromatized Al Kα was used as the photon source.
Optical and PEC Measurements: The diffused reflectance spectra were determined by a VARIAN
Cary-300 UV-vis spectrophotometer with DRA-CA-30I. The bare Ti foil was used for the baseline. The
florescence spectra were determined by LabRAM HR UV/Vis/NIR photoluminescence (Horiba Jobin
Yvon) with 325 nm He-Cd CW laser source. The florescence decay spectra with the TCSPC system was
measured using Edinburgh Instruments FL920. The emission peak at 509 nm that was excited by 375 nm
laser source (1 MHz) was collected to by the TCSPC detector at 18°C. The PEC measurements were
carried out in a conventional three-electrode system connected to a potentiostat (Gamry, Reference 600).
A platinum wire and an Ag/AgCl electrode were used as counter and reference electrodes, respectively,
which were immersed in aqueous electrolyte of 0.1M NaClO4 with 25 vol.% methanol. The electrolyte
solution was continuously purged with nitrogen during measurement and the NEWPORT 300 W Xenon
lamp with air mass (AM) 1.5G (100 mWcm-2) light filter was used for light source. The scan rate for the
voltammogram was 10 mVs-1. The values from EIS were obtained at open-circuit potential (OCP) in the
frequency range of 106 ~ 10-2 Hz. The optical system for the photocatalytic reactions was composed of a
NEWPORT 300 W Xenon arc lamp and an IR filter (λ > 700 nm) with water cooling system. The average
light intensity was 300 mWcm-2. The quartz reactor was filled with 62 ml water solution of 25 vol.%
methanol and purged with helium (99.999%) for about 2 hour. The evolution of hydrogen was carried out
without Pt and reference electrode, and monitored by using SHIMAZU GC-2014A gas chromatograph of
closed circulation system with quartz reactor.
Electronic Supplementary Material (ESI) for Journal of Materials Chemistry AThis journal is © The Royal Society of Chemistry 2013

Sample TiO2 annealing temperature (°C)
Glucose concentration (mmol)
Pyrolysis temperature (°C)
TiO2 NT 650
GDN-1 650 1 650
GDN-5 650 50 650
GDN-10 650 100 650
TiO2 NT-7 750
GDN-17 650 1 750
GDN-57 650 50 750
GDN-107 650 100 750
Table S1. The experimental conditions of various samples.
Electronic Supplementary Material (ESI) for Journal of Materials Chemistry AThis journal is © The Royal Society of Chemistry 2013

Figure S1. FE-SEM images of bare TiO2 NTs a) before and b) after annealing at 650°C. The smooth
surface is changed to uneven. c) FE-SEM image after hydrothermal treatment. Polymerized glucose
covers whole surface of TiO2 NTs. Top views of d) GDN-5, e) GDN-10 and f) GDN-57 samples,
respectively. The original ordered and aligned 1-D morphology of TiO2 NTs of GDN-5 is preserved well
after the creation of graphitic carbon layer. However, excess of carbon (GDN-10) and high pyrolysis
temperature (GDN-57) introduce collapse of original morphology of TiO2 NTs.
Electronic Supplementary Material (ESI) for Journal of Materials Chemistry AThis journal is © The Royal Society of Chemistry 2013

Figure S2. HR-TEM images for a) irregular, b) thick and fragmented shape, c) the amorphous states of
carbons and d) naturally contaminated amorphous carbons on the surface of bare TiO2 NT. e) Energy
dispersive spectroscopy (EDS) map images of GDN-5. All elements are uniformly located throughout the
surface of TiO2 NTs.
Electronic Supplementary Material (ESI) for Journal of Materials Chemistry AThis journal is © The Royal Society of Chemistry 2013

Figure S3. XPS C 1s spectra of other samples. The GDN-10 shows Ti-C bond peak. The strong sp3 and
organic component peak indicate that the carbon layers of GDN-57 supposed to be amorphous state. The
GDN-1 has similar peak shape with the bare TiO2 NTs.
Electronic Supplementary Material (ESI) for Journal of Materials Chemistry AThis journal is © The Royal Society of Chemistry 2013

Figure S4. Raman spectra of GDN-1 and GDN-10 (GDN-5 and TiO2 NT result are same with Figure 2a).
The ID/IG value of GDN-1 and GDN-10 are 0.86 and 0.88, respectively. The lowest ID/IG value (0.56) and
sharp G-band of the GDN-5 indicates that the state of carbons in GDN-5 is more graphitic than others.
Electronic Supplementary Material (ESI) for Journal of Materials Chemistry AThis journal is © The Royal Society of Chemistry 2013

Figure S5. Diffused ultraviolet-visible (UV-Vis.) absorbance spectra. The absorbance curves of GDN-1
and GDN-5 within the UV range (200–400 nm) were similar to those of bare TiO2 NTs. However, GDN-
10 has a very different absorbance slope and intensity because of its deconstructed anatase phase (band
gap: 3.2 eV) and its newly oriented rutile phase (band gap: 3.0 eV). Although GDs absorb visible light
with an increase in the glucose concentration, we confirmed experimentally that they show no
photocatalytic activity in the visible light range (400~700 nm). Therefore, this absorbance in the visible
light range is thought to come from the molecular vibrations of various organic components that are
created during the formation of GD.
Electronic Supplementary Material (ESI) for Journal of Materials Chemistry AThis journal is © The Royal Society of Chemistry 2013

Figure S6. a) Back and b) front side picture of GDN-5 during hydrogen evolution in water solution of 25
vol.% methanol. Hydrogen evolution is mainly occur on GD combined TiO2 NTs at front side, and also
small amount hydrogen evolved at back side by transported electrons to titanium metal.
Decay time (ns) Relative amplitude (%)
Sample τ1 τ2 τ3 f1 f2 f3 Average
lifetime (ns) χ2
TiO2 NT 0.14 0.86 5.77 25.25 61.38 10.37 3.36 1.325
TiO2 NT:Pt 0.11 0.43 3.18 55.20 42.82 1.98 0.91 1.018
GDN-5 0.12 0.57 4.21 41.82 53.14 5.04 1.89 1.175
Table S2. Tri-exponential function fitted fluorescence decay data. The average lifetime was calculated
using equation (1).32
τττττττ
312111
2
33
2
22
2
11
ffffff
++
++>=< (1)
Electronic Supplementary Material (ESI) for Journal of Materials Chemistry AThis journal is © The Royal Society of Chemistry 2013
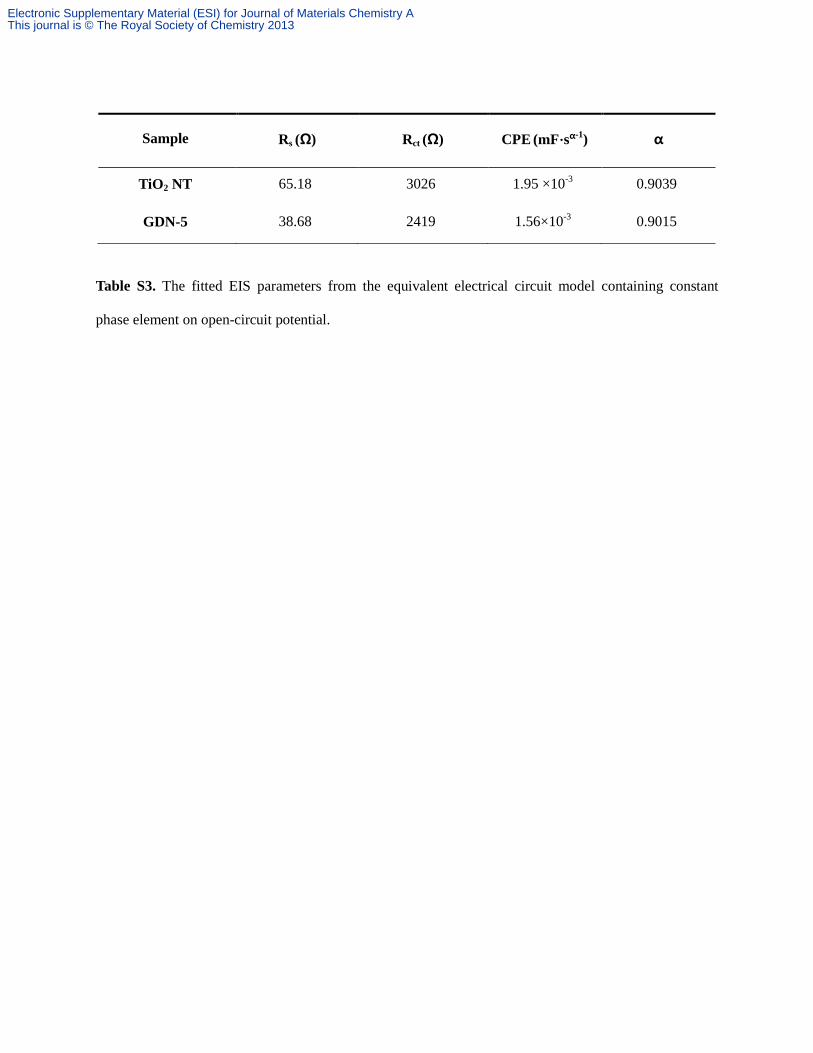
Sample Rs (Ω) Rct (Ω) CPE (mF∙sα-1) α
TiO2 NT 65.18 3026 1.95 ×10⁻³ 0.9039
GDN-5 38.68 2419 1.56×10⁻³ 0.9015
Table S3. The fitted EIS parameters from the equivalent electrical circuit model containing constant
phase element on open-circuit potential.
Electronic Supplementary Material (ESI) for Journal of Materials Chemistry AThis journal is © The Royal Society of Chemistry 2013