Embed Size (px)
Citation preview

TiO2 Nanotube Arrays
Craig A. Grimes l Gopal K. Mor
TiO2 Nanotube Arrays
Synthesis, Properties, and Applications
Craig A. GrimesPennsylvania State UniversityElectrical EngineeringDepartmentUniversity Park, PA [email protected]
Gopal K. MorPennsylvania State UniversityMaterials Research InstituteUniversity Park, PA 16802USAgkm1@ psu.edu
ISBN 978-1-4419-0067-8 e-ISBN 978-1-4419-0068-5DOI 10.1007/978-1-4419-0068-5Springer Dordrecht Heidelberg London New York
Library of Congress Control Number: 2009930642
# Springer Science þ Business Media, LLC 2009All rights reserved. This work may not be translated or copied in whole or in part without the writtenpermission of the publisher (Springer Science+Business Media, LLC, 233 Spring Street, New York, NY10013, USA), except for brief excerpts in connection with reviews or scholarly analysis. Use in connectionwith any form of information storage and retrieval, electronic adaptation, computer software, or by similaror dissimilar methodology now known or hereafter developed is forbidden.The use in this publication of trade names, trademarks, service marks, and similar terms, even if they arenot identified as such, is not to be taken as an expression of opinion as to whether or not they are subject toproprietary rights.
Printed on acid-free paper
Springer is part of Springer Science+Business Media (www.springer.com)
Preface
As the title of this book implies, we examine the fabrication, properties, and
different applications of highly ordered vertically oriented TiO2 nanotube arrays
made by Ti anodization. Since the first report of the highly ordered TiO2 nanotube
arrays by Gong et al. (J Mater Res 16:3331–3334, 2001), the field has grown so
rapidly as to make it difficult to summarize the scope of all related work. Built upon
a suite of synthesis chemistries that enable significant differences in nanotube
morphologies, the TiO2 nanotube arrays have demonstrated remarkable properties
that have successfully given rise to a large number of diverse applications that
include, but are certainly not limited to, super capacitors, solar cells, drug eluting
surfaces, hydrogen sensors, biofiltration membranes, and photoelectrochemical
cells for the solar generation of hydrogen. It appears, for the moment, impossible
to completely canvas the field as it moves more rapidly than one can report on it. Be
that as it may we have tried to at least touch on key aspects of the field, reviewing
the contributions made by various research groups to the fabrication, and applica-
tion of the nanotube arrays, and apologize to those authors of significant work we
may have overlooked.
The book is intended for researchers in the field, which could encompass
undergraduate students, graduate students and beyond. It is meant as both an
introductory work as well as a reference to the field. While the book could be
read cover to cover by those having such energy and interest, the individual
chapters are self-contained per their specific topic. Chapter 1 considers nanotube
array synthesis techniques. Chapter 2 summarizes the structural, elemental, optical,
mechanical, and electrical properties of the TiO2 nanotube arrays. Chapter 3
examines use of TiO2 nanotube arrays as hydrogen gas sensors. Chapter 4 considers
use of the material architecture for photoelectrochemical water splitting. Chapter 5
considers application of TiO2 nanotube arrays to dye-sensitized solar cells and
polymer-based solid state heterojunction solar cells. Chapter 6 discusses the use of
TiO2 nanotubes in biological applications, including their use as a base for biosen-
sors, drug eluting surfaces, osseointegration, biotemplating, enhanced blood
clotting, and as biofiltration membranes.
v

We wish to thank Emeritus Professor Dale M. Grimes for helpful comments
towards improving the manuscript, the anonymous reviewers of the book who put
forth many helpful suggestions, and thank the many authors who generously
granted us permission to use their figures in this book, with a particular nod
to Dr. Radim Beranek, Department of Chemistry & Pharmacy, University of
Erlangen-Nurnberg, who was willing to redraw some of his figures for use herein.
University Park, PA Craig A. Grimes
Gopal K. Mor
vi Preface
Contents
Introduction . . . . . . . . . . . . . . . . . . . . . . . . . . . . . . . . . . . . . . . . . . . . . . . . . . . . . . . . . . . . . . . . xiii
1 Fabrication of TiO2 Nanotube Arrays by Electrochemical
Anodization: Four Synthesis Generations . . . . . . . . . . . . . . . . . . . . . . . . . . . . . . . . . 1
1.1 Introduction . . . . . . . . . . . . . . . . . . . . . . . . . . . . . . . . . . . . . . . . . . . . . . . . . . . . . . . . . . . . . . . 1
1.1.1 The Electrochemical Anodization Process . . . . . . . . . . . . . . . . . . . . . . . . 2
1.2 Nanotube Array Synthesis Using Aqueous Electrolytes:
The First Generation . . . . . . . . . . . . . . . . . . . . . . . . . . . . . . . . . . . . . . . . . . . . . . . . . . . . . . 3
1.2.1 HF-Based Electrolytes . . . . . . . . . . . . . . . . . . . . . . . . . . . . . . . . . . . . . . . . . . . . . 3
1.2.2 Tapered Conical Shape Nanotubes . . . . . . . . . . . . . . . . . . . . . . . . . . . . . . . . 5
1.2.3 Wall Thickness Variation . . . . . . . . . . . . . . . . . . . . . . . . . . . . . . . . . . . . . . . . . 6
1.2.4 Using HNO3/HF . . . . . . . . . . . . . . . . . . . . . . . . . . . . . . . . . . . . . . . . . . . . . . . . . . . 7
1.2.5 Using H2SO4/HF . . . . . . . . . . . . . . . . . . . . . . . . . . . . . . . . . . . . . . . . . . . . . . . . . . 8
1.2.6 Using H2Cr2O7/HF . . . . . . . . . . . . . . . . . . . . . . . . . . . . . . . . . . . . . . . . . . . . . . . . 8
1.2.7 Using CH3COOH/NH4F, H2SO4/NH4F . . . . . . . . . . . . . . . . . . . . . . . . . . . 9
1.2.8 Using H3PO4/HF, H3PO4/NH4F . . . . . . . . . . . . . . . . . . . . . . . . . . . . . . . . . . 10
1.3 Nanotube Array Synthesis Using Buffered Electrolytes:
The Second Generation . . . . . . . . . . . . . . . . . . . . . . . . . . . . . . . . . . . . . . . . . . . . . . . . . . 12
1.3.1 Step-by-Step Procedure: Solution Preparation,
Mixing and pH Adjustment . . . . . . . . . . . . . . . . . . . . . . . . . . . . . . . . . . . . . . 15
1.3.2 Solution Set Preparation . . . . . . . . . . . . . . . . . . . . . . . . . . . . . . . . . . . . . . . . . . 15
1.3.3 Anodization with Constant Current Density . . . . . . . . . . . . . . . . . . . . . 16
1.4 Synthesis of Nanotube Arrays Using Polar Organic Electrolytes:
The Third Generation . . . . . . . . . . . . . . . . . . . . . . . . . . . . . . . . . . . . . . . . . . . . . . . . . . . . 18
1.4.1 Using Formamide and Dimethyl formamide electrolyte . . . . . . . . . 18
1.4.2 Dimethyl Sulfoxide Electrolytes . . . . . . . . . . . . . . . . . . . . . . . . . . . . . . . . . 22
1.4.3 Ethylene Glycol Electrolytes . . . . . . . . . . . . . . . . . . . . . . . . . . . . . . . . . . . . . 26
1.4.4 Diethylene Glycol Electrolytes . . . . . . . . . . . . . . . . . . . . . . . . . . . . . . . . . . . 34
1.4.5 Using Glycerol and NH4F . . . . . . . . . . . . . . . . . . . . . . . . . . . . . . . . . . . . . . . . 37
1.4.6 Methanol, Water, and HF . . . . . . . . . . . . . . . . . . . . . . . . . . . . . . . . . . . . . . . . 38
1.5 Nanotube Array Synthesis Using Non-Fluoride Based Electrolytes:
The Fourth Generation . . . . . . . . . . . . . . . . . . . . . . . . . . . . . . . . . . . . . . . . . . . . . . . . . . 38
vii
1.5.1 Using HCl . . . . . . . . . . . . . . . . . . . . . . . . . . . . . . . . . . . . . . . . . . . . . . . . . . . . . . . . 40
1.5.2 H2O2 Aqueous Electrolytes . . . . . . . . . . . . . . . . . . . . . . . . . . . . . . . . . . . . . . 40
1.5.3 HCl/H2O2 Aqueous Electrolytes . . . . . . . . . . . . . . . . . . . . . . . . . . . . . . . . . 42
1.6 Fabrication of Transparent TiO2 Nanotubes Arrays . . . . . . . . . . . . . . . . . . . . 44
1.7 Mechanistic Model of Nanotube Array Formation by
Potentiostatic Anodization . . . . . . . . . . . . . . . . . . . . . . . . . . . . . . . . . . . . . . . . . . . . . . 48
References . . . . . . . . . . . . . . . . . . . . . . . . . . . . . . . . . . . . . . . . . . . . . . . . . . . . . . . . . . . . . . . . . . . . 59
2 Material Properties of TiO2 Nanotube Arrays: Structural, Elemental,
Mechanical, Optical, and Electrical . . . . . . . . . . . . . . . . . . . . . . . . . . . . . . . . . . . . . . . 67
2.1 Introduction . . . . . . . . . . . . . . . . . . . . . . . . . . . . . . . . . . . . . . . . . . . . . . . . . . . . . . . . . . . . . . 67
2.2 Structural and Elemental Characterization . . . . . . . . . . . . . . . . . . . . . . . . . . . . . . 67
2.2.1 Anodic Formation of Crystalline Metal Oxide Nanotubes . . . . . . 73
2.2.2 Improved Crystallization via Solvothermal Treatment . . . . . . . . . . 76
2.2.3 Partially Crystalline Anatase Phase Nanotubes
by Anodization . . . . . . . . . . . . . . . . . . . . . . . . . . . . . . . . . . . . . . . . . . . . . . . . . . . 78
2.3 Characterization of Doped Titania Nanotubes . . . . . . . . . . . . . . . . . . . . . . . . . . 79
2.3.1 Carbon Incorporation Within the Nanotubes . . . . . . . . . . . . . . . . . . . . 79
2.3.2 Nitrogen Incorporation Within the Nanotubes . . . . . . . . . . . . . . . . . . . 80
2.3.3 Boron-Doped Nanotubes . . . . . . . . . . . . . . . . . . . . . . . . . . . . . . . . . . . . . . . . . 82
2.3.4 Organic Bath . . . . . . . . . . . . . . . . . . . . . . . . . . . . . . . . . . . . . . . . . . . . . . . . . . . . . . 82
2.3.5 CdS-Coated Nanotubes . . . . . . . . . . . . . . . . . . . . . . . . . . . . . . . . . . . . . . . . . . . 83
2.4 Optical Properties of Titania Nanotubes Arrays . . . . . . . . . . . . . . . . . . . . . . . . 83
2.4.1 Finite Difference Time Domain Simulation
of Light Propagation in Nanotube Arrays . . . . . . . . . . . . . . . . . . . . . . . . 83
2.4.2 Measured Optical Properties . . . . . . . . . . . . . . . . . . . . . . . . . . . . . . . . . . . . . 88
2.4.3 Ellipsometric Measurements . . . . . . . . . . . . . . . . . . . . . . . . . . . . . . . . . . . . . 92
2.4.4 Raman Spectra Measurements . . . . . . . . . . . . . . . . . . . . . . . . . . . . . . . . . . . 96
2.5 Electrical Property Measurements . . . . . . . . . . . . . . . . . . . . . . . . . . . . . . . . . . . . . . 97
2.5.1 Photocurrent Transient Measurements . . . . . . . . . . . . . . . . . . . . . . . . . . . 97
2.5.2 Capacitance Measurements . . . . . . . . . . . . . . . . . . . . . . . . . . . . . . . . . . . . . . . 98
2.6 Mechanical Properties . . . . . . . . . . . . . . . . . . . . . . . . . . . . . . . . . . . . . . . . . . . . . . . . . 105
References . . . . . . . . . . . . . . . . . . . . . . . . . . . . . . . . . . . . . . . . . . . . . . . . . . . . . . . . . . . . . . . . . . 106
3 TiO2 Nanotube Arrays: Application to Hydrogen Sensing . . . . . . . . . . . . 115
3.1 Introduction . . . . . . . . . . . . . . . . . . . . . . . . . . . . . . . . . . . . . . . . . . . . . . . . . . . . . . . . . . . . 115
3.2 High Temperature Sensors using TiO2 Nanotube Arrays . . . . . . . . . . . . . 117
3.3 Self-Cleaning Room-Temperature Hydrogen Sensors . . . . . . . . . . . . . . . . 121
3.4 Room-Temperature Hydrogen Sensors of Enhanced Sensitivity . . . . . 126
3.4.1 TiO2 Nanotube Arrays on Ti Foil . . . . . . . . . . . . . . . . . . . . . . . . . . . . . . . 126
3.4.2 Transparent Hydrogen Sensors . . . . . . . . . . . . . . . . . . . . . . . . . . . . . . . . . . 131
3.5 Extreme Hydrogen Gas Sensitivities at Room Temperature . . . . . . . . . 132
3.6 Transcutaneous Hydrogen Monitoring using TiO2
Nanotube Arrays . . . . . . . . . . . . . . . . . . . . . . . . . . . . . . . . . . . . . . . . . . . . . . . . . . . . . . . 136
3.6.1 Cross Interference and Calibration . . . . . . . . . . . . . . . . . . . . . . . . . . . . . . 137
viii Contents
3.6.2 Transcutaneous Hydrogen and Lactose Intolerance . . . . . . . . . . . . 141
References . . . . . . . . . . . . . . . . . . . . . . . . . . . . . . . . . . . . . . . . . . . . . . . . . . . . . . . . . . . . . . . . . . 142
4 TiO2 Nanotube Arrays: Application to Photoelectrochemical
Water Splitting . . . . . . . . . . . . . . . . . . . . . . . . . . . . . . . . . . . . . . . . . . . . . . . . . . . . . . . . . . . . 149
4.1 Introduction . . . . . . . . . . . . . . . . . . . . . . . . . . . . . . . . . . . . . . . . . . . . . . . . . . . . . . . . . . . . 149
4.2 Photoelectrolysis Cell . . . . . . . . . . . . . . . . . . . . . . . . . . . . . . . . . . . . . . . . . . . . . . . . . 150
4.2.1 Water Splitting Efficiency . . . . . . . . . . . . . . . . . . . . . . . . . . . . . . . . . . . . . . . 153
4.2.2 Quantum Efficiency Calculation . . . . . . . . . . . . . . . . . . . . . . . . . . . . . . . . 157
4.3 Photoelectrolysis Using Unmodified TiO2 Nanotubes . . . . . . . . . . . . . . . . 158
4.3.1 Short Nanotubes . . . . . . . . . . . . . . . . . . . . . . . . . . . . . . . . . . . . . . . . . . . . . . . . . 159
4.3.2 Medium Length Nanotubes . . . . . . . . . . . . . . . . . . . . . . . . . . . . . . . . . . . . . 161
4.3.3 Long Nanotubes . . . . . . . . . . . . . . . . . . . . . . . . . . . . . . . . . . . . . . . . . . . . . . . . . 164
4.3.4 Roughness Factor . . . . . . . . . . . . . . . . . . . . . . . . . . . . . . . . . . . . . . . . . . . . . . . . 166
4.3.5 Effect of Electrolyte Additives . . . . . . . . . . . . . . . . . . . . . . . . . . . . . . . . . . 168
4.4 Photoelectrolysis Using Anionic and Cationic Doped
TiO2 Nanotubes . . . . . . . . . . . . . . . . . . . . . . . . . . . . . . . . . . . . . . . . . . . . . . . . . . . . . . . . 170
4.4.1 N-Doped TiO2 Nanotubes . . . . . . . . . . . . . . . . . . . . . . . . . . . . . . . . . . . . . . . 170
4.4.2 Carbon Doped TiO2 Nanotubes . . . . . . . . . . . . . . . . . . . . . . . . . . . . . . . . . 174
4.4.3 Sulfur-Doped TiO2 Nanotubes . . . . . . . . . . . . . . . . . . . . . . . . . . . . . . . . . . 175
4.4.4 Boron-Doped TiO2 Nanotubes . . . . . . . . . . . . . . . . . . . . . . . . . . . . . . . . . . 176
4.4.5 Silicon-Doped TiO2 Nanotubes . . . . . . . . . . . . . . . . . . . . . . . . . . . . . . . . . 177
4.5 Photoelectrolysis Using Surface-Sensitized TiO2 Nanotubes . . . . . . . . 178
4.5.1 CdS Sensitized TiO2 Nanotubes . . . . . . . . . . . . . . . . . . . . . . . . . . . . . . . . 178
4.5.2 CdSe Sensitized TiO2 Nanotubes . . . . . . . . . . . . . . . . . . . . . . . . . . . . . . . 180
4.5.3 CdTe Sensitized TiO2 Nanotube Arrays [137] . . . . . . . . . . . . . . . . . . 180
4.5.4 WO3 Coated TiO2 Nanotubes . . . . . . . . . . . . . . . . . . . . . . . . . . . . . . . . . . . 183
4.5.5 Pt Sensitized TiO2 Nanotubes . . . . . . . . . . . . . . . . . . . . . . . . . . . . . . . . . . . 184
4.6 Other Approaches . . . . . . . . . . . . . . . . . . . . . . . . . . . . . . . . . . . . . . . . . . . . . . . . . . . . . 185
4.6.1 Polyoxophosphotungstate Encapsulated in
TiO2 Nanotubes . . . . . . . . . . . . . . . . . . . . . . . . . . . . . . . . . . . . . . . . . . . . . . . . . . 185
4.6.2 Light Sensitized Enzymatic System
with TiO2 Nanotubes . . . . . . . . . . . . . . . . . . . . . . . . . . . . . . . . . . . . . . . . . . . . 186
4.7 Self-Biased Photoelectrochemical Diodes Using Cu-Ti-O Ternary
Oxide Nanotubes . . . . . . . . . . . . . . . . . . . . . . . . . . . . . . . . . . . . . . . . . . . . . . . . . . . . . . 188
4.7.1 Fabrication of p-Type Copper Rich Cu-Ti-O Nanotubes . . . . . . . 189
4.7.2 Photoelectrochemical Properties . . . . . . . . . . . . . . . . . . . . . . . . . . . . . . . . 192
4.7.3 Self-Biased Heterojunction Photoelectrochemical Diodes . . . . . 193
4.8 Visible light responsive Ti-Fe-O ternary oxide nanotubes . . . . . . . . . . . 195
4.8.1 Benefits of nanostructuring hematite . . . . . . . . . . . . . . . . . . . . . . . . . . . . 195
4.8.2 Self-Aligned Nanoporous Iron (III) Oxide . . . . . . . . . . . . . . . . . . . . . . 196
4.8.3 Photoelectrochemical Properties of Self–Aligned
Nanoporous Iron (III) Oxide . . . . . . . . . . . . . . . . . . . . . . . . . . . . . . . . . . . . 198
4.8.4 Fabrication and Structural Characterization of
Ti-Fe-O Nanotubes . . . . . . . . . . . . . . . . . . . . . . . . . . . . . . . . . . . . . . . . . . . . . . 198
Contents ix
4.8.5 Photoelectrochemical Properties of Ti–Fe–O Nanotubes . . . . . . . 203
4.9 Compositionally Graded Ternary Oxide Nanotube Arrays . . . . . . . . . . . 205
References . . . . . . . . . . . . . . . . . . . . . . . . . . . . . . . . . . . . . . . . . . . . . . . . . . . . . . . . . . . . . . . . . . 206
5 Dye-Sensitized and Bulk-Heterojunctions Solar Cells:
TiO2 Nanotube Arrays as a Base Material . . . . . . . . . . . . . . . . . . . . . . . . . . . . . . 217
5.1 Introduction . . . . . . . . . . . . . . . . . . . . . . . . . . . . . . . . . . . . . . . . . . . . . . . . . . . . . . . . . . . . 217
5.2 Dye Sensitized Solar Cells: Operating Principles . . . . . . . . . . . . . . . . . . . . . 218
5.2.1 Key DSC Processes . . . . . . . . . . . . . . . . . . . . . . . . . . . . . . . . . . . . . . . . . . . . . . 219
5.2.2 Factors Influencing Conversion Efficiencies . . . . . . . . . . . . . . . . . . . . 220
5.2.3 Nanocrystalline DSCs . . . . . . . . . . . . . . . . . . . . . . . . . . . . . . . . . . . . . . . . . . . 223
5.3 Solar Cell Parameters . . . . . . . . . . . . . . . . . . . . . . . . . . . . . . . . . . . . . . . . . . . . . . . . . . 225
5.4 J–V Characterization Under Standard Conditions . . . . . . . . . . . . . . . . . . . . 226
5.4.1 Calibrating the Solar Simulator for DSC
and Polymeric Solar Cells . . . . . . . . . . . . . . . . . . . . . . . . . . . . . . . . . . . . . . . 226
5.4.2 Experimental Setup . . . . . . . . . . . . . . . . . . . . . . . . . . . . . . . . . . . . . . . . . . . . . . 227
5.5 Benefits of Vertically Oriented Uniformly Aligned TiO2
Nanotube Arrays in DSCs . . . . . . . . . . . . . . . . . . . . . . . . . . . . . . . . . . . . . . . . . . . . . 228
5.5.1 Finite Difference Time Domain Application to DSCs . . . . . . . . . . 229
5.6 Liquid Junction DSCs . . . . . . . . . . . . . . . . . . . . . . . . . . . . . . . . . . . . . . . . . . . . . . . . . 234
5.6.1 Transparent TiO2 Nanotube Arrays on FTO
Coated Glass: Front Side Illumination . . . . . . . . . . . . . . . . . . . . . . . . . . 239
5.6.2 TiO2 Nanotube Arrays on Ti Foil: Back Side Illumination . . . . . 245
5.6.3 Charge Collection Properties . . . . . . . . . . . . . . . . . . . . . . . . . . . . . . . . . . . . 252
5.6.4 Electron Transport and Recombination Properties . . . . . . . . . . . . . . 253
5.7 Polymer Based Bulk Heterojunction Solar Cells . . . . . . . . . . . . . . . . . . . . . 258
5.7.1 TiO2 Nanotubes on FTO Glass: Polymeric Bulk
Heterojunction Solar Cells . . . . . . . . . . . . . . . . . . . . . . . . . . . . . . . . . . . . . . 262
5.7.2 Solar Cell Fabrication and Performance . . . . . . . . . . . . . . . . . . . . . . . . 266
5.7.3 TiO2-Polymer Based Solar Cells: Back Side Illumination
Geometry . . . . . . . . . . . . . . . . . . . . . . . . . . . . . . . . . . . . . . . . . . . . . . . . . . . . . . . . 270
References . . . . . . . . . . . . . . . . . . . . . . . . . . . . . . . . . . . . . . . . . . . . . . . . . . . . . . . . . . . . . . . . . . 274
6 Use of TiO2 Nanotube Arrays for Biological Applications . . . . . . . . . . . . 285
6.1 Introduction . . . . . . . . . . . . . . . . . . . . . . . . . . . . . . . . . . . . . . . . . . . . . . . . . . . . . . . . . . . . 285
6.2 Biosensors . . . . . . . . . . . . . . . . . . . . . . . . . . . . . . . . . . . . . . . . . . . . . . . . . . . . . . . . . . . . . 286
6.2.1 H2O2 Detection: Nanotubes Co-immobilized
with HRP and Thionine . . . . . . . . . . . . . . . . . . . . . . . . . . . . . . . . . . . . . . . . . 286
6.2.2 Co-Immobilized with Cytochrome c . . . . . . . . . . . . . . . . . . . . . . . . . . . . 288
6.2.3 Detection of H2O2 and Glucose . . . . . . . . . . . . . . . . . . . . . . . . . . . . . . . . . 288
6.3 Enhanced Blood Clotting . . . . . . . . . . . . . . . . . . . . . . . . . . . . . . . . . . . . . . . . . . . . . . 290
6.4 Cell Adhesion and Osteoblast Growth . . . . . . . . . . . . . . . . . . . . . . . . . . . . . . . . 292
6.5 Drug Elution from TiO2 Nanotubes . . . . . . . . . . . . . . . . . . . . . . . . . . . . . . . . . . . 296
6.6 Hydrophobic Nanotubes: SAMs on Surface on Hydrophilic
Nanotubes . . . . . . . . . . . . . . . . . . . . . . . . . . . . . . . . . . . . . . . . . . . . . . . . . . . . . . . . . . . . . . 301
x Contents

6.7 Biological Fluids Filtration and Drug Delivery Using TiO2
Nanotubular Membrane . . . . . . . . . . . . . . . . . . . . . . . . . . . . . . . . . . . . . . . . . . . . . . . 302
6.8 Application of Photocatalytic TiO2 Nanotube Properties . . . . . . . . . . . . . 308
References . . . . . . . . . . . . . . . . . . . . . . . . . . . . . . . . . . . . . . . . . . . . . . . . . . . . . . . . . . . . . . . . . . 309
7 Conclusions and New Directions . . . . . . . . . . . . . . . . . . . . . . . . . . . . . . . . . . . . . . . . . 315
7.1 Conclusions . . . . . . . . . . . . . . . . . . . . . . . . . . . . . . . . . . . . . . . . . . . . . . . . . . . . . . . . . . . . 315
7.2 Some Future Directions . . . . . . . . . . . . . . . . . . . . . . . . . . . . . . . . . . . . . . . . . . . . . . . 320
7.2.1 Intercalation and Supercapacitors . . . . . . . . . . . . . . . . . . . . . . . . . . . . . . . 320
7.2.2 CO2 Reduction Using Visible Light . . . . . . . . . . . . . . . . . . . . . . . . . . . . 329
References . . . . . . . . . . . . . . . . . . . . . . . . . . . . . . . . . . . . . . . . . . . . . . . . . . . . . . . . . . . . . . . . . . 340
Index . . . . . . . . . . . . . . . . . . . . . . . . . . . . . . . . . . . . . . . . . . . . . . . . . . . . . . . . . . . . . . . . . . . . . . . . . . . 347
Contents xi
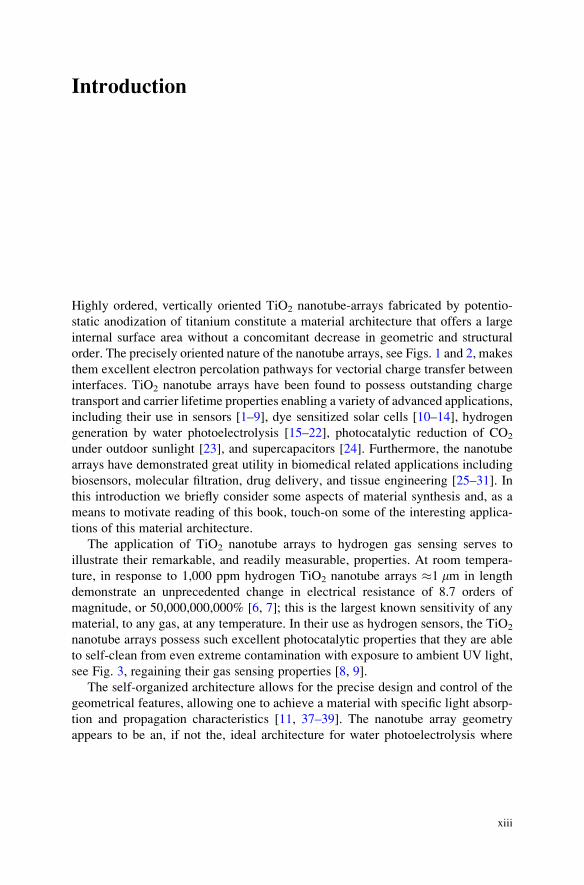
Introduction
Highly ordered, vertically oriented TiO2 nanotube-arrays fabricated by potentio-
static anodization of titanium constitute a material architecture that offers a large
internal surface area without a concomitant decrease in geometric and structural
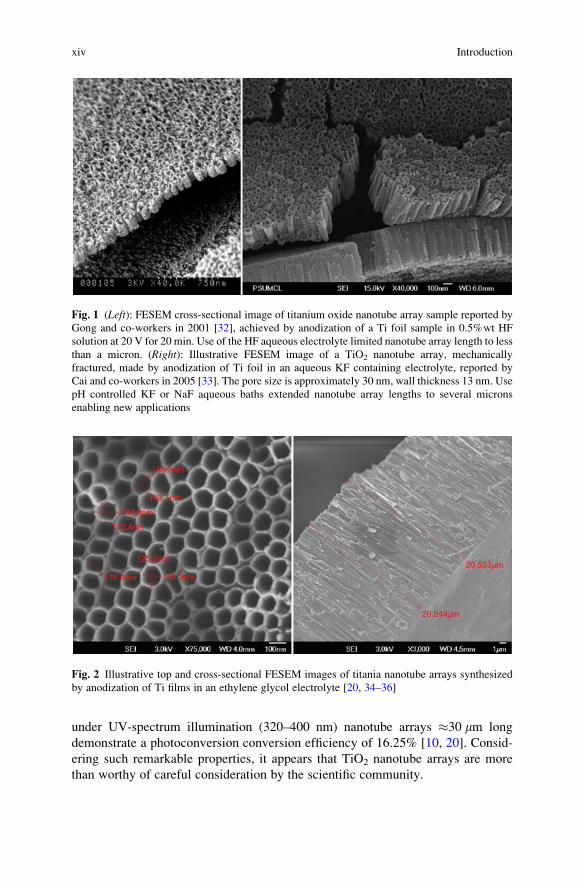
order. The precisely oriented nature of the nanotube arrays, see Figs. 1 and 2, makes
them excellent electron percolation pathways for vectorial charge transfer between
interfaces. TiO2 nanotube arrays have been found to possess outstanding charge
transport and carrier lifetime properties enabling a variety of advanced applications,
including their use in sensors [1–9], dye sensitized solar cells [10–14], hydrogen
generation by water photoelectrolysis [15–22], photocatalytic reduction of CO2
under outdoor sunlight [23], and supercapacitors [24]. Furthermore, the nanotube
arrays have demonstrated great utility in biomedical related applications including
biosensors, molecular filtration, drug delivery, and tissue engineering [25–31]. In
this introduction we briefly consider some aspects of material synthesis and, as a
means to motivate reading of this book, touch-on some of the interesting applica-
tions of this material architecture.
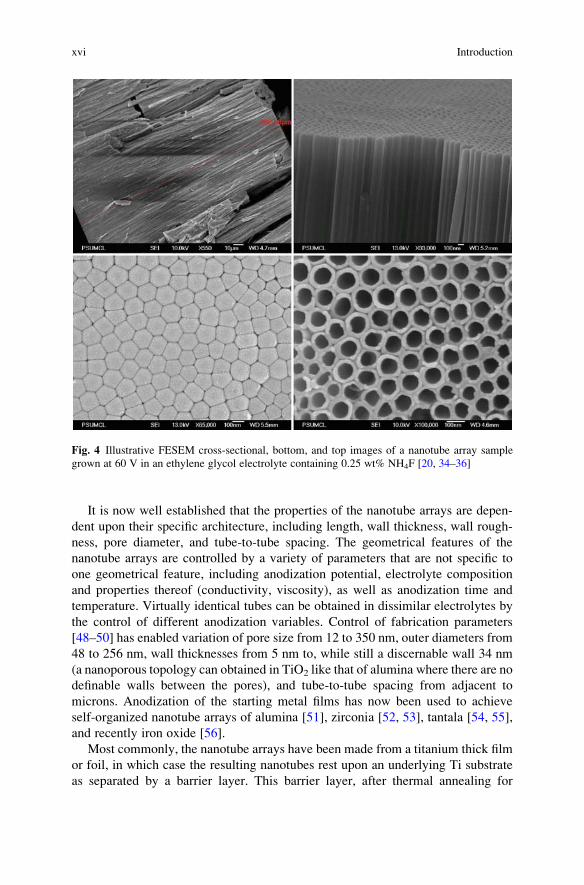
The application of TiO2 nanotube arrays to hydrogen gas sensing serves to
illustrate their remarkable, and readily measurable, properties. At room tempera-
ture, in response to 1,000 ppm hydrogen TiO2 nanotube arrays �1 mm in length
demonstrate an unprecedented change in electrical resistance of 8.7 orders of
magnitude, or 50,000,000,000% [6, 7]; this is the largest known sensitivity of any
material, to any gas, at any temperature. In their use as hydrogen sensors, the TiO2
nanotube arrays possess such excellent photocatalytic properties that they are able
to self-clean from even extreme contamination with exposure to ambient UV light,
see Fig. 3, regaining their gas sensing properties [8, 9].
The self-organized architecture allows for the precise design and control of the
geometrical features, allowing one to achieve a material with specific light absorp-
tion and propagation characteristics [11, 37–39]. The nanotube array geometry
appears to be an, if not the, ideal architecture for water photoelectrolysis where
xiii
under UV-spectrum illumination (320–400 nm) nanotube arrays �30 mm long
demonstrate a photoconversion conversion efficiency of 16.25% [10, 20]. Consid-
ering such remarkable properties, it appears that TiO2 nanotube arrays are more
than worthy of careful consideration by the scientific community.
Fig. 1 (Left): FESEM cross-sectional image of titanium oxide nanotube array sample reported by
Gong and co-workers in 2001 [32], achieved by anodization of a Ti foil sample in 0.5%wt HF
solution at 20 V for 20 min. Use of the HF aqueous electrolyte limited nanotube array length to less
than a micron. (Right): Illustrative FESEM image of a TiO2 nanotube array, mechanically
fractured, made by anodization of Ti foil in an aqueous KF containing electrolyte, reported by
Cai and co-workers in 2005 [33]. The pore size is approximately 30 nm, wall thickness 13 nm. Use
pH controlled KF or NaF aqueous baths extended nanotube array lengths to several microns
enabling new applications
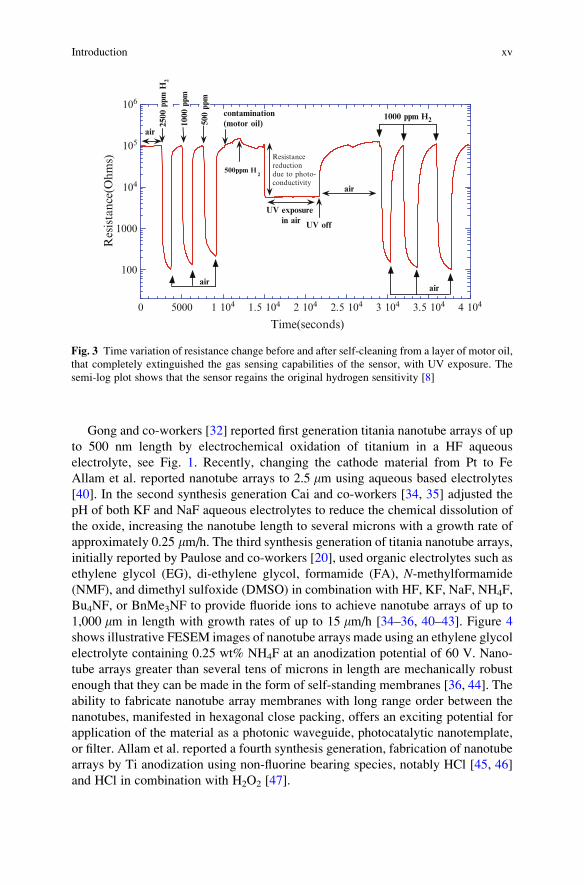
Fig. 2 Illustrative top and cross-sectional FESEM images of titania nanotube arrays synthesized
by anodization of Ti films in an ethylene glycol electrolyte [20, 34–36]
xiv Introduction
Gong and co-workers [32] reported first generation titania nanotube arrays of up
to 500 nm length by electrochemical oxidation of titanium in a HF aqueous
electrolyte, see Fig. 1. Recently, changing the cathode material from Pt to Fe
Allam et al. reported nanotube arrays to 2.5 mm using aqueous based electrolytes
[40]. In the second synthesis generation Cai and co-workers [34, 35] adjusted the
pH of both KF and NaF aqueous electrolytes to reduce the chemical dissolution of
the oxide, increasing the nanotube length to several microns with a growth rate of
approximately 0.25 mm/h. The third synthesis generation of titania nanotube arrays,
initially reported by Paulose and co-workers [20], used organic electrolytes such as
ethylene glycol (EG), di-ethylene glycol, formamide (FA), N-methylformamide
(NMF), and dimethyl sulfoxide (DMSO) in combination with HF, KF, NaF, NH4F,
Bu4NF, or BnMe3NF to provide fluoride ions to achieve nanotube arrays of up to
1,000 mm in length with growth rates of up to 15 mm/h [34–36, 40–43]. Figure 4
shows illustrative FESEM images of nanotube arrays made using an ethylene glycol
electrolyte containing 0.25 wt% NH4F at an anodization potential of 60 V. Nano-
tube arrays greater than several tens of microns in length are mechanically robust
enough that they can be made in the form of self-standing membranes [36, 44]. The
ability to fabricate nanotube array membranes with long range order between the
nanotubes, manifested in hexagonal close packing, offers an exciting potential for
application of the material as a photonic waveguide, photocatalytic nanotemplate,
or filter. Allam et al. reported a fourth synthesis generation, fabrication of nanotube
arrays by Ti anodization using non-fluorine bearing species, notably HCl [45, 46]
and HCl in combination with H2O2 [47].
100
1000
104
105
106
0 5000 1 104 1.5 104 2 104 2.5 104 3 104 3.5 104 4 104
Res
ista
nce(
Ohm
s)
Time(seconds)
2500
ppm
H2
1000
ppm
500
ppm
contamination(motor oil)
500ppm H2
Resistance reductiondue to photo-conductivity
air
UV exposure in air UV off
air
1000 ppm H2
air
air
Fig. 3 Time variation of resistance change before and after self-cleaning from a layer of motor oil,
that completely extinguished the gas sensing capabilities of the sensor, with UV exposure. The
semi-log plot shows that the sensor regains the original hydrogen sensitivity [8]
Introduction xv
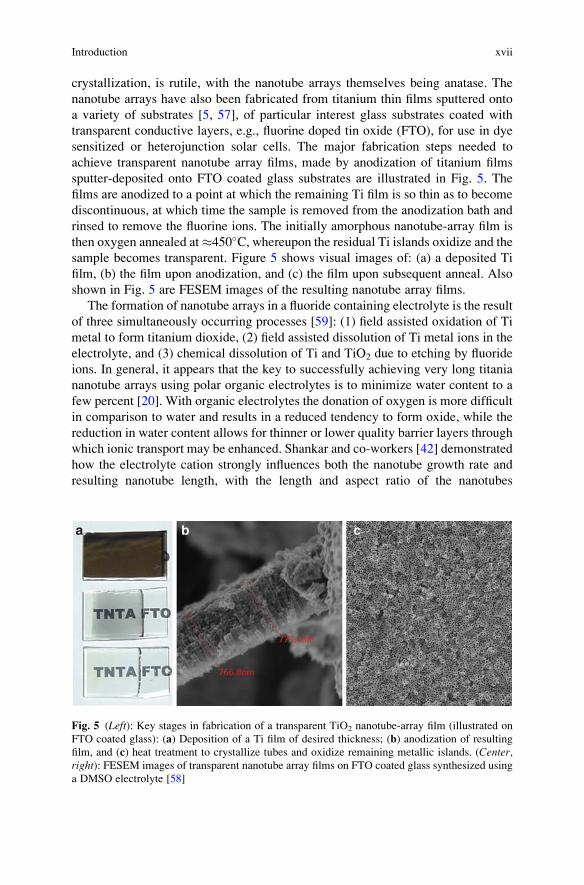
It is now well established that the properties of the nanotube arrays are depen-
dent upon their specific architecture, including length, wall thickness, wall rough-
ness, pore diameter, and tube-to-tube spacing. The geometrical features of the
nanotube arrays are controlled by a variety of parameters that are not specific to
one geometrical feature, including anodization potential, electrolyte composition
and properties thereof (conductivity, viscosity), as well as anodization time and
temperature. Virtually identical tubes can be obtained in dissimilar electrolytes by
the control of different anodization variables. Control of fabrication parameters
[48–50] has enabled variation of pore size from 12 to 350 nm, outer diameters from
48 to 256 nm, wall thicknesses from 5 nm to, while still a discernable wall 34 nm
(a nanoporous topology can obtained in TiO2 like that of alumina where there are no
definable walls between the pores), and tube-to-tube spacing from adjacent to
microns. Anodization of the starting metal films has now been used to achieve
self-organized nanotube arrays of alumina [51], zirconia [52, 53], tantala [54, 55],
and recently iron oxide [56].
Most commonly, the nanotube arrays have been made from a titanium thick film
or foil, in which case the resulting nanotubes rest upon an underlying Ti substrate
as separated by a barrier layer. This barrier layer, after thermal annealing for
Fig. 4 Illustrative FESEM cross-sectional, bottom, and top images of a nanotube array sample
grown at 60 V in an ethylene glycol electrolyte containing 0.25 wt% NH4F [20, 34–36]
xvi Introduction
crystallization, is rutile, with the nanotube arrays themselves being anatase. The
nanotube arrays have also been fabricated from titanium thin films sputtered onto
a variety of substrates [5, 57], of particular interest glass substrates coated with
transparent conductive layers, e.g., fluorine doped tin oxide (FTO), for use in dye
sensitized or heterojunction solar cells. The major fabrication steps needed to
achieve transparent nanotube array films, made by anodization of titanium films
sputter-deposited onto FTO coated glass substrates are illustrated in Fig. 5. The
films are anodized to a point at which the remaining Ti film is so thin as to become
discontinuous, at which time the sample is removed from the anodization bath and
rinsed to remove the fluorine ions. The initially amorphous nanotube-array film is
then oxygen annealed at�450�C, whereupon the residual Ti islands oxidize and thesample becomes transparent. Figure 5 shows visual images of: (a) a deposited Ti
film, (b) the film upon anodization, and (c) the film upon subsequent anneal. Also
shown in Fig. 5 are FESEM images of the resulting nanotube array films.
The formation of nanotube arrays in a fluoride containing electrolyte is the result
of three simultaneously occurring processes [59]: (1) field assisted oxidation of Ti
metal to form titanium dioxide, (2) field assisted dissolution of Ti metal ions in the
electrolyte, and (3) chemical dissolution of Ti and TiO2 due to etching by fluoride
ions. In general, it appears that the key to successfully achieving very long titania
nanotube arrays using polar organic electrolytes is to minimize water content to a
few percent [20]. With organic electrolytes the donation of oxygen is more difficult
in comparison to water and results in a reduced tendency to form oxide, while the
reduction in water content allows for thinner or lower quality barrier layers through
which ionic transport may be enhanced. Shankar and co-workers [42] demonstrated
how the electrolyte cation strongly influences both the nanotube growth rate and
resulting nanotube length, with the length and aspect ratio of the nanotubes
Fig. 5 (Left): Key stages in fabrication of a transparent TiO2 nanotube-array film (illustrated on
FTO coated glass): (a) Deposition of a Ti film of desired thickness; (b) anodization of resulting
film, and (c) heat treatment to crystallize tubes and oxidize remaining metallic islands. (Center,right): FESEM images of transparent nanotube array films on FTO coated glass synthesized using
a DMSO electrolyte [58]
Introduction xvii
increasing with increasing cation size. Under similar conditions, electrolytes con-
taining a tetrabutylammonium cation resulted in the longest nanotubes (~94 mm),
while the shortest nanotubes (~3 mm) were obtained when Hþ ions were the sole
cationic species in the anodization electrolyte. The difference in growth character-
istics was attributed to the inhibitory effect of the quarternary ammonium ions that
restrict the thickness of the interfacial (barrier) oxide layer; a thinner interfacial
oxide layer facilitates ionic transport, thus, enhancing nanotube growth. Tables 1
and 2 are illustrative of some of the inherent nanotube array fabrication variables.
It is important to note that a tube is not necessarily a tube; nanotube array forma-
tion in aqueous electrolytes, and under certain conditions using organic electro-
lytes, is purely a subtractive process: one starts with a titanium film of thickness X
and achieves a nanotube array having a thickness less than X. In contrast, in some
polar organic electrolytes, one can begin with a titanium film of thickness Y and
achieve a nanotube array of thickness greater than Y with material removed from
the pores going into wall formation. It appears that a comparative study on the
electrical properties of the TiO2 nanotubes as a function of their fabrication
conditions has yet to be reported, and would be a most interesting and valuable
contribution to the field.
As initially fabricated, the nanotube arrays are amorphous, crystallizing with a
high temperature anneal [60]. Higher temperature anneals improve the crystallinity
of the anatase nanotube walls. For nanotube arrays made from, and resting upon, an
underlying titanium layer higher annealing temperatures increase the thickness of
the barrier layer and the rutile content in the barrier layer. There are clues that
indicate control of the anodization process may possibly enable one to directly
achieve crystalline nanotube arrays [41]. We note the work of Allam et al. [61] that
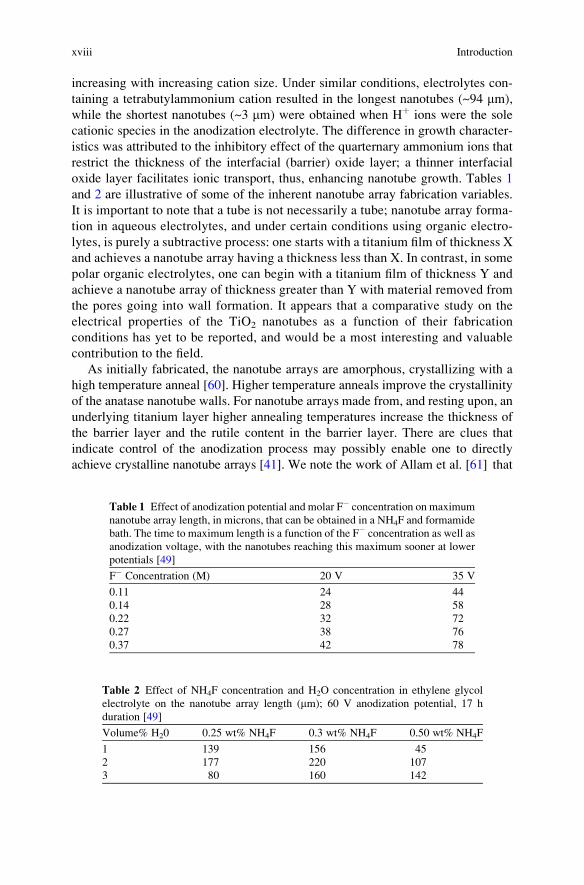
Table 2 Effect of NH4F concentration and H2O concentration in ethylene glycol
electrolyte on the nanotube array length (mm); 60 V anodization potential, 17 h
duration [49]
Volume% H20 0.25 wt% NH4F 0.3 wt% NH4F 0.50 wt% NH4F
1 139 156 45
2 177 220 107
3 80 160 142
Table 1 Effect of anodization potential and molar F� concentration on maximum
nanotube array length, in microns, that can be obtained in a NH4F and formamide
bath. The time to maximum length is a function of the F� concentration as well as
anodization voltage, with the nanotubes reaching this maximum sooner at lower
potentials [49]
F� Concentration (M) 20 V 35 V
0.11 24 44
0.14 28 58
0.22 32 72
0.27 38 76
0.37 42 78
xviii Introduction
directly synthesized crystalline nanotube arrays a few microns in length by
anodization of chemically oxidized Ti films.
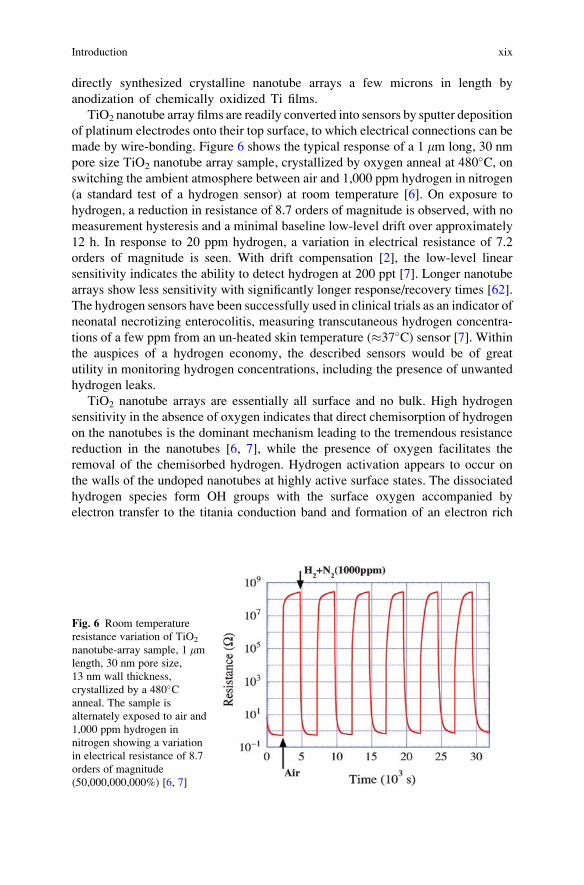
TiO2 nanotube array films are readily converted into sensors by sputter deposition
of platinum electrodes onto their top surface, to which electrical connections can be
made by wire-bonding. Figure 6 shows the typical response of a 1 mm long, 30 nm
pore size TiO2 nanotube array sample, crystallized by oxygen anneal at 480�C, onswitching the ambient atmosphere between air and 1,000 ppm hydrogen in nitrogen
(a standard test of a hydrogen sensor) at room temperature [6]. On exposure to
hydrogen, a reduction in resistance of 8.7 orders of magnitude is observed, with no
measurement hysteresis and a minimal baseline low-level drift over approximately
12 h. In response to 20 ppm hydrogen, a variation in electrical resistance of 7.2
orders of magnitude is seen. With drift compensation [2], the low-level linear
sensitivity indicates the ability to detect hydrogen at 200 ppt [7]. Longer nanotube
arrays show less sensitivity with significantly longer response/recovery times [62].
The hydrogen sensors have been successfully used in clinical trials as an indicator of
neonatal necrotizing enterocolitis, measuring transcutaneous hydrogen concentra-
tions of a few ppm from an un-heated skin temperature (�37�C) sensor [7]. Within
the auspices of a hydrogen economy, the described sensors would be of great
utility in monitoring hydrogen concentrations, including the presence of unwanted
hydrogen leaks.
TiO2 nanotube arrays are essentially all surface and no bulk. High hydrogen
sensitivity in the absence of oxygen indicates that direct chemisorption of hydrogen
on the nanotubes is the dominant mechanism leading to the tremendous resistance
reduction in the nanotubes [6, 7], while the presence of oxygen facilitates the
removal of the chemisorbed hydrogen. Hydrogen activation appears to occur on
the walls of the undoped nanotubes at highly active surface states. The dissociated
hydrogen species form OH groups with the surface oxygen accompanied by
electron transfer to the titania conduction band and formation of an electron rich
Fig. 6 Room temperature
resistance variation of TiO2
nanotube-array sample, 1 mmlength, 30 nm pore size,
13 nm wall thickness,
crystallized by a 480�Canneal. The sample is
alternately exposed to air and
1,000 ppm hydrogen in
nitrogen showing a variation
in electrical resistance of 8.7
orders of magnitude
(50,000,000,000%) [6, 7]
Introduction xix
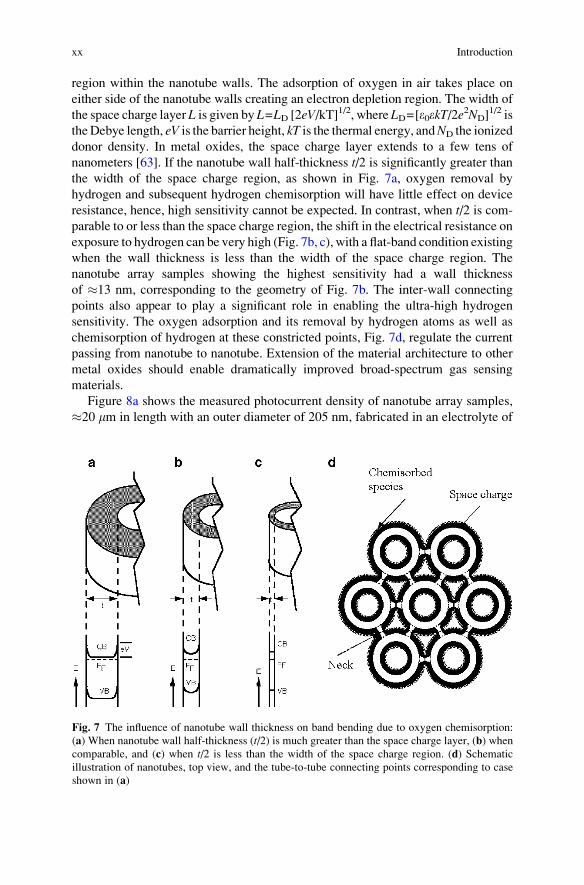
region within the nanotube walls. The adsorption of oxygen in air takes place on
either side of the nanotube walls creating an electron depletion region. The width of
the space charge layer L is given by L=LD [2eV/kT]1/2, where LD=[e0ekT/2e2ND]
1/2 is
theDebye length, eV is the barrier height, kT is the thermal energy, andND the ionized
donor density. In metal oxides, the space charge layer extends to a few tens of
nanometers [63]. If the nanotube wall half-thickness t/2 is significantly greater than
the width of the space charge region, as shown in Fig. 7a, oxygen removal by
hydrogen and subsequent hydrogen chemisorption will have little effect on device
resistance, hence, high sensitivity cannot be expected. In contrast, when t/2 is com-
parable to or less than the space charge region, the shift in the electrical resistance on
exposure to hydrogen can be very high (Fig. 7b, c), with a flat-band condition existing
when the wall thickness is less than the width of the space charge region. The
nanotube array samples showing the highest sensitivity had a wall thickness
of �13 nm, corresponding to the geometry of Fig. 7b. The inter-wall connecting
points also appear to play a significant role in enabling the ultra-high hydrogen
sensitivity. The oxygen adsorption and its removal by hydrogen atoms as well as
chemisorption of hydrogen at these constricted points, Fig. 7d, regulate the current
passing from nanotube to nanotube. Extension of the material architecture to other
metal oxides should enable dramatically improved broad-spectrum gas sensing
materials.
Figure 8a shows the measured photocurrent density of nanotube array samples,
�20 mm in length with an outer diameter of 205 nm, fabricated in an electrolyte of
Fig. 7 The influence of nanotube wall thickness on band bending due to oxygen chemisorption:
(a) When nanotube wall half-thickness (t/2) is much greater than the space charge layer, (b) when
comparable, and (c) when t/2 is less than the width of the space charge region. (d) Schematic
illustration of nanotubes, top view, and the tube-to-tube connecting points corresponding to case
shown in (a)
xx Introduction
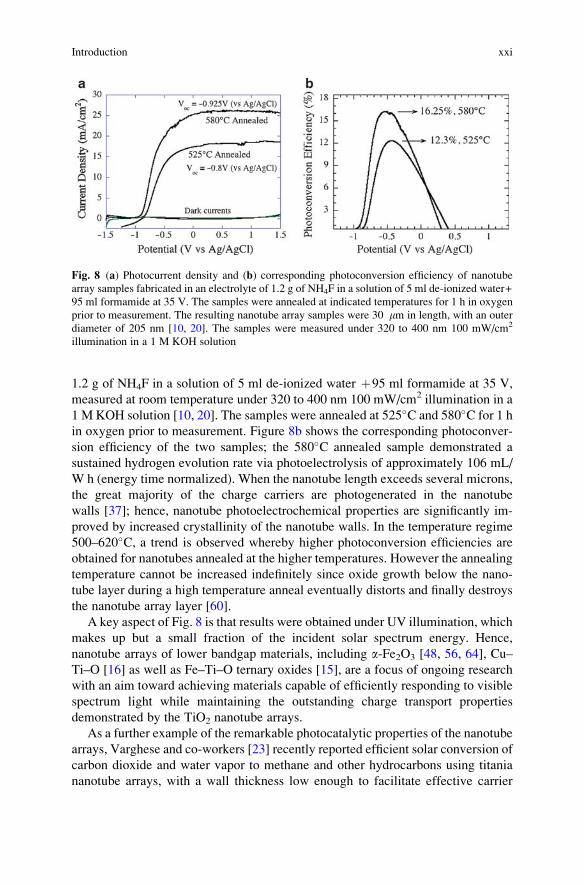
1.2 g of NH4F in a solution of 5 ml de-ionized water þ95 ml formamide at 35 V,
measured at room temperature under 320 to 400 nm 100 mW/cm2 illumination in a
1 M KOH solution [10, 20]. The samples were annealed at 525�C and 580�C for 1 h
in oxygen prior to measurement. Figure 8b shows the corresponding photoconver-
sion efficiency of the two samples; the 580�C annealed sample demonstrated a
sustained hydrogen evolution rate via photoelectrolysis of approximately 106 mL/
W h (energy time normalized). When the nanotube length exceeds several microns,
the great majority of the charge carriers are photogenerated in the nanotube
walls [37]; hence, nanotube photoelectrochemical properties are significantly im-
proved by increased crystallinity of the nanotube walls. In the temperature regime
500–620�C, a trend is observed whereby higher photoconversion efficiencies are
obtained for nanotubes annealed at the higher temperatures. However the annealing
temperature cannot be increased indefinitely since oxide growth below the nano-
tube layer during a high temperature anneal eventually distorts and finally destroys
the nanotube array layer [60].
A key aspect of Fig. 8 is that results were obtained under UV illumination, which
makes up but a small fraction of the incident solar spectrum energy. Hence,
nanotube arrays of lower bandgap materials, including a-Fe2O3 [48, 56, 64], Cu–
Ti–O [16] as well as Fe–Ti–O ternary oxides [15], are a focus of ongoing research
with an aim toward achieving materials capable of efficiently responding to visible
spectrum light while maintaining the outstanding charge transport properties
demonstrated by the TiO2 nanotube arrays.
As a further example of the remarkable photocatalytic properties of the nanotube
arrays, Varghese and co-workers [23] recently reported efficient solar conversion of
carbon dioxide and water vapor to methane and other hydrocarbons using titania
nanotube arrays, with a wall thickness low enough to facilitate effective carrier
Fig. 8 (a) Photocurrent density and (b) corresponding photoconversion efficiency of nanotube
array samples fabricated in an electrolyte of 1.2 g of NH4F in a solution of 5 ml de-ionized water+
95 ml formamide at 35 V. The samples were annealed at indicated temperatures for 1 h in oxygen
prior to measurement. The resulting nanotube array samples were 30 mm in length, with an outer
diameter of 205 nm [10, 20]. The samples were measured under 320 to 400 nm 100 mW/cm2
illumination in a 1 M KOH solution
Introduction xxi
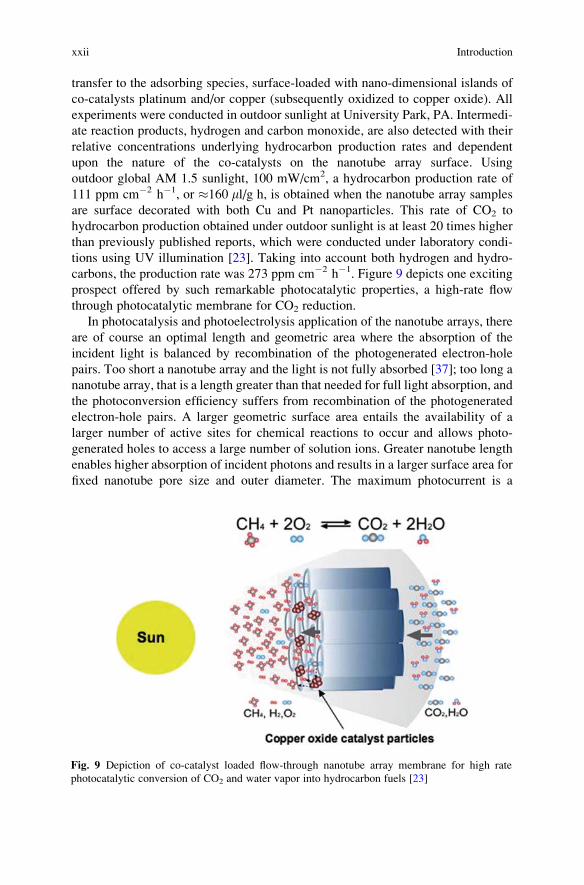
transfer to the adsorbing species, surface-loaded with nano-dimensional islands of
co-catalysts platinum and/or copper (subsequently oxidized to copper oxide). All
experiments were conducted in outdoor sunlight at University Park, PA. Intermedi-
ate reaction products, hydrogen and carbon monoxide, are also detected with their
relative concentrations underlying hydrocarbon production rates and dependent
upon the nature of the co-catalysts on the nanotube array surface. Using
outdoor global AM 1.5 sunlight, 100 mW/cm2, a hydrocarbon production rate of
111 ppm cm�2 h�1, or �160 ml/g h, is obtained when the nanotube array samples
are surface decorated with both Cu and Pt nanoparticles. This rate of CO2 to
hydrocarbon production obtained under outdoor sunlight is at least 20 times higher
than previously published reports, which were conducted under laboratory condi-
tions using UV illumination [23]. Taking into account both hydrogen and hydro-
carbons, the production rate was 273 ppm cm�2 h�1. Figure 9 depicts one exciting
prospect offered by such remarkable photocatalytic properties, a high-rate flow
through photocatalytic membrane for CO2 reduction.
In photocatalysis and photoelectrolysis application of the nanotube arrays, there
are of course an optimal length and geometric area where the absorption of the
incident light is balanced by recombination of the photogenerated electron-hole
pairs. Too short a nanotube array and the light is not fully absorbed [37]; too long a
nanotube array, that is a length greater than that needed for full light absorption, and
the photoconversion efficiency suffers from recombination of the photogenerated
electron-hole pairs. A larger geometric surface area entails the availability of a
larger number of active sites for chemical reactions to occur and allows photo-
generated holes to access a large number of solution ions. Greater nanotube length
enables higher absorption of incident photons and results in a larger surface area for
fixed nanotube pore size and outer diameter. The maximum photocurrent is a
Fig. 9 Depiction of co-catalyst loaded flow-through nanotube array membrane for high rate
photocatalytic conversion of CO2 and water vapor into hydrocarbon fuels [23]
xxii Introduction
measure of the generation, and subsequent collection of charge carriers and corre-
lates well with the surface area of the nanotubes [10]. In contrast, the photoconver-
sion efficiency also depends on the separation processes of the photogenerated
electron-hole pairs, that is its recombination characteristics, which for the nanotube
arrays are a complex function of the temperature and duration of crystallization,
the wall-thickness of the nanotubes, barrier-layer thickness, and the incorporation
(if any) of dopants from the electrolyte during anodization.
While back-side illuminated dye sensitized solar cells can be readily constructed
using nanotube arrays easily fabricated from thick-film foil Ti samples [65, 66] the
geometry is not optimal, with the photoconversion efficiency of such devices
significantly decreased due to unwanted reflection of light from the counter elec-
trode and unwanted light absorption by the electrolyte. Gratzel and co-workers
report [67] an absolute difference in dye-sensitized solar cell photoconversion
efficiency between back-side illumination (through the cathode), and front-side
illumination (through the photoanode) of 4%. Hence, it is of significant interest
that Shankar and co-workers [10] reported a back-side illuminated dye sensitized
solar cell comprised of a 20 mm long nanotube array, on a Ti foil substrate,
with 6.89% photoconversion efficiency under (NREL calibrated) AM 1.5 illumina-
tion (N719 dye, Jsc¼12.72 mA/cm2, Voc¼0.82 V, fill factor¼0.663). Frank and
co-workers [39] used intensity-modulated photocurrent and photovoltage spectros-
copy of nanotube array films on Ti substrates to determine that the electron
recombination time constants of nanotube array films were an order of magnitude
greater than those of nanoparticle films of equal thickness, with calculations
indicating that the charge-collection efficiency of the nanotube array films is 25%
larger than that of nanoparticulate films, implying that nanotube arrays can be made
much thicker than the nanoparticulate films for a given recombination loss allowing
for a higher light-harvesting efficiency [39].
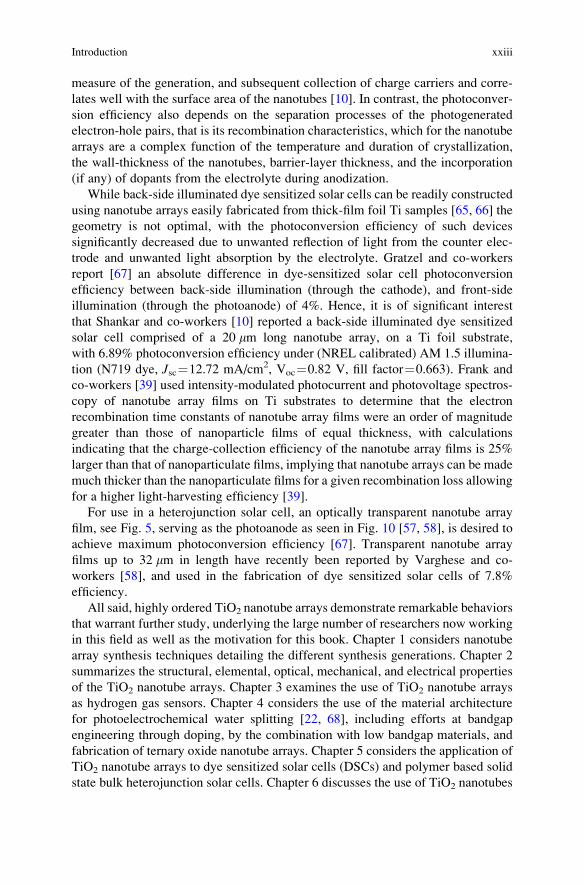
For use in a heterojunction solar cell, an optically transparent nanotube array
film, see Fig. 5, serving as the photoanode as seen in Fig. 10 [57, 58], is desired to
achieve maximum photoconversion efficiency [67]. Transparent nanotube array
films up to 32 mm in length have recently been reported by Varghese and co-
workers [58], and used in the fabrication of dye sensitized solar cells of 7.8%
efficiency.
All said, highly ordered TiO2 nanotube arrays demonstrate remarkable behaviors
that warrant further study, underlying the large number of researchers now working
in this field as well as the motivation for this book. Chapter 1 considers nanotube
array synthesis techniques detailing the different synthesis generations. Chapter 2
summarizes the structural, elemental, optical, mechanical, and electrical properties
of the TiO2 nanotube arrays. Chapter 3 examines the use of TiO2 nanotube arrays
as hydrogen gas sensors. Chapter 4 considers the use of the material architecture
for photoelectrochemical water splitting [22, 68], including efforts at bandgap
engineering through doping, by the combination with low bandgap materials, and
fabrication of ternary oxide nanotube arrays. Chapter 5 considers the application of
TiO2 nanotube arrays to dye sensitized solar cells (DSCs) and polymer based solid
state bulk heterojunction solar cells. Chapter 6 discusses the use of TiO2 nanotubes
Introduction xxiii
in biological applications, including their use as a base for biosensors, drug
eluting surfaces, osseointegration, biotemplating, enhanced blood clotting, and as
biofiltration membranes.
References
1. Varghese OK, Gong D, Paulose M, Ong KG, Grimes CA (2003) Hydrogen sensing using
titania nanotubes. Sens Actuators B 93:338–344
2. Varghese OK, Mor GK, Grimes CA, Paulose M, Mukherjee N (2004) A titania nanotube-array
room-temperature sensor for selective detection of hydrogen at low concentrations. J Nanosci
Nanotechnol 4:733–737
3. VargheseOK,GongD, PauloseM,OngKG,DickeyEC,GrimesCA (2003) Extreme changes in
the electrical resistance of titania nanotubes with hydrogen exposure. Adv Mater 15:624–662
4. Mor GK, Varghese OK, Paulose M, Ong KG, Grimes CA (2006) Fabrication of hydrogen
sensors with transparent titanium oxide nanotube-array thin films as sensing elements. Thin
Solid Films 496:42–48
5. Varghese OK, Grimes CA (2003) Metal oxide nanoarchitectures for environmental sensing.
J Nanosci Nanotechnol 3:277–293
6. Paulose M, Varghese OK, Mor GK, Grimes CA, Ong KG (2006) Unprecedented ultra-high
hydrogen gas sensitivity in undoped titania nanotubes. Nanotechnol 17:398–402
7. Varghese OK, Yang X, Kendig J, Paulose M, Zeng K, Palmer C, Ong KG, Grimes CA (2006)
A transcutaneous hydrogen sensor: from design to application. Sensor Lett 4:120–128
8. Mor GK, Varghese OK, Paulose M, Grimes CA (2003) A self-cleaning room temperature
titania-nanotube hydrogen gas sensor. Sens Lett 1:42–46
Fig. 10 Integration of transparent nanotube array architecture into (front-side illuminated)
dye-sensitized solar cells
xxiv Introduction
9. Mor GK, Carvalho MA, Varghese OK, Pishko MV, Grimes CA (2004) A room temperature
TiO2 nanotube hydrogen sensor able to self-clean photoactively from environmental contami-
nation. J Mater Res 19:628–634
10. Shankar K, Mor GK, Prakasam HE, Yoriya S, Paulose M, Varghese OK, Grimes CA (2007)
Highly-ordered TiO2 nanotube arrays up to 220 mm in length: use in water photoelectrolysis
and dye-sensitized solar cells. Nanotechnol 18:065707
11. Mor GK, Shankar K, Paulose M, Varghese OK, Grimes CA (2006) Use of highly-ordered
TiO2 nanotube arrays in dye-sensitized solar cells. Nano Lett 6:215–218
12. Mor GK, Shankar K, Paulose M, Varghese OK, Grimes CA (2007) High efficiency double
heterojunction polymer photovoltaic cells using highly ordered TiO2 nanotube arrays. Appl
Phys Lett 91:152111
13. Shankar K, Mor GK, Paulose M, Varghese OK, Grimes CA (2008) Effect of device geometry
on the performance of TiO2 nanotube array-organic semiconductor double heterojunction
solar cells. J Non-Cryst Solids 354:2767–2771
14. Shankar K, Mor GK, Prakasam HE, Varghese OK, Grimes CA (2007) Self-assembled hybrid
polymer-TiO2 nanotube array heterojunction solar cells. Langmuir 23:12445–12449
15. Mor GK, Prakasam HE, Varghese OK, Shankar K, Grimes CA (2007) Vertically oriented
Ti–Fe–O nanotube array films: toward a useful material architecture for solar spectrum
water photoelectrolysis. Nano Lett 7:2356–2364
16. Mor GK, Varghese OK,Wilke RHT, Sharma S, Shankar K, Latempa TJ, Choi KS, Grimes CA
(2008) p-Type Cu–Ti–O nanotube arrays and their use in self-biased heterojunction photo-
electrochemical diodes for hydrogen generation. Nano Lett 8:1906–1911
17. Chen SG, Paulose M, Ruan C, Mor GK, Varghese OK, Grimes CA (2006) Electrochemically
synthesized CdS nanoparticle-modified TiO2 nanotube-array photoelectrodes: preparation,
characterization, and application to photoelectrochemical cells. J Photochem Photobiol A
177:177–184
18. Seabold JA, Shankar K, Wilke RHT, Paulose M, Varghese OK, Grimes CA, Choi KS (2008)
Photoelectrochemical properties of heterojunction CdTe/TiO2 electrodes constructed using
highly ordered TiO2 nanotube arrays. Chem Mater 20:5266–5273
19. Varghese OK, Paulose M, Shankar K, Mor GK, Grimes CA (2005) Water-photolysis properties
of micron-length highly-ordered titania nanotube-arrays. J Nanosci Nanotechnol 5:1158–1165
20. Paulose M, Shankar K, Yoriya S, Prakasam HE, Varghese OK, Mor GK, Latempa TA,
Fitzgerald A, Grimes CA (2006) Anodic growth of highly ordered TiO2 nanotube arrays to
134 mm in length. J Phys Chem B 110:16179–16184
21. Mor GK, Shankar K, Paulose M, Varghese OK, Grimes CA (2005) Enhanced photocleavage
of water using titania nanotube arrays. Nano Lett 5:191–195
22. Grimes CA, Varghese OK, Ranjan S (2008) Light, water, hydrogen: the solar generation of
hydrogen by water photoelectrolysis. Springer, New York
23. Varghese OK, Paulose M, LaTempa TJ, Grimes CA (2009) High-rate solar photocatalytic
conversion of CO2 and water vapor to hydrocarbon fuels. Nano Lett 9:731–737
24. Fabregat-Santiago F, Barea EM, Bisquert J, Mor GK, Shankar K, Grimes CA (2008) High
carrier density and capacitance in TiO2 nanotube arrays induced by electrochemical doping.
J Am Chem Soc 130:11312–11316
25. Popat KC, Eltgroth M, LaTempa TJ, Grimes CA, Desai TA (2007) Titania nanotubes: a novel
platform for drug-eluting coatings for medical implants? Small 11:1878–1881
26. Popat KC, Leoni L, Grimes CA, Desai TA (2007) Influence of engineered titania nanotubular
surfaces on bone cells. Biomaterials 28:3188–3197
27. Peng L, Mendelsohn AD, LaTempa TJ, Yoriya S, Grimes CA, Desai TA (2009) Long-term
small molecule and protein elution from TiO2 nanotubes. Nano Lett 9:1932–1936
28. Liu S, Chen A (2005) Coadsorption of horseradish peroxidase with thionine on TiO2 nano-
tubes for biosensing. Langmuir 21:8409–8413
29. Xie Y, Zhoua L, Huang H (2007) Bioelectrocatalytic application of titania nanotube array for
molecule detection. Biosens Bioelectron 22:2812–2818
References xxv
30. Roy SC, Paulose M, Grimes CA (2007) The effect of TiO2 nanotubes in the enhancement of
blood clotting for the control of hemorrhage. Biomater 28:4667–4672
31. Popat KC, Eltgroth M, LaTempa TJ, Grimes CA, Desai TA (2007) Decreased Staphylococcus
epidermis adhesion and increased osteoblast functionality on antibiotic-loaded titania
nanotubes. Biomater 28:4880–4888
32. Gong D, Grimes CA, Varghese OK, Hu W, Singh RS, Chen Z, Dickey EC (2001) Titanium
oxide nanotube arrays prepared by anodic oxidation. J Mater Res 16:3331–3334
33. Cai Q, Paulose M, Varghese OK, Grimes CA (2005) The effect of electrolyte composition on
the fabrication of self-organized titanium oxide nanotube arrays by anodic oxidation. J Mater
Res 20:230–236
34. Prakasam HE, Shankar K, Paulose M, Grimes CA (2007) A new benchmark for TiO2
nanotube array growth by anodization. J Phys Chem C 111:7235–7241
35. Albu SP, Ghicov A, Macak JM, Schmuki P (2007) 250 mm long anodic TiO2 nanotubes with
hexagonal self-ordering. Physica Status Solidi 1:R65–R67
36. Paulose M, Prakasam HE, Varghese OK, Peng L, Popat KC, Mor GK, Desai TA, Grimes CA
(2007) TiO2 nanotube arrays of 1000 mm in length by anodization of titanium foil: phenol red
diffusion. J Phys Chem C 111:14992–14997
37. Ong KG, Varghese OK, Mor GK, Grimes CA (2005) Numerical simulation of light propaga-
tion through highly-ordered titania nanotube arrays: dimension optimization for improved
photoabsorption. J Nanosci Nanotech 5:1801–1808
38. Ong KG, Varghese OK, Mor GK, Shankar K, Grimes CA (2007) Application of finite
difference time domain to dye-sensitized solar cells: the effect of nanotube-array negative
electrode dimensions on light absorption. Solar Energy Mater & Solar Cells 91:250–257
39. Zhu K, Neale NR, Miedaner A, Frank AJ (2006) Enhanced charge-collection efficiencies and
light scattering in dye-sensitized solar cells using oriented TiO2 nanotubes arrays. Nano Lett
7:69–74
40. Allam NK, Grimes CA (2008) Effect of cathode material on the morphology and photoelec-
trochemical properties of vertically oriented TiO2 nanotube arrays. Sol Energy Mater sol cells
92:1468–1475
41. Yoriya S, Mor GK, Sharma S, Grimes CA (2008) Synthesis of ordered arrays of discrete,
partially crystalline titania nanotubes by Ti anodization using diethylene glycol electrolytes.
J Mater Chem 18:3332–3336
42. Shankar K, Mor GK, Fitzgerald A, Grimes CA (2007) Cation effect on the electrochemical
formation of very high aspect ratio TiO2 nanotube arrays in formamide–water mixtures.
J Phys Chem C 111:21–26
43. Yoriya S, Paulose M, Varghese OK, Mor GK, Grimes CA (2007) Fabrication of vertically
oriented TiO2 nanotube arrays using dimethyl sulfoxide electrolytes. J Phys Chem C
111:13770–13776
44. Paulose M, Peng L, Popat KC, Varghese OK, LaTempa TJ, Bao N, Desai TA, Grimes CA
(2008) Fabrication of mechanically robust, large area, polycrystalline nanotubular/porous
TiO2 membranes. J Membrane Sci 319:199–205
45. Allam NK, Grimes CA (2007) Formation of vertically oriented TiO2 nanotube arrays using
a fluoride free HCl aqueous electrolyte. J Phys Chem C 111:13028–13032
46. Chen X, Schriver M, Suen T, Mao SS (2007) Fabrication of 10 nm diameter TiO2 nanotube
arrays by titanium anodization. Thin Solid Films 515:8511–8514
47. Allam NK, Shankar K, Grimes CA (2008) Photoelectrochemical and water photoelectrolysis
properties of ordered TiO2 nanotubes fabricated by Ti anodization in fluoride-free HCl
electrolytes. J Mat Chem 18:2341–2348
48. Shankar K, Basham JI, Allam NK, Varghese OK, Mor GK, Feng X, Paulose M, Seabold JA,
Choi KS, Grimes CA (2009). A review of recent advances in the use of TiO2 nanotube and
nanowire arrays for oxidative photoelectrochemistry. J. Phys Chem C 113:6327–6359 (in press)
49. Grimes CA (2007) Synthesis and application of highly-ordered arrays of TiO2 Nanotubes.
J Mater Chem 17:1451–1457
xxvi Introduction
50. Mor GK, Varghese OK, Paulose M, Shankar K, Grimes CA (2006) A review on highly
ordered, vertically oriented TiO2 nanotube arrays: fabrication, material properties, and solar
energy applications. Sol Energy Mater Sol Cells 90:2011–2075
51. Woo LeeW, Roland Scholz R, Ulrich Go U (2008) A continuous process for structurally well-
defined Al2O3 nanotubes based on pulse anodization of aluminum. Nano Lett 8:2155–2160
52. Lee WJ, Smyrl WH (2005) Zirconium oxide nanotubes synthesized via direct electrochemical
anodization. Electrochem Solid-State Lett 8:B7–B9
53. Shin Y, Lee S (2009) A freestanding membrane of highly ordered anodic ZrO2 nanotube
arrays. Nanotechnology 20: Art. No. 105301
54. Allam NK, Feng X, Grimes CA (2008) Self-assembled fabrication of vertically oriented
Ta2O5 nanotube arrays, and membranes thereof, by one-step tantalum anodization. Chem
Mater 20:6477–6481
55. Ruckh T, Porter JR, Allam NK, Feng X, Grimes CA, Popat KC (2009) Nanostructured tantala
as a template for enhanced osseointegration. Nanotechnology 20:045102
56. LaTempa TJ, Grimes CA (2009) Hematite nanotube arrays by potentiostatic anodization of Ti
Foil: photoelectrochemical properties. J Phys Chem C 113:mmm-mmm (in press)
57. Mor GK, Varghese OK, Paulose M, Grimes CA (2005) Transparent highly-ordered TiO2
nanotube-arrays via anodization of titanium thin films. Adv Funct Mater 15:1291–1296
58. Maggie Paulose, Oomman K. Varghese and Craig A. Grimes. Transparent films of vertically
aligned long titania nanotube arrays on TCO glass for highly efficient dye sensitized solar
cells. In Press, Nat Nanotechnol
59. Mor GK, Varghese OK, Paulose M, Mukherjee N, Grimes CA (2003) Fabrication of tapered,
conical-shaped titania nanotubes. J Mater Res 18:2588–2593
60. Varghese OK, Gong D, Paulose M, Ong KG, Grimes CA, Dickey EC (2003) Crystallization
and high-temperature structural stability of titanium oxide nanotube arrays. J Mater Res
18:156–165
61. Allam NK, Shankar K, Grimes CA (2008) A general method for the anodic formation of
crystalline metal oxide nanotube arrays without the use of thermal annealing. Adv Mater
20:3942–3946
62. Yoriya S, Prakasam HE, Varghese OK, Shankar K, Paulose M, Mor GK, Latempa TJ, Grimes
CA (2006) Initial studies on the hydrogen gas sensing properties of highly-ordered high aspect
ratio TiO2 nanotube-arrays 20 mm to 222 mm in length. Sensor Lett 4:334–339
63. Morimoto T, Nagao M, Tokuda F (1969) Relation between amounts of chemisorbed and
physisorbed water on metal oxides. J Phys Chem 73:243–248
64. Prakasam HE, Paulose M, Varghese OK, Mor GK, Grimes CA (2006) Synthesis and photo-
electrochemical properties of nanoporous iron (III) oxide by potentiostatic anodization.
Nanotechnology 17:4285–4291
65. Paulose M, Shankar K, Varghese OK, Mor GK, Hardin B, Grimes CA (2006) Backside
illuminated dye-sensitized solar cells based on titania nanotube array electrodes. Nanotech-
nology 17:1446–1448
66. Paulose M, Shankar K, Varghese OK, Mor GK, Grimes CA (2006) Application of highly-
ordered TiO2 nanotube-arrays in dye-sensitized solar cells. J Physics D 39:2498–2503
67. Ito S, Ha NC, Rothenberger G, Liska P, Comte P, Zakeeruddin SM, Pechy P, Nazeeruddin
MK, Gratzel M (2006) High-efficiency (7.2%) flexible dye-sensitized solar cells with Ti-metal
substrate for nanocrystalline-TiO2 photoanode. Chem Commun 38:4004–4006
68. Fujishima A, Honda K (1972) Electrochemical photolysis of water at a semiconductor
electrode. Nature 238:37–38
References xxvii
Chapter 1
Fabrication of TiO2 Nanotube Arrays by
Electrochemical Anodization: Four Synthesis
Generations
1.1 Introduction
One-dimensional (1-D) nanowire and nanotube systems with high surface-
to-volume ratios have been found to possess significant, useful, and unique proper-
ties. The synthesis of highly ordered 1-D materials using localized chemical disso-
lution with controlled, field-assisted oxidation and dissolution reactions is
particularly noteworthy for it permits achievement of a precisely ordered, nanoscale
self-assembly. Comparative studies show that ordered arrays of TiO2 outperform
colloidal TiO2 for photocatalytic applications [1–5], sensing [6–9], photoelectroly-
sis [10–16], polymer-based bulk heterojunction photovoltaics [17–19], dye-sensi-
tized solar cells [20–26], biofluids filtration, drug delivery and other biomedical
applications [27–30]. Initial investigations indicate that they also may be useful for
energy storage devices such as Li-ion batteries and supercapacitors; these applica-
tions of TiO2 nanotube arrays are among those discussed in the subsequent chapters.
TiO2 nanotubes and arrays thereof have been produced by a number of methods.
These include: using a template of nanoporous alumina [31–34], sol-gel transcrip-
tion processes using organo-gelator templates [35, 36], seeded growth mechanisms
[37], and hydrothermal techniques [38–40]. None of these methods, however, offer
superior control over the nanotube dimensions than does the anodization of titani-
um in a fluoride-based electrolyte [41–48].
In 1999, Zwilling and co-workers achieved self-organized porous TiO2 by
anodizing a Ti-based alloy in an acidic, fluoride-based electrolyte [49, 50]. In
2001, Gong and co-workers fabricated self-organized, highly uniform TiO2 nano-
tube arrays by anodizing Ti in an aqueous dilute HF electrolyte [41, 42]. Maximum
nanotube lengths in this first synthesis generation were approximately 500 nm. In
subsequent work, the second-generation, the nanotube array length was increased to
approximately 7mm by proper control of the anodization electrolyte pH thereby
reducing the chemical dissolution of TiO2 during anodization [43, 46]; the pH
should be high but remain acidic. In later work, the third-generation, TiO2 nanotube
arrays with lengths of up to approximately 1000mm were achieved using
C.A. Grimes and G.K. Mor, TiO2 Nanotube Arrays,DOI 10.1007/978-1-4419-0068-5_1, # Springer Science+Business Media, LLC 2009
1
a non-aqueous, polar organic electrolyte such as formamide, dimethylsulfoxide,
ethylene glycol or diethylene glycol [44, 51–54]. We suggest the fourth synthesis
generation is that of non-fluoride-based anodization chemistries.
In this chapter, we review the contribution of different research groups to the
fabrication of the titania nanotube arrays, and we discuss a mechanistic growth
model for nanotube array formation.
1.1.1 The Electrochemical Anodization Process
Anodization is an electrolytic process that creates a protective or decorative oxide
film over a metallic surface. Anodization typically increases both the thickness and
density of the oxide layer that forms on any metal surface exposed to the earth’s
atmosphere. To accomplish it, the conducting piece undergoing anodization is
connected to the positive terminal of a dc power supply and placed in an electrolytic
bath where it serves as the anode. The cathode is commonly a plate or rod of
platinum, although materials such as carbon are sometimes used. When power is
applied electrons are forced from the electrolyte to the positive anode. The process
leaves surface metal atoms exposed to oxygen ions within the electrolyte. The
atoms react and become an in situ integral part of the oxide layer. The electrons
travel through the power source and return to the cathode where, if an appropriate
electrolyte pH is present, they react with hydrogen ions and the combination
bubbles off as hydrogen gas.
Since the metal oxide partially dissolves in any electrolyte, it is necessary to use
only those electrolytes for which the oxide forms more rapidly than it dissolves. The
electrolyte composition is also the primary determinant of whether the oxide film is
porous or if it forms a barrier layer. Oxide barrier layers grow in those neutral or
slightly alkaline solutions in which titanium dioxide is largely insoluble. Porous
oxide layers grow in acidic electrolytes with fluoride or chloride ions in which
oxide forms and then rapidly dissolves. The acid cations also affect the resulting
nanotube array structures.
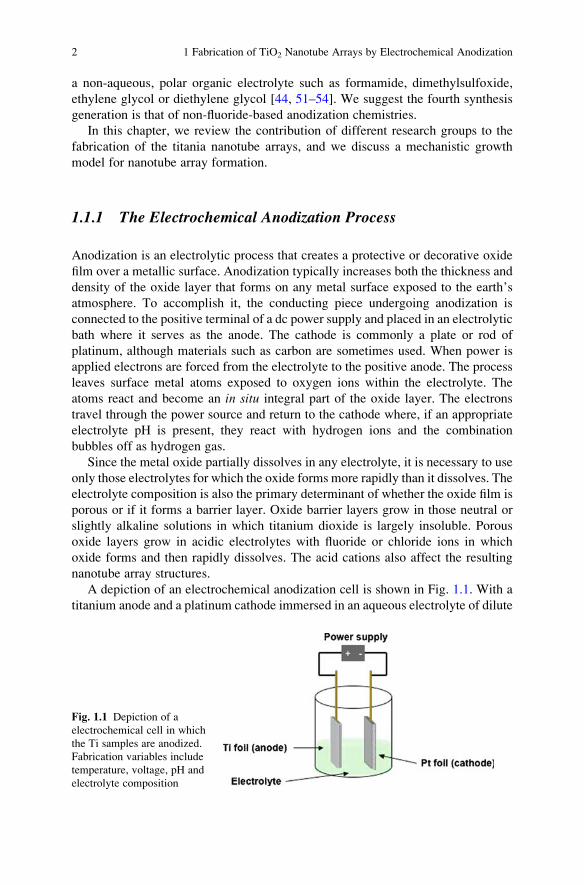
A depiction of an electrochemical anodization cell is shown in Fig. 1.1. With a
titanium anode and a platinum cathode immersed in an aqueous electrolyte of dilute
Fig. 1.1 Depiction of a
electrochemical cell in which
the Ti samples are anodized.
Fabrication variables include
temperature, voltage, pH and
electrolyte composition
2 1 Fabrication of TiO2 Nanotube Arrays by Electrochemical Anodization
acid to which a small dc voltage is applied the surface layer is sufficiently resistive
to prevent current flow. Increasing the applied voltage produces no additional
current flow until a threshold level is reached where the electric field intensity
within the barrier is sufficient to force oxygen ions to diffuse across it, producing an
ionic current. These oxygen ions react with the metal and increase the thickness
and/or density of the oxide barrier. This process of high-field ionic conduction is
central to anodization. Of course, the same process liberates hydrogen gas from the
cathode. Since the electric resistance of the layer increases in proportion to its
thickness and since the rate of oxide growth is proportional to the current density,
the thinner portions of the layer carry more current than the thicker ones. Hence,
a thin section grows faster than a thick one, creating an even more uniform layer. As
the layer thickens the applied voltage necessary to maintain a constant current
increases. The process continues until, for each bath composition and temperature,
a maximum applied voltage is reached above which other, non-desired reactions
become manifest, for example: oxygen evolution, solute oxidation, or sparking due
to electron avalanche through the oxide.
Fabrication of TiO2 nanotube arrays via anodic oxidation of Ti was first reported
in 2001 [41]. Later studies focused on precise control and extension of the nanotube
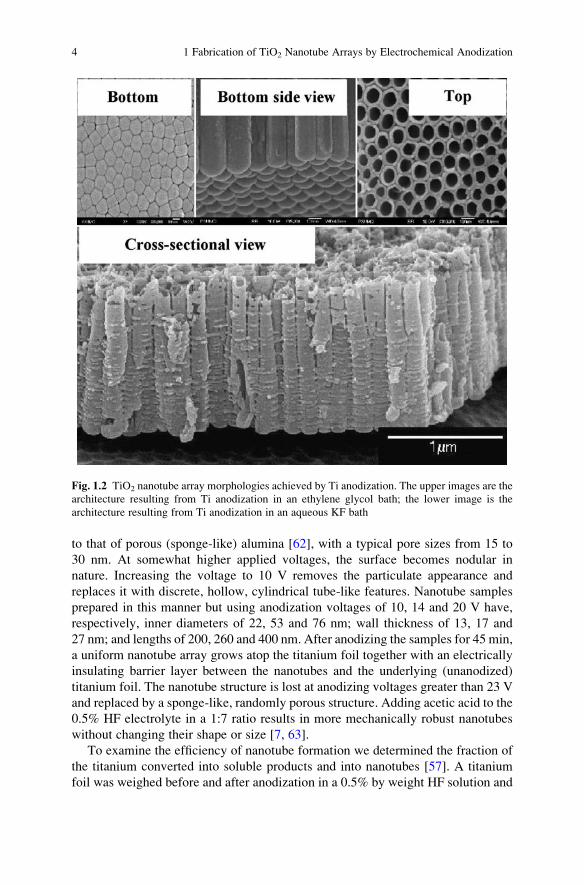
morphology [42], length and pore size [43], and wall thickness [55]. Illustrative
TiO2 nanotube array morphologies, as grown by Ti anodization, are shown in
Fig. 1.2; these vertically oriented nanotubes are firmly attached to the substrate
with an open top and a bottom closed by a barrier layer of metal oxide. The use
of different electrolytic solvents permits control of the architecture from well-
separated, stand-alone nanotubes to densely packed arrays. A typical nanotube’s
wall thickness ranges from 5 to 30 nm, the pore size from 20 to 350 nm, and the
length from 0.2 to 1000mm. The aspect ratio, defined as the nanotube length-
to-outer diameter ratio, can be controlled from about 10 to approximately 20,000
by selection of appropriate anodization variables.
1.2 Nanotube Array Synthesis Using Aqueous Electrolytes:
The First Generation
1.2.1 HF-Based Electrolytes
Anodization of titanium foil (note, the titanium sample does not have to be planar)
were conducted in a two-electrode electrochemical cell at a constant-applied
voltage and with a platinum foil cathode. Anodization experiments were conducted
at room temperature with magnetic stirring of electrolyte. Stirring reduces the
thickness of the double layer at the metal/electrolyte interface and ensures uniform
local current density and temperature over the surface of the Ti electrode [56]. Foils
were anodized in 0.5 wt% HF aqueous solution at anodizing voltages of: 3, 5, 10
and 20 V [41, 57–61]. At low anodization voltages, the film morphology is similar
1.2 Nanotube Array Synthesis Using Aqueous Electrolytes: The First Generation 3
to that of porous (sponge-like) alumina [62], with a typical pore sizes from 15 to
30 nm. At somewhat higher applied voltages, the surface becomes nodular in
nature. Increasing the voltage to 10 V removes the particulate appearance and
replaces it with discrete, hollow, cylindrical tube-like features. Nanotube samples
prepared in this manner but using anodization voltages of 10, 14 and 20 V have,
respectively, inner diameters of 22, 53 and 76 nm; wall thickness of 13, 17 and
27 nm; and lengths of 200, 260 and 400 nm. After anodizing the samples for 45 min,
a uniform nanotube array grows atop the titanium foil together with an electrically
insulating barrier layer between the nanotubes and the underlying (unanodized)
titanium foil. The nanotube structure is lost at anodizing voltages greater than 23 V
and replaced by a sponge-like, randomly porous structure. Adding acetic acid to the
0.5% HF electrolyte in a 1:7 ratio results in more mechanically robust nanotubes
without changing their shape or size [7, 63].
To examine the efficiency of nanotube formation we determined the fraction of
the titanium converted into soluble products and into nanotubes [57]. A titanium
foil was weighed before and after anodization in a 0.5% by weight HF solution and
Fig. 1.2 TiO2 nanotube array morphologies achieved by Ti anodization. The upper images are the
architecture resulting from Ti anodization in an ethylene glycol bath; the lower image is the
architecture resulting from Ti anodization in an aqueous KF bath
4 1 Fabrication of TiO2 Nanotube Arrays by Electrochemical Anodization
held at 20 V for 2 h; the average weight loss was 8.3�10�4g/cm2. Estimating a tube
length of 250 nm, pore size of 100 nm, and a wall thickness of 10 nm we calculated
the fraction of the area occupied by nanotubes to be 0.23. The TiO2 nanotube array
volume is 5.75�10�6cm3 per each cm2 of foil surface area, giving 2.208�10�5g
of TiO2 (density 3.84 g/cm3) formed in each cm2 surface area. Since oxygen
increases the mass of the barrier layer, if TiO2 formation was the only process
inherent to anodization a mass gain would be observed, not a mass loss. Analysis of
the used anodization solution via Inductively Coupled Plasma Mass Spectrometry
(ICMS) revealed that most of the mass loss is the loss of titanium as it is dissolved
into the solution; only about 2% of the titanium was converted into nanotubes and
the underlying barrier layer.
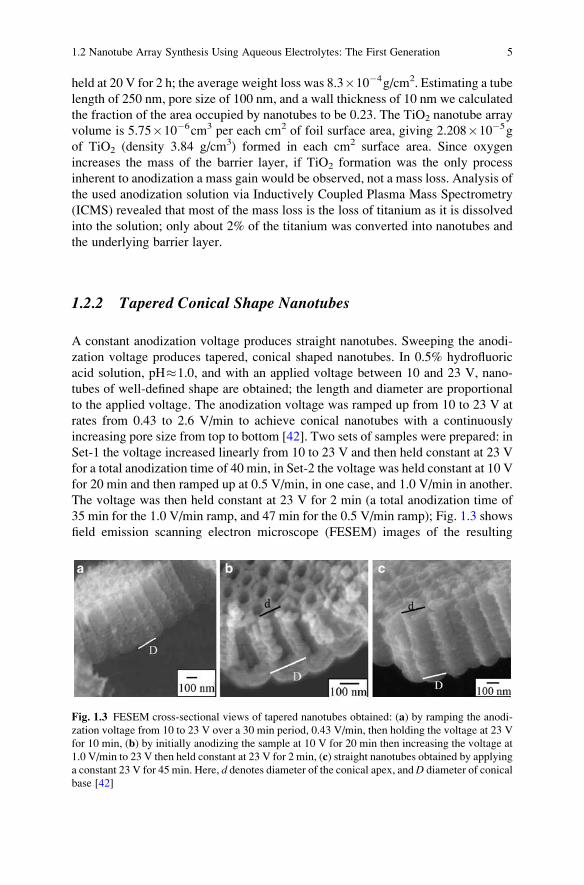
1.2.2 Tapered Conical Shape Nanotubes
A constant anodization voltage produces straight nanotubes. Sweeping the anodi-
zation voltage produces tapered, conical shaped nanotubes. In 0.5% hydrofluoric
acid solution, pH�1.0, and with an applied voltage between 10 and 23 V, nano-
tubes of well-defined shape are obtained; the length and diameter are proportional
to the applied voltage. The anodization voltage was ramped up from 10 to 23 V at
rates from 0.43 to 2.6 V/min to achieve conical nanotubes with a continuously
increasing pore size from top to bottom [42]. Two sets of samples were prepared: in
Set-1 the voltage increased linearly from 10 to 23 V and then held constant at 23 V
for a total anodization time of 40 min, in Set-2 the voltage was held constant at 10 V
for 20 min and then ramped up at 0.5 V/min, in one case, and 1.0 V/min in another.
The voltage was then held constant at 23 V for 2 min (a total anodization time of
35 min for the 1.0 V/min ramp, and 47 min for the 0.5 V/min ramp); Fig. 1.3 shows
field emission scanning electron microscope (FESEM) images of the resulting
Fig. 1.3 FESEM cross-sectional views of tapered nanotubes obtained: (a) by ramping the anodi-
zation voltage from 10 to 23 V over a 30 min period, 0.43 V/min, then holding the voltage at 23 V
for 10 min, (b) by initially anodizing the sample at 10 V for 20 min then increasing the voltage at
1.0 V/min to 23 V then held constant at 23 V for 2 min, (c) straight nanotubes obtained by applying
a constant 23 V for 45 min. Here, d denotes diameter of the conical apex, andD diameter of conical
base [42]
1.2 Nanotube Array Synthesis Using Aqueous Electrolytes: The First Generation 5