Embed Size (px)
Citation preview

Graphite-API DocumentationRelease 1.1.3
Bruno Renié
Oct 25, 2017


Contents
1 Why should I use it? 3
2 Contents 52.1 Installation . . . . . . . . . . . . . . . . . . . . . . . . . . . . . . . . . . . . . . . . . . . . . . . . 52.2 Configuration . . . . . . . . . . . . . . . . . . . . . . . . . . . . . . . . . . . . . . . . . . . . . . . 62.3 Deployment . . . . . . . . . . . . . . . . . . . . . . . . . . . . . . . . . . . . . . . . . . . . . . . 92.4 HTTP API . . . . . . . . . . . . . . . . . . . . . . . . . . . . . . . . . . . . . . . . . . . . . . . . 132.5 Built-in functions . . . . . . . . . . . . . . . . . . . . . . . . . . . . . . . . . . . . . . . . . . . . . 332.6 Storage finders . . . . . . . . . . . . . . . . . . . . . . . . . . . . . . . . . . . . . . . . . . . . . . 542.7 Custom functions . . . . . . . . . . . . . . . . . . . . . . . . . . . . . . . . . . . . . . . . . . . . . 562.8 Graphite-API releases . . . . . . . . . . . . . . . . . . . . . . . . . . . . . . . . . . . . . . . . . . 57
3 Indices and tables 61
Python Module Index 63
i

ii

Graphite-API Documentation, Release 1.1.3
Graphite-API is an alternative to Graphite-web, without any built-in dashboard. Its role is solely to fetch metrics froma time-series database (whisper, cyanite, etc.) and rendering graphs or JSON data out of these time series. It is meantto be consumed by any of the numerous Graphite dashboard applications.
Graphite-API is a fork of Graphite-web and couldn’t have existed without the fantastic prior work done by the Graphiteteam.
Contents 1

Graphite-API Documentation, Release 1.1.3
2 Contents

CHAPTER 1
Why should I use it?
Graphite-API offers a number of improvements over Graphite-web that you might find useful. Namely:
• The Graphite-API application is completely stateless and doesn’t need a SQL database. It only needs to talk toa time series database.
• Python 2 and 3 are both supported.
• The HTTP API accepts JSON data additionnaly to form data and querystring parameters.
• The application is extremely simple to install and configure.
• The architecture has been drastically simplified and there are many fewer moving parts than in graphite-web:
– No memcache integration – rendering is live.
– No support for the Pickle format when rendering.
– Plugin architecture for integrating with time series databases or adding more analysis functions.
• The codebase has been thoroughly updated with a focus on test coverage and code quality.
Note: Graphite-API does not provide any web/graphical interface. If you currently rely on the built-in Graphitecomposer, Graphite-API might not be for you. However, if you’re using a third-party dashboard interface, Graphite-API will do just fine.
3

Graphite-API Documentation, Release 1.1.3
4 Chapter 1. Why should I use it?

CHAPTER 2
Contents
Installation
Debian / Ubuntu: native package
If you run Debian 8 or Ubuntu 14.04 LTS, you can use one of the available packages which provides a self-containedbuild of graphite-api. Builds are available on the releases page.
Once installed, Graphite-api should be running as a service and available on port 8888. The package contains all theoptional dependencies.
Python package
Prerequisites
Installing Graphite-API requires:
• Python 2 (2.6 and above) or 3 (3.3 and above), with development files. On debian/ubuntu, you’ll want to installpython-dev.
• gcc. On debian/ubuntu, install build-essential.
• Cairo, including development files. On debian/ubuntu, install the libcairo2-dev package.
• libffi with development files, libffi-dev on debian/ubuntu.
• Pip, the Python package manager. On debian/ubuntu, install python-pip.
Global installation
To install Graphite-API globally on your system, run as root:
5

Graphite-API Documentation, Release 1.1.3
$ pip install graphite-api
Isolated installation (virtualenv)
If you want to isolate Graphite-API from the system-wide python environment, you can install it in a virtualenv.
$ virtualenv /usr/share/python/graphite$ /usr/share/python/graphite/bin/pip install graphite-api
Extra dependencies
When you install graphite-api, all the dependencies for running a Graphite server that uses Whisper as a storagebackend are installed. You can specify extra dependencies:
• For Sentry integration: pip install graphite-api[sentry].
• For Cyanite integration: pip install graphite-api[cyanite].
• For Cache support: pip install graphite-api[cache]. You’ll also need the driver for the type ofcaching you want to use (Redis, Memcache, etc.). See the Flask-Cache docs for supported cache types.
You can also combine several extra dependencies:
$ pip install graphite-api[sentry,cyanite]
Configuration
/etc/graphite-api.yaml
The configuration file for Graphite-API lives at /etc/graphite-api.yaml and uses the YAML format. Creatingthe configuration file is optional: if Graphite-API doesn’t find the file, sane defaults are used. They are described below.
Default values
search_index: /srv/graphite/indexfinders:
- graphite_api.finders.whisper.WhisperFinderfunctions:
- graphite_api.functions.SeriesFunctions- graphite_api.functions.PieFunctions
whisper:directories:- /srv/graphite/whisper
time_zone: <system timezone> or UTC
Config sections
Default sections
search_index
6 Chapter 2. Contents

Graphite-API Documentation, Release 1.1.3
The location of the search index used for searching metrics. Note that it needs to be a file that is writableby the Graphite-API process.
finders
A list of python paths to the storage finders you want to use when fetching metrics.
functions
A list of python paths to function definitions for transforming / analyzing time series data.
whisper
The configuration information for whisper. Only relevant when using WhisperFinder. Simply holds adirectories key listing all directories containing whisper data.
time_zone
The time zone to use when generating graphs. By default, Graphite-API tries to detect your systemtimezone. If detection fails it falls back to UTC. You can also manually override it if you want anothervalue than your system’s timezone.
Extra sections
carbon
Configuration information for reading data from carbon’s cache. Items:
hosts List of carbon-cache hosts, in the format hostname:port[:instance].
timeout Socket timeout for carbon connections, in seconds.
retry_delay Time to wait before trying to re-establish a failed carbon connection, in seconds.
hashing_keyfunc Python path to a hashing function for metrics. If you use Carbon with consistent hash-ing and a custom function, you need to point to the same hashing function.
hashing_type Type of metric hashing function. The default carbon_ch is Graphite’s traditionalconsistent-hashing implementation. Alternatively, you can use fnv1a_ch, which supports theFowler-Noll-Vo hash function (FNV-1a) hash implementation offered by the carbon-c-relay project.Default: carbon_ch
carbon_prefix Prefix for carbon’s internal metrics. When querying metrics starting with this prefix, re-quests are made to all carbon-cache instances instead of one instance selected by the key function.Default: carbon.
replication_factor The replication factor of your carbon setup. Default: 1.
Example:
carbon:hosts:
- 127.0.0.1:7002timeout: 1retry_delay: 15carbon_prefix: carbonreplication_factor: 1
sentry_dsn
This is useful if you want to send Graphite-API’s exceptions to a Sentry instance for easier debugging.
Example:
2.2. Configuration 7

Graphite-API Documentation, Release 1.1.3
sentry_dsn: https://key:[email protected]/12345
Note: Sentry integration requires Graphite-API to be installed with the corresponding extra dependency:
$ pip install graphite-api[sentry]
allowed_origins
Allows you to do cross-domain (CORS) requests to the Graphite API. Say you have a dashboard atdashboard.example.com that makes AJAX requests to graphite.example.com, just set thevalue accordingly:
allowed_origins:- dashboard.example.com
You can specify as many origins as you want. A wildcard can be used to allow all origins:
allowed_origins:- *
cache
Lets you configure a cache for graph rendering. This is done via Flask-Cache which supports a numberof backends including memcache, Redis, filesystem or in-memory caching.
Cache configuration maps directly to Flask-Cache’s config values. For each CACHE_* config value, setthe lowercased name in the cache section, without the prefix. Example:
cache:type: redisredis_host: localhost
This would configure Flask-Cache with CACHE_TYPE = 'redis' and CACHE_REDIS_HOST ='localhost'.
Some cache options have default values defined by Graphite-API:
• default_timeout: 60
• key_prefix: 'graphite-api:.
Note: Caching functionality requires you to install the cache extra dependency but also the underlyingdriver. E.g. for redis, you’ll need:
$ pip install graphite-api[cache] redis
statsd
Attaches a statsd object to the application, which can be used for instrumentation. Currently Graphite-APIitself doesn’t use this, but some backends do, like Graphite-Influxdb.
Example:
statsd:host: 'statsd_host'port: 8125 # not needed if default
8 Chapter 2. Contents

Graphite-API Documentation, Release 1.1.3
Note: This requires the statsd module:
$ pip install statsd
render_errors
If True (default), full tracebacks are returned in the HTTP response in case of application errors.
Custom location
If you need the Graphite-API config file to be stored in another place than /etc/graphite-api.yaml, you canset a custom location using the GRAPHITE_API_CONFIG environment variable:
export GRAPHITE_API_CONFIG=/var/lib/graphite/config.yaml
Deployment
There are several options available, depending on your setup.
Gunicorn + nginx
First, you need to install Gunicorn. The easiest way is to use pip:
$ pip install gunicorn
If you have installed Graphite-API in a virtualenv, install Gunicorn in the same virtualenv:
$ /usr/share/python/graphite/bin/pip install gunicorn
Next, create the script that will run Graphite-API using your process watcher of choice.
Upstart
description "Graphite-API server"start on runlevel [2345]stop on runlevel [!2345]
respawn
exec gunicorn -w2 graphite_api.app:app -b 127.0.0.1:8888
Supervisor
[program:graphite-api]command = gunicorn -w2 graphite_api.app:app -b 127.0.0.1:8888autostart = trueautorestart = true
systemd
2.3. Deployment 9
Graphite-API Documentation, Release 1.1.3
# This is /etc/systemd/system/graphite-api.socket[Unit]Description=graphite-api socket
[Socket]ListenStream=/run/graphite-api.sockListenStream=127.0.0.1:8888
[Install]WantedBy=sockets.target
# This is /etc/systemd/system/graphite-api.service[Unit]Description=Graphite-API serviceRequires=graphite-api.socket
[Service]ExecStart=/usr/bin/gunicorn -w2 graphite_api.app:appRestart=on-failure#User=graphite#Group=graphiteExecReload=/bin/kill -s HUP $MAINPIDExecStop=/bin/kill -s TERM $MAINPIDPrivateTmp=true
[Install]WantedBy=multi-user.target
Note: If you have installed Graphite-API and Gunicorn in a virtualenv, you need to use the full path to Gunicorn.Instead of gunicorn, use /usr/share/python/graphite/bin/gunicorn (assuming your virtualenv is at/usr/share/python/graphite).
See the Gunicorn docs for configuration options and command-line flags.
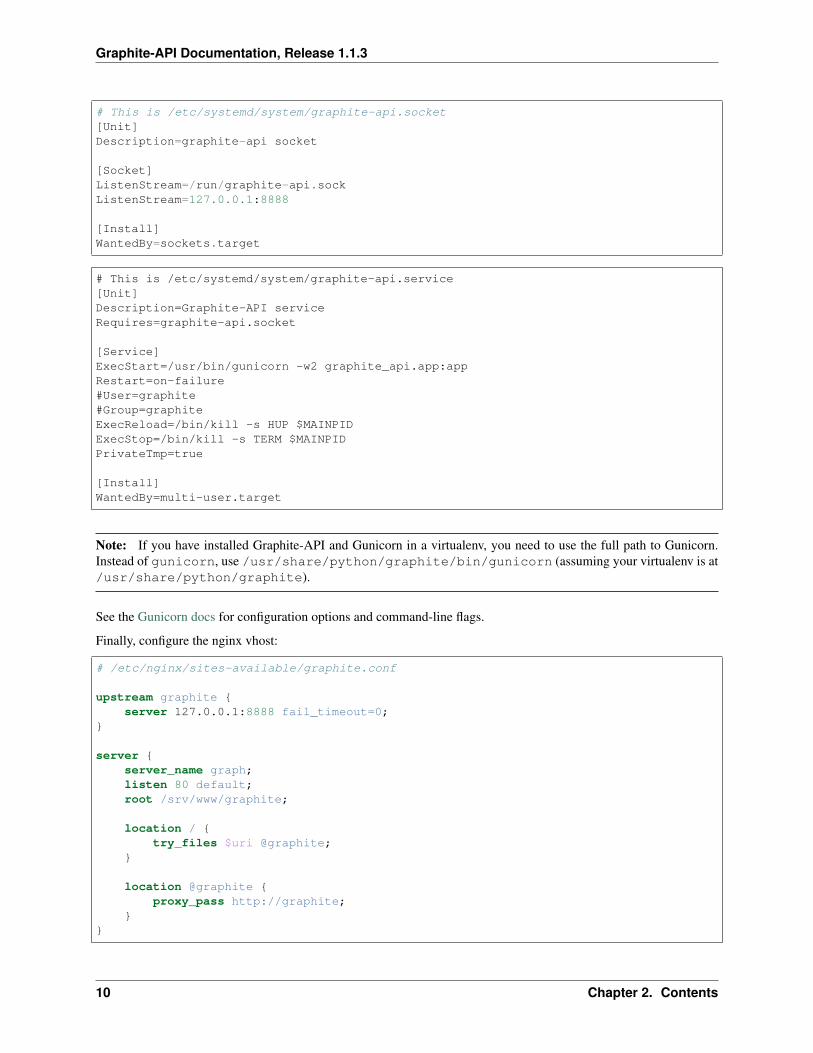
Finally, configure the nginx vhost:
# /etc/nginx/sites-available/graphite.conf
upstream graphite {server 127.0.0.1:8888 fail_timeout=0;
}
server {server_name graph;listen 80 default;root /srv/www/graphite;
location / {try_files $uri @graphite;
}
location @graphite {proxy_pass http://graphite;
}}
10 Chapter 2. Contents

Graphite-API Documentation, Release 1.1.3
Enable the vhost and restart nginx:
$ ln -s /etc/nginx/sites-available/graphite.conf /etc/nginx/sites-enabled$ service nginx restart
Apache + mod_wsgi
First, you need to install mod_wsgi.
See the mod_wsgi InstallationInstructions for installation instructions.
Then create the graphite-api.wsgi:
# /var/www/wsgi-scripts/graphite-api.wsgi
from graphite_api.app import app as application
Finally, configure the apache vhost:
# /etc/httpd/conf.d/graphite.conf
LoadModule wsgi_module modules/mod_wsgi.so
WSGISocketPrefix /var/run/wsgi
Listen 8013<VirtualHost *:8013>
WSGIDaemonProcess graphite-api processes=5 threads=5 display-name='%{GROUP}'→˓inactivity-timeout=120
WSGIProcessGroup graphite-apiWSGIApplicationGroup %{GLOBAL}WSGIImportScript /var/www/wsgi-scripts/graphite-api.wsgi process-group=graphite-
→˓api application-group=%{GLOBAL}
WSGIScriptAlias / /var/www/wsgi-scripts/graphite-api.wsgi
<Directory /var/www/wsgi-scripts/>Order deny,allowAllow from all
</Directory></VirtualHost>
Adapt the mod_wsgi configuration to your requirements.
See the mod_wsgi QuickConfigurationGuide for an overview of configurations and mod_wsgi ConfigurationDirectivesto see all configuration directives
Restart apache:
$ service httpd restart
Docker
Create a graphite-api.yaml configuration file with your desired config.
Create a Dockerfile:
2.3. Deployment 11

Graphite-API Documentation, Release 1.1.3
FROM brutasse/graphite-api
Build your container:
docker build -t graphite-api .
Run it:
docker run -t -i -p 8888:8888 graphite-api
/srv/graphite is a docker VOLUME. You can use that to provide whisper data from the host (or from anotherdocker container) to the graphite-api container:
docker run -t -i -v /path/to/graphite:/srv/graphite -p 8888:8888 graphite-api
This container has all the extra packages included. Cyanite backend and Sentry integration are available.
Nginx + uWSGI
First, you need to install uWSGI with Python support. On Debian, install uwsgi-plugin-python.
Then create the uWSGI file for Graphite-API in /etc/uwsgi/apps-available/graphite-api.ini:
[uwsgi]processes = 2socket = localhost:8080plugins = python27module = graphite_api.app:app
If you installed Graphite-API in a virtualenv, specify the virtualenv path:
home = /var/www/wsgi-scripts/env
If you need a custom location for Graphite-API’s config file, set the environment variable like this:
env = GRAPHITE_API_CONFIG=/var/www/wsgi-scripts/config.yml
Enable graphite-api.ini and restart uWSGI:
$ ln -s /etc/uwsgi/apps-available/graphite-api.ini /etc/uwsgi/apps-enabled$ service uwsgi restart
Finally, configure the nginx vhost:
# /etc/nginx/sites-available/graphite.conf
server {listen 80;
location / {include uwsgi_params;uwsgi_pass localhost:8080;
}}
Enable the vhost and restart nginx:
12 Chapter 2. Contents
Graphite-API Documentation, Release 1.1.3
$ ln -s /etc/nginx/sites-available/graphite.conf /etc/nginx/sites-enabled$ service nginx restart
Other deployment methods
They currently aren’t described here but there are several other ways to serve Graphite-API:
• nginx + circus + chaussette
If you feel like contributing some documentation, feel free to open pull a request on the Graphite-API repository.
HTTP API
Here is the general behavior of the API:
• When parameters are missing or wrong, an HTTP 400 response is returned with the detailed errors in theresponse body.
• Request parameters can be passed via:
– JSON data in the request body (application/json content-type).
– Form data in the request body (application/www-form-urlencoded content-type).
– Querystring parameters.
You can pass some parameters by querystring and others by json/form data if you want to. Parameters are lookedup in the order above, meaning that if a parameter is present in both the form data and the querystring, only theone from the querystring is taken into account.
• URLs are given without a trailing slash but adding a trailing slash is fine for all API calls.
• Parameters are case-sensitive.
The Metrics API
These API endpoints are useful for finding and listing metrics available in the system.
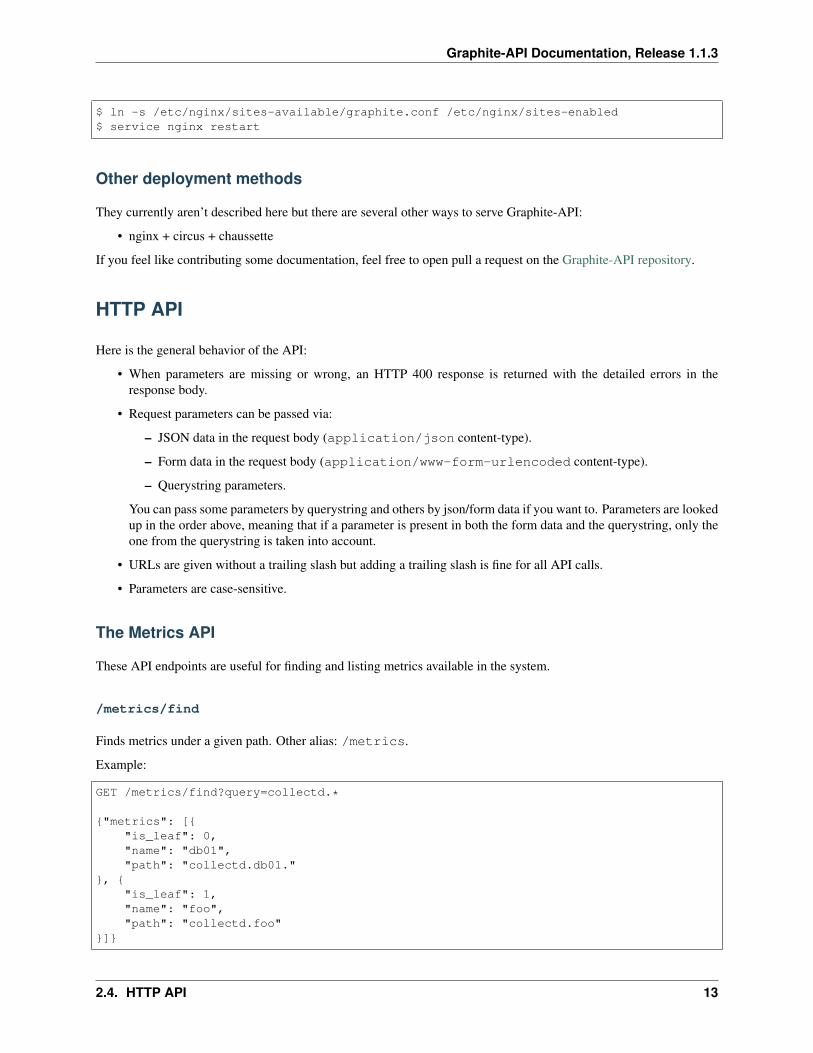
/metrics/find
Finds metrics under a given path. Other alias: /metrics.
Example:
GET /metrics/find?query=collectd.*
{"metrics": [{"is_leaf": 0,"name": "db01","path": "collectd.db01."
}, {"is_leaf": 1,"name": "foo","path": "collectd.foo"
}]}
2.4. HTTP API 13

Graphite-API Documentation, Release 1.1.3
Parameters:
query (mandatory) The query to search for.
format The output format to use. Can be completer or treejson (default).
wildcards (0 or 1) Whether to add a wildcard result at the end or no. Default: 0.
from Epoch timestamp from which to consider metrics.
until Epoch timestamp until which to consider metrics.
jsonp (optional) Wraps the response in a JSONP callback.
/metrics/expand
Expands the given query with matching paths.
Parameters:
query (mandatory) The metrics query. Can be specified multiple times.
groupByExpr (0 or 1) Whether to return a flat list of results or group them by query. Default: 0.
leavesOnly (0 or 1) Whether to only return leaves or both branches and leaves. Default: 0
jsonp (optional) Wraps the response in a JSONP callback.
/metrics/index.json
Walks the metrics tree and returns every metric found as a sorted JSON array.
Parameters:
jsonp (optional) Wraps the response in a jsonp callback.
Example:
GET /metrics/index.json
["collectd.host1.load.longterm","collectd.host1.load.midterm","collectd.host1.load.shortterm"
]
The Render API – /render
Graphite-API provides a /render endpoint for generating graphs and retrieving raw data. This endpoint acceptsvarious arguments via query string parameters, form data or JSON data.
To verify that the api is running and able to generate images, open http://<api-host>:<port>/render?target=test in a browser. The api should return a simple 600x300 image with the text “No Data”.
Once the api is running and you’ve begun feeding data into the storage backend, use the parameters below to customizeyour graphs and pull out raw data. For example:
14 Chapter 2. Contents

Graphite-API Documentation, Release 1.1.3
# single server load on large graphhttp://graphite/render?target=server.web1.load&height=800&width=600
# average load across web machines over last 12 hourshttp://graphite/render?target=averageSeries(server.web*.load)&from=-12hours
# number of registered users over past day as raw json datahttp://graphite/render?target=app.numUsers&format=json
# rate of new signups per minutehttp://graphite/render?target=summarize(derivative(app.numUsers),"1min")&title=New_→˓Users_Per_Minute
Note: Most of the functions and parameters are case sensitive. For example &linewidth=2 will fail silently. Thecorrect parameter in this case is &lineWidth=2
Graphing Metrics
To begin graphing specific metrics, pass one or more target parameters and specify a time window for the graph viafrom / until.
target
The target parameter specifies a path identifying one or several metrics, optionally with functions acting on thosemetrics. Paths are documented below, while functions are listed on the functions page.
Paths and Wildcards
Metric paths show the ”.” separated path from the root of the metrics tree (often starting with servers) to a metric,for example servers.ix02ehssvc04v.cpu.total.user.
Paths also support the following wildcards, which allows you to identify more than one metric in a single path.
Asterisk
The asterisk (*) matches zero or more characters. It is non-greedy, so you can have more than one withina single path element.
Example: servers.ix*ehssvc*v.cpu.total.* will return all total CPU metrics for all serversmatching the given name pattern.
Character list or range
Characters in square brackets ([...]) specify a single character position in the path string, and match ifthe character in that position matches one of the characters in the list or range.
A character range is indicated by 2 characters separated by a dash (-), and means that any characterbetween those 2 characters (inclusive) will match. More than one range can be included within the squarebrackets, e.g. foo[a-z0-9]bar will match foopbar, foo7bar etc..
If the characters cannot be read as a range, they are treated as a list – any character in the list will match,e.g. foo[bc]ar will match foobar and foocar. If you want to include a dash (-) in your list, put itat the beginning or end, so it’s not interpreted as a range.
2.4. HTTP API 15
Graphite-API Documentation, Release 1.1.3
Value list
Comma-separated values within curly braces ({foo,bar,...}) are treated as value lists, and match ifany of the values matches the current point in the path. For example, servers.ix01ehssvc04v.cpu.total.{user,system,iowait} will match the user, system and I/O wait total CPU metricsfor the specified server.
Note: All wildcards apply only within a single path element. In other words, they do not include or cross dots (.)Therefore, servers.* will not match servers.ix02ehssvc04v.cpu.total.user, while servers.*.*.*.* will.
Examples
This will draw one or more metrics
Example:
&target=company.server05.applicationInstance04.requestsHandled(draws one metric)
Let’s say there are 4 identical application instances running on each server:
&target=company.server05.applicationInstance*.requestsHandled(draws 4 metrics / lines)
Now let’s say you have 10 servers:
&target=company.server*.applicationInstance*.requestsHandled(draws 40 metrics / lines)
You can also run any number of functions on the various metrics before graphing:
&target=averageSeries(company.server*.applicationInstance.requestsHandled)(draws 1 aggregate line)
The target param can also be repeated to graph multiple related metrics:
&target=company.server1.loadAvg&target=company.server1.memUsage
Note: If more than 10 metrics are drawn the legend is no longer displayed. See the hideLegend parameter for details.
from / until
These are optional parameters that specify the relative or absolute time period to graph from specifies the beginning,until specifies the end. If from is omitted, it defaults to 24 hours ago If until is omitted, it defaults to the currenttime (now).
There are multiple possible formats for these functions:
&from=-RELATIVE_TIME&from=ABSOLUTE_TIME
16 Chapter 2. Contents

Graphite-API Documentation, Release 1.1.3
RELATIVE_TIME is a length of time since the current time. It is always preceded by a minus sign (-) and followedby a unit of time. Valid units of time:
Abbreviation Units Secondsmin Minutesh Hoursd Daysw Weeksmon 30 Days (month)y 365 Days (year)
ABSOLUTE_TIME is in the format HH:MM_YYMMDD, YYYYMMDD, MM/DD/YY, or any other at(1)-compatible time format.
Abbreviation MeaningHH Hours, in 24h clock format. Times before 12PM must include leading zeroes.MM MinutesYYYY 4 Digit Year.MM Numeric month representation with leading zeroDD Day of month with leading zero
&from and &until can mix absolute and relative time if desired.
Examples:
&from=-8d&until=-7d(shows same day last week)
&from=04:00_20110501&until=16:00_20110501(shows 4AM-4PM on May 1st, 2011)
&from=20091201&until=20091231(shows December 2009)
&from=noon+yesterday(shows data since 12:00pm on the previous day)
&from=6pm+today(shows data since 6:00pm on the same day)
&from=january+1(shows data since the beginning of the current year)
&from=monday(show data since the previous monday)
template
The targetmetrics can use a special template function which allows the metric paths to contain variables. Valuesfor these variables can be provided via the template query parameter.
Example:
&target=template(hosts.$hostname.cpu)&template[hostname]=worker1
Default values for the template variables can also be provided:
2.4. HTTP API 17

Graphite-API Documentation, Release 1.1.3
&target=template(hosts.$hostname.cpu, hostname="worker1")
Positional arguments can be used instead of named ones:
&target=template(hosts.$1.cpu, "worker1")&target=template(hosts.$1.cpu, "worker1")&template[1]=worker*
In addition to path substitution, variables can be used for numeric and string literals:
&target=template(constantLine($number))&template[number]=123&target=template(sinFunction($name))&template[name]=nameOfMySineWaveMetric
Data Display Formats
Along with rendering an image, the api can also generate SVG with embedded metadata, PDF, or return the raw datain various formats for external graphing, analysis or monitoring.
format
Controls the format of data returned Affects all &targets passed in the URL.
Examples:
&format=png&format=raw&format=csv&format=json&format=svg&format=pdf&format=dygraph&format=rickshaw
png
Renders the graph as a PNG image of size determined by width and height
raw
Renders the data in a custom line-delimited format. Targets are output one per line and are of the format <targetname>,<start timestamp>,<end timestamp>,<series step>|[data]*.
Example:
entries,1311836008,1311836013,1|1.0,2.0,3.0,5.0,6.0
csv
Renders the data in a CSV format suitable for import into a spreadsheet or for processing in a script.
Example:
18 Chapter 2. Contents

Graphite-API Documentation, Release 1.1.3
entries,2011-07-28 01:53:28,1.0entries,2011-07-28 01:53:29,2.0entries,2011-07-28 01:53:30,3.0entries,2011-07-28 01:53:31,5.0entries,2011-07-28 01:53:32,6.0
json
Renders the data as a json object. The jsonp option can be used to wrap this data in a named call for cross-domainaccess.
[{"target": "entries","datapoints": [[1.0, 1311836008],[2.0, 1311836009],[3.0, 1311836010],[5.0, 1311836011],[6.0, 1311836012]
]}]
svg
Renders the graph as SVG markup of size determined by width and height. Metadata about the drawn graph is savedas an embedded script with the variable metadata being set to an object describing the graph.
<script><![CDATA[metadata = {
"area": {"xmin": 39.195507812499997,"ymin": 33.96875,"ymax": 623.794921875,"xmax": 1122
},"series": [
{"start": 1335398400,"step": 1800,"end": 1335425400,"name": "summarize(test.data, \"30min\", \"sum\")","color": "#859900","data": [null, null, 1.0, null, 1.0, null, 1.0, null, 1.0, null, 1.0, null,
→˓null, null, null],"options": {},"valuesPerPoint": 1
}],"y": {
"labelValues": [0, 0.25, 0.5, 0.75, 1.0],"top": 1.0,"labels": ["0 ", "0.25 ", "0.50 ", "0.75 ", "1.00 "],"step": 0.25,
2.4. HTTP API 19

Graphite-API Documentation, Release 1.1.3
"bottom": 0},"x": {
"start": 1335398400,"end": 1335423600
},"font": {
"bold": false,"name": "Sans","italic": false,"size": 10
},"options": {
"lineWidth": 1.2}
}]]>
</script>
Renders the graph as a PDF of size determined by width and height.
dygraph
Renders the data as a json object suitable for passing to a Dygraph object.
{"labels" : ["Time","entries"
],"data" : [[1468791890000, 0.0],[1468791900000, 0.0]
]}
rickshaw
Renders the data as a json object suitable for passing to a Rickshaw object.
[{"target": "entries","datapoints": [{"y": 0.0,"x": 1468791890
}, {"y": 0.0,"x": 1468791900
}]}]
20 Chapter 2. Contents

Graphite-API Documentation, Release 1.1.3
rawData
Deprecated since version 0.9.9: This option is deprecated in favor of format
Used to get numerical data out of the webapp instead of an image Can be set to true, false, csv. Affects all &targetspassed in the URL.
Example:
&target=carbon.agents.graphiteServer01.cpuUsage&from=-5min&rawData=true
Returns the following text:
carbon.agents.graphiteServer01.cpuUsage,1306217160,1306217460,60|0.0,0.00666666520965,→˓0.00666666624282,0.0,0.0133345399694
Graph Parameters
areaAlpha
Default: 1.0
Takes a floating point number between 0.0 and 1.0.
Sets the alpha (transparency) value of filled areas when using an areaMode.
areaMode
Default: none
Enables filling of the area below the graphed lines. Fill area is the same color as the line color associated with it. SeeareaAlpha to make this area transparent. Takes one of the following parameters which determines the fill mode to use:
none Disables areaMode
first Fills the area under the first target and no other
all Fills the areas under each target
stacked Creates a graph where the filled area of each target is stacked on one another. Each target line is displayedas the sum of all previous lines plus the value of the current line.
bgcolor
Default: white
Sets the background color of the graph.
2.4. HTTP API 21

Graphite-API Documentation, Release 1.1.3
Color Names RGB Valueblack 0,0,0white 255,255,255blue 100,100,255green 0,200,0red 200,0,50yellow 255,255,0orange 255, 165, 0purple 200,100,255brown 150,100,50aqua 0,150,150gray 175,175,175grey 175,175,175magenta 255,0,255pink 255,100,100gold 200,200,0rose 200,150,200darkblue 0,0,255darkgreen 0,255,0darkred 255,0,0darkgray 111,111,111darkgrey 111,111,111
RGB can be passed directly in the format #RRGGBB where RR, GG, and BB are 2-digit hex vaules for red, green andblue, respectively.
Examples:
&bgcolor=blue&bgcolor=#2222FF
cacheTimeout
Default: the value of cache.default_timeout in your configuration file. By default, 60 seconds.
colorList
Default: blue,green,red,purple,brown,yellow,aqua,grey,magenta,pink,gold,rose
Takes one or more comma-separated color names or RGB values (see bgcolor for a list of color names) and uses thatlist in order as the colors of the lines. If more lines / metrics are drawn than colors passed, the list is reused in order.
Example:
&colorList=green,yellow,orange,red,purple,#DECAFF
drawNullAsZero
Default: false
Converts any None (null) values in the displayed metrics to zero at render time.
22 Chapter 2. Contents

Graphite-API Documentation, Release 1.1.3
fgcolor
Default: black
Sets the foreground color This only affects the title, legend text, and axis labels.
See majorGridLineColor, and minorGridLineColor for further control of colors.
See bgcolor for a list of color names and details on formatting this parameter.
fontBold
Default: false
If set to true, makes the font bold.
Example:
&fontBold=true
fontItalic
Default: false
If set to true, makes the font italic / oblique.
Example:
&fontItalic=true
fontName
Default: ‘Sans’
Change the font used to render text on the graph The font must be installed on the Graphite-API server.
Example:
&fontName=FreeMono
fontSize
Default: 10
Changes the font size Must be passed a positive floating point number or integer equal to or greater than 1.
Example:
&fontSize=8
format
See: Data Display Formats
2.4. HTTP API 23
Graphite-API Documentation, Release 1.1.3
from
See: from / until
graphOnly
Default: false
Display only the graph area with no grid lines, axes, or legend.
graphType
Default: line
Sets the type of graph to be rendered. Currently there are only two graph types:
line A line graph displaying metrics as lines over time.
pie A pie graph with each slice displaying an aggregate of each metric calculated using the function specified bypieMode.
hideLegend
Default: <unset>
If set to true, the legend is not drawn.
If set to false, the legend is drawn.
If unset, the legend is displayed if there are less than 10 items.
Hint: If set to false the &height parameter may need to be increased to accommodate the additional text.
Example:
&hideLegend=false
hideNullFromLegend
Default: False
If set to true, series with all null values will not be reported in the legend.
Example:
&hideNullFromLegend=true
hideAxes
Default: false
If set to true the X and Y axes will not be rendered.
Example:
24 Chapter 2. Contents

Graphite-API Documentation, Release 1.1.3
&hideAxes=true
hideXAxis
Default: false
If set to true the X Axis will not be rendered.
hideYAxis
Default: false
If set to true the Y Axis will not be rendered.
hideGrid
Default: false
If set to true the grid lines will not be rendered.
Example:
&hideGrid=true
height
Default: 300
Sets the height of the generated graph image in pixels.
See also: width
Example:
&width=650&height=250
jsonp
Default: <unset>
If set and combined with format=json, wraps the JSON response in a function call named by the parameterspecified.
leftColor
Default: color chosen from colorList.
In dual Y-axis mode, sets the color of all metrics associated with the left Y-axis.
2.4. HTTP API 25

Graphite-API Documentation, Release 1.1.3
leftDashed
Default: false
In dual Y-axis mode, draws all metrics associated with the left Y-axis using dashed lines.
leftWidth
Default: value of the parameter lineWidth
In dual Y-axis mode, sets the line width of all metrics associated with the left Y-axis.
lineMode
Default: slope
Sets the line drawing behavior. Takes one of the following parameters:
slope Slope line mode draws a line from each point to the next. Periods with Null values will not be drawn.
staircase Staircase draws a flat line for the duration of a time period and then a vertical line up or down to thenext value.
connected Like a slope line, but values are always connected with a slope line, regardless of whether or not thereare Null values between them.
Example:
&lineMode=staircase
lineWidth
Default: 1.2
Takes any floating point or integer (negative numbers do not error but will cause no line to be drawn). Changes thewidth of the line in pixels.
Example:
&lineWidth=2
logBase
Default: <unset>
If set, draws the graph with a logarithmic scale of the specified base (e.g. 10 for common logarithm).
majorGridLineColor
Default: rose
Sets the color of the major grid lines.
See bgcolor for valid color names and formats.
26 Chapter 2. Contents

Graphite-API Documentation, Release 1.1.3
Example:
&majorGridLineColor=#FF22FF
margin
Default: 10
Sets the margin around a graph image in pixels on all sides.
Example:
&margin=20
max
Deprecated since version 0.9.0: See yMax
maxDataPoints
Set the maximum numbers of datapoints returned when using json content.
If the number of datapoints in a selected range exceeds the maxDataPoints value then the datapoints over the wholeperiod are consolidated.
minorGridLineColor
Default: grey
Sets the color of the minor grid lines.
See bgcolor for valid color names and formats.
Example:
&minorGridLineColor=darkgrey
minorY
Default: 1
Sets the number of minor grid lines per major line on the y-axis.
Example:
&minorY=3
min
Deprecated since version 0.9.0: See yMin
2.4. HTTP API 27

Graphite-API Documentation, Release 1.1.3
minXStep
Default: 1
Sets the minimum pixel-step to use between datapoints drawn. Any value below this will trigger a point consolidationof the series at render time. The default value of 1 combined with the default lineWidth of 1.2 will cause a minimalamount of line overlap between close-together points. To disable render-time point consolidation entirely, set this to 0though note that series with more points than there are pixels in the graph area (e.g. a few month’s worth of per-minutedata) will look very ‘smooshed’ as there will be a good deal of line overlap. In response, one may use lineWidth tocompensate for this.
noCache
Default: False
Set it to disable caching in rendered graphs.
noNullPoints
Default: False
If set and combined with format=json, removes all null datapoints from the series returned.
pieLabels
Default: horizontal
Orientation to use for slice labels inside of a pie chart.
horizontal Labels are oriented horizontally within each slice
rotated Labels are oriented radially within each slice
pieMode
Default: average
The type of aggregation to use to calculate slices of a pie when graphType=pie. One of:
average The average of non-null points in the series.
maximum The maximum of non-null points in the series.
minimum The minimum of non-null points in the series.
rightColor
Default: color chosen from colorList
In dual Y-axis mode, sets the color of all metrics associated with the right Y-axis.
28 Chapter 2. Contents

Graphite-API Documentation, Release 1.1.3
rightDashed
Default: false
In dual Y-axis mode, draws all metrics associated with the right Y-axis using dashed lines.
rightWidth
Default: value of the parameter lineWidth
In dual Y-axis mode, sets the line width of all metrics associated with the right Y-axis.
template
Default: default
Used to specify a template from graphTemplates.conf to use for default colors and graph styles.
Example:
&template=plain
thickness
Deprecated since version 0.9.0: See: lineWidth
title
Default: <unset>
Puts a title at the top of the graph, center aligned. If unset, no title is displayed.
Example:
&title=Apache Busy Threads, All Servers, Past 24h
tz
Default: The timezone specified in the graphite-api configuration
Time zone to convert all times into.
Examples:
&tz=America/Los_Angeles&tz=UTC
uniqueLegend
Default: false
Display only unique legend items, removing any duplicates.
2.4. HTTP API 29

Graphite-API Documentation, Release 1.1.3
until
See: from / until
valueLabels
Default: percent
Determines how slice labels are rendered within a pie chart.
none Slice labels are not shown
numbers Slice labels are reported with the original values
percent Slice labels are reported as a percent of the whole
valueLabelsColor
Default: black
Color used to draw slice labels within a pie chart.
valueLabelsMin
Default: 5
Slice values below this minimum will not have their labels rendered.
vtitle
Default: <unset>
Labels the y-axis with vertical text. If unset, no y-axis label is displayed.
Example:
&vtitle=Threads
vtitleRight
Default: <unset>
In dual Y-axis mode, sets the title of the right Y-Axis (see: vtitle).
width
Default: 330
Sets the width of the generated graph image in pixels.
See also: height
Example:
30 Chapter 2. Contents

Graphite-API Documentation, Release 1.1.3
&width=650&height=250
xFormat
Default: Determined automatically based on the time-width of the X axis
Sets the time format used when displaying the X-axis. See datetime.date.strftime() for format specification details.
yAxisSide
Default: left
Sets the side of the graph on which to render the Y-axis. Accepts values of left or right.
yDivisors
Default: 4,5,6
Sets the preferred number of intermediate values to display on the Y-axis (Y values between the minimum and max-imum). Note that Graphite will ultimately choose what values (and how many) to display based on a ‘pretty’ factor,which tries to maintain a sensible scale (e.g. preferring intermediary values like 25%,50%,75% over 33.3%,66.6%).To explicitly set the Y-axis values, see yStep.
yLimit
Reserved for future use
See: yMax
yLimitLeft
Reserved for future use
See: yMaxLeft
yLimitRight
Reserved for future use
See: yMaxRight
yMin
Default: The lowest value of any of the series displayed
Manually sets the lower bound of the graph. Can be passed any integer or floating point number.
Example:
2.4. HTTP API 31

Graphite-API Documentation, Release 1.1.3
&yMin=0
yMax
Default: The highest value of any of the series displayed
Manually sets the upper bound of the graph. Can be passed any integer or floating point number.
Example:
&yMax=0.2345
yMaxLeft
In dual Y-axis mode, sets the upper bound of the left Y-Axis (see: yMax).
yMaxRight
In dual Y-axis mode, sets the upper bound of the right Y-Axis (see: yMax).
yMinLeft
In dual Y-axis mode, sets the lower bound of the left Y-Axis (see: yMin).
yMinRight
In dual Y-axis mode, sets the lower bound of the right Y-Axis (see: yMin).
yStep
Default: Calculated automatically
Manually set the value step between Y-axis labels and grid lines.
yStepLeft
In dual Y-axis mode, Manually set the value step between the left Y-axis labels and grid lines (see: yStep).
yStepRight
In dual Y-axis mode, Manually set the value step between the right Y-axis labels and grid lines (see: yStep).
32 Chapter 2. Contents

Graphite-API Documentation, Release 1.1.3
yUnitSystem
Default: si
Set the unit system for compacting Y-axis values (e.g. 23,000,000 becomes 23M). Value can be one of:
si Use si units (powers of 1000) - K, M, G, T, P.
binary Use binary units (powers of 1024) - Ki, Mi, Gi, Ti, Pi.
sec Use time units (seconds) - m, H, D, M, Y.
msec Use time units (milliseconds) - s, m, H, D, M, Y.
none Dont compact values, display the raw number.
Built-in functions
Functions are used to transform, combine, and perform computations on series data. They are applied by manipulatingthe target parameters in the Render API.
Usage
Most functions are applied to one series list. Functions with the parameter *seriesLists can take an arbitrarynumber of series lists. To pass multiple series lists to a function which only takes one, use the group() function.
List of functions
absolute(seriesList)Takes one metric or a wildcard seriesList and applies the mathematical abs function to each datapoint transform-ing it to its absolute value.
Example:
&target=absolute(Server.instance01.threads.busy)&target=absolute(Server.instance*.threads.busy)
aggregateLine(seriesList, func=’avg’)Takes a metric or wildcard seriesList and draws a horizontal line based on the function applied to each series.
Note: By default, the graphite renderer consolidates data points by averaging data points over time. If you areusing the ‘min’ or ‘max’ function for aggregateLine, this can cause an unusual gap in the line drawn by thisfunction and the data itself. To fix this, you should use the consolidateBy() function with the same functionargument you are using for aggregateLine. This will ensure that the proper data points are retained and thegraph should line up correctly.
Example:
&target=aggregateLine(server01.connections.total, 'avg')&target=aggregateLine(server*.connections.total, 'avg')
alias(seriesList, newName)Takes one metric or a wildcard seriesList and a string in quotes. Prints the string instead of the metric name inthe legend.
Example:
2.5. Built-in functions 33

Graphite-API Documentation, Release 1.1.3
&target=alias(Sales.widgets.largeBlue,"Large Blue Widgets")
aliasByMetric(seriesList)Takes a seriesList and applies an alias derived from the base metric name.
Example:
&target=aliasByMetric(carbon.agents.graphite.creates)
aliasByNode(seriesList, *nodes)Takes a seriesList and applies an alias derived from one or more “node” portion/s of the target name. Nodeindices are 0 indexed.
Example:
&target=aliasByNode(ganglia.*.cpu.load5,1)
aliasSub(seriesList, search, replace)
Runs series names through a regex search/replace.
Example:
&target=aliasSub(ip.*TCP*,"^.*TCP(\d+)","\1")
alpha(seriesList, alpha)Assigns the given alpha transparency setting to the series. Takes a float value between 0 and 1.
applyByNode(seriesList, nodeNum, templateFunction, newName=None)Takes a seriesList and applies some complicated function (described by a string), replacing templates withunique prefixes of keys from the seriesList (the key is all nodes up to the index given as nodeNum).
If the newName parameter is provided, the name of the resulting series will be given by that parameter, with any“%” characters replaced by the unique prefix.
Example:
&target=applyByNode(servers.*.disk.bytes_free,1,"divideSeries(%.disk.bytes_free,sumSeries(%.disk.bytes_*))")
Would find all series which match servers.*.disk.bytes_free, then trim them down to unique series up to the nodegiven by nodeNum, then fill them into the template function provided (replacing % by the prefixes).
areaBetween(*seriesLists)Draws the vertical area in between the two series in seriesList. Useful for visualizing a range such as theminimum and maximum latency for a service.
areaBetween expects exactly one argument that results in exactly two series (see example below). The orderof the lower and higher values series does not matter. The visualization only works when used in conjunctionwith areaMode=stacked.
Most likely use case is to provide a band within which another metric should move. In such case applying analpha(), as in the second example, gives best visual results.
Example:
&target=areaBetween(service.latency.{min,max})&areaMode=stacked
&target=alpha(areaBetween(service.latency.{min,max}),0.3)&areaMode=stacked
34 Chapter 2. Contents

Graphite-API Documentation, Release 1.1.3
If for instance, you need to build a seriesList, you should use the group function, like so:
&target=areaBetween(group(minSeries(a.*.min),maxSeries(a.*.max)))
asPercent(seriesList, total=None)Calculates a percentage of the total of a wildcard series. If total is specified, each series will be calculated as apercentage of that total. If total is not specified, the sum of all points in the wildcard series will be used instead.
The total parameter may be a single series, reference the same number of series as seriesList or a numeric value.
Example:
&target=asPercent(Server01.connections.{failed,succeeded},Server01.connections.attempted)
&target=asPercent(Server*.connections.{failed,succeeded},Server*.connections.attempted)
&target=asPercent(apache01.threads.busy,1500)&target=asPercent(Server01.cpu.*.jiffies)
averageAbove(seriesList, n)Takes one metric or a wildcard seriesList followed by an integer N. Out of all metrics passed, draws only themetrics with an average value above N for the time period specified.
Example:
&target=averageAbove(server*.instance*.threads.busy,25)
Draws the servers with average values above 25.
averageBelow(seriesList, n)Takes one metric or a wildcard seriesList followed by an integer N. Out of all metrics passed, draws only themetrics with an average value below N for the time period specified.
Example:
&target=averageBelow(server*.instance*.threads.busy,25)
Draws the servers with average values below 25.
averageOutsidePercentile(seriesList, n)Removes functions lying inside an average percentile interval
averageSeries(*seriesLists)Short Alias: avg()
Takes one metric or a wildcard seriesList. Draws the average value of all metrics passed at each time.
Example:
&target=averageSeries(company.server.*.threads.busy)
averageSeriesWithWildcards(seriesList, *positions)Call averageSeries after inserting wildcards at the given position(s).
Example:
&target=averageSeriesWithWildcards(host.cpu-[0-7].cpu-{user,system}.value, 1)
This would be the equivalent of:
2.5. Built-in functions 35

Graphite-API Documentation, Release 1.1.3
&target=averageSeries(host.*.cpu-user.value)&target=averageSeries(host.*.cpu-system.value)
cactiStyle(seriesList, system=None, units=None)Takes a series list and modifies the aliases to provide column aligned output with Current, Max, and Min valuesin the style of cacti. Optionally takes a “system” value to apply unit formatting in the same style as the Y-axis,or a “unit” string to append an arbitrary unit suffix. NOTE: column alignment only works with monospace fontssuch as terminus.
Example:
&target=cactiStyle(ganglia.*.net.bytes_out,"si")&target=cactiStyle(ganglia.*.net.bytes_out,"si","b")
changed(seriesList)Takes one metric or a wildcard seriesList. Output 1 when the value changed, 0 when null or the same Example:
&target=changed(Server01.connections.handled)
color(seriesList, theColor)Assigns the given color to the seriesList
Example:
&target=color(collectd.hostname.cpu.0.user, 'green')&target=color(collectd.hostname.cpu.0.system, 'ff0000')&target=color(collectd.hostname.cpu.0.idle, 'gray')&target=color(collectd.hostname.cpu.0.idle, '6464ffaa')
consolidateBy(seriesList, consolidationFunc)Takes one metric or a wildcard seriesList and a consolidation function name.
Valid function names are ‘sum’, ‘average’, ‘min’, and ‘max’.
When a graph is drawn where width of the graph size in pixels is smaller than the number of datapoints to begraphed, Graphite consolidates the values to to prevent line overlap. The consolidateBy() function changes theconsolidation function from the default of ‘average’ to one of ‘sum’, ‘max’, or ‘min’. This is especially usefulin sales graphs, where fractional values make no sense and a ‘sum’ of consolidated values is appropriate.
Example:
&target=consolidateBy(Sales.widgets.largeBlue, 'sum')&target=consolidateBy(Servers.web01.sda1.free_space, 'max')
constantLine(value)Takes a float F.
Draws a horizontal line at value F across the graph.
Example:
&target=constantLine(123.456)
countSeries(*seriesLists)Draws a horizontal line representing the number of nodes found in the seriesList.
Example:
36 Chapter 2. Contents

Graphite-API Documentation, Release 1.1.3
&target=countSeries(carbon.agents.*.*)
cumulative(seriesList)Takes one metric or a wildcard seriesList.
When a graph is drawn where width of the graph size in pixels is smaller than the number of datapoints tobe graphed, Graphite consolidates the values to prevent line overlap. The cumulative() function changes theconsolidation function from the default of ‘average’ to ‘sum’. This is especially useful in sales graphs, wherefractional values make no sense and a ‘sum’ of consolidated values is appropriate.
Alias for consolidateBy(series, 'sum')
Example:
&target=cumulative(Sales.widgets.largeBlue)
currentAbove(seriesList, n)Takes one metric or a wildcard seriesList followed by an integer N. Out of all metrics passed, draws only themetrics whose value is above N at the end of the time period specified.
Example:
&target=currentAbove(server*.instance*.threads.busy,50)
Draws the servers with more than 50 busy threads.
currentBelow(seriesList, n)Takes one metric or a wildcard seriesList followed by an integer N. Out of all metrics passed, draws only themetrics whose value is below N at the end of the time period specified.
Example:
&target=currentBelow(server*.instance*.threads.busy,3)
Draws the servers with less than 3 busy threads.
dashed(seriesList, dashLength=5)Takes one metric or a wildcard seriesList, followed by a float F.
Draw the selected metrics with a dotted line with segments of length F If omitted, the default length of thesegments is 5.0
Example:
&target=dashed(server01.instance01.memory.free,2.5)
delay(seriesList, steps)This shifts all samples later by an integer number of steps. This can be used for custom derivative calculations,among other things. Note: this will pad the early end of the data with None for every step shifted.
This complements other time-displacement functions such as timeShift and timeSlice, in that this function isindifferent about the step intervals being shifted.
Example:
&target=divideSeries(server.FreeSpace,delay(server.FreeSpace,1))
This computes the change in server free space as a percentage of the previous free space.
2.5. Built-in functions 37

Graphite-API Documentation, Release 1.1.3
derivative(seriesList)This is the opposite of the integral function. This is useful for taking a running total metric and calculating thedelta between subsequent data points.
This function does not normalize for periods of time, as a true derivative would. Instead see the perSecond()function to calculate a rate of change over time.
Example:
&target=derivative(company.server.application01.ifconfig.TXPackets)
Each time you run ifconfig, the RX and TXPackets are higher (assuming there is network traffic.) By applyingthe derivative function, you can get an idea of the packets per minute sent or received, even though you’re onlyrecording the total.
diffSeries(*seriesLists)Subtracts series 2 through n from series 1.
Example:
&target=diffSeries(service.connections.total,service.connections.failed)
To diff a series and a constant, one should use offset instead of (or in addition to) diffSeries.
Example:
&target=offset(service.connections.total, -5)
&target=offset(diffSeries(service.connections.total,service.connections.failed), -4)
divideSeries(dividendSeriesList, divisorSeriesList)Takes a dividend metric and a divisor metric and draws the division result. A constant may not be passed. Todivide by a constant, use the scale() function (which is essentially a multiplication operation) and use the inverseof the dividend. (Division by 8 = multiplication by 1/8 or 0.125)
Example:
&target=divideSeries(Series.dividends,Series.divisors)
divideSeriesLists(dividendSeriesList, divisorSeriesList)Iterates over a two lists and divides list1[0] by list2[0], list1[1] by list2[1] and so on. The lists need to be thesame length
drawAsInfinite(seriesList)Takes one metric or a wildcard seriesList. If the value is zero, draw the line at 0. If the value is above zero, drawthe line at infinity. If the value is null or less than zero, do not draw the line.
Useful for displaying on/off metrics, such as exit codes. (0 = success, anything else = failure.)
Example:
drawAsInfinite(Testing.script.exitCode)
exclude(seriesList, pattern)Takes a metric or a wildcard seriesList, followed by a regular expression in double quotes. Excludes metricsthat match the regular expression.
Example:
38 Chapter 2. Contents

Graphite-API Documentation, Release 1.1.3
&target=exclude(servers*.instance*.threads.busy,"server02")
exponentialMovingAverage(seriesList, windowSize)Takes a series of values and a window size and produces an exponential moving average utilizing the followingformula:
ema(current) = constant * (Current Value) + (1 - constant) * ema(previous)
The Constant is calculated as:
constant = 2 / (windowSize + 1)
The first period EMA uses a simple moving average for its value.
Example:
&target=exponentialMovingAverage(*.transactions.count, 10)&target=exponentialMovingAverage(*.transactions.count, '-10s')
fallbackSeries(seriesList, fallback)Takes a wildcard seriesList, and a second fallback metric. If the wildcard does not match any series, draws thefallback metric.
Example:
&target=fallbackSeries(server*.requests_per_second, constantLine(0))
Draws a 0 line when server metric does not exist.
formatPathExpressions(seriesList)Returns a comma-separated list of unique path expressions.
grep(seriesList, pattern)Takes a metric or a wildcard seriesList, followed by a regular expression in double quotes. Excludes metricsthat don’t match the regular expression.
Example:
&target=grep(servers*.instance*.threads.busy,"server02")
group(*seriesLists)Takes an arbitrary number of seriesLists and adds them to a single seriesList. This is used to pass multipleseriesLists to a function which only takes one.
groupByNode(seriesList, nodeNum, callback)Takes a serieslist and maps a callback to subgroups within as defined by a common node.
Example:
&target=groupByNode(ganglia.by-function.*.*.cpu.load5,2,"sumSeries")
Would return multiple series which are each the result of applying the “sumSeries” function to groups joined onthe second node (0 indexed) resulting in a list of targets like:
sumSeries(ganglia.by-function.server1.*.cpu.load5),sumSeries(ganglia.by-function.server2.*.cpu.load5),...
groupByNodes(seriesList, callback, *nodes)Takes a serieslist and maps a callback to subgroups within as defined by multiple nodes.
Example:
2.5. Built-in functions 39

Graphite-API Documentation, Release 1.1.3
&target=groupByNodes(ganglia.server*.*.cpu.load*,"sumSeries",1,4)
Would return multiple series which are each the result of applying the “sumSeries” function to groups joined onthe nodes’ list (0 indexed) resulting in a list of targets like:
sumSeries(ganglia.server1.*.cpu.load5),sumSeries(ganglia.server1.*.cpu.load10),sumSeries(ganglia.server1.*.cpu.load15),sumSeries(ganglia.server2.*.cpu.load5),sumSeries(ganglia.server2.*.cpu.load10),sumSeries(ganglia.server2.*.cpu.load15), ...
highestAverage(seriesList, n=1)Takes one metric or a wildcard seriesList followed by an integer N. Out of all metrics passed, draws only thetop N metrics with the highest average value for the time period specified.
Example:
&target=highestAverage(server*.instance*.threads.busy,5)
Draws the top 5 servers with the highest average value.
highestCurrent(seriesList, n=1)Takes one metric or a wildcard seriesList followed by an integer N. Out of all metrics passed, draws only the Nmetrics with the highest value at the end of the time period specified.
Example:
&target=highestCurrent(server*.instance*.threads.busy,5)
Draws the 5 servers with the highest busy threads.
highestMax(seriesList, n=1)Takes one metric or a wildcard seriesList followed by an integer N.
Out of all metrics passed, draws only the N metrics with the highest maximum value in the time period specified.
Example:
&target=highestMax(server*.instance*.threads.busy,5)
Draws the top 5 servers who have had the most busy threads during the time period specified.
hitcount(seriesList, intervalString, alignToInterval=False)Estimate hit counts from a list of time series.
This function assumes the values in each time series represent hits per second. It calculates hits per some largerinterval such as per day or per hour. This function is like summarize(), except that it compensates automaticallyfor different time scales (so that a similar graph results from using either fine-grained or coarse-grained records)and handles rarely-occurring events gracefully.
holtWintersAberration(seriesList, delta=3)Performs a Holt-Winters forecast using the series as input data and plots the positive or negative deviation of theseries data from the forecast.
holtWintersConfidenceArea(seriesList, delta=3)Performs a Holt-Winters forecast using the series as input data and plots the area between the upper and lowerbands of the predicted forecast deviations.
40 Chapter 2. Contents

Graphite-API Documentation, Release 1.1.3
holtWintersConfidenceBands(seriesList, delta=3)Performs a Holt-Winters forecast using the series as input data and plots upper and lower bands with the pre-dicted forecast deviations.
holtWintersForecast(seriesList)Performs a Holt-Winters forecast using the series as input data. Data from one week previous to the series isused to bootstrap the initial forecast.
identity(name, step=60)Identity function: Returns datapoints where the value equals the timestamp of the datapoint. Useful when youhave another series where the value is a timestamp, and you want to compare it to the time of the datapoint, torender an age
Example:
&target=identity("The.time.series")
This would create a series named “The.time.series” that contains points where x(t) == t.
Accepts optional second argument as ‘step’ parameter (default step is 60 sec)
integral(seriesList)This will show the sum over time, sort of like a continuous addition function. Useful for finding totals or trendsin metrics that are collected per minute.
Example:
&target=integral(company.sales.perMinute)
This would start at zero on the left side of the graph, adding the sales each minute, and show the total sales forthe time period selected at the right side, (time now, or the time specified by ‘&until=’).
integralByInterval(seriesList, intervalUnit)This will do the same as integral() funcion, except resetting the total to 0 at the given time in the parameter“from” Useful for finding totals per hour/day/week/..
Example:
&target=integralByInterval(company.sales.perMinute,"1d")&from=midnight-10days
This would start at zero on the left side of the graph, adding the sales each minute, and show the evolution ofsales per day during the last 10 days.
interpolate(seriesList, limit=inf)Takes one metric or a wildcard seriesList, and optionally a limit to the number of ‘None’ values to skip over.Continues the line with the last received value when gaps (‘None’ values) appear in your data, rather thanbreaking your line.
Example:
&target=interpolate(Server01.connections.handled)&target=interpolate(Server01.connections.handled, 10)
invert(seriesList)Takes one metric or a wildcard seriesList, and inverts each datapoint (i.e. 1/x).
Example:
&target=invert(Server.instance01.threads.busy)
2.5. Built-in functions 41

Graphite-API Documentation, Release 1.1.3
isNonNull(seriesList)Takes a metric or wild card seriesList and counts up how many non-null values are specified. This is useful forunderstanding which metrics have data at a given point in time (ie, to count which servers are alive).
Example:
&target=isNonNull(webapp.pages.*.views)
Returns a seriesList where 1 is specified for non-null values, and 0 is specified for null values.
keepLastValue(seriesList, limit=inf)Takes one metric or a wildcard seriesList, and optionally a limit to the number of ‘None’ values to skip over.Continues the line with the last received value when gaps (‘None’ values) appear in your data, rather thanbreaking your line.
Example:
&target=keepLastValue(Server01.connections.handled)&target=keepLastValue(Server01.connections.handled, 10)
legendValue(seriesList, *valueTypes)Takes one metric or a wildcard seriesList and a string in quotes. Appends a value to the metric name in thelegend. Currently one or several of: last, avg, total, min, max. The last argument can be si (default) or binary,in that case values will be formatted in the corresponding system.
Example:
&target=legendValue(Sales.widgets.largeBlue, 'avg', 'max', 'si')
limit(seriesList, n)Takes one metric or a wildcard seriesList followed by an integer N.
Only draw the first N metrics. Useful when testing a wildcard in a metric.
Example:
&target=limit(server*.instance*.memory.free,5)
Draws only the first 5 instance’s memory free.
lineWidth(seriesList, width)Takes one metric or a wildcard seriesList, followed by a float F.
Draw the selected metrics with a line width of F, overriding the default value of 1, or the &lineWidth=X.Xparameter.
Useful for highlighting a single metric out of many, or having multiple line widths in one graph.
Example:
&target=lineWidth(server01.instance01.memory.free,5)
linearRegression(seriesList, startSourceAt=None, endSourceAt=None)Graphs the liner regression function by least squares method.
Takes one metric or a wildcard seriesList, followed by a quoted string with the time to start the line and anotherquoted string with the time to end the line. The start and end times are inclusive (default range is from tountil). See from / until in the render_api_ for examples of time formats. Datapoints in the range is usedto regression.
Example:
42 Chapter 2. Contents

Graphite-API Documentation, Release 1.1.3
&target=linearRegression(Server.instance01.threads.busy,'-1d')&target=linearRegression(Server.instance*.threads.busy,
"00:00 20140101","11:59 20140630")
linearRegressionAnalysis(series)Returns factor and offset of linear regression function by least squares method.
logarithm(seriesList, base=10)Takes one metric or a wildcard seriesList, a base, and draws the y-axis in logarithmic format. If base is omitted,the function defaults to base 10.
Example:
&target=log(carbon.agents.hostname.avgUpdateTime,2)
lowestAverage(seriesList, n=1)Takes one metric or a wildcard seriesList followed by an integer N. Out of all metrics passed, draws only thebottom N metrics with the lowest average value for the time period specified.
Example:
&target=lowestAverage(server*.instance*.threads.busy,5)
Draws the bottom 5 servers with the lowest average value.
lowestCurrent(seriesList, n=1)Takes one metric or a wildcard seriesList followed by an integer N. Out of all metrics passed, draws only the Nmetrics with the lowest value at the end of the time period specified.
Example:
&target=lowestCurrent(server*.instance*.threads.busy,5)
Draws the 5 servers with the least busy threads right now.
mapSeries(seriesList, mapNode)Short form: map().
Takes a seriesList and maps it to a list of sub-seriesList. Each sub-seriesList has the given mapNode in common.
Example (note: This function is not very useful alone. It should be used with reduceSeries()):
mapSeries(servers.*.cpu.*,1) =>[
servers.server1.cpu.*,servers.server2.cpu.*,...servers.serverN.cpu.*
]
maxSeries(*seriesLists)Takes one metric or a wildcard seriesList. For each datapoint from each metric passed in, pick the maximumvalue and graph it.
Example:
&target=maxSeries(Server*.connections.total)
2.5. Built-in functions 43

Graphite-API Documentation, Release 1.1.3
maximumAbove(seriesList, n)Takes one metric or a wildcard seriesList followed by a constant n. Draws only the metrics with a maximumvalue above n.
Example:
&target=maximumAbove(system.interface.eth*.packetsSent,1000)
This would only display interfaces which at one point sent more than 1000 packets/min.
maximumBelow(seriesList, n)Takes one metric or a wildcard seriesList followed by a constant n. Draws only the metrics with a maximumvalue below n.
Example:
&target=maximumBelow(system.interface.eth*.packetsSent,1000)
This would only display interfaces which always sent less than 1000 packets/min.
minSeries(*seriesLists)Takes one metric or a wildcard seriesList. For each datapoint from each metric passed in, pick the minimumvalue and graph it.
Example:
&target=minSeries(Server*.connections.total)
minimumAbove(seriesList, n)Takes one metric or a wildcard seriesList followed by a constant n. Draws only the metrics with a minimumvalue above n.
Example:
&target=minimumAbove(system.interface.eth*.packetsSent,1000)
This would only display interfaces which always sent more than 1000 packets/min.
minimumBelow(seriesList, n)Takes one metric or a wildcard seriesList followed by a constant n. Draws only the metrics with a minimumvalue below n.
Example:
&target=minimumBelow(system.interface.eth*.packetsSent,1000)
This would only display interfaces which sent at one point less than 1000 packets/min.
mostDeviant(seriesList, n)Takes one metric or a wildcard seriesList followed by an integer N. Draws the N most deviant metrics. To findthe deviants, the standard deviation (sigma) of each series is taken and ranked. The top N standard deviationsare returned.
Example:
&target=mostDeviant(server*.instance*.memory.free, 5)
Draws the 5 instances furthest from the average memory free.
movingAverage(seriesList, windowSize)Graphs the moving average of a metric (or metrics) over a fixed number of past points, or a time interval.
44 Chapter 2. Contents

Graphite-API Documentation, Release 1.1.3
Takes one metric or a wildcard seriesList followed by a number N of datapoints or a quoted string with a lengthof time like ‘1hour’ or ‘5min’ (See from / until in the render_api_ for examples of time formats). Graphsthe average of the preceding datapoints for each point on the graph.
Example:
&target=movingAverage(Server.instance01.threads.busy,10)&target=movingAverage(Server.instance*.threads.idle,'5min')
movingMax(seriesList, windowSize)Graphs the moving maximum of a metric (or metrics) over a fixed number of past points, or a time interval.
Takes one metric or a wildcard seriesList followed by a number N of datapoints or a quoted string with a lengthof time like ‘1hour’ or ‘5min’ (See from / until in the render_api_ for examples of time formats). Graphsthe maximum of the preceeding datapoints for each point on the graph.
Example:
&target=movingMax(Server.instance01.requests,10)&target=movingMax(Server.instance*.errors,'5min')
movingMedian(seriesList, windowSize)Graphs the moving median of a metric (or metrics) over a fixed number of past points, or a time interval.
Takes one metric or a wildcard seriesList followed by a number N of datapoints or a quoted string with a lengthof time like ‘1hour’ or ‘5min’ (See from / until in the render_api_ for examples of time formats). Graphsthe median of the preceding datapoints for each point on the graph.
Example:
&target=movingMedian(Server.instance01.threads.busy,10)&target=movingMedian(Server.instance*.threads.idle,'5min')
movingMin(seriesList, windowSize)Graphs the moving minimum of a metric (or metrics) over a fixed number of past points, or a time interval.
Takes one metric or a wildcard seriesList followed by a number N of datapoints or a quoted string with a lengthof time like ‘1hour’ or ‘5min’ (See from / until in the render_api_ for examples of time formats). Graphsthe minimum of the preceeding datapoints for each point on the graph.
Example:
&target=movingMin(Server.instance01.requests,10)&target=movingMin(Server.instance*.errors,'5min')
movingSum(seriesList, windowSize)Graphs the moving sum of a metric (or metrics) over a fixed number of past points, or a time interval.
Takes one metric or a wildcard seriesList followed by a number N of datapoints or a quoted string with a lengthof time like ‘1hour’ or ‘5min’ (See from / until in the render_api_ for examples of time formats). Graphsthe sum of the preceeding datapoints for each point on the graph.
Example:
&target=movingSum(Server.instance01.requests,10)&target=movingSum(Server.instance*.errors,'5min')
multiplySeries(*seriesLists)Takes two or more series and multiplies their points. A constant may not be used. To multiply by a constant,use the scale() function.
2.5. Built-in functions 45

Graphite-API Documentation, Release 1.1.3
Example:
&target=multiplySeries(Series.dividends,Series.divisors)
multiplySeriesWithWildcards(seriesList, *position)Call multiplySeries after inserting wildcards at the given position(s).
Example:
&target=multiplySeriesWithWildcards(web.host-[0-7].{avg-response,total-request}.value, 2)
This would be the equivalent of:
&target=multiplySeries(web.host-0.{avg-response,total-request}.value)&target=multiplySeries(web.host-1.{avg-response,total-request}.value)...
nPercentile(seriesList, n)Returns n-percent of each series in the seriesList.
nonNegativeDerivative(seriesList, maxValue=None)Same as the derivative function above, but ignores datapoints that trend down. Useful for counters that increasefor a long time, then wrap or reset. (Such as if a network interface is destroyed and recreated by unloading andre-loading a kernel module, common with USB / WiFi cards.
Example:
&target=nonNegativederivative(company.server.application01.ifconfig.TXPackets)
offset(seriesList, factor)Takes one metric or a wildcard seriesList followed by a constant, and adds the constant to each datapoint.
Example:
&target=offset(Server.instance01.threads.busy,10)
offsetToZero(seriesList)Offsets a metric or wildcard seriesList by subtracting the minimum value in the series from each datapoint.
Useful to compare different series where the values in each series may be higher or lower on average but you’reonly interested in the relative difference.
An example use case is for comparing different round trip time results. When measuring RTT (like pinging aserver), different devices may come back with consistently different results due to network latency which willbe different depending on how many network hops between the probe and the device. To compare differentdevices in the same graph, the network latency to each has to be factored out of the results. This is a shortcutthat takes the fastest response (lowest number in the series) and sets that to zero and then offsets all of the otherdatapoints in that series by that amount. This makes the assumption that the lowest response is the fastest thedevice can respond, of course the more datapoints that are in the series the more accurate this assumption is.
Example:
&target=offsetToZero(Server.instance01.responseTime)&target=offsetToZero(Server.instance*.responseTime)
perSecond(seriesList, maxValue=None)NonNegativeDerivative adjusted for the series time interval This is useful for taking a running total metric andshowing how many requests per second were handled.
46 Chapter 2. Contents

Graphite-API Documentation, Release 1.1.3
Example:
&target=perSecond(company.server.application01.ifconfig.TXPackets)
Each time you run ifconfig, the RX and TXPackets are higher (assuming there is network traffic.) By applyingthe nonNegativeDerivative function, you can get an idea of the packets per minute sent or received, even thoughyou’re only recording the total.
percentileOfSeries(seriesList, n, interpolate=False)percentileOfSeries returns a single series which is composed of the n-percentile values taken across a wildcardseries at each point. Unless interpolate is set to True, percentile values are actual values contained in one of thesupplied series.
pow(seriesList, factor)Takes one metric or a wildcard seriesList followed by a constant, and raises the datapoint by the power of theconstant provided at each point.
Example:
&target=pow(Server.instance01.threads.busy,10)&target=pow(Server.instance*.threads.busy,10)
powSeries(*seriesLists)Takes two or more series and pows their points. A constant line may be used.
Example:
&target=powSeries(Server.instance01.app.requests,Server.instance01.app.replies)
randomWalkFunction(name, step=60)Short Alias: randomWalk()
Returns a random walk starting at 0. This is great for testing when there is no real data in whisper.
Example:
&target=randomWalk("The.time.series")
This would create a series named “The.time.series” that contains points where x(t) == x(t-1)+random()-0.5, andx(0) == 0.
Accepts an optional second argument as step parameter (default step is 60 sec).
rangeOfSeries(*seriesLists)Takes a wildcard seriesList. Distills down a set of inputs into the range of the series
Example:
&target=rangeOfSeries(Server*.connections.total)
reduceSeries(seriesLists, reduceFunction, reduceNode, *reduceMatchers)Short form: reduce().
Takes a list of seriesLists and reduces it to a list of series by means of the reduceFunction.
Reduction is performed by matching the reduceNode in each series against the list of reduceMatchers. Theeach series is then passed to the reduceFunction as arguments in the order given by reduceMatchers. ThereduceFunction should yield a single series.
The resulting list of series are aliased so that they can easily be nested in other functions.
2.5. Built-in functions 47

Graphite-API Documentation, Release 1.1.3
Example: Map/Reduce asPercent(bytes_used,total_bytes) for each server.
Assume that metrics in the form below exist:
servers.server1.disk.bytes_usedservers.server1.disk.total_bytesservers.server2.disk.bytes_usedservers.server2.disk.total_bytesservers.server3.disk.bytes_usedservers.server3.disk.total_bytes...servers.serverN.disk.bytes_usedservers.serverN.disk.total_bytes
To get the percentage of disk used for each server:
reduceSeries(mapSeries(servers.*.disk.*,1),"asPercent",3,"bytes_used","total_bytes") =>
alias(asPercent(servers.server1.disk.bytes_used,servers.server1.disk.total_bytes),
"servers.server1.disk.reduce.asPercent"),alias(asPercent(servers.server2.disk.bytes_used,
servers.server2.disk.total_bytes),"servers.server2.disk.reduce.asPercent"),
...alias(asPercent(servers.serverN.disk.bytes_used,
servers.serverN.disk.total_bytes),"servers.serverN.disk.reduce.asPercent")
In other words, we will get back the following metrics:
servers.server1.disk.reduce.asPercent,servers.server2.disk.reduce.asPercent,...servers.serverN.disk.reduce.asPercent
See also:
mapSeries()
removeAbovePercentile(seriesList, n)Removes data above the nth percentile from the series or list of series provided. Values above this percentile areassigned a value of None.
removeAboveValue(seriesList, n)Removes data above the given threshold from the series or list of series provided. Values above this thresholdare assigned a value of None.
removeBelowPercentile(seriesList, n)Removes data below the nth percentile from the series or list of series provided. Values below this percentileare assigned a value of None.
removeBelowValue(seriesList, n)Removes data below the given threshold from the series or list of series provided. Values below this thresholdare assigned a value of None.
removeBetweenPercentile(seriesList, n)Removes lines who do not have an value lying in the x-percentile of all the values at a moment
48 Chapter 2. Contents

Graphite-API Documentation, Release 1.1.3
removeEmptySeries(seriesList)Takes one metric or a wildcard seriesList. Out of all metrics passed, draws only the metrics with not empty data.
Example:
&target=removeEmptySeries(server*.instance*.threads.busy)
Draws only live servers with not empty data.
scale(seriesList, factor)Takes one metric or a wildcard seriesList followed by a constant, and multiplies the datapoint by the constantprovided at each point.
Example:
&target=scale(Server.instance01.threads.busy,10)&target=scale(Server.instance*.threads.busy,10)
scaleToSeconds(seriesList, seconds)Takes one metric or a wildcard seriesList and returns “value per seconds” where seconds is a last argument tothis functions.
Useful in conjunction with derivative or integral function if you want to normalize its result to a known resolutionfor arbitrary retentions
secondYAxis(seriesList)Graph the series on the secondary Y axis.
sinFunction(name, amplitude=1, step=60)Short Alias: sin()
Just returns the sine of the current time. The optional amplitude parameter changes the amplitude of the wave.
Example:
&target=sin("The.time.series", 2)
This would create a series named “The.time.series” that contains sin(x)*2.
A third argument can be provided as a step parameter (default is 60 secs).
smartSummarize(seriesList, intervalString, func=’sum’)Smarter experimental version of summarize.
sortByMaxima(seriesList)Takes one metric or a wildcard seriesList.
Sorts the list of metrics by the maximum value across the time period specified. Useful with the &areaMode=allparameter, to keep the lowest value lines visible.
Example:
&target=sortByMaxima(server*.instance*.memory.free)
sortByMinima(seriesList)Takes one metric or a wildcard seriesList.
Sorts the list of metrics by the lowest value across the time period specified.
Example:
&target=sortByMinima(server*.instance*.memory.free)
2.5. Built-in functions 49

Graphite-API Documentation, Release 1.1.3
sortByName(seriesList, natural=False)Takes one metric or a wildcard seriesList.
Sorts the list of metrics by the metric name using either alphabetical order or natural sorting. Natural sortingallows names containing numbers to be sorted more naturally, e.g:
•Alphabetical sorting: server1, server11, server12, server2
•Natural sorting: server1, server2, server11, server12
sortByTotal(seriesList)Takes one metric or a wildcard seriesList.
Sorts the list of metrics by the sum of values across the time period specified.
squareRoot(seriesList)Takes one metric or a wildcard seriesList, and computes the square root of each datapoint.
Example:
&target=squareRoot(Server.instance01.threads.busy)
stacked(seriesLists, stackName=’__DEFAULT__’)Takes one metric or a wildcard seriesList and change them so they are stacked. This is a way of stacking justa couple of metrics without having to use the stacked area mode (that stacks everything). By means of this amixed stacked and non stacked graph can be made
It can also take an optional argument with a name of the stack, in case there is more than one, e.g. for input andoutput metrics.
Example:
&target=stacked(company.server.application01.ifconfig.TXPackets, 'tx')
stddevSeries(*seriesLists)Takes one metric or a wildcard seriesList. Draws the standard deviation of all metrics passed at each time.
Example:
&target=stddevSeries(company.server.*.threads.busy)
stdev(seriesList, points, windowTolerance=0.1)Takes one metric or a wildcard seriesList followed by an integer N. Draw the Standard Deviation of all metricspassed for the past N datapoints. If the ratio of null points in the window is greater than windowTolerance, skipthe calculation. The default for windowTolerance is 0.1 (up to 10% of points in the window can be missing).Note that if this is set to 0.0, it will cause large gaps in the output anywhere a single point is missing.
Example:
&target=stdev(server*.instance*.threads.busy,30)&target=stdev(server*.instance*.cpu.system,30,0.0)
substr(seriesList, start=0, stop=0)Takes one metric or a wildcard seriesList followed by 1 or 2 integers. Assume that the metric name is a listor array, with each element separated by dots. Prints n - length elements of the array (if only one integer n ispassed) or n - m elements of the array (if two integers n and m are passed). The list starts with element 0 andends with element (length - 1).
Example:
50 Chapter 2. Contents

Graphite-API Documentation, Release 1.1.3
&target=substr(carbon.agents.hostname.avgUpdateTime,2,4)
The label would be printed as “hostname.avgUpdateTime”.
sumSeries(*seriesLists)Short form: sum()
This will add metrics together and return the sum at each datapoint. (See integral for a sum over time)
Example:
&target=sum(company.server.application*.requestsHandled)
This would show the sum of all requests handled per minute (provided requestsHandled are collected once aminute). If metrics with different retention rates are combined, the coarsest metric is graphed, and the sum ofthe other metrics is averaged for the metrics with finer retention rates.
sumSeriesWithWildcards(seriesList, *positions)Call sumSeries after inserting wildcards at the given position(s).
Example:
&target=sumSeriesWithWildcards(host.cpu-[0-7].cpu-{user,system}.value,1)
This would be the equivalent of:
&target=sumSeries(host.*.cpu-user.value)&target=sumSeries(host.*.cpu-system.value)
summarize(seriesList, intervalString, func=’sum’, alignToFrom=False)Summarize the data into interval buckets of a certain size.
By default, the contents of each interval bucket are summed together. This is useful for counters where eachincrement represents a discrete event and retrieving a “per X” value requires summing all the events in thatinterval.
Specifying ‘avg’ instead will return the mean for each bucket, which can be more useful when the value is agauge that represents a certain value in time.
‘max’, ‘min’ or ‘last’ can also be specified.
By default, buckets are calculated by rounding to the nearest interval. This works well for intervals smaller thana day. For example, 22:32 will end up in the bucket 22:00-23:00 when the interval=1hour.
Passing alignToFrom=true will instead create buckets starting at the from time. In this case, the bucket for 22:32depends on the from time. If from=6:30 then the 1hour bucket for 22:32 is 22:30-23:30.
Example:
# total errors per hour&target=summarize(counter.errors, "1hour")
# new users per week&target=summarize(nonNegativeDerivative(gauge.num_users), "1week")
# average queue size per hour&target=summarize(queue.size, "1hour", "avg")
# maximum queue size during each hour&target=summarize(queue.size, "1hour", "max")
2.5. Built-in functions 51

Graphite-API Documentation, Release 1.1.3
# 2010 Q1-4&target=summarize(metric, "13week", "avg", true)&from=midnight+20100101
threshold(value, label=None, color=None)Takes a float F, followed by a label (in double quotes) and a color. (See bgcolor in the render_api_ for validcolor names & formats.)
Draws a horizontal line at value F across the graph.
Example:
&target=threshold(123.456, "omgwtfbbq", "red")
timeFunction(name, step=60)Short Alias: time()
Just returns the timestamp for each X value. T
Example:
&target=time("The.time.series")
This would create a series named “The.time.series” that contains in Y the same value (in seconds) as X.
A second argument can be provided as a step parameter (default is 60 secs)
timeShift(seriesList, timeShift, resetEnd=True, alignDST=False)Takes one metric or a wildcard seriesList, followed by a quoted string with the length of time (See from /until in the render_api_ for examples of time formats).
Draws the selected metrics shifted in time. If no sign is given, a minus sign ( - ) is implied which will shift themetric back in time. If a plus sign ( + ) is given, the metric will be shifted forward in time.
Will reset the end date range automatically to the end of the base stat unless resetEnd is False. Example case iswhen you timeshift to last week and have the graph date range set to include a time in the future, will limit thistimeshift to pretend ending at the current time. If resetEnd is False, will instead draw full range including futuretime.
Because time is shifted by a fixed number of seconds, comparing a time period with DST to a time periodwithout DST, and vice-versa, will result in an apparent misalignment. For example, 8am might be overlaid with7am. To compensate for this, use the alignDST option.
Useful for comparing a metric against itself at a past periods or correcting data stored at an offset.
Example:
&target=timeShift(Sales.widgets.largeBlue,"7d")&target=timeShift(Sales.widgets.largeBlue,"-7d")&target=timeShift(Sales.widgets.largeBlue,"+1h")
timeSlice(seriesList, startSliceAt, endSliceAt=’now’)Takes one metric or a wildcard metric, followed by a quoted string with the time to start the line and anotherquoted string with the time to end the line. The start and end times are inclusive. See from / until in therender api for examples of time formats.
Useful for filtering out a part of a series of data from a wider range of data.
Example:
52 Chapter 2. Contents

Graphite-API Documentation, Release 1.1.3
&target=timeSlice(network.core.port1,"00:00 20140101","11:59 20140630")&target=timeSlice(network.core.port1,"12:00 20140630","now")
timeStack(seriesList, timeShiftUnit, timeShiftStart, timeShiftEnd)Takes one metric or a wildcard seriesList, followed by a quoted string with the length of time (See from /until in the render_api_ for examples of time formats). Also takes a start multiplier and end multiplier for thelength of time-
Create a seriesList which is composed the original metric series stacked with time shifts starting time shifts fromthe start multiplier through the end multiplier.
Useful for looking at history, or feeding into averageSeries or stddevSeries.
Example:
# create a series for today and each of the previous 7 days&target=timeStack(Sales.widgets.largeBlue,"1d",0,7)
transformNull(seriesList, default=0, referenceSeries=None)Takes a metric or wildcard seriesList and replaces null values with the value specified by default. The value 0used if not specified. The optional referenceSeries, if specified, is a metric or wildcard series list that governswhich time intervals nulls should be replaced. If specified, nulls are replaced only in intervals where a non-nullis found for the same interval in any of referenceSeries. This method compliments the drawNullAsZero functionin graphical mode, but also works in text-only mode.
Example:
&target=transformNull(webapp.pages.*.views,-1)
This would take any page that didn’t have values and supply negative 1 as a default. Any other numeric valuemay be used as well.
useSeriesAbove(seriesList, value, search, replace)Compares the maximum of each series against the given value. If the series maximum is greater than value, theregular expression search and replace is applied against the series name to plot a related metric.
e.g. given useSeriesAbove(ganglia.metric1.reqs,10,’reqs’,’time’), the response time metric will be plotted onlywhen the maximum value of the corresponding request/s metric is > 10
Example:
&target=useSeriesAbove(ganglia.metric1.reqs,10,"reqs","time")
verticalLine(ts, label=None, color=None)Takes a timestamp string ts.
Draws a vertical line at the designated timestamp with optional ‘label’ and ‘color’. Supported timestamp formatsinclude both relative (e.g. -3h) and absolute (e.g. 16:00_20110501) strings, such as those used with from anduntil parameters. When set, the ‘label’ will appear in the graph legend.
Note: Any timestamps defined outside the requested range will raise a ‘ValueError’ exception.
Example:
&target=verticalLine("12:3420131108","event","blue")&target=verticalLine("16:00_20110501","event")&target=verticalLine("-5mins")
weightedAverage(seriesListAvg, seriesListWeight, *nodes)Takes a series of average values and a series of weights and produces a weighted average for all values.
2.5. Built-in functions 53

Graphite-API Documentation, Release 1.1.3
The corresponding values should share one or more zero-indexed nodes.
Example:
&target=weightedAverage(*.transactions.mean,*.transactions.count,0)&target=weightedAverage(*.transactions.mean,*.transactions.count,1,3,4)
Storage finders
Graphite-API searches and fetches metrics from time series databases using an interface called finders. The defaultfinder provided with Graphite-API is the one that integrates with Whisper databases.
Customizing finders can be done in the finders section of the Graphite-API configuration file:
finders:- graphite_api.finders.whisper.WhisperFinder
Several values are allowed, to let you store different kinds of metrics at different places or smoothly handle transitionsfrom one time series database to another.
The default finder reads data from a Whisper database.
Custom finders
finders being a list of arbitrary python paths, it is relatively easy to write a custom finder if you want to read datafrom other places than Whisper. A finder is a python class with a find_nodes() method:
class CustomFinder(object):def find_nodes(self, query):
# ...
query is a FindQuery object. find_nodes() is the entry point when browsing the metrics tree. It must yieldleaf or branch nodes matching the query:
from graphite_api.node import LeafNode, BranchNode
class CustomFinder(object):def find_nodes(self, query):
# find some paths matching the query, then yield them# is_branch or is_leaf are predicates you need to implementfor path in matches:
if is_branch(path):yield BranchNode(path)
if is_leaf(path):yield LeafNode(path, CustomReader(path))
LeafNode is created with a reader, which is the class responsible for fetching the datapoints for the given path. It isa simple class with 2 methods: fetch() and get_intervals():
from graphite_api.intervals import IntervalSet, Interval
class CustomReader(object):__slots__ = ('path',) # __slots__ is recommended to save memory on readers
def __init__(self, path):
54 Chapter 2. Contents

Graphite-API Documentation, Release 1.1.3
self.path = path
def fetch(self, start_time, end_time):# fetch datatime_info = _from_, _to_, _step_return time_info, series
def get_intervals(self):return IntervalSet([Interval(start, end)])
fetch() must return a list of 2 elements: the time info for the data and the datapoints themselves. The time info is alist of 3 items: the start time of the datapoints (in unix time), the end time and the time step (in seconds) between thedatapoints.
The datapoints is a list of points found in the database for the required interval. There must be (end - start) /step points in the dataset even if the database has gaps: gaps can be filled with None values.
get_intervals() is a method that hints graphite-web about the time range available for this given metric in thedatabase. It must return an IntervalSet of one or more Interval objects.
Fetching multiple paths at once
If your storage backend allows it, fetching multiple paths at once is useful to avoid sequential fetches and save timeand resources. This can be achieved in three steps:
• Subclass LeafNode and add a __fetch_multi__ class attribute to your subclass:
class CustomLeafNode(LeafNode):__fetch_multi__ = 'custom'
The string 'custom' is used to identify backends and needs to be unique per-backend.
• Add the __fetch_multi__ attribute to your finder class:
class CustomFinder(objects):__fetch_multi__ = 'custom'
• Implement a fetch_multi() method on your finder:
class CustomFinder(objects):def fetch_multi(self, nodes, start_time, end_time):
paths = [node.path for node in nodes]# fetch pathsreturn time_info, series
time_info is the same structure as the one returned by fetch(). series is a dictionnary with paths askeys and datapoints as values.
Installing custom finders
In order for your custom finder to be importable, you need to package it under a namespace of your choice. Pythonpackaging won’t be covered here but you can look at third-party finders to get some inspiration:
• Cyanite finder
2.6. Storage finders 55

Graphite-API Documentation, Release 1.1.3
Configuration
Graphite-API instantiates finders and passes it its whole parsed configuration file, as a Python data structure. Externalfinders can require extra sections in the configuration file to setup access to the time series database they communicatewith. For instance, let’s say your CustomFinder needs two configuration parameters, a host and a user:
class CustomFinder(object):def __init__(self, config):
config.setdefault('custom', {})self.user = config['custom'].get('user', 'default')self.host = config['custom'].get('host', 'localhost')
The configuration file would look like:
finders:- custom.CustomFinder
custom:user: myuserhost: example.com
When possible, try to use sane defaults that would “just work” for most common setups. Here if the custom sectionisn’t provided, the finder uses default as user and localhost as host.
Custom functions
Just like with storage finders, it is possible to extend Graphite-API to add custom processing functions.
To give an example, let’s implement a function that reverses the time series, placing old values at the end and recentvalues at the beginning.
# reverse.py
def reverseSeries(requestContex, seriesList):reverse = []for series in seriesList:
reverse.append(TimeSeries(series.name, series.start, series.end,series.step, series[::-1]))
return reverse
The first argument, requestContext, holds some information about the request parameters. seriesList is thelist of paths found for the request target.
Once you’ve created your function, declare it in a dictionnary:
ReverseFunctions = {'reverseSeries': reverseSeries,
}
Add your module to the Graphite-API Python path and add it to the configuration:
functions:- graphite_api.functions.SeriesFunctions- graphite_api.functions.PieFunctions- reverse.ReverseFunctions
56 Chapter 2. Contents

Graphite-API Documentation, Release 1.1.3
Graphite-API releases
1.1.3 – 2016-05-23
• Remove extra parenthesis from aliasByMetric().
• Fix leap year handling in graphite_api.render.attime.
• Allow colon and hash in node names in aliasByNode()
• Fix calling reduceFunction in reduceSeries
• Revert a whisper patch which broke multiple retentions handling.
• Specify which function is invalid when providing an invalid consolidation function.
1.1.2 – 2015-11-19
• Fix regression in multi fetch handling: paths were queried multiple times, leading to erroneous behaviour andslowdown.
• Continue on IndexError in remove{Above,Below}Percentile functions.
1.1.1 – 2015-10-23
• Fix areaMode=stacked.
• Fix error when calling functions that use fetchWithBootstrap and the bootstrap range isn’t available (fillwith nulls instead).
1.1 – 2015-10-05
• Add CarbonLink support.
• Add support for configuring a cache backend and the noCache and cacheTimeout API options.
• When no timezone is provided in the configuration file, try to guess from the system’s timezone with a fallbackto UTC.
• Now supporting Flask >= 0.8 and Pyparsing >= 1.5.7.
• Add support for fetch_multi() in storage finders. This is useful for database-backed finders such as Cyanitebecause it allows fetching all time series at once instead of sequentially.
• Add multiplySeriesWithWildcards, minimumBelow, changed, timeSlice andremoveEmptySeries functions.
• Add optional step argument to time, sin and randomWalk functions.
• Add /metrics API call as an alias to /metrics/find.
• Add missing /metrics/index.json API call.
• Allow wildcards origins (*) in CORS configuration.
• Whisper finder now logs debug information.
• Fix parsing dates such as “feb27” during month days > 28.
2.8. Graphite-API releases 57
Graphite-API Documentation, Release 1.1.3
• Change sum() to return null instead of 0 when all series’ datapoints are null at the same time. This isgraphite-web’s behavior.
• Extract paths of all targets before fetching data. This is a significant optimization for storage backends such asCyanite that allow bulk-fetching metrics.
• Add JSONP support to all API endpoints that can return JSON.
• Fix 500 error when generating a SVG graph without any data.
• Return tracebacks in the HTTP response when app errors occur. This behavior can be disabled in the configura-tion.
• Fixes for the following graphite-web issues:
– #639 – proper timezone handling of from and until with client-supplied timezones.
– #540 – provide the last data point when rendering to JSON format.
– #381 – make areaBetween()work either when passed 2 arguments or a single wildcard series of length2.
– #702 – handle backslash as path separator on windows.
– #410 – SVG output sometimes had an extra </g> tag.
1.0.1 – 2014-03-21
• time_zone set to UTC by default instead of Europe/Berlin.
• Properly log app exceptions.
• Fix constantLine for python 3.
• Create whisper directories if they don’t exist.
• Fixes for the following graphite-web issues:
– #645, #625 – allow constantLine to work even if there are no other targets in the graph.
1.0.0 – 2014-03-20
Version 1.0 is based on the master branch of Graphite-web, mid-March 2014, with the following modifications:
• New /index API endpoint for re-building the index (replaces the build-index command-line script fromgraphite-web).
• Removal of memcache integration.
• Removal of Pickle integration.
• Removal of remote rendering.
• Support for Python 3.
• A lot more tests and test coverage.
• Fixes for the following graphite-web issues:
– (meta) #647 – strip out the API from graphite-web.
– #665 – address some DeprecationWarnings.
– #658 – accept a float value in maxDataPoints.
58 Chapter 2. Contents

Graphite-API Documentation, Release 1.1.3
– #654 – ignore invalid logBase values (<=1).
– #591 – accept JSON data additionaly to querystring params or form data.
2.8. Graphite-API releases 59

Graphite-API Documentation, Release 1.1.3
60 Chapter 2. Contents

CHAPTER 3
Indices and tables
• genindex
• modindex
• search
61

Graphite-API Documentation, Release 1.1.3
62 Chapter 3. Indices and tables
Python Module Index
ggraphite_api.functions, 33
63

Graphite-API Documentation, Release 1.1.3
64 Python Module Index

Index
Aabsolute() (in module graphite_api.functions), 33aggregateLine() (in module graphite_api.functions), 33alias() (in module graphite_api.functions), 33aliasByMetric() (in module graphite_api.functions), 34aliasByNode() (in module graphite_api.functions), 34aliasSub() (in module graphite_api.functions), 34alpha() (in module graphite_api.functions), 34applyByNode() (in module graphite_api.functions), 34areaBetween() (in module graphite_api.functions), 34asPercent() (in module graphite_api.functions), 35averageAbove() (in module graphite_api.functions), 35averageBelow() (in module graphite_api.functions), 35averageOutsidePercentile() (in module
graphite_api.functions), 35averageSeries() (in module graphite_api.functions), 35averageSeriesWithWildcards() (in module
graphite_api.functions), 35
CcactiStyle() (in module graphite_api.functions), 36changed() (in module graphite_api.functions), 36color() (in module graphite_api.functions), 36consolidateBy() (in module graphite_api.functions), 36constantLine() (in module graphite_api.functions), 36countSeries() (in module graphite_api.functions), 36cumulative() (in module graphite_api.functions), 37currentAbove() (in module graphite_api.functions), 37currentBelow() (in module graphite_api.functions), 37
Ddashed() (in module graphite_api.functions), 37delay() (in module graphite_api.functions), 37derivative() (in module graphite_api.functions), 37diffSeries() (in module graphite_api.functions), 38divideSeries() (in module graphite_api.functions), 38divideSeriesLists() (in module graphite_api.functions), 38drawAsInfinite() (in module graphite_api.functions), 38
Eexclude() (in module graphite_api.functions), 38exponentialMovingAverage() (in module
graphite_api.functions), 39
FfallbackSeries() (in module graphite_api.functions), 39formatPathExpressions() (in module
graphite_api.functions), 39
Ggraphite_api.functions (module), 33grep() (in module graphite_api.functions), 39group() (in module graphite_api.functions), 39groupByNode() (in module graphite_api.functions), 39groupByNodes() (in module graphite_api.functions), 39
HhighestAverage() (in module graphite_api.functions), 40highestCurrent() (in module graphite_api.functions), 40highestMax() (in module graphite_api.functions), 40hitcount() (in module graphite_api.functions), 40holtWintersAberration() (in module
graphite_api.functions), 40holtWintersConfidenceArea() (in module
graphite_api.functions), 40holtWintersConfidenceBands() (in module
graphite_api.functions), 40holtWintersForecast() (in module graphite_api.functions),
41
Iidentity() (in module graphite_api.functions), 41integral() (in module graphite_api.functions), 41integralByInterval() (in module graphite_api.functions),
41interpolate() (in module graphite_api.functions), 41invert() (in module graphite_api.functions), 41isNonNull() (in module graphite_api.functions), 41
65

Graphite-API Documentation, Release 1.1.3
KkeepLastValue() (in module graphite_api.functions), 42
LlegendValue() (in module graphite_api.functions), 42limit() (in module graphite_api.functions), 42linearRegression() (in module graphite_api.functions), 42linearRegressionAnalysis() (in module
graphite_api.functions), 43lineWidth() (in module graphite_api.functions), 42logarithm() (in module graphite_api.functions), 43lowestAverage() (in module graphite_api.functions), 43lowestCurrent() (in module graphite_api.functions), 43
MmapSeries() (in module graphite_api.functions), 43maximumAbove() (in module graphite_api.functions), 43maximumBelow() (in module graphite_api.functions), 44maxSeries() (in module graphite_api.functions), 43minimumAbove() (in module graphite_api.functions), 44minimumBelow() (in module graphite_api.functions), 44minSeries() (in module graphite_api.functions), 44mostDeviant() (in module graphite_api.functions), 44movingAverage() (in module graphite_api.functions), 44movingMax() (in module graphite_api.functions), 45movingMedian() (in module graphite_api.functions), 45movingMin() (in module graphite_api.functions), 45movingSum() (in module graphite_api.functions), 45multiplySeries() (in module graphite_api.functions), 45multiplySeriesWithWildcards() (in module
graphite_api.functions), 46
NnonNegativeDerivative() (in module
graphite_api.functions), 46nPercentile() (in module graphite_api.functions), 46
Ooffset() (in module graphite_api.functions), 46offsetToZero() (in module graphite_api.functions), 46
PpercentileOfSeries() (in module graphite_api.functions),
47perSecond() (in module graphite_api.functions), 46pow() (in module graphite_api.functions), 47powSeries() (in module graphite_api.functions), 47
RrandomWalkFunction() (in module
graphite_api.functions), 47rangeOfSeries() (in module graphite_api.functions), 47reduceSeries() (in module graphite_api.functions), 47
removeAbovePercentile() (in modulegraphite_api.functions), 48
removeAboveValue() (in module graphite_api.functions),48
removeBelowPercentile() (in modulegraphite_api.functions), 48
removeBelowValue() (in module graphite_api.functions),48
removeBetweenPercentile() (in modulegraphite_api.functions), 48
removeEmptySeries() (in module graphite_api.functions),48
Sscale() (in module graphite_api.functions), 49scaleToSeconds() (in module graphite_api.functions), 49secondYAxis() (in module graphite_api.functions), 49sinFunction() (in module graphite_api.functions), 49smartSummarize() (in module graphite_api.functions), 49sortByMaxima() (in module graphite_api.functions), 49sortByMinima() (in module graphite_api.functions), 49sortByName() (in module graphite_api.functions), 49sortByTotal() (in module graphite_api.functions), 50squareRoot() (in module graphite_api.functions), 50stacked() (in module graphite_api.functions), 50stddevSeries() (in module graphite_api.functions), 50stdev() (in module graphite_api.functions), 50substr() (in module graphite_api.functions), 50summarize() (in module graphite_api.functions), 51sumSeries() (in module graphite_api.functions), 51sumSeriesWithWildcards() (in module
graphite_api.functions), 51
Tthreshold() (in module graphite_api.functions), 52timeFunction() (in module graphite_api.functions), 52timeShift() (in module graphite_api.functions), 52timeSlice() (in module graphite_api.functions), 52timeStack() (in module graphite_api.functions), 53transformNull() (in module graphite_api.functions), 53
UuseSeriesAbove() (in module graphite_api.functions), 53
VverticalLine() (in module graphite_api.functions), 53
WweightedAverage() (in module graphite_api.functions),
53
66 Index
![WorkFlow RESTful API Documentation - CallidusCloud · WorkFlow RESTful API Documentation - CallidusCloud ... x ] ] x](https://img.pdfslide.us/doc/110x75/5f71c84b4ed89f54f46297b2/workflow-restful-api-documentation-calliduscloud-workflow-restful-api-documentation.jpg)