Embed Size (px)
Citation preview
BA
In this chapter we study graphing and focus on the graphs of lines.As you work through the chapter, pay attention to key terms. Then work
through this puzzle. When you fill in the blanks, notice that hyphens andspaces also go in the boxes.
Graphing LinearEquations in TwoVariables
3.1 Rectangular Coordinate System
3.2 Linear Equations in Two Variables
3.3 Slope of a Line
3.4 Slope-Intercept Form of a Line
3.5 Point-Slope Formula
3.6 Applications of Linear Equations
33
Across
1. (0, b)
3. one of four regions in the xy-plane
4. The point (0, 0)
5. horizontal axis
7. lines with the same slope and differenty-intercepts
8. (a, 0)
Down
1. vertical axis
2. lines that intersect at a right angle
6. “slant” of a line
209
1y
3q
2pretni�
�
�
c e
u a d
r4
o
5x
�8
x
i g i
a x
7p
6s
ra a
i tn e
el
ec
l
t
e
p
e
r a n
n
d
c
u
i s
l
a
r
o
p t
e
ta
x
i
s
miL28711_ch03_209-296 9/26/06 05:43 PM Page 209CONFIRMING PAGES
210 Chapter 3 Graphing Linear Equations in Two Variables
BA
1. Interpreting GraphsMathematics is a powerful tool used by scientists and has directly contributedto the highly technical world we live in. Applications of mathematics have ledto advances in the sciences, business, computer technology, and medicine.
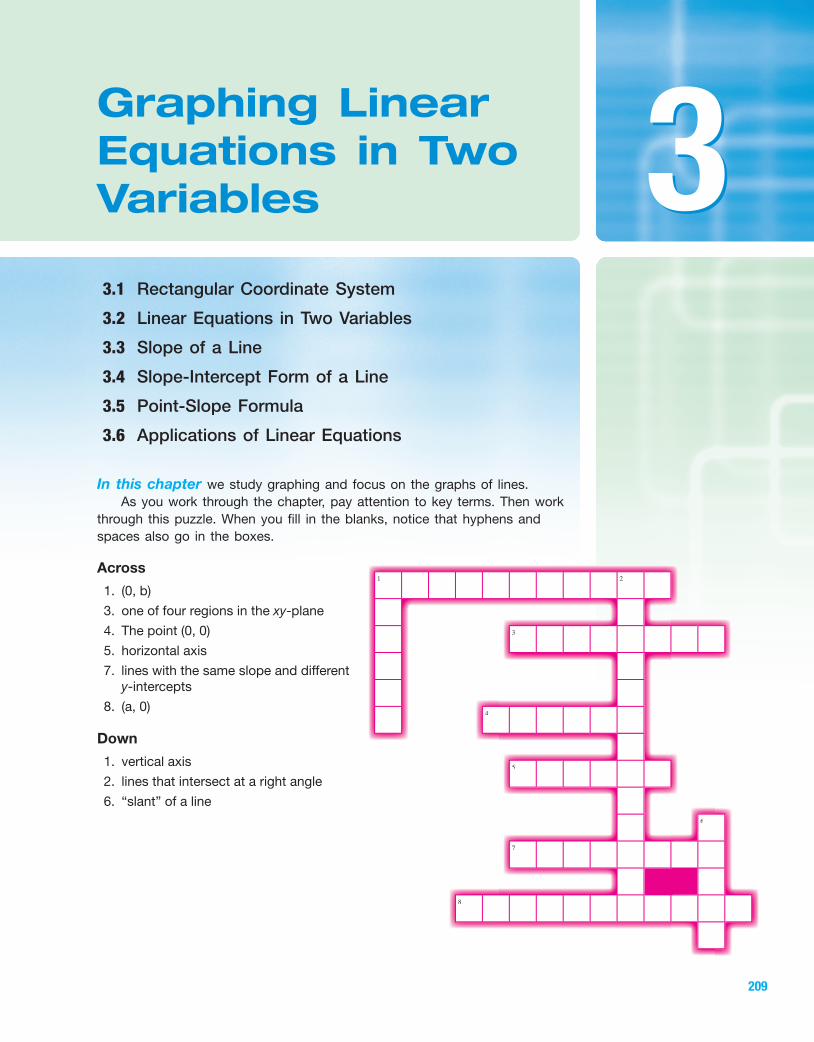
One fundamental application of mathematics is the graphical representation ofnumerical information (or data). For example, Table 3-1 represents the number ofclients admitted to a drug and alcohol rehabilitation program over a 12-monthperiod.
In table form, the information is difficult to picture and interpret. It appearsthat on a monthly basis, the number of clients fluctuates. However, when the dataare represented in a graph, an upward trend is clear (Figure 3-1).
Month (x � 1 corresponds to Jan.)
Num
ber
of C
lient
s
Number of Clients Admitted to Program
00 1 2 3 4 5 6 7 8 9 10 11 12
20
40
60
80
100y
x
Figure 3-1
From the increase in clients shown in this graph, management for the rehabili-tation center might make plans for the future. If the trend continues, managementmight consider expanding its facilities and increasing its staff to accommodate theexpected increase in clients.
Section 3.1 Rectangular Coordinate System
Concepts
1. Interpreting Graphs2. Plotting Points in a
Rectangular CoordinateSystem
3. Applications of Plotting andIdentifying Points
Table 3-1
Number ofMonth Clients
Jan. 1 55
Feb. 2 62
March 3 64
April 4 60
May 5 70
June 6 73
July 7 77
Aug. 8 80
Sept. 9 80
Oct. 10 74
Nov. 11 85
Dec. 12 90
miL28711_ch03_209-296 9/26/06 07:30 AM Page 210CONFIRMING PAGES
Section 3.1 Rectangular Coordinate System 211
BA
Interpreting a Graph
Refer to Figure 3-1 and Table 3-1.
a. For which month was the number of clients the greatest?
b. How many clients were served in the first month (January)?
c. Which month corresponds to 60 clients served?
d. Between which two months did the number of clients decrease?
e. Between which two months did the number of clients remain the same?
Solution:
a. Month 12 (December) corresponds to the highest point on the graph, whichrepresents the most clients.
b. In month 1 (January), there were 55 clients served.
c. Month 4 (April).
d. The number of clients decreased between months 3 and 4 and betweenmonths 9 and 10.
e. The number of clients remained the same between months 8 and 9.
1. Refer to Figure 3-1.a. How many clients were served in October?b. Which month corresponds to 70 clients served?c. What is the difference between the number of clients in month 12 and
month 1?d. For which month was the number of clients served the least?
Skill Practice
Example 1
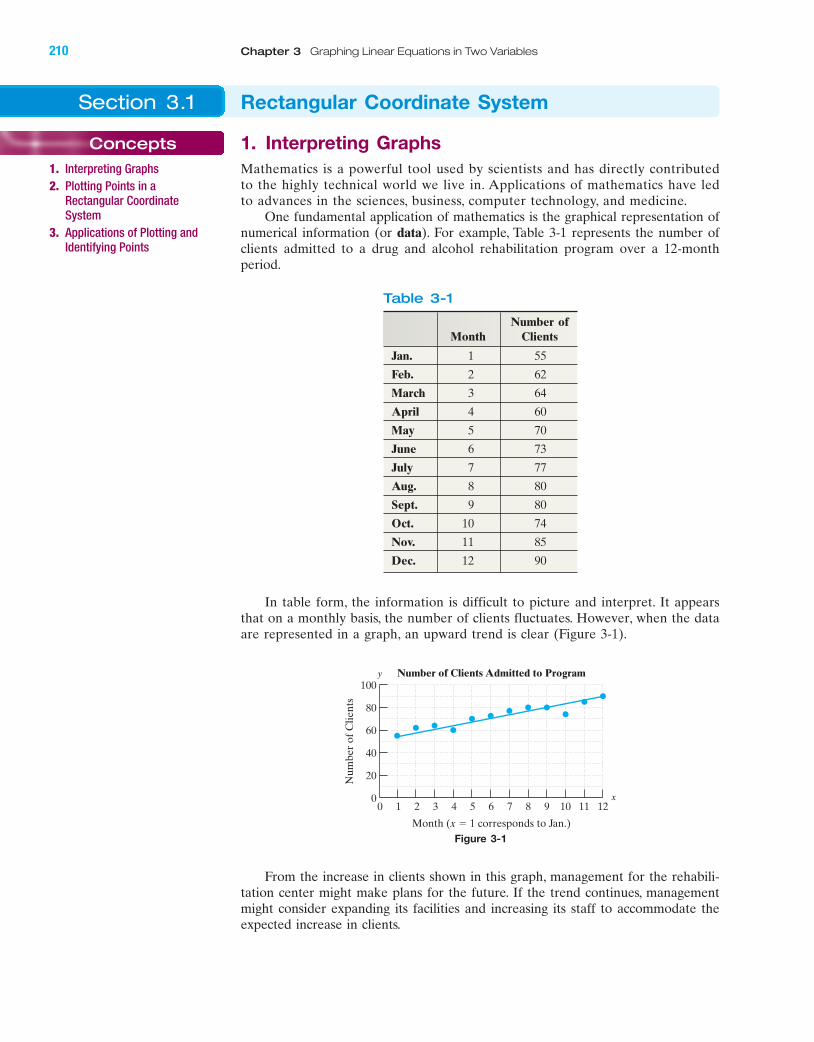
2. Plotting Points in a Rectangular Coordinate SystemIn Example 1, two variables are represented, time and the number of clients. Topicture two variables, we use a graph with two number lines drawn at right anglesto each other (Figure 3-2). This forms a rectangular coordinate system. The hori-zontal line is called the x-axis, and the vertical line is called the y-axis. The pointwhere the lines intersect is called the origin. On the x-axis, the numbers to theright of the origin are positive and the numbers to the left are negative. On they-axis, the numbers above the origin are positive and the numbers below are neg-ative. The x- and y-axes divide the graphing area into four regions called quadrants.
Figure 3-2
�5�6�7 �4
�4
�3
�2
�5
�6�7
2
3
4
5
6
7
�1�2 �1�3
y-axis
1
3 4 5 6 71 2
Quadrant I
Origin
Quadrant II
Quadrant III Quadrant IV
0
x-axis
Skill Practice Answers
1a. 74b. Month 5, Mayc. 35d. Month 1, January
miL28711_ch03_209-296 9/26/06 07:30 AM Page 211CONFIRMING PAGES
212 Chapter 3 Graphing Linear Equations in Two Variables
BA
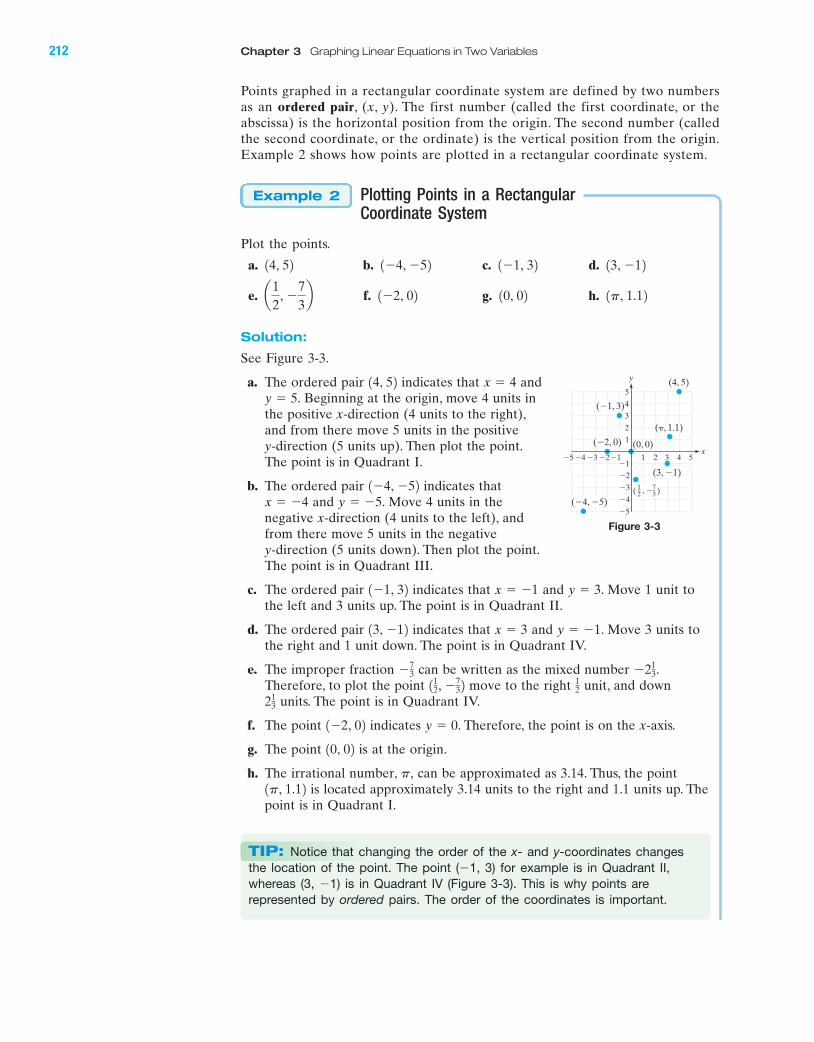
Points graphed in a rectangular coordinate system are defined by two numbersas an ordered pair, (x, y). The first number (called the first coordinate, or theabscissa) is the horizontal position from the origin. The second number (calledthe second coordinate, or the ordinate) is the vertical position from the origin.Example 2 shows how points are plotted in a rectangular coordinate system.
Plotting Points in a Rectangular Coordinate System
Plot the points.
a. b. c. d.
e. f. g. h.
Solution:
See Figure 3-3.
a. The ordered pair indicates that and. Beginning at the origin, move 4 units in
the positive x-direction (4 units to the right),and from there move 5 units in the positivey-direction (5 units up). Then plot the point.The point is in Quadrant I.
b. The ordered pair indicates thatand . Move 4 units in the
negative x-direction (4 units to the left), andfrom there move 5 units in the negativey-direction (5 units down). Then plot the point.The point is in Quadrant III.
c. The ordered pair indicates that and . Move 1 unit tothe left and 3 units up. The point is in Quadrant II.
d. The ordered pair indicates that and . Move 3 units tothe right and 1 unit down. The point is in Quadrant IV.
e. The improper fraction can be written as the mixed number .Therefore, to plot the point move to the right unit, and down
units. The point is in Quadrant IV.
f. The point indicates . Therefore, the point is on the x-axis.
g. The point is at the origin.
h. The irrational number, can be approximated as 3.14. Thus, the pointis located approximately 3.14 units to the right and 1.1 units up. The
point is in Quadrant I.1p, 1.12
p,
10, 02
y � 01�2, 02
213
12112, �
73 2
�213�7
3
y � �1x � 313, �12
y � 3x � �11�1, 32
y � �5x � �41�4, �52
y � 5x � 414, 52
1p, 1.1210, 021�2, 02a12
, �73b
13, �121�1, 321�4, �5214, 52
Example 2
�2�5 �4
�4
�3
�2
�5
2
3
4
5
�1�1�3
1
3 4 51 2
y
x
(4, 5)
(�4, �5)
(�2, 0)
(�1, 3)
(3, �1)
( , � )12
73
(0, 0)
(�, 1.1)
Figure 3-3
TIP: Notice that changing the order of the x- and y-coordinates changesthe location of the point. The point (�1, 3) for example is in Quadrant II,whereas (3, �1) is in Quadrant IV (Figure 3-3). This is why points arerepresented by ordered pairs. The order of the coordinates is important.
miL28711_ch03_209-296 9/26/06 07:31 AM Page 212CONFIRMING PAGES
Section 3.1 Rectangular Coordinate System 213
BA
2. Plot the points.
A(3, 4) B(�2, 2) C(4, 0) D E(�5, �2)
The effective use of graphs for mathematical models requires skill in identify-ing points and interpreting graphs.
Identifying Points
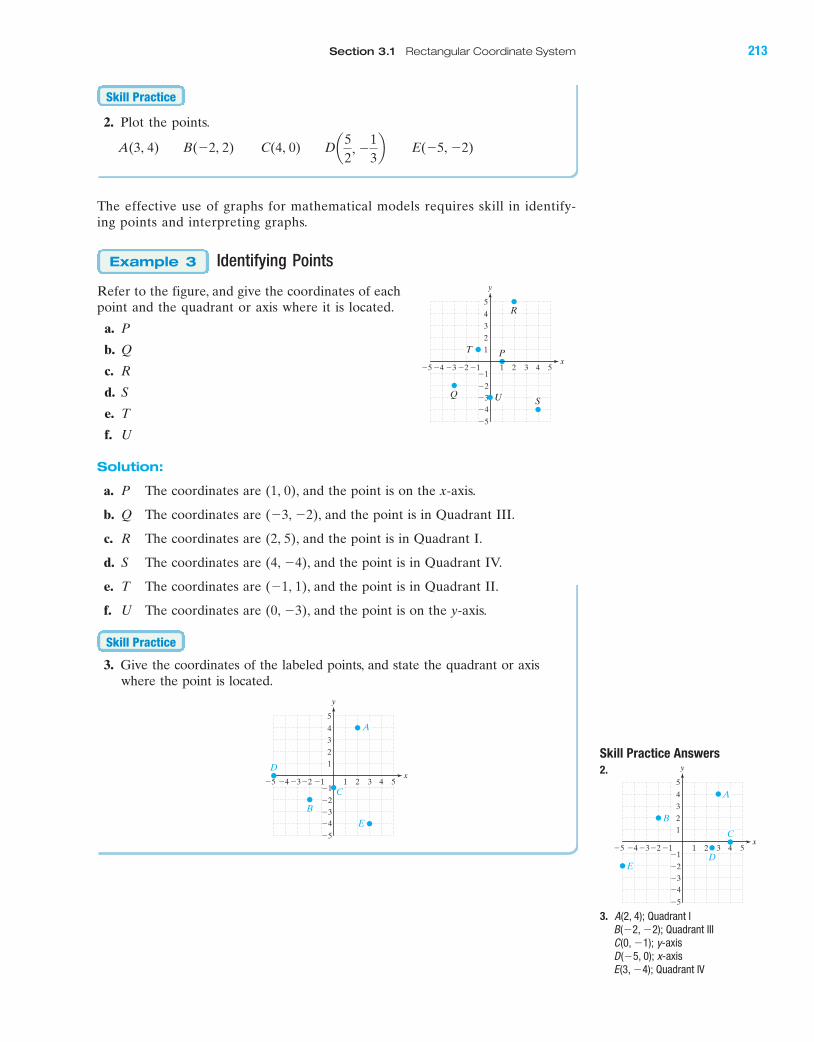
Refer to the figure, and give the coordinates of eachpoint and the quadrant or axis where it is located.
a. P
b. Q
c. R
d. S
e. T
f. U
Solution:
a. P The coordinates are (1, 0), and the point is on the x-axis.
b. Q The coordinates are (�3, �2), and the point is in Quadrant III.
c. R The coordinates are (2, 5), and the point is in Quadrant I.
d. S The coordinates are (4, �4), and the point is in Quadrant IV.
e. T The coordinates are (�1, 1), and the point is in Quadrant II.
f. U The coordinates are (0, �3), and the point is on the y-axis.
3. Give the coordinates of the labeled points, and state the quadrant or axiswhere the point is located.
4 5�4�5 �3 1 2 3
�2�3�4
�5
21
4
5
3
�1�2
A
B
E
y
x
C�1
D
Skill Practice
Example 3
a52
, �13b
Skill Practice
4 5�4�5 �3 1 2 3�1
�2�3�4
�5
21
4
5
3
�1�2
y
xPT
UQS
R
Skill Practice Answers
2.
3. A(2, 4); Quadrant IB(�2, �2); Quadrant IIIC(0, �1); y-axisD(�5, 0); x-axisE(3, �4); Quadrant IV
4 5�4�5 �3 1 2 3�1
�2�3�4
�5
21
4
5
3
�1�2
A
D
B
E
y
xC
miL28711_ch03_209-296 9/26/06 07:31 AM Page 213CONFIRMING PAGES
214 Chapter 3 Graphing Linear Equations in Two Variables
BA
3. Applications of Plotting and Identifying Points
Plotting Points in an Application
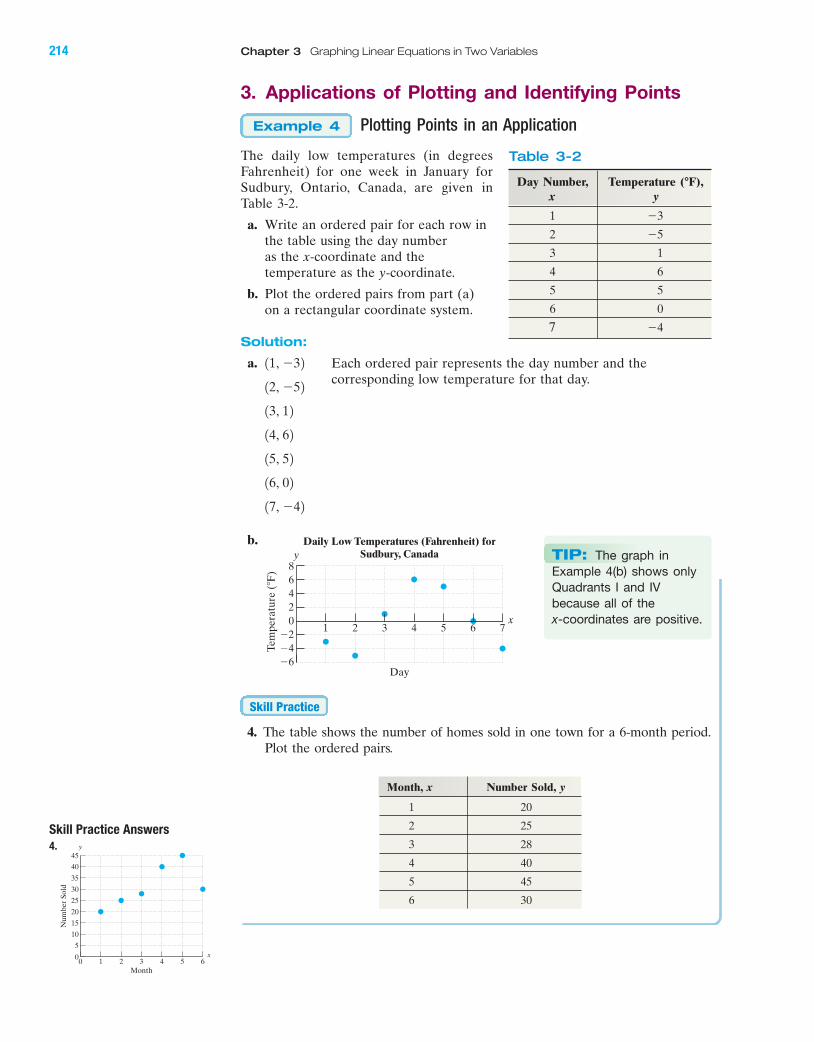
The daily low temperatures (in degreesFahrenheit) for one week in January forSudbury, Ontario, Canada, are given inTable 3-2.
a. Write an ordered pair for each row inthe table using the day number as the x-coordinate and thetemperature as the y-coordinate.
b. Plot the ordered pairs from part (a)on a rectangular coordinate system.
Solution:
a.
b.
4. The table shows the number of homes sold in one town for a 6-month period.Plot the ordered pairs.
Skill Practice
Daily Low Temperatures (Fahrenheit) forSudbury, Canada
86
1 2 6543 7
Tem
pera
ture
(�F
)
Day
42
�2�4�6
0
y
x
17, �42
16, 02
15, 52
14, 62
13, 12
12, �52
11, �32
Example 4
Skill Practice Answers
4.
0210 3 4 5 6
Num
ber
Sold
Month
25
30
35
40
45
5
10
15
20
y
x
Day Number, Temperature (�F),x y
1
2
3 1
4 6
5 5
6 0
7 �4
�5
�3
TIP: The graph inExample 4(b) shows onlyQuadrants I and IVbecause all of thex-coordinates are positive.
Month, x Number Sold, y
1 20
2 25
3 28
4 40
5 45
6 30
Each ordered pair represents the day number and thecorresponding low temperature for that day.
Table 3-2
miL28711_ch03_209-296 9/26/06 07:31 AM Page 214CONFIRMING PAGES
Section 3.1 Rectangular Coordinate System 215
BA
Determining Points from a Graph
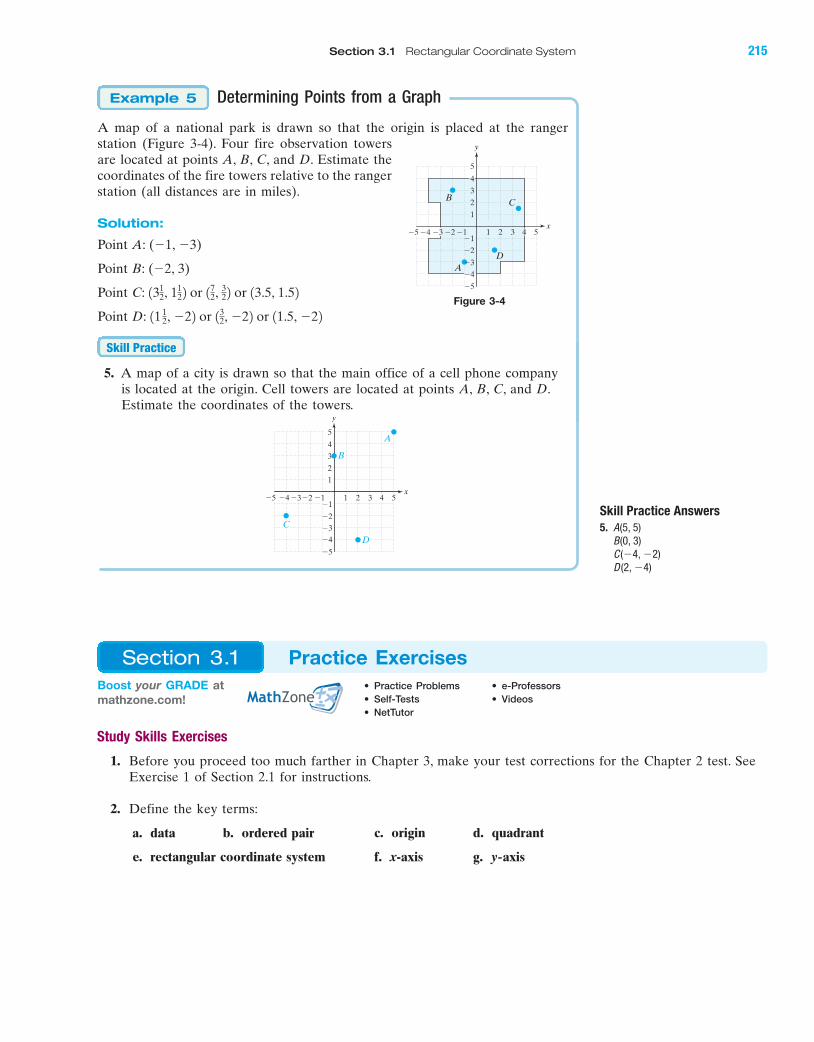
A map of a national park is drawn so that the origin is placed at the rangerstation (Figure 3-4). Four fire observation towersare located at points A, B, C, and D. Estimate thecoordinates of the fire towers relative to the rangerstation (all distances are in miles).
Solution:
Point A: (�1, �3)
Point B: (�2, 3)
Point C:
Point D:
5. A map of a city is drawn so that the main office of a cell phone companyis located at the origin. Cell towers are located at points A, B, C, and D.Estimate the coordinates of the towers.
4 5�4�5 �3 1 2 3�1
�2�3�4
�5
21
4
5
3
�1�2
A
B
y
x
C
D
Skill Practice
1112, �22 or 132, �22 or 11.5, �22
1312, 1
12 2 or 172,
32 2 or 13.5, 1.52
Example 5
4 521 3�1
�2
�3
2
1
B
A
y
x
3
4
5
�4
�5
�4�5 �3 �1�2
C
D
Figure 3-4
Skill Practice Answers
5. A(5, 5)B(0, 3)C (�4, �2)D (2, �4)
Study Skills Exercises
1. Before you proceed too much farther in Chapter 3, make your test corrections for the Chapter 2 test. SeeExercise 1 of Section 2.1 for instructions.
2. Define the key terms:
a. data b. ordered pair c. origin d. quadrant
e. rectangular coordinate system f. x-axis g. y-axis
Boost your GRADE atmathzone.com!
• Practice Problems • e-Professors
• Self-Tests • Videos
• NetTutor
Section 3.1 Practice Exercises
miL28711_ch03_209-296 9/26/06 07:31 AM Page 215CONFIRMING PAGES
216 Chapter 3 Graphing Linear Equations in Two Variables
BA
Concept 1: Interpreting Graphs
For Exercises 3–6, refer to the graphs to answer the questions.
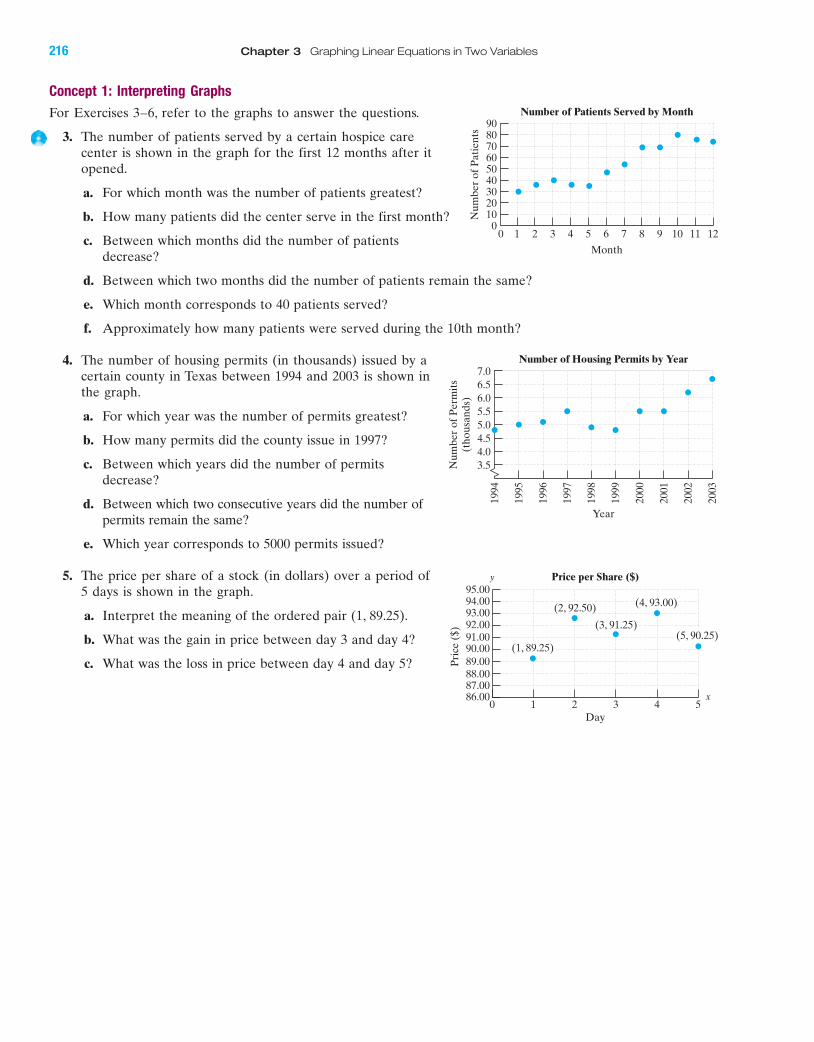
3. The number of patients served by a certain hospice carecenter is shown in the graph for the first 12 months after itopened.
a. For which month was the number of patients greatest?
b. How many patients did the center serve in the first month?
c. Between which months did the number of patientsdecrease?
d. Between which two months did the number of patients remain the same?
e. Which month corresponds to 40 patients served?
f. Approximately how many patients were served during the 10th month?
4. The number of housing permits (in thousands) issued by acertain county in Texas between 1994 and 2003 is shown inthe graph.
a. For which year was the number of permits greatest?
b. How many permits did the county issue in 1997?
c. Between which years did the number of permitsdecrease?
d. Between which two consecutive years did the number ofpermits remain the same?
e. Which year corresponds to 5000 permits issued?
5. The price per share of a stock (in dollars) over a period of5 days is shown in the graph.
a. Interpret the meaning of the ordered pair (1, 89.25).
b. What was the gain in price between day 3 and day 4?
c. What was the loss in price between day 4 and day 5?
0 1 2 3 4 5 6 7 8 9 10 11 12
Num
ber
of P
atie
nts
Number of Patients Served by Month
0102030405060708090
Month
3.54.04.55.05.56.06.57.0
1994
1995
1996
1997
Year
Num
ber
of P
erm
its
(tho
usan
ds)
Number of Housing Permits by Year
1998
1999
2000
2001
2002
2003
93.0094.0095.00
0 1 2 3 4 5
Pri
ce (
$)
Day
Price per Share ($)
90.0091.0092.00
89.0088.00
86.0087.00
y
x
(1, 89.25)
(2, 92.50)
(3, 91.25)
(4, 93.00)
(5, 90.25)
miL28711_ch03_209-296 9/26/06 07:31 AM Page 216CONFIRMING PAGES
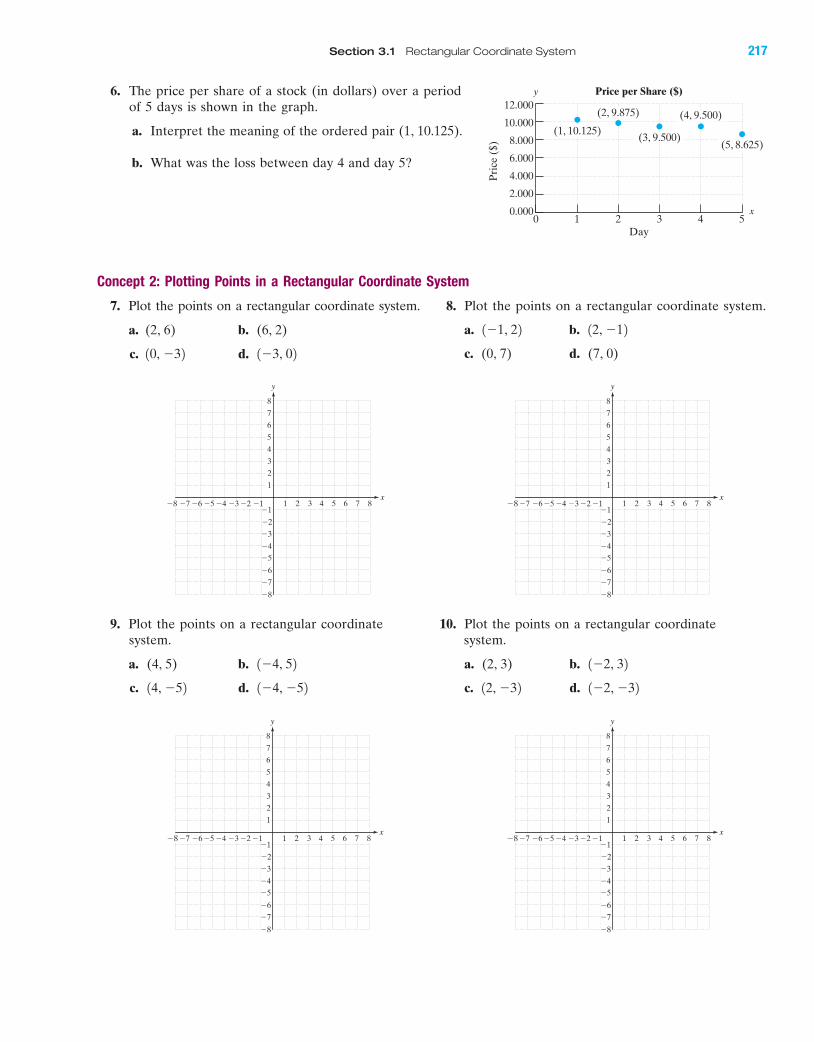
6. The price per share of a stock (in dollars) over a periodof 5 days is shown in the graph.
a. Interpret the meaning of the ordered pair (1, 10.125).
b. What was the loss between day 4 and day 5?
Concept 2: Plotting Points in a Rectangular Coordinate System
7. Plot the points on a rectangular coordinate system. 8. Plot the points on a rectangular coordinate system.
a. (2, 6) b. (6, 2)
c. d. 1�3, 0210, �32
0 1 2 3 4 5
Pri
ce (
$)
Day
Price per Share ($)
8.000
10.000
12.000
6.000
4.000
0.000
2.000
y
x
(1, 10.125)
(2, 9.875)
(3, 9.500)
(4, 9.500)
(5, 8.625)
4 5 6 7 8�4�5�6�7�8 �3 1 2 3
�2
�3
�4�5
�6
�7
�8
4
5
6
7
8
�1�1�2
y
x
3
2
1
4 5 6 7 8�4�5�6�7�8 �3 1 2 3
�2
�3
�4�5
�6
�7
�8
4
5
6
7
8
�1�1�2
y
x
3
2
1
a. b.
c. (0, 7) d. (7, 0)
12, �121�1, 22
9. Plot the points on a rectangular coordinate 10. Plot the points on a rectangular coordinate system. system.
a. (4, 5) b. a. (2, 3) b.
c. d. c. d. 1�2, �3212, �321�4, �5214, �52
1�2, 321�4, 52
4 5 6 7 8�4�5�6�7�8 �3 1 2 3
�2
�3
�4�5
�6
�7
�8
4
5
6
7
8
�1�1�2
y
x
3
2
1
4 5 6 7 8�4�5�6�7�8 �3 1 2 3
�2
�3
�4�5
�6
�7
�8
4
5
6
7
8
�1�1�2
y
x
3
2
1
BA
Section 3.1 Rectangular Coordinate System 217
miL28711_ch03_209-296 9/26/06 07:31 AM Page 217CONFIRMING PAGES
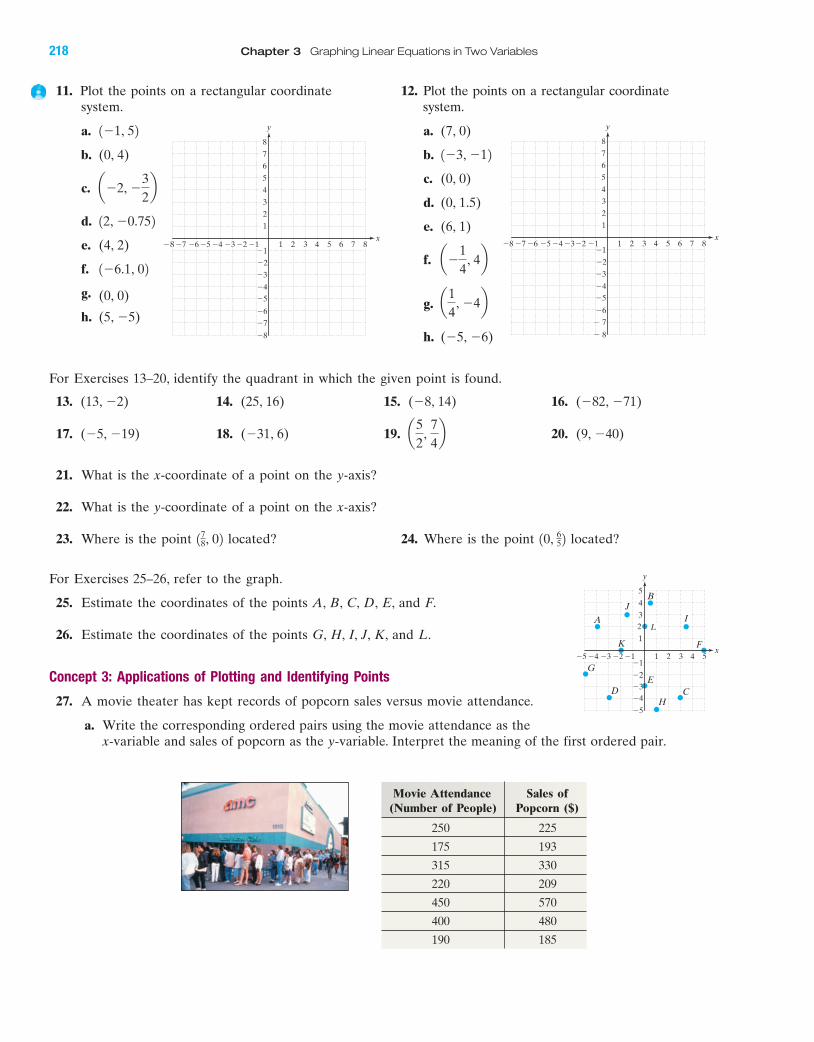
11. Plot the points on a rectangular coordinatesystem.
a.
b. (0, 4)
c.
d.
e. (4, 2)
f.
g. (0, 0)
h. (5, �5)
1�6.1, 02
12, �0.752
a�2, �32b
1�1, 52
Movie Attendance Sales of(Number of People) Popcorn ($)
250 225
175 193
315 330
220 209
450 570
400 480
190 185
For Exercises 13–20, identify the quadrant in which the given point is found.
13. (13, �2) 14. (25, 16) 15. (�8, 14) 16. (�82, �71)
17. (�5, �19) 18. (�31, 6) 19. 20. (9, �40)
21. What is the x-coordinate of a point on the y-axis?
22. What is the y-coordinate of a point on the x-axis?
23. Where is the point located? 24. Where is the point located?
For Exercises 25–26, refer to the graph.
25. Estimate the coordinates of the points A, B, C, D, E, and F.
26. Estimate the coordinates of the points G, H, I, J, K, and L.
Concept 3: Applications of Plotting and Identifying Points
27. A movie theater has kept records of popcorn sales versus movie attendance.
a. Write the corresponding ordered pairs using the movie attendance as thex-variable and sales of popcorn as the y-variable. Interpret the meaning of the first ordered pair.
10, 65 2178, 02
a52
, 74b
4 5 6 7 8�4�5�6�7�8 �3 1 3
�2
�3
�4�5
�6
�7
�8
4
5
6
7
8
�1�1�2
y
x
3
2
1
2
G
DE
HC
F
BJ
K
A I
5�4�5 �3 1 2 3�1
�2�3�4
�5
1
2
4
5
3
�1�2
y
x4
L
BA
218 Chapter 3 Graphing Linear Equations in Two Variables
12. Plot the points on a rectangular coordinate system.
a. (7, 0)
b.
c. (0, 0)
d. (0, 1.5)
e. (6, 1)
f.
g.
h. (�5, �6)
a14
, �4b
a�14
, 4b
1�3, �12
4 5 6 8�4�5�6�7�8 �3 1 2 3
�2
�3
�4�5
�6
� 7
� 8
5
6
7
8
�1�1�2
y
x
3
2
1
7
4
miL28711_ch03_209-296 9/26/06 07:31 AM Page 218CONFIRMING PAGES
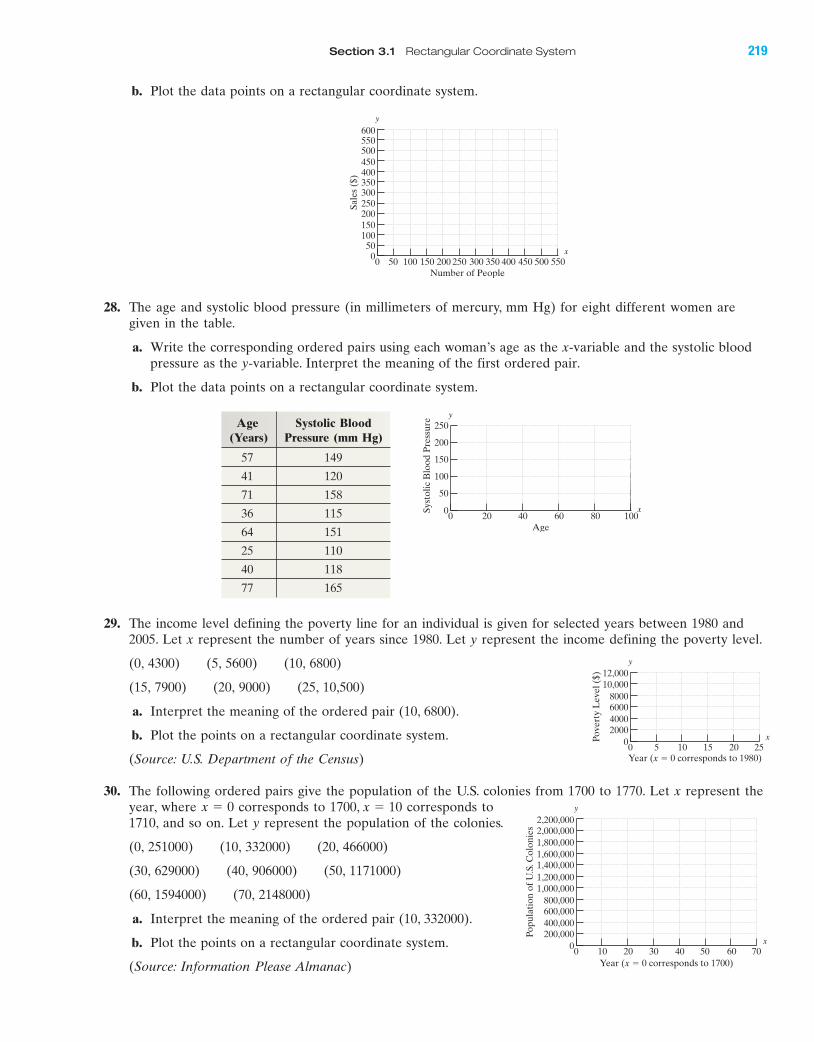
28. The age and systolic blood pressure (in millimeters of mercury, mm Hg) for eight different women aregiven in the table.
a. Write the corresponding ordered pairs using each woman’s age as the x-variable and the systolic bloodpressure as the y-variable. Interpret the meaning of the first ordered pair.
b. Plot the data points on a rectangular coordinate system.
00 50 100 150 200 250 300 350 400 450 550500
Sale
s ($
)
Number of People
250300350400450500550600
50100150200
y
x
29. The income level defining the poverty line for an individual is given for selected years between 1980 and2005. Let x represent the number of years since 1980. Let y represent the income defining the poverty level.
(0, 4300) (5, 5600) (10, 6800)
(15, 7900) (20, 9000) (25, 10,500)
a. Interpret the meaning of the ordered pair (10, 6800).
b. Plot the points on a rectangular coordinate system.
(Source: U.S. Department of the Census)
30. The following ordered pairs give the population of the U.S. colonies from 1700 to 1770. Let x represent theyear, where corresponds to corresponds to1710, and so on. Let y represent the population of the colonies.
(0, 251000) (10, 332000) (20, 466000)
(30, 629000) (40, 906000) (50, 1171000)
(60, 1594000) (70, 2148000)
a. Interpret the meaning of the ordered pair (10, 332000).
b. Plot the points on a rectangular coordinate system.
(Source: Information Please Almanac)
1700, x � 10x � 0
250
00 20 40 60 80 100
Syst
olic
Blo
od P
ress
ure
Age
200
150
100
50
y
x
Age Systolic Blood(Years) Pressure (mm Hg)
57 149
41 120
71 158
36 115
64 151
25 110
40 118
77 165
00 5 10 15 20 25
Pove
rty
Lev
el (
$)
Year (x � 0 corresponds to 1980)
10,00012,000
2000400060008000
y
x
00 10 20 30 40 50 60 70
Popu
lati
on o
f U.S
. Col
onie
s
Year (x � 0 corresponds to 1700)
1,000,0001,200,0001,400,0001,600,0001,800,0002,000,0002,200,000
200,000400,000600,000800,000
y
x
BA
b. Plot the data points on a rectangular coordinate system.
Section 3.1 Rectangular Coordinate System 219
miL28711_ch03_209-296 9/26/06 07:31 AM Page 219CONFIRMING PAGES
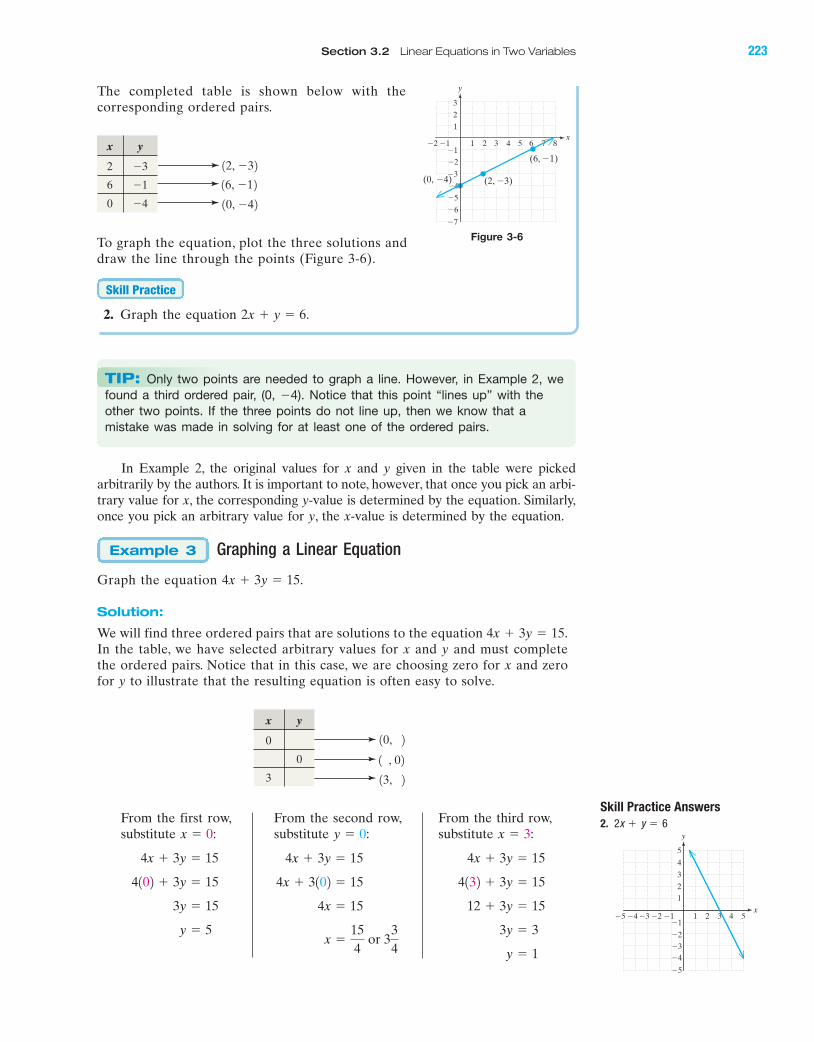
34. A townhouse has a sprinkler system in the backyard. With the water source at the origin,the sprinkler heads are located at points A, B, C, D, and E. All distances are in feet.
a. Estimate the coordinates of each sprinkler head.
b. How far is the distance from sprinkler head B to C?
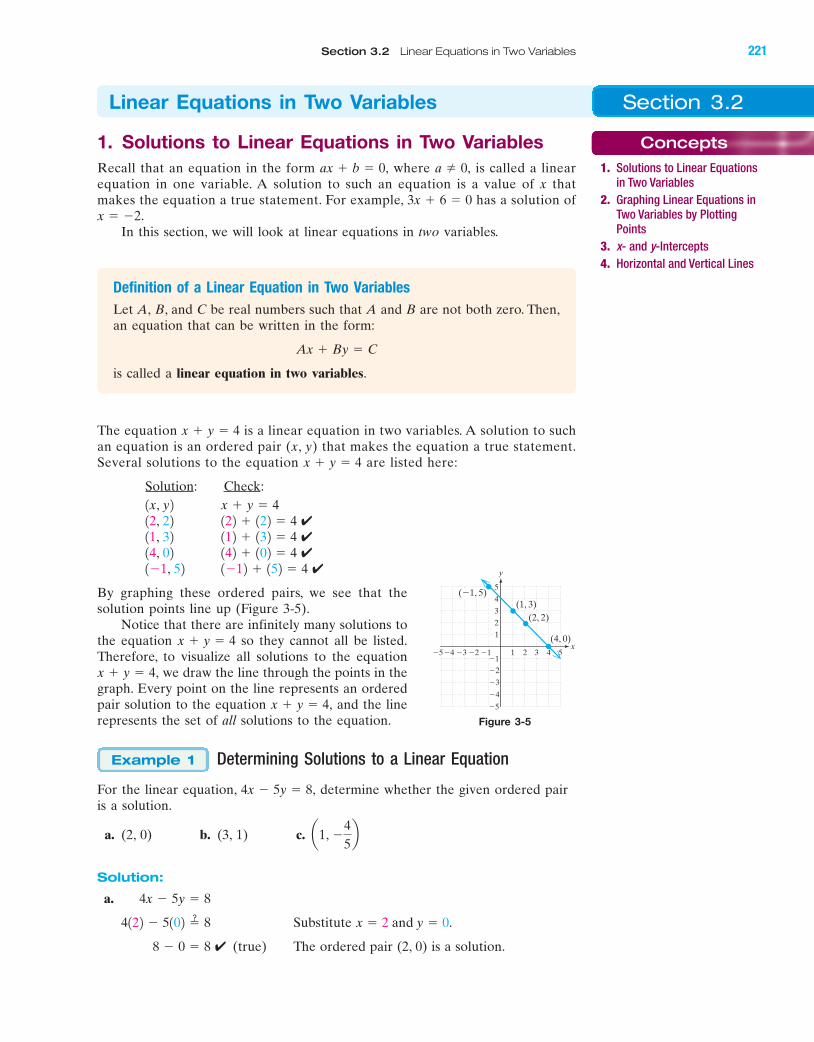
32. The table shows the average temperature in degrees Fahrenheit forFairbanks, Alaska, by month.
a. Write the corresponding ordered pairs, letting correspond to themonth of January.
b. Plot the ordered pairs on a rectangular coordinate system.
x � 1
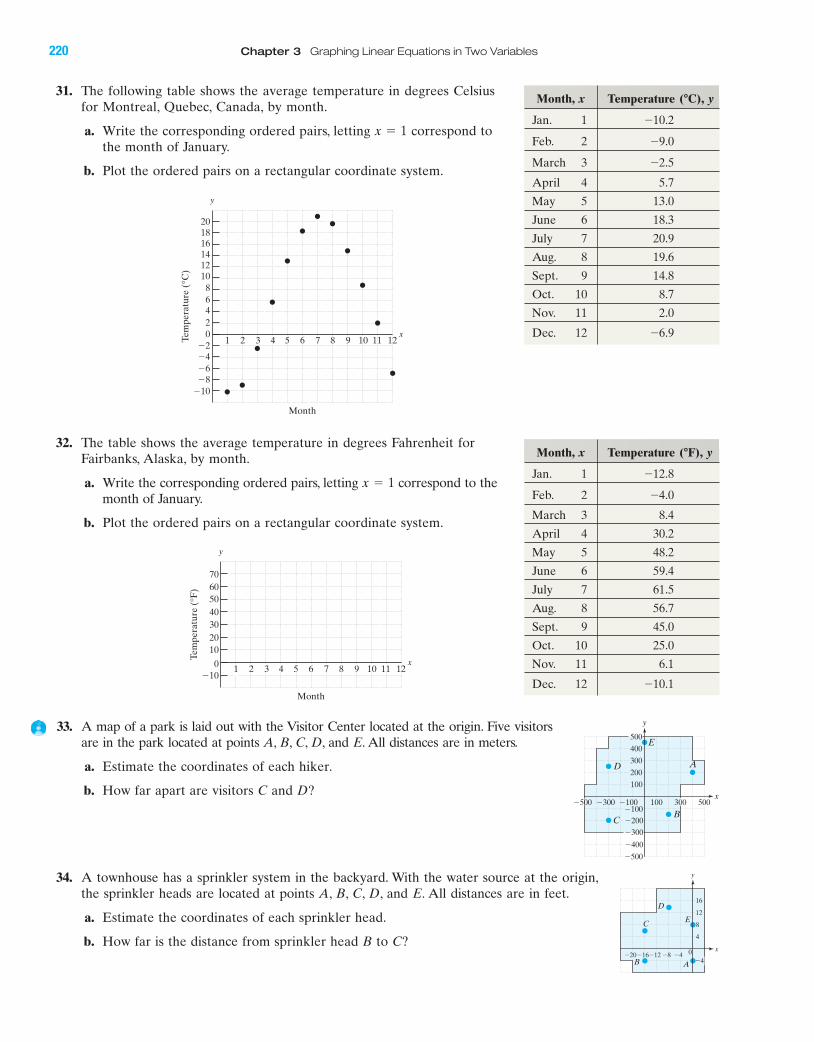
31. The following table shows the average temperature in degrees Celsiusfor Montreal, Quebec, Canada, by month.
a. Write the corresponding ordered pairs, letting correspond tothe month of January.
b. Plot the ordered pairs on a rectangular coordinate system.
x � 1
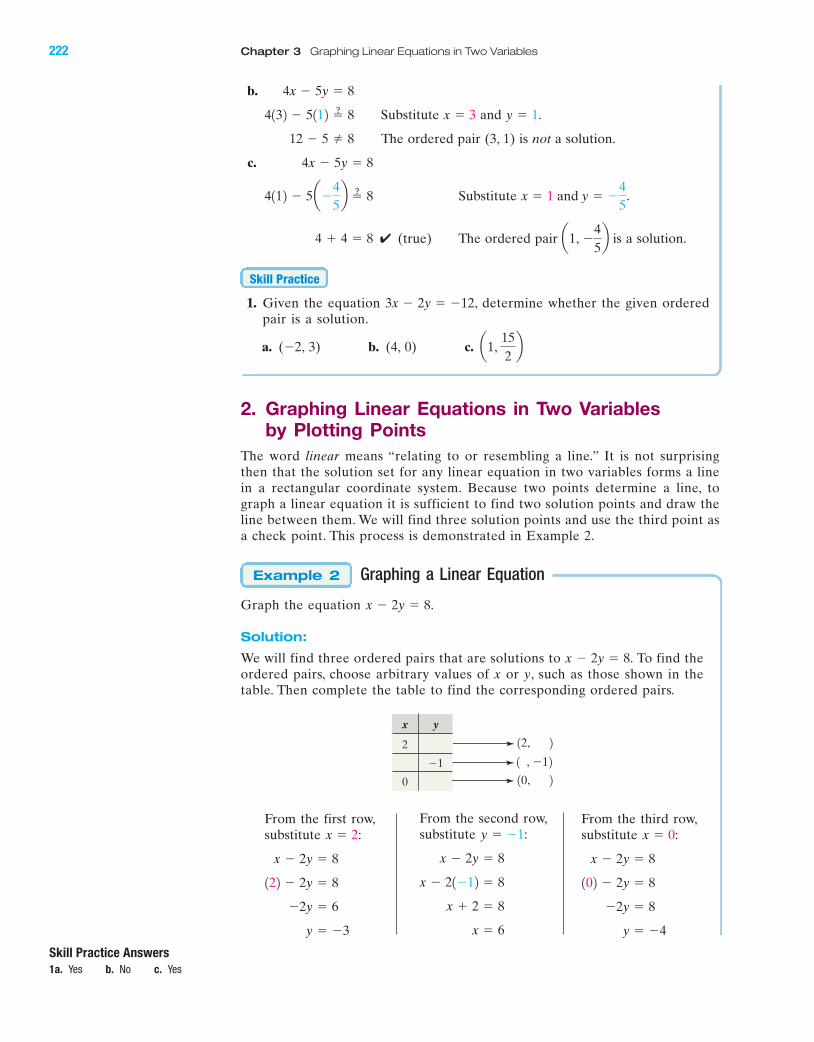
33. A map of a park is laid out with the Visitor Center located at the origin. Five visitorsare in the park located at points A, B, C, D, and E. All distances are in meters.
a. Estimate the coordinates of each hiker.
b. How far apart are visitors C and D?
Month, x Temperature (�C), y
Jan. 1
Feb. 2
March 3
April 4 5.7
May 5 13.0
June 6 18.3
July 7 20.9
Aug. 8 19.6
Sept. 9 14.8
Oct. 10 8.7
Nov. 11 2.0
Dec. 12 �6.9
�2.5
�9.0
�10.2
3
�10
1 2 4 5 6 7 8 9 10 11 12Tem
pera
ture
(°C
)
Month
2468
101214161820
�8�6�4�2
0
y
x
Month, x Temperature (�F), y
Jan. 1
Feb. 2
March 3 8.4
April 4 30.2
May 5 48.2
June 6 59.4
July 7 61.5
Aug. 8 56.7
Sept. 9 45.0
Oct. 10 25.0
Nov. 11 6.1
Dec. 12 �10.1
�4.0
�12.8
D
EC
y
x�20�16�12 �8 �4 0
16
12
8
4
�4B A
12
Tem
pera
ture
(°F
)
Month
10203040506070
�100
y
x2 3 4 5 6 7 8 9 10 111
�500
�200
200
300
400
�100�100�300
100
500100x
B
A
E
D
C
�500
�400
�300
300
500
y
BA
220 Chapter 3 Graphing Linear Equations in Two Variables
miL28711_ch03_209-296 9/26/06 08:57 PM Page 220CONFIRMING PAGES
Section 3.2 Linear Equations in Two Variables 221
BA
Section 3.2Linear Equations in Two Variables
Concepts
1. Solutions to Linear Equationsin Two Variables
2. Graphing Linear Equations inTwo Variables by PlottingPoints
3. x- and y-Intercepts4. Horizontal and Vertical Lines
1. Solutions to Linear Equations in Two VariablesRecall that an equation in the form where is called a linearequation in one variable. A solution to such an equation is a value of x thatmakes the equation a true statement. For example, has a solution of
In this section, we will look at linear equations in two variables.x � �2.
3x � 6 � 0
a � 0,ax � b � 0,
The equation is a linear equation in two variables. A solution to suchan equation is an ordered pair (x, y) that makes the equation a true statement.Several solutions to the equation are listed here:
Solution: Check:
✔✔✔
✔
By graphing these ordered pairs, we see that thesolution points line up (Figure 3-5).
Notice that there are infinitely many solutions tothe equation so they cannot all be listed.Therefore, to visualize all solutions to the equation
we draw the line through the points in thegraph. Every point on the line represents an orderedpair solution to the equation and the linerepresents the set of all solutions to the equation.
Determining Solutions to a Linear Equation
For the linear equation, determine whether the given ordered pairis a solution.
a. (2, 0) b. (3, 1) c.
Solution:
a.
Substitute
✔ (true) The ordered pair (2, 0) is a solution. 8 � 0 � 8
x � 2 and y � 0. 4122 � 5102 � 8
4x � 5y � 8
a1, �45b
4x � 5y � 8,
Example 1
x � y � 4,
x � y � 4,
x � y � 4
1�12 � 152 � 41�1, 52142 � 102 � 414, 02112 � 132 � 411, 32122 � 122 � 412, 22x � y � 41x, y2
x � y � 4
x � y � 4
Definition of a Linear Equation in Two Variables
Let A, B, and C be real numbers such that A and B are not both zero. Then,an equation that can be written in the form:
is called a linear equation in two variables.
Ax � By � C
5
(4, 0)�5�4
�4
�3
�2
�5
2
3
4
�1�2 �1�3
1
3 41 2
(�1, 5)(1, 3)
(2, 2)
5
y
x
Figure 3-5
miL28711_ch03_209-296 9/26/06 07:31 AM Page 221CONFIRMING PAGES
BA
222 Chapter 3 Graphing Linear Equations in Two Variables
b.
Substitute and
The ordered pair (3, 1) is not a solution.
c.
Substitute
✔ (true) The ordered pair is a solution.
1. Given the equation , determine whether the given orderedpair is a solution.
a. (�2, 3) b. (4, 0) c.
2. Graphing Linear Equations in Two Variables by Plotting Points
The word linear means “relating to or resembling a line.” It is not surprisingthen that the solution set for any linear equation in two variables forms a linein a rectangular coordinate system. Because two points determine a line, tograph a linear equation it is sufficient to find two solution points and draw theline between them. We will find three solution points and use the third point asa check point. This process is demonstrated in Example 2.
Graphing a Linear Equation
Graph the equation
Solution:
We will find three ordered pairs that are solutions to To find theordered pairs, choose arbitrary values of x or y, such as those shown in thetable. Then complete the table to find the corresponding ordered pairs.
x � 2y � 8.
x � 2y � 8.
Example 2
a1, 152b
3x � 2y � �12
Skill Practice
a1, �45b 4 � 4 � 8
x � 1 and y � �45
. 4112 � 5 a�45b � 8
4x � 5y � 8
12 � 5 � 8
y � 1.x � 3 4132 � 5112 � 8
4x � 5y � 8
12, 2
1 , �12
10, 2
x y
2
�1
0
From the first row,substitute
y � �3
�2y � 6
122 � 2y � 8
x � 2y � 8
x � 2:From the second row,substitute
x � 6
x � 2 � 8
x � 21�12 � 8
x � 2y � 8
y � �1:From the third row,substitute
y � �4
�2y � 8
102 � 2y � 8
x � 2y � 8
x � 0:
Skill Practice Answers
1a. Yes b. No c. Yes
miL28711_ch03_209-296 9/26/06 07:31 AM Page 222CONFIRMING PAGES
BA
Section 3.2 Linear Equations in Two Variables 223
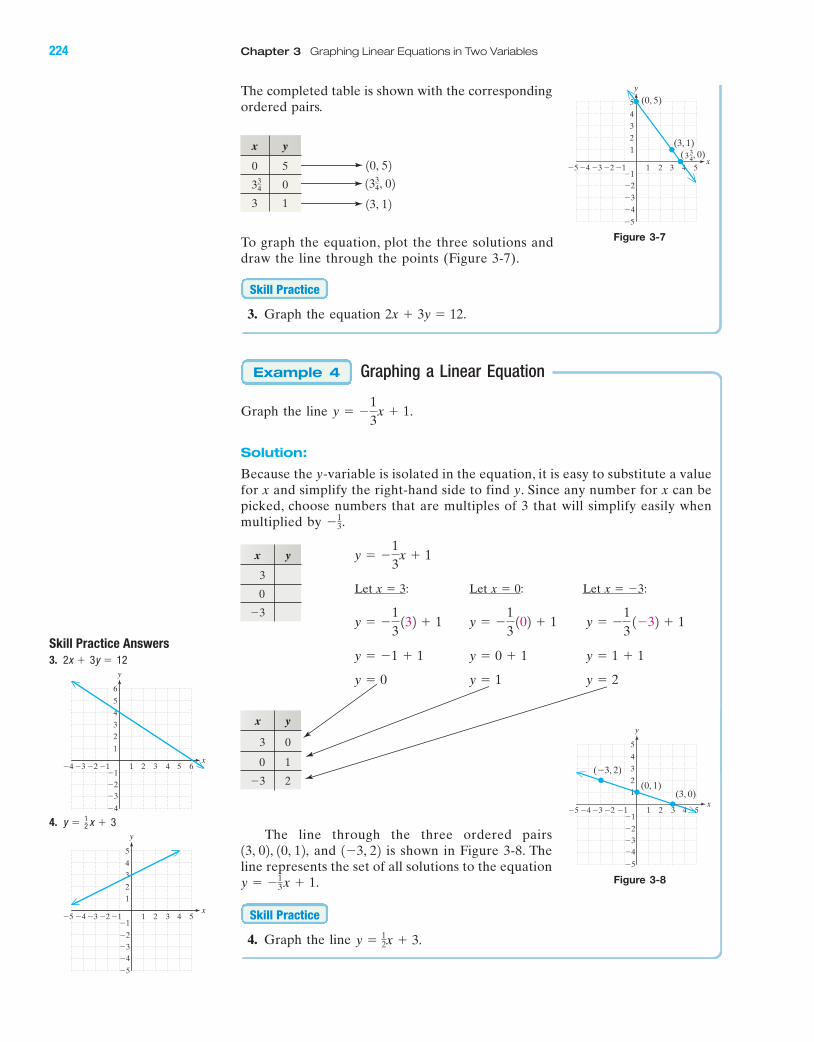
The completed table is shown below with thecorresponding ordered pairs.
y � 1
3y � 3
12 � 3y � 15
4132 � 3y � 15
4x � 3y � 15
y � 5
3y � 15
4102 � 3y � 15
4x � 3y � 15
x �154
or 334
4x � 15
4x � 3102 � 15
4x � 3y � 15
12, �32
16, �12
10, �42
x y
2 �3
6 �1
0 �4
10, 2
1 , 02
13, 2
x y
0
0
3
To graph the equation, plot the three solutions anddraw the line through the points (Figure 3-6).
2. Graph the equation 2x � y � 6.
Skill Practice
�4
�6
�5
�7
2
3
�3
�2�1
�2 �1
1
3 4 5 6 71 2
y
x
(0, �4) (2, �3)
(6, �1)
8
In Example 2, the original values for x and y given in the table were pickedarbitrarily by the authors. It is important to note, however, that once you pick an arbi-trary value for x, the corresponding y-value is determined by the equation. Similarly,once you pick an arbitrary value for y, the x-value is determined by the equation.
Graphing a Linear Equation
Graph the equation
Solution:
We will find three ordered pairs that are solutions to the equation In the table, we have selected arbitrary values for x and y and must completethe ordered pairs. Notice that in this case, we are choosing zero for x and zerofor y to illustrate that the resulting equation is often easy to solve.
4x � 3y � 15.
4x � 3y � 15.
Example 3
From the first row, From the second row, From the third row,substitute substitute substitute x � 3:y � 0:x � 0:
Figure 3-6
Skill Practice Answers
2. 2x � y � 6
TIP: Only two points are needed to graph a line. However, in Example 2, wefound a third ordered pair, (0, �4). Notice that this point “lines up” with theother two points. If the three points do not line up, then we know that amistake was made in solving for at least one of the ordered pairs.
4 5�4�5 �3 1 2 3�1
�2�3�4
�5
21
4
5
3
�1�2
y
x
miL28711_ch03_209-296 9/26/06 07:31 AM Page 223CONFIRMING PAGES
BA
224 Chapter 3 Graphing Linear Equations in Two Variables
To graph the equation, plot the three solutions anddraw the line through the points (Figure 3-7).
3. Graph the equation .
Graphing a Linear Equation
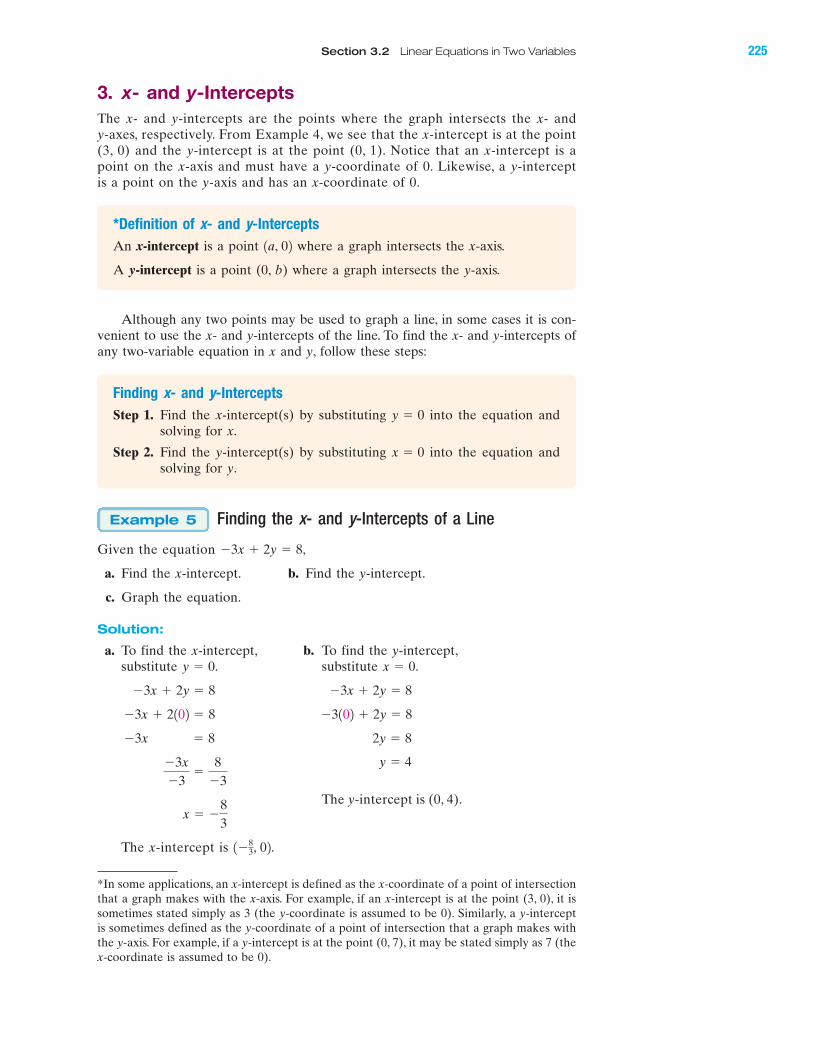
Graph the line
Solution:
Because the y-variable is isolated in the equation, it is easy to substitute a valuefor x and simplify the right-hand side to find y. Since any number for x can bepicked, choose numbers that are multiples of 3 that will simplify easily whenmultiplied by
Let x � 3: Let x � 0: Let x � �3:
The line through the three ordered pairsand is shown in Figure 3-8. The
line represents the set of all solutions to the equation
4. Graph the line y � 12x � 3.
Skill Practice
y � �13 x � 1.
1�3, 2213, 02, 10, 12,
y � 2 y � 1 y � 0
y � 1 � 1 y � 0 � 1 y � �1 � 1
y � �13
1�32 � 1 y � �13
102 � 1 y � �13
132 � 1
y � �13
x � 1
�13.
y � �13
x � 1.
Example 4
2x � 3y � 12
Skill Practice
The completed table is shown with the correspondingordered pairs.
10, 52
1334, 02
13, 12
x y
0 5
0
3 1
334
Figure 3-7
x y
3 0
0 1
2�3
4 5�4�5 �3 1 2 3�1
�2�3�4
�5
�1�2
(�3, 2)
(3, 0)(0, 1)
y
x
2
4
5
3
1
Figure 3-8
x y
3
0
�3
Skill Practice Answers
3.
4. y � 12 x � 3
2x � 3y � 12
�5�4
�4
�3
�2
�5
2
3
4
5
�1�2 �1�3
1
3 51 2x
(0, 5)
(3, 1)( , 0)33
4
y
4
5 6�3�4 �2 21 3 4�1�2�3
�4
3
2
1
5
6
4
�1
y
x
4 5�4�5 �3 1 2 3�1
�2�3�4
�5
21
4
5
3
�1�2
y
x
miL28711_ch03_209-296 9/26/06 08:57 PM Page 224CONFIRMING PAGES
BA
Section 3.2 Linear Equations in Two Variables 225
3. x- and y-InterceptsThe x- and y-intercepts are the points where the graph intersects the x- and y-axes, respectively. From Example 4, we see that the x-intercept is at the point(3, 0) and the y-intercept is at the point (0, 1). Notice that an x-intercept is apoint on the x-axis and must have a y-coordinate of 0. Likewise, a y-interceptis a point on the y-axis and has an x-coordinate of 0.
Although any two points may be used to graph a line, in some cases it is con-venient to use the x- and y-intercepts of the line. To find the x- and y-intercepts ofany two-variable equation in x and y, follow these steps:
*In some applications, an x-intercept is defined as the x-coordinate of a point of intersectionthat a graph makes with the x-axis. For example, if an x-intercept is at the point (3, 0), it issometimes stated simply as 3 (the y-coordinate is assumed to be 0). Similarly, a y-interceptis sometimes defined as the y-coordinate of a point of intersection that a graph makes withthe y-axis. For example, if a y-intercept is at the point (0, 7), it may be stated simply as 7 (thex-coordinate is assumed to be 0).
*Definition of x- and y-Intercepts
An x-intercept is a point where a graph intersects the x-axis.
A y-intercept is a point (0, b) where a graph intersects the y-axis.
1a, 02
Finding x- and y-Intercepts
Step 1. Find the x-intercept(s) by substituting into the equation andsolving for x.
Step 2. Find the y-intercept(s) by substituting into the equation andsolving for y.
x � 0
y � 0
Finding the x- and y-Intercepts of a Line
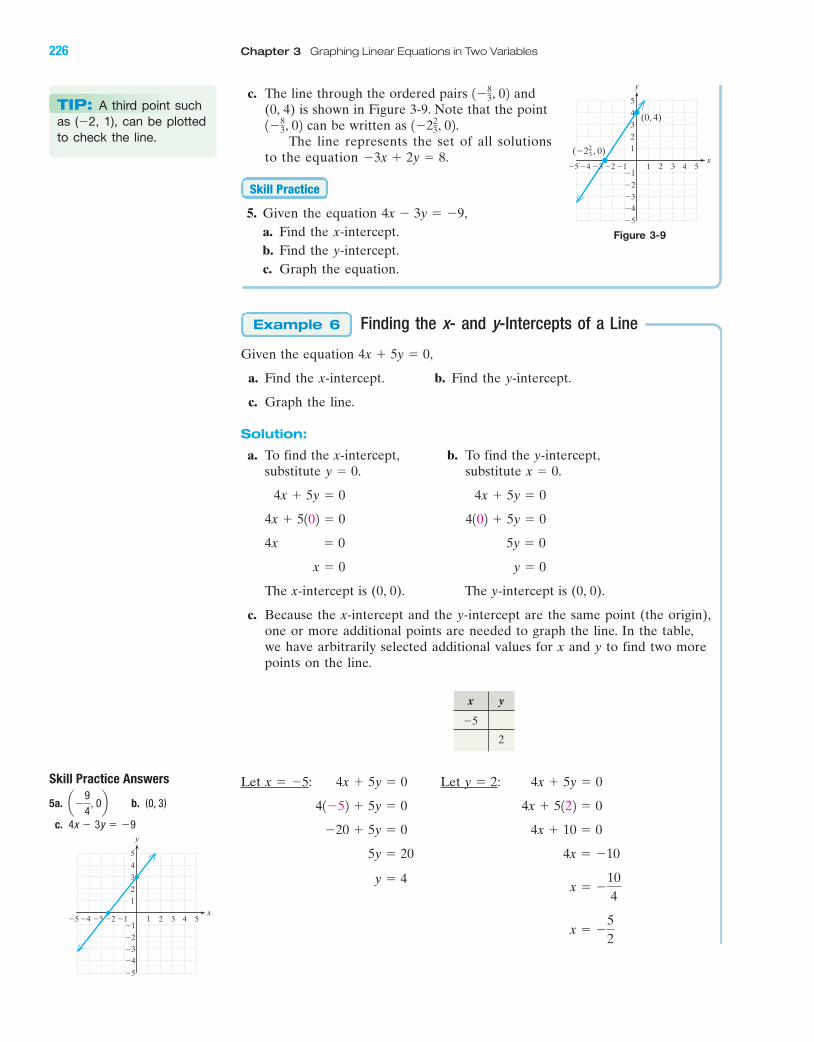
Given the equation
a. Find the x-intercept. b. Find the y-intercept.
c. Graph the equation.
Solution:
a. To find the x-intercept, b. To find the y-intercept,substitute substitute
The x-intercept is 1�83, 02.
x � �83
y � 4 �3x�3
�8
�3
2y � 8� 8�3x
�3102 � 2y � 8�3x � 2102 � 8
�3x � 2y � 8 �3x � 2y � 8
x � 0.y � 0.
�3x � 2y � 8,
Example 5
The y-intercept is (0, 4).
miL28711_ch03_209-296 9/26/06 07:31 AM Page 225CONFIRMING PAGES
BA
226 Chapter 3 Graphing Linear Equations in Two Variables
Figure 3-9
c. The line through the ordered pairs and (0, 4) is shown in Figure 3-9. Note that the point
can be written as The line represents the set of all solutions
to the equation
5. Given the equation a. Find the x-intercept.b. Find the y-intercept.c. Graph the equation.
Finding the x- and y-Intercepts of a Line
Given the equation ,
a. Find the x-intercept. b. Find the y-intercept.
c. Graph the line.
Solution:
a. To find the x-intercept, b. To find the y-intercept,substitute substitute
The x-intercept is (0, 0). The y-intercept is (0, 0).
c. Because the x-intercept and the y-intercept are the same point (the origin),one or more additional points are needed to graph the line. In the table,we have arbitrarily selected additional values for x and y to find two morepoints on the line.
y � 0 x � 0
5y � 0� 04x
4102 � 5y � 0 4x � 5102 � 0
4x � 5y � 0 4x � 5y � 0
x � 0.y � 0.
4x � 5y � 0
Example 6
4x � 3y � �9,
Skill Practice
�3x � 2y � 8.
1�223, 02.1�8
3, 02
1�83, 02
�4�5 �3�1
�2�3�4
�5
21
4
5
3
�1�2
(0, 4)
y
x(�2 , 0)2
3
1 2 3 4 5
Let x � �5: Let y � 2:
x � �52
x � �104
y � 4
4x � �10 5y � 20
4x � 10 � 0 �20 � 5y � 0
4x � 5122 � 0 41�52 � 5y � 0
4x � 5y � 04x � 5y � 0
x y
2
�5
TIP: A third point suchas (�2, 1), can be plottedto check the line.
Skill Practice Answers
5a. b. (0, 3)
c. 4x � 3y � �9
a�94
, 0b
4 5�4�5 �3 1 2 3�1
�2�3�4
�5
21
4
5
3
�1�2
y
x
miL28711_ch03_209-296 9/26/06 07:31 AM Page 226CONFIRMING PAGES
BA
Section 3.2 Linear Equations in Two Variables 227
4. Horizontal and Vertical LinesRecall that a linear equation can be written in the form where Aand B are not both zero. However, if A or B is 0, then the line is either paral-lel to the x-axis (horizontal) or parallel to the y-axis (vertical), respectively.
Ax � By � C,
Graphing a Horizontal Line
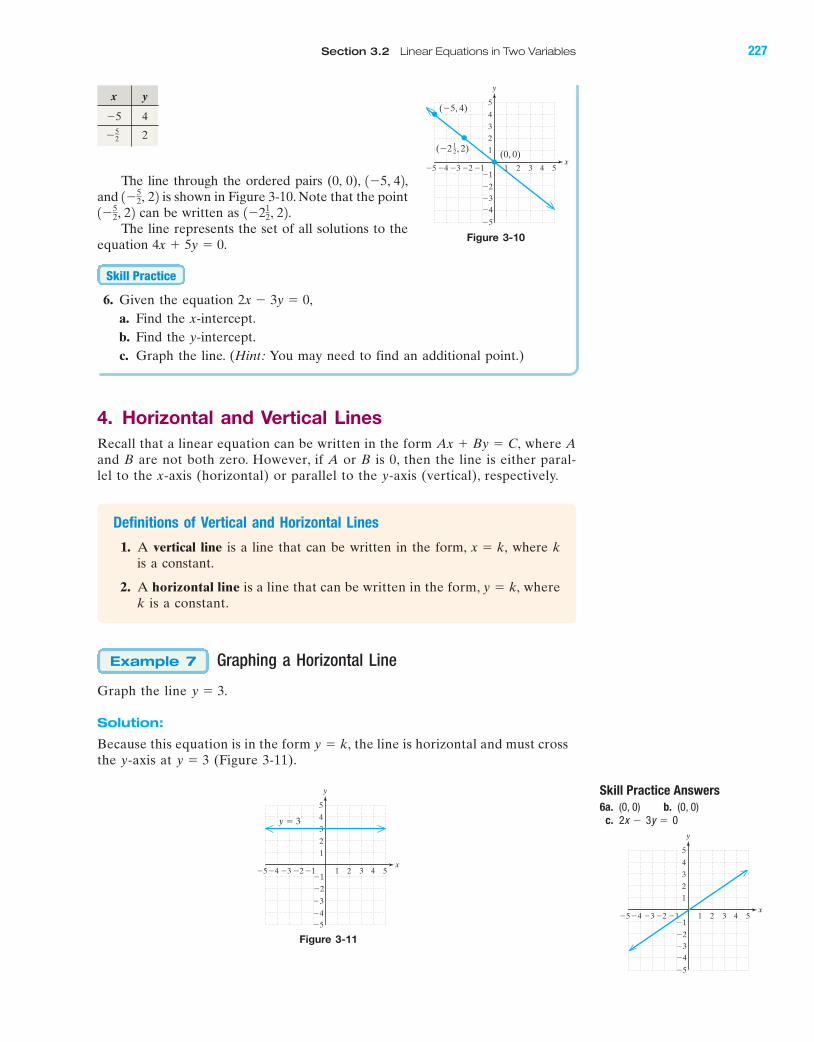
Graph the line
Solution:
Because this equation is in the form the line is horizontal and must crossthe y-axis at (Figure 3-11).y � 3
y � k,
y � 3.
Example 7
y � 3
4 5�4�5 �3 1 2 3
�2
�1
�3
�4�5
4
5
1
�1�2
y
x
3
2
Figure 3-11
The line through the ordered pairs (0, 0), ,and is shown in Figure 3-10. Note that the point
can be written as The line represents the set of all solutions to the
equation
6. Given the equation ,a. Find the x-intercept.b. Find the y-intercept.c. Graph the line. (Hint: You may need to find an additional point.)
2x � 3y � 0
Skill Practice
4x � 5y � 0.
1�212, 22.1�5
2, 221�5
2, 221�5, 42
4 5�4�5 �3 1 2 3�1
�2�3�4
�5
21
4
5
3
�1�2
(�5, 4)
(0, 0)
y
x
(�2 , 2)12
Figure 3-10
x y
�5 4
2�52
Skill Practice Answers
6a. (0, 0) b. (0, 0)c. 2x � 3y � 0
Definitions of Vertical and Horizontal Lines
1. A vertical line is a line that can be written in the form, where kis a constant.
2. A horizontal line is a line that can be written in the form, wherek is a constant.
y � k,
x � k,
4 5�4�5 �3 1 2 3�1
�2�3�4
�5
21
4
5
3
�1�2
y
x
miL28711_ch03_209-296 9/26/06 07:32 AM Page 227CONFIRMING PAGES
BA
228 Chapter 3 Graphing Linear Equations in Two Variables
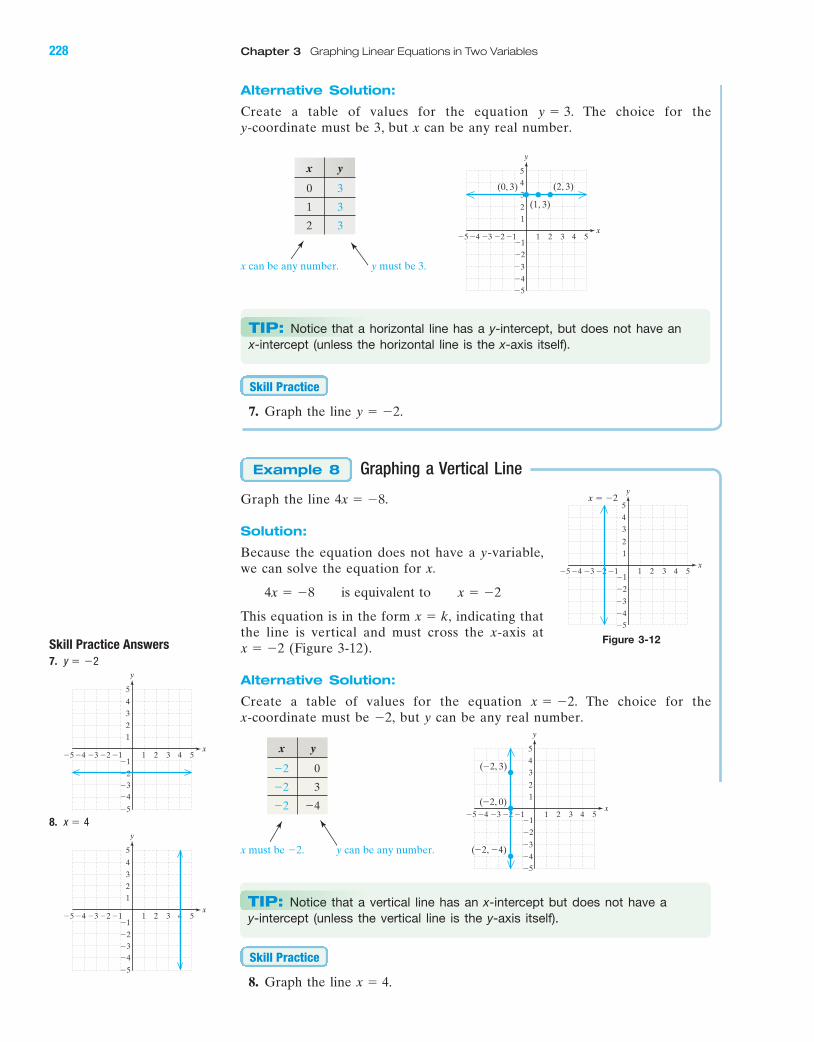
Alternative Solution:
Create a table of values for the equation The choice for the y-coordinate must be 3, but x can be any real number.
x can be any number. y must be 3.
7. Graph the line .
Graphing a Vertical Line
Graph the line
Solution:
Because the equation does not have a y-variable,we can solve the equation for x.
is equivalent to
This equation is in the form indicating thatthe line is vertical and must cross the x-axis at
(Figure 3-12).
Alternative Solution:
Create a table of values for the equation The choice for the x-coordinate must be but y can be any real number.
x must be y can be any number.
8. Graph the line .x � 4
Skill Practice
�2.
�2,x � �2.
x � �2
x � k,
x � �24x � �8
4x � �8.
Example 8
y � �2
Skill Practice
y � 3.
4 5�4�5 �3 1 2 3
�2
�1
�3
�4�5
4
5
1
�1�2
y
x
3
2
(0, 3) (2, 3)
(1, 3)
x y
0 3
1 3
2 3
x y
�2 0
�2 3
�2 �44 5�4�5 �3 1 2 3
�2
�1
�3
�4�5
4
5
1
�1�2
y
x
3
2
(�2, 3)
(�2, 0)
(�2, �4)
x � �2
4 5�4�5 �3 1 2 3
�2
�1
�3
�4�5
4
5
1
�1�2
y
x
3
2
Figure 3-12
TIP: Notice that a horizontal line has a y-intercept, but does not have an x-intercept (unless the horizontal line is the x-axis itself).
TIP: Notice that a vertical line has an x-intercept but does not have a y-intercept (unless the vertical line is the y-axis itself).
Skill Practice Answers
7.
8.
5�4�5 �3 1 2 3�1
�2�3�4
�5
21
4
5
3
�1�2
y
x4
x � 4
4 5�4�5 �3 1 2 3�1
�3�4
�5
21
4
5
3
�1�2
y
x
�2
y � �2
miL28711_ch03_209-296 9/26/06 07:32 AM Page 228CONFIRMING PAGES
BA
Section 3.2 Linear Equations in Two Variables 229
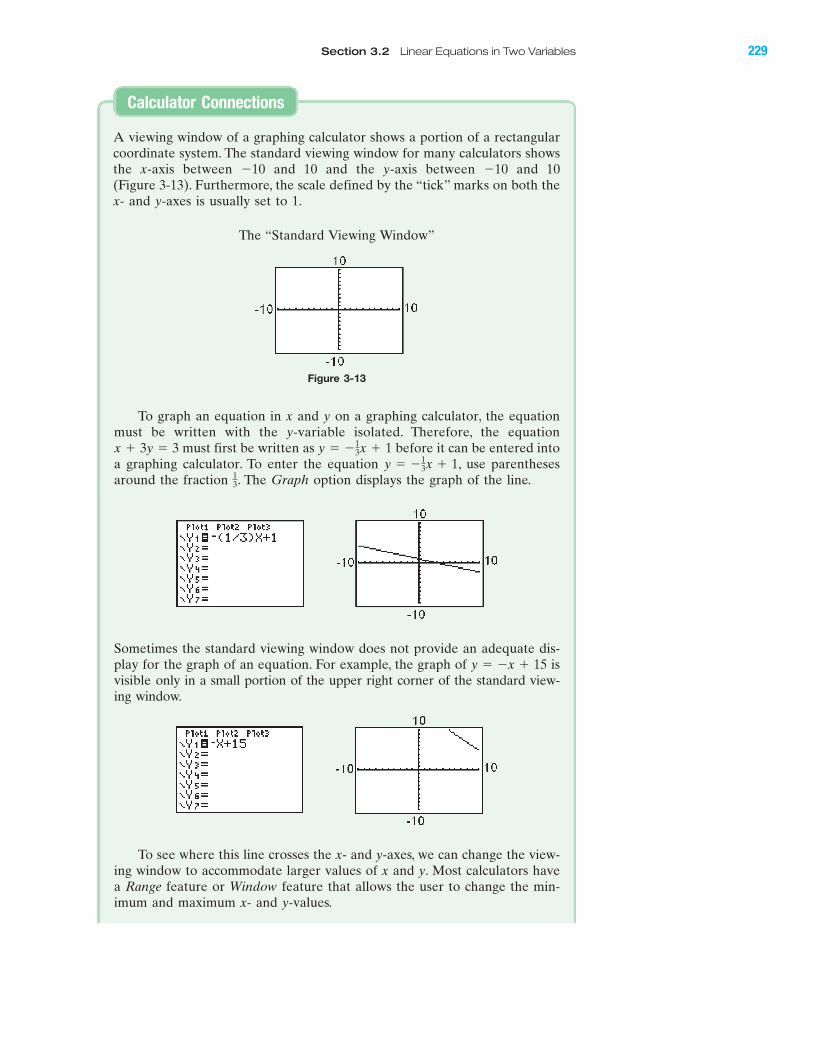
A viewing window of a graphing calculator shows a portion of a rectangularcoordinate system. The standard viewing window for many calculators showsthe x-axis between and 10 and the y-axis between and 10 (Figure 3-13). Furthermore, the scale defined by the “tick” marks on both thex- and y-axes is usually set to 1.
The “Standard Viewing Window”
�10�10
Calculator Connections
Figure 3-13
To graph an equation in x and y on a graphing calculator, the equationmust be written with the y-variable isolated. Therefore, the equation
must first be written as before it can be entered intoa graphing calculator. To enter the equation , use parenthesesaround the fraction . The Graph option displays the graph of the line.1
3
y � �13x � 1
y � �13x � 1x � 3y � 3
Sometimes the standard viewing window does not provide an adequate dis-play for the graph of an equation. For example, the graph of isvisible only in a small portion of the upper right corner of the standard view-ing window.
y � �x � 15
To see where this line crosses the x- and y-axes, we can change the view-ing window to accommodate larger values of x and y. Most calculators havea Range feature or Window feature that allows the user to change the min-imum and maximum x- and y-values.
miL28711_ch03_209-296 9/26/06 12:16 PM Page 229CONFIRMING PAGES
230 Chapter 3 Graphing Linear Equations in Two Variables
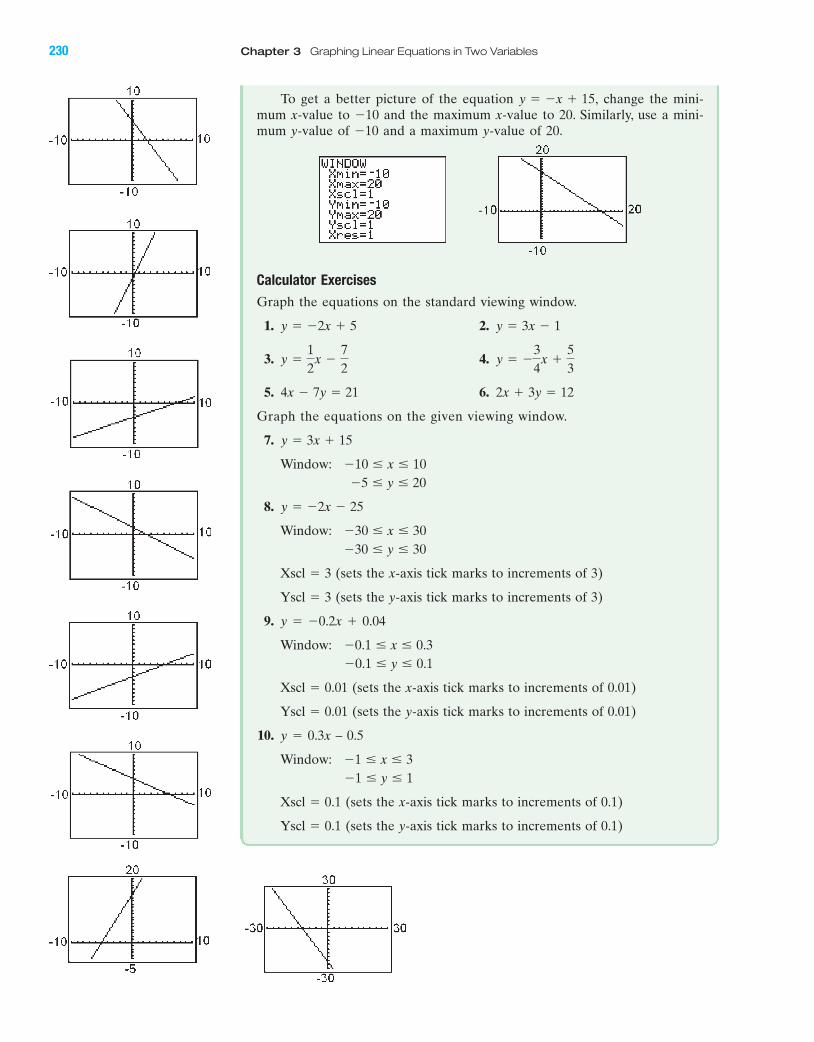
To get a better picture of the equation change the mini-mum x-value to and the maximum x-value to 20. Similarly, use a mini-mum y-value of and a maximum y-value of 20.�10
�10y � �x � 15,
Calculator Exercises
Graph the equations on the standard viewing window.
1. 2.
3. 4.
5. 6.
Graph the equations on the given viewing window.
7.
Window:
8.
Window:
Xscl � 3 (sets the x-axis tick marks to increments of 3)
Yscl � 3 (sets the y-axis tick marks to increments of 3)
9. y � �0.2x � 0.04
Window:
Xscl � 0.01 (sets the x-axis tick marks to increments of 0.01)
Yscl � 0.01 (sets the y-axis tick marks to increments of 0.01)
10. y � 0.3x – 0.5
Window:
Xscl � 0.1 (sets the x-axis tick marks to increments of 0.1)
Yscl � 0.1 (sets the y-axis tick marks to increments of 0.1)
�1 � y � 1�1 � x � 3
�0.1 � y � 0.1�0.1 � x � 0.3
�30 � y � 30�30 � x � 30
y � �2x � 25
�5 � y � 20�10 � x � 10
y � 3x � 15
2x � 3y � 124x � 7y � 21
y � �34
x �53
y �12
x �72
y � 3x � 1y � �2x � 5
BAmiL28711_ch03_209-296 9/26/06 07:32 AM Page 230CONFIRMING PAGES
Section 3.2 Linear Equations in Two Variables 231
Study Skills Exercises
1. Check your progress by answering these questions.
Yes No Did you have sufficient time to study for the test on Chapter 2? If not, whatcould you have done to create more time for studying?
Yes No Did you work all of the assigned homework problems in Chapter 2?
Yes No If you encountered difficulty, did you see your instructor or tutor for help?
Yes No Have you taken advantage of the textbook supplements such as the StudentSolutions Manual and MathZone?
2. Define the key terms:
a. horizontal line b. linear equation in two variables c. vertical line
d. x-intercept e. y-intercept
Review Exercises
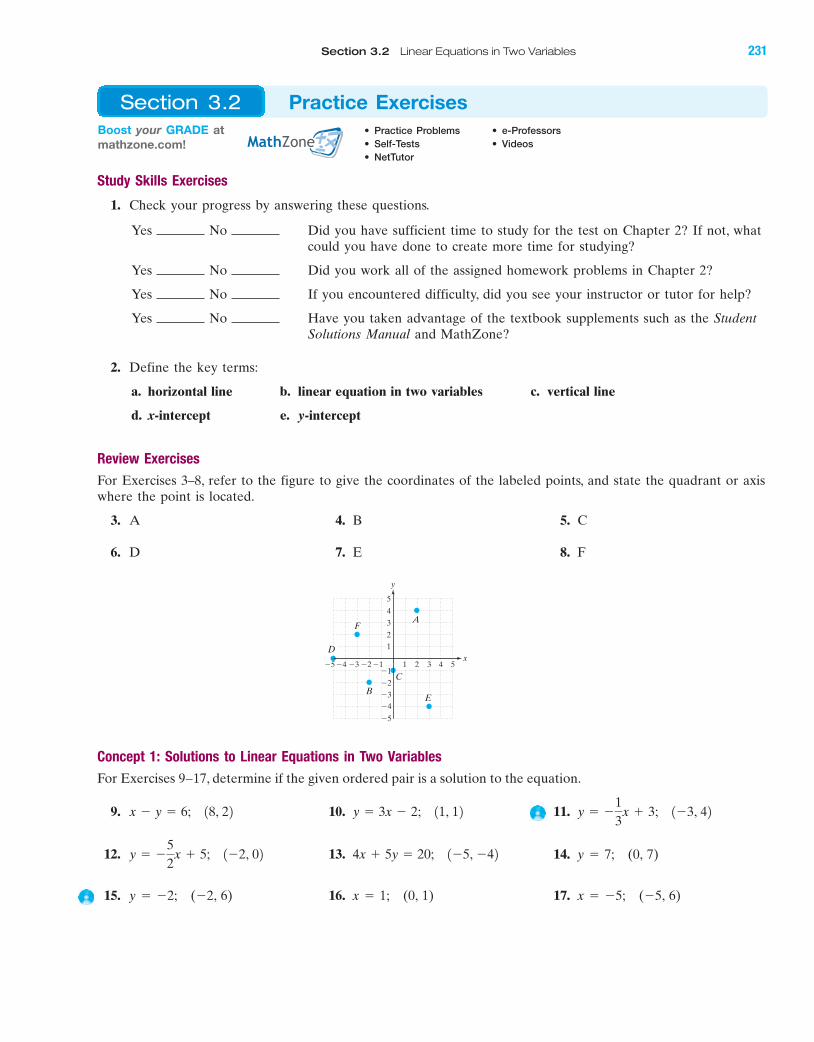
For Exercises 3–8, refer to the figure to give the coordinates of the labeled points, and state the quadrant or axiswhere the point is located.
3. A 4. B 5. C
6. D 7. E 8. F
Concept 1: Solutions to Linear Equations in Two Variables
For Exercises 9–17, determine if the given ordered pair is a solution to the equation.
9. 10. 11.
12. 13. 14. y � 7; (0, 7)
15. y � �2; (�2, 6) 16. x � 1; (0, 1) 17. x � �5; (�5, 6)
4x � 5y � 20; 1�5, �42y � �52
x � 5; 1�2, 02
y � �13
x � 3; 1�3, 42y � 3x � 2; 11, 12x � y � 6; 18, 22
4 5�4�5 �3 1 2 3�1
�2�3�4
�5
21
4
5
3
�1�2
A
B
C
y
x
E
D
F
Boost your GRADE atmathzone.com!
• Practice Problems • e-Professors
• Self-Tests • Videos
• NetTutor
Section 3.2 Practice Exercises
BAmiL28711_ch03_209-296 9/26/06 07:32 AM Page 231CONFIRMING PAGES
Concept 2: Graphing Linear Equations in Two Variables by Plotting Points
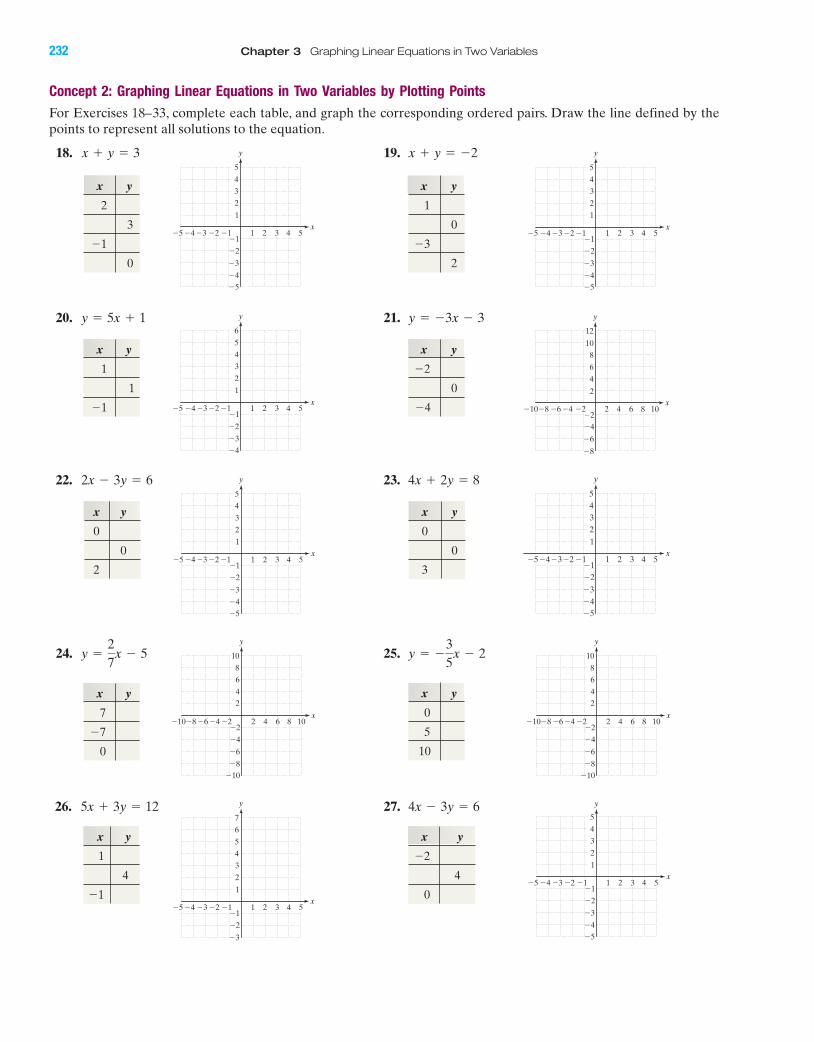
For Exercises 18–33, complete each table, and graph the corresponding ordered pairs. Draw the line defined by thepoints to represent all solutions to the equation.
18. 19. x � y � �2x � y � 3
4 5�4�5 �3 1 2 3
�2
�3
�4�5
5
1
�1�2
y
x
4
2
�1
3
4 5�4�5 �3 1 2 3
�3
�4�5
4
5
�2
y
x
3
2
�1
1
�2
�1
4 5�4�5 �3 1 2 3
�2
�3
�4�5
4
5
1
�1�2
y
x
3
2
�1
20. 21. y � �3x � 3y � 5x � 1
22. 23. 4x � 2y � 82x � 3y � 6
24. 25. y � �35
x � 2y �27
x � 5
y
x2 4 6 8 10
�4�2
�6
�8
�2�4�6�8�10
2
6
4
8
10
12
8 10�8�10 �6 2 4 6
�4
�6
�8�10
8
10
�2�4
y
x
6
42
�2
x y
2
3
�1
0
x y
1
0
�3
2
x y
0
0
2
x y
0
0
3
x y
1
1
�1
x y
�2
0
�4
x y
7
�7
0
x y
0
5
10
4 5�4�5 �3 1 2 3
�2�3�4�5
4
1
�1�2
y
x
32
�1
5
4 5�4�5 �3 1 2 3�1
�2
�3�4
5
6
�1�2
y
x
4
3
2
1
8 10�8�10 �6 2 4 6
�4
�6
�8�10
8
10
�2�4
y
x
6
42
�2
26. 27. 4x � 3y � 65x � 3y � 12
x y
1
4
�1
x y
�2
4
04 5�4�5 �3 1 2 3
�2
�3
4
5
6
7
1
�1�2
y
x
3
2
�1
4 5�4�5 �3 1 2 3
�2
�3
�4�5
4
5
1
�1�2
y
x
3
2
�1
232 Chapter 3 Graphing Linear Equations in Two Variables
BAmiL28711_ch03_209-296 9/26/06 07:32 AM Page 232CONFIRMING PAGES
BA
Section 3.2 Linear Equations in Two Variables 233
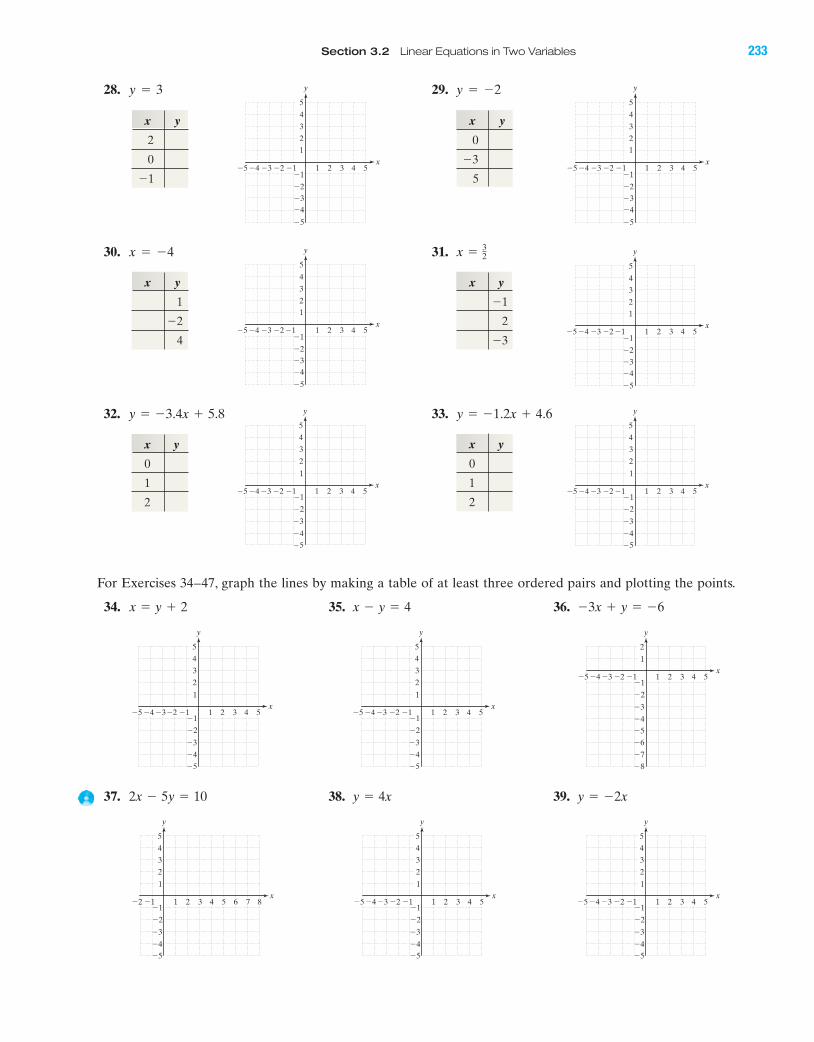
For Exercises 34–47, graph the lines by making a table of at least three ordered pairs and plotting the points.
34. 35. 36. �3x � y � �6x � y � 4x � y � 2
37. 38. 39. y � �2xy � 4x2x � 5y � 10
4 5�4�5 �3 1 2 3
�2
�3
�4�5
4
5
1
�1�2
y
x
3
2
�14 5�4�5 �3 1 2 3
�2
�3
�4�5
4
5
1
�1�2
y
x
3
2
�1
4 5�4�5 �3 1 2 3
�2
�3
�4�5
�6
�7�8
1
�1�2
y
x
2
�1
4 51 2 3
�2
�3
�4�5
4
5
1
�1�2
y
86 7x
3
2
�14 5�4�5 �3 1 2 3
�2
�3
�4�5
4
5
1
�1�2
y
x
3
2
�14 5�4�5 �3 1 2 3
�2
�3
�4�5
4
5
1
�1�2
y
x
3
2
�1
28. y � 3 29. y � �2
30. x � �4 31. x � 32
32. 33. y � �1.2x � 4.6y � �3.4x � 5.8
4 5�4�5 �3 1 2 3�1
�2�3�4
�5
21
4
5
3
�1�2
y
x4 5�4�5 �3 1 2 3
�1
�2
�4
�5
21
4
5
3
�1�2
y
x
�3
4 5�4�5 �3 1 2 3�1
�2�3�4
�5
21
4
5
3
�1�2
y
x
4 5�4�5 �3 1 2 3
�2
�3
�4�5
4
5
1
�1�2
y
x
3
2
�14 5�4�5 �3 1 2 3
�2
�3
�4�5
4
1
�1�2
y
x
3
2
�1
5
x y
2
0
�1
x y
1
�2
4
x y
0
�3
5
x y
�1
2
�3
x y
0
1
2
x y
0
1
2
4 5�4�5 �3 1 2 3�1
�2�3�4
�5
21
4
5
3
�1�2
y
x
BAmiL28711_ch03_209-296 9/26/06 07:32 AM Page 233CONFIRMING PAGES
BA
40. 41. 42. x � y � 0y �14
x � 2y � �12
x � 3
43. 44. 45. 4x � 5y � 152x � 3y � 8�x � y � 0
4 51 2 3
�2
�3
�4�5
4
5
1
�1�2
y
86 7x
3
2
�14 5�4�5 �3 1 2 3
�2
�3
�4�5
4
5
1
�1�2
y
x
3
2
�14 5�4�5 �3 1 2 3
�2�3�4�5
45
1
�1�2
y
x
32
�1
4 5�4�5 �3 1 2 3
�2
�3
�4�5
4
5
1
�1�2
y
x
3
2
�14 5�4�5 �3 1 2 3
�2
�3
�4�5
4
5
1
�1�2
y
x
3
2
�14 5�4�5 �3 1 2 3
�2
�3
�4�5
4
5
1
�1�2
y
x
3
2
�1
46. 47. �30x � 20y � 6050x � 40y � 200
4 5�4�5 �3 1 2 3
�2
�3
�4�5
�6
�7
�8
1
�1�2
y
x
2
�1
4 5�4�5 �3 1 2 3
�2
�3
�4�5
4
5
1
�1�2
y
x
3
2
�1
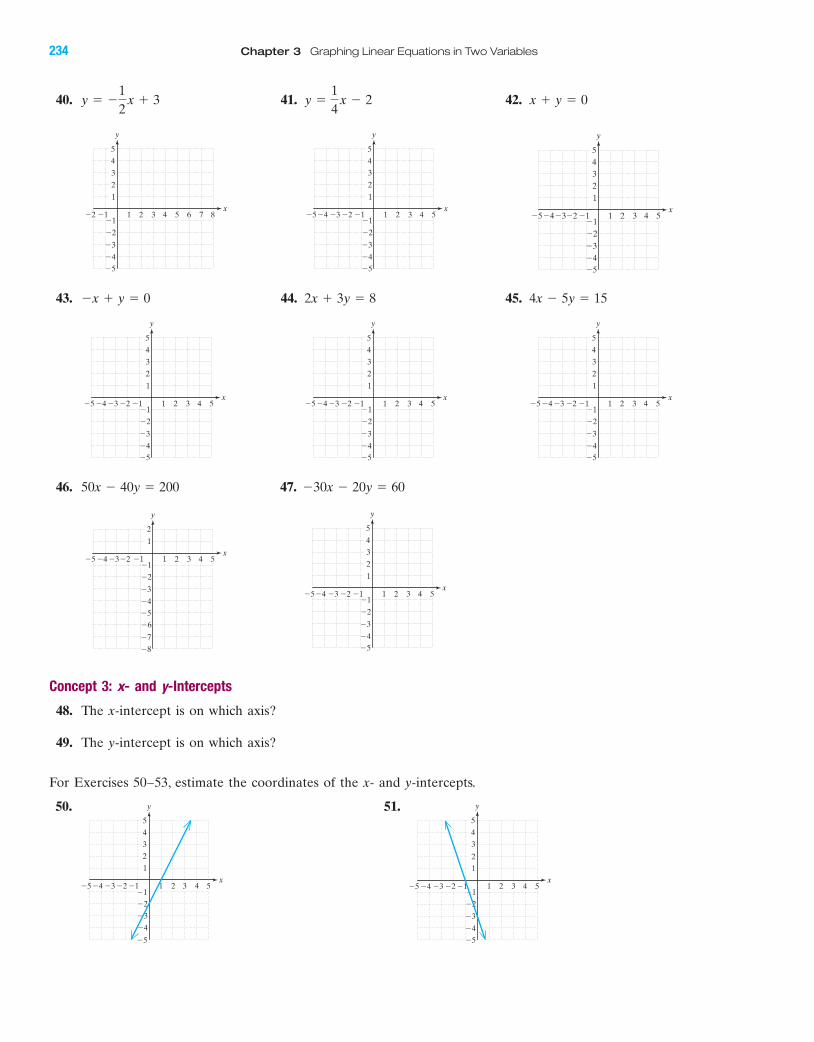
Concept 3: x- and y-Intercepts
48. The x-intercept is on which axis?
49. The y-intercept is on which axis?
For Exercises 50–53, estimate the coordinates of the x- and y-intercepts.
50. 51.
4 51 2 3
�2
�1
�3
�4�5
4
5
1
y
x
3
2
�4�5 �3 �1�2�5�4
�4
�3
�2
�5
3
4
5
�2 �1�3
1
3 52 4
2
1�1
x
y
234 Chapter 3 Graphing Linear Equations in Two Variables
BAmiL28711_ch03_209-296 9/26/06 07:32 AM Page 234CONFIRMING PAGES
BA
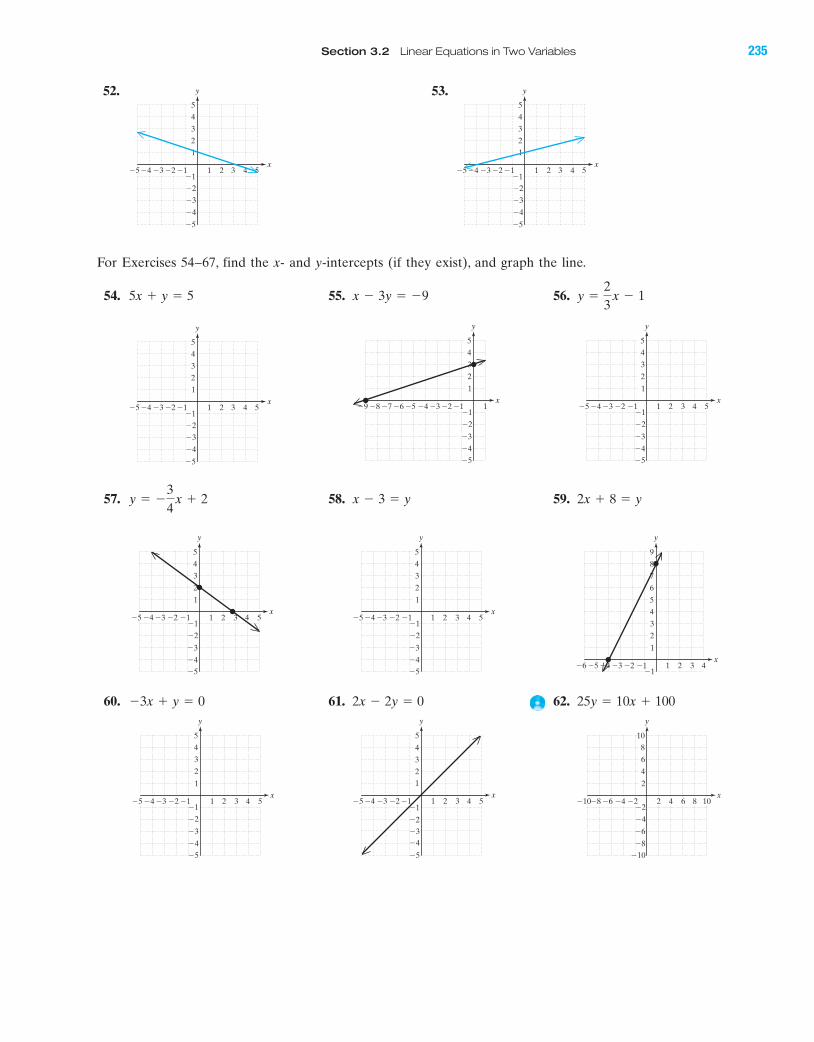
Section 3.2 Linear Equations in Two Variables 235
60. 61. 62. 25y � 10x � 1002x � 2y � 0�3x � y � 0
4 5�4�5 �3 1 2 3
�2
�3
�4�5
4
5
1
�1�2
y
x
3
2
�14 5�4�5 �3 1 2 3
�1
�2�3�4
�5
21
4
5
3
�1�2
y
x8 10�8�10 �6 2 4 6
�4
�6
�8�10
8
10
2
�2�4
y
x
6
4
�2
57. 58. 59. 2x � 8 � yx � 3 � yy � �34
x � 2
�5�4
�4
�3
�2
�5
3
4
5
�2 �1�3
1
3 52 4
2
1�1
x
y
4 5�4�5 �3 1 2 3
�2
�3
�4�5
4
5
1
�1�2
y
x
3
2
�1
4 5�4�5 �3 1 2 3
�2
�3
�4�5
4
5
1
�1�2
y
x
3
2
�14 5�4�5 �3 1 2 3
�2
�3
�4�5
4
5
1
�1�2
y
x
3
2
�1
�4�5 �3 1
�2
�3
�4�5
4
5
1
�1�2
y
x
3
2
�1�6�7�8�9
4�4�5 �3 1 2 3
4
5
6
7
8
9
1
�1�2
y
x
3
2
�1�6
52. 53.
For Exercises 54–67, find the x- and y-intercepts (if they exist), and graph the line.
54. 55. 56. y �23
x � 1x � 3y � �95x � y � 5
�5�4
�4
�3
�2
�5
3
4
5
�2 �1�3
1
3 52 4
2
1�1
x
y
�5�4
�4
�3
�2
�5
3
4
5
�2 �1�3
1
3 52 4
2
1�1
x
y
BAmiL28711_ch03_209-296 9/26/06 07:32 AM Page 235CONFIRMING PAGES
BA
63. 64. 65. �8.1x � 10.8y � 16.21.2x � 2.4y � 3.620x � �40y � 200
66. 67. x � �5yx � 2y
8 10�8�10 �6 2 4 6
�4
�6
�8�10
8
10
2
�2�4
y
x
6
4
�24 5�4�5 �3 1 2 3
�2�3�4�5
45
1
�1�2
y
x
32
�1 4 5�4�5 �3 1 2 3
�2
�3
�4�5
4
5
1
�1�2
y
x
3
2
�1
4 5�4�5 �3 1 2 3
�2
�3
�4�5
4
5
1
�1�2
y
x
3
2
�14 5�4�5 �3 1 2 3
�2
�3
�4�5
4
5
1
�1�2
y
x
3
2
�1
Concept 4: Horizontal and Vertical Lines
68. Explain why not every line has both an x- and a y-intercept.
69. Which of the lines will have only one intercept?
a. b. c. d.
70. Which of the lines will have only one intercept?
a. b. c. d. x � 4y � 82x � 10 � 2x � y � 0y � 2
�x � y � 02y � 8x � 52x � 3y � 6
For Exercises 71–74, answer true or false. If the statement is false, rewrite it to be true.
71. The line is horizontal. 72. The line is horizontal.
73. A line parallel to the y-axis is vertical. 74. A line perpendicular to the x-axis is vertical.
y � �4x � 3
For Exercises 75–86,
a. Identify as representing a horizontal or vertical line. b. Graph the line.
c. Identify the x- and y-intercepts if they exist.
75. 76. 77. �2y � 8y � �1x � 3
4 5�4�5 �3 1 2 3
�2�3�4�5
45
1
�1�2
y
x
32
�14 5�4�5 �3 1 2 3
�2�3�4�5
45
1
�1�2
y
x
32
�1
4 5�4�5 �3 1 2 3
�2
�3
�4�5
�6
4
1
�1�2
y
x
3
2
�1
236 Chapter 3 Graphing Linear Equations in Two Variables
miL28711_ch03_209-296 9/26/06 07:32 AM Page 236CONFIRMING PAGES
BA
Section 3.2 Linear Equations in Two Variables 237
78. 79. 80. y � 8 � �13x � 3 � 75x � 20
Expanding Your Skills
87. The students in the ninth grade at Atlantic High School pick up aluminumcans to be recycled. The current value of aluminum is $0.69 per pound. Ifthe students pay $20 to rent a truck to haul the cans, then the followingequation expresses the amount of money that they earn, y, given thenumber of pounds of aluminum, x.
a. Let and solve for y.
b. Let and solve for x.
c. Write the ordered pairs from parts (a) and (b), and interprettheir meaning in the context of the problem.
d. Graph the ordered pairs and the line defined by the points.
y � 80.05
x � 55
y � 0.69x � 20 1x 02
4 5�4�5 �3 1 2 3
�2
�3
�4�5
4
5
1
�1�2
y
x
3
2
�14 5�4�5 �3 1 2 3
�1
�2�3�4
�5
21
4
5
3
�1�2
y
x�4�5 �3 1 2
�2
�3
�4
�5
4
5
1
�1�2
y
x
3
2
�1�6�7�8
84. 85. 86. 7 � �2x � 59 � 3 � 4y�3y � 2 � 9
4 5�4 �3 1 2 3
�2
�3
�4�5
4
5
1
�1�2
y
6x
3
2
�14 5�4 �3 1 2 3
�2
�3
�4�5
4
5
1
�1�2
y
6x
3
2
�1
4 5�4�5 �3 1 2 3
�2
�3
�4�5
�6
�7
�8
1
�1�2
y
x
2
�1
4 5�4�5 �3 1 2 3
�2
�3
�4�5
4
5
1
�1�2
y
x
3
2
�1
81. 82. 83. 2x � 7 � 105x � 03y � 0
4 5�4�5 �3 1 2 3
�2
�3
�4�5
4
5
1
�1�2
y
x
3
2
�1 4 5�4�5 �3 1 2 3
�2
�3
�4�5
4
5
1
�1�2
y
x
3
2
�1
90
10
Dol
lars
Weight (pounds)
8070605040302010
20 30 40 50 60 70 80 90 100
110
120
130
140
150
y
x
(145, 80.05)
(55, 17.95)
miL28711_ch03_209-296 9/26/06 07:32 AM Page 237CONFIRMING PAGES
BA
88. The store “CDs R US” sells all compact disks for $13.99. The following equation represents the revenue, y,(in dollars) generated by selling x CDs.
a. Find y when
b. Find x when .
c. Write the ordered pairs from parts (a) and (b), and interpret theirmeaning in the context of the problem.
d. Graph the ordered pairs and the line defined by the points.
89. The value of a car depreciates once it is driven off of the dealer’s lot. For a Hyundai Accent, the value ofthe car is given by the equation y � where y is the value of the car in dollars xyears after its purchase. (Source: Kelly Blue Book)
a. Find y when
b. Find x when .
c. Write the ordered pairs from parts (a) and (b), and interpret their meaning in the context of the problem.
y � 7006
x � 1.
�1531x � 11,599 1x 02
y � 279.80
x � 13.
y � 13.99x 1x 02250
200
0 2 4 12 14 16 181086 20
Rev
enue
($)
Number of Compact Disks
150
100
0
50
300y
x
238 Chapter 3 Graphing Linear Equations in Two Variables
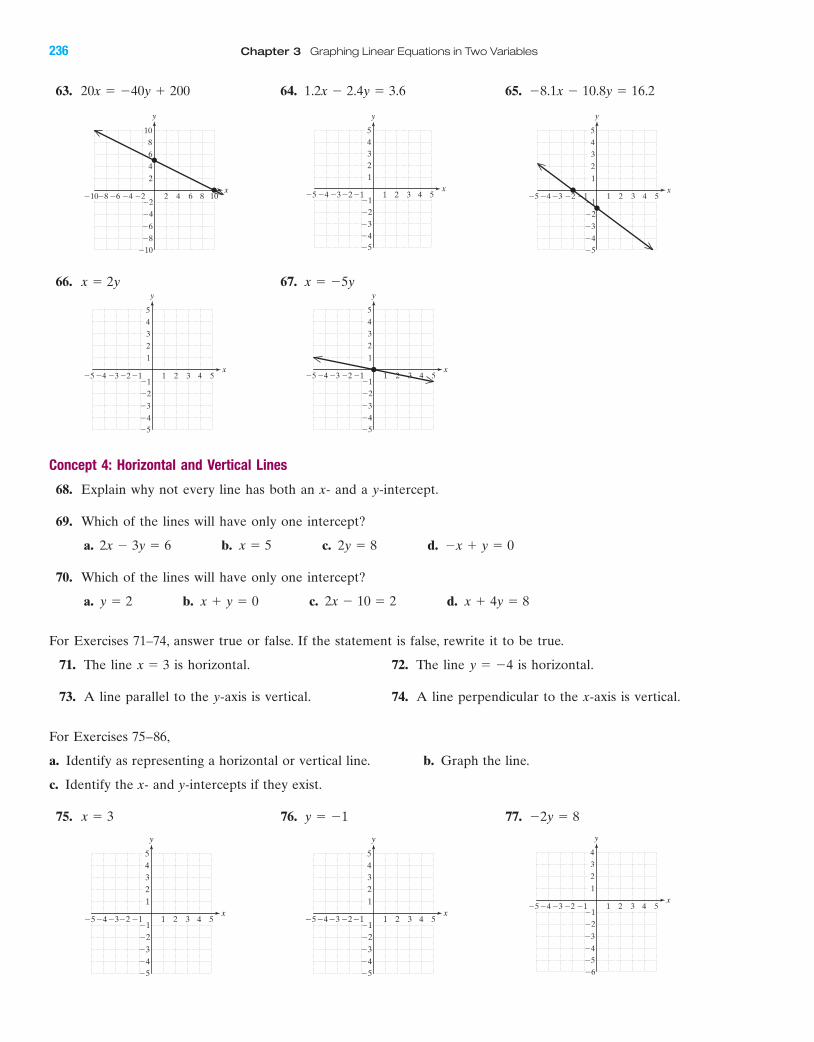
1. Introduction to SlopeThe x- and y-intercepts represent the points where a line crosses the x- andy-axes. Another important feature of a line is its slope. Geometrically, the slopeof a line measures the “steepness” of the line. For example, two ski runs aredepicted by the lines in Figure 3-14.
Figure 3-14
Beginner’s Hill Daredevil Hill
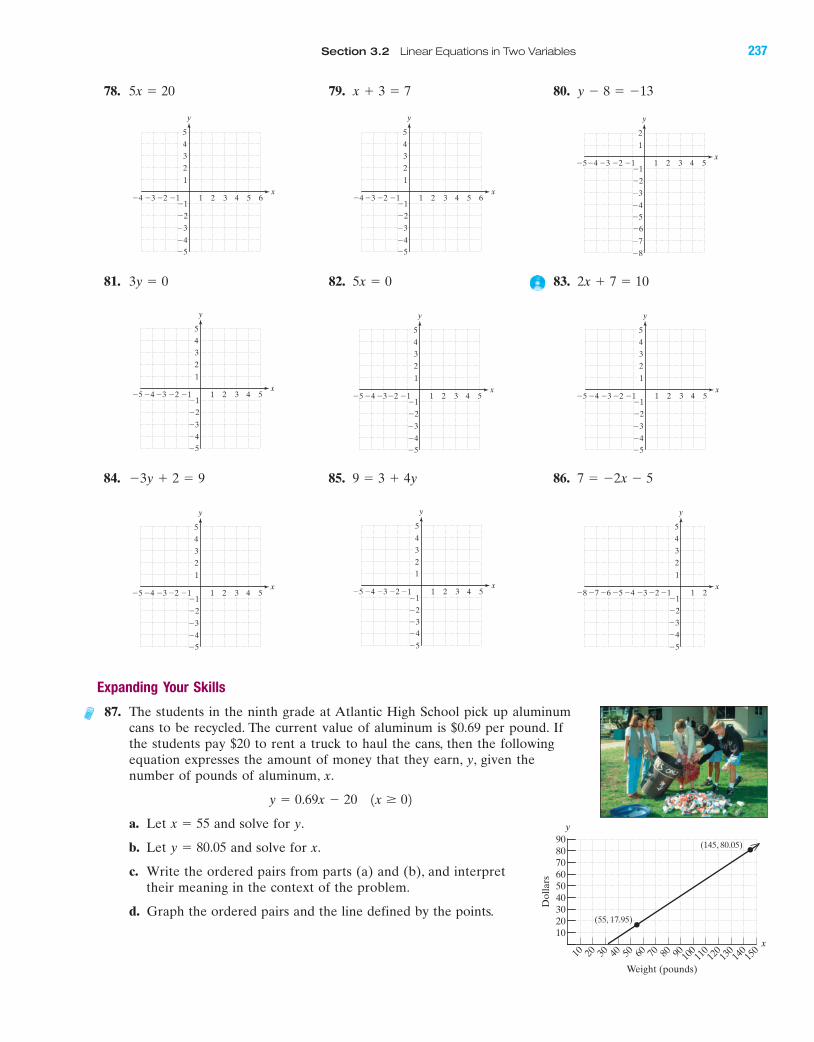
By visual inspection, Daredevil Hill is “steeper” than Beginner’s Hill. To mea-sure the slope of a line quantitatively, consider two points on the line. The slopeof the line is the ratio of the vertical change (change in y) between the two pointsand the horizontal change (change in x). As a memory device, we might think ofthe slope of a line as “rise over run.” See Figure 3-15.
Slope �change in y
change in x�
riserun
Figure 3-15
Change in x (run)
Change in y(rise)
Section 3.3 Slope of a Line
Concepts
1. Introduction to Slope2. Slope Formula3. Parallel and Perpendicular
Lines4. Applications of Slope
miL28711_ch03_209-296 9/26/06 07:32 AM Page 238CONFIRMING PAGES
BA
Section 3.3 Slope of a Line 239
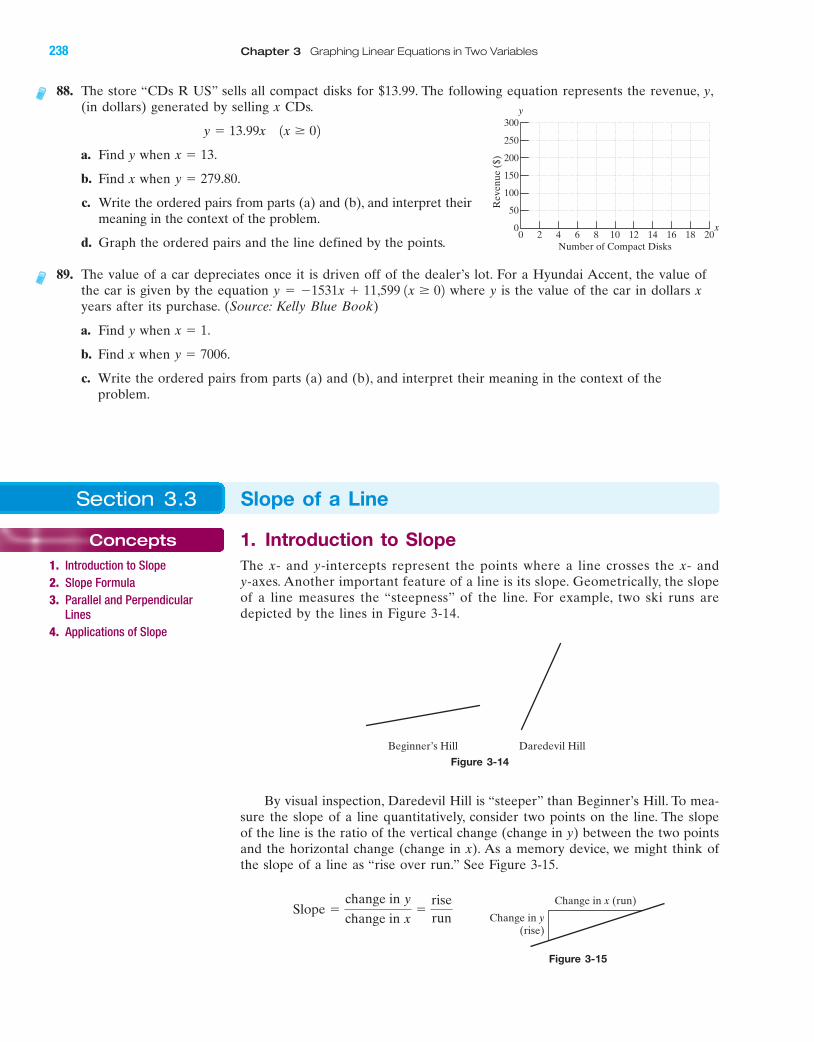
Figure 3-16
Figure 3-17
The slope of Daredevil Hill is greater than the slope of Beginner’s Hill,confirming the observation that Daredevil Hill is steeper. On Daredevil Hill,there is a 12-ft change in elevation for every 6 ft of horizontal distance (a 2 :1ratio). On Beginner’s Hill there is only a 2-ft change in elevation for every 6 ftof horizontal distance (a 1 :3 ratio).
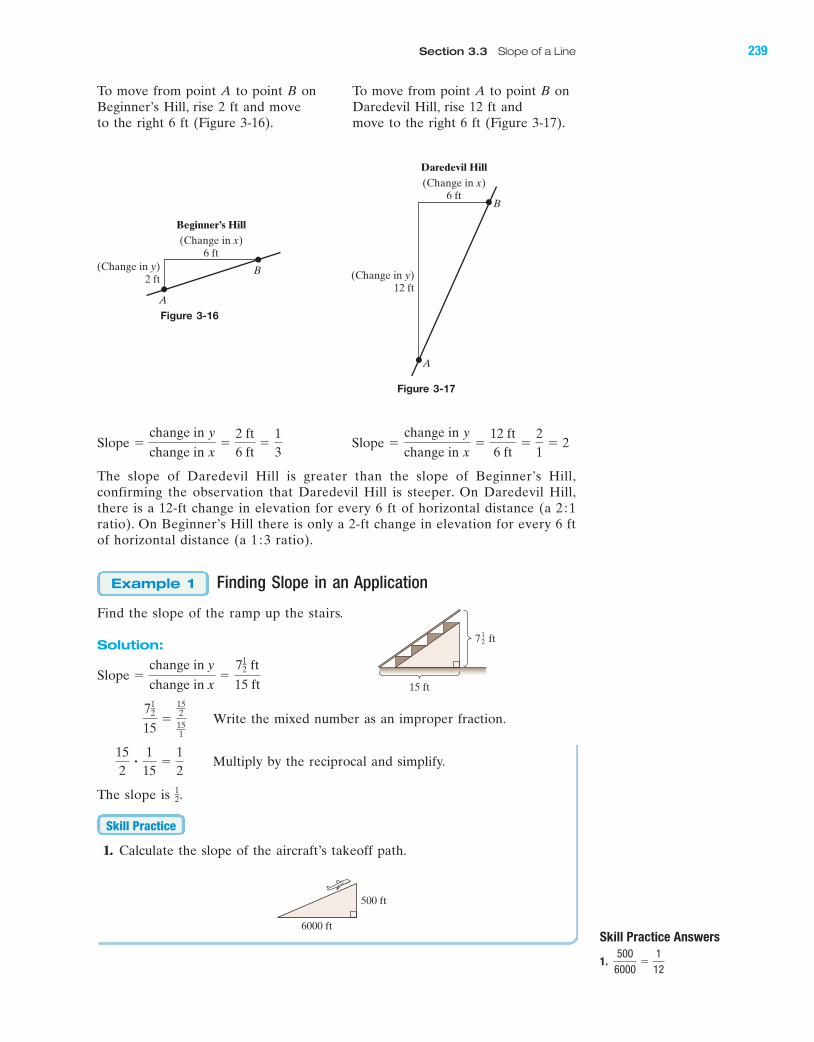
Finding Slope in an Application
Find the slope of the ramp up the stairs.
Solution:
Write the mixed number as an improper fraction.
Multiply by the reciprocal and simplify.
The slope is
1. Calculate the slope of the aircraft’s takeoff path.
Skill Practice
12.
152
�1
15�
12
712
15�
152151
Slope �change in y
change in x�
712 ft
15 ft
Example 1
Slope �change in y
change in x�
12 ft6 ft
�21
� 2Slope �change in y
change in x�
2 ft6 ft
�13
To move from point A to point B on To move from point A to point B onBeginner’s Hill, rise 2 ft and move Daredevil Hill, rise 12 ft and to the right 6 ft (Figure 3-16). move to the right 6 ft (Figure 3-17).
(Change in x)6 ft
(Change in y)2 ft
Beginner’s Hill
A
B
(Change in x)6 ft
A
B
(Change in y)12 ft
Daredevil Hill
6000 ft
500 ft
15 ft
7 ft12
Skill Practice Answers
1.5006000
�1
12
miL28711_ch03_209-296 9/26/06 07:32 AM Page 239CONFIRMING PAGES
BA
240 Chapter 3 Graphing Linear Equations in Two Variables
Skill Practice Answers
2.16
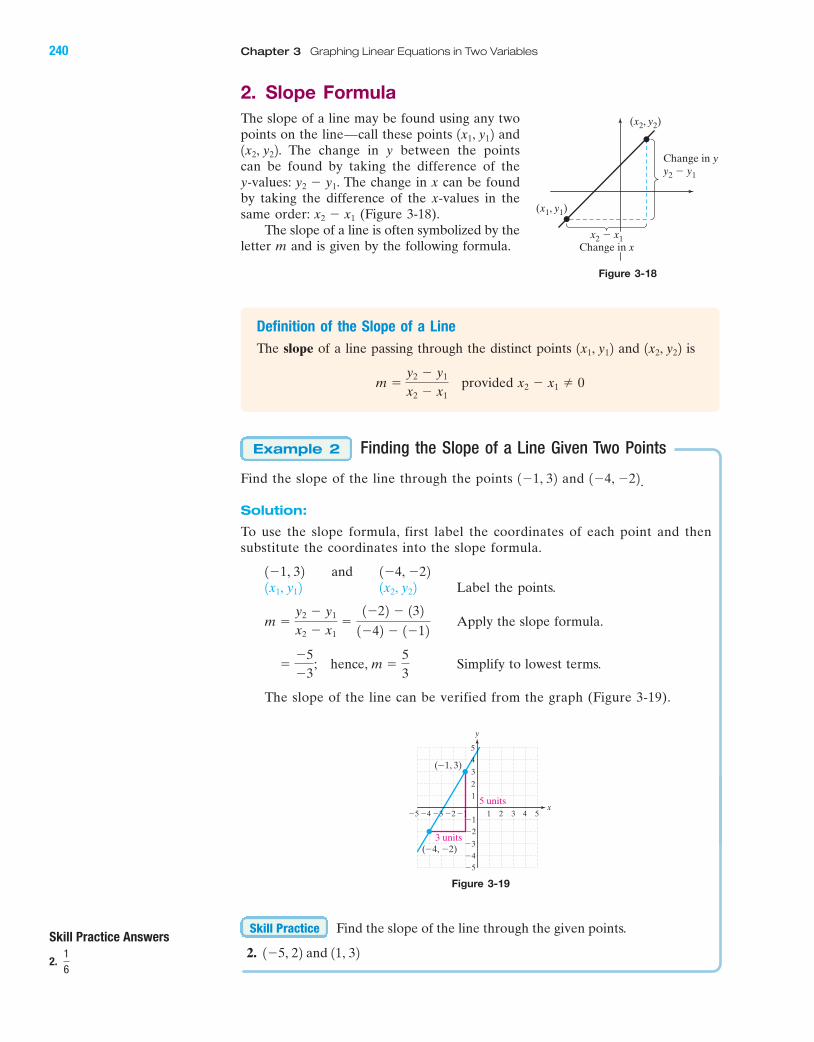
2. Slope FormulaThe slope of a line may be found using any twopoints on the line—call these points and
The change in y between the pointscan be found by taking the difference of they-values: The change in x can be foundby taking the difference of the x-values in thesame order: (Figure 3-18).
The slope of a line is often symbolized by theletter m and is given by the following formula.
Definition of the Slope of a Line
The slope of a line passing through the distinct points and is
provided
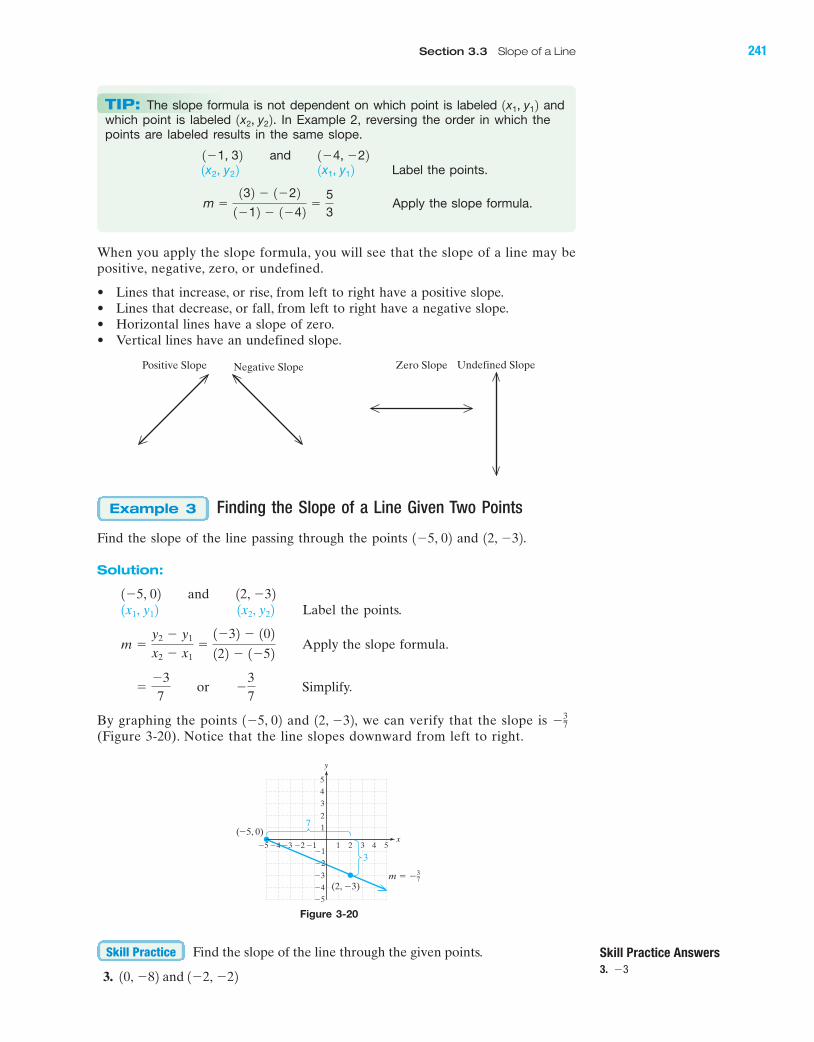
Finding the Slope of a Line Given Two Points
Find the slope of the line through the points and .
Solution:
To use the slope formula, first label the coordinates of each point and thensubstitute the coordinates into the slope formula.
Label the points.
Apply the slope formula.
Simplify to lowest terms.
The slope of the line can be verified from the graph (Figure 3-19).
��5�3
; hence, m �53
m �y2 � y1
x2 � x1�1�22 � 132
1�42 � 1�12
1x2, y221x1, y121�1, 32 and 1�4, �22
1�4, �221�1, 32
Example 2
x2 � x1 � 0m �y2 � y1
x2 � x1
1x2, y221x1, y12
x2 � x1
y2 � y1.
1x2, y22.1x1, y12
Figure 3-18
(x2, y2)
Change in yy2 � y1
x2 � x1Change in x
(x1, y1)
Figure 3-19
(�1, 3)
(�4, �2)
5 units
3 units
4 5�4�5 �3 1 2 3
�2
�1
�3
�4�5
4
5
1
�1�2
y
x
3
2
Find the slope of the line through the given points.
2. 1�5, 22 and 11, 32
Skill Practice
miL28711_ch03_209-296 9/26/06 07:32 AM Page 240CONFIRMING PAGES
BA
Section 3.3 Slope of a Line 241
Finding the Slope of a Line Given Two Points
Find the slope of the line passing through the points and .
Solution:
Label the points.
Apply the slope formula.
Simplify.
By graphing the points and we can verify that the slope is (Figure 3-20). Notice that the line slopes downward from left to right.
Find the slope of the line through the given points.
3. 10, �82 and 1�2, �22
Skill Practice
�3712, �32,1�5, 02
��37 or �
37
m �y2 � y1
x2 � x1�1�32 � 102
122 � 1�52
1x2, y221x1, y121�5, 02 and 12, �32
12, �321�5, 02
Example 3
When you apply the slope formula, you will see that the slope of a line may bepositive, negative, zero, or undefined.
• Lines that increase, or rise, from left to right have a positive slope.• Lines that decrease, or fall, from left to right have a negative slope.• Horizontal lines have a slope of zero.• Vertical lines have an undefined slope.
Positive Slope Negative Slope Zero Slope Undefined Slope
TIP: The slope formula is not dependent on which point is labeled andwhich point is labeled In Example 2, reversing the order in which thepoints are labeled results in the same slope.
Label the points.
Apply the slope formula.m �132 � 1�22
1�12 � 1�42�
53
1x1, y121x2, y221�1, 32 and 1�4, �22
1x2, y22.1x1, y12
Figure 3-20
3
7
4 5�4�5 �3 1 2 3
�2
�1
�3
�4�5
4
5
1
�1�2
y
x
3
2
37m � �
(�5, 0)
(2, �3)
Skill Practice Answers
3. �3
miL28711_ch03_209-296 9/26/06 07:33 AM Page 241CONFIRMING PAGES
BA
242 Chapter 3 Graphing Linear Equations in Two Variables
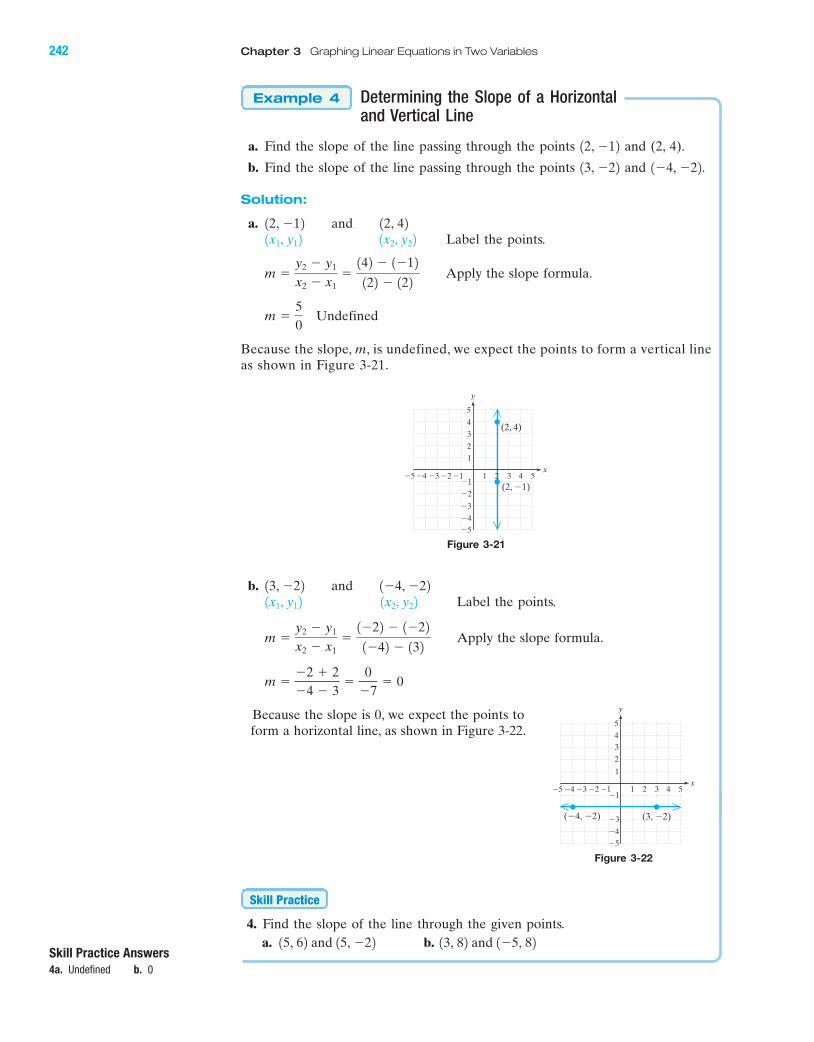
Determining the Slope of a Horizontal and Vertical Line
a. Find the slope of the line passing through the points and (2, 4).
b. Find the slope of the line passing through the points and .
Solution:
a.Label the points.
Apply the slope formula.
Because the slope, m, is undefined, we expect the points to form a vertical lineas shown in Figure 3-21.
b.Label the points.
Apply the slope formula.
Because the slope is 0, we expect the points toform a horizontal line, as shown in Figure 3-22.
4. Find the slope of the line through the given points.a. b. 13, 82 and 1�5, 8215, 62 and 15, �22
Skill Practice
m ��2 � 2�4 � 3
�0
�7� 0
m �y2 � y1
x2 � x1�1�22 � 1�22
1�42 � 132
1x2, y221x1, y1213, �22 and 1�4, �22
m �50 Undefined
m �y2 � y1
x2 � x1�142 � 1�12
122 � 122
1x2, y221x1, y1212, �12 and 12, 42
1�4, �2213, �22
12, �12
Example 4
Skill Practice Answers
4a. Undefined b. 0
Figure 3-21
(2, 4)
(2, �1)4 5�4�5 �3 1 2 3
�2
�1
�3
�4�5
4
5
1
�1�2
y
x
3
2
Figure 3-22
4 5�4�5 �3 1 2 3
�3
�1
�4�5
4
5
1
�1�2
y
x
2
3
(3, �2)(�4, �2)
miL28711_ch03_209-296 9/26/06 07:33 AM Page 242CONFIRMING PAGES
BA
Section 3.3 Slope of a Line 243
Figure 3-23 Figure 3-24
5
3
m2 � 53
5
3
m1 � 53
2
7
72
m1 � �72
m2 � 27
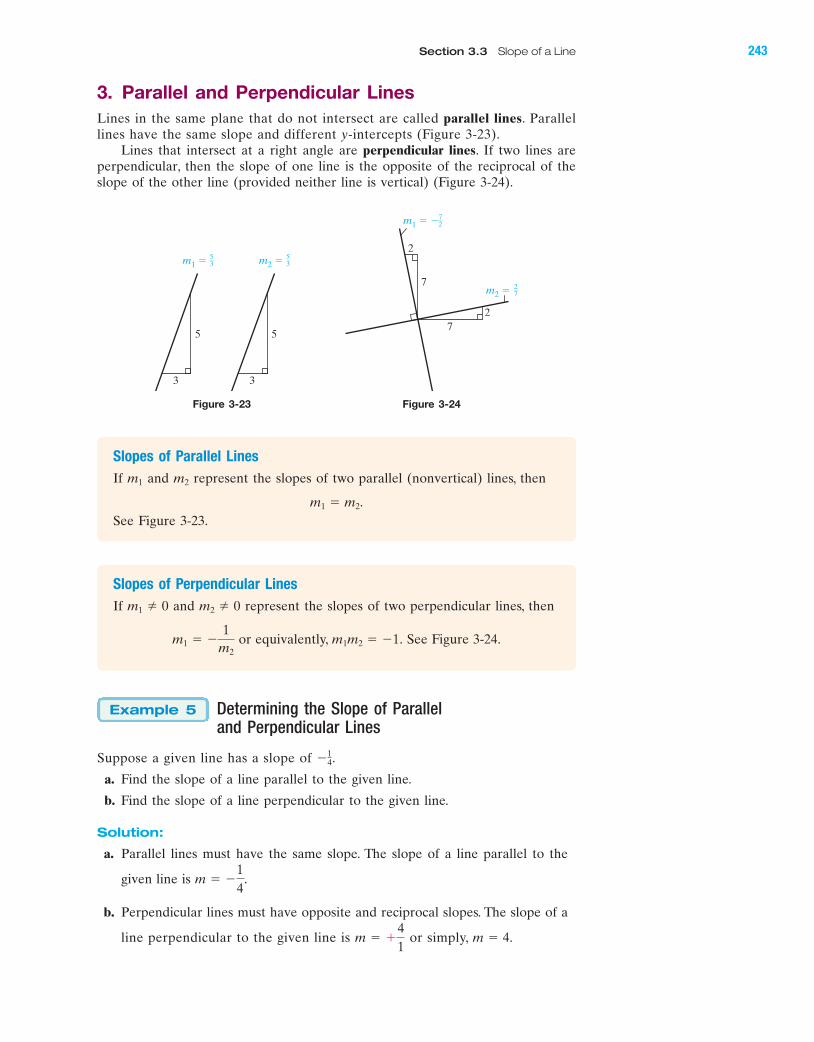
3. Parallel and Perpendicular LinesLines in the same plane that do not intersect are called parallel lines. Parallellines have the same slope and different y-intercepts (Figure 3-23).
Lines that intersect at a right angle are perpendicular lines. If two lines areperpendicular, then the slope of one line is the opposite of the reciprocal of theslope of the other line (provided neither line is vertical) (Figure 3-24).
Slopes of Parallel Lines
If and represent the slopes of two parallel (nonvertical) lines, then
See Figure 3-23.m1 � m2.
m2m1
Slopes of Perpendicular Lines
If and represent the slopes of two perpendicular lines, then
or equivalently, See Figure 3-24.m1m2 � �1.m1 � �1
m2
m2 � 0m1 � 0
Determining the Slope of Parallel and Perpendicular Lines
Suppose a given line has a slope of
a. Find the slope of a line parallel to the given line.
b. Find the slope of a line perpendicular to the given line.
Solution:
a. Parallel lines must have the same slope. The slope of a line parallel to the
given line is
b. Perpendicular lines must have opposite and reciprocal slopes. The slope of a
line perpendicular to the given line is or simply, m � 4.m � �41
m � �14
.
�14.
Example 5
miL28711_ch03_209-296 9/26/06 07:33 AM Page 243CONFIRMING PAGES
BA
244 Chapter 3 Graphing Linear Equations in Two Variables
5. A given line has a slope of .a. Find the slope of a line parallel to the given line.b. Find the slope of a line perpendicular to the given line.
4. Applications of SlopeIn many applications, the interpretation of slope refers to the rate of change ofthe y-variable to the x-variable.
Interpreting Slope in an Application
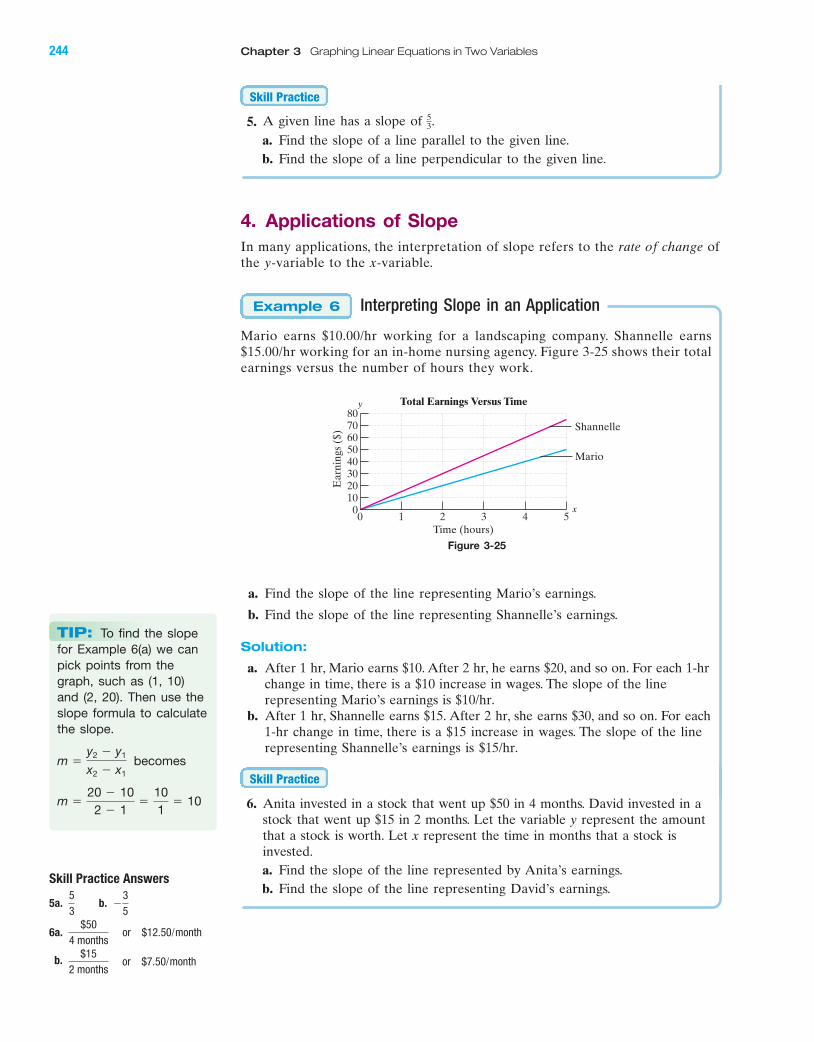
Mario earns $10.00/hr working for a landscaping company. Shannelle earns$15.00/hr working for an in-home nursing agency. Figure 3-25 shows their totalearnings versus the number of hours they work.
Example 6
53
Skill Practice
a. Find the slope of the line representing Mario’s earnings.
b. Find the slope of the line representing Shannelle’s earnings.
Solution:
a. After 1 hr, Mario earns $10. After 2 hr, he earns $20, and so on. For each 1-hrchange in time, there is a $10 increase in wages. The slope of the linerepresenting Mario’s earnings is $10/hr.
b. After 1 hr, Shannelle earns $15. After 2 hr, she earns $30, and so on. For each1-hr change in time, there is a $15 increase in wages. The slope of the linerepresenting Shannelle’s earnings is $15/hr.
6. Anita invested in a stock that went up $50 in 4 months. David invested in astock that went up $15 in 2 months. Let the variable y represent the amountthat a stock is worth. Let x represent the time in months that a stock isinvested.a. Find the slope of the line represented by Anita’s earnings.b. Find the slope of the line representing David’s earnings.
Skill Practice
Figure 3-25
80Total Earnings Versus Time
0 1 2 3 4 5
Ear
ning
s ($
)
Time (hours)
40506070
3020100
y
x
Shannelle
Mario
Skill Practice Answers
5a. b.
6a.
b.$15
2 months or $7.50/month
$504 months
or $12.50/month
�35
53
TIP: To find the slopefor Example 6(a) we canpick points from thegraph, such as (1, 10)and (2, 20). Then use theslope formula to calculatethe slope.
m �20 � 102 � 1
�101
� 10
m �y2 � y1
x2 � x1 becomes
miL28711_ch03_209-296 9/26/06 07:33 AM Page 244CONFIRMING PAGES
BA
Section 3.3 Slope of a Line 245
(Source: U.S. Department of the Census)
Interpreting Slope in an Application
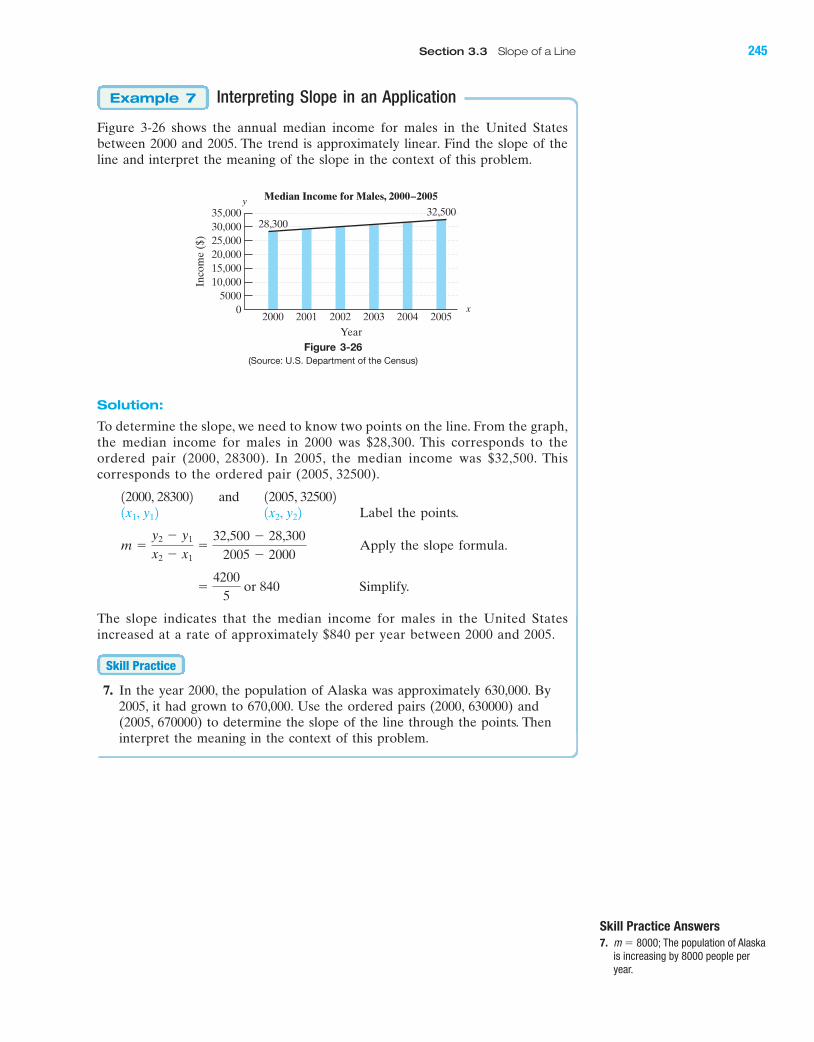
Figure 3-26 shows the annual median income for males in the United Statesbetween 2000 and 2005. The trend is approximately linear. Find the slope of theline and interpret the meaning of the slope in the context of this problem.
Example 7
Solution:
To determine the slope, we need to know two points on the line. From the graph,the median income for males in 2000 was $28,300. This corresponds to theordered pair (2000, 28300). In 2005, the median income was $32,500. Thiscorresponds to the ordered pair (2005, 32500).
Label the points.
Apply the slope formula.
Simplify.
The slope indicates that the median income for males in the United Statesincreased at a rate of approximately $840 per year between 2000 and 2005.
7. In the year 2000, the population of Alaska was approximately 630,000. By2005, it had grown to 670,000. Use the ordered pairs (2000, 630000) and(2005, 670000) to determine the slope of the line through the points. Theninterpret the meaning in the context of this problem.
Skill Practice
�4200
5 or 840
m �y2 � y1
x2 � x1�
32,500 � 28,3002005 � 2000
1x2, y221x1, y1212000, 283002 and 12005, 325002
0
10,00015,000
5000
2000 2001 2002 2003 2004 2005
20,00025,00030,00035,000
28,30032,500
x
yIn
com
e ($
)
Year
Median Income for Males, 2000–2005
Figure 3-26
Skill Practice Answers
7. m � 8000; The population of Alaskais increasing by 8000 people peryear.
miL28711_ch03_209-296 9/26/06 07:33 AM Page 245CONFIRMING PAGES
BA
246 Chapter 3 Graphing Linear Equations in Two Variables
Boost your GRADE atmathzone.com!
• Practice Problems • e-Professors
• Self-Tests • Videos
• NetTutor
Section 3.3 Practice Exercises
Study Skills Exercises
1. Make up a practice test for yourself. Use examples or exercises from the text. Be sure to cover eachconcept that was presented.
2. Define the key terms:
a. parallel lines b. perpendicular lines c. slope
Review Exercises
For Exercises 3–8, find the x- and y-intercepts (if they exist). Then graph the lines.
3. 4. 5. y �23
xx � 5 � 2x � 3y � 6
8 ft
24 ft
18 ft
10 ft
6. 7. 8.
Concept 1: Introduction to Slope
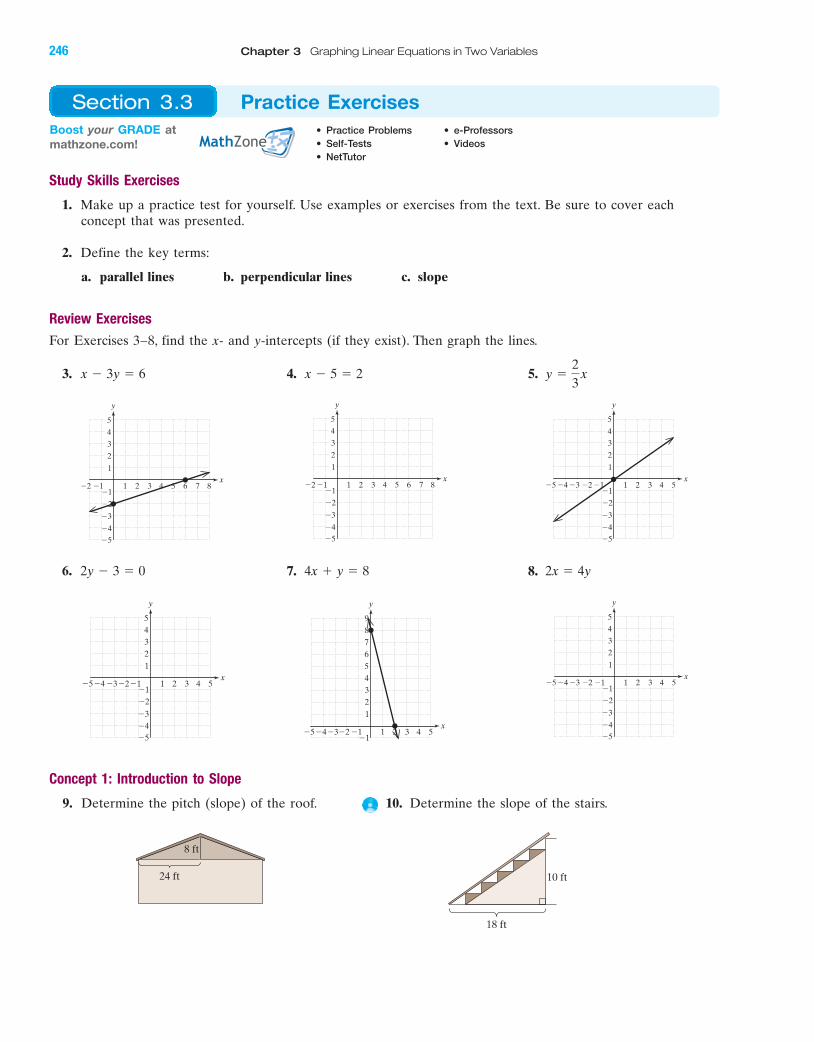
9. Determine the pitch (slope) of the roof. 10. Determine the slope of the stairs.
4 5�4�5 �3 1 2 3
�2
�3
�4�5
4
5
1
�1�2
y
x
3
2
�1
4 5�4�5 �3 1 2 3
456789
1
�1�2
y
x
32
�1
4 5�4�5 �3 1 2 3
�2�3�4�5
45
1
�1�2
y
x
32
�1
2x � 4y4x � y � 82y � 3 � 0
4 5�4�5 �3 1 2 3
�2
�3
�4�5
4
5
1
�1�2
y
x
3
2
�14 51 2 3
�2
�3
�4�5
4
5
1
�1�2
y
86 7x
3
2
�14 51 2 3
�2
�3
�4�5
4
5
1
�1�2
y
86 7x
3
2
�1
miL28711_ch03_209-296 9/26/06 07:33 AM Page 246CONFIRMING PAGES
BA
Section 3.3 Slope of a Line 247
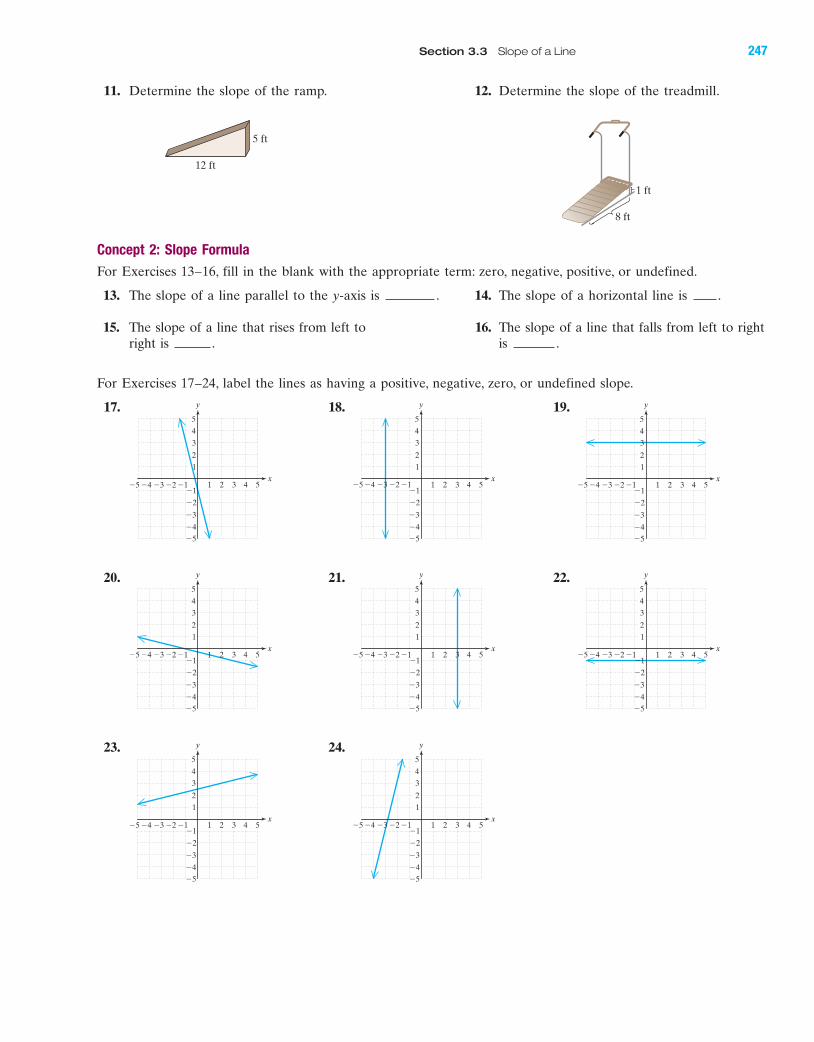
11. Determine the slope of the ramp. 12. Determine the slope of the treadmill.
Concept 2: Slope Formula
For Exercises 13–16, fill in the blank with the appropriate term: zero, negative, positive, or undefined.
13. The slope of a line parallel to the y-axis is . 14. The slope of a horizontal line is .
15. The slope of a line that rises from left to 16. The slope of a line that falls from left to right right is . is .
For Exercises 17–24, label the lines as having a positive, negative, zero, or undefined slope.
17. 18. 19.
20. 21. 22.
23. 24.
4 51 2 3
�2
�1
�3
�4�5
4
5
1
y
x
3
2
�4�5 �3 �1�24 51 2 3
�2
�1
�3
�4�5
4
5
1
y
x
3
2
�4�5 �3 �1�2
4 51 2 3
�2
�1
�3
�4�5
4
5
1
y
x
3
2
�4�5 �3 �1�24 51 2 3
�2
�1
�3
�4�5
4
5
1
y
x
3
2
�4�5 �3 �1�24 51 2 3
�2
�1
�3
�4�5
4
5
1
y
x
3
2
�4�5 �3 �1�2
4 51 2 3
�2
�1
�3
�4�5
4
5
1
y
x
3
2
�4�5 �3 �1�24 51 2 3
�2
�1
�3
�4�5
4
5
1
y
x
3
2
�4�5 �3 �1�24 51 2 3
�2
�1
�3
�4�5
4
5
1
y
x
3
2
�4�5 �3 �1�2
12 ft
5 ft
8 ft
1 ft
miL28711_ch03_209-296 9/26/06 07:33 AM Page 247CONFIRMING PAGES
BA
248 Chapter 3 Graphing Linear Equations in Two Variables
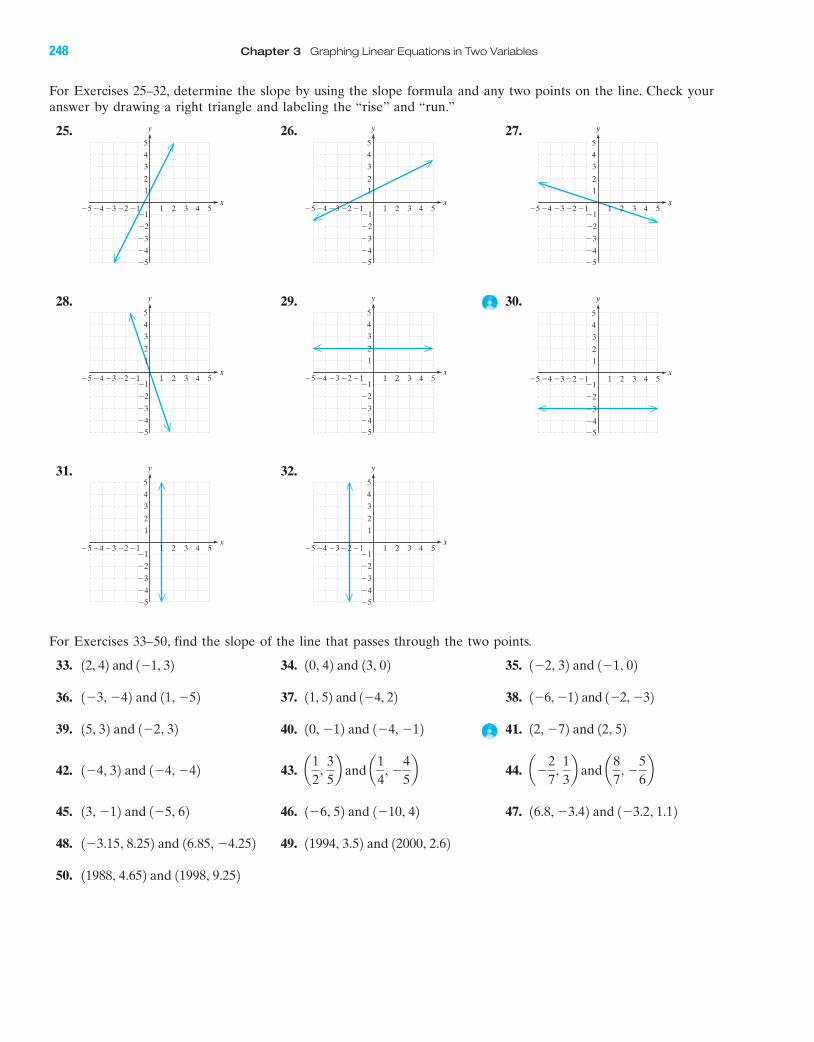
For Exercises 25–32, determine the slope by using the slope formula and any two points on the line. Check youranswer by drawing a right triangle and labeling the “rise” and “run.”
25. 26. 27.
28. 29. 30.
31. 32.
For Exercises 33–50, find the slope of the line that passes through the two points.
33. 34. 35.
36. 37. 38.
39. 40. 41.
42. 43. 44.
45. 46. 47.
48. 49.
50. 11988, 4.652 and 11998, 9.252
11994, 3.52 and 12000, 2.621�3.15, 8.252 and 16.85, �4.252
16.8, �3.42 and 1�3.2, 1.121�6, 52 and 1�10, 4213, �12 and 1�5, 62
a�27
, 13b and a
87
, �56ba
12
, 35b and a
14
, �45b1�4, 32 and 1�4, �42
12, �72 and 12, 5210, �12 and 1�4, �1215, 32 and 1�2, 32
1�6, �12 and 1�2, �3211, 52 and 1�4, 221�3, �42 and 11, �52
1�2, 32 and 1�1, 0210, 42 and 13, 0212, 42 and 1�1, 32
4 51 2 3
�2
�1
�3
�4�5
4
5
1
y
x
3
2
�4�5 �3 �1�24 51 2 3
�2
�1
�3
�4�5
4
5
1
y
x
3
2
�4�5 �3 �1�2
4 51 2 3
�2
�1
�3
�4�5
4
5
1
y
x
3
2
�4�5 �3 �1�24 51 2 3
�2
�1
�3
�4�5
4
5
1
y
x
3
2
�4�5 �3 �1�24 51 2 3
�2
�1
�3
�4�5
4
5
1
y
x
3
2
�4�5 �3 �1�2
4 51 2 3
�2
�1
�3
�4�5
4
5
1
y
x
3
2
�4�5 �3 �1�24 51 2 3
�2
�1
�3
�4�5
4
5
1
y
x
3
2
�4�5 �3 �1�24 51 2 3
�2
�1
�3
�4�5
4
5
1
y
x
3
2
�4�5 �3 �1�2
miL28711_ch03_209-296 9/26/06 07:33 AM Page 248CONFIRMING PAGES
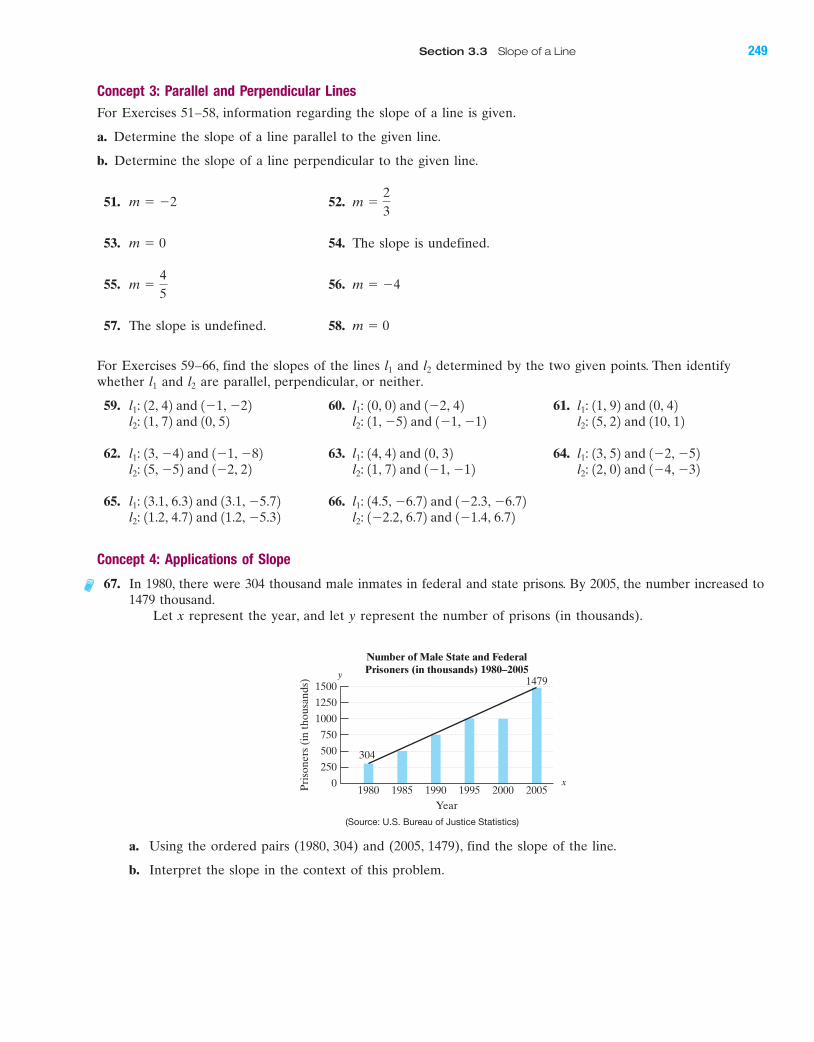
BA
Section 3.3 Slope of a Line 249
Concept 3: Parallel and Perpendicular Lines
For Exercises 51–58, information regarding the slope of a line is given.
a. Determine the slope of a line parallel to the given line.
b. Determine the slope of a line perpendicular to the given line.
51. 52.
53. 54. The slope is undefined.
55. 56.
57. The slope is undefined. 58.
For Exercises 59–66, find the slopes of the lines and determined by the two given points. Then identifywhether and are parallel, perpendicular, or neither.
59. 60. 61.
62. 63. 64.
65. 66.
Concept 4: Applications of Slope
67. In 1980, there were 304 thousand male inmates in federal and state prisons. By 2005, the number increased to1479 thousand.
Let x represent the year, and let y represent the number of prisons (in thousands).
l2: 1�2.2, 6.72 and 1�1.4, 6.72l2: 11.2, 4.72 and 11.2, �5.32l1: 14.5, �6.72 and 1�2.3, �6.72l1: 13.1, 6.32 and 13.1, �5.72
l2: 12, 02 and 1�4, �32l2: 11, 72 and 1�1, �12l2: 15, �52 and 1�2, 22l1: 13, 52 and 1�2, �52l1: 14, 42 and 10, 32l1: 13, �42 and 1�1, �82
l2: 15, 22 and 110, 12l2: 11, �52 and 1�1, �12l2: 11, 72 and 10, 52l1: 11, 92 and 10, 42l1: 10, 02 and 1�2, 42l1: 12, 42 and 1�1, �22
l2l1
l2l1
m � 0
m � �4m �45
m � 0
m �23
m � �2
0
250
500
1980 1985 1990 1995 2000 2005
750
1000
1250
1500
304
1479
x
y
Pri
sone
rs (
in th
ousa
nds)
Year
Number of Male State and FederalPrisoners (in thousands) 1980–2005
(Source: U.S. Bureau of Justice Statistics)
a. Using the ordered pairs (1980, 304) and (2005, 1479), find the slope of the line.
b. Interpret the slope in the context of this problem.
miL28711_ch03_209-296 9/26/06 07:33 AM Page 249CONFIRMING PAGES
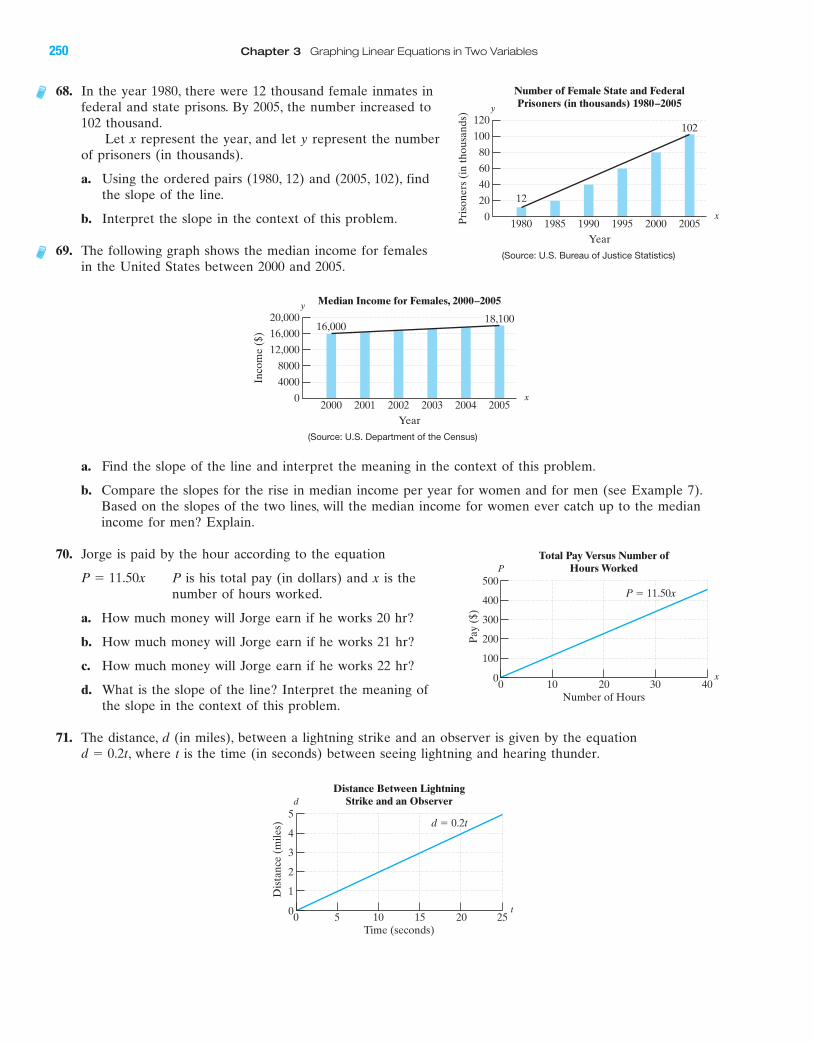
BA
250 Chapter 3 Graphing Linear Equations in Two Variables
68. In the year 1980, there were 12 thousand female inmates infederal and state prisons. By 2005, the number increased to102 thousand.
Let x represent the year, and let y represent the numberof prisoners (in thousands).
a. Using the ordered pairs (1980, 12) and (2005, 102), findthe slope of the line.
b. Interpret the slope in the context of this problem.
69. The following graph shows the median income for femalesin the United States between 2000 and 2005.
0
4000
2000 2001 2002 2003 2004 2005
8000
12,000
16,000
20,00016,000
18,100
x
y
Inco
me
($)
Year
Median Income for Females, 2000–2005
(Source: U.S. Bureau of Justice Statistics)
(Source: U.S. Department of the Census)
0
20
40
1980 1985 1990 1995 2000 2005
60
80
100
120
12
102
x
y
Pri
sone
rs (
in th
ousa
nds)
Year
Number of Female State and FederalPrisoners (in thousands) 1980–2005
a. Find the slope of the line and interpret the meaning in the context of this problem.
b. Compare the slopes for the rise in median income per year for women and for men (see Example 7).Based on the slopes of the two lines, will the median income for women ever catch up to the medianincome for men? Explain.
70. Jorge is paid by the hour according to the equation
P is his total pay (in dollars) and x is thenumber of hours worked.
a. How much money will Jorge earn if he works 20 hr?
b. How much money will Jorge earn if he works 21 hr?
c. How much money will Jorge earn if he works 22 hr?
d. What is the slope of the line? Interpret the meaning ofthe slope in the context of this problem.
71. The distance, d (in miles), between a lightning strike and an observer is given by the equation, where t is the time (in seconds) between seeing lightning and hearing thunder.d � 0.2t
P � 11.50x 500
00 10 20 30 40
Pay
($)
Number of Hours
P � 11.50x
Total Pay Versus Number ofHours Worked
400
300
200
100
P
x
5
00 5 10 15 20 25
Dis
tanc
e (m
iles)
Time (seconds)
d � 0.2t
Distance Between LightningStrike and an Observer
4
3
2
1
d
t
miL28711_ch03_209-296 9/26/06 07:33 AM Page 250CONFIRMING PAGES
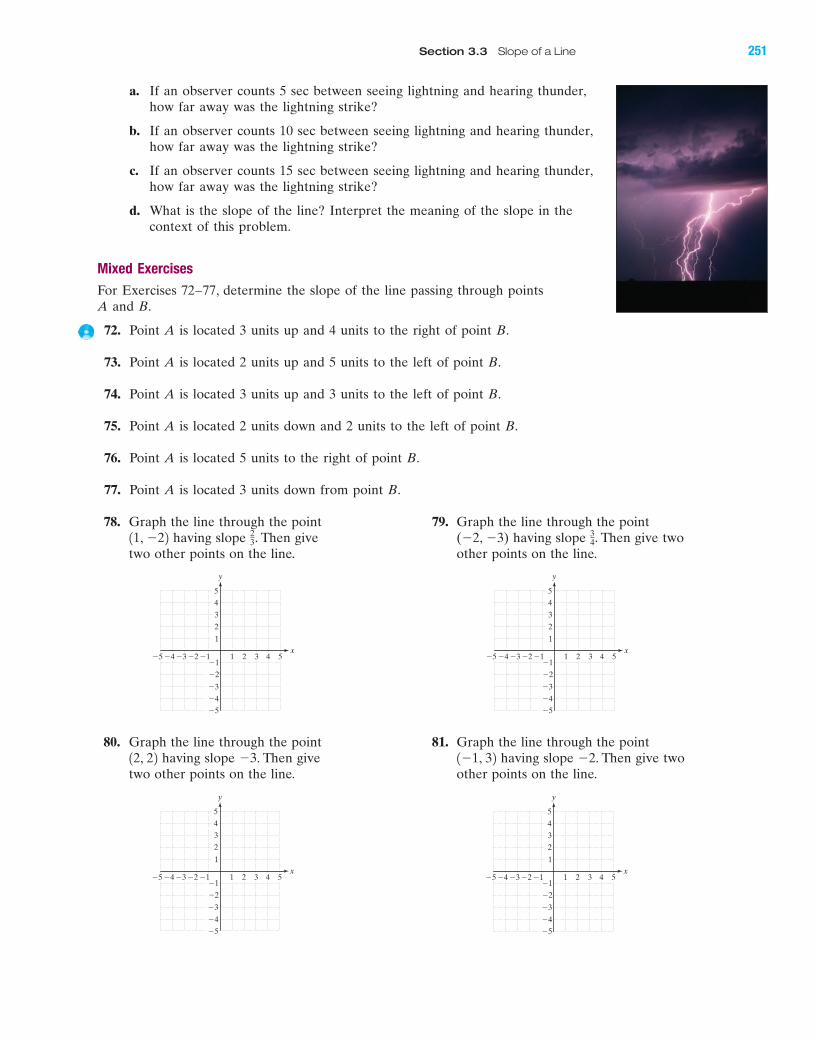
BA
Section 3.3 Slope of a Line 251
a. If an observer counts 5 sec between seeing lightning and hearing thunder,how far away was the lightning strike?
b. If an observer counts 10 sec between seeing lightning and hearing thunder,how far away was the lightning strike?
c. If an observer counts 15 sec between seeing lightning and hearing thunder,how far away was the lightning strike?
d. What is the slope of the line? Interpret the meaning of the slope in thecontext of this problem.
Mixed Exercises
For Exercises 72–77, determine the slope of the line passing through points A and B.
72. Point A is located 3 units up and 4 units to the right of point B.
73. Point A is located 2 units up and 5 units to the left of point B.
74. Point A is located 3 units up and 3 units to the left of point B.
75. Point A is located 2 units down and 2 units to the left of point B.
76. Point A is located 5 units to the right of point B.
77. Point A is located 3 units down from point B.
78. Graph the line through the point 79. Graph the line through the pointhaving slope . Then give ( ) having slope . Then give two
two other points on the line. other points on the line.
80. Graph the line through the point 81. Graph the line through the pointhaving slope . Then give having slope . Then give two
two other points on the line. other points on the line.�21�1, 32�312, 22
34�2, �32
311, �22
4 5�4�5 �3 1 2 3
�2
�3
�4�5
4
5
1
�1�2
y
x
3
2
�14 5�4�5 �3 1 2 3
�2
�3
�4�5
4
5
1
�1�2
y
x
3
2
�1
4 5�4�5 �3 1 2 3
�2
�3
�4�5
4
5
1
�1�2
y
x
3
2
�14 5�4�5 �3 1 2 3
�2
�3
�4�5
4
5
1
�1�2
y
x
3
2
�1
miL28711_ch03_209-296 9/26/06 07:33 AM Page 251CONFIRMING PAGES
BA
252 Chapter 3 Graphing Linear Equations in Two Variables
For Exercises 82–89, draw a line as indicated. Answers may vary.
82. Draw a line with a positive slope and 83. Draw a line with a positive slope and a negativea positive y-intercept. y-intercept.
84. Draw a line with a negative slope and a 85. Draw a line with a negative slope and positivenegative y-intercept. y-intercept.
86. Draw a line with a zero slope and a positive 87. Draw a line with a zero slope and a negativey-intercept. y-intercept.
88. Draw a line with undefined slope and a 89. Draw a line with undefined slope and a positive negative x-intercept. x-intercept.
4 5�4�5 �3 1 2 3
�2
�3
�4�5
4
5
1
�1�2
y
x
3
2
�14 5�4�5 �3 1 2 3
�2
�3
�4�5
4
5
1
�1�2
y
x
3
2
�1
4 5�4�5 �3 1 2 3
�2
�3
�4�5
4
5
1
�1�2
y
x
3
2
�14 5�4�5 �3 1 2 3
�2
�3
�4�5
4
5
1
�1�2
y
x
3
2
�1
4 5�4�5 �3 1 2 3
�2
�3
�4�5
4
5
1
�1�2
y
x
3
2
�14 5�4�5 �3 1 2 3
�2
�3
�4�5
4
5
1
�1�2
y
x
3
2
�1
4 5�4�5 �3 1 2 3
�2�3�4�5
45
1
�1�2
y
x
32
�14 5�4�5 �3 1 2 3
�2
�3
�4�5
4
5
1
�1�2
y
x
3
2
�1
miL28711_ch03_209-296 9/26/06 07:33 AM Page 252CONFIRMING PAGES
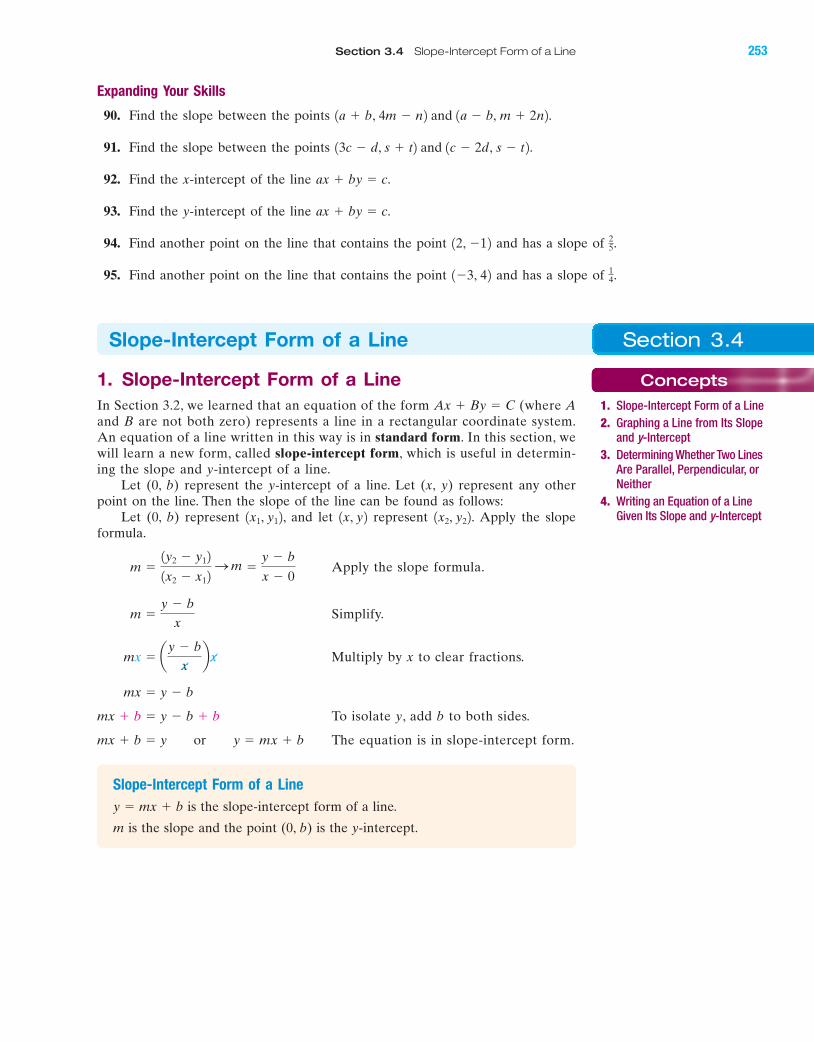
BA
Section 3.4 Slope-Intercept Form of a Line 253
Expanding Your Skills
90. Find the slope between the points .
91. Find the slope between the points .
92. Find the x-intercept of the line
93. Find the y-intercept of the line
94. Find another point on the line that contains the point and has a slope of
95. Find another point on the line that contains the point and has a slope of 14.1�3, 42
25.12, �12
ax � by � c.
ax � by � c.
13c � d, s � t2 and 1c � 2d, s � t2
1a � b, 4m � n2 and 1a � b, m � 2n2
Section 3.4Slope-Intercept Form of a Line
Concepts
1. Slope-Intercept Form of a Line2. Graphing a Line from Its Slope
and y-Intercept3. Determining Whether Two Lines
Are Parallel, Perpendicular, orNeither
4. Writing an Equation of a LineGiven Its Slope and y-Intercept
1. Slope-Intercept Form of a LineIn Section 3.2, we learned that an equation of the form (where Aand B are not both zero) represents a line in a rectangular coordinate system.An equation of a line written in this way is in standard form. In this section, wewill learn a new form, called slope-intercept form, which is useful in determin-ing the slope and y-intercept of a line.
Let (0, b) represent the y-intercept of a line. Let (x, y) represent any otherpoint on the line. Then the slope of the line can be found as follows:
Let (0, b) represent , and let represent Apply the slope formula.
Apply the slope formula.
Simplify.
Multiply by x to clear fractions.
To isolate y, add b to both sides.
The equation is in slope-intercept form.
Slope-Intercept Form of a Line
is the slope-intercept form of a line.
m is the slope and the point (0, b) is the y-intercept.
y � mx � b
mx � b � y or y � mx � b
mx � b � y � b � b
mx � y � b
mx � ay � b
xb x
m �y � b
x
m �1y2 � y12
1x2 � x12S m �
y � b
x � 0
1x2, y22.1x, y21x1, y12
Ax � By � C
miL28711_ch03_209-296 9/26/06 07:33 AM Page 253CONFIRMING PAGES
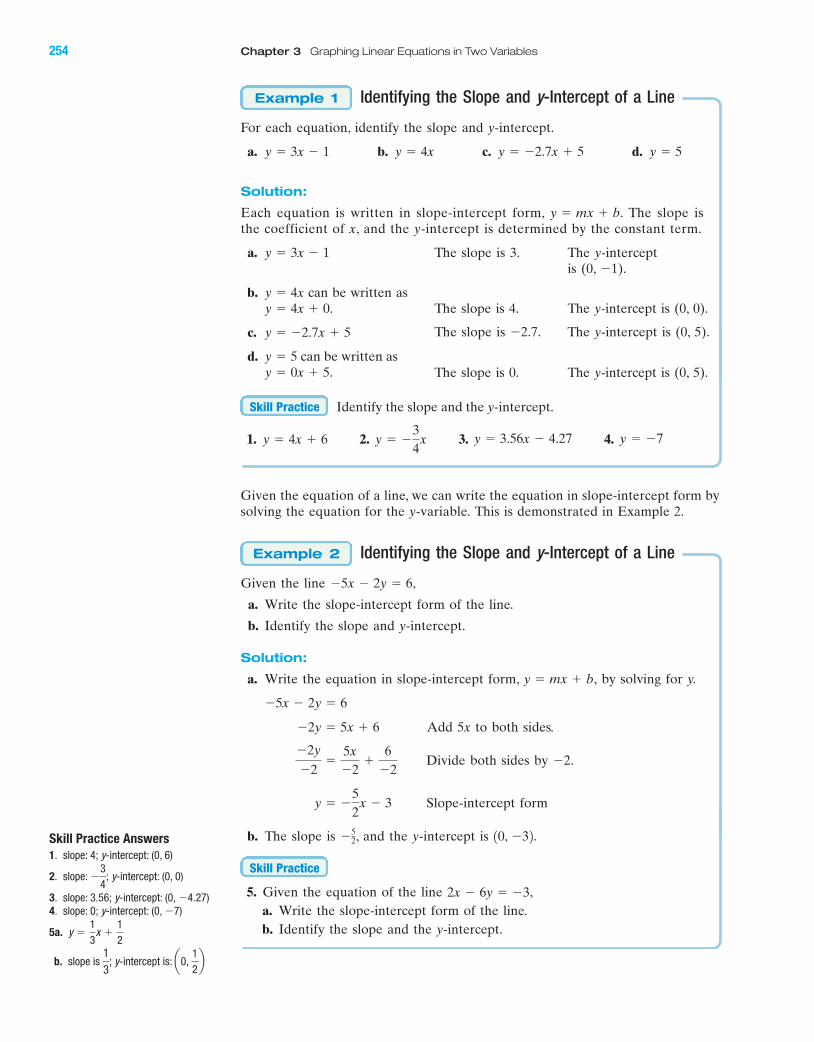
BA
254 Chapter 3 Graphing Linear Equations in Two Variables
Identifying the Slope and y-Intercept of a Line
For each equation, identify the slope and y-intercept.
a. b. c. d.
Solution:
Each equation is written in slope-intercept form, The slope isthe coefficient of x, and the y-intercept is determined by the constant term.
a.
b. can be written as
c.
d. can be written as
Identify the slope and the y-intercept.
1. 2. 3. 4. y � �7y � 3.56x � 4.27y � �34
xy � 4x � 6
Skill Practice
y � 0x � 5.y � 5
y � �2.7x � 5
y � 4x � 0.y � 4x
y � 3x � 1
y � mx � b.
y � 5y � �2.7x � 5y � 4xy � 3x � 1
Example 1
Identifying the Slope and y-Intercept of a Line
Given the line
a. Write the slope-intercept form of the line.
b. Identify the slope and y-intercept.
Solution:
a. Write the equation in slope-intercept form, by solving for y.
Add 5x to both sides.
Divide both sides by
Slope-intercept form
b. The slope is , and the y-intercept is
5. Given the equation of the line ,a. Write the slope-intercept form of the line.b. Identify the slope and the y-intercept.
2x � 6y � �3
Skill Practice
10, �32.�52
y � �52
x � 3
�2. �2y
�2�
5x�2
�6
�2
�2y � 5x � 6
�5x � 2y � 6
y � mx � b,
�5x � 2y � 6,
Example 2
The slope is 3. The y-interceptis (0, �1).
The slope is �2.7. The y-intercept is (0, 5).
The slope is 4. The y-intercept is (0, 0).
The slope is 0. The y-intercept is (0, 5).
Given the equation of a line, we can write the equation in slope-intercept form bysolving the equation for the y-variable. This is demonstrated in Example 2.
Skill Practice Answers
1. slope: 4; y-intercept: (0, 6)
2. slope: ; y-intercept: (0, 0)
3. slope: 3.56; y-intercept: (0, �4.27)4. slope: 0; y-intercept: (0, �7)
5a.
b. slope is y-intercept is: a0, 12b
13
;
y �13
x �12
�34
miL28711_ch03_209-296 9/26/06 07:33 AM Page 254CONFIRMING PAGES
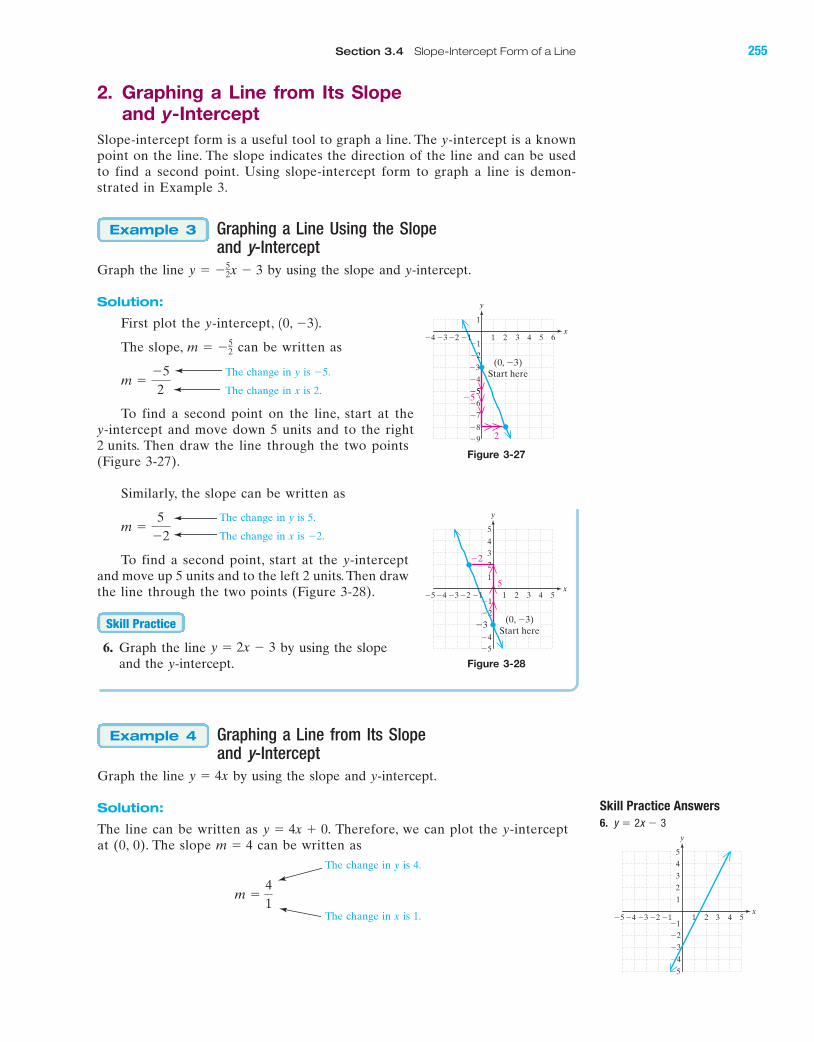
Graphing a Line from Its Slopeand y-Intercept
Graph the line by using the slope and y-intercept.
Solution:
The line can be written as Therefore, we can plot the y-interceptat (0, 0). The slope can be written as
m �41
m � 4y � 4x � 0.
y � 4x
Example 4
Graphing a Line Using the Slopeand y-Intercept
Graph the line by using the slope and y-intercept.
Solution:
First plot the y-intercept,
The slope, can be written as
To find a second point on the line, start at the y-intercept and move down 5 units and to the right2 units. Then draw the line through the two points(Figure 3-27).
Similarly, the slope can be written as
To find a second point, start at the y-interceptand move up 5 units and to the left 2 units. Then drawthe line through the two points (Figure 3-28).
6. Graph the line by using the slopeand the y-intercept.
y � 2x � 3
Skill Practice
m �5
�2
m ��52
m � �52
10, �32.
y � �52x � 3
Example 3
BA
Section 3.4 Slope-Intercept Form of a Line 255
The change in y is 5.
The change in y is 4.
The change in x is 1.
2. Graphing a Line from Its Slopeand y-Intercept
Slope-intercept form is a useful tool to graph a line. The y-intercept is a knownpoint on the line. The slope indicates the direction of the line and can be usedto find a second point. Using slope-intercept form to graph a line is demon-strated in Example 3.
The change in y is �5.
The change in x is 2.
Figure 3-27
2
�5
y
x1 2 3 4 5 6
�2�1
�3
�4
�5
�6
�7
�8
�9
�5
�1�2�3�4
1
(0, �3)Start here
Figure 3-28
�2
5
y
x1 2 3 4 5
�2�1
�3�4�5
�2�3�4�5
1
23
4
5
(0, �3)Start here
�1
The change in x is �2.
Skill Practice Answers
6.
�5�4
�4
�3
�2
�5
3
4
5
�2 �1�3
1
3 52 4
2
1�1
x
y
y � 2x � 3
miL28711_ch03_209-296 9/26/06 12:17 PM Page 255CONFIRMING PAGES
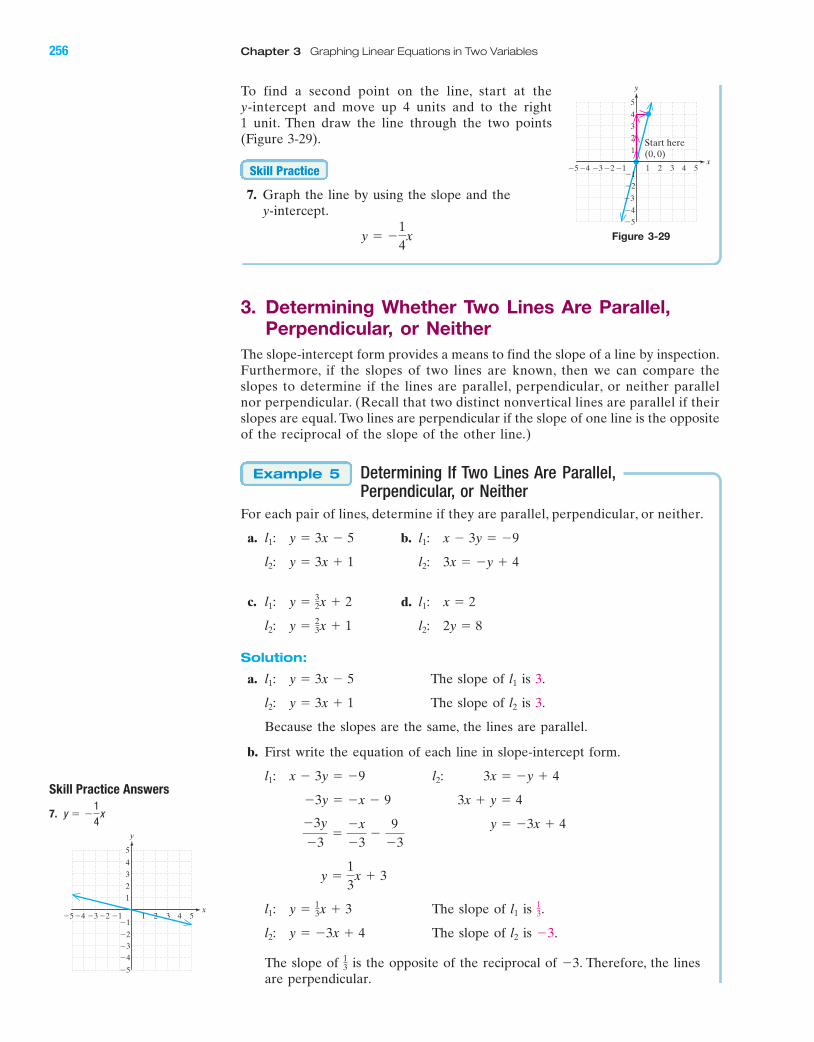
256 Chapter 3 Graphing Linear Equations in Two Variables
To find a second point on the line, start at they-intercept and move up 4 units and to the right1 unit. Then draw the line through the two points(Figure 3-29).
7. Graph the line by using the slope and they-intercept.
3. Determining Whether Two Lines Are Parallel,Perpendicular, or Neither
The slope-intercept form provides a means to find the slope of a line by inspection.Furthermore, if the slopes of two lines are known, then we can compare theslopes to determine if the lines are parallel, perpendicular, or neither parallelnor perpendicular. (Recall that two distinct nonvertical lines are parallel if theirslopes are equal. Two lines are perpendicular if the slope of one line is the oppositeof the reciprocal of the slope of the other line.)
Determining If Two Lines Are Parallel,Perpendicular, or Neither
For each pair of lines, determine if they are parallel, perpendicular, or neither.
a.
c.
Solution:
a. The slope of is 3.
The slope of is 3.
Because the slopes are the same, the lines are parallel.
b. First write the equation of each line in slope-intercept form.
The slope of is .
The slope of is .
The slope of is the opposite of the reciprocal of . Therefore, the linesare perpendicular.
�313
�3l2l2: y � �3x � 4
13l1l1: y � 1
3x � 3
y �13
x � 3
y � �3x � 4�3y
�3�
�x�3
�9
�3
3x � y � 4�3y � �x � 9
l2: 3x � �y � 4l1: x � 3y � �9
l2l2: y � 3x � 1
l1l1: y � 3x � 5
l2: y � 23x � 1
l1: y � 32x � 2
l2: y � 3x � 1
l1: y � 3x � 5
Example 5
y � �14
x
Skill Practice
b.
d.
l2: 2y � 8
l1: x � 2
l2: 3x � �y � 4
l1: x � 3y � �9
Figure 3-29
y
x1 2 3 4 5
�5
�1�2�3�4�5
1
23
4
5
Start here(0, 0)
�2�1
�3
�4
Skill Practice Answers
7.
4 5�4�5 �3 1 2 3�1
�2�3�4
�5
21
4
5
3
�1�2
y
x
y � �14
x
BAmiL28711_ch03_209-296 9/26/06 07:34 AM Page 256CONFIRMING PAGES
Section 3.4 Slope-Intercept Form of a Line 257
c. The slope of l1 is .
The slope of l2 is .
The slopes are not the same. Therefore, the lines are not parallel. Thevalues of the slopes are reciprocals, but they are not opposite in sign.Therefore, the lines are not perpendicular. The lines are neither parallelnor perpendicular.
d. The equation represents a vertical line because the equation is inthe form
The equation can be simplified to which represents ahorizontal line.
In this example, we do not need to analyze the slopes because verticallines and horizontal lines are perpendicular.
For each pair of lines determine if they are parallel, perpendicular,or neither.
8. 9.
10. 11.
4. Writing an Equation of a Line Given ItsSlope and y-Intercept
The slope-intercept form of a line can be used to write an equation of a linewhen the slope is known and the y-intercept is known.
Writing an Equation of a Line UsingSlope-Intercept Form
Write an equation of the line with a slope of and y-intercept (0, 8).
Solution:
The slope is given as , and the y-intercept (0, b) is given as (0, 8). Sub-stitute the values into the slope-intercept form of a line.
12. Write an equation of the line with slope of and y-intercept 10, �102.�4
Skill Practice
y �23
x � 8
y � mx � b
m � 23 and b � 8,
m � 23
23
Example 6
y �56
x �12
y � �5y �56
x �12
5x � 1 � �yy � �3x � 15
x � 5y � 10y � 3x � 5
Skill Practice
y � 4,2y � 8
x � k.x � 2
23l2: y � 2
3x � 1
32l1: y � 3
2x � 2
x � 6
Skill Practice Answers
8. Neither 9. Perpendicular10. Parallel 11. Perpendicular12. y � �4x � 10
BAmiL28711_ch03_209-296 9/26/06 07:34 AM Page 257CONFIRMING PAGES
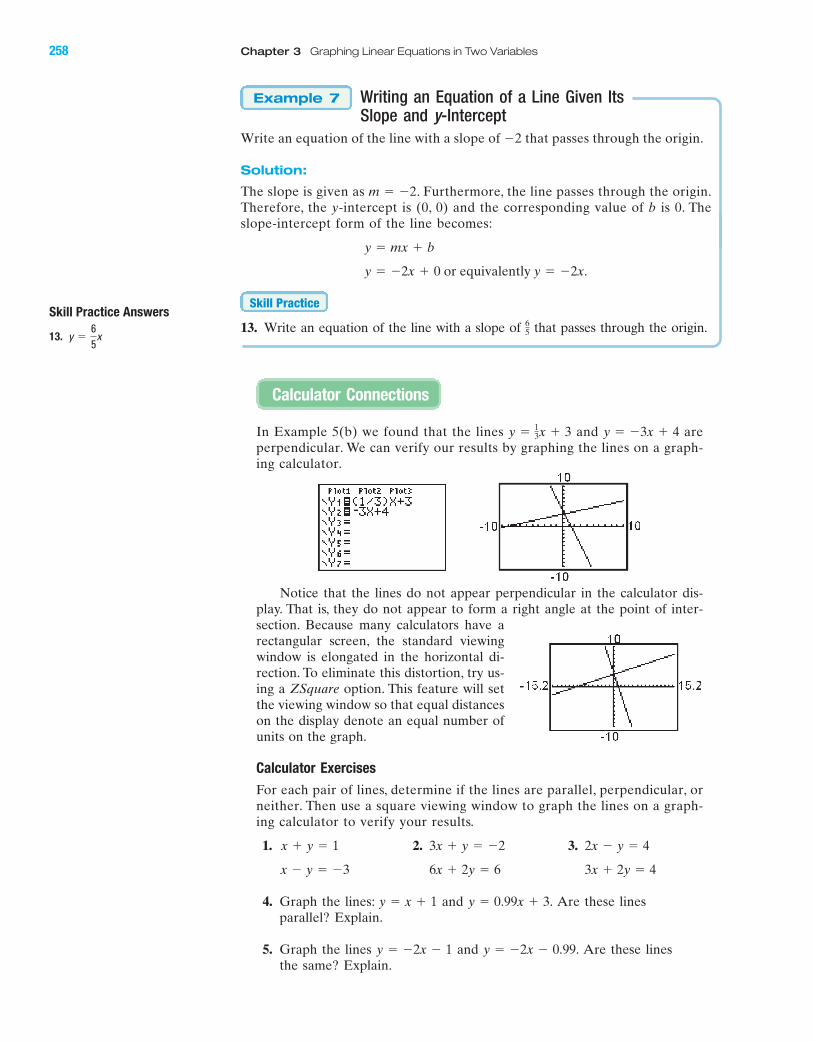
Writing an Equation of a Line Given ItsSlope and y-Intercept
Write an equation of the line with a slope of �2 that passes through the origin.
Solution:
The slope is given as . Furthermore, the line passes through the origin.Therefore, the y-intercept is (0, 0) and the corresponding value of b is 0. Theslope-intercept form of the line becomes:
13. Write an equation of the line with a slope of that passes through the origin.65
Skill Practice
y � �2x � 0 or equivalently y � �2x.
y � mx � b
m � �2
Example 7
Skill Practice Answers
13. y �65
x
258 Chapter 3 Graphing Linear Equations in Two Variables
In Example 5(b) we found that the lines and areperpendicular. We can verify our results by graphing the lines on a graph-ing calculator.
Notice that the lines do not appear perpendicular in the calculator dis-play. That is, they do not appear to form a right angle at the point of inter-section. Because many calculators have arectangular screen, the standard viewingwindow is elongated in the horizontal di-rection. To eliminate this distortion, try us-ing a ZSquare option. This feature will setthe viewing window so that equal distanceson the display denote an equal number ofunits on the graph.
Calculator Exercises
For each pair of lines, determine if the lines are parallel, perpendicular, orneither. Then use a square viewing window to graph the lines on a graph-ing calculator to verify your results.
1. 2. 3.
4. Graph the lines: and Are these linesparallel? Explain.
5. Graph the lines and Are these linesthe same? Explain.
y � �2x � 0.99.y � �2x � 1
y � 0.99x � 3.y � x � 1
3x � 2y � 46x � 2y � 6x � y � �3
2x � y � 43x � y � �2x � y � 1
y � �3x � 4y � 13x � 3
Calculator Connections
BAmiL28711_ch03_209-296 9/26/06 07:34 AM Page 258CONFIRMING PAGES
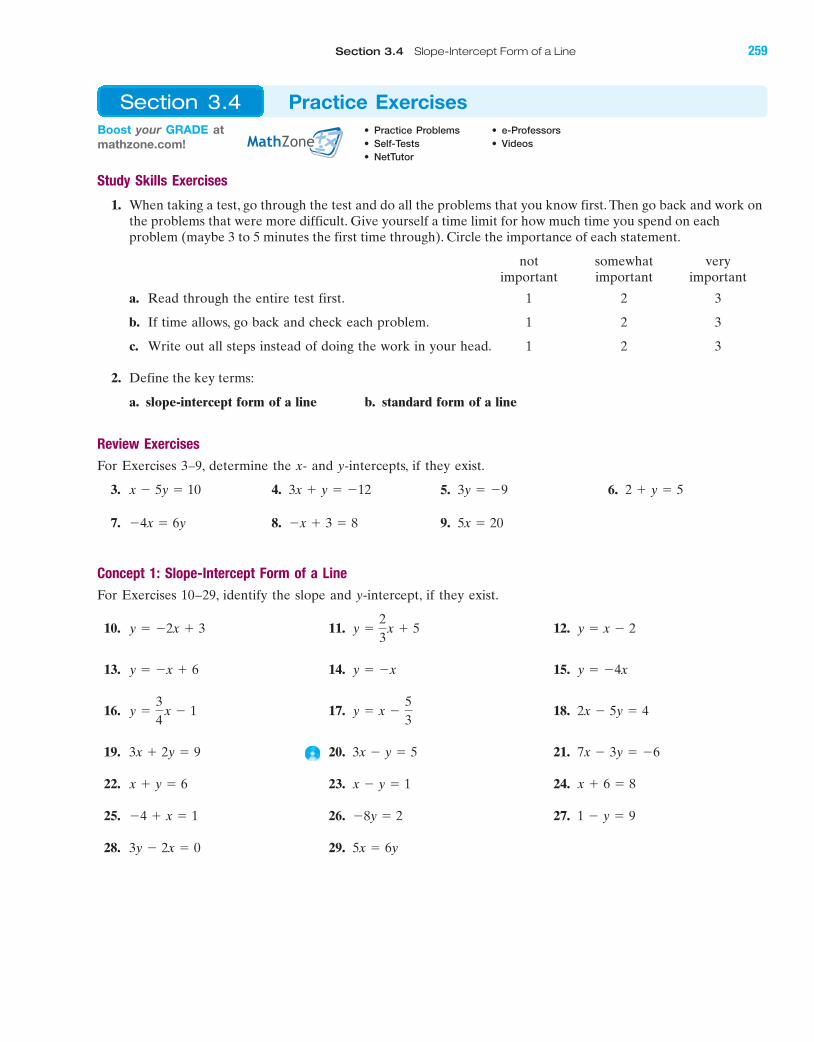
Section 3.4 Slope-Intercept Form of a Line 259
Study Skills Exercises
1. When taking a test, go through the test and do all the problems that you know first. Then go back and work onthe problems that were more difficult. Give yourself a time limit for how much time you spend on eachproblem (maybe 3 to 5 minutes the first time through). Circle the importance of each statement.
not somewhat veryimportant important important
a. Read through the entire test first. 1 2 3
b. If time allows, go back and check each problem. 1 2 3
c. Write out all steps instead of doing the work in your head. 1 2 3
2. Define the key terms:
a. slope-intercept form of a line b. standard form of a line
Review Exercises
For Exercises 3–9, determine the x- and y-intercepts, if they exist.
3. 4. 5. 6.
7. 8. 9.
Concept 1: Slope-Intercept Form of a Line
For Exercises 10–29, identify the slope and y-intercept, if they exist.
10. 11. 12.
13. 14. 15.
16. 17. 18.
19. 20. 21.
22. 23. 24.
25. 26. 27.
28. 29. 5x � 6y3y � 2x � 0
1 � y � 9�8y � 2�4 � x � 1
x � 6 � 8x � y � 1x � y � 6
7x � 3y � �63x � y � 53x � 2y � 9
2x � 5y � 4y � x �53
y �34
x � 1
y � �4xy � �xy � �x � 6
y � x � 2y �23
x � 5y � �2x � 3
5x � 20�x � 3 � 8�4x � 6y
2 � y � 53y � �93x � y � �12x � 5y � 10
Boost your GRADE atmathzone.com!
• Practice Problems • e-Professors
• Self-Tests • Videos
• NetTutor
Section 3.4 Practice Exercises
BAmiL28711_ch03_209-296 9/26/06 12:18 PM Page 259CONFIRMING PAGES
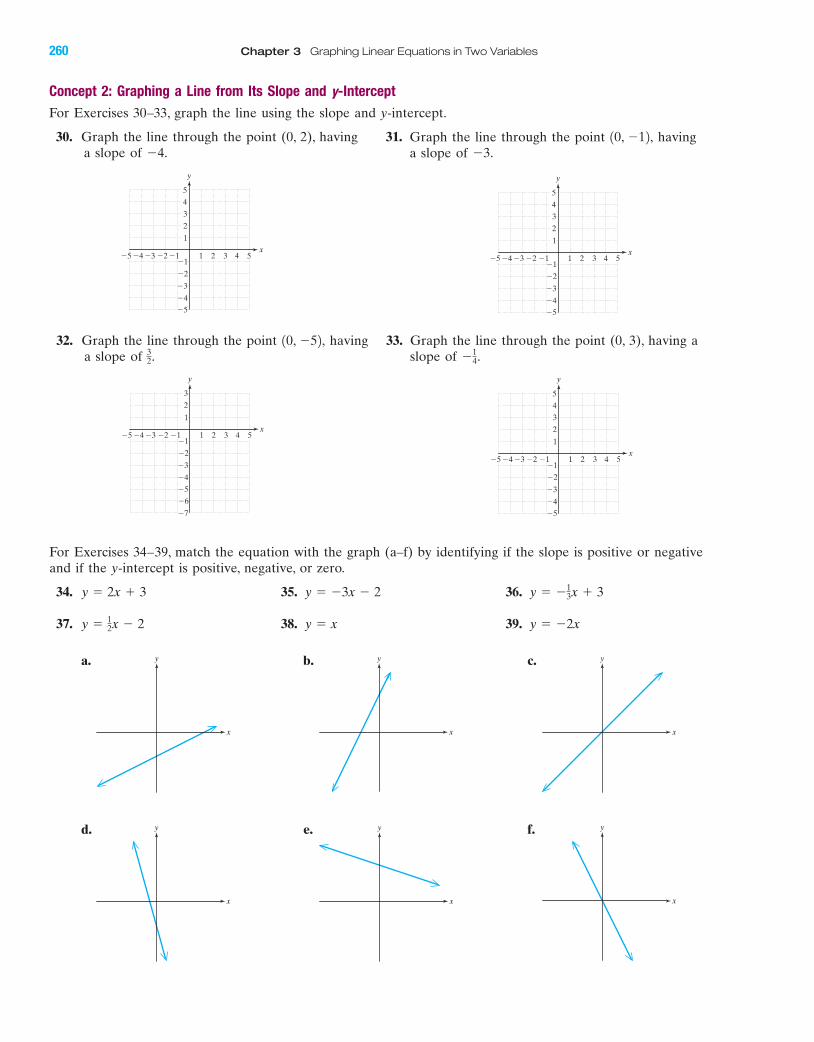
Concept 2: Graphing a Line from Its Slope and y-Intercept
For Exercises 30–33, graph the line using the slope and y-intercept.
30. Graph the line through the point (0, 2), having 31. Graph the line through the point havinga slope of a slope of �3.�4.
10, �12,
4 5�4�5 �3 1 2 3
�2
�3
�4�5
4
5
1
�1�2
y
x
3
2
�1 4 5�4�5 �3 1 2 3
�2
�3
�4�5
4
5
1
�1�2
y
x
3
2
�1
32. Graph the line through the point having 33. Graph the line through the point (0, 3), having a a slope of slope of �1
4.32.
10, �52,
4 5�4�5 �3 1 2 3
�2
�3
�4�5
�6
�7
1
�1�2
y
x
3
2
�1
4 5�4�5 �3 1 2 3
�2
�3
�4�5
4
5
1
�1�2
y
x
3
2
�1
260 Chapter 3 Graphing Linear Equations in Two Variables
For Exercises 34–39, match the equation with the graph (a–f) by identifying if the slope is positive or negativeand if the y-intercept is positive, negative, or zero.
34. 35. 36.
37. 38. 39. y � �2xy � xy � 12x � 2
y � �13x � 3y � �3x � 2y � 2x � 3
y
x
y
x
y
x
y
x
y
x
y
x
a. b. c.
d. e. f.
BAmiL28711_ch03_209-296 9/26/06 07:34 AM Page 260CONFIRMING PAGES
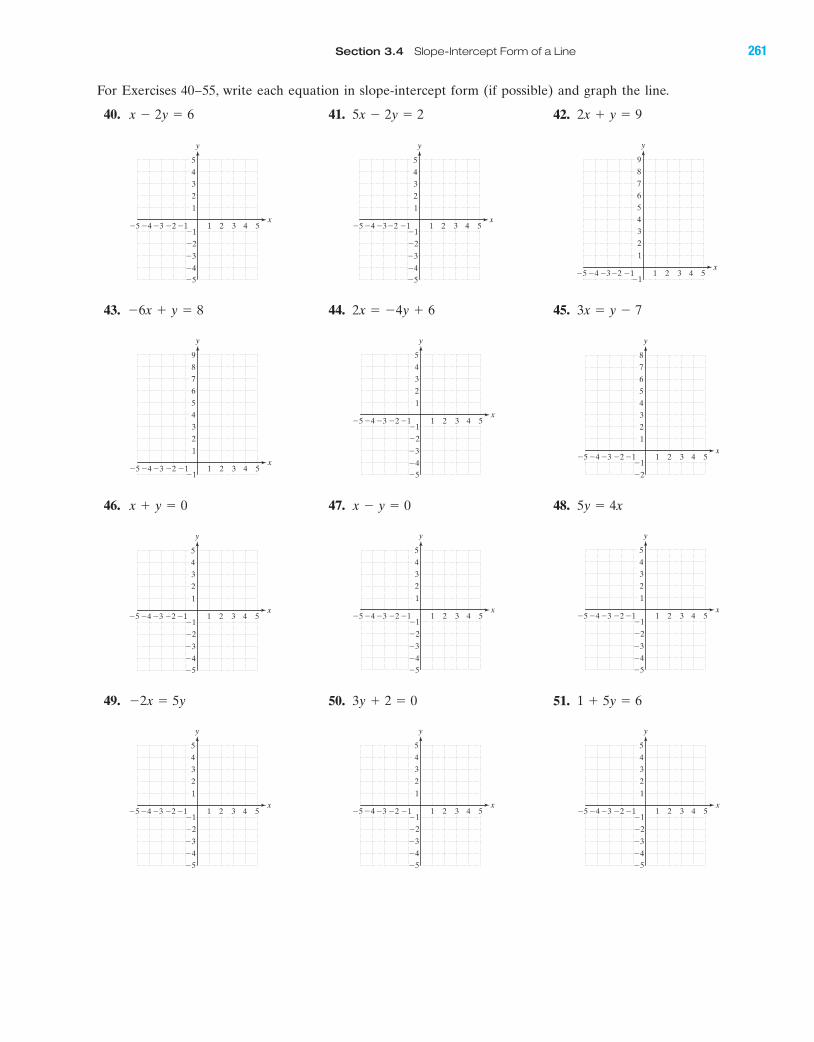
Section 3.4 Slope-Intercept Form of a Line 261
46. 47. 48. 5y � 4xx � y � 0x � y � 0
4 5�4�5 �3 1 2 3
�2
�3
�4�5
4
5
1
�1�2
y
x
3
2
�1
49. 50. 51. 1 � 5y � 63y � 2 � 0�2x � 5y
4 5�4�5 �3 1 2 3
�2
�3
�4�5
4
5
1
�1�2
y
x
3
2
�14 5�4�5 �3 1 2 3
�2
�3
�4�5
4
5
1
�1�2
y
x
3
2
�1
4 5�4�5 �3 1 2 3
�2
�3
�4�5
4
5
1
�1�2
y
x
3
2
�14 5�4�5 �3 1 2 3
�2
�3
�4�5
4
5
1
�1�2
y
x
3
2
�14 5�4�5 �3 1 2 3
�2
�3
�4�5
4
5
1
�1�2
y
x
3
2
�1
43. 44. 45. 3x � y � 72x � �4y � 6�6x � y � 8
4 5�4�5 �3 1 2 3
�2
�3
�4�5
4
5
1
�1�2
y
x
3
2
�1
4 5�4�5 �3 1 2 3
�2
4
5
6
7
8
1
�1�2
y
x
3
2
�14 5�4�5 �3 1 2 3
4
5
6
7
8
9
1
�1�2
y
x
3
2
�1
4 5�4�5 �3 1 2 3
�2
�3
�4�5
4
5
1
�1�2
y
x
3
2
�14 5�4�5 �3 1 2 3
�2
�3
�4�5
4
5
1
�1�2
y
x
3
2
�1
For Exercises 40–55, write each equation in slope-intercept form (if possible) and graph the line.
40. 41. 42. 2x � y � 95x � 2y � 2x � 2y � 6
4 5�4�5 �3 1 2 3
4
5
6
7
8
9
1
�1�2
y
x
3
2
�1
BAmiL28711_ch03_209-296 9/26/06 07:34 AM Page 261CONFIRMING PAGES
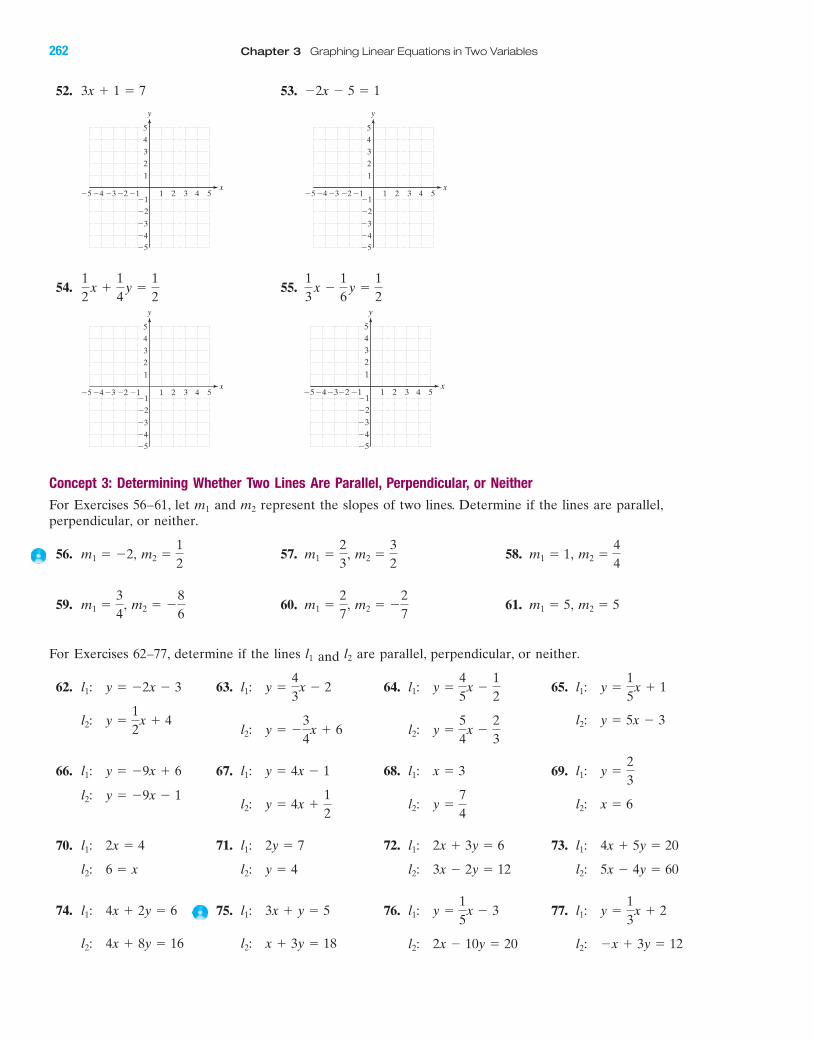
52. 53. �2x � 5 � 13x � 1 � 7
54. 55.13
x �16
y �12
12
x �14
y �12
4 5�4�5 �3 1 2 3
�2
�3
�4�5
4
5
1
�1�2
y
x
3
2
�14 5�4�5 �3 1 2 3
�2
�3
�4�5
4
5
1
�1�2
y
x
3
2
�1
4 5�4�5 �3 1 2 3
�2
�3
�4�5
4
5
1
�1�2
y
x
3
2
�14 5�4�5 �3 1 2 3
�2�3�4�5
45
1
�1�2
y
x
32
�1
262 Chapter 3 Graphing Linear Equations in Two Variables
Concept 3: Determining Whether Two Lines Are Parallel, Perpendicular, or Neither
For Exercises 56–61, let and represent the slopes of two lines. Determine if the lines are parallel,perpendicular, or neither.
56. 57. 58.
59. 60. 61.
For Exercises 62–77, determine if the lines and are parallel, perpendicular, or neither.
62. 63. 64. 65.
66. 67. 68. 69.
70. 71. 72. 73.
74. 75. 76. 77.
l2: �x � 3y � 12l2: 2x � 10y � 20l2: x � 3y � 18l2: 4x � 8y � 16
l1: y �13
x � 2l1: y �15
x � 3l1: 3x � y � 5l1: 4x � 2y � 6
l2: 5x � 4y � 60l2: 3x � 2y � 12l2: y � 4l2: 6 � x
l1: 4x � 5y � 20l1: 2x � 3y � 6l1: 2y � 7l1: 2x � 4
l2: x � 6l2: y �74
l2: y � 4x �12
l2: y � �9x � 1
l1: y �23
l1: x � 3l1: y � 4x � 1l1: y � �9x � 6
l2: y � 5x � 3l2: y �
54
x �23
l2: y � �34
x � 6l2: y �
12
x � 4
l1: y �15
x � 1l1: y �45
x �12
l1: y �43
x � 2l1: y � �2x � 3
l2l1
m2 � 5m1 � 5,m2 � �27
m1 �27
,m2 � �86
m1 �34
,
m2 �44
m1 � 1,m2 �32
m1 �23
,m2 �12
m1 � �2,
m2m1
BAmiL28711_ch03_209-296 9/26/06 07:34 AM Page 262CONFIRMING PAGES
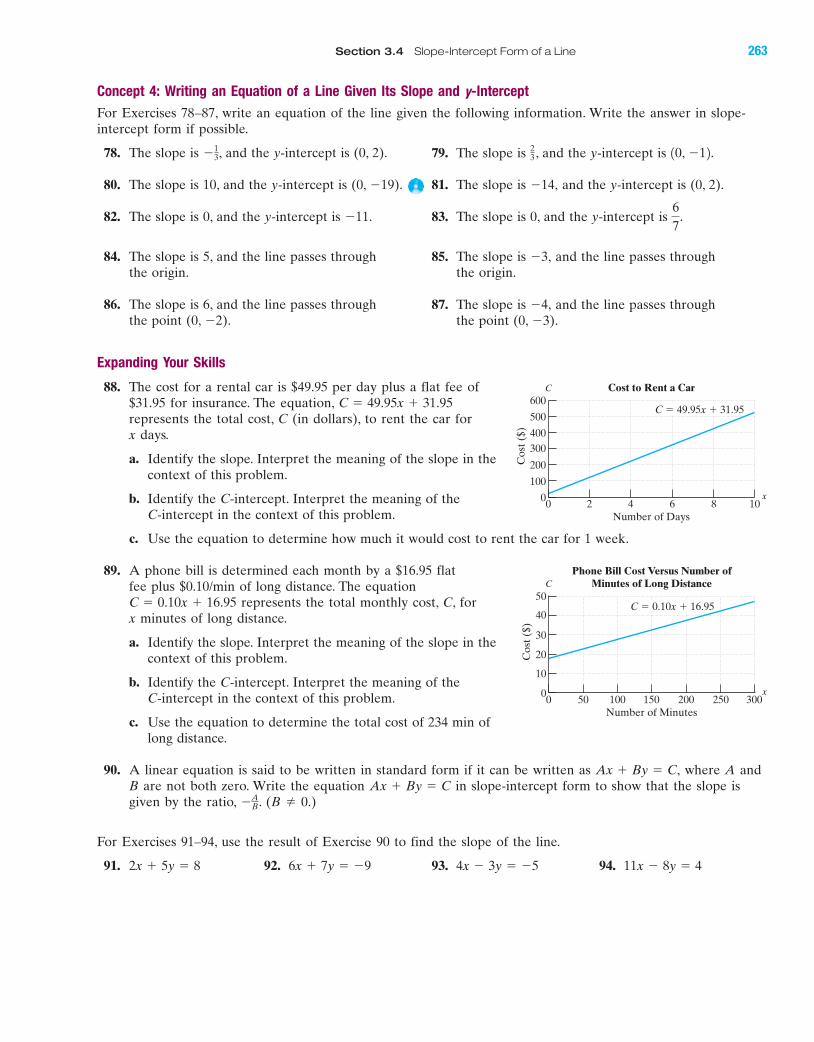
Section 3.4 Slope-Intercept Form of a Line 263
Concept 4: Writing an Equation of a Line Given Its Slope and y-Intercept
For Exercises 78–87, write an equation of the line given the following information. Write the answer in slope-intercept form if possible.
78. The slope is , and the y-intercept is (0, 2). 79. The slope is , and the y-intercept is
80. The slope is 10, and the y-intercept is (0, �19). 81. The slope is and the y-intercept is (0, 2).
82. The slope is 0, and the y-intercept is 83. The slope is 0, and the y-intercept is
84. The slope is 5, and the line passes through 85. The slope is and the line passes through the origin. the origin.
86. The slope is 6, and the line passes through 87. The slope is and the line passes through the point (0, �2). the point (0, �3).
Expanding Your Skills
88. The cost for a rental car is $49.95 per day plus a flat fee of$31.95 for insurance. The equation,represents the total cost, C (in dollars), to rent the car forx days.
a. Identify the slope. Interpret the meaning of the slope in thecontext of this problem.
b. Identify the C-intercept. Interpret the meaning of theC-intercept in the context of this problem.
c. Use the equation to determine how much it would cost to rent the car for 1 week.
89. A phone bill is determined each month by a $16.95 flat fee plus $0.10/min of long distance. The equation
represents the total monthly cost, C, for x minutes of long distance.
a. Identify the slope. Interpret the meaning of the slope in thecontext of this problem.
b. Identify the C-intercept. Interpret the meaning of the C-intercept in the context of this problem.
c. Use the equation to determine the total cost of 234 min oflong distance.
90. A linear equation is said to be written in standard form if it can be written as where A andB are not both zero. Write the equation in slope-intercept form to show that the slope isgiven by the ratio, . (B � 0.)
For Exercises 91–94, use the result of Exercise 90 to find the slope of the line.
91. 92. 93. 94. 11x � 8y � 44x � 3y � �56x � 7y � �92x � 5y � 8
�AB
Ax � By � CAx � By � C,
C � 0.10x � 16.95
C � 49.95x � 31.95
�4,
�3,
67
.�11.
�14,
10, �12.23�1
3
600
00 2 4 6 8 10
Cos
t ($)
Number of Days
C � 49.95x � 31.95
Cost to Rent a Car
500
400300
200
100
C
x
50
00 50 100 150 200 300250
Cos
t ($)
Number of Minutes
C � 0.10x � 16.95
Phone Bill Cost Versus Number ofMinutes of Long Distance
40
30
20
10
C
x
BAmiL28711_ch03_209-296 9/26/06 07:34 AM Page 263CONFIRMING PAGES
BA
264 Chapter 3 Graphing Linear Equations in Two Variables
Section 3.5 Point-Slope Formula
Concepts
1. Writing an Equation of a Line Using the Point-SlopeFormula
2. Writing an Equation of a Line Through Two Points
3. Writing an Equation of a Line Parallel or Perpendicularto Another Line
4. Different Forms of LinearEquations: A Summary
1. Writing an Equation of a Line Using the Point-Slope Formula
In Section 3.4, the slope-intercept form of a line was used as a tool to constructan equation of a line. Another useful tool to determine an equation of a line isthe point-slope formula. The point-slope formula can be derived from the slopeformula as follows:
Suppose a line passes through a given point and has slope m. If is any other point on the line, then:
Slope formula
Clear fractions
or
Point-slope formula
Point-Slope Formula
The point-slope formula is given by
where m is the slope of the line and is a known point on the line.
Example 1 demonstrates how to use the point-slope formula to find an equa-tion of a line when a point on the line and slope are given.
Writing an Equation of a Line Using the Point-Slope Formula
Use the point-slope formula to find an equation of the line having a slopeof 3 and passing through the point Write the answer in slope-intercept form.
Solution:
The slope of the line is given:
A point on the line is given:
The point-slope formula:
Substitute
Simplify. Because the final answer is required inslope-intercept form, simplify the equation andsolve for y.
Apply the distributive property.
Subtract 4 from both sides.
y � 3x � 2
y � 3x � 6 � 4
y � 4 � 3x � 6
y � 4 � 31x � 22
m � 3, x1 � �2, and y1 � �4. y � 1�42 � 3 3x � 1�22 4
y � y1 � m1x � x12
1x1, y12 � 1�2, �42.
m � 3.
1�2, �42.
Example 1
1x1, y12
y � y1 � m1x � x12
y � y1 � m1x � x12
m1x � x12 � y � y1
m1x � x12 �y � y1
x � x1 1x � x12
m �y � y1
x � x1
1x, y21x1, y12
miL28711_ch03_209-296 9/26/06 07:35 AM Page 264CONFIRMING PAGES
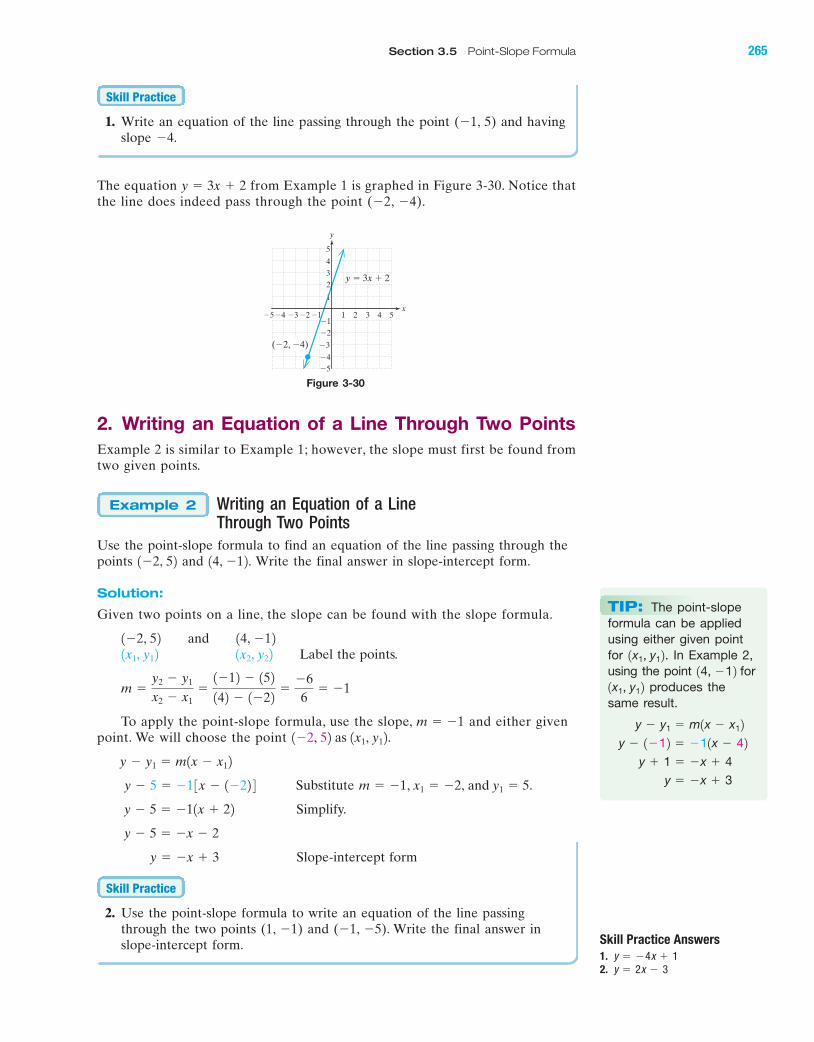
1. Write an equation of the line passing through the point (�1, 5) and havingslope �4.
The equation from Example 1 is graphed in Figure 3-30. Notice thatthe line does indeed pass through the point (�2, �4).
y � 3x � 2
Skill Practice
Section 3.5 Point-Slope Formula 265
BA
Figure 3-30
(�2, �4)
y � 3x � 2
y
x1 2 3 4 5
�5
�1�2�3�4�5
1
23
4
5
�2�1
�3
�4
2. Writing an Equation of a Line Through Two PointsExample 2 is similar to Example 1; however, the slope must first be found fromtwo given points.
Writing an Equation of a Line Through Two Points
Use the point-slope formula to find an equation of the line passing through thepoints and Write the final answer in slope-intercept form.
Solution:
Given two points on a line, the slope can be found with the slope formula.
Label the points.
To apply the point-slope formula, use the slope, and either givenpoint. We will choose the point
Substitute
Simplify.
Slope-intercept form
2. Use the point-slope formula to write an equation of the line passingthrough the two points (1, �1) and (�1, �5). Write the final answer inslope-intercept form.
Skill Practice
y � �x � 3
y � 5 � �x � 2
y � 5 � �11x � 22
m � �1, x1 � �2, and y1 � 5. y � 5 � �1 3x � 1�22 4
y � y1 � m1x � x12
1�2, 52 as 1x1, y12.m � �1
m �y2 � y1
x2 � x1�1�12 � 152
142 � 1�22�
�66
� �1
1x2, y221x1, y121�2, 52 and 14, �12
14, �12.1�2, 52
Example 2
Skill Practice Answers
1.
2. y � 2x � 3y � �4x � 1
TIP: The point-slopeformula can be appliedusing either given pointfor In Example 2,using the point
produces thesame result.
y � �x � 3
y � 1 � �x � 4
y � 1�12 � �11x � 42
y � y1 � m1x � x12
1x1, y12
14, �12 for 1x1, y12.
miL28711_ch03_209-296 9/26/06 12:18 PM Page 265CONFIRMING PAGES
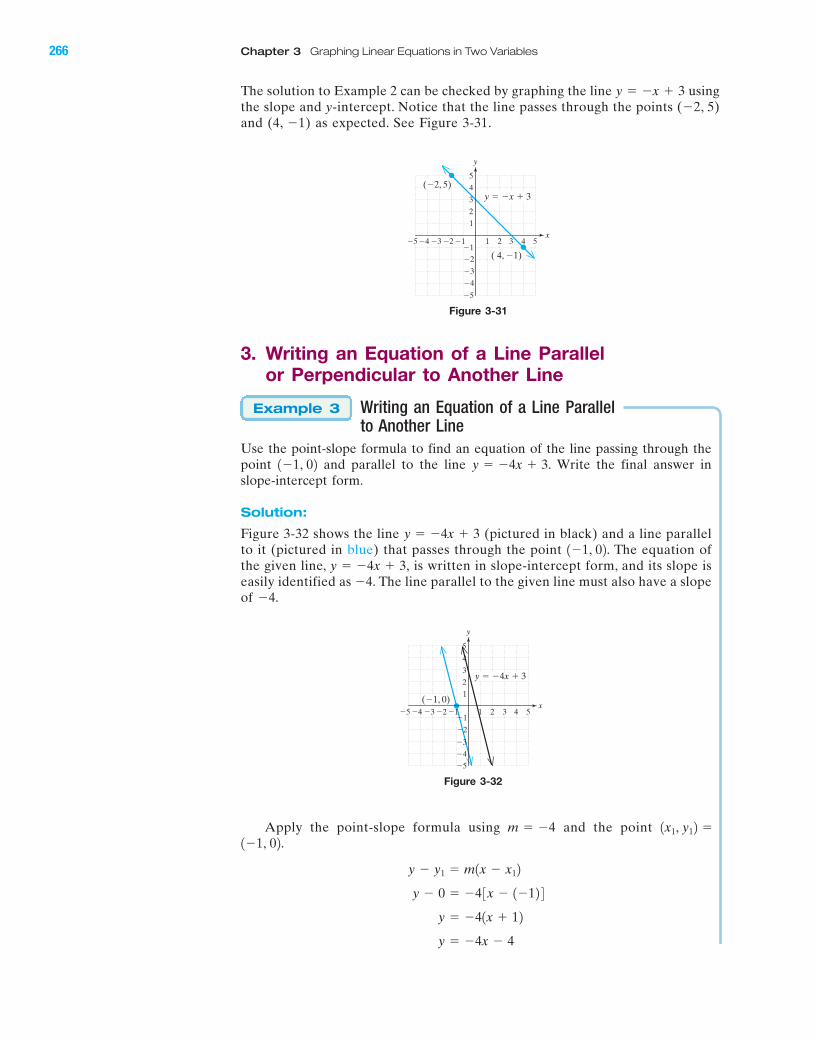
y � �4x � 4
y � �41x � 12
y � 0 � �4 3x � 1�12 4
y � y1 � m1x � x12
3. Writing an Equation of a Line Parallel or Perpendicular to Another Line
Writing an Equation of a Line Parallel to Another Line
Use the point-slope formula to find an equation of the line passing through thepoint and parallel to the line Write the final answer inslope-intercept form.
Solution:
Figure 3-32 shows the line (pictured in black) and a line parallelto it (pictured in blue) that passes through the point The equation ofthe given line, is written in slope-intercept form, and its slope iseasily identified as The line parallel to the given line must also have a slopeof �4.
�4.y � �4x � 3,
1�1, 02.y � �4x � 3
y � �4x � 3.1�1, 02
Example 3
The solution to Example 2 can be checked by graphing the line usingthe slope and y-intercept. Notice that the line passes through the points (�2, 5)and (4, �1) as expected. See Figure 3-31.
y � �x � 3
266 Chapter 3 Graphing Linear Equations in Two Variables
BA
Figure 3-31
�5�4
�4
�3
�2
�5
2
3
4
5
�1�2 �1�3
1
3 51 2x
4
(�2, 5)
( 4, �1)
y � �x � 3
y
Figure 3-32
4 5�4�5 �3 1 2 3
�2
�1
�3
�4�5
5
1
�1�2
y
x
4
3
2
(�1, 0)
y � �4x � 3
Apply the point-slope formula using and the point 1�1, 02.
1x1, y12 �m � �4
miL28711_ch03_209-296 9/26/06 07:35 AM Page 266CONFIRMING PAGES
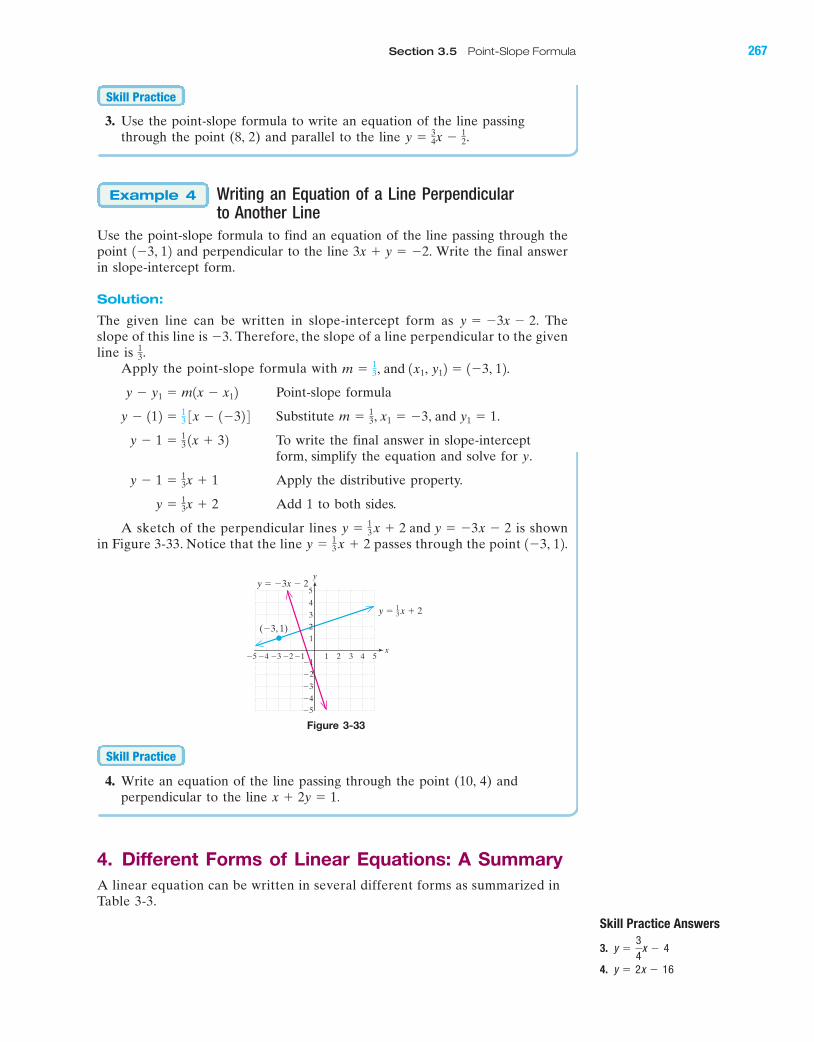
3. Use the point-slope formula to write an equation of the line passingthrough the point (8, 2) and parallel to the line
Writing an Equation of a Line Perpendicular to Another Line
Use the point-slope formula to find an equation of the line passing through thepoint and perpendicular to the line Write the final answerin slope-intercept form.
Solution:
The given line can be written in slope-intercept form as Theslope of this line is Therefore, the slope of a line perpendicular to the givenline is
Apply the point-slope formula with
Point-slope formula
Substitute
To write the final answer in slope-interceptform, simplify the equation and solve for y.
Apply the distributive property.
Add 1 to both sides.
A sketch of the perpendicular lines is shownin Figure 3-33. Notice that the line passes through the point 1�3, 12.y � 1
3 x � 2y � 1
3 x � 2 and y � �3x � 2
y � 13x � 2
y � 1 � 13x � 1
y � 1 � 13 1x � 32
m � 13, x1 � �3, and y1 � 1. y � 112 � 1
3 3x � 1�32 4
y � y1 � m1x � x12
m � 13, and 1x1, y12 � 1�3, 12.
13.
�3.y � �3x � 2.
3x � y � �2.1�3, 12
Example 4
y � 34x � 1
2.
Skill Practice
Section 3.5 Point-Slope Formula 267
BA
Figure 3-33
4 5�4�5 �3 1 2 3
�2
�1
�3
�4�5
5
1
�1�2
y
x
4
3
2(�3, 1)
y � �3x � 2
y � x � 213
Skill Practice Answers
3.
4. y � 2x � 16
y �34
x � 4
4. Write an equation of the line passing through the point (10, 4) and perpendicular to the line .x � 2y � 1
Skill Practice
4. Different Forms of Linear Equations: A SummaryA linear equation can be written in several different forms as summarized inTable 3-3.
miL28711_ch03_209-296 9/26/06 07:35 AM Page 267CONFIRMING PAGES
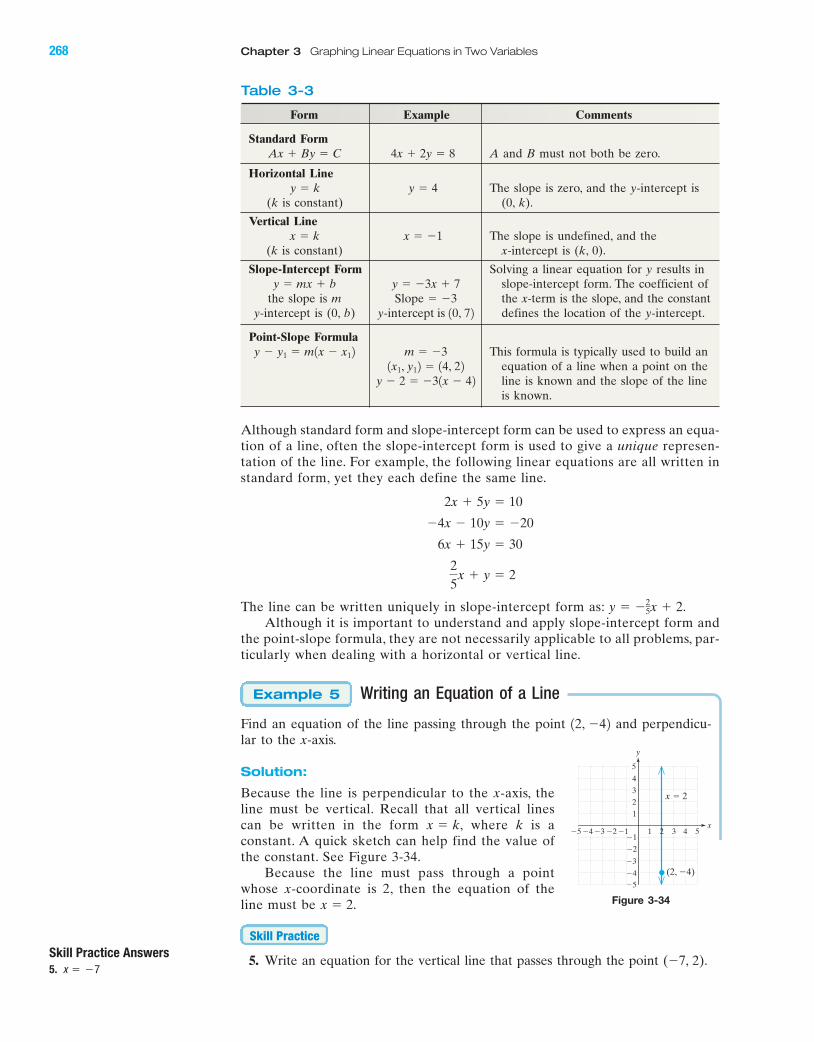
268 Chapter 3 Graphing Linear Equations in Two Variables
BA
Form Example Comments
Standard FormA and B must not both be zero.
Horizontal LineThe slope is zero, and the y-intercept is
(k is constant) (0, k).
Vertical LineThe slope is undefined, and the
(k is constant) x-intercept is (k, 0).
Slope-Intercept Form Solving a linear equation for y results inslope-intercept form. The coefficient of
the slope is m the x-term is the slope, and the constanty-intercept is (0, b) defines the location of the y-intercept.
Point-Slope FormulaThis formula is typically used to build an
equation of a line when a point on the line is known and the slope of the line is known.
y � 2 � �31x � 421x1, y12 � 14, 22
m � �3y � y1 � m1x � x12
y-intercept is 10, 72Slope � �3y � �3x � 7y � mx � b
x � �1x � k
y � 4y � k
4x � 2y � 8Ax � By � C
Table 3-3
Skill Practice Answers
5. x � �7
Although standard form and slope-intercept form can be used to express an equa-tion of a line, often the slope-intercept form is used to give a unique represen-tation of the line. For example, the following linear equations are all written instandard form, yet they each define the same line.
The line can be written uniquely in slope-intercept form as:Although it is important to understand and apply slope-intercept form and
the point-slope formula, they are not necessarily applicable to all problems, par-ticularly when dealing with a horizontal or vertical line.
Writing an Equation of a Line
Find an equation of the line passing through the point and perpendicu-lar to the x-axis.
Solution:
Because the line is perpendicular to the x-axis, theline must be vertical. Recall that all vertical linescan be written in the form where k is aconstant. A quick sketch can help find the value ofthe constant. See Figure 3-34.
Because the line must pass through a pointwhose x-coordinate is 2, then the equation of theline must be
5. Write an equation for the vertical line that passes through the point (�7, 2).
Skill Practice
x � 2.
x � k,
12, �42
Example 5
y � �25x � 2.
25
x � y � 2
6x � 15y � 30
�4x � 10y � �20
2x � 5y � 10
Figure 3-34
4 5�4�5 �3 1 2 3
�2
�1
�3
�4�5
5
1
�1�2
y
x
4
3
2
(2, �4)
x � 2
miL28711_ch03_209-296 9/26/06 07:35 AM Page 268CONFIRMING PAGES
Study Skills Exercises
1. Prepare a one-page summary sheet with the most important information that you need for the test. On theday of the test, look at this sheet several times to refresh your memory instead of trying to memorize newinformation.
2. Define the key term: point-slope formula
Review Exercises
For Exercises 3–6, graph the equations.
3. 4. y � �2x2x � 3y � �3
Section 3.5 Point-Slope Formula 269
BA
Boost your GRADE atmathzone.com!
• Practice Problems • e-Professors
• Self-Tests • Videos
• NetTutor
Section 3.5 Practice Exercises
4 5�4�5 �3 1 2 3
�2
�3
�4�5
4
5
1
�1�2
y
x
3
2
�1
4 5�4�5 �3 1 2 3
�2
�3
�4�5
4
5
1
�1�2
y
x
3
2
�1
4 5�4�5 �3 1 2 3
�2
�3
�4�5
4
5
1
�1�2
y
x
3
2
�1
4 5�4�5 �3 1 2 3
�2
�3
�4�5
�6
�7
�8
1
�1�2
y
x
2
�1
5. 6. y �45
x3 � y � 9
For Exercises 7–10, find the slope of the line that passes through the given points.
7. 8.
9. 10.
Concept 1: Writing an Equation of a Line Using the Point-Slope Formula
For Exercises 11–22, use the point-slope formula (if possible) to write an equation of the line given the followinginformation.
11. The slope is 3, and the line passes through the point
12. The slope is , and the line passes through the point
13. The slope is , and the line passes through the point 1�3, �22.�4
11, �52.�2
1�2, 12.
16.1, 2.52 and 16.1, �1.521�2, 52 and 15, 52
12, �42 and 1�2, 4211, �32 and 12, 62
miL28711_ch03_209-296 9/26/06 07:35 AM Page 269CONFIRMING PAGES
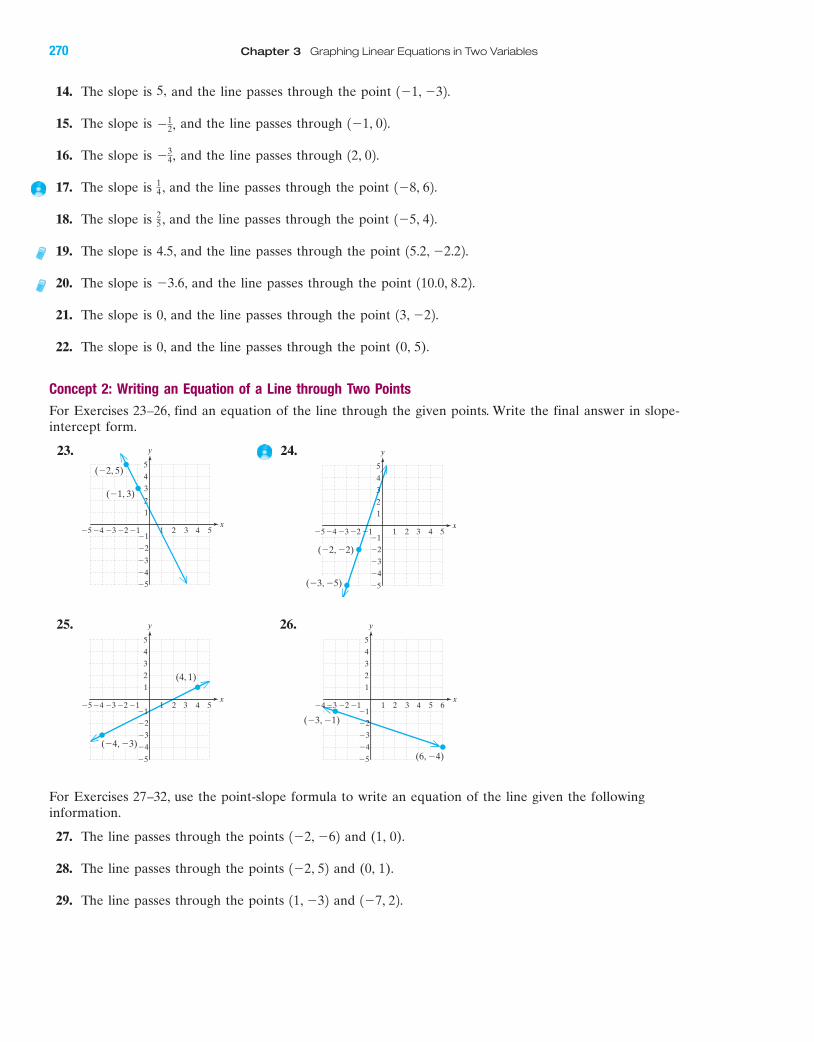
14. The slope is and the line passes through the point
15. The slope is and the line passes through
16. The slope is and the line passes through
17. The slope is , and the line passes through the point
18. The slope is , and the line passes through the point
19. The slope is 4.5, and the line passes through the point
20. The slope is , and the line passes through the point
21. The slope is 0, and the line passes through the point
22. The slope is 0, and the line passes through the point (0, 5).
Concept 2: Writing an Equation of a Line through Two Points
For Exercises 23–26, find an equation of the line through the given points. Write the final answer in slope-intercept form.
23. 24.
25. 26.
For Exercises 27–32, use the point-slope formula to write an equation of the line given the followinginformation.
27. The line passes through the points and (1, 0).
28. The line passes through the points and (0, 1).
29. The line passes through the points and 1�7, 22.11, �32
1�2, 52
1�2, �62
(�3, �1)
(6, �4)
y
�4
�3
�2
�5
3
4
5
1
2
�1�4�3 �1�2 4 632 51
x�5�4
�4
�3
�2
�5
3
4
5
�2 �1�3
1
3 52 4
(4, 1)
(�4, �3)
y
2
1�1
x
�5�4
�4
�3
�2
�5
4
5
�1�2�3
1
3 51 2 4
(�2, �2)
(�3, �5)
y
2
�1
3
x4 51 2 3
�2
�1
�3
�4�5
4
5
1
y
x
3
2
�4�5 �3 �1�2
(�1, 3)
(�2, 5)
13, �22.
110.0, 8.22.�3.6
15.2, �2.22.
1�5, 42.25
1�8, 62.14
12, 02.�34,
1�1, 02.�12,
1�1, �32.5,
270 Chapter 3 Graphing Linear Equations in Two Variables
BAmiL28711_ch03_209-296 9/26/06 07:35 AM Page 270CONFIRMING PAGES
30. The line passes through the points and
31. The line passes through the points (2.2, �3.3) and
32. The line passes through the points and
Concept 3: Writing an Equation of a Line Parallel or Perpendicular to Another Line
For Exercises 33–44, use the point-slope formula to write an equation of the line given the followinginformation.
33. The line passes through the point and is parallel to the line
34. The line passes through the point and is parallel to the line
35. The line passes through the point and is parallel to the line .
36. The line passes through the point and is parallel to the line .
37. The line passes through the point and is perpendicular to the line
38. The line passes through the point and is perpendicular to the line
39. The line passes through the point and is perpendicular to the line
40. The line passes through the point and is perpendicular to the line
41. The line passes through the point and is parallel to the line
42. The line passes through the point and is parallel to the line
43. The line passes through the point and is perpendicular to
44. The line passes through the point and is perpendicular to
Concept 4: Different Forms of Linear Equations: A Summary
For Exercises 45–50, match the form or formula on the left with its name on the right.
45. i. Standard form
46. ii. Point-slope formula
47. iii. Horizontal line
48. iv. Vertical line
49. v. Slope-intercept form
50. vi. Slope formulaAx � By � C
y � k
y � y1 � m1x � x12
m �y2 � y1
x2 � x1
y � mx � b
x � k
3x � 2y � 9.1�4, 32
4x � y � 3.1�2, �12
5x � y � �5.1�1, �72
3x � y � 6.14, 42
2x � y � 5.10, �82
�5x � y � 4.10, �62
y � 13 x � 5.1�2, �22
y � 12 x � 3.1�5, 22
5x � 3y � 612, 02
3x � 2y � 814, 02
y � 3 x � 1.14, �12
y � 4 x � 3.1�3, 12
1�0.3, 6.82.14.7, �2.22
112.2, �5.32.
1�1, �32.10, �42
Section 3.5 Point-Slope Formula 271
BAmiL28711_ch03_209-296 9/26/06 07:35 AM Page 271CONFIRMING PAGES
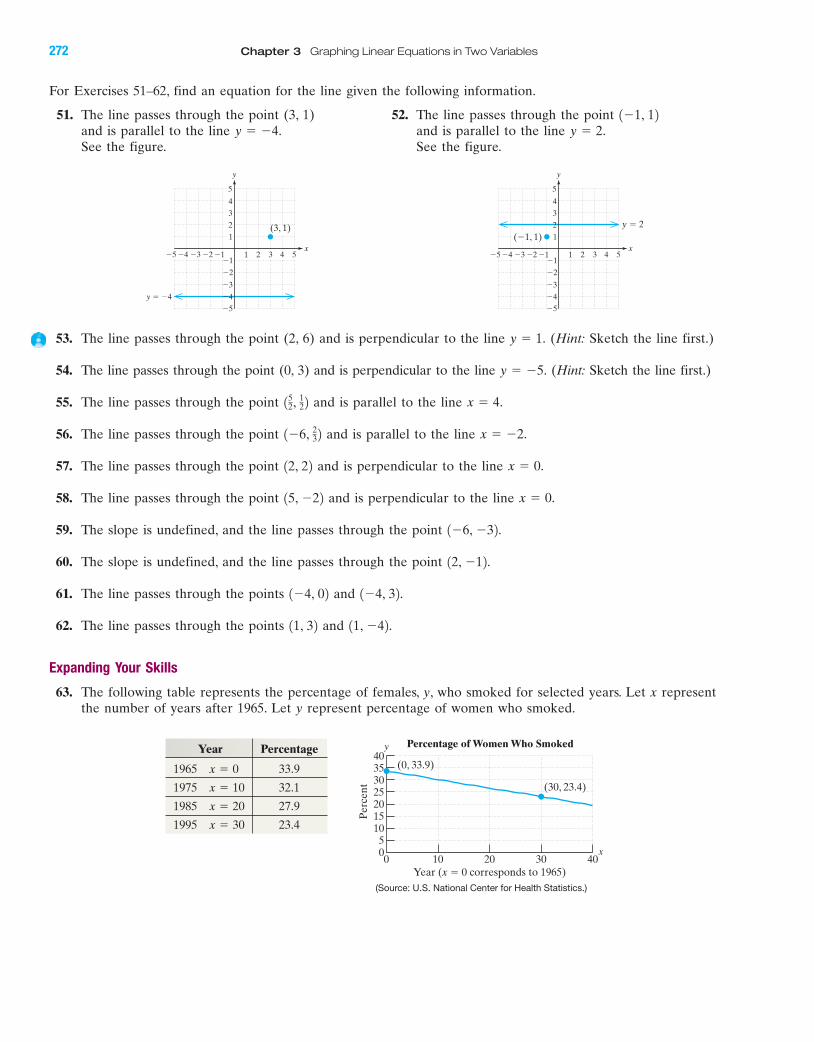
For Exercises 51–62, find an equation for the line given the following information.
51. The line passes through the point (3, 1) 52. The line passes through the point and is parallel to the line and is parallel to the line See the figure. See the figure.
y � 2.y � �4.1�1, 12
272 Chapter 3 Graphing Linear Equations in Two Variables
BA
4 51 2 3
�2
�1
�3
�4�5
5
1
y
x
4
3
2 (3, 1)
y � �4
�4�5 �3 �1�2 4 51 2 3
�2
�1
�3
�4�5
5
1
y
x
4
3
2
(�1, 1)y � 2
�4�5 �3 �1�2
53. The line passes through the point (2, 6) and is perpendicular to the line (Hint: Sketch the line first.)
54. The line passes through the point (0, 3) and is perpendicular to the line (Hint: Sketch the line first.)
55. The line passes through the point and is parallel to the line
56. The line passes through the point and is parallel to the line
57. The line passes through the point and is perpendicular to the line
58. The line passes through the point and is perpendicular to the line
59. The slope is undefined, and the line passes through the point
60. The slope is undefined, and the line passes through the point
61. The line passes through the points and
62. The line passes through the points and
Expanding Your Skills
63. The following table represents the percentage of females, y, who smoked for selected years. Let x representthe number of years after 1965. Let y represent percentage of women who smoked.
11, �42.11, 32
1�4, 32.1�4, 02
12, �12.
1�6, �32.
x � 0.15, �22
x � 0.12, 22
x � �2.1�6, 23 2
x � 4.152, 12 2
y � �5.
y � 1.
(Source: U.S. National Center for Health Statistics.)
Year Percentage
1965 33.9
1975 32.1
1985 27.9
1995 23.4x � 30
x � 20
x � 10
x � 040
Percentage of Women Who Smoked
35
0 10 20 30 40
Per
cent
Year (x � 0 corresponds to 1965)
302520151050
y
x
(30, 23.4)
(0, 33.9)
miL28711_ch03_209-296 9/26/06 08:58 PM Page 272CONFIRMING PAGES
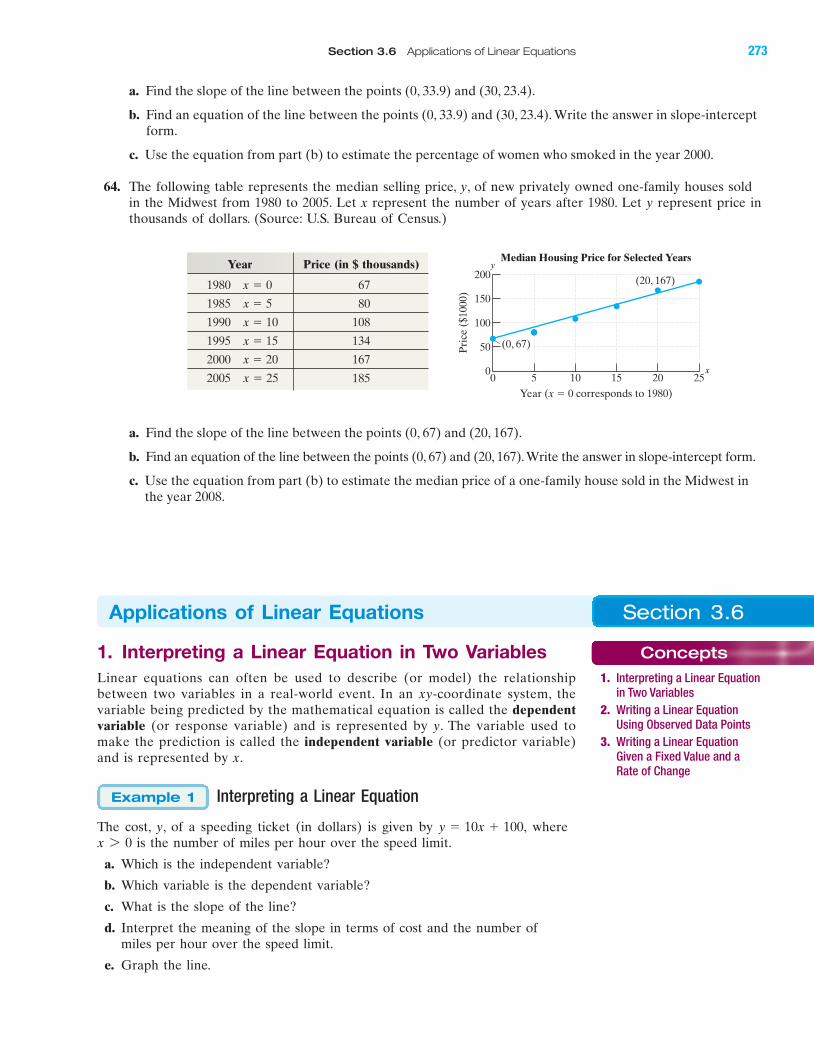
a. Find the slope of the line between the points (0, 33.9) and (30, 23.4).
b. Find an equation of the line between the points (0, 33.9) and (30, 23.4). Write the answer in slope-interceptform.
c. Use the equation from part (b) to estimate the percentage of women who smoked in the year 2000.
64. The following table represents the median selling price, y, of new privately owned one-family houses soldin the Midwest from 1980 to 2005. Let x represent the number of years after 1980. Let y represent price inthousands of dollars. (Source: U.S. Bureau of Census.)
Section 3.6 Applications of Linear Equations 273
BA
Year Price (in $ thousands)
1980 67
1985 80
1990 108
1995 134
2000 167
2005 185x � 25
x � 20
x � 15
x � 10
x � 5
x � 0200
Median Housing Price for Selected Years
0 5 10 15 25
Pri
ce (
$100
0)
Year (x � 0 corresponds to 1980)
50
100
150
020
y
x
(0, 67)
(20, 167)
a. Find the slope of the line between the points (0, 67) and (20, 167).
b. Find an equation of the line between the points (0, 67) and (20, 167).Write the answer in slope-intercept form.
c. Use the equation from part (b) to estimate the median price of a one-family house sold in the Midwest inthe year 2008.
Section 3.6Applications of Linear Equations
Concepts
1. Interpreting a Linear Equationin Two Variables
2. Writing a Linear EquationUsing Observed Data Points
3. Writing a Linear EquationGiven a Fixed Value and aRate of Change
1. Interpreting a Linear Equation in Two VariablesLinear equations can often be used to describe (or model) the relationshipbetween two variables in a real-world event. In an xy-coordinate system, thevariable being predicted by the mathematical equation is called the dependentvariable (or response variable) and is represented by y. The variable used tomake the prediction is called the independent variable (or predictor variable)and is represented by x.
Interpreting a Linear Equation
The cost, y, of a speeding ticket (in dollars) is given by whereis the number of miles per hour over the speed limit.
a. Which is the independent variable?
b. Which variable is the dependent variable?
c. What is the slope of the line?
d. Interpret the meaning of the slope in terms of cost and the number ofmiles per hour over the speed limit.
e. Graph the line.
x 7 0y � 10x � 100,
Example 1
miL28711_ch03_209-296 9/26/06 07:35 AM Page 273CONFIRMING PAGES
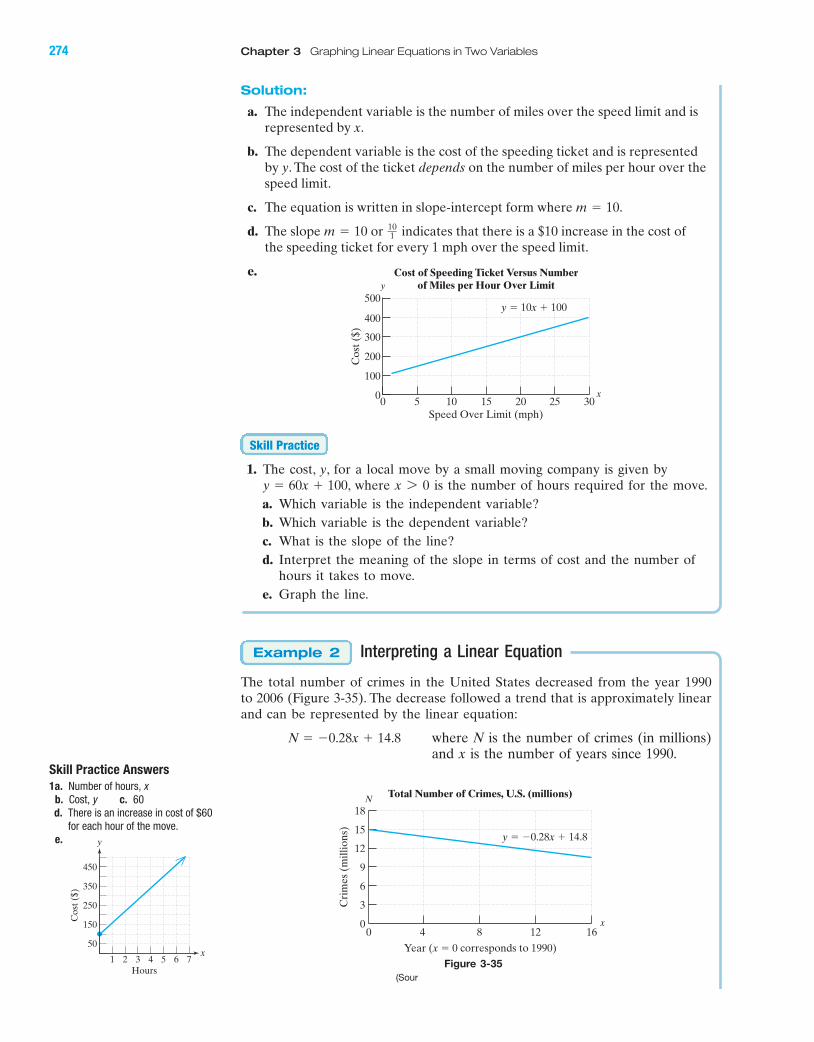
274 Chapter 3 Graphing Linear Equations in Two Variables
BA
21 3 4 5 6 7
Cos
t ($)
Hours
250
350
450
50
150
x
y
Skill Practice Answers
1a. Number of hours, xb. Cost, y c. 60d. There is an increase in cost of $60
for each hour of the move.e.
Solution:
a. The independent variable is the number of miles over the speed limit and isrepresented by x.
b. The dependent variable is the cost of the speeding ticket and is representedby y. The cost of the ticket depends on the number of miles per hour over thespeed limit.
c. The equation is written in slope-intercept form where
d. The slope or indicates that there is a $10 increase in the cost of the speeding ticket for every 1 mph over the speed limit.
e.
1. The cost, y, for a local move by a small moving company is given by, where is the number of hours required for the move.
a. Which variable is the independent variable?b. Which variable is the dependent variable?c. What is the slope of the line?d. Interpret the meaning of the slope in terms of cost and the number of
hours it takes to move.e. Graph the line.
Interpreting a Linear Equation
The total number of crimes in the United States decreased from the year 1990to 2006 (Figure 3-35). The decrease followed a trend that is approximately linearand can be represented by the linear equation:
where N is the number of crimes (in millions)and x is the number of years since 1990.
N � �0.28x � 14.8
Example 2
x 7 0y � 60x � 100
Skill Practice
500
00 5 10 15 20 25 30
Cos
t ($)
Speed Over Limit (mph)
y � 10x � 100
Cost of Speeding Ticket Versus Numberof Miles per Hour Over Limit
400
300
200
100
y
x
101m � 10
m � 10.
Figure 3-35(Sour
Year (x � 0 corresponds to 1990)
Cri
mes
(m
illio
ns)
Total Number of Crimes, U.S. (millions)
00 4 8 1612
3
9
12
15
18N
x
6
y � �0.28x � 14.8
miL28711_ch03_209-296 9/26/06 07:36 AM Page 274CONFIRMING PAGES
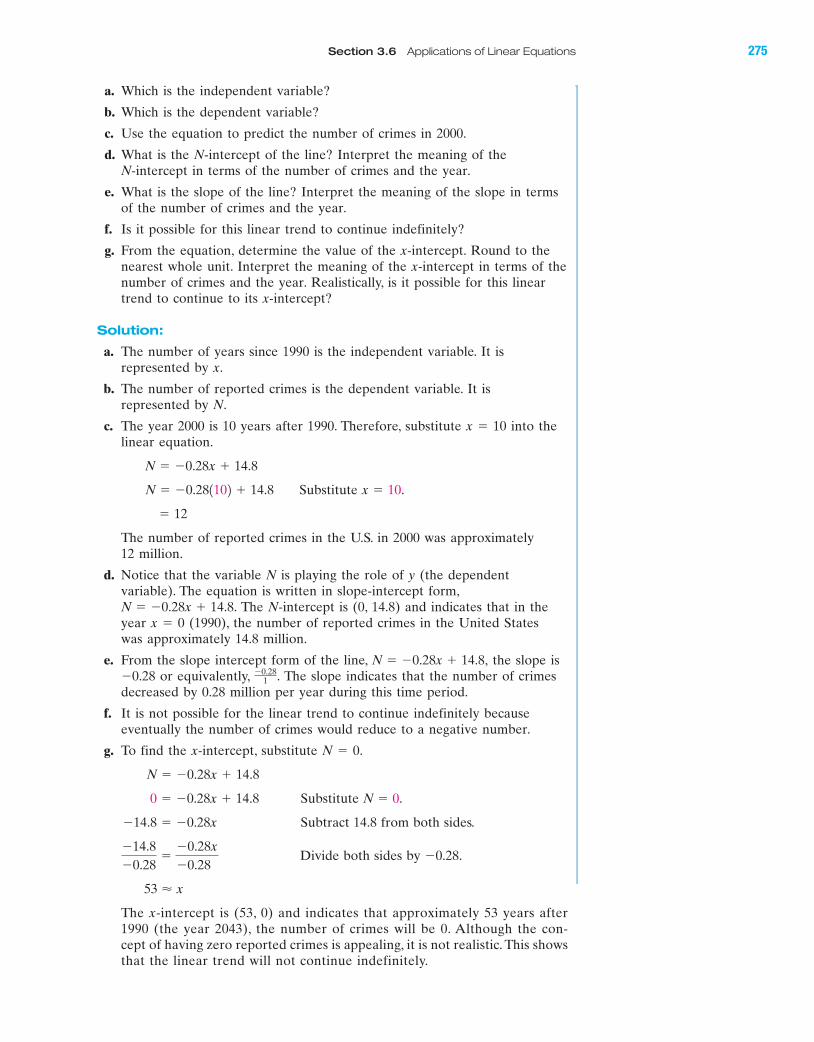
a. Which is the independent variable?
b. Which is the dependent variable?
c. Use the equation to predict the number of crimes in 2000.
d. What is the N-intercept of the line? Interpret the meaning of the N-intercept in terms of the number of crimes and the year.
e. What is the slope of the line? Interpret the meaning of the slope in termsof the number of crimes and the year.
f. Is it possible for this linear trend to continue indefinitely?
g. From the equation, determine the value of the x-intercept. Round to thenearest whole unit. Interpret the meaning of the x-intercept in terms of thenumber of crimes and the year. Realistically, is it possible for this lineartrend to continue to its x-intercept?
Solution:
a. The number of years since 1990 is the independent variable. It isrepresented by x.
b. The number of reported crimes is the dependent variable. It isrepresented by N.
c. The year 2000 is 10 years after 1990. Therefore, substitute x � 10 into thelinear equation.
Substitute x � 10.
� 12
The number of reported crimes in the U.S. in 2000 was approximately 12 million.
d. Notice that the variable N is playing the role of y (the dependentvariable). The equation is written in slope-intercept form,
The N-intercept is (0, 14.8) and indicates that in theyear x � 0 (1990), the number of reported crimes in the United Stateswas approximately 14.8 million.
e. From the slope intercept form of the line, the slope is�0.28 or equivalently, The slope indicates that the number of crimesdecreased by 0.28 million per year during this time period.
f. It is not possible for the linear trend to continue indefinitely becauseeventually the number of crimes would reduce to a negative number.
g. To find the x-intercept, substitute N � 0.
Substitute
Subtract 14.8 from both sides.
Divide both sides by �0.28.
The x-intercept is (53, 0) and indicates that approximately 53 years after1990 (the year 2043), the number of crimes will be 0. Although the con-cept of having zero reported crimes is appealing, it is not realistic. This showsthat the linear trend will not continue indefinitely.
53 � x
�14.8�0.28
��0.28x�0.28
�14.8 � �0.28x
N � 0.0 � �0.28x � 14.8
N � �0.28x � 14.8
�0.281 .
N � �0.28x � 14.8,
N � �0.28x � 14.8.
N � �0.281102 � 14.8
N � �0.28x � 14.8
Section 3.6 Applications of Linear Equations 275
BAmiL28711_ch03_209-296 9/26/06 07:36 AM Page 275CONFIRMING PAGES
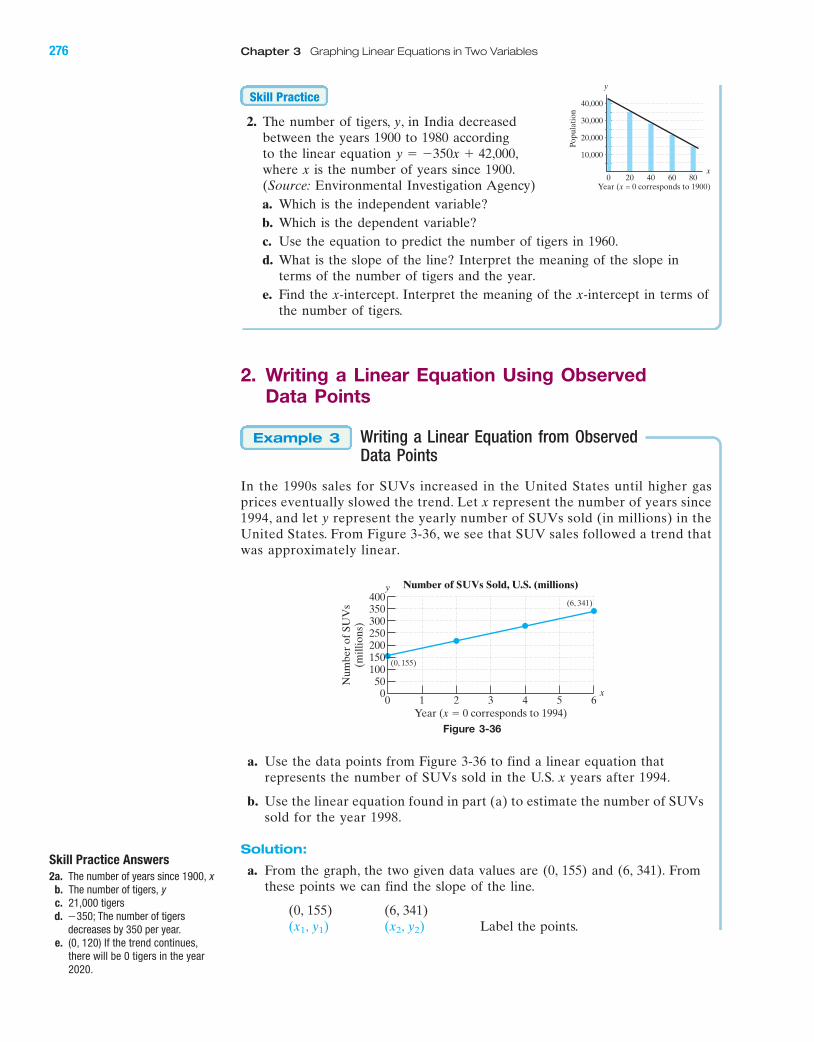
276 Chapter 3 Graphing Linear Equations in Two Variables
BA
Skill Practice Answers
2a. The number of years since 1900, xb. The number of tigers, yc. 21,000 tigersd. The number of tigers
decreases by 350 per year.e. (0, 120) If the trend continues,
there will be 0 tigers in the year2020.
�350;
2. The number of tigers, y, in India decreasedbetween the years 1900 to 1980 accordingto the linear equation where x is the number of years since 1900.(Source: Environmental Investigation Agency)a. Which is the independent variable?b. Which is the dependent variable?c. Use the equation to predict the number of tigers in 1960.d. What is the slope of the line? Interpret the meaning of the slope in
terms of the number of tigers and the year.e. Find the x-intercept. Interpret the meaning of the x-intercept in terms of
the number of tigers.
2. Writing a Linear Equation Using ObservedData Points
Writing a Linear Equation from ObservedData Points
In the 1990s sales for SUVs increased in the United States until higher gasprices eventually slowed the trend. Let x represent the number of years since1994, and let y represent the yearly number of SUVs sold (in millions) in theUnited States. From Figure 3-36, we see that SUV sales followed a trend thatwas approximately linear.
Figure 3-36
a. Use the data points from Figure 3-36 to find a linear equation thatrepresents the number of SUVs sold in the U.S. x years after 1994.
b. Use the linear equation found in part (a) to estimate the number of SUVssold for the year 1998.
Solution:
a. From the graph, the two given data values are (0, 155) and (6, 341). Fromthese points we can find the slope of the line.
(0, 155) (6, 341)(x1, y1) (x2, y2) Label the points.
400Number of SUVs Sold, U.S. (millions)
0 21 43 65
Num
ber
of S
UV
s(m
illio
ns)
Year (x � 0 corresponds to 1994)
100150
50
200250300350
0
y
x
(0, 155)
(6, 341)
Example 3
y � �350x � 42,000,
Skill Practice40,000
0 20 40 60 80
Popu
lati
on
Year (x = 0 corresponds to 1900)
30,000
20,000
10,000
y
x
miL28711_ch03_209-296 9/26/06 07:36 AM Page 276CONFIRMING PAGES
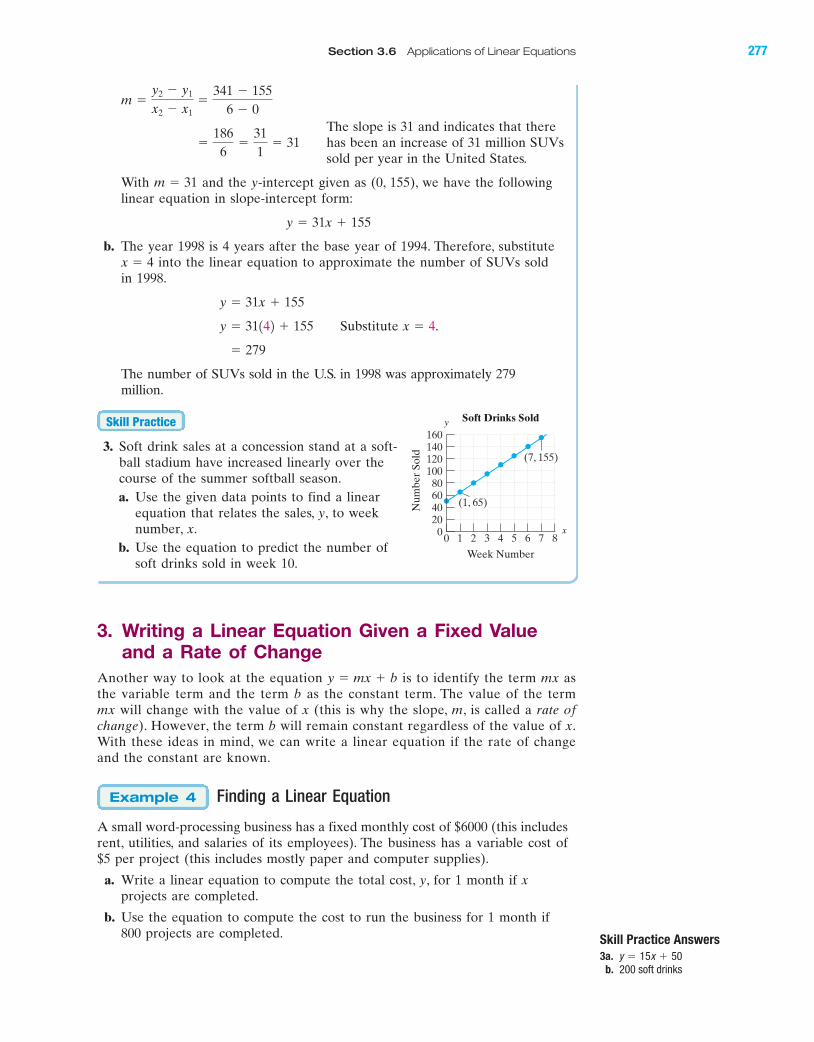
The slope is 31 and indicates that therehas been an increase of 31 million SUVssold per year in the United States.
With and the y-intercept given as (0, 155), we have the followinglinear equation in slope-intercept form:
b. The year 1998 is 4 years after the base year of 1994. Therefore, substituteinto the linear equation to approximate the number of SUVs sold
in 1998.
Substitute
� 279
The number of SUVs sold in the U.S. in 1998 was approximately 279million.
3. Soft drink sales at a concession stand at a soft-ball stadium have increased linearly over thecourse of the summer softball season.a. Use the given data points to find a linear
equation that relates the sales, y, to weeknumber, x.
b. Use the equation to predict the number ofsoft drinks sold in week 10.
3. Writing a Linear Equation Given a Fixed Value and a Rate of Change
Another way to look at the equation is to identify the term mx asthe variable term and the term b as the constant term. The value of the termmx will change with the value of x (this is why the slope, m, is called a rate ofchange). However, the term b will remain constant regardless of the value of x.With these ideas in mind, we can write a linear equation if the rate of changeand the constant are known.
Finding a Linear Equation
A small word-processing business has a fixed monthly cost of $6000 (this includesrent, utilities, and salaries of its employees). The business has a variable cost of$5 per project (this includes mostly paper and computer supplies).
a. Write a linear equation to compute the total cost, y, for 1 month if xprojects are completed.
b. Use the equation to compute the cost to run the business for 1 month if800 projects are completed.
Example 4
y � mx � b
Skill Practice
x � 4.y � 31142 � 155
y � 31x � 155
x � 4
y � 31x � 155
m � 31
�1866
�311
� 31
m �y2 � y1
x2 � x1�
341 � 1556 � 0
Section 3.6 Applications of Linear Equations 277
BA
160
00 1 2 3 4 5 6 7 8
Num
ber
Sold
Week Number
(7, 155)
(1, 65)
Soft Drinks Sold
120140
10080604020
y
x
Skill Practice Answers
3a.
b. 200 soft drinksy � 15x � 50
miL28711_ch03_209-296 9/26/06 07:36 AM Page 277CONFIRMING PAGES
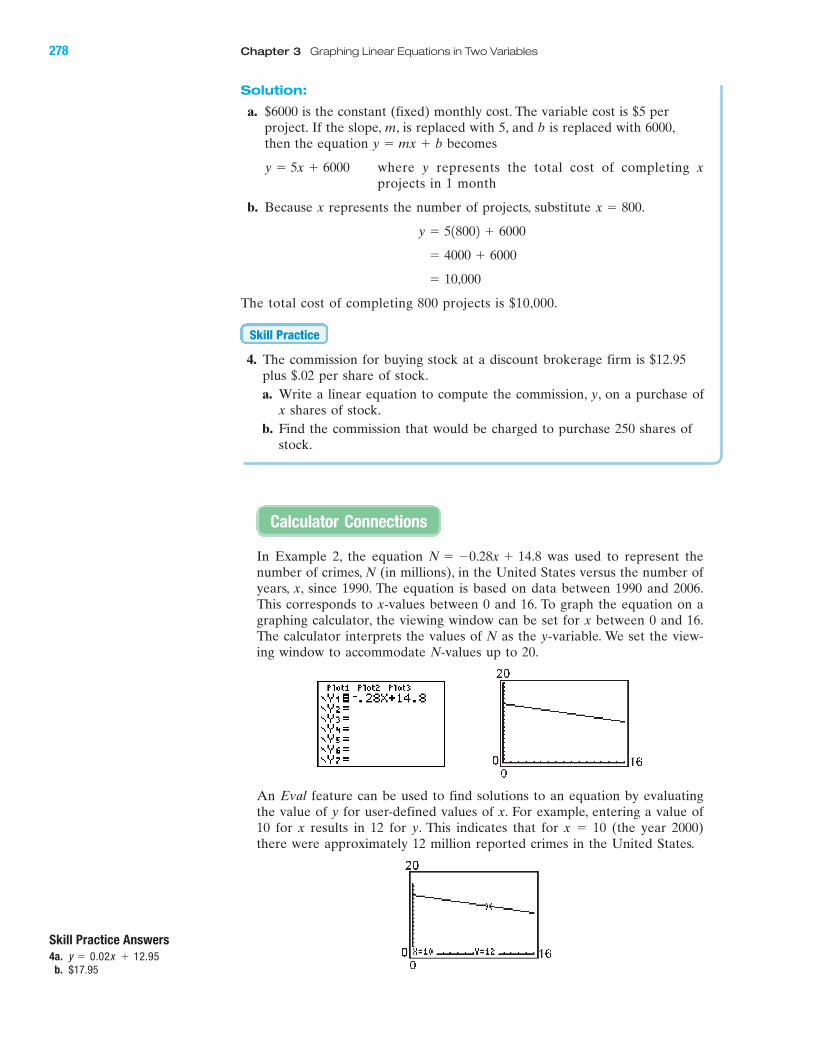
Solution:
a. $6000 is the constant (fixed) monthly cost. The variable cost is $5 perproject. If the slope, m, is replaced with 5, and b is replaced with 6000,then the equation becomes
where y represents the total cost of completing xprojects in 1 month
b. Because x represents the number of projects, substitute
The total cost of completing 800 projects is $10,000.
4. The commission for buying stock at a discount brokerage firm is $12.95plus $.02 per share of stock.a. Write a linear equation to compute the commission, y, on a purchase of
x shares of stock.b. Find the commission that would be charged to purchase 250 shares of
stock.
Skill Practice
� 10,000
� 4000 � 6000
y � 518002 � 6000
x � 800.
y � 5x � 6000
y � mx � b
278 Chapter 3 Graphing Linear Equations in Two Variables
BA
Skill Practice Answers
4a.
b. $17.95y � 0.02x � 12.95
In Example 2, the equation was used to represent thenumber of crimes, N (in millions), in the United States versus the number ofyears, x, since 1990. The equation is based on data between 1990 and 2006.This corresponds to x-values between 0 and 16. To graph the equation on agraphing calculator, the viewing window can be set for x between 0 and 16.The calculator interprets the values of N as the y-variable. We set the view-ing window to accommodate N-values up to 20.
An Eval feature can be used to find solutions to an equation by evaluatingthe value of y for user-defined values of x. For example, entering a value of10 for x results in 12 for y. This indicates that for x � 10 (the year 2000)there were approximately 12 million reported crimes in the United States.
N � �0.28x � 14.8
Calculator Connections
miL28711_ch03_209-296 9/26/06 08:58 PM Page 278CONFIRMING PAGES
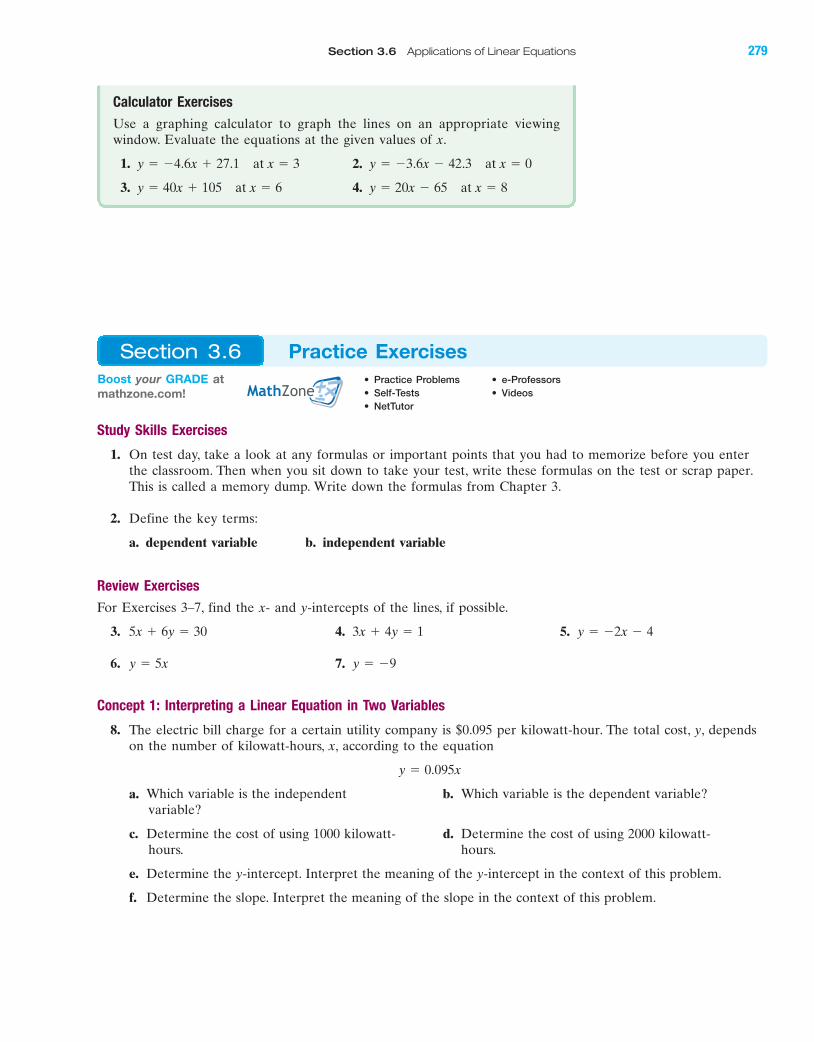
Study Skills Exercises
1. On test day, take a look at any formulas or important points that you had to memorize before you enterthe classroom. Then when you sit down to take your test, write these formulas on the test or scrap paper.This is called a memory dump. Write down the formulas from Chapter 3.
2. Define the key terms:
a. dependent variable b. independent variable
Review Exercises
For Exercises 3–7, find the x- and y-intercepts of the lines, if possible.
3. 4. 5.
6. 7.
Concept 1: Interpreting a Linear Equation in Two Variables
8. The electric bill charge for a certain utility company is $0.095 per kilowatt-hour. The total cost, y, dependson the number of kilowatt-hours, x, according to the equation
a. Which variable is the independent b. Which variable is the dependent variable?variable?
c. Determine the cost of using 1000 kilowatt- d. Determine the cost of using 2000 kilowatt-hours. hours.
e. Determine the y-intercept. Interpret the meaning of the y-intercept in the context of this problem.
f. Determine the slope. Interpret the meaning of the slope in the context of this problem.
y � 0.095x
y � �9y � 5x
y � �2x � 43x � 4y � 15x � 6y � 30
BA
Calculator Exercises
Use a graphing calculator to graph the lines on an appropriate viewingwindow. Evaluate the equations at the given values of x.
1. 2.
3. 4. y � 20x � 65 at x � 8y � 40x � 105 at x � 6
y � �3.6x � 42.3 at x � 0y � �4.6x � 27.1 at x � 3
Boost your GRADE atmathzone.com!
• Practice Problems • e-Professors
• Self-Tests • Videos
• NetTutor
Section 3.6 Practice Exercises
Section 3.6 Applications of Linear Equations 279
miL28711_ch03_209-296 9/26/06 07:36 AM Page 279CONFIRMING PAGES
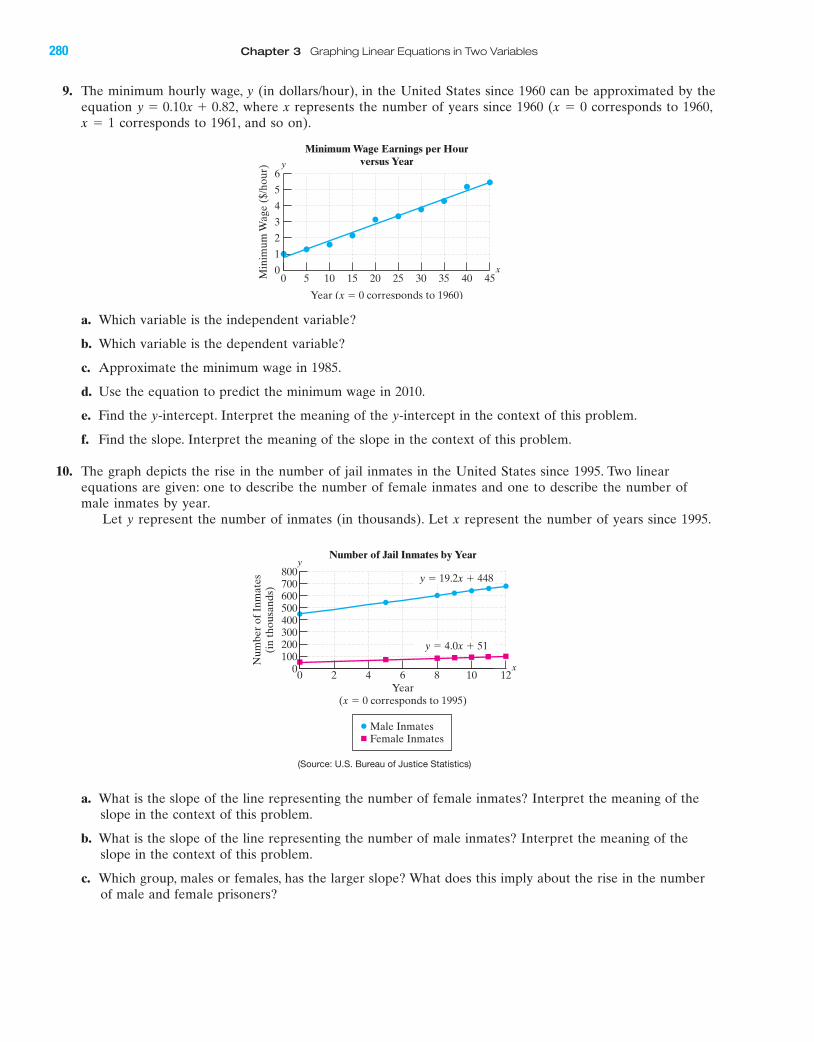
9. The minimum hourly wage, y (in dollars/hour), in the United States since 1960 can be approximated by theequation where x represents the number of years since 1960 (x � 0 corresponds to 1960,x � 1 corresponds to 1961, and so on).
a. Which variable is the independent variable?
b. Which variable is the dependent variable?
c. Approximate the minimum wage in 1985.
d. Use the equation to predict the minimum wage in 2010.
e. Find the y-intercept. Interpret the meaning of the y-intercept in the context of this problem.
f. Find the slope. Interpret the meaning of the slope in the context of this problem.
10. The graph depicts the rise in the number of jail inmates in the United States since 1995. Two linearequations are given: one to describe the number of female inmates and one to describe the number ofmale inmates by year.
Let y represent the number of inmates (in thousands). Let x represent the number of years since 1995.
a. What is the slope of the line representing the number of female inmates? Interpret the meaning of theslope in the context of this problem.
b. What is the slope of the line representing the number of male inmates? Interpret the meaning of theslope in the context of this problem.
c. Which group, males or females, has the larger slope? What does this imply about the rise in the numberof male and female prisoners?
6
Minimum Wage Earnings per Hourversus Year
0 105 2015 454025 30 35Min
imum
Wag
e ($
/hou
r)
Year (x � 0 corresponds to 1960)
2
3
1
4
5
0
y
x
y � 0.10x � 0.82,
280 Chapter 3 Graphing Linear Equations in Two Variables
BA
(Source: U.S. Bureau of Justice Statistics)
800
00 128 10642
Num
ber
of I
nmat
es(i
n th
ousa
nds)
Year(x � 0 corresponds to 1995)
Male InmatesFemale Inmates
y � 19.2x � 448
y � 4.0x � 51
Number of Jail Inmates by Year
600700
500400300200100
y
x
miL28711_ch03_209-296 9/26/06 07:36 AM Page 280CONFIRMING PAGES
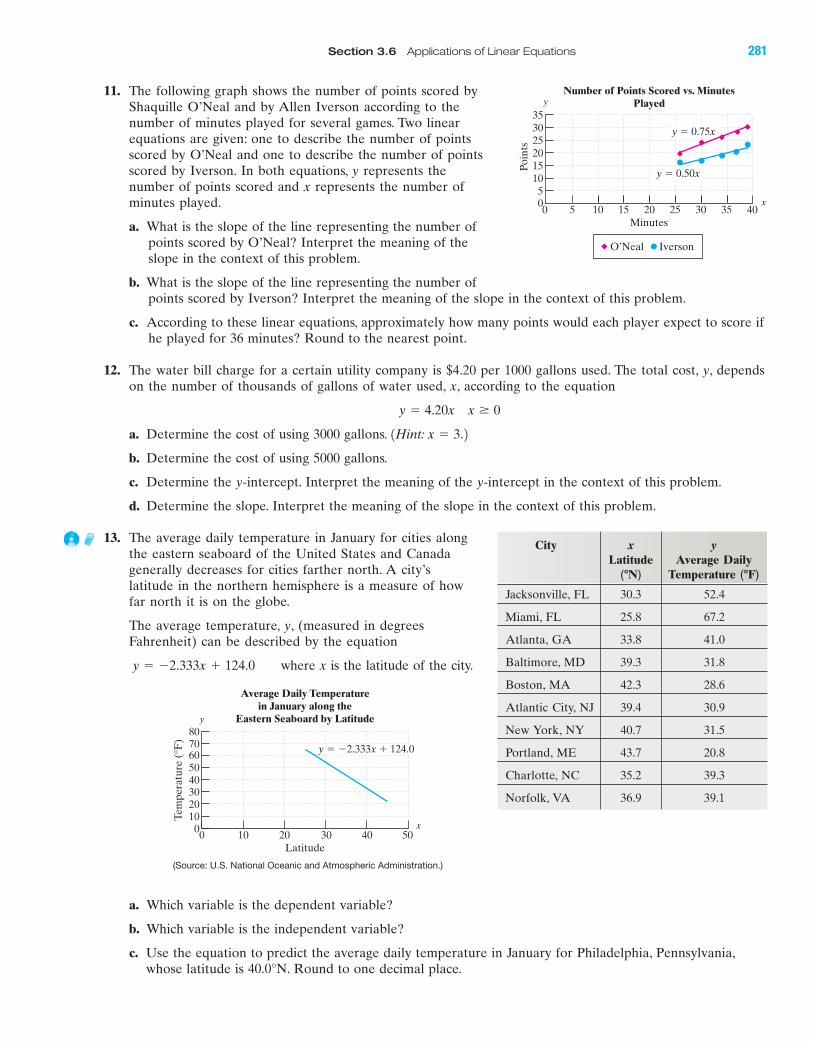
11. The following graph shows the number of points scored byShaquille O’Neal and by Allen Iverson according to thenumber of minutes played for several games. Two linearequations are given: one to describe the number of pointsscored by O’Neal and one to describe the number of pointsscored by Iverson. In both equations, y represents thenumber of points scored and x represents the number ofminutes played.
a. What is the slope of the line representing the number ofpoints scored by O’Neal? Interpret the meaning of theslope in the context of this problem.
b. What is the slope of the line representing the number ofpoints scored by Iverson? Interpret the meaning of the slope in the context of this problem.
c. According to these linear equations, approximately how many points would each player expect to score ifhe played for 36 minutes? Round to the nearest point.
12. The water bill charge for a certain utility company is $4.20 per 1000 gallons used. The total cost, y, dependson the number of thousands of gallons of water used, x, according to the equation
a. Determine the cost of using 3000 gallons.
b. Determine the cost of using 5000 gallons.
c. Determine the y-intercept. Interpret the meaning of the y-intercept in the context of this problem.
d. Determine the slope. Interpret the meaning of the slope in the context of this problem.
13. The average daily temperature in January for cities alongthe eastern seaboard of the United States and Canadagenerally decreases for cities farther north. A city’slatitude in the northern hemisphere is a measure of howfar north it is on the globe.
The average temperature, y, (measured in degreesFahrenheit) can be described by the equation
where x is the latitude of the city.
a. Which variable is the dependent variable?
b. Which variable is the independent variable?
c. Use the equation to predict the average daily temperature in January for Philadelphia, Pennsylvania,whose latitude is . Round to one decimal place.40.0°N
y � �2.333x � 124.0
1Hint: x � 3.2
y � 4.20x x 0
BA
y
x05
101520253035
0 5 10 15 20 25 30 35 40
Number of Points Scored vs. MinutesPlayed
Minutes
Poin
ts
y � 0.75x
y � 0.50x
O’Neal Iverson
80
00 10 20 30 40 50
Tem
pera
ture
(°F
)
Latitude
Average Daily Temperaturein January along the
Eastern Seaboard by Latitude
70605040302010
y
x
y � �2.333x � 124.0
(Source: U.S. National Oceanic and Atmospheric Administration.)
City x yLatitude Average Daily
Temperature
Jacksonville, FL 30.3 52.4
Miami, FL 25.8 67.2
Atlanta, GA 33.8 41.0
Baltimore, MD 39.3 31.8
Boston, MA 42.3 28.6
Atlantic City, NJ 39.4 30.9
New York, NY 40.7 31.5
Portland, ME 43.7 20.8
Charlotte, NC 35.2 39.3
Norfolk, VA 36.9 39.1
(�F)(�N)
Section 3.6 Applications of Linear Equations 281
miL28711_ch03_209-296 9/26/06 07:36 AM Page 281CONFIRMING PAGES
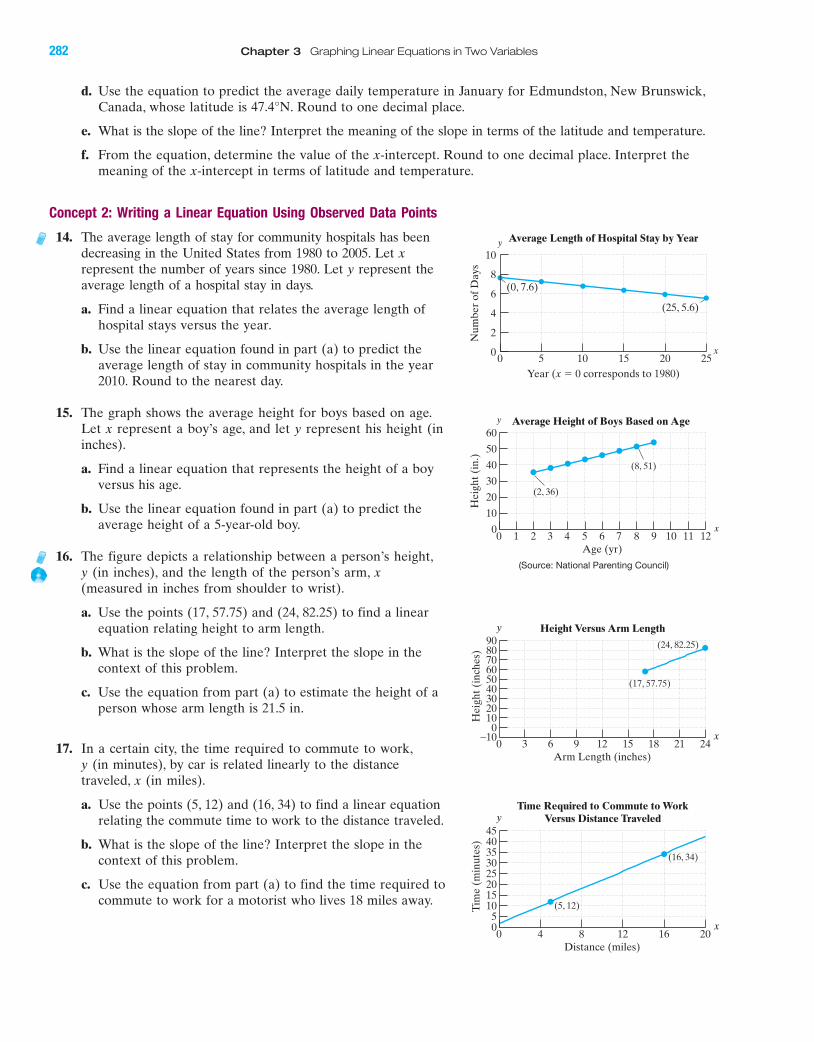
17. In a certain city, the time required to commute to work,y (in minutes), by car is related linearly to the distancetraveled, x (in miles).
a. Use the points (5, 12) and (16, 34) to find a linear equationrelating the commute time to work to the distance traveled.
b. What is the slope of the line? Interpret the slope in thecontext of this problem.
c. Use the equation from part (a) to find the time required tocommute to work for a motorist who lives 18 miles away.
d. Use the equation to predict the average daily temperature in January for Edmundston, New Brunswick,Canada, whose latitude is . Round to one decimal place.
e. What is the slope of the line? Interpret the meaning of the slope in terms of the latitude and temperature.
f. From the equation, determine the value of the x-intercept. Round to one decimal place. Interpret themeaning of the x-intercept in terms of latitude and temperature.
Concept 2: Writing a Linear Equation Using Observed Data Points
14. The average length of stay for community hospitals has beendecreasing in the United States from 1980 to 2005. Let xrepresent the number of years since 1980. Let y represent theaverage length of a hospital stay in days.
a. Find a linear equation that relates the average length ofhospital stays versus the year.
b. Use the linear equation found in part (a) to predict theaverage length of stay in community hospitals in the year2010. Round to the nearest day.
15. The graph shows the average height for boys based on age.Let x represent a boy’s age, and let y represent his height (ininches).
a. Find a linear equation that represents the height of a boyversus his age.
b. Use the linear equation found in part (a) to predict theaverage height of a 5-year-old boy.
16. The figure depicts a relationship between a person’s height,y (in inches), and the length of the person’s arm, x(measured in inches from shoulder to wrist).
a. Use the points (17, 57.75) and (24, 82.25) to find a linearequation relating height to arm length.
b. What is the slope of the line? Interpret the slope in thecontext of this problem.
c. Use the equation from part (a) to estimate the height of aperson whose arm length is 21.5 in.
47.4°N
282 Chapter 3 Graphing Linear Equations in Two Variables
BA
10
00 5 10 15 20 25
Num
ber
of D
ays
Year (x � 0 corresponds to 1980)
(0, 7.6)
Average Length of Hospital Stay by Year
6
8
4
2
y
x
(25, 5.6)
45
Time Required to Commute to WorkVersus Distance Traveled
0 4 8 12 16 20
Tim
e (m
inut
es)
Distance (miles)
25303540
201510
05
y
x
(16, 34)
(5, 12)
60Average Height of Boys Based on Age
0 21 43 8 9 10 11 125 6 7
Hei
ght (
in.)
Age (yr)
20
30
10
40
50
0
y
x
(8, 51)
(2, 36)
(Source: National Parenting Council)
90Height Versus Arm Length
80
0 3 6 9 12 15 18 21 24
Hei
ght (
inch
es)
Arm Length (inches)
70605040302010
−100
y
x
(24, 82.25)
(17, 57.75)
miL28711_ch03_209-296 9/26/06 07:36 AM Page 282CONFIRMING PAGES
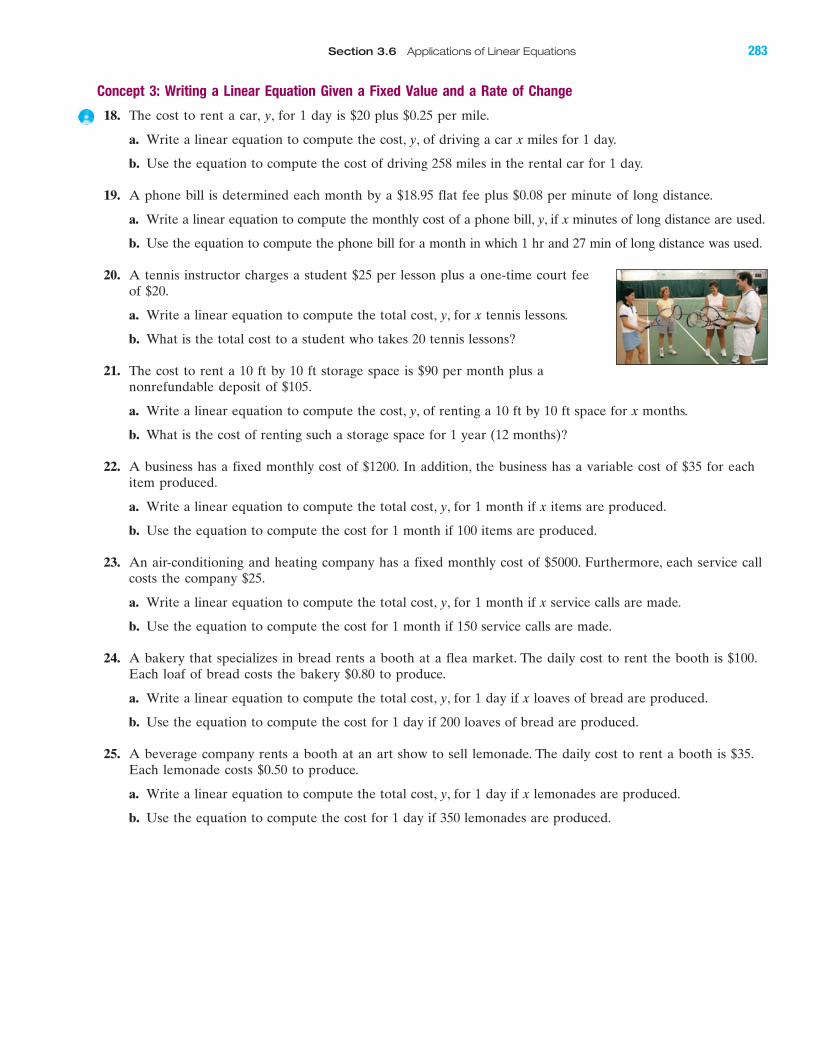
Concept 3: Writing a Linear Equation Given a Fixed Value and a Rate of Change
18. The cost to rent a car, y, for 1 day is $20 plus $0.25 per mile.
a. Write a linear equation to compute the cost, y, of driving a car x miles for 1 day.
b. Use the equation to compute the cost of driving 258 miles in the rental car for 1 day.
19. A phone bill is determined each month by a $18.95 flat fee plus $0.08 per minute of long distance.
a. Write a linear equation to compute the monthly cost of a phone bill, y, if x minutes of long distance are used.
b. Use the equation to compute the phone bill for a month in which 1 hr and 27 min of long distance was used.
20. A tennis instructor charges a student $25 per lesson plus a one-time court feeof $20.
a. Write a linear equation to compute the total cost, y, for x tennis lessons.
b. What is the total cost to a student who takes 20 tennis lessons?
21. The cost to rent a 10 ft by 10 ft storage space is $90 per month plus anonrefundable deposit of $105.
a. Write a linear equation to compute the cost, y, of renting a 10 ft by 10 ft space for x months.
b. What is the cost of renting such a storage space for 1 year (12 months)?
22. A business has a fixed monthly cost of $1200. In addition, the business has a variable cost of $35 for eachitem produced.
a. Write a linear equation to compute the total cost, y, for 1 month if x items are produced.
b. Use the equation to compute the cost for 1 month if 100 items are produced.
23. An air-conditioning and heating company has a fixed monthly cost of $5000. Furthermore, each service callcosts the company $25.
a. Write a linear equation to compute the total cost, y, for 1 month if x service calls are made.
b. Use the equation to compute the cost for 1 month if 150 service calls are made.
24. A bakery that specializes in bread rents a booth at a flea market. The daily cost to rent the booth is $100.Each loaf of bread costs the bakery $0.80 to produce.
a. Write a linear equation to compute the total cost, y, for 1 day if x loaves of bread are produced.
b. Use the equation to compute the cost for 1 day if 200 loaves of bread are produced.
25. A beverage company rents a booth at an art show to sell lemonade. The daily cost to rent a booth is $35.Each lemonade costs $0.50 to produce.
a. Write a linear equation to compute the total cost, y, for 1 day if x lemonades are produced.
b. Use the equation to compute the cost for 1 day if 350 lemonades are produced.
BA
Section 3.6 Applications of Linear Equations 283
miL28711_ch03_209-296 9/26/06 07:36 AM Page 283CONFIRMING PAGES
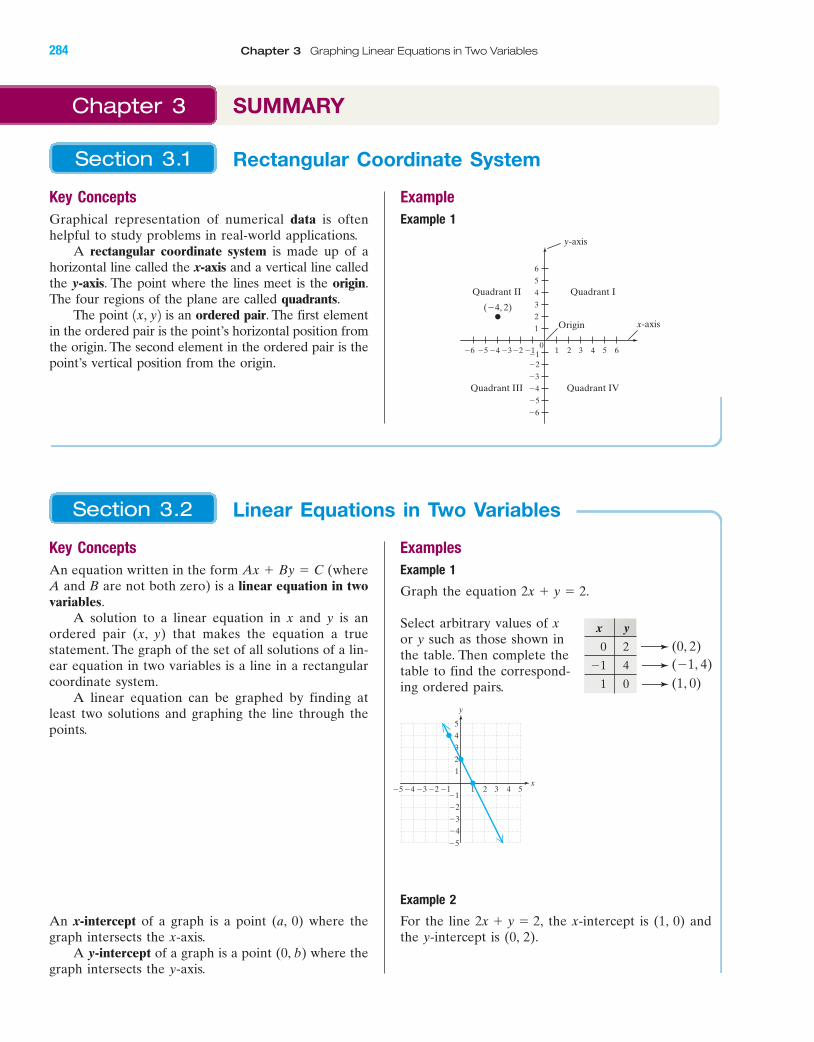
Key Concepts
Graphical representation of numerical data is oftenhelpful to study problems in real-world applications.
A rectangular coordinate system is made up of ahorizontal line called the x-axis and a vertical line calledthe y-axis. The point where the lines meet is the origin.The four regions of the plane are called quadrants.
The point is an ordered pair. The first elementin the ordered pair is the point’s horizontal position fromthe origin. The second element in the ordered pair is thepoint’s vertical position from the origin.
1x, y2
Example
Example 1
y-axis
Quadrant II Quadrant I
Origin
Quadrant III Quadrant IV
x-axis
3 4 5 6�4�5�6 �3 10
2
�5
�6
�2�1
�3
�4
1
2
3
4
6
5
�1�2
(�4, 2)
284 Chapter 3 Graphing Linear Equations in Two Variables
Rectangular Coordinate SystemSection 3.1
Chapter 3 SUMMARY
BA
Examples
Example 1
Graph the equation .
Select arbitrary values of xor y such as those shown in the table. Then complete the table to find the correspond-ing ordered pairs.
Example 2
For the line the x-intercept is (1, 0) andthe y-intercept is (0, 2).
2x � y � 2,
2x � y � 2
Key Concepts
An equation written in the form (where A and B are not both zero) is a linear equation in twovariables.
A solution to a linear equation in x and y is anordered pair (x, y) that makes the equation a truestatement. The graph of the set of all solutions of a lin-ear equation in two variables is a line in a rectangularcoordinate system.
A linear equation can be graphed by finding atleast two solutions and graphing the line through thepoints.
An x-intercept of a graph is a point (a, 0) where thegraph intersects the x-axis.
A y-intercept of a graph is a point (0, b) where thegraph intersects the y-axis.
Ax � By � C
x y
0 2
�1 4
1 0
Linear Equations in Two VariablesSection 3.2
(0, 2)(�1, 4)(1, 0)
�5�4
�4
�3
�2
�5
3
4
5
�2 �1�3
1
3 52 4
2
1�1
x
y
miL28711_ch03_209-296 9/26/06 07:36 AM Page 284CONFIRMING PAGES
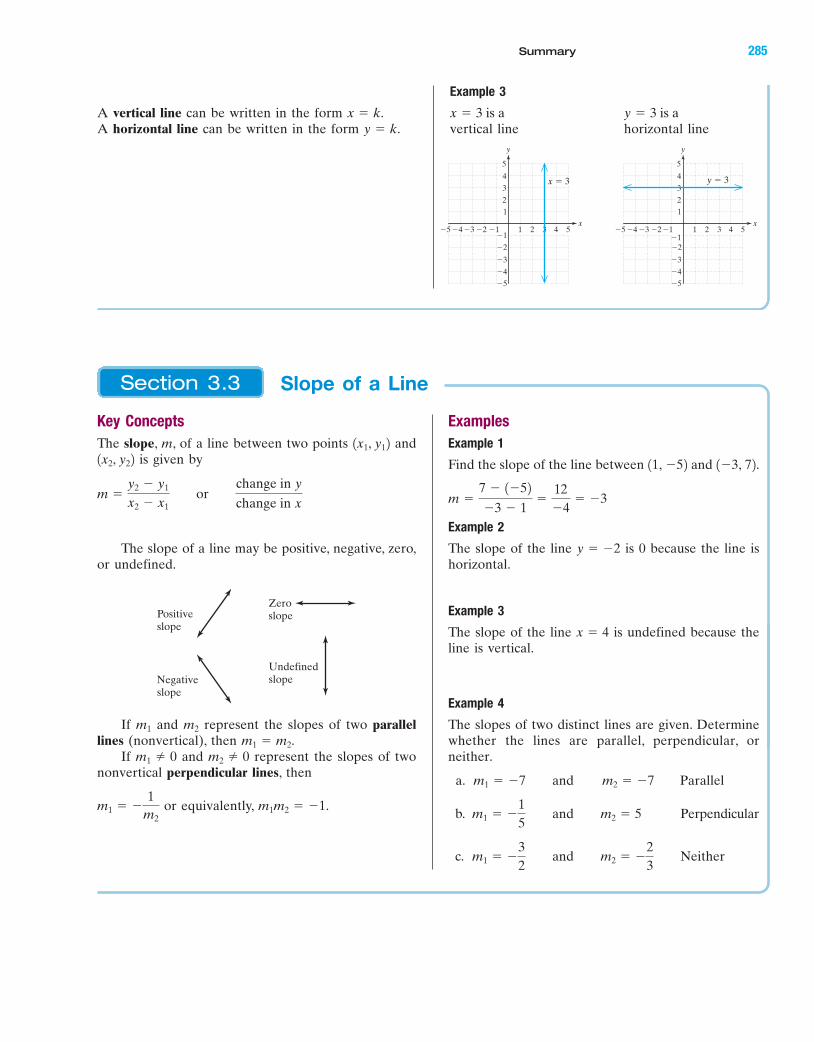
Summary 285
BA
4 5�4�5 �3 1 2 3
�2
�1
�3
�4�5
5
1
�1�2
y
x
4
3
2
x � 3
4 5�4�5 �3 1 2 3
�2�1
�3
�4�5
5
1
�1�2
y
x
4
3
2
y � 3
A vertical line can be written in the form A horizontal line can be written in the form y � k.
x � k.
Example 3
vertical line horizontal liney � 3 is ax � 3 is a
Examples
Example 1
Find the slope of the line between and
Example 2
The slope of the line is 0 because the line ishorizontal.
Example 3
The slope of the line is undefined because theline is vertical.
Example 4
The slopes of two distinct lines are given. Determinewhether the lines are parallel, perpendicular, orneither.
a. Parallel
b. Perpendicular
c. Neitherm1 � �32 and m2 � �
23
m1 � �15 and m2 � 5
m1 � �7 and m2 � �7
x � 4
y � �2
m �7 � 1�52
�3 � 1�
12�4
� �3
1�3, 72.11, �52
Key Concepts
The slope, m, of a line between two points andis given by
The slope of a line may be positive, negative, zero,or undefined.
If and represent the slopes of two parallellines (nonvertical), then .
If and represent the slopes of twononvertical perpendicular lines, then
or equivalently, .m1m2 � �1m1 � �1
m2
m2 � 0m1 � 0m1 � m2
m2m1
m �y2 � y1
x2 � x1 or
change in y
change in x
1x2, y221x1, y12
Positiveslope
Negativeslope
Zeroslope
Undefinedslope
Slope of a LineSection 3.3
miL28711_ch03_209-296 9/26/06 07:36 AM Page 285CONFIRMING PAGES
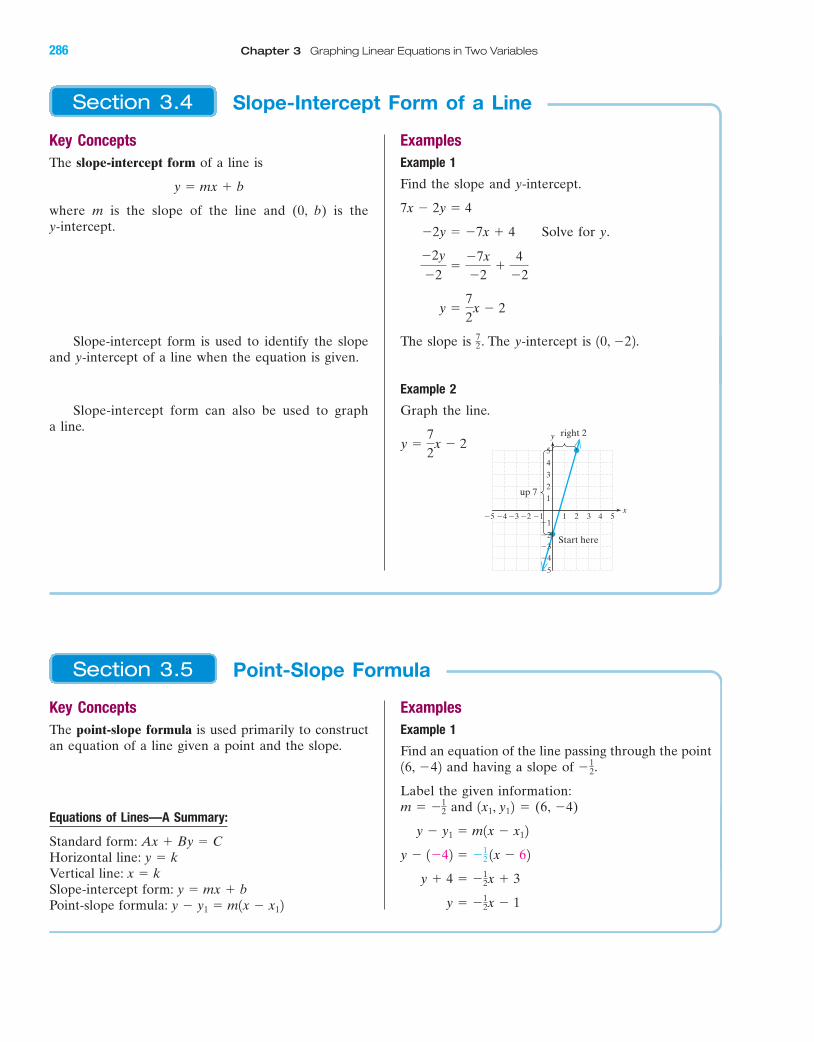
286 Chapter 3 Graphing Linear Equations in Two Variables
BA
Key Concepts
The point-slope formula is used primarily to constructan equation of a line given a point and the slope.
Equations of Lines—A Summary:
Standard form:Horizontal line:Vertical line:Slope-intercept form:Point-slope formula: y � y1 � m1x � x12
y � mx � bx � k
y � kAx � By � C
Examples
Example 1
Find an equation of the line passing through the pointand having a slope of .
Label the given information:and � (6, �4)
y � �12x � 1
y � 4 � �12x � 3
y � 1�42 � �12 1x � 62
y � y1 � m1x � x12
1x1, y12m � �12
�1216, �42
Key Concepts
The slope-intercept form of a line is
where m is the slope of the line and (0, b) is they-intercept.
Slope-intercept form is used to identify the slopeand y-intercept of a line when the equation is given.
Slope-intercept form can also be used to graph a line.
y � mx � b
Examples
Example 1
Find the slope and y-intercept.
Solve for y.
The slope is . The y-intercept is
Example 2
Graph the line.
y �72
x � 2
10, �22.72
y �72
x � 2
�2y
�2�
�7x�2
�4
�2
�2y � �7x � 4
7x � 2y � 4
4 5�4�5 �3 1 2 3�1
�2�3�4
�5
21
4
5
3
�1�2
up 7
Start here
right 2y
x
Slope-Intercept Form of a LineSection 3.4
Point-Slope FormulaSection 3.5
miL28711_ch03_209-296 9/26/06 07:36 AM Page 286CONFIRMING PAGES
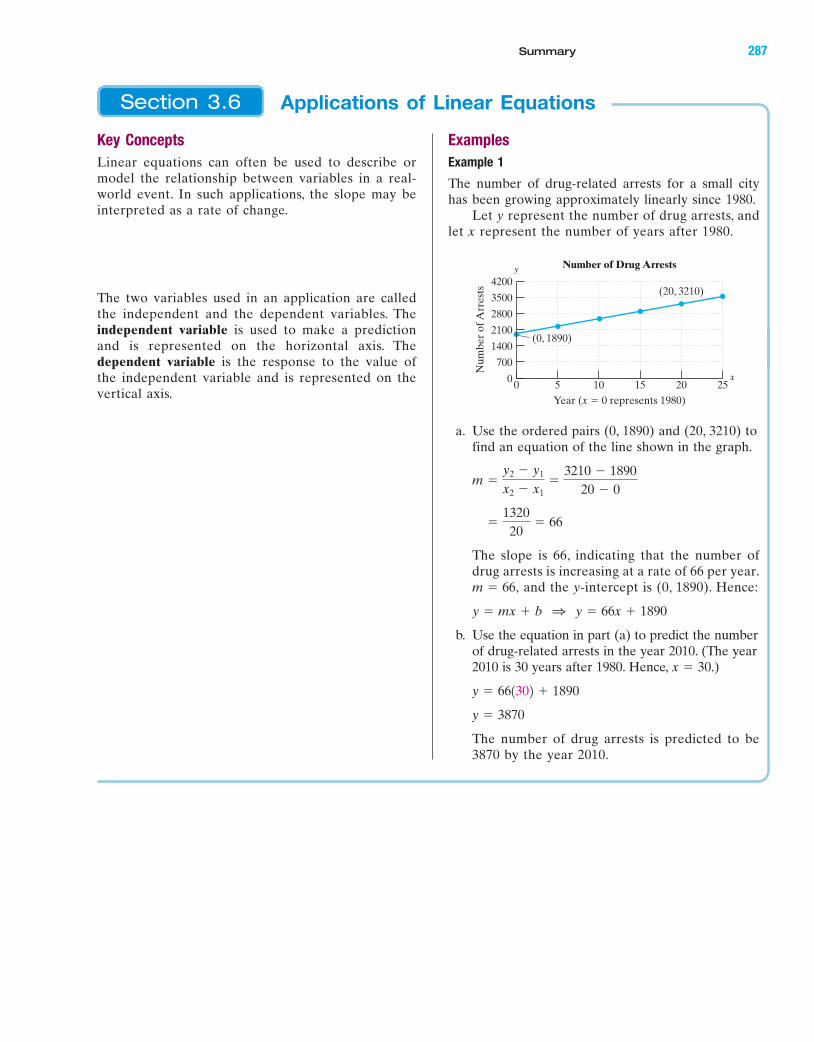
Summary 287
BA
Key Concepts
Linear equations can often be used to describe ormodel the relationship between variables in a real-world event. In such applications, the slope may beinterpreted as a rate of change.
The two variables used in an application are calledthe independent and the dependent variables. Theindependent variable is used to make a predictionand is represented on the horizontal axis. Thedependent variable is the response to the value ofthe independent variable and is represented on thevertical axis.
Examples
Example 1
The number of drug-related arrests for a small cityhas been growing approximately linearly since 1980.
Let y represent the number of drug arrests, andlet x represent the number of years after 1980.
a. Use the ordered pairs (0, 1890) and (20, 3210) tofind an equation of the line shown in the graph.
The slope is 66, indicating that the number ofdrug arrests is increasing at a rate of 66 per year.
and the y-intercept is (0, 1890). Hence:
b. Use the equation in part (a) to predict the numberof drug-related arrests in the year 2010. (The year2010 is 30 years after 1980. Hence, .)
The number of drug arrests is predicted to be3870 by the year 2010.
y � 3870
y � 661302 � 1890
x � 30
y � mx � b 1 y � 66x � 1890
m � 66,
�132020
� 66
m �y2 � y1
x2 � x1�
3210 � 189020 � 0
Applications of Linear EquationsSection 3.6
4200
00 5 10 15 20 25
Num
ber
of A
rres
ts
Year (x � 0 represents 1980)
(0, 1890)
(20, 3210)
Number of Drug Arrests
3500
2800
2100
1400
700
y
x
miL28711_ch03_209-296 9/26/06 07:36 AM Page 287CONFIRMING PAGES
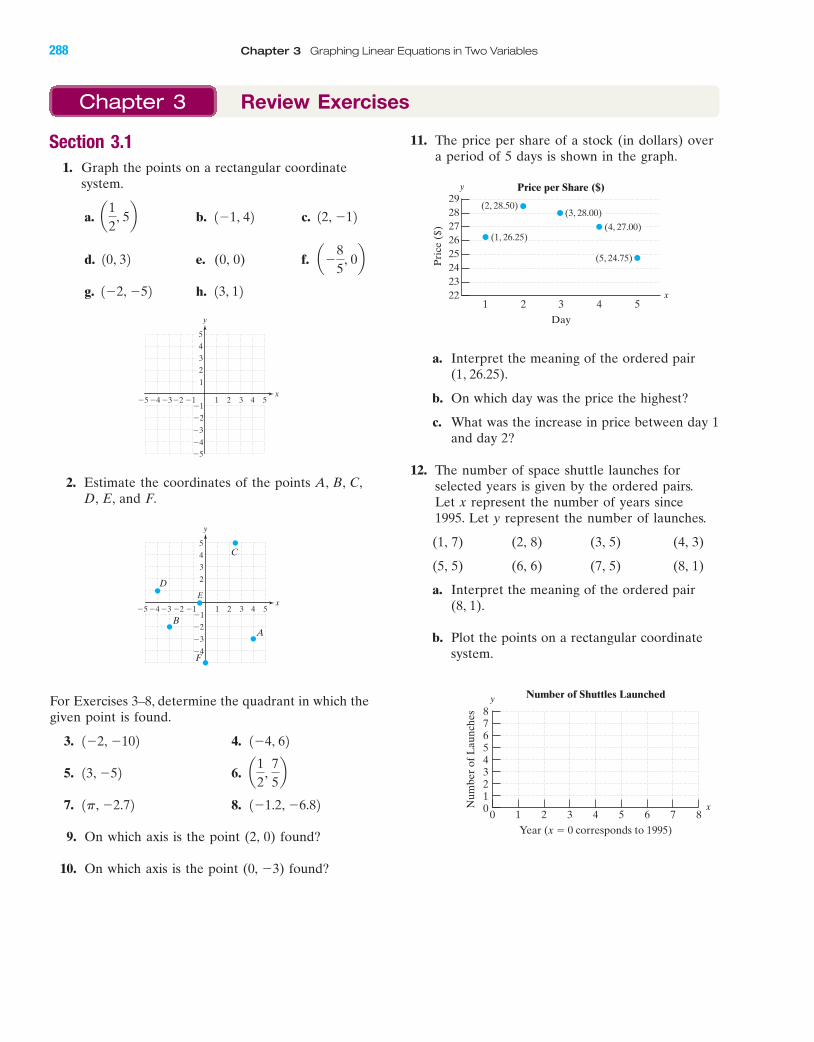
Section 3.1
1. Graph the points on a rectangular coordinatesystem.
a. b. c.
d. e. (0, 0) f.
g. h. 13, 121�2, �52
a�85
, 0b10, 32
12, �121�1, 42a12
, 5b
11. The price per share of a stock (in dollars) overa period of 5 days is shown in the graph.
Chapter 3 Review Exercises
2. Estimate the coordinates of the points A, B, C,D, E, and F.
For Exercises 3–8, determine the quadrant in which thegiven point is found.
3. 4.
5. 6.
7. 8.
9. On which axis is the point (2, 0) found?
10. On which axis is the point (0, �3) found?
1�1.2, �6.821p, �2.72
a12
, 75b13, �52
1�4, 621�2, �102
4 5�4�5 �3 1 2 3
�2
�3
�4�5
4
5
1
�1�2
y
x
3
2
�1
C
D
B
F
E
A
4 5�4�5 �3 1 2 3�1
�3
�2
�4
4
5
�1�2
y
x
3
2
Day
Pri
ce (
$)
Price per Share ($)
1 2 3 4 5
y
x222324252627
2928 (3, 28.00)
(2, 28.50)
(1, 26.25)
(5, 24.75)
(4, 27.00)
a. Interpret the meaning of the ordered pair(1, 26.25).
b. On which day was the price the highest?
c. What was the increase in price between day 1and day 2?
12. The number of space shuttle launches forselected years is given by the ordered pairs.Let x represent the number of years since 1995. Let y represent the number of launches.
(1, 7) (2, 8) (3, 5) (4, 3)
(5, 5) (6, 6) (7, 5) (8, 1)
a. Interpret the meaning of the ordered pair (8, 1).
b. Plot the points on a rectangular coordinatesystem.
8
00 1 2 3 54 6 7 8
Num
ber
of L
aunc
hes
Year (x � 0 corresponds to 1995)
Number of Shuttles Launched
67
45
21
3
y
x
288 Chapter 3 Graphing Linear Equations in Two Variables
BAmiL28711_ch03_209-296 9/26/06 07:36 AM Page 288CONFIRMING PAGES
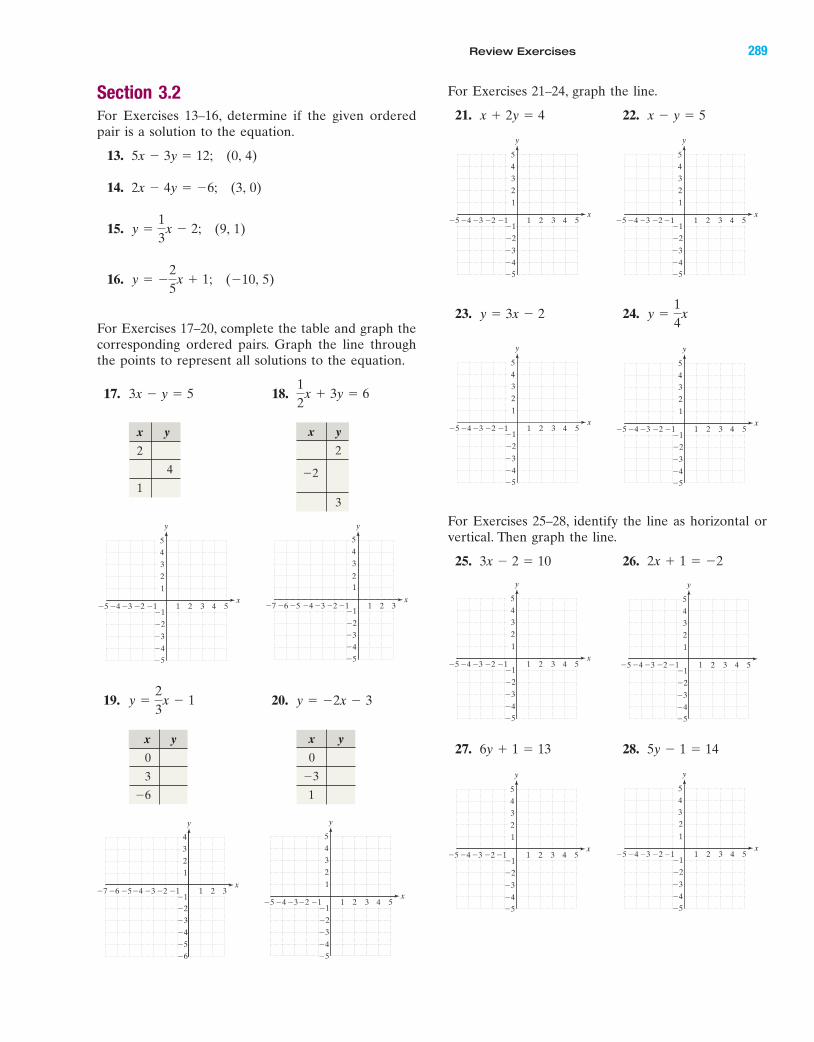
For Exercises 21–24, graph the line.
21. 22.
23. 24.
For Exercises 25–28, identify the line as horizontal orvertical. Then graph the line.
25. 26.
27. 28. 5y � 1 � 146y � 1 � 13
2x � 1 � �23x � 2 � 10
y �14
xy � 3x � 2
x � y � 5x � 2y � 4
Review Exercises 289
BA
x y
2
4
1
x y
2
�2
3
x y
0
3
�6
x y
0
�3
1
32�4�5�6�7 �3 1
�2
�1
�3
�4
�5
4
5
1
�1�2
y
x
3
2
4 5�4�5 �3 1 2 3
�2
�3
�4�5
4
5
1
�1�2
y
x
3
2
�1
y
x2 3�4�5�6�7 �3
�3
�4
�5
�6
3
4
�1�1
�2
2
1
1
�24 5�4�5 �3 1 2 3
�4�5
4
5
1
�1�2
y
x
3
2
�1
�3
�2
4�4�5 �3 1 2 3
�2
�3
�4�5
4
5
1
�1�2
y
x
3
�1
2
5 4 5�4�5 �3 1 2 3
�2
�3
�4�5
4
5
1
�1�2
y
x
3
2
�1
4 5�4�5 �3 1 2 3
�2
�3
�4�5
4
5
1
�1�2
y
x
3
2
�14 5�4�5 �3 �2 1 2 3
�2
�3
�4�5
4
5
1
�1
y
x
3
2
�1
5�4�5 �3 1 2 3
�2
�3
�4�5
5
1
�1�2
y
x
3
2
�1
4
4 5�4�5 �3 1 2 3 4
�2
�3
�4�5
4
5
1
�1�2
y
x
3
2
�1
5�4�5 �3 1 3 4
�2
�3
�4�5
4
5
1
�1�2
y
x
3
�1
2
2 5�4�5 �3 1 2 3 4
�2
�3
�4�5
4
5
1
2
�1�2
y
x
�1
3
Section 3.2
For Exercises 13–16, determine if the given orderedpair is a solution to the equation.
13. (0, 4)
14. (3, 0)
15. (9, 1)
16. (�10, 5)
For Exercises 17–20, complete the table and graph thecorresponding ordered pairs. Graph the line throughthe points to represent all solutions to the equation.
17. 18.12
x � 3y � 63x � y � 5
y � �25
x � 1;
y �13
x � 2;
2x � 4y � �6;
5x � 3y � 12;
19. 20. y � �2x � 3y �23
x � 1
miL28711_ch03_209-296 9/26/06 07:36 AM Page 289CONFIRMING PAGES
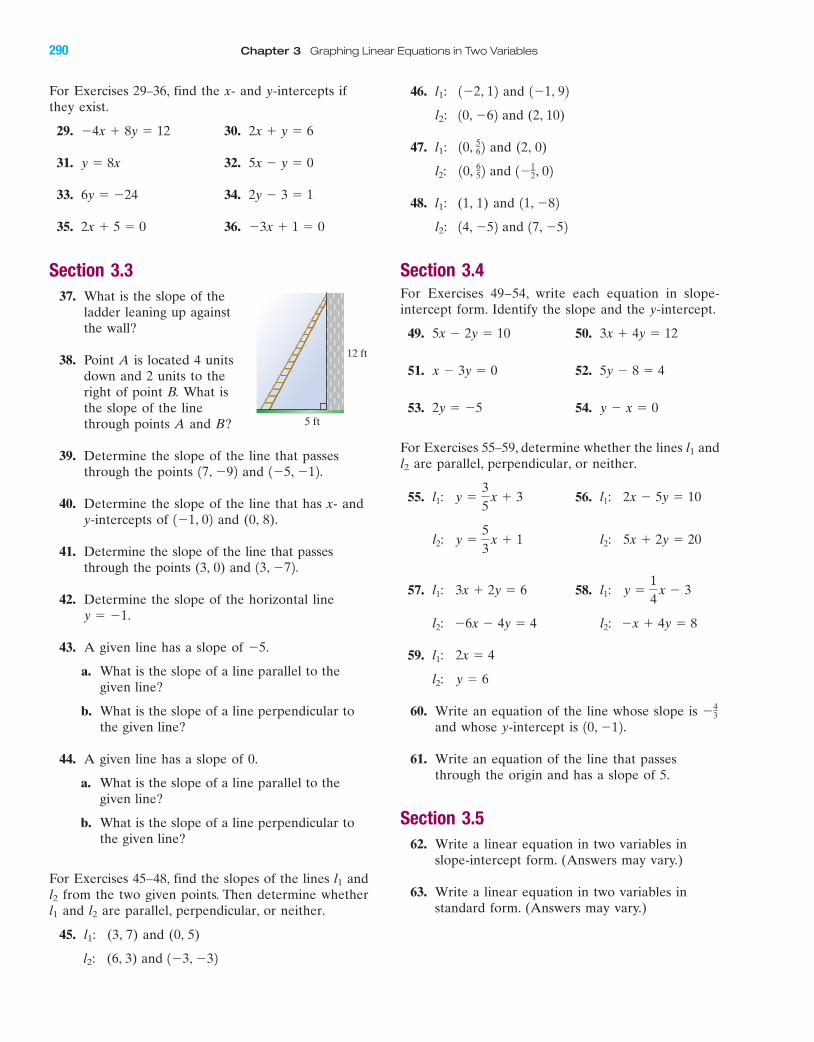
For Exercises 29–36, find the x- and y-intercepts ifthey exist.
29. 30.
31. 32.
33. 34.
35. 36.
Section 3.3
37. What is the slope of theladder leaning up againstthe wall?
38. Point A is located 4 unitsdown and 2 units to theright of point B. What isthe slope of the linethrough points A and B?
39. Determine the slope of the line that passesthrough the points and
40. Determine the slope of the line that has x- andy-intercepts of and (0, 8).
41. Determine the slope of the line that passesthrough the points (3, 0) and
42. Determine the slope of the horizontal line
43. A given line has a slope of
a. What is the slope of a line parallel to thegiven line?
b. What is the slope of a line perpendicular tothe given line?
44. A given line has a slope of 0.
a. What is the slope of a line parallel to thegiven line?
b. What is the slope of a line perpendicular tothe given line?
For Exercises 45–48, find the slopes of the lines l1 andl2 from the two given points. Then determine whetherl1 and l2 are parallel, perpendicular, or neither.
45. l1: (3, 7) and (0, 5)
l2: (6, 3) and 1�3, �32
�5.
y � �1.
13, �72.
1�1, 02
1�5, �12.17, �92
�3x � 1 � 02x � 5 � 0
2y � 3 � 16y � �24
5x � y � 0y � 8x
2x � y � 6�4x � 8y � 12
46. l1: and
l2: and (2, 10)
47. l1: and (2, 0)
and
48. l1: (1, 1) and
l2: and
Section 3.4
For Exercises 49–54, write each equation in slope-intercept form. Identify the slope and the y-intercept.
49. 50.
51. 52.
53. 54.
For Exercises 55–59, determine whether the lines l1 andl2 are parallel, perpendicular, or neither.
55. 56.
57. 58.
59.
60. Write an equation of the line whose slope is and whose y-intercept is
61. Write an equation of the line that passesthrough the origin and has a slope of 5.
Section 3.5
62. Write a linear equation in two variables inslope-intercept form. (Answers may vary.)
63. Write a linear equation in two variables instandard form. (Answers may vary.)
10, �12.�4
3
l2: y � 6
l1: 2x � 4
l2: �x � 4y � 8l2: �6x � 4y � 4
l1: y �14
x � 3l1: 3x � 2y � 6
l2: 5x � 2y � 20l2: y �53
x � 1
l1: 2x � 5y � 10l1: y �35
x � 3
y � x � 02y � �5
5y � 8 � 4x � 3y � 0
3x � 4y � 125x � 2y � 10
17, �5214, �52
11, �82
1�12, 02l2: 10, 65 2
10, 56 2
10, �62
1�1, 921�2, 12
290 Chapter 3 Graphing Linear Equations in Two Variables
BA
12 ft
5 ft
miL28711_ch03_209-296 9/26/06 07:36 AM Page 290CONFIRMING PAGES
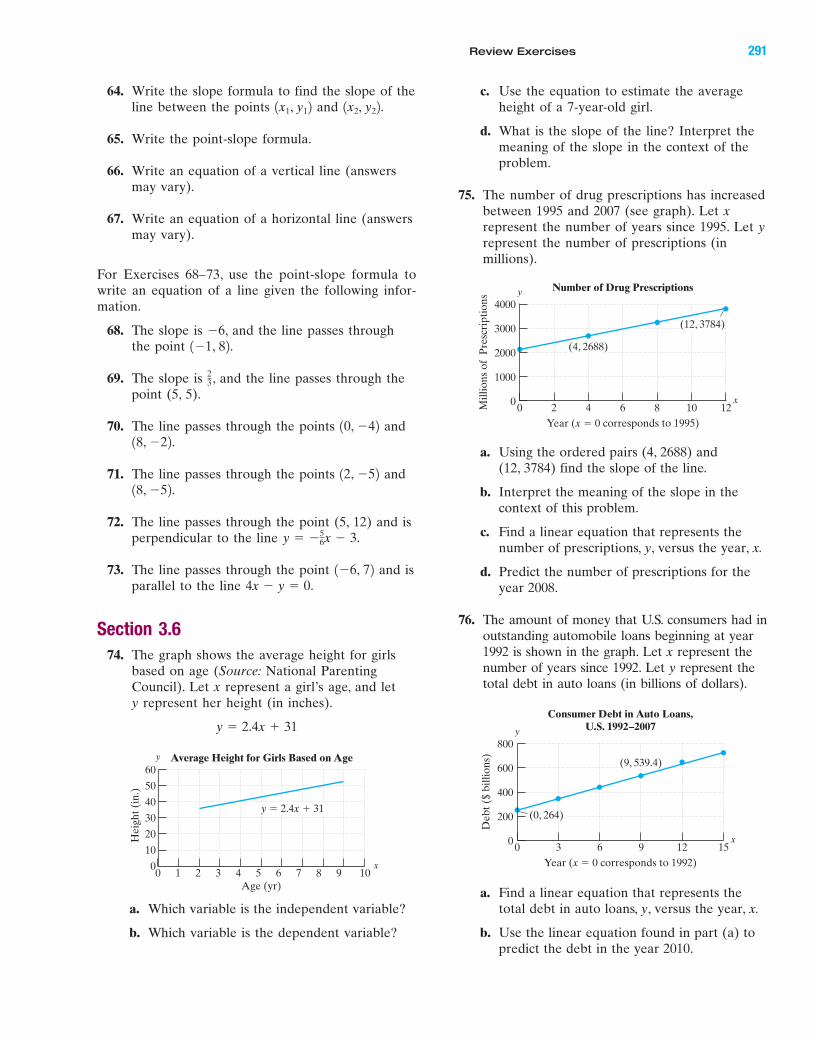
Review Exercises 291
BA
64. Write the slope formula to find the slope of theline between the points and
65. Write the point-slope formula.
66. Write an equation of a vertical line (answersmay vary).
67. Write an equation of a horizontal line (answersmay vary).
For Exercises 68–73, use the point-slope formula towrite an equation of a line given the following infor-mation.
68. The slope is , and the line passes throughthe point
69. The slope is , and the line passes through thepoint (5, 5).
70. The line passes through the points and
71. The line passes through the points and
72. The line passes through the point (5, 12) and isperpendicular to the line
73. The line passes through the point and isparallel to the line
Section 3.6
74. The graph shows the average height for girlsbased on age (Source: National ParentingCouncil). Let x represent a girl’s age, and let y represent her height (in inches).
y � 2.4x � 31
4x � y � 0.1�6, 72
y � �56x � 3.
18, �52.12, �52
18, �22.10, �42
23
1�1, 82.�6
1x2, y22.1x1, y12
a. Which variable is the independent variable?
b. Which variable is the dependent variable?
c. Use the equation to estimate the averageheight of a 7-year-old girl.
d. What is the slope of the line? Interpret themeaning of the slope in the context of theproblem.
75. The number of drug prescriptions has increasedbetween 1995 and 2007 (see graph). Let xrepresent the number of years since 1995. Let yrepresent the number of prescriptions (inmillions).
60Average Height for Girls Based on Age
0 1 52 3 4 6 7 8 9 10
Hei
ght (
in.)
Age (yr)
30
40
50
20
10
0
y
x
y � 2.4x � 31
a. Using the ordered pairs (4, 2688) and (12, 3784) find the slope of the line.
b. Interpret the meaning of the slope in thecontext of this problem.
c. Find a linear equation that represents thenumber of prescriptions, y, versus the year, x.
d. Predict the number of prescriptions for theyear 2008.
76. The amount of money that U.S. consumers had inoutstanding automobile loans beginning at year1992 is shown in the graph. Let x represent thenumber of years since 1992. Let y represent thetotal debt in auto loans (in billions of dollars).
a. Find a linear equation that represents thetotal debt in auto loans, y, versus the year, x.
b. Use the linear equation found in part (a) topredict the debt in the year 2010.
4000
00 2 4 6 8 10 12M
illio
ns o
f P
resc
ript
ions
Year (x � 0 corresponds to 1995)
(4, 2688)
(12, 3784)
Number of Drug Prescriptions
3000
2000
1000
y
x
800
00 3 6 9 12 15
Deb
t ($
billi
ons)
Year (x � 0 corresponds to 1992)
(0, 264)
(9, 539.4)
Consumer Debt in Auto Loans,U.S. 1992–2007
600
400
200
y
x
miL28711_ch03_209-296 9/26/06 07:37 AM Page 291CONFIRMING PAGES
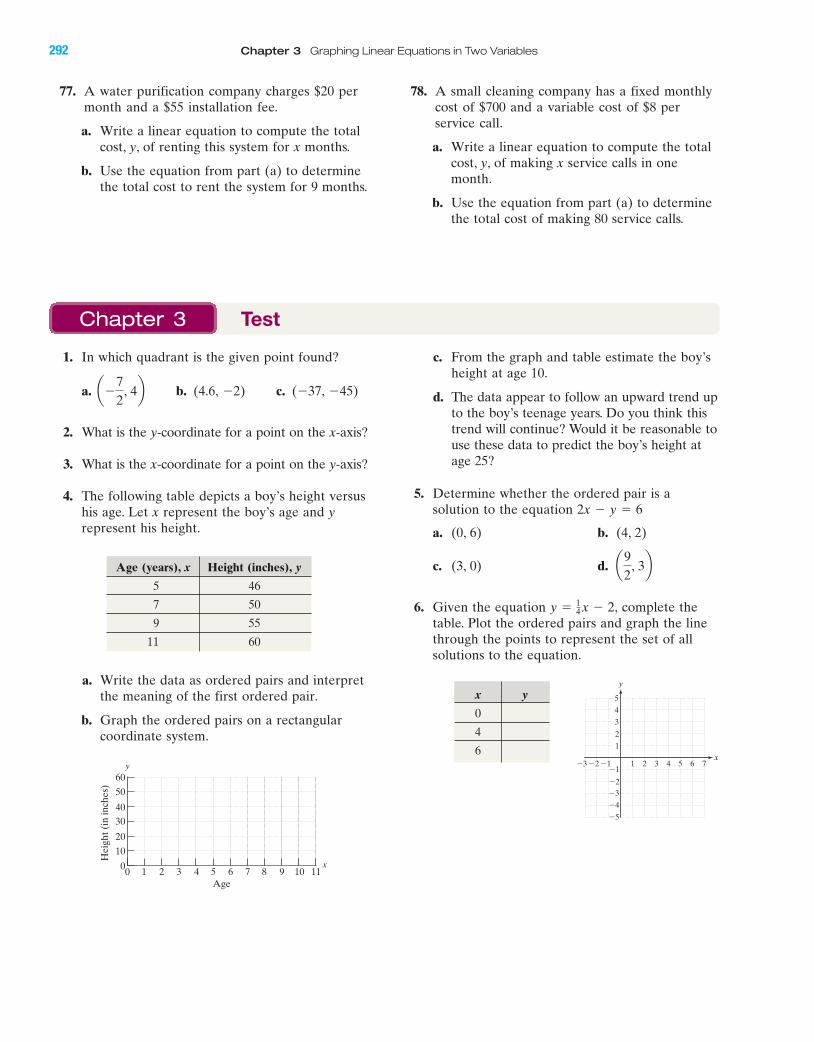
78. A small cleaning company has a fixed monthlycost of $700 and a variable cost of $8 perservice call.
a. Write a linear equation to compute the totalcost, y, of making x service calls in onemonth.
b. Use the equation from part (a) to determinethe total cost of making 80 service calls.
77. A water purification company charges $20 permonth and a $55 installation fee.
a. Write a linear equation to compute the totalcost, y, of renting this system for x months.
b. Use the equation from part (a) to determinethe total cost to rent the system for 9 months.
292 Chapter 3 Graphing Linear Equations in Two Variables
BA
1. In which quadrant is the given point found?
a. b. (4.6, �2) c. (�37, �45)
2. What is the y-coordinate for a point on the x-axis?
3. What is the x-coordinate for a point on the y-axis?
4. The following table depicts a boy’s height versushis age. Let x represent the boy’s age and yrepresent his height.
a�72
, 4b
c. From the graph and table estimate the boy’sheight at age 10.
d. The data appear to follow an upward trend upto the boy’s teenage years. Do you think thistrend will continue? Would it be reasonable touse these data to predict the boy’s height atage 25?
5. Determine whether the ordered pair is asolution to the equation 2x � y � 6
a. (0, 6) b. (4, 2)
c. (3, 0) d.
6. Given the equation complete thetable. Plot the ordered pairs and graph the linethrough the points to represent the set of allsolutions to the equation.
y � 14 x � 2,
a92
, 3b
Chapter 3 Test
Age (years), x Height (inches), y
5 46
7 50
9 55
11 60
x y
0
4
676�1�2�3 4 5321
�1
�3
�4
�5
4
5
1
2
3
y
x
�2
a. Write the data as ordered pairs and interpretthe meaning of the first ordered pair.
b. Graph the ordered pairs on a rectangularcoordinate system.
60
50
3040
00 1 2 3 4 5 6 7 8 9 10 11
Hei
ght (
in in
ches
)
Age
20
10
y
x
miL28711_ch03_209-296 9/26/06 07:37 AM Page 292CONFIRMING PAGES
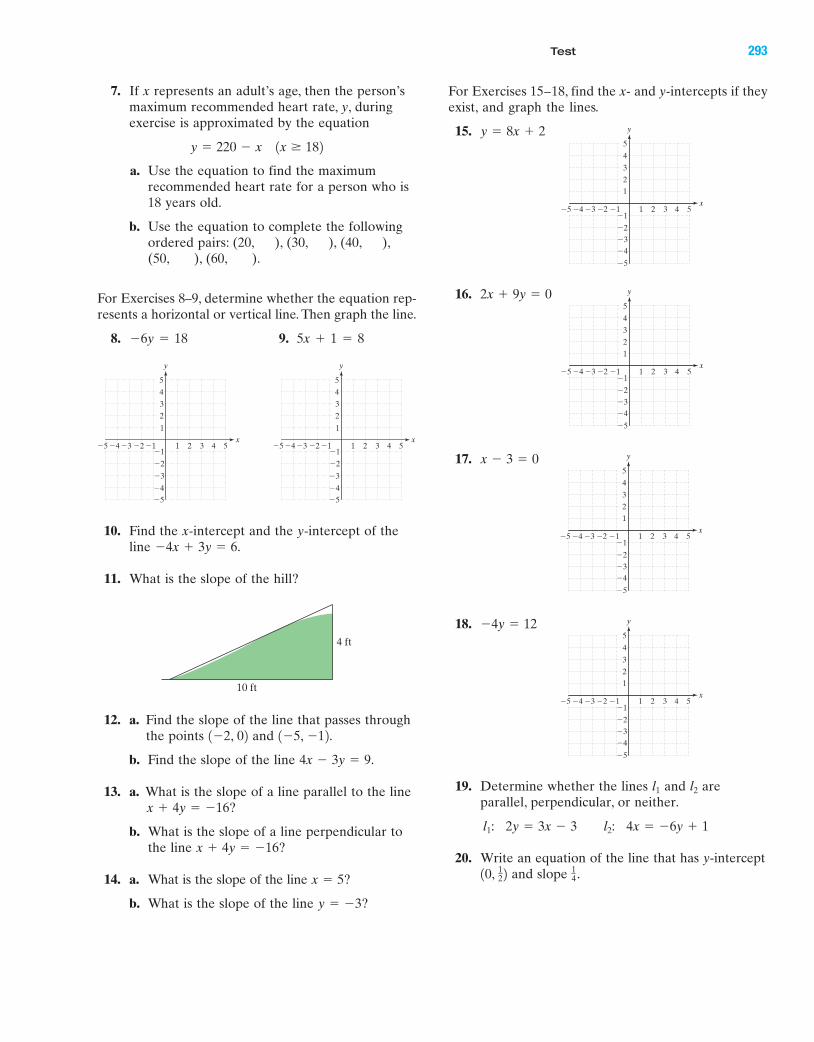
Test 293
BA
For Exercises 15–18, find the x- and y-intercepts if theyexist, and graph the lines.
15.
16.
17.
18.
19. Determine whether the lines and areparallel, perpendicular, or neither.
20. Write an equation of the line that has y-interceptand slope .1
410, 12 2
l1: 2y � 3x � 3 l2: 4x � �6y � 1
l2l1
4 5�4�5 �3 1 2 3�1
�2
�4
�5
21
4
5
3
�1�2
y
x
�3
�4y � 12
4 5�4�5 �3 1 2 3�1
�2�3�4
�5
21
4
5
3
�1�2
y
x
x � 3 � 0
4 5�4�5 �3 1 2 3�1
�2�3�4
�5
21
4
5
3
�1�2
y
x
2x � 9y � 0
4 5�4�5 �3 1 2 3�1
�2�3�4
�5
21
4
5
3
�1�2
y
x
y � 8x � 2
10. Find the x-intercept and the y-intercept of theline
11. What is the slope of the hill?
�4x � 3y � 6.
7. If x represents an adult’s age, then the person’smaximum recommended heart rate, y, duringexercise is approximated by the equation
a. Use the equation to find the maximumrecommended heart rate for a person who is18 years old.
b. Use the equation to complete the followingordered pairs: (20, ), (30, ), (40, ),(50, ), (60, ).
For Exercises 8–9, determine whether the equation rep-resents a horizontal or vertical line. Then graph the line.
8. �6y � 18 9. 5x � 1 � 8
y � 220 � x 1x 182
12. a. Find the slope of the line that passes throughthe points and .
b. Find the slope of the line .
13. a. What is the slope of a line parallel to the line
b. What is the slope of a line perpendicular tothe line
14. a. What is the slope of the line
b. What is the slope of the line y � �3?
x � 5?
x � 4y � �16?
x � 4y � �16?
4x � 3y � 9
1�5, �121�2, 02
5�4�5 �3 1 2 3 4
�2
�4�5
4
5
1
�1�2
y
x
3
2
�1
�3
5�4�5 �3 1 2 3 4
�2
�3
�4�5
4
5
1
�1�2
y
x
3
2
�1
4 ft
10 ft
miL28711_ch03_209-296 9/26/06 07:37 AM Page 293CONFIRMING PAGES
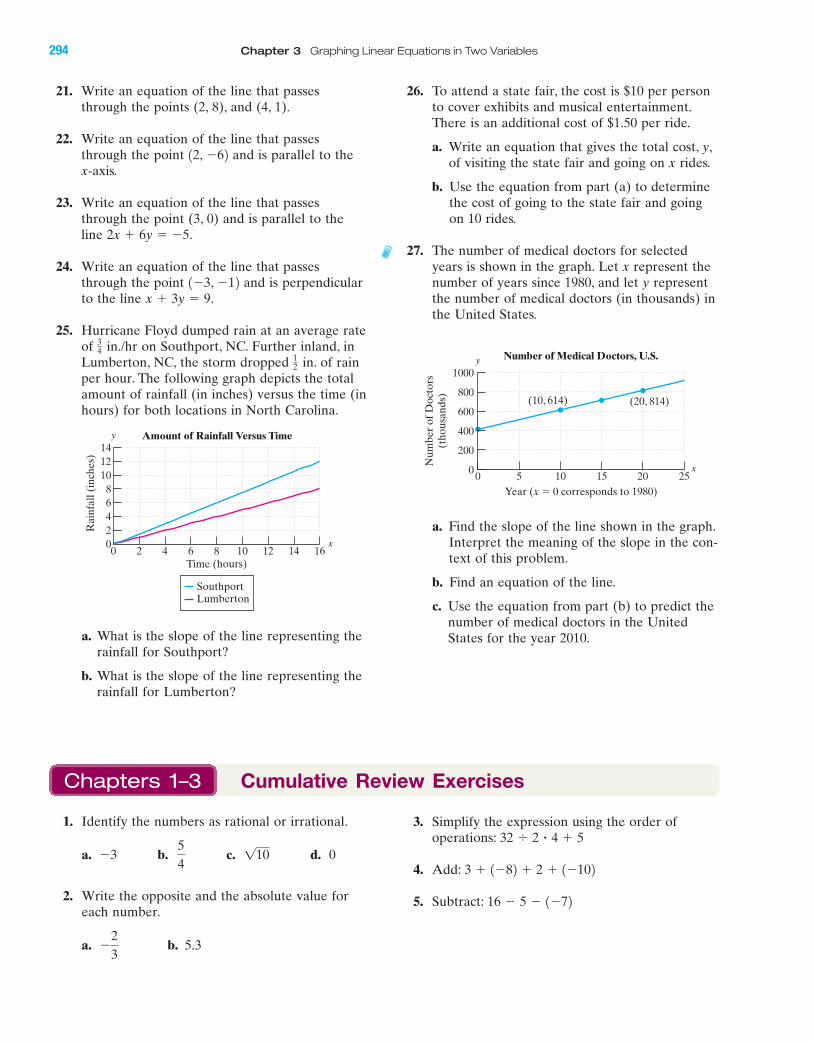
a. What is the slope of the line representing therainfall for Southport?
b. What is the slope of the line representing therainfall for Lumberton?
21. Write an equation of the line that passesthrough the points (2, 8), and (4, 1).
22. Write an equation of the line that passesthrough the point and is parallel to thex-axis.
23. Write an equation of the line that passesthrough the point (3, 0) and is parallel to theline .
24. Write an equation of the line that passesthrough the point and is perpendicularto the line .
25. Hurricane Floyd dumped rain at an average rateof in./hr on Southport, NC. Further inland, inLumberton, NC, the storm dropped in. of rainper hour. The following graph depicts the totalamount of rainfall (in inches) versus the time (inhours) for both locations in North Carolina.
12
34
x � 3y � 91�3, �12
2x � 6y � �5
12, �62
294 Chapter 3 Graphing Linear Equations in Two Variables
BA
14Amount of Rainfall Versus Time
0 2 104 6 8 12 14 16
Rai
nfal
l (in
ches
)
Time (hours)
68
1012
420
y
x
SouthportLumberton
26. To attend a state fair, the cost is $10 per personto cover exhibits and musical entertainment.There is an additional cost of $1.50 per ride.
a. Write an equation that gives the total cost, y,of visiting the state fair and going on x rides.
b. Use the equation from part (a) to determinethe cost of going to the state fair and goingon 10 rides.
27. The number of medical doctors for selectedyears is shown in the graph. Let x represent thenumber of years since 1980, and let y representthe number of medical doctors (in thousands) inthe United States.
1000
00 5 10 15 20 25
Num
ber
of D
octo
rs(t
hous
ands
)
Year (x � 0 corresponds to 1980)
(10, 614) (20, 814)
Number of Medical Doctors, U.S.
800
600
400
200
y
x
a. Find the slope of the line shown in the graph.Interpret the meaning of the slope in the con-text of this problem.
b. Find an equation of the line.
c. Use the equation from part (b) to predict thenumber of medical doctors in the UnitedStates for the year 2010.
Chapters 1–3 Cumulative Review Exercises
3. Simplify the expression using the order ofoperations:
4. Add:
5. Subtract: 16 � 5 � 1�72
3 � 1�82 � 2 � 1�102
32 � 2 � 4 � 51. Identify the numbers as rational or irrational.
a. b. c. d. 0
2. Write the opposite and the absolute value foreach number.
a. b. 5.3�23
11054
�3
miL28711_ch03_209-296 9/26/06 12:42 PM Page 294CONFIRMING PAGES
Cumulative Review Exercises 295
BA
15. Graph the line
16. Find the x- and y-intercepts of .
17. Write the equation in slope-intercept form. Thenidentify the slope and the y-intercept.
18. Explain why the line has only oneintercept.
19. Find an equation of a line passing throughwith slope �3.
20. Find an equation of the line passing throughand 1�3, 42.10, 62
12, �52
2x � 3 � 5
3x � 2y � �12
�2x � 4y � 4
�6x � 2y � 0.For Exercises 6–7, translate the English phrase into analgebraic expression. Then evaluate the expression.
6. The quotient of and
7. The product of �2.1 and �6.
8. Name the property that is illustrated by thefollowing statement.
For Exercises 9–12, solve the equation.
9. 10.
11. 12.
13. The area of Texas is 267,277 mi2. If this is 712 mi2 less than 29 times the area of Maine,find the area of Maine.
14. For the formula solve for a.3a � b � c,
1.7z � 2 � �210.3z � 1.3223
y �16
� y �43
31m � 22 � 3 � 2m � 86x � 10 � 14
6 � 18 � 22 � 16 � 82 � 2
�78
.34
4 5�4�5 �3 1 2 3
�2
�3
�4�5
4
5
1
�1�2
y
x
3
2
�1
miL28711_ch03_209-296 9/26/06 07:37 AM Page 295CONFIRMING PAGES

miL28711_ch03_209-296 9/26/06 07:37 AM Page 296CONFIRMING PAGES