Embed Size (px)
DESCRIPTION
GRAPHING. Using the following data we will look at how to assemble a line graph to represent the relationship between number of wraps of wire and number of paper clips picked up. Our graph will be made on a grid that is 10 X 10, but any grid would work. The vertical axis is called the - PowerPoint PPT Presentation
Citation preview

GRAPHING• Using the following data we will look at how to assemble a
line graph to represent the relationship between number of wraps of wire and number of paper clips picked up.
Trial Number
Number wraps of wire
Number of paper clips picked up
One 8 6
Two 15 14
Three 28 19

Our graph will be made on a grid that is 10 X 10, but any grid would work.
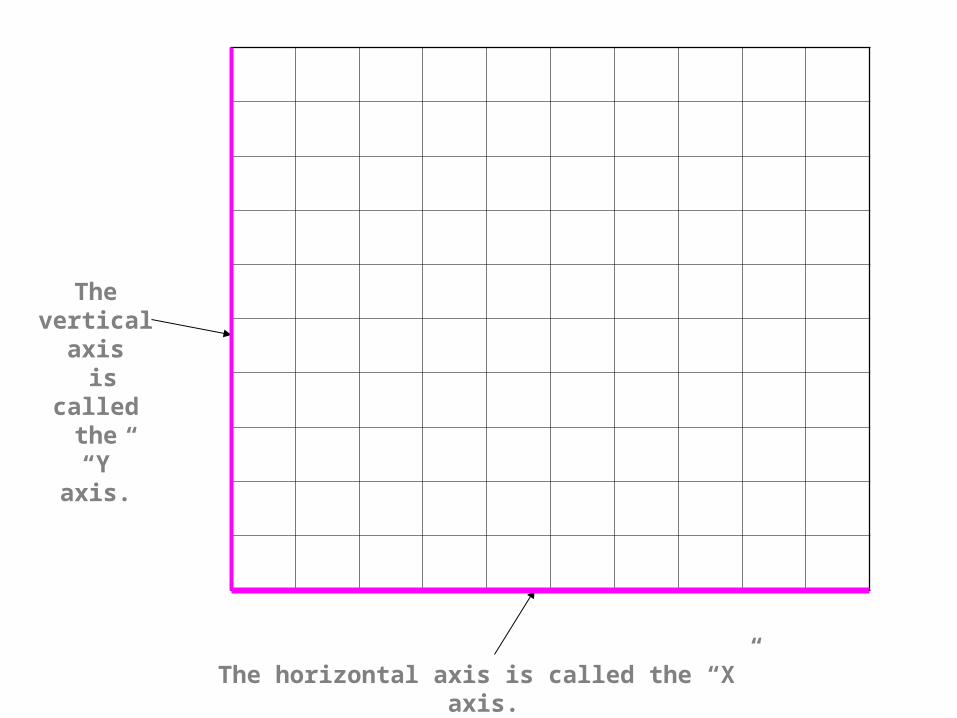
The horizontal axis is called the “X” axis.
The vertical axis
is called the
“Y” axis.

We will plot the independent variable on the horizontal (X axis).
The independent variable is the data that we control.
The student determines how many wraps of wire they will use.
So, the number of wraps of wire is the independent variable.
Number of wraps of wire
Label this axis
For example . . .

We will plot the dependent variable on the vertical (Y axis).
The dependent variable is the data that depends on what the students does.
The student determines how many wraps of wire they will use but, they don’t know how many paper clips the magnet will pickup.
So, the number of paper clips picked up is the dependent variable.
Label this axis
Number of wraps of wire
Nu
mb
er
of
pap
er
clip
s p
icked
up

Number of wraps of wire
Nu
mb
er
of
pap
er
clip
s p
icked
up
Place an informative title at the top.
Electromagnet Strength: Wraps vs. Number of Paper Clips

Number of wraps of wire
Nu
mb
er
of
pap
er
clip
s p
icked
up
Now we are ready to number the graph.
Electromagnet Strength: Wraps vs. Number of Paper Clips

First, let’s go back and look at the data.
Trial Number Number wraps of wire Number of paper clips picked up
One 8 6
Two 15 14
Three 28 19
We’ll begin with the independent variable, the number of wraps of wire.
The largest number we have is 28,
For the smallest number we will use 0. If we had 0 number of wraps the magnet would pick up 0 paper clips.
So the range of numbers on the horizontal (X axis) must go from 0 to at least 28.
28
Number of wraps of wire

Number of wraps of wire
Nu
mb
er
of
pap
er
clip
s p
icked
up Numbers should line up with the
vertical lines . . .
not between lines.
10

Number of wraps of wire
Nu
mb
er
of
pap
er
clip
s p
icked
up
How do we get numbers from 0 to 28 to fiton a grid that only has 10 lines?
The lines can be any value we decideas long as we stay consistent on an axis.
We could number our horizontal (X axis) by 1’s
0
, but that would only get us up to 10.
1 2 3 4 5 6 7 8 9 10
We need to go to 28.

Number of wraps of wire
Nu
mb
er
of
pap
er
clip
s p
icked
up
Numbering by 2’s will only take us to 20.
We do not need to end at exactly 28, and ifwe number by 3’s
0
we can take any number up to 30.
3 6 9 12 15 18 21 24 27 30
Number of wraps of wire
Nu
mb
er
of
pap
er
clip
s p
icked
up
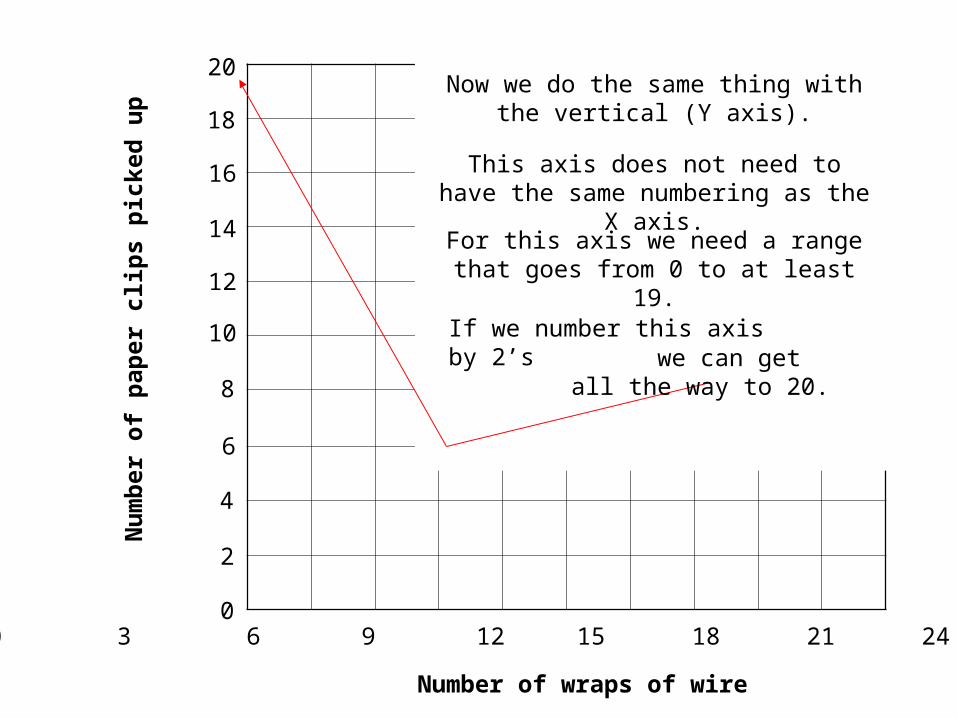
Now we do the same thing with the vertical (Y axis).
0 3 6 9 12 15 18 21 24 27 30
This axis does not need to have the same numbering as the X axis.
For this axis we need a range that goes from 0 to at least 19.
If we number this axis by 2’s
20
18
16
14
12
10
8
6
4
2
0
we can get all the way to 20.

Number of wraps of wire
Nu
mb
er
of
pap
er
clip
s p
icked
up
0 3 6 9 12 15 18 21 24 27 30
20
18
16
14
12
10
8
6
4
2
0
Electromagnet Strength: Wraps vs. Number of Paper Clips
Now we can plot the actual data.

Number of wraps of wire
Nu
mb
er
of
pap
er
clip
s p
icked
up
0 3 6 9 12 15 18 21 24 27 30
20
18
16
14
12
10
8
6
4
2
0
Trial Number
Number wraps of wire
Number of paper clips picked up
One 8 6
Two 15 14
Three 28 19
The first point will be for trial 1.
Locate where 8 can be found on the X axis. It is between 6 and 9, closer to 9.
Locate 6 on the Y axis.
Plot a point on the graph where
these two lines intersect.
8 6One

Number of wraps of wire
Nu
mb
er
of
pap
er
clip
s p
icked
up
0 3 6 9 12 15 18 21 24 27 30
20
18
16
14
12
10
8
6
4
2
0
Trial Number
Number wraps of wire
Number of paper clips picked up
One 8 6
Two 15 14
Three 28 19
Plot the points for trials 2 and 3.

Number of wraps of wire
Nu
mb
er
of
pap
er
clip
s p
icked
up
0 3 6 9 12 15 18 21 24 27 30
20
18
16
14
12
10
8
6
4
2
0
We can plot a final point at 0 on the X
axis and 0 on the Y axis since zero wraps will not pick up any paper clips.
Number of wraps of wire
Nu
mb
er
of
pap
er
clip
s p
icked
up
0 3 6 9 12 15 18 21 24 27 30
20
18
16
14
12
10
8
6
4
2
0
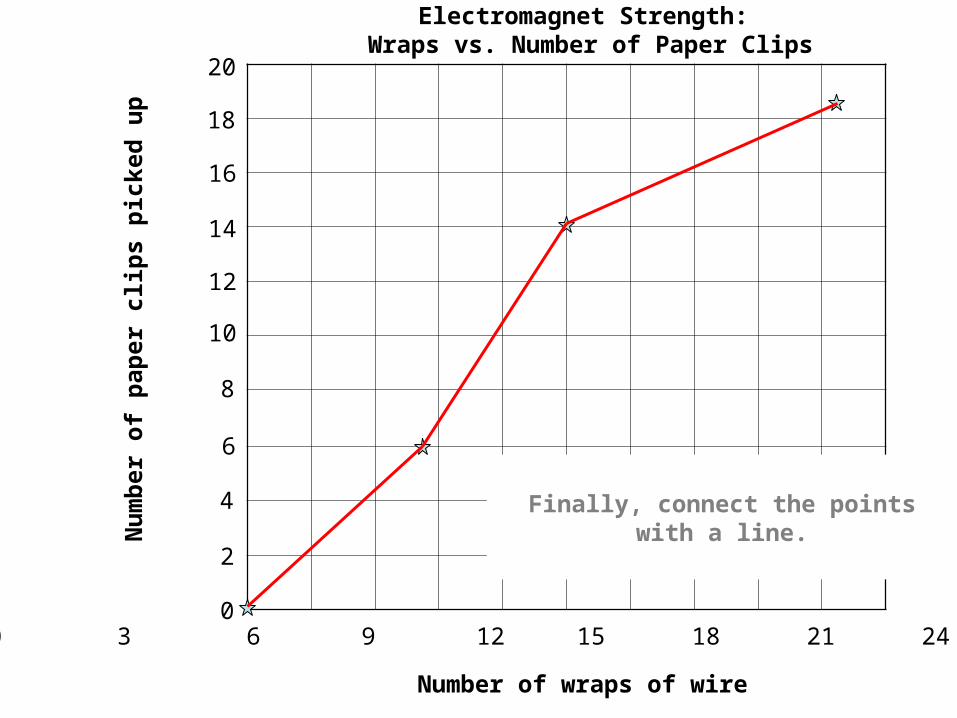
Finally, connect the points with a line.
Electromagnet Strength: Wraps vs. Number of Paper Clips
Number of wraps of wire
Nu
mb
er
of
pap
er
clip
s p
icked
up
0 3 6 9 12 15 18 21 24 27 30
20
18
16
14
12
10
8
6
4
2
0
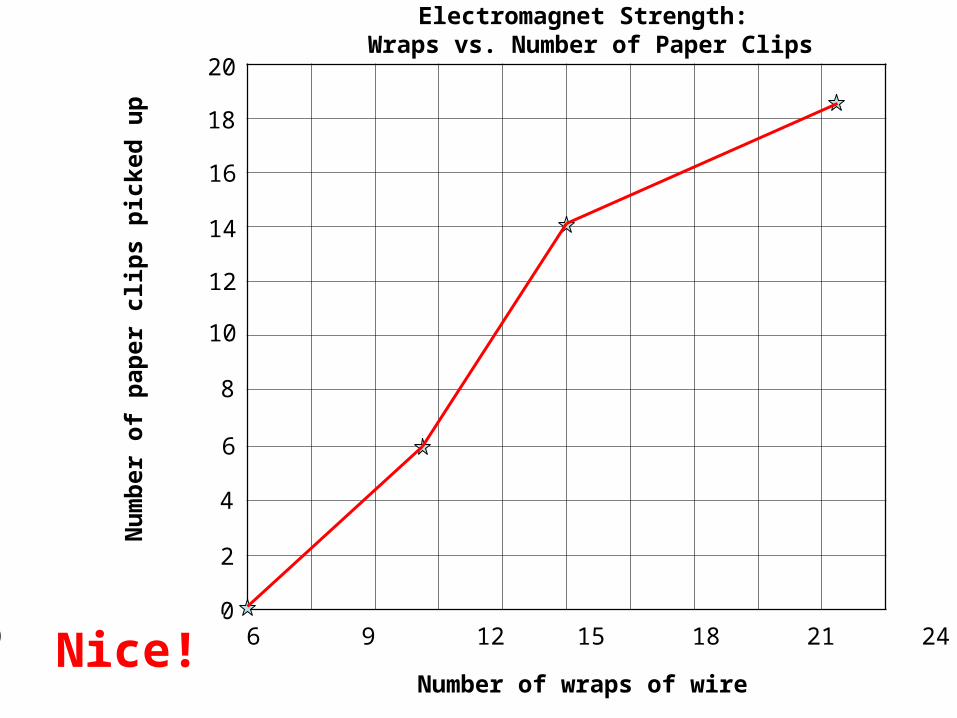
Nice!
Electromagnet Strength: Wraps vs. Number of Paper Clips