Embed Size (px)
Citation preview
1 | P a g e
Graphics API Performance Guide For Intel® Processor Graphics Gen9
Version 2.5 November 29, 2017
2 | P a g e
Graphics API Performance Guide For Intel® Processor Graphics Gen9
Abstract Welcome to the Graphics API Performance Guide for Intel® Processor Graphics Gen9. This document provides recommendations for developers who are already engaged in a graphics project on how to take advantage of numerous new features and capabilities, resulting in significant performance gains and reduced power consumption. Intel® driver development and software validation teams work closely with industry partners to ensure that each of the APIs discussed in this document take full advantage of the hardware improvements. Recommendations for optimization are derived by porting real-world games to the new platforms and instrumenting them with the Intel graphics analysis tools. In this guide, you will find information on structuring and optimizing OpenGL* 4.5, Direct3D* 12, Vulkan*, and Metal* 2 code through hints, tutorials, step-by-step instructions, and online references that will help with the app development process. This guide expands on previous guides and tutorials. For additional details, or further hints, tips, and expert insights on Intel® processors and prior graphics APIs, you can find a full range of reference materials at the Intel® Software Developer Zone website for Game Developers.
3 | P a g e
Table of Contents
1. Introduction ............................................................................................................................................ 4
2. Intel® Processor Graphics Gen9 Architecture .......................................................................................... 5
2.1. General Refinements ....................................................................................................................... 5
2.2 Conservative Rasterization ................................................................................................................ 6
2.2. Texture Compression ....................................................................................................................... 7
2.3. Memory ............................................................................................................................................ 8
2.4. Multiplane Overlay ........................................................................................................................... 9
3. Tools for Performance Analysis ............................................................................................................. 10
3.1. Debug and Performance Tools for Graphics .................................................................................. 10
3.2. Intel® Graphics Performance Analyzers (Intel® GPA) ...................................................................... 11
3.3. Intel® VTune™ Amplifier XE ............................................................................................................ 15
4. Performance Tips for Intel® Processor Graphics Gen9 ......................................................................... 19
4.1. Common Graphics Performance Recommendations ..................................................................... 19
4.2. Direct3D* 12 Performance Tips ..................................................................................................... 23
4.3. Vulkan* Performance Tips ............................................................................................................. 27
4.4. Metal* 2 Performance Tips ............................................................................................................ 29
4.5. OpenGL* Performance Tips ........................................................................................................... 32
5. Designing for Low Power ...................................................................................................................... 36
5.1. Idle and Active Power .................................................................................................................... 36
5.2. Analysis Tips ................................................................................................................................... 37
5.3. Use of SIMD .................................................................................................................................... 41
5.4. Power Versus Frame Rate .............................................................................................................. 41
6. Performance Analysis Workflow for Direct3D 12 ................................................................................. 42
6.1. Selecting an Event .......................................................................................................................... 42
6.2. Performance Analysis with Hardware Metrics............................................................................... 43
7. Appendix: Developer Resources ........................................................................................................... 52
7.1. The Intel® Software Developer Zone and Game Dev Websites...................................................... 52
7.2. DirectX 12 Resources ..................................................................................................................... 54
7.3. Vulkan Resources ........................................................................................................................... 55
7.4. Metal* 2 Resources ........................................................................................................................ 56
7.5. OpenGL* Resources ....................................................................................................................... 57
8. Notices ................................................................................................................................................. 58
4 | P a g e
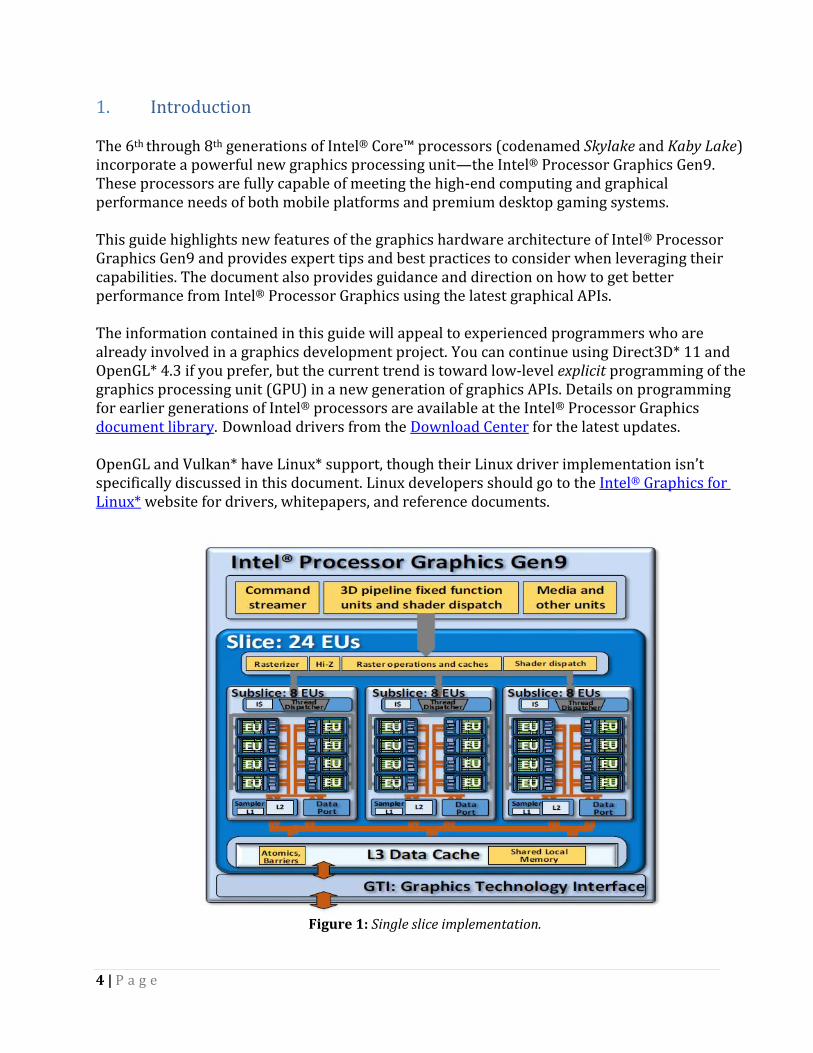
1. Introduction The 6th through 8th generations of Intel® Core™ processors (codenamed Skylake and Kaby Lake) incorporate a powerful new graphics processing unit—the Intel® Processor Graphics Gen9. These processors are fully capable of meeting the high-end computing and graphical performance needs of both mobile platforms and premium desktop gaming systems. This guide highlights new features of the graphics hardware architecture of Intel® Processor Graphics Gen9 and provides expert tips and best practices to consider when leveraging their capabilities. The document also provides guidance and direction on how to get better performance from Intel® Processor Graphics using the latest graphical APIs. The information contained in this guide will appeal to experienced programmers who are already involved in a graphics development project. You can continue using Direct3D* 11 and OpenGL* 4.3 if you prefer, but the current trend is toward low-level explicit programming of the graphics processing unit (GPU) in a new generation of graphics APIs. Details on programming for earlier generations of Intel® processors are available at the Intel® Processor Graphics document library. Download drivers from the Download Center for the latest updates. OpenGL and Vulkan* have Linux* support, though their Linux driver implementation isn’t specifically discussed in this document. Linux developers should go to the Intel® Graphics for Linux* website for drivers, whitepapers, and reference documents.
Figure 1: Single slice implementation.
5 | P a g e
2. Intel® Processor Graphics Gen9 Architecture
Intel® Processor Graphics Gen9 includes many refinements throughout the microarchitecture
and supporting software. Generally, these changes are across the domains of memory hierarchy,
compute capability, power management, and product configuration. They are briefly
summarized here, with more detail provided for significant new features.
2.1. General Refinements
Conservative rasterization
Multisample anti-aliasing (MSAA) – 2x, 4x, 8x performance improved, new 16x support
16-bit floating point hardware support, providing power and performance benefits
when using half precision. Native support for denormal and gradual underflow
Multiplane overlay, display controller features
Atomics support in shared local memory and global memory
Improved back-to-back performance to the same address
Improved geometry throughput
Improved pixel back-end fill rate
Codec support for HEVC and VP8 encode/decode
Memory Hierarchy Refinements Increased bandwidth for the ring interconnect and last-level cache (LLC).
Cache hierarchy changes to support LLC, enhanced dynamic random access memory
(EDRAM), and GPU data sharing. Coherent shared local memory write performance is
significantly improved via new LLC cache management policies.
The available L3 cache capacity has been increased to 768 Kbytes per slice,
512 Kbytes for application data. The sizes of both L3 and LLC request queues have been
increased. This improves latency hiding to achieve better effective bandwidth against the
architecture peak theoretical.
The EDRAM memory controller has moved into the system agent, adjacent to the display
controller, to support power efficient and low latency display refresh. EDRAM now acts as a
memory-side cache between LLC and DRAM. Up to 128 MB on some stock keeping units
(SKUs).
6 | P a g e
Resource Refinements
Tiled resources support for sparse textures and buffers. Unmapped tiles return zero,
writes are discarded.
Lossless compression of render target and texture data, up to 2:1 maximum compression.
Larger texture and buffer sizes (2D mipmapped textures, up to 128Kb x 128Kb x 8 bits).
Hardware support for Adaptive Scalable Texture Compression (ASTC) for lossless color compression to save bandwidth and power with minimal perceptive degradation.
Bindless resources support added increasing available slots from ~256 to ~2 million
(depending on API support). Reduces binding table overhead and adds flexibility.
New shader instructions for LOD clamping and obtaining operation status.
Standard swizzle support for more efficient texture sharing across adapters.
Texture samplers now natively support an NV12 YUV format for improved surface sharing
between compute APIs and media fixed function units.
Compute Capability Refinements
Preemption of compute applications is now supported at a thread level, meaning that compute threads can be preempted (and later resumed) midway through execution.
Round robin scheduling of threads within an execution unit. Intel® Processor Graphics Gen9 adds new native support for the 32-bit float atomics
operations of min, max, and compare/exchange. The performance of all 32-bit atomics is improved for kernel scenarios that issued multiple atomics back to back.
Power Management Refinements
New power gating and clock domains for more efficient dynamic power management. This can particularly improve low-power media playback modes.
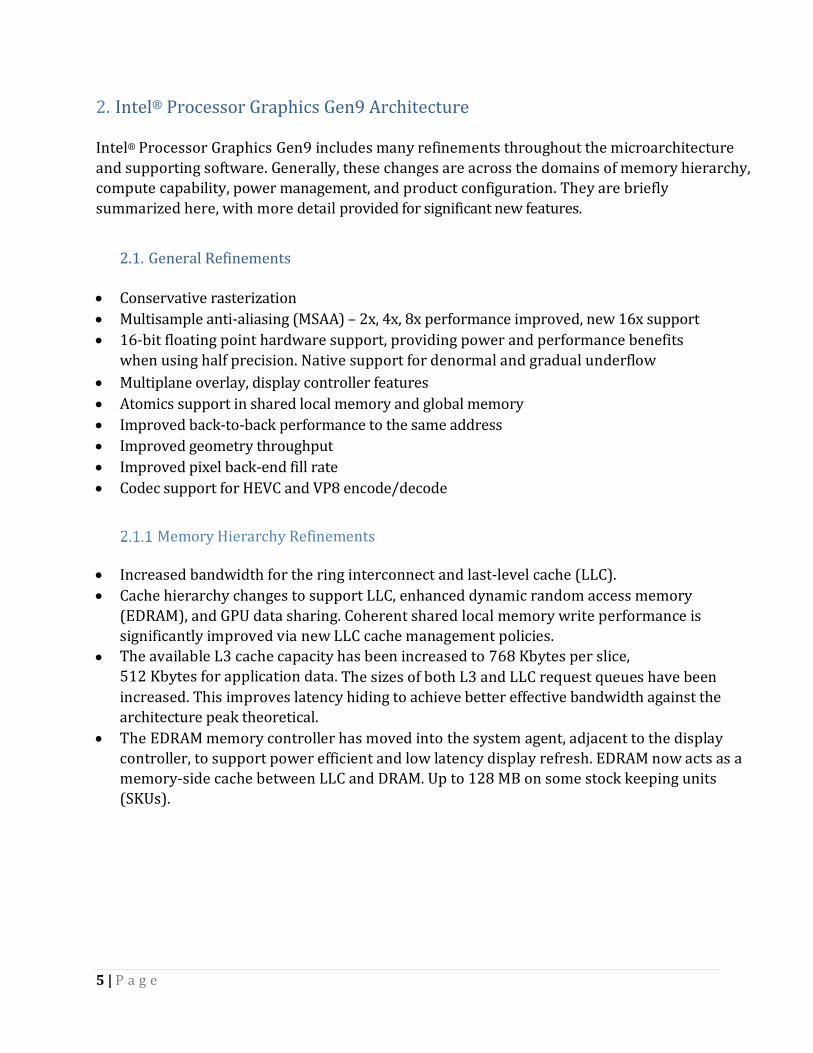
2.2 Conservative Rasterization Rasterization is the process of converting vector-based geometric objects into pixels on a screen. While you could simply check the center of a pixel to see if a polygon covers it (point sampling), conservative rasterization tests coverage at the corners of the pixel leading to much more accurate results. The Intel® Processor Graphics Gen9 GPU architecture adds hardware support for conservative rasterization. There is a flag in the shader to indicate whether the pixel is fully (inner conservative) or partially covered (outer conservative).
7 | P a g e
The implementation meets the requirements of tier2 hardware per the Direct3D specification. It is truly conservative with respect to floating point inputs, and is at most 1/256th of a pixel over conservative (tier 2). No covered pixels are missed or incorrectly flagged as fully covered. Post-snapped degenerate triangles are not culled. A depth coverage flag notes whether each sample was covered by rasterization and has also passed the early depth flag test (see SV_DepthCoverage in Direct3D).
Outer Conservative Inner Conservative
Figure 2: Conservative rasterization.
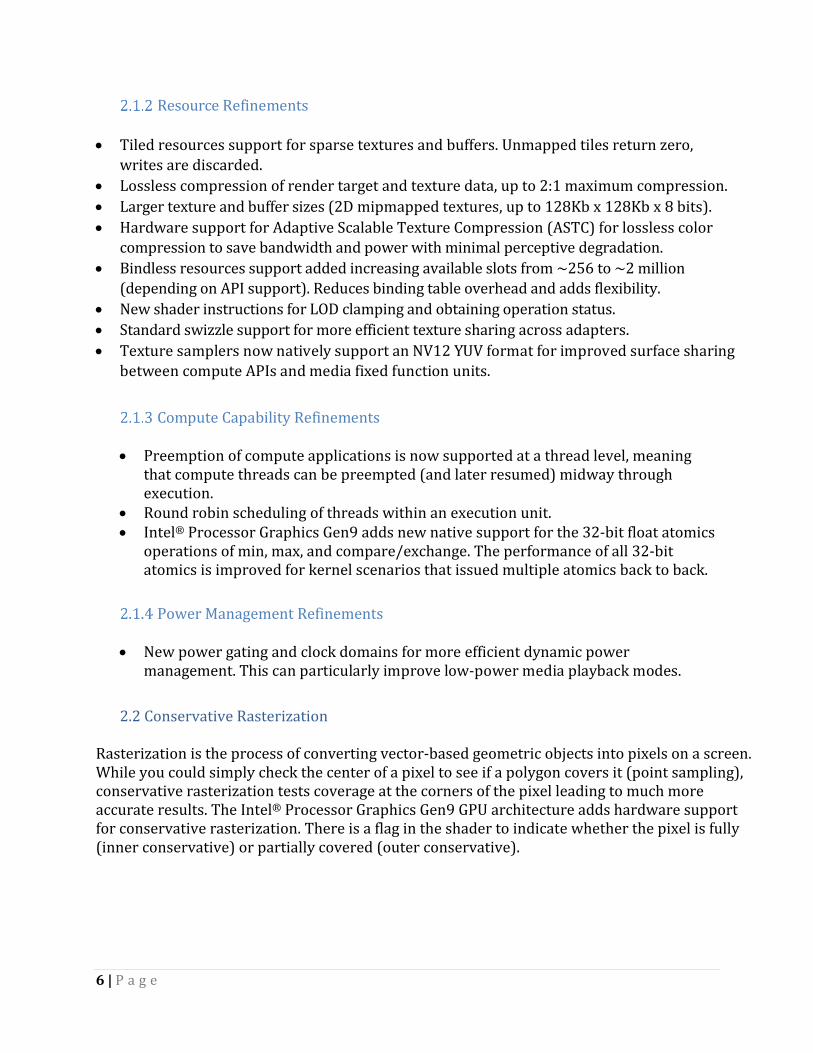
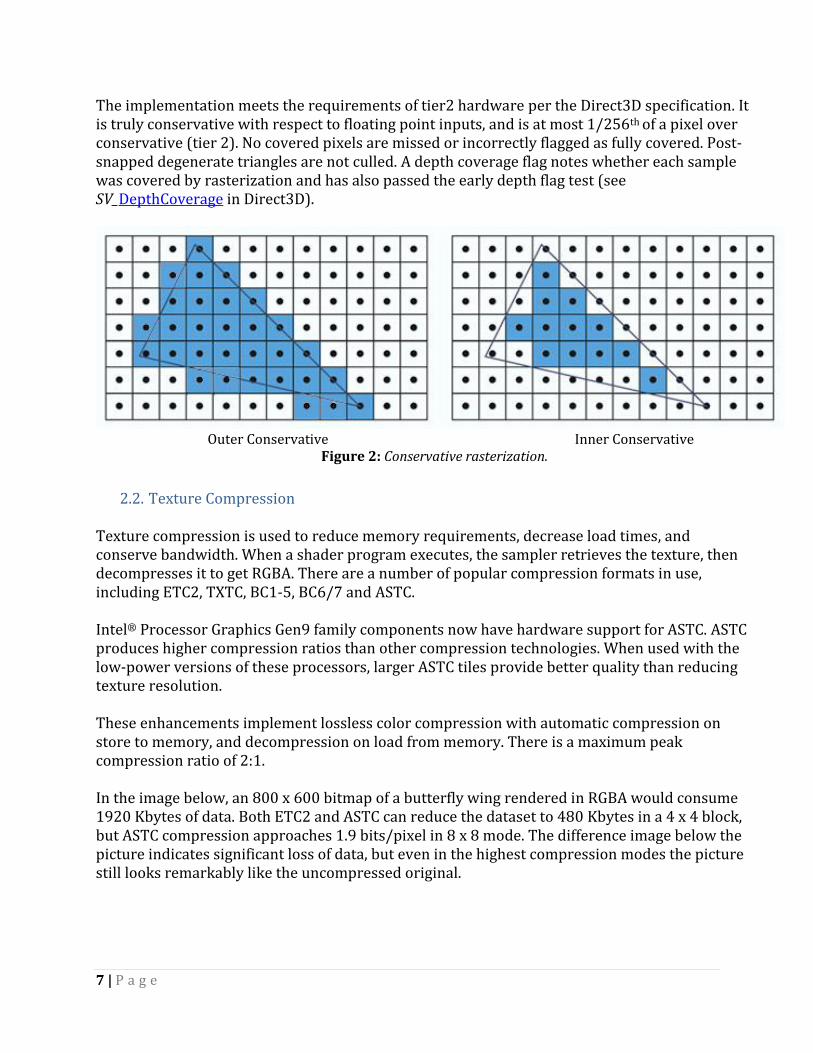
2.2. Texture Compression Texture compression is used to reduce memory requirements, decrease load times, and conserve bandwidth. When a shader program executes, the sampler retrieves the texture, then decompresses it to get RGBA. There are a number of popular compression formats in use, including ETC2, TXTC, BC1-5, BC6/7 and ASTC. Intel® Processor Graphics Gen9 family components now have hardware support for ASTC. ASTC produces higher compression ratios than other compression technologies. When used with the low-power versions of these processors, larger ASTC tiles provide better quality than reducing texture resolution. These enhancements implement lossless color compression with automatic compression on store to memory, and decompression on load from memory. There is a maximum peak compression ratio of 2:1. In the image below, an 800 x 600 bitmap of a butterfly wing rendered in RGBA would consume 1920 Kbytes of data. Both ETC2 and ASTC can reduce the dataset to 480 Kbytes in a 4 x 4 block, but ASTC compression approaches 1.9 bits/pixel in 8 x 8 mode. The difference image below the picture indicates significant loss of data, but even in the highest compression modes the picture still looks remarkably like the uncompressed original.
8 | P a g e
’
Figure 3: Comparing compression techniques.
2.3. Memory
Graphics resources that are allocated from system memory with write-back caching will utilize the full cache hierarchy: Level 1 (L1), Level 2 (L2), last-level cache (LLC), optional EDRAM, and finally DRAM. When accessed from the GPU, sharing can occur in LLC and further caches/memory. The Intel® Processor Graphics Gen9 GPU has numerous bandwidth improvements including increased LLC and ring bandwidth. Coupled with support for DDR4 RAM, these help hide latency. When detecting the amount of available video memory for your graphics device, remember that different rules may apply to different devices. An integrated graphics part reports only a small amount of dedicated video memory. Because the graphics hardware uses a portion of system memory, the reported system memory is a better indication of what your game may use. This should be taken into account when using the reported memory as guidance for enabling or disabling certain features. The GPU Detect Sample shows how to obtain this information in Windows*.
9 | P a g e
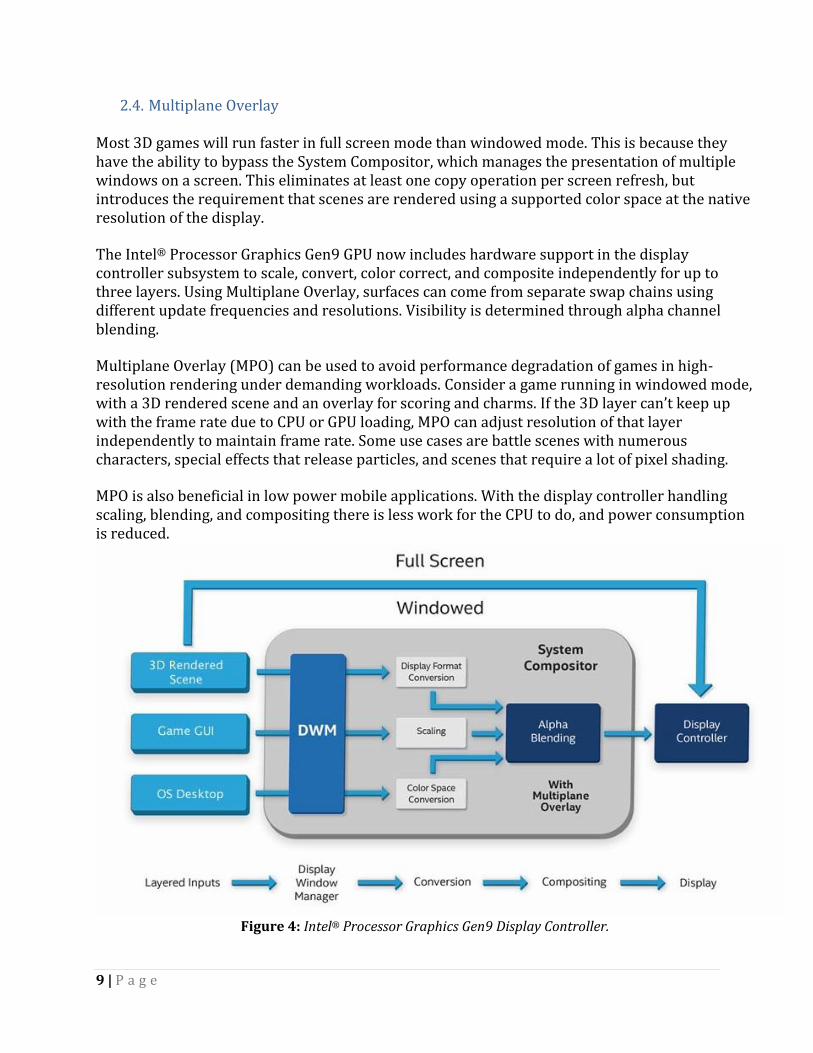
2.4. Multiplane Overlay Most 3D games will run faster in full screen mode than windowed mode. This is because they have the ability to bypass the System Compositor, which manages the presentation of multiple windows on a screen. This eliminates at least one copy operation per screen refresh, but introduces the requirement that scenes are rendered using a supported color space at the native resolution of the display.
The Intel® Processor Graphics Gen9 GPU now includes hardware support in the display controller subsystem to scale, convert, color correct, and composite independently for up to three layers. Using Multiplane Overlay, surfaces can come from separate swap chains using different update frequencies and resolutions. Visibility is determined through alpha channel blending.
Multiplane Overlay (MPO) can be used to avoid performance degradation of games in high-resolution rendering under demanding workloads. Consider a game running in windowed mode, with a 3D rendered scene and an overlay for scoring and charms. If the 3D layer can’t keep up with the frame rate due to CPU or GPU loading, MPO can adjust resolution of that layer independently to maintain frame rate. Some use cases are battle scenes with numerous characters, special effects that release particles, and scenes that require a lot of pixel shading.
MPO is also beneficial in low power mobile applications. With the display controller handling scaling, blending, and compositing there is less work for the CPU to do, and power consumption is reduced.
Figure 4: Intel® Processor Graphics Gen9 Display Controller.
10 | P a g e
3. Tools for Performance Analysis
In this section, the Intel® Graphics Performance Analyzer (Intel® GPA) and Intel® VTune™
Amplifier tools will be used to show you how to locate and fix performance issues and design
code to operate more efficiently. In addition, you might consider some other useful tools not
described in this guide:
Microsoft* Visual Studio* Graphics Analyzers Diagnostics Windows* Performance Toolkit: GPUView and WPA RenderDoc*
Note: As graphics APIs evolve, these tools steadily change to support the latest API versions.
Look for tools that support the most current editions of your favorite graphics APIs, and stay
tuned for more exciting tool features to come in the months ahead.
3.1. Debug and Performance Tools for Graphics
One of the first steps when scanning for possible performance issues is to determine if the
application is CPU- or GPU-bound. A GPU-bound application has at least one CPU thread waiting
for GPU work to complete. The usual waiting point is Present(), when the CPU is too far ahead of
the GPU.
A CPU-bound application has the GPU wait on completion from work happening on the CPU. The
GPU work gets queued in a command buffer. If the GPU finishes what is available in its queue
before the CPU can provide more work, the GPU front-end starves. Remember that all graphics
runtime and driver work is done on the CPU, even when its sole role is to drive the GPU.
If you are experiencing problems with your software application's overall performance, the
following steps will help you determine whether a target application is CPU- or GPU-bound.
Make sure that the "Present" (or equivalent) call is not synchronized to the monitor refresh; that is, frames are being submitted as fast as possible.
A quick-and-dirty method to determine if an application is CPU-bound is often to measure frame rate at high resolution (with MSAA on, and so on). Then, also do so at the lowest possible resolution with no MSAA enabled. If you discover that there is a very small delta between frame rates in these cases, the application is most likely CPU-bound.
For a more accurate determination, use Intel® GPA (see Section 3.2) to measure the load on the GPU and CPU.
For details involving GPU-CPU synchronizations, use Intel® GPA, Intel® VTune Amplifier XE, or GPUView*.
Once you've established where the application is bound, you can then drill down and either tune CPU performance using Intel® VTune Amplifier XE or tune GPU Performance using Intel® GPA.
11 | P a g e
3.2. Intel® Graphics Performance Analyzers (Intel® GPA) Intel® GPA includes powerful, agile tools that enable game developers to utilize the full performance potential of their gaming platform, including (though not limited to) Intel Core processors and Intel Processor Graphics, as well as Intel processor-based tablets running the Android* platform. Intel GPA tools visualize performance data from your application, enabling you to understand system-level and individual frame performance issues. These tools also let you perform what- if experiments to estimate potential performance gains from optimizations.
System Analyzer/HUD
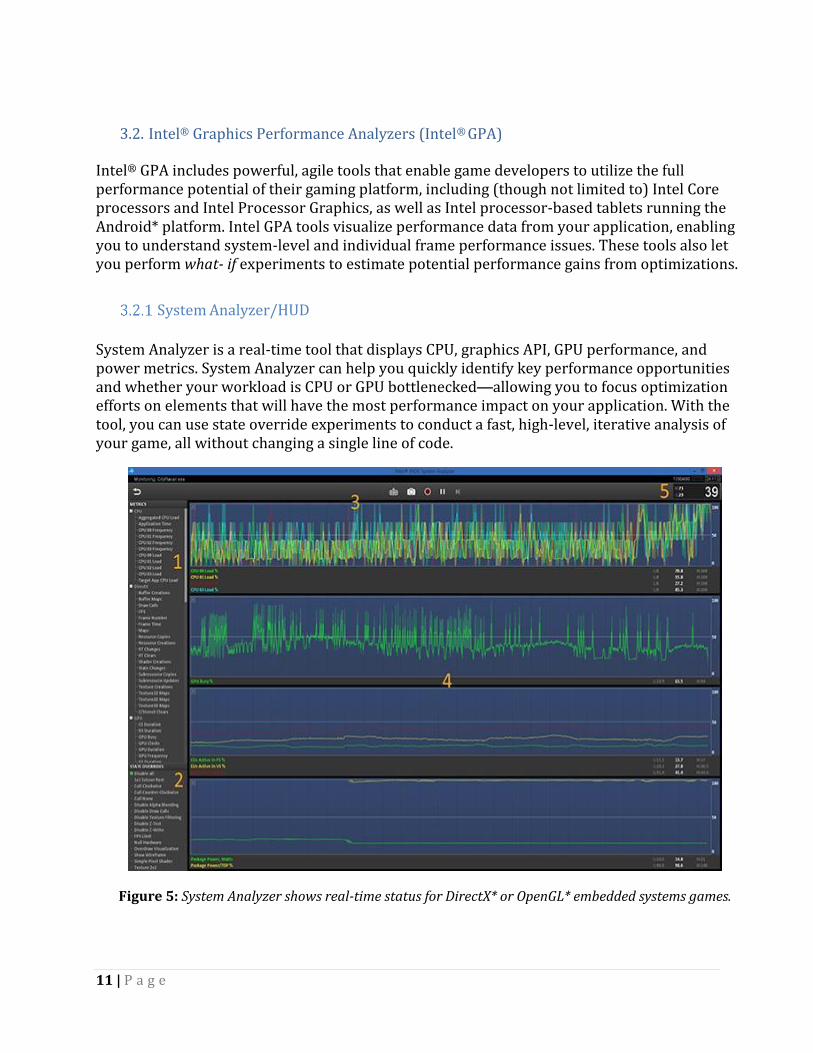
System Analyzer is a real-time tool that displays CPU, graphics API, GPU performance, and power metrics. System Analyzer can help you quickly identify key performance opportunities and whether your workload is CPU or GPU bottlenecked—allowing you to focus optimization efforts on elements that will have the most performance impact on your application. With the tool, you can use state override experiments to conduct a fast, high-level, iterative analysis of your game, all without changing a single line of code.
Figure 5: System Analyzer shows real-time status for DirectX* or OpenGL* embedded systems games.
12 | P a g e
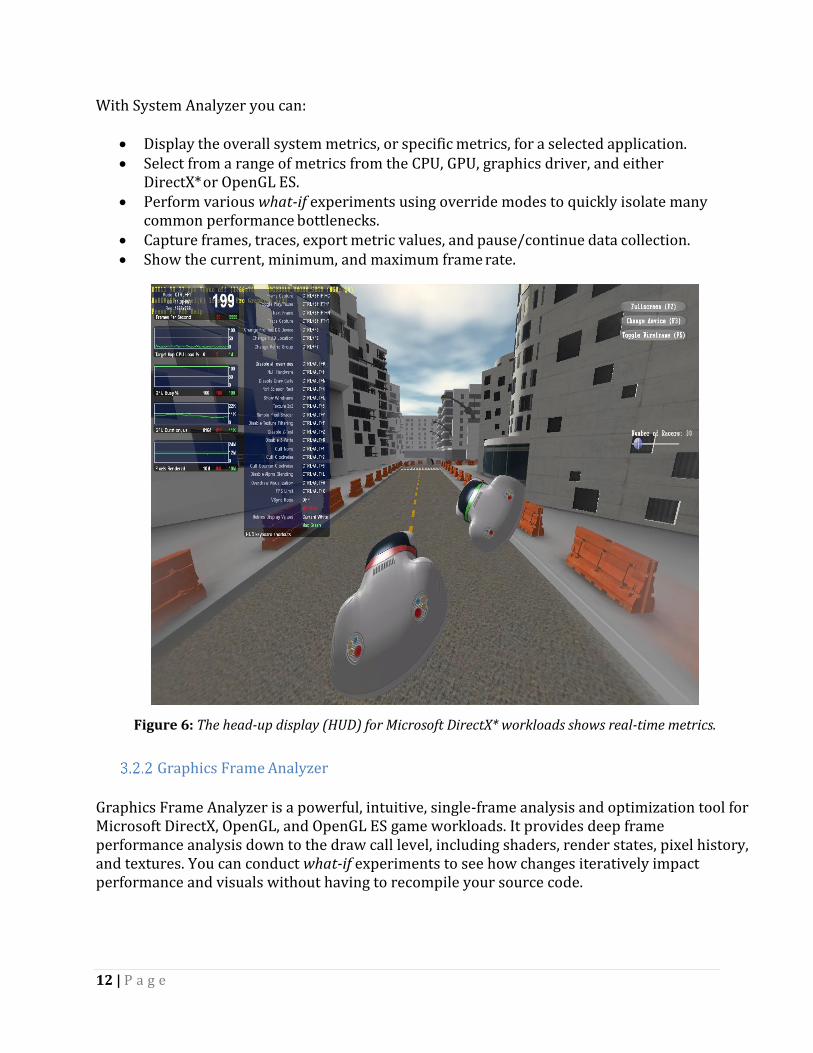
With System Analyzer you can:
Display the overall system metrics, or specific metrics, for a selected application. Select from a range of metrics from the CPU, GPU, graphics driver, and either
DirectX* or OpenGL ES. Perform various what-if experiments using override modes to quickly isolate many
common performance bottlenecks. Capture frames, traces, export metric values, and pause/continue data collection. Show the current, minimum, and maximum frame rate.
Figure 6: The head-up display (HUD) for Microsoft DirectX* workloads shows real-time metrics.
Graphics Frame Analyzer
Graphics Frame Analyzer is a powerful, intuitive, single-frame analysis and optimization tool for Microsoft DirectX, OpenGL, and OpenGL ES game workloads. It provides deep frame performance analysis down to the draw call level, including shaders, render states, pixel history, and textures. You can conduct what-if experiments to see how changes iteratively impact performance and visuals without having to recompile your source code.
13 | P a g e
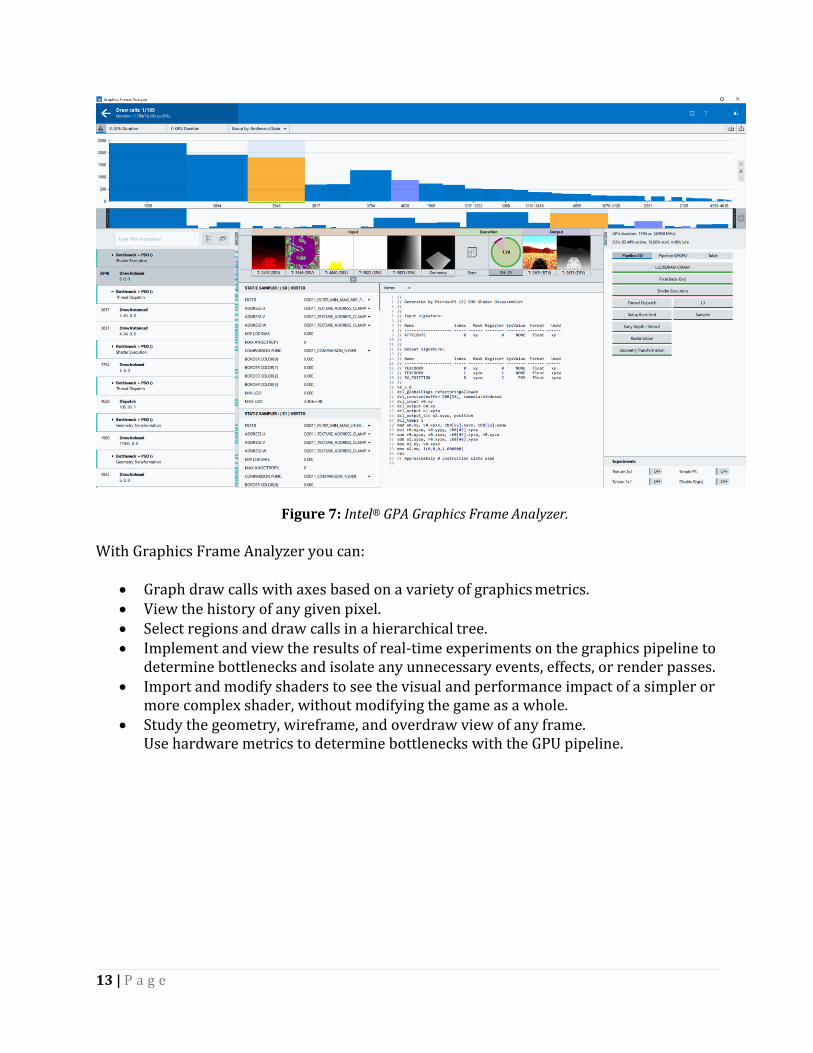
Figure 7: Intel® GPA Graphics Frame Analyzer.
With Graphics Frame Analyzer you can:
Graph draw calls with axes based on a variety of graphics metrics. View the history of any given pixel. Select regions and draw calls in a hierarchical tree. Implement and view the results of real-time experiments on the graphics pipeline to
determine bottlenecks and isolate any unnecessary events, effects, or render passes. Import and modify shaders to see the visual and performance impact of a simpler or
more complex shader, without modifying the game as a whole. Study the geometry, wireframe, and overdraw view of any frame.
Use hardware metrics to determine bottlenecks with the GPU pipeline.
14 | P a g e
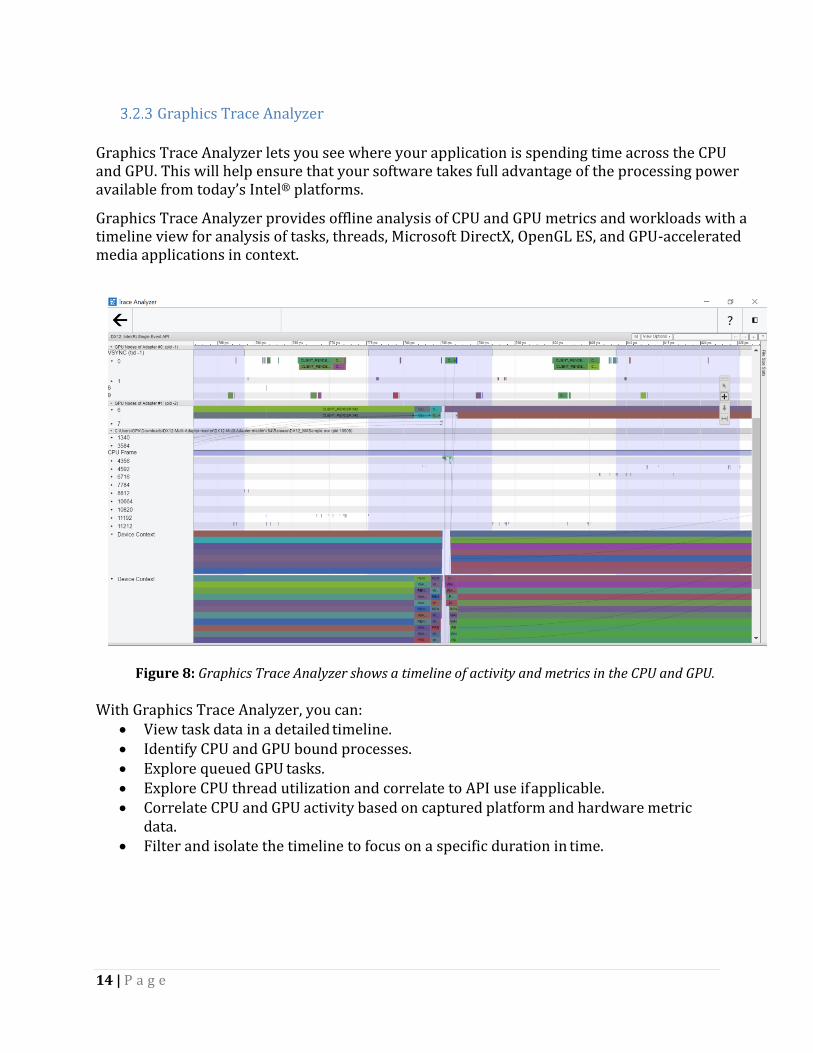
Graphics Trace Analyzer
Graphics Trace Analyzer lets you see where your application is spending time across the CPU and GPU. This will help ensure that your software takes full advantage of the processing power available from today’s Intel® platforms.
Graphics Trace Analyzer provides offline analysis of CPU and GPU metrics and workloads with a timeline view for analysis of tasks, threads, Microsoft DirectX, OpenGL ES, and GPU-accelerated media applications in context.
Figure 8: Graphics Trace Analyzer shows a timeline of activity and metrics in the CPU and GPU.
With Graphics Trace Analyzer, you can:
View task data in a detailed timeline. Identify CPU and GPU bound processes. Explore queued GPU tasks. Explore CPU thread utilization and correlate to API use if applicable. Correlate CPU and GPU activity based on captured platform and hardware metric
data. Filter and isolate the timeline to focus on a specific duration in time.
15 | P a g e
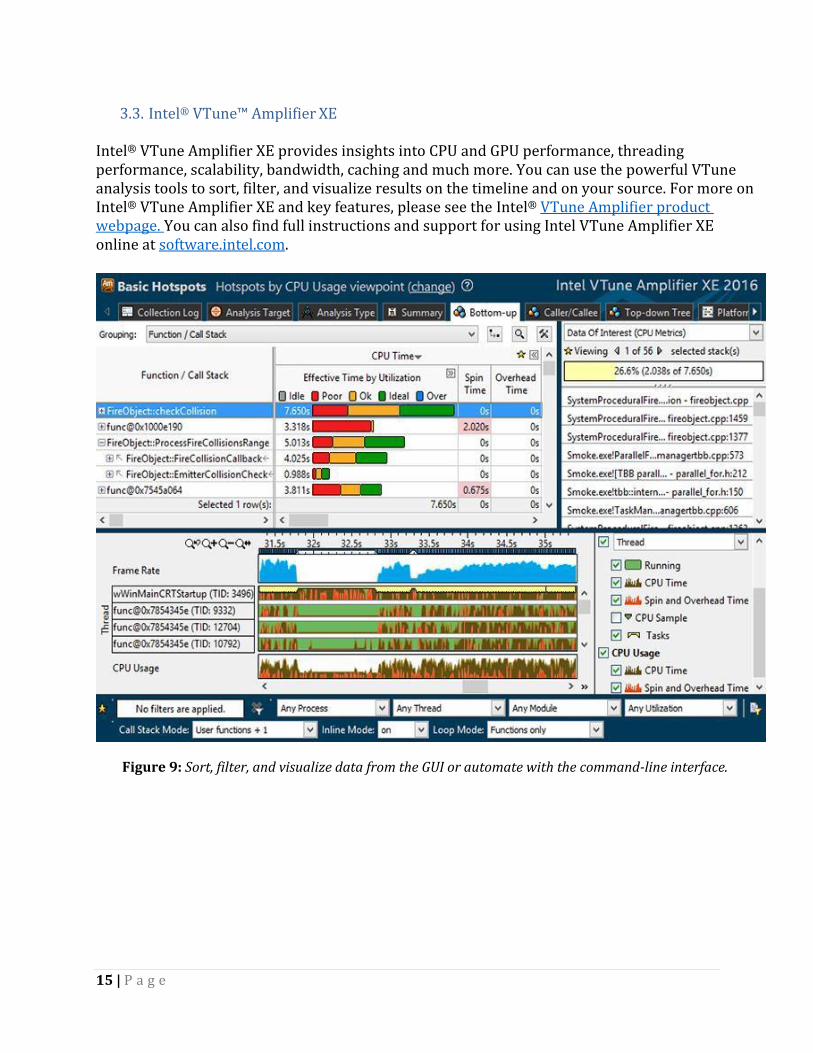
3.3. Intel® VTune™ Amplifier XE Intel® VTune Amplifier XE provides insights into CPU and GPU performance, threading performance, scalability, bandwidth, caching and much more. You can use the powerful VTune analysis tools to sort, filter, and visualize results on the timeline and on your source. For more on Intel® VTune Amplifier XE and key features, please see the Intel® VTune Amplifier product webpage. You can also find full instructions and support for using Intel VTune Amplifier XE online at software.intel.com.
Figure 9: Sort, filter, and visualize data from the GUI or automate with the command-line interface.
16 | P a g e
Hotspot Analysis Intel® VTune Amplifier quickly locates code that is taking up a lot of time. Hotspot analysis features provide a sorted list of the functions that are using considerable CPU time. Fine tuning can provide significant gains, especially if your game is CPU-bound. If you have symbols and sources, you can easily drill down to find the costliest functions, and VTune will provide profiling data on your source to indicate hotspots within the function of interest.
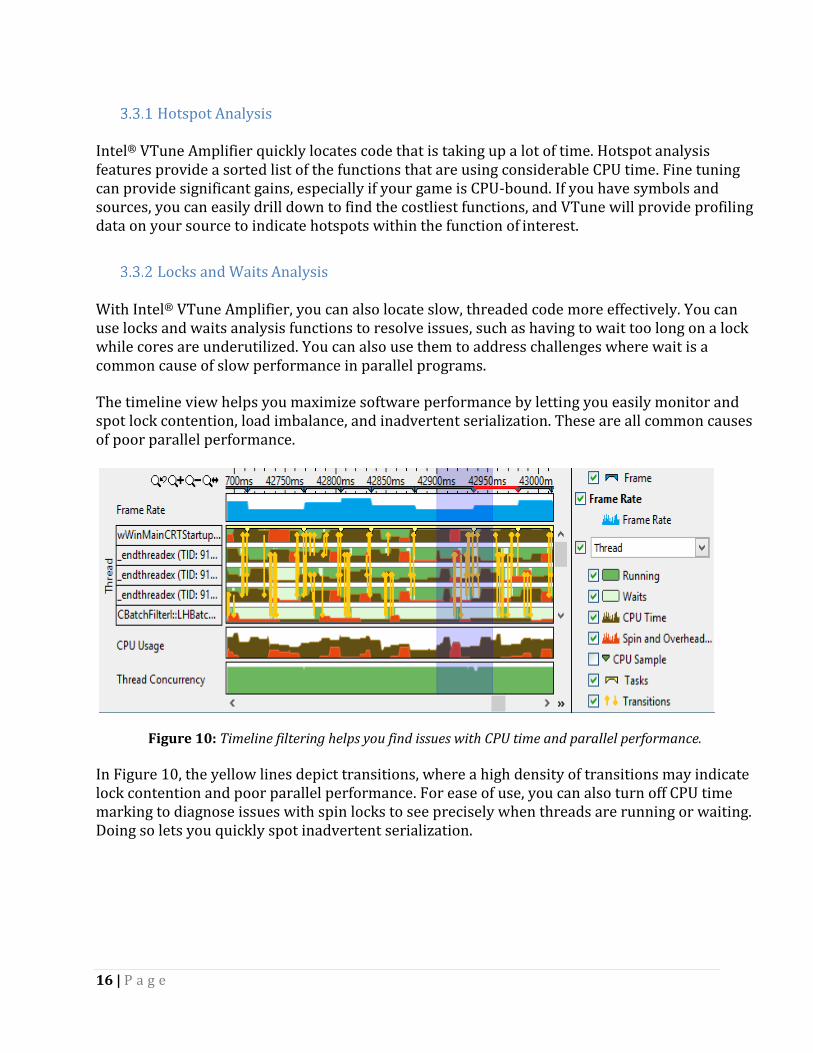
Locks and Waits Analysis With Intel® VTune Amplifier, you can also locate slow, threaded code more effectively. You can use locks and waits analysis functions to resolve issues, such as having to wait too long on a lock while cores are underutilized. You can also use them to address challenges where wait is a common cause of slow performance in parallel programs. The timeline view helps you maximize software performance by letting you easily monitor and spot lock contention, load imbalance, and inadvertent serialization. These are all common causes of poor parallel performance.
Figure 10: Timeline filtering helps you find issues with CPU time and parallel performance.
In Figure 10, the yellow lines depict transitions, where a high density of transitions may indicate lock contention and poor parallel performance. For ease of use, you can also turn off CPU time marking to diagnose issues with spin locks to see precisely when threads are running or waiting. Doing so lets you quickly spot inadvertent serialization.
17 | P a g e
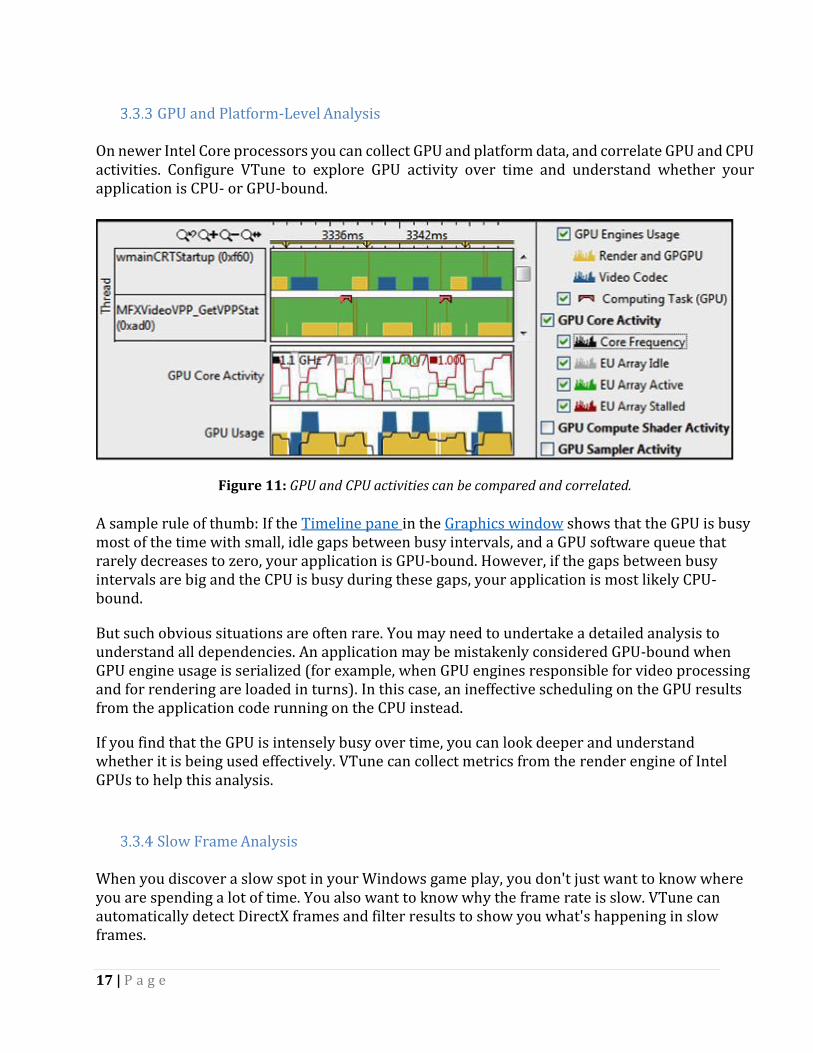
GPU and Platform-Level Analysis On newer Intel Core processors you can collect GPU and platform data, and correlate GPU and CPU activities. Configure VTune to explore GPU activity over time and understand whether your application is CPU- or GPU-bound.
Figure 11: GPU and CPU activities can be compared and correlated.
A sample rule of thumb: If the Timeline pane in the Graphics window shows that the GPU is busy most of the time with small, idle gaps between busy intervals, and a GPU software queue that rarely decreases to zero, your application is GPU-bound. However, if the gaps between busy intervals are big and the CPU is busy during these gaps, your application is most likely CPU-bound.
But such obvious situations are often rare. You may need to undertake a detailed analysis to understand all dependencies. An application may be mistakenly considered GPU-bound when GPU engine usage is serialized (for example, when GPU engines responsible for video processing and for rendering are loaded in turns). In this case, an ineffective scheduling on the GPU results from the application code running on the CPU instead.
If you find that the GPU is intensely busy over time, you can look deeper and understand whether it is being used effectively. VTune can collect metrics from the render engine of Intel GPUs to help this analysis.
Slow Frame Analysis When you discover a slow spot in your Windows game play, you don't just want to know where you are spending a lot of time. You also want to know why the frame rate is slow. VTune can automatically detect DirectX frames and filter results to show you what's happening in slow frames.

18 | P a g e
User Task-Level Analysis with Code Instrumentation Intel VTune Amplifier XE also provides a task annotation API that you can use to annotate your source. Then, when you study your results in VTune, it can display which tasks are executing. For instance, if you label the stages of your pipeline they will be marked in the timeline, and hovering over them will reveal further details. This makes profiling data much easier to understand.
19 | P a g e
4. Performance Tips for Intel® Processor Graphics Gen9
4.1. Common Graphics Performance Recommendations The new closer to the metal programming APIs give developers control over low-level design choices that used to be buried in the device driver. With great power comes great responsibility, so you are going to need debug libraries and good visualization tools to find those hotspots and stalls in your code. There are many similarities between the different APIs that run on Intel Processor Graphics. In this section, we'll take a closer look at how to maximize performance when designing and engineering applications for use with Intel Core processors. The performance recommendations in this section are relevant to all APIs interacting with Intel Processor Graphics. Specific recommendations for OpenGL, Direct3D, Vulkan, and Metal appear in subsequent chapters.
Optimizing Clear, Copy, and Update Operations
To achieve the best performance when performing clear, copy, or update operations on resources, please follow these guidelines:
Use the provided API functions for clear, copy, and update needs. Do not implement your own version of the API calls in the 3D pipeline.
Enable hardware ‘fast clear’ as specified, and utilize 0 or 1 for each channel in the clear color for color or depth. For example, RGBA <0,0,0,1> will clear to black using a fast clear operation.
Copy depth and stencil surfaces only as needed instead of copying both unconditionally.
Render Target Definition and Use
Use the following guidelines to achieve the best performance from a render target:
Use as few render targets as you can. Combine render targets when possible. Define the appropriate format for rendering; that is, avoid defining unnecessary
channels or higher-precision formats when not needed. Avoid using sRGB formats where unnecessary.
20 | P a g e
Texture Sampling and Texture Definition Sampling is a common shader operation, and it is important to optimize both the definition of surfaces sampled along with the sampling operations. Follow these guidelines to achieve the best performance when sampling:
When sampling from a render target, avoid sampling across levels in the surface with instructions like sample l.
Make use of API-defined compression formats (BC1-BC7) to reduce memory bandwidth and improve locality of memory accesses when sampling.
If you’re creating textures that are not CPU-accessible, define them so they match the render target size and alignment requirements. This will enable lossless compression when possible. Sampling is cheaper than conversion!
Avoid dependent texture samples between sample instructions; for example, when the UV coordinate of the next sample instruction is dependent upon the results of the previous sample operation.
Define appropriate resource types for sampling operation and filtering mode. Do not use volumetric surface options when texture 2D or 2D array could have been used.
Avoid defining constant data in textures that could be procedurally computed in the shader, such as gradients.
Use constant channel width formats (for example; R8B8G8A8) rather than variable channel width formats (R10G10B10A2) for operations that may be sampler bottlenecked due to poor cache utilization. This includes those surfaces that are read many times with little other work in a shader.
Use non-volumetric surfaces for operations that may be sampler bottlenecked.
Geometry Transformation
Follow these guidelines to ensure maximum performance during geometry transformation:
● Define input geometry in structure of arrays (SOA) instead of array of structures (AOS)
layouts for vertex buffers by providing multiple streams (one for each attribute) versus a
single stream containing all attributes.
● Do not duplicate shared vertices in mesh to enable better vertex cache reuse; that is, merge
edge data to avoid duplicating the vertices. Incorrect results may appear if the vertex
positions are cached but some of the other attributes are different.
● Optimize transformation shaders (VS->GS) to only output attributes consumed by
downstream shader stages. For example, avoid defining unnecessary outputs from a vertex
shader that are not consumed by a pixel shader.
● Avoid spatial overlap of geometry within a single draw when stencil operations are enabled.
Presort geometry to minimize overlap, and use a stencil prepass for overlapped objects,
otherwise the geometry may serialize in the front end as it attempts to determine if it can
update the stencil buffer. This issue is commonly seen when performing functions such as
foliage rendering, clouds, or dust.
21 | P a g e
General Shading Guidance To achieve optimal performance when shading, follow these guidelines:
Avoid creating shaders where the number of temporaries (dcl_temps for D3D) is ≥ 16. This is to prevent overutilizing the register space, causing the potential for slowdowns. Optimize to reduce the number of temporaries in the shader assembly.
Structure code to avoid unnecessary dependencies (especially dependencies on high-latency operations like sample).
Avoid flow control decisions on high-latency operations. Structure your code to hide the latency of the operation that drives control flow.
Avoid flow control decisions using non-uniform variables, including loops. Try to ensure uniform execution among the shader threads.
Avoid querying resource information at runtime (for example, the High Level Shading Language (HLSL) GetDimensions call) to make decisions on control flow, or unnecessarily incorporating resource information into algorithms; for example, disabling a feature by binding an arbitrarily sized (1 x 1) surface.
Implement fast paths in shaders to return early in algorithms where the output of the algorithm can be predetermined or computed at a lower cost of the full algorithm.
Use discard (or other kill pixel operations) where output will not contribute to the final color in the render target. Blending can be skipped where the output of the algorithm is an alpha of 0, or adding inputs to shaders that are 0s that negate output.
Constants
Follow these guidelines when defining and using constants to achieve the best possible results from software applications:
Structure constant buffers to improve cache locality; that is, so accesses all occur on the same cache line.
Accesses have two modes, direct (offset known at compile time) and indirect (offset computed at runtime). Avoid defining algorithms that rely on indirect accesses, especially with control flow or tight loops. Make use of direct accesses for high-latency operations like control flow and sampling.

22 | P a g e
Anti-Aliasing For the best anti-aliasing performance, follow these guidelines:
For improved performance over MSAAx4, use Conservative Morphological Anti-Aliasing (CMAA) (see the CMAA whitepaper for more information).
Avoid querying resource information from within a loop or branch where the result is immediately consumed or duplicated across loop iterations.
Minimize per-sample operations, and when shading in per-sample, maximize the number of cases where any kill pixel operation is used (for example, discard) to get the best surface compression.
Minimize the use of stencil or blend when MSAA is enabled.
23 | P a g e
4.2. Direct3D* 12 Performance Tips
What’s new in Direct3D 12?
Direct3D 12 introduces a set of new resources for the rendering pipeline including pipeline state objects, command lists and bundles, descriptor heaps and tables, and explicit synchronization objects. New features include conservative rasterization, volume-tiled resources to enable streamed, three-dimension resources to be treated as if they were all in video memory, rasterizer order views (ROVs) to enable reliable transparency rendering, setting the stencil reference within a shader to enable special shadowing and other effects, and improved texture mapping and typed unordered access views (UAV).
In addition to general optimization guidelines in Section 3 of this document, there are some additional specific guidelines for Direct3D 12. By following them, developers can ensure maximum performance from applications, and ensure optimum visual fidelity.
Clear Operations
To get maximum performance of depth and render target clears, provide the optimized clear color (use 0 or 1 valued colors; for example, 0,0,0,1) when creating the resource, and use only that clear color when clearing any of the Render target views or Depth stencil views associated with the D3D12_CLEAR_VALUES structure at resource creation time.
Pipeline State Objects
Direct3D 12 introduces a collection of shaders and some states known as pipeline state objects (PSOs). Follow these guidelines when defining PSOs to optimize output:
When creating PSOs, make sure to take advantage of all the available CPU threads on the system. In previous versions of DirectX, the driver would create these threads for you, but you must create the threads yourself in DirectX 12.
Compile similar PSOs on the same thread to improve on the de-duplication done by the driver and runtime.
Avoid creating duplicate PSOs, and do not rely on the driver to cache PSOs. Define optimized shaders for PSOs instead of using combinations of generic shaders
mixed with specialized shaders. Don’t define a PSO with a vertex shader generating unnecessary output not consumed by a pixel shader.
Don’t define a depth + stencil format if the stencil will not be enabled.
24 | P a g e
Asynchronous Dispatch (3D + Compute)
Asynchronous dispatch of 3D and compute operations is not supported at this time. Therefore, it is not recommended to structure algorithms with the expectation of latency hiding by executing 3D and compute functions simultaneously. Instead, batch your compute algorithms to allow for minimal latency and context switching.
Root Signature
Follow these guidelines to achieve maximum performance:
Limit visibility flags to shader stages that will be bound. Actively use DENY flags where resources will not be referenced by a shader stage. Avoid generic root signature definitions where unnecessary descriptors are defined
and not leveraged. Instead, optimize root signature definitions to the minimal set of descriptor tables needed.
Root Constants
Use root constants for cases where the constants are changing at a high frequency. Favor root constants over root descriptors, and favor root descriptors over descriptor tables when working with constants.
Compiled Shader Caching
Use the features provided in the Direct3D 12 Pipeline Library support to natively cache compiled shaders to reduce CPU overhead upon startup.
Conservative Rasterization and Raster Order Views
Use hardware conservative rasterization for full-speed rasterization and use ROVs only when you need synchronization. Also favor ROVs over atomics.
Command Lists and Barriers
Group together as many command lists as possible when calling execute command lists as long as the CPU cost of managing the bundles does not starve the GPU. If the cost to create command lists is greater than the cost to execute the previous command list, the GPU goes idle.
25 | P a g e
Try to group together barriers into a single call instead of many separate calls, and avoid the use of unnecessary barriers. Generally, avoid barriers outside of render target changes and avoid states like D3D12_RESOURCE_STATE_COMMON unless necessary for presenting, context sharing, or CPU access. Each barrier generally results in a cache flush or GPU stall operation.
Resource Creation
Prefer committed resources. They have less padding, so the memory layout is more optimal.
Direct Compute Optimizations The balance of this section covers additional optimization guidelines to follow when programming the compute engine of the Intel® Processor Graphics Gen9. For more info on general purpose GPU programming, see The Compute Architecture of Intel® Processor Graphics Gen9.
Dispatch and Thread Occupancy To achieve optimal dispatch and thread occupancy of EUs, there are three factors to balance when optimizing for dispatch and occupancy: thread group dimensions, single instruction multiple data (SIMD) width of execution, and shared local memory (SLM) allocation per thread group. The goal is to avoid GPU idle cycles.
The combination of thread group dimensions and SIMD width of execution will control the dispatch of thread groups on sub-slices.
Intel® Processor Graphics Gen9 have 56 hardware threads per subslice. Hardware thread utilization per thread group is determined by taking thread group
dimensions (that is, dim x * dim y * dim z) and dividing by SIMD width of shader (SIMD16 when number of temporaries are ≤ 16; otherwise, SIMD8).
For a 16 x 16 x 1 thread group, 256 threads / 16 (SIMD width) = 16 hardware threads for each thread group. 56 total threads / 16 hardware threads per group allows for 3 thread groups to fully execute per subslice, with one possible partial (depending on barriers defined).
SIMD32 exception overrides SIMD16 compilation when thread group dimension is too large to fit on a subslice. For a 32 x 32 x 1 thread group, 1024 threads / 16 (SIMD width) = 64 hardware threads. As there are 56 hardware threads per subslice, you need to compile as SIMD32 to fit.
SLM allocation per subslice is 64 Kbytes for up to the number of hardware threads supported by
your subslice (see above). SLM allocation per thread group can limit thread group dispatch on a
subslice.
26 | P a g e
A thread group defined with 32 Kbytes of SLM would limit to only two thread groups executing
per subslice. A 16 x 16 x 1 thread group consuming 16 hardware threads (SIMD16) would only
fill 32 of 56 hardware threads, leaving the subslice ~43 percent idle during execution.
Resource Access
When reading from or writing to surfaces in compute, avoid partial writes so that you can get maximum bandwidth through the graphics cache hierarchy. Partial writes are any accesses where the data written doesn’t fully cover the 64-byte cache line. UAV writes commonly cause partial writes.
Shared Local Memory
Memory is shared across threads in the thread group. Follow these guidelines for maximum performance:
Layout elements in structured buffers as SOA instead of AOS to improve caching and reduce unnecessary memory fetch of unused/unreferenced elements. Additionally, structure data in SOA where element granularity in the SOA is 4 bytes between elements, and the total size of the array is not a multiple of 16.
Split RGBA definition in a single structure into R, G, B, and A, where the array length of each R, G, B, and A is padded out to a non-multiple of 16.
SOA removes bank collisions when accessing a single channel (for example, R). Padding out to a non-multiple of 16 removes bank collisions when accessing multiple channels (RGBA).
If AOS is required, pad structure size to a prime number for structure sizes greater than 16 bytes.
27 | P a g e
4.3. Vulkan* Performance Tips Vulkan was developed by the Khronos Group as an alternative to OpenGL, for a low-level, high- performance API for modern graphics and compute hardware. Like OpenGL, it is cross platform and open source; supporting Windows, Linux, and Android. Unlike OpenGL, the programmer is responsible for low-level details such as frame buffer creation, command lists, memory management, CPU/GPU synchronization, and error checking.
What’s new in Vulkan? Vulkan shader code is loaded in a bytecode format called SPIR-V* (Standard Portable Intermediate Representation). SPIR-V allows the use of industry standard shading languages like OpenGL Shading Language (GLSL) and HLSL on the front end, then outputs a compiled intermediate binary. Additional benefits of SPIR-V are standards compliance and decreased shader load times. Device independence is achieved in Vulkan by separating out any operating system-dependent code at the application binary interface (ABI). The ABIs specify the calling conventions, data types, register usage, and file formats utilized for communications between the game, the operating system, and the graphics hardware.
Memory Resources Create memory resources from the same memory object. Image layouts and transitions are heavily optimized. Always use VK_IMAGE_LAYOUT_{}_Optimal. Avoid VK_IMAGE_LAYOUT_GENERAL or VK_IMAGE_CREATE_MUTABLE_FORMAT_BIT unless really needed. OPTIMAL can be used for just about everything, while MUTABLE doesn’t allow the driver to optimize for memory management.
Clears Use RGBA <0,0,0,1> clears for best performance, but use any 0/1 clear value when possible. Use VK_ATTACHMENT_LOAD_OP+CLEAR to enable this rather than vkCmdClearColorImage.
Barriers Avoid sending barriers per resource. Minimize the number of memory barriers used in layout transitions. Batch pipeline barriers. Use implicit render pass barriers whenever possible.
28 | P a g e
Command Buffers Use primary command buffers whenever possible. Performance is better due to internal batch buffer usage. Batch your work to increase command buffer size and reduce the number of command buffers. Secondary command buffers are less efficient than primary, especially on depth clears. Use caution with reusable command buffers as they may require a copy. Use: VK_COMMAND_BUFFER_USAGE_ONE_TIME_SUBMIT_BIT. Avoid: VK_COMMAND_BUFFER_USAGE_SIMULTANEOUS_USE_BIT
Presentation Use full screen presentation modes whenever possible. Windowed mode requires an extra context switch and copy operation.
Multithreading Use multiple CPU cores to fill command buffers. Multithreading reduces single core CPU overhead and can improve CPU performance and power consumption. It may allow the GPU to benefit from the shared turbo.
Compute The pipeline is flushed when switching between 3D graphics rendering and compute functions. Asynchronous compute functions are not supported at this time. Batch the compute kernels into groups whenever possible.
29 | P a g e
4.4. Metal* 2 Performance Tips
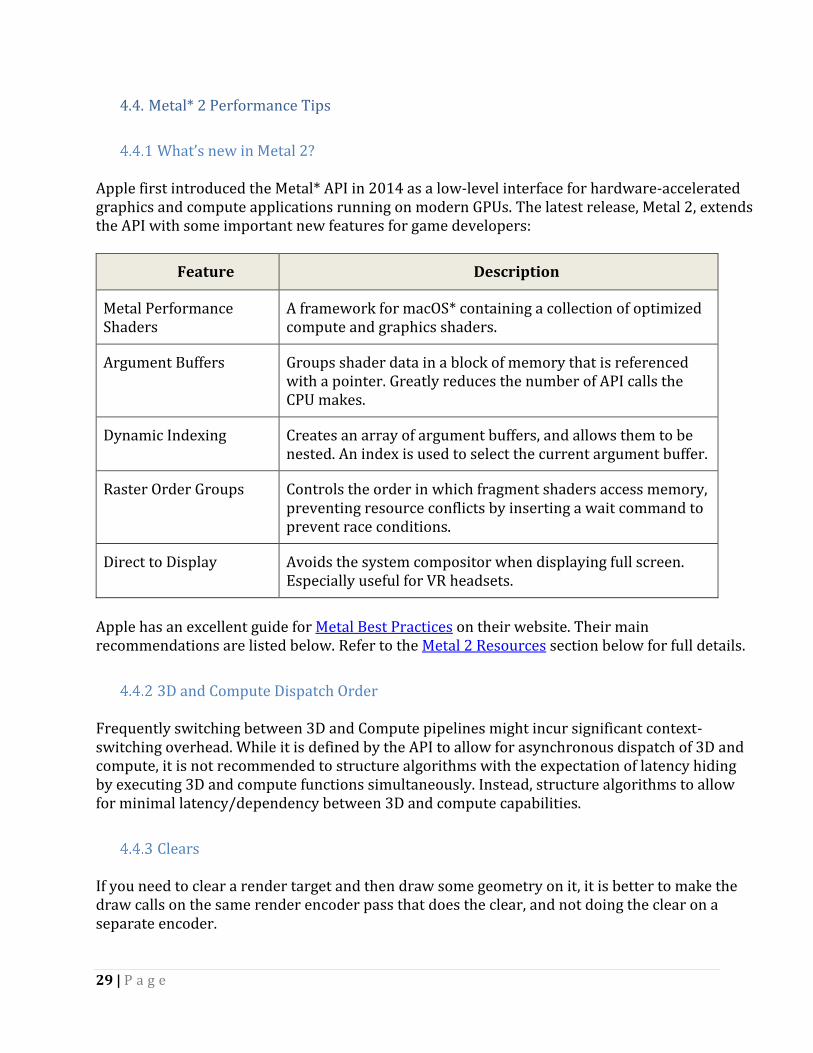
What’s new in Metal 2? Apple first introduced the Metal* API in 2014 as a low-level interface for hardware-accelerated graphics and compute applications running on modern GPUs. The latest release, Metal 2, extends the API with some important new features for game developers:
Feature Description
Metal Performance Shaders
A framework for macOS* containing a collection of optimized compute and graphics shaders.
Argument Buffers Groups shader data in a block of memory that is referenced with a pointer. Greatly reduces the number of API calls the CPU makes.
Dynamic Indexing Creates an array of argument buffers, and allows them to be nested. An index is used to select the current argument buffer.
Raster Order Groups Controls the order in which fragment shaders access memory, preventing resource conflicts by inserting a wait command to prevent race conditions.
Direct to Display Avoids the system compositor when displaying full screen. Especially useful for VR headsets.
Apple has an excellent guide for Metal Best Practices on their website. Their main recommendations are listed below. Refer to the Metal 2 Resources section below for full details.
3D and Compute Dispatch Order Frequently switching between 3D and Compute pipelines might incur significant context-switching overhead. While it is defined by the API to allow for asynchronous dispatch of 3D and compute, it is not recommended to structure algorithms with the expectation of latency hiding by executing 3D and compute functions simultaneously. Instead, structure algorithms to allow for minimal latency/dependency between 3D and compute capabilities.
Clears If you need to clear a render target and then draw some geometry on it, it is better to make the draw calls on the same render encoder pass that does the clear, and not doing the clear on a separate encoder.
30 | P a g e
This is because the driver resolves the clear color at the end of the encoder pass that cleared it, so if you have an encoder that only clears the RT, the driver will fast clear it and immediately resolve, and the performance will be the same or worse than not using fast clear at all. When you draw to some pixels in the same encoder then the resolve will be cheaper.
Texture Barriers The MTLRenderCommandEncoder’s textureBarrier() call flushes all render targets and the depth buffer and allows the application to bind the current render targets and/or depth buffer for reading. The suggestion here is that instead of having one encoder that does some draws, then binds the depth buffer for reading, and then some more draws, it is better to split it into two different encoders. This is because when the current depth buffer is bound as texture for reading, the use of the compress depth buffer (HiZ) might get disabled for all draws of the render encoder, including the draws that happened in the encoder before the binding point. If the depth buffer was cleared in the same encoder then fast depth clear also will not be used.
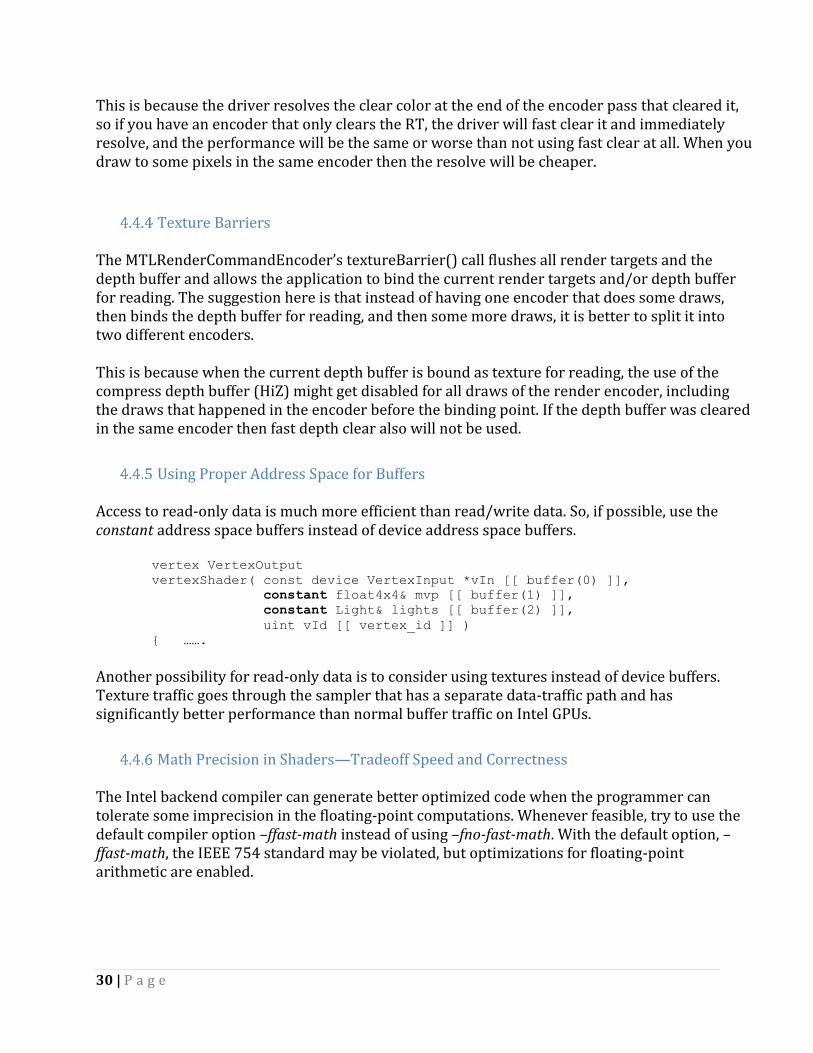
Using Proper Address Space for Buffers Access to read-only data is much more efficient than read/write data. So, if possible, use the constant address space buffers instead of device address space buffers. vertex VertexOutput
vertexShader( const device VertexInput *vIn [[ buffer(0) ]],
constant float4x4& mvp [[ buffer(1) ]],
constant Light& lights [[ buffer(2) ]],
uint vId [[ vertex_id ]] )
{ …….
Another possibility for read-only data is to consider using textures instead of device buffers. Texture traffic goes through the sampler that has a separate data-traffic path and has significantly better performance than normal buffer traffic on Intel GPUs.
Math Precision in Shaders—Tradeoff Speed and Correctness The Intel backend compiler can generate better optimized code when the programmer can tolerate some imprecision in the floating-point computations. Whenever feasible, try to use the default compiler option –ffast-math instead of using –fno-fast-math. With the default option, –ffast-math, the IEEE 754 standard may be violated, but optimizations for floating-point arithmetic are enabled.
31 | P a g e
Using Half-Floats Efficiently Using half-float data types, whenever possible, is advisable as it reduces the data footprint and can increase instruction throughput. However, avoid frequent mixing of float and half-float computations as it may result in unnecessary type-conversion overhead. It would be better to do all the computations in one float type and convert to the other float type only when necessary.
Low Occupancy If compute kernels are very short, thread launch can be an overhead. Try forcing a higher SIMD, or introduce a loop so there is more work per thread.
Avoid uchars Data reads are done at a 64-byte granularity. Using an uchar data type can result in partial reads and writes of cache lines, which can affect performance. Use a wider data type like int or int4.
Array Indices Use unsigned int for array indexes, since this helps the compiler to ensure the indices cannot have negative values, and thus can optimize send instructions.
Other Metal 2 Optimization Recommendations
Render drawables at the exact pixel size of your target display. Merge render command encoders when possible
Mark the resource option as untracked if there will be no overlap between multiple
uses of the same buffer. Synchronization is not required when different kernels read/write to different and non-overlapping areas of the buffer. Use fences for synchronization if a potential resource hazard exists.
Tessellation is a bit different in Metal. Tessellation factors are calculated in the compute engine, then returned to the 3D engine to get rendered. Calculate tessellation factors once for multiple draws to reduce the amount of context switching.
Keep execution units (EU) busy by avoiding lots of very short draw calls. Likewise,
avoid changing textures too often in short draws. This can cause thrashing in the render color cache. Don't change render targets too frequently within a short draw; this will incur a driver overhead penalty due to cache flushes and pipeline stalls.
The application should avoid redundant setFragmentBytes() calls. Data should be sent only when it has changed. Consider using setFragmentBuffer() instead.
32 | P a g e
4.5. OpenGL* Performance Tips
This section will lead you through some of the main performance points for OpenGL applications. The OpenGL 4.5 device driver contains many Intel® Processor Graphics Gen9 specific optimizations, but the programming model still reflects the traditional OpenGL state machine design as compared to the discrete programming model of other modern APIs.
OpenGL Shaders
When writing GLSL shaders, use and pass only what is needed, and declare only the resources that will be used. This includes samplers, uniforms, uniform buffer objects (UBOs), shader storage buffer objects (SSBOs), and images. Used attributes should only be passed between stages.
Use built-in shader functions rather than other equivalents. Use compile-time constants to help the compiler generate optimal code, including loop iterations, indexing buffers, inputs, and outputs.
Use medium precision for OpenGL ES contexts, for improved performance. Each thread in the Intel® Processor Graphics Gen9 architecture has 128 registers
and each register is 8 x 32 bits. For shaders other than fragment shaders, keep in mind that each register represents a single channel of vec4 variable for 8 data streams.
Fragment shaders can be launched by the driver in SIMD8, SIMD16 or SIMD32 modes. Depending on the mode, a single channel of vec4 variable can occupy a single register, or two or four registers for 8, 16, or 32 pixels.
Registers are used for the delivery of initial hardware-dependent payload as well as uniforms, which can consume up to 64 registers. A bigger number of variables and uniforms in shaders will increase register pressure, which can lead to saving/restoring registers from memory. This, in turn, can have a negative impact on the performance of your shaders.
Limit the number of uniforms in the default block to minimize register pressure; however, the default uniform block is still the best method of constant data delivery for smaller and more frequently changed constants.
Don’t use compute shader group sizes larger than 256 (and recall that larger groups will require a wider SIMD). They result in higher register pressure and may lead to EU underutilization.
33 | P a g e
Textures
Optimizing texture accesses is an important aspect of OpenGL applications.
Always use mipmaps to minimize the memory bandwidth used for texturing. Textures with power-of-two dimensions will have better performance in general. When uploading textures, provide textures in a format that is the same as the
internal format, to avoid implicit conversions in the graphics driver.
Images When using OpenGL images, textures usually provide better read performance than images. Some of the image formats required by OpenGL specifications are not natively supported by hardware devices, and will therefore need to be unpacked in the shaders.
Shader Storage Buffer Objects
Shader Storage Buffer Objects present a universal mechanism for providing input/output both to and from shaders. Since they are flexible, they can also be used to fetch vertex data based on gl_VertexId. Use vertex arrays where possible, as they usually offer better performance.
Atomic Counter Buffers Atomic counter buffers and atomic counters are internally implemented as shader storage buffer objects atomic operations. Therefore, there are no real performance benefits to be utilized from using atomic counter buffers.
Frame Buffer Object
For frame buffer objects (FBOs), consider a few important things:
When switching color/depth/stencil attachments, try to use dedicated frame buffer objects for each set in use. Switching the entire frame buffer object is more efficient than switching individual attachments one at a time.
Don’t clear buffers that are never used. Skip color buffer clears if all pixels are to be rendered. In many cases, clearing the
depth buffer should be sufficient. Limit functions that switch color/depth/stencil attachments between rendering and
sampling. They are expensive operations.
34 | P a g e
State Changes
Minimize state changes. Group similar draw calls together. For texturing, use texture arrays. They provide a much more efficient way of
switching textures compared to reconfiguration of texture units. By using instancing and differentiating, rendering based on gl_InstanceID can also
provide a high-performance alternative to rendering similar objects, when compared to reconfiguring the pipeline for each object individually.
Use the default uniform block rather than uniform buffer objects for small constant data that changes frequently.
Limit functions that switch frame buffer objects and GLSL programs. They are the most expensive driver operations.
Avoid redundant state changes. In particular, do not bind a state to default values between draw calls, as not all of
these state changes can be optimized in the driver: glBindTexture(GL_TEXTURE_2D, tex1); glDrawArrays(GL_TRIANGLE_STRIP, 0, 2); glBindTexture(GL_TEXTURE_2D, 0);
glBindTexture(GL_TEXTURE_2D, tex2); glDrawArrays(GL_TRIANGLE_STRIP, 0, 2); glBindTexture(GL_TEXTURE_2D, 0);
Avoid CPU/GPU Synchronization
Synchronization between the CPU and GPU can cause stalls.
Avoid calls that synchronize between the CPU and GPU, for example, glReadPixels or glFinish.
Use glFlush with caution. Use sync objects to achieve synchronization between contexts.
Avoid updating resources that are used by the GPU. Static resources should be created at the startup of the application and not modified later. Whenever possible, create vertex buffer objects as static (GL_STATIC_DRAW).
Avoid updating resources that are used by the GPU. Don’t call glBufferSubData/glTexImage if there are queued commands that access a given VBO/texture. Limit the chances of simultaneous read/write access to resources.
For creation of buffers and textures, use immutable versions of API calls: glBufferStorage() and glTexStorage*().
One way you can update buffers and avoid GPU/CPU synchronization issues is to create a pool of bigger buffers with glBufferStorage() and permanently map them with the glMapBuffer() function call. The application can then iterate over individual buffers with increasing offsets, providing new chunks of data.

35 | P a g e
For uniform buffer objects, use glBindBufferRange()to bind new chunks of data at the current offset. For vertex buffer objects, access newly copied chunks of data with firstIndex (for glDrawArrays) or indices/baseVertex parameters (for glDrawElements/BaseVertex). Increase the initial number of pools if the oldest buffer submitted for GPU consumption is still in use. Monitor the progress of the GPU by accessing the data from the buffers with sync objects.
Anti-Aliasing Options OpenGL drivers for 6th, 7th, and 8th generation Intel Core processors support standard MSAA functionality. You might get better anti-aliasing performance from Conservative Morphological Anti-Aliasing (CMAA), an Intel-provided alternative to MSAA.
With CMAA, image quality will prove equal or better when compared to a fast approximate anti-aliasing (FXAA)/ morphological anti-aliasing (MLAA) solution. When performance counts, consider CMAA a more efficient replacement of MSAAx4.
With OpenGL the Intel_framebuffer_CMAA extension is a simple to use option.

36 | P a g e
5. Designing for Low Power
Mobile and ultra-mobile computing are ubiquitous. As a result, battery life, device temperature, and power-limited performance have become significant issues. As manufacturing processes continue to shrink and improve, we see improved performance per-watt characteristics of CPUs and processor graphics. However, there are many ways that software can reduce power use on mobile devices, as well as improve power efficiency. In the following sections, you'll find insights and recommendations illustrating how to best recognize these performance gains.
5.1. Idle and Active Power Processors execute in different power states, known as P-states and C-states. C-states are essentially idle states that minimize power draw by progressively shutting down more and more of the processor. P-states are performance states where the processor will consume progressively more power and run faster at a higher frequency.
These power states define how much time the processor is sleeping and how it distributes available power when active. Power states can change very quickly, so sleep states are relevant to most applications that do not consume all the power available, including real-time applications.
When you optimize applications, try to save power in two different ways:
Increase the amount of idle time your application uses where it makes sense. Improve overall power usage and balance under active use.
You can determine the power state behavior of your application by measuring how much time it spends in each state. Since each state consumes a different amount of power, you’ll get a picture over time of your app’s overall power use.
37 | P a g e
5.2. Analysis Tips To start, begin by measuring your app’s baseline power usage in multiple cases and at different loads:
At near idle, as in the UI during videos. Under an average load during a typical scene with average effects.
The worst-case load may not occur where you think. We have seen very high frame rates (1000 FPS) during cut scene playback in certain apps, a situation that can cause the GPU and CPU to use unnecessary power. As you study your application, try a few of these tips:
Measure how long (on average) your application can run on battery power, and compare its performance with other, similar apps. Measuring power consumption regularly will inform you if any recent changes caused your app to utilize more power.
Intel’s Battery Life Analyzer (BLA) is a good (Windows-only) tool for this work. For more information, please see this article showcasing BLA and how it can collect high-level data and analyze an app's power use. If the data BLA provides shows that you have issues residing in the wrong C-states for too long, it's time to look deeper.
If your app is reported as deficient or there are unexpected wakeups, start optimizing for power. To do so, you'll want to look at the Windows Performance Analyzer (WPA) tool, which showcases workflow using WPA for CPU analysis.
Intel® VTune Amplifier XE is also useful to get power call stacks, since it can identify the cause of the wakeup.
Use the data gained through these methods to reduce or consolidate wakeups, thus remaining in a lower power state longer.
Investigating Idle Power As you study power at near idle, watch for very high frame rates. If your app has high frame rates at near idle power (during cut scenes, menus, or other low-GPU-intensive parts), remember that these parts of your app will look fine if you lock the present interval to a 60Hz display refresh rate (or clamp your frame rate lower, to 30 FPS). Watch for these behaviors in menus, loading screens, and other low-GPU–intensive parts of games, and scale accordingly to minimize power consumption. This can also improve CPU-intensive loading times, by allowing turbo boost to kick in, when necessary.
38 | P a g e
Active Power and Speed Shift
While in active states, the processor and the operating system jointly decide frequencies for various parts of the system (CPUs, GPU, and memory ring, in particular). The current generation of Intel Core processors add more interaction between the operating system and the processor(s) to respond more efficiently and quickly to changes in power demand—a process referred to as Intel® Speed Shift Technology.
The system will balance the frequencies based on activity and will increase frequency (and thus consumed power) where it is needed most. As a result, a mostly active workload may have its GPU and CPU balance frequencies based on power consumption.
Reducing the amount of work done on the CPU can free up power for the GPU and vice versa. This can result in better overall performance, even when the other side was the primary performance bottleneck.
Tools like Intel® Power Gadget can also help you see the frequencies of each clock domain in real time. By running this tool you can monitor the frequencies of different sub-systems on target devices.
You can tell that your app’s power distribution is getting balanced when the primary performance bottleneck is not running at full frequency but power consumption is reaching the maximum limits available.
When and How to Reduce Activity There are times when the user explicitly requests trading performance for battery life, and there are things you can do to more effectively meet these demands. There are also patterns in application usage that always consume extra power for little return, patterns which you can more effectively address to handle overall power usage. In the next sections you’ll see some issues to watch for when trying to reduce overall power consumption.
39 | P a g e
Scale Settings to Match System Power Settings and Power Profile
It was once necessary to poll for power settings and profile (for example, GetSystemPowerStatus()), but since the launch of Windows Vista*, Windows supports asynchronous power notification APIs.
Use RegisterPowerSettingNotification() with the appropriate globally unique identifier (GUID) to track changes.
Scale your app's settings and behavior based on the power profile and whether your
device is plugged in to power. Scale the resolution, reduce the max frame rate to a cap, and/or reduce quality settings.
If you cap the frame rate, you can use the V-Sync mechanism in DirectX or OpenGL. You can also manage the frame rate and resolution yourself as well. The dynamic resolution rendering (DRR) sample shows how to adjust frame resolution to maintain a frame rate.
Run as Slow as You Can, While Remaining Responsive
If you run as slow as you can (but still remain responsive) then you can save power and extend battery life.
Detect when you are in a power-managed mode and limit frame rate. This will prolong battery life and also allow your system to run cooler. Running at 30 Hz instead of 60 Hz can save significant power.
Provide a way to disable the frame rate limit, for benchmarking. Warn players that they will use their battery quickly. You should also want to let the player control the frame rate cap.
Use off-screen buffers and do smart compositing for in-game user interfaces (which are often limited to small panels for displays like health, power-ups, and so on). Since user interfaces usually change much more slowly than in-game scenes, there’s no need to change them at the same rate as the game frame. Here again, DRR may be useful in helping you decouple UI rendering from main scene rendering.
40 | P a g e
Manage Timers and Respect System Idle, Avoid Tight Polling Loops There are several other related points to watch:
Reduce your app's reliance on high-resolution periodic timers.
Avoid Sleep() calls in tight loops. Use Wait*() APIs instead. Sleep() or any other busy-wait API can cause the operating system to keep the machine from being in the Idle state. Intel's Mobile Platform Idle Optimization presentation offers an extensive rundown of which APIs to use and avoid.
Avoid tight polling loops. If you have a polling architecture that uses a tight loop, convert it to an event-driven architecture. If you must poll, use the largest polling interval possible.
Avoid busy-wait calls. In the code below, the Direct3D query will be called repeatedly, causing unnecessary power use. There's no way for the operating system or the power management hardware to detect that the code does nothing useful. You can avoid this with some basic planning and design tweaks.
Multithread Sensibly
Balanced threading offers performance benefits, but you need to consider how it operates alongside the GPU, as imbalanced threading can also result in lower performance and reduced power efficiency. Avoid affinitizing threads so that the operating system can schedule threads directly. If you must, provide hints using SetIdealProcessor().
41 | P a g e
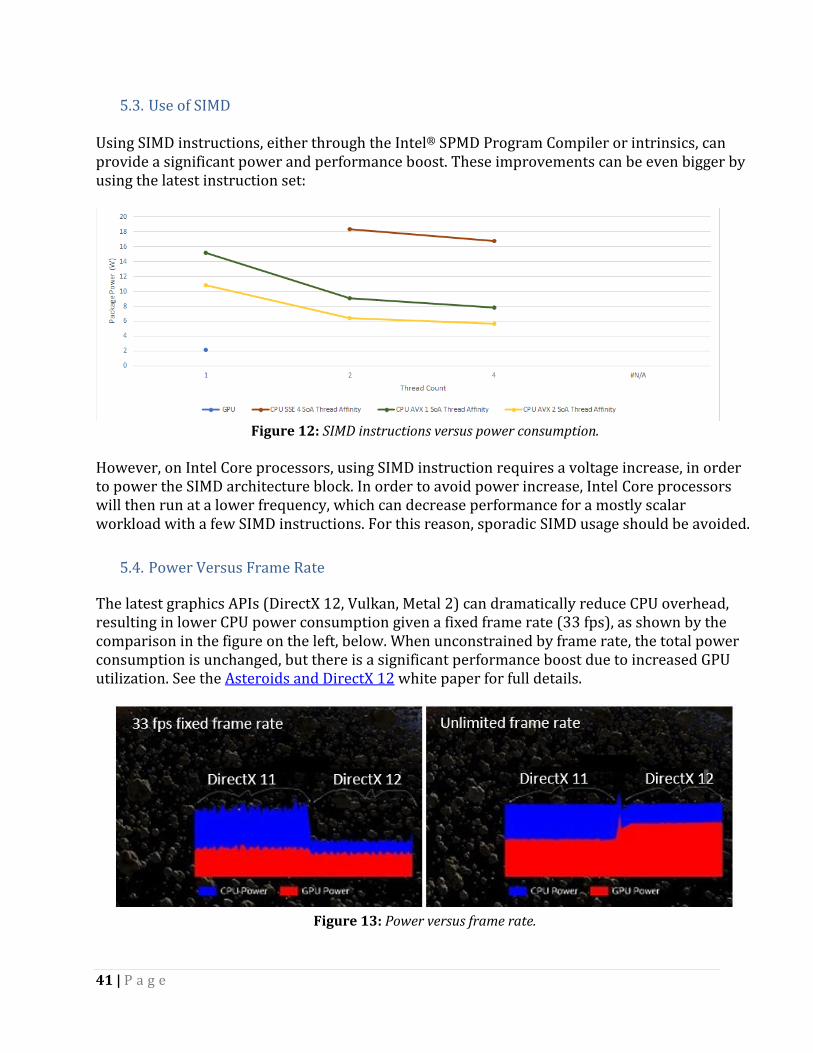
5.3. Use of SIMD Using SIMD instructions, either through the Intel® SPMD Program Compiler or intrinsics, can provide a significant power and performance boost. These improvements can be even bigger by using the latest instruction set:
Figure 12: SIMD instructions versus power consumption.
However, on Intel Core processors, using SIMD instruction requires a voltage increase, in order to power the SIMD architecture block. In order to avoid power increase, Intel Core processors will then run at a lower frequency, which can decrease performance for a mostly scalar workload with a few SIMD instructions. For this reason, sporadic SIMD usage should be avoided.
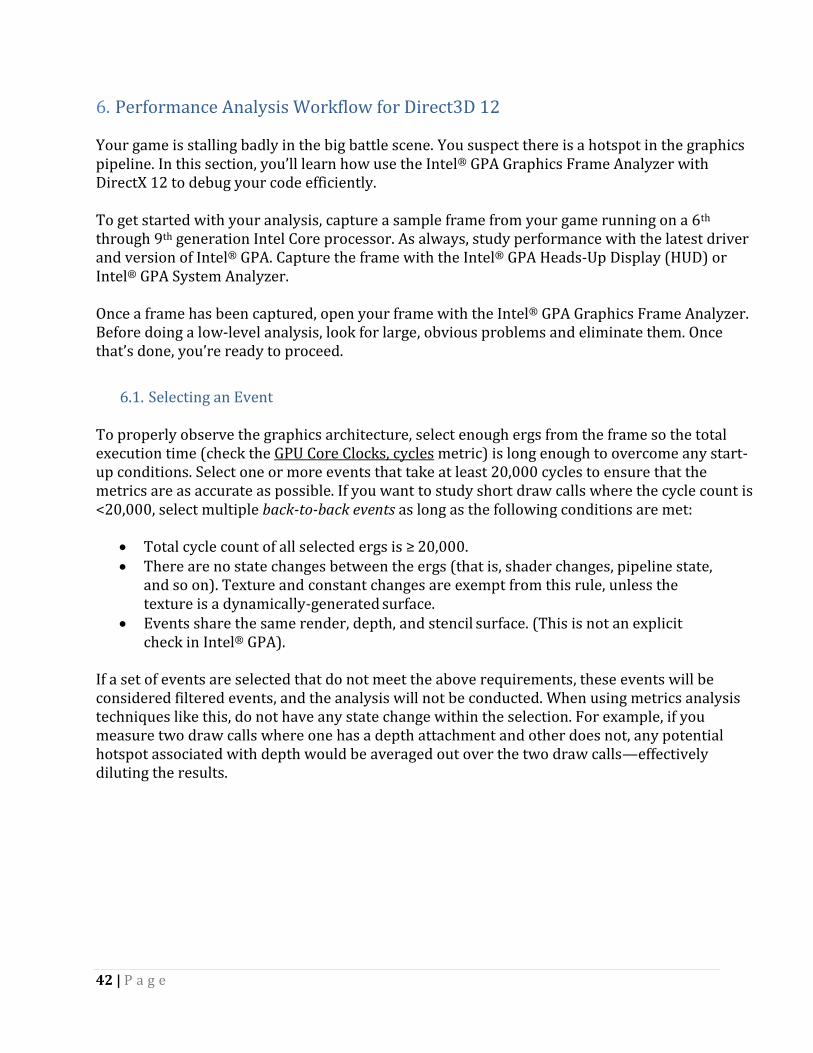
5.4. Power Versus Frame Rate The latest graphics APIs (DirectX 12, Vulkan, Metal 2) can dramatically reduce CPU overhead, resulting in lower CPU power consumption given a fixed frame rate (33 fps), as shown by the comparison in the figure on the left, below. When unconstrained by frame rate, the total power consumption is unchanged, but there is a significant performance boost due to increased GPU utilization. See the Asteroids and DirectX 12 white paper for full details.
Figure 13: Power versus frame rate.
42 | P a g e
6. Performance Analysis Workflow for Direct3D 12
Your game is stalling badly in the big battle scene. You suspect there is a hotspot in the graphics pipeline. In this section, you’ll learn how use the Intel® GPA Graphics Frame Analyzer with DirectX 12 to debug your code efficiently. To get started with your analysis, capture a sample frame from your game running on a 6th through 9th generation Intel Core processor. As always, study performance with the latest driver and version of Intel® GPA. Capture the frame with the Intel® GPA Heads-Up Display (HUD) or Intel® GPA System Analyzer. Once a frame has been captured, open your frame with the Intel® GPA Graphics Frame Analyzer. Before doing a low-level analysis, look for large, obvious problems and eliminate them. Once that’s done, you’re ready to proceed.
6.1. Selecting an Event To properly observe the graphics architecture, select enough ergs from the frame so the total execution time (check the GPU Core Clocks, cycles metric) is long enough to overcome any start-up conditions. Select one or more events that take at least 20,000 cycles to ensure that the metrics are as accurate as possible. If you want to study short draw calls where the cycle count is <20,000, select multiple back-to-back events as long as the following conditions are met:
Total cycle count of all selected ergs is ≥ 20,000. There are no state changes between the ergs (that is, shader changes, pipeline state,
and so on). Texture and constant changes are exempt from this rule, unless the texture is a dynamically-generated surface.
Events share the same render, depth, and stencil surface. (This is not an explicit check in Intel® GPA).
If a set of events are selected that do not meet the above requirements, these events will be considered filtered events, and the analysis will not be conducted. When using metrics analysis techniques like this, do not have any state change within the selection. For example, if you measure two draw calls where one has a depth attachment and other does not, any potential hotspot associated with depth would be averaged out over the two draw calls—effectively diluting the results.
43 | P a g e
6.2. Performance Analysis with Hardware Metrics
Once you have selected the events of interest, you can accurately triage the hotspots associated with major graphics architectural blocks. Once the selection is made, Intel® GPA Graphics Frame Analyzer will playback the frame on your GPU and collect performance data. This section will guide you through studying your performance and give you implementation tips to avoid future performance problems. Intel Processor Graphics perform deeply pipelined parallel execution of front-end (geometry transformation, rasterization, early depth/stencil, and so on) and back-end (pixel shading, sampling, color write, blend, and late depth/stencil) work within a single event. Because of the deeply pipelined execution, hotspots from downstream architectural blocks will bubble up and stall upstream blocks. This can make it difficult to find the actual hotspot. To use metrics to find the primary hotspot, you must walk the pipeline in reverse order.
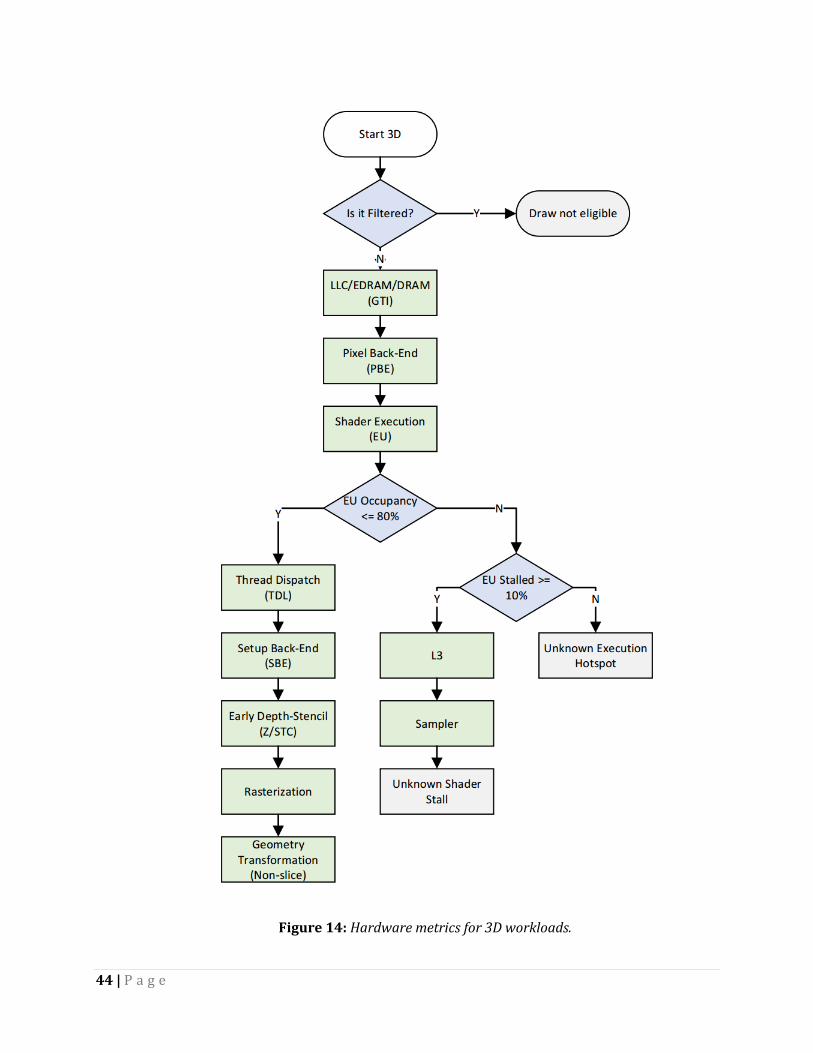
The metrics for your selected events appear in the right-hand metrics section or in the Metrics Analysis tab (and metric names are underlined here, for clarity). With those metrics, follow these workflows to find your primary hotspot. For each step, see the following sections to discover if that metric shows a hotspot. If so, optimize that hotspot with the tips in that section; if not, continue through the workflow. There are separate workflows for 3D and general-purpose computing on graphics processing units (GPGPU) workloads because they are a bit different.
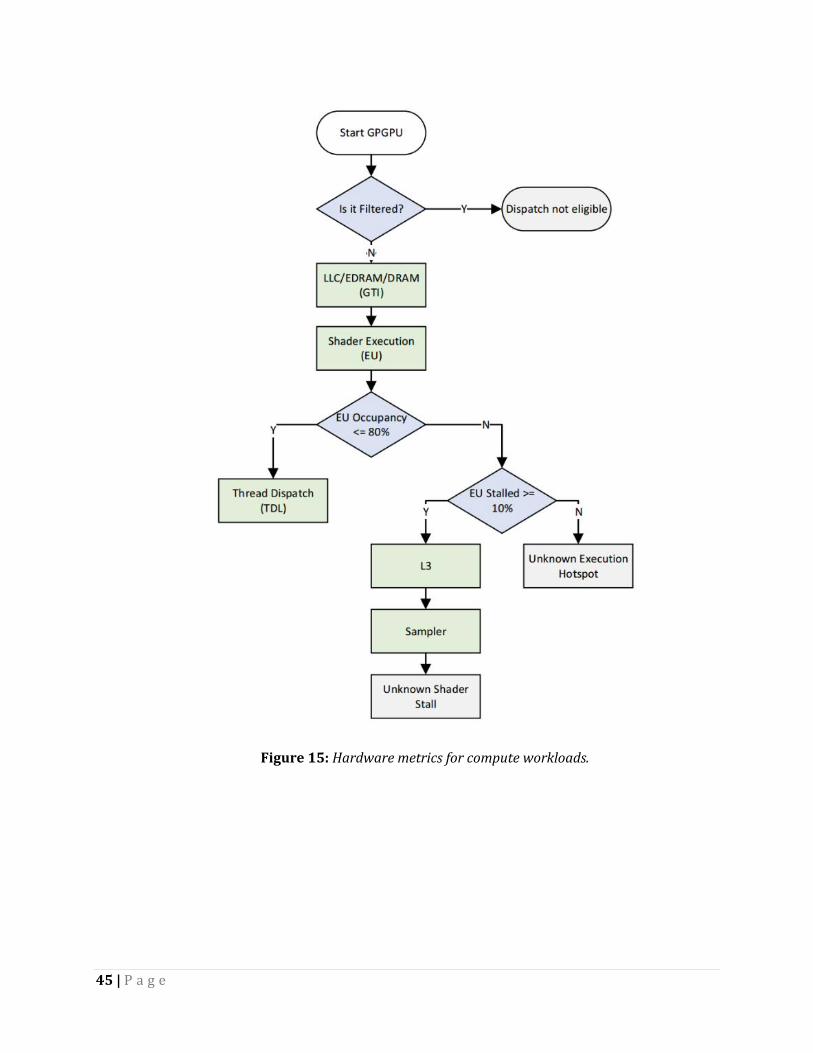
Green nodes within the flowchart represent a potential bottleneck within the GPU. At each node you should ask the question, “Is this the primary bottleneck?” If yes, you have found the bottleneck for your particular selection. If no, continue to the next node in the flowchart. Blue nodes will branch the decision path and grey nodes represent unknown terminal hotspots. Read the following sections for more information about the unknown hotspots.
44 | P a g e
Figure 14: Hardware metrics for 3D workloads.
45 | P a g e
Figure 15: Hardware metrics for compute workloads.
46 | P a g e
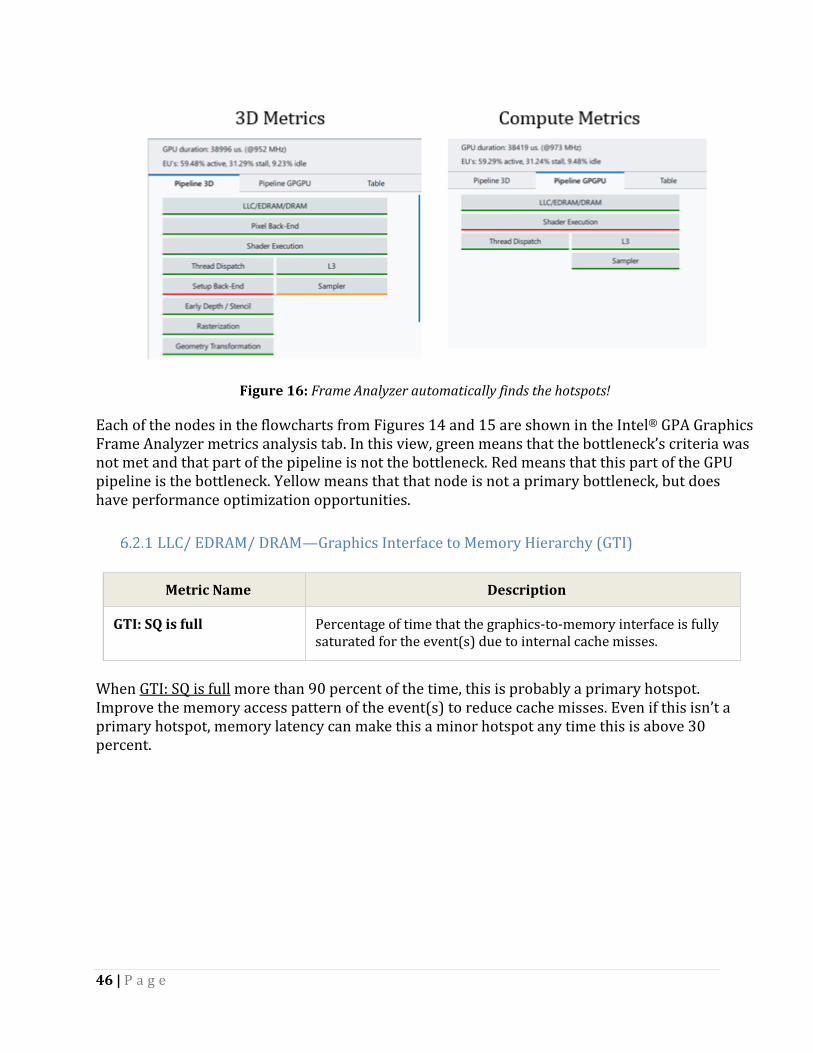
Figure 16: Frame Analyzer automatically finds the hotspots!
Each of the nodes in the flowcharts from Figures 14 and 15 are shown in the Intel® GPA Graphics Frame Analyzer metrics analysis tab. In this view, green means that the bottleneck’s criteria was not met and that part of the pipeline is not the bottleneck. Red means that this part of the GPU pipeline is the bottleneck. Yellow means that that node is not a primary bottleneck, but does have performance optimization opportunities.
LLC/ EDRAM/ DRAM—Graphics Interface to Memory Hierarchy (GTI)
Metric Name Description
GTI: SQ is full Percentage of time that the graphics-to-memory interface is fully saturated for the event(s) due to internal cache misses.
When GTI: SQ is full more than 90 percent of the time, this is probably a primary hotspot. Improve the memory access pattern of the event(s) to reduce cache misses. Even if this isn’t a primary hotspot, memory latency can make this a minor hotspot any time this is above 30 percent.
47 | P a g e
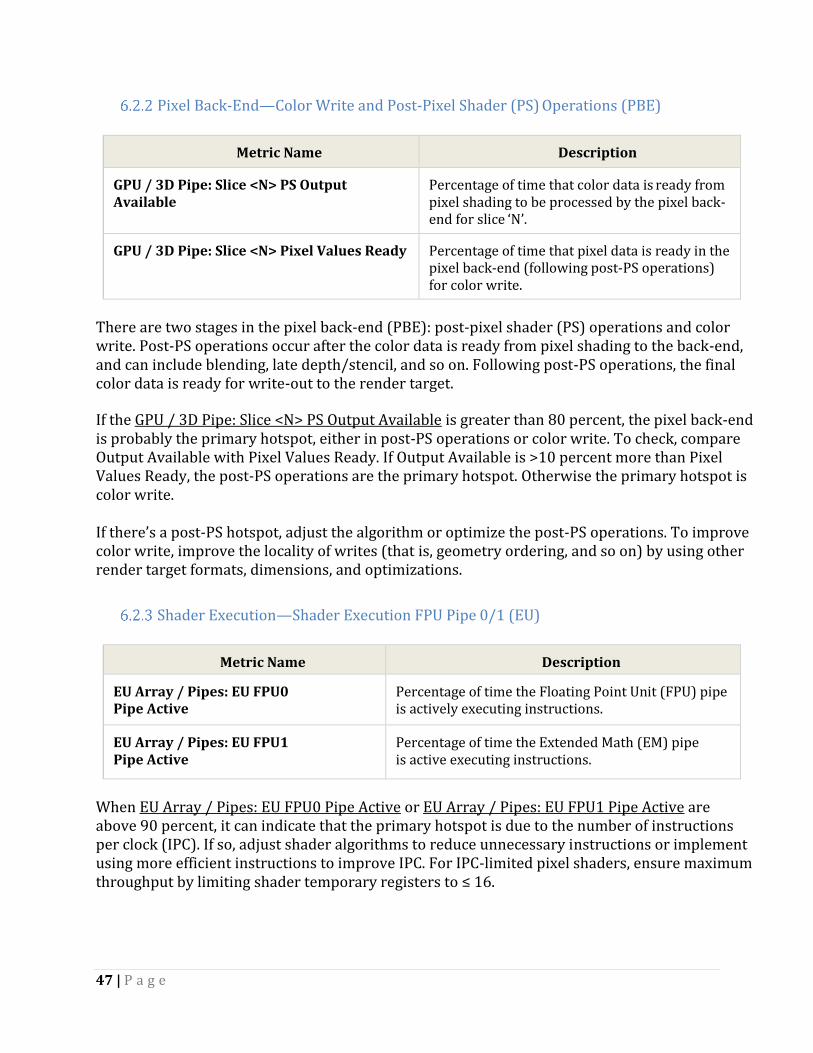
Pixel Back-End—Color Write and Post-Pixel Shader (PS) Operations (PBE)
Metric Name Description
GPU / 3D Pipe: Slice <N> PS Output Available
Percentage of time that color data is ready from pixel shading to be processed by the pixel back-end for slice ‘N’.
GPU / 3D Pipe: Slice <N> Pixel Values Ready Percentage of time that pixel data is ready in the pixel back-end (following post-PS operations) for color write.
There are two stages in the pixel back-end (PBE): post-pixel shader (PS) operations and color write. Post-PS operations occur after the color data is ready from pixel shading to the back-end, and can include blending, late depth/stencil, and so on. Following post-PS operations, the final color data is ready for write-out to the render target.
If the GPU / 3D Pipe: Slice <N> PS Output Available is greater than 80 percent, the pixel back-end is probably the primary hotspot, either in post-PS operations or color write. To check, compare Output Available with Pixel Values Ready. If Output Available is >10 percent more than Pixel Values Ready, the post-PS operations are the primary hotspot. Otherwise the primary hotspot is color write. If there’s a post-PS hotspot, adjust the algorithm or optimize the post-PS operations. To improve color write, improve the locality of writes (that is, geometry ordering, and so on) by using other render target formats, dimensions, and optimizations.
Shader Execution—Shader Execution FPU Pipe 0/1 (EU)
Metric Name Description
EU Array / Pipes: EU FPU0 Pipe Active
Percentage of time the Floating Point Unit (FPU) pipe is actively executing instructions.
EU Array / Pipes: EU FPU1 Pipe Active
Percentage of time the Extended Math (EM) pipe is active executing instructions.
When EU Array / Pipes: EU FPU0 Pipe Active or EU Array / Pipes: EU FPU1 Pipe Active are above 90 percent, it can indicate that the primary hotspot is due to the number of instructions per clock (IPC). If so, adjust shader algorithms to reduce unnecessary instructions or implement using more efficient instructions to improve IPC. For IPC-limited pixel shaders, ensure maximum throughput by limiting shader temporary registers to ≤ 16.
48 | P a g e
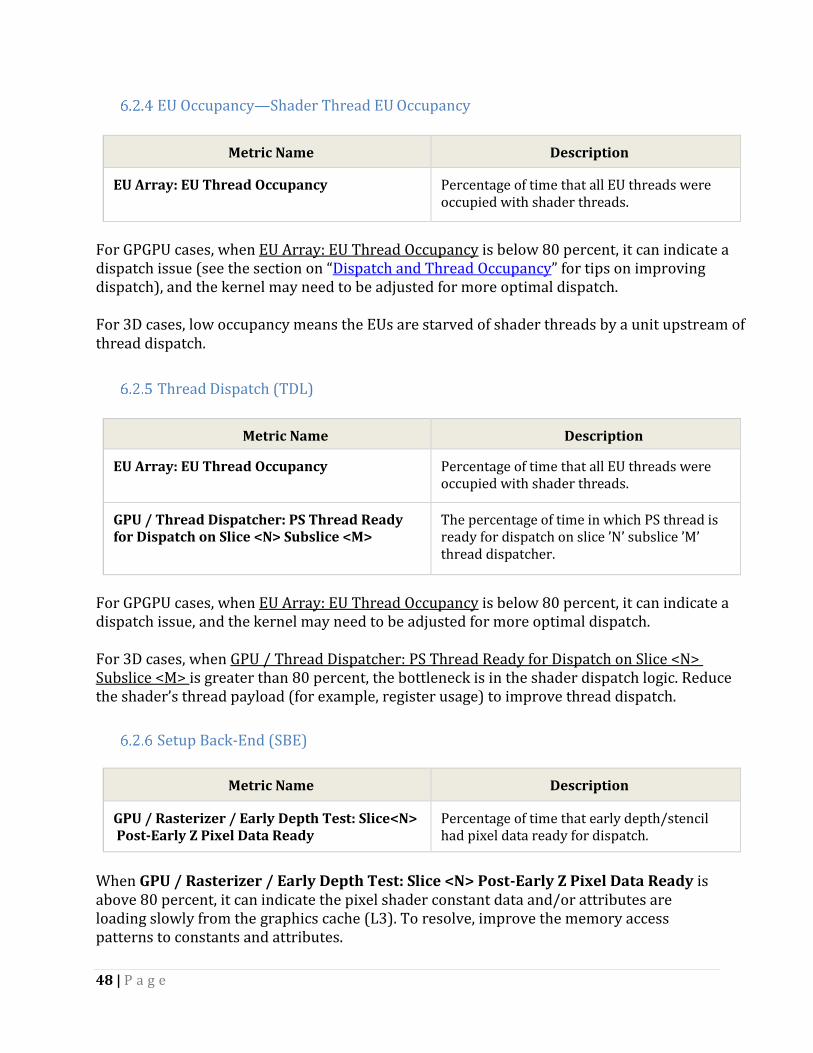
EU Occupancy—Shader Thread EU Occupancy
Metric Name Description
EU Array: EU Thread Occupancy Percentage of time that all EU threads were occupied with shader threads.
For GPGPU cases, when EU Array: EU Thread Occupancy is below 80 percent, it can indicate a dispatch issue (see the section on “Dispatch and Thread Occupancy” for tips on improving dispatch), and the kernel may need to be adjusted for more optimal dispatch. For 3D cases, low occupancy means the EUs are starved of shader threads by a unit upstream of thread dispatch.
Thread Dispatch (TDL)
Metric Name Description
EU Array: EU Thread Occupancy Percentage of time that all EU threads were occupied with shader threads.
GPU / Thread Dispatcher: PS Thread Ready for Dispatch on Slice <N> Subslice <M>
The percentage of time in which PS thread is ready for dispatch on slice ’N’ subslice ’M’ thread dispatcher.
For GPGPU cases, when EU Array: EU Thread Occupancy is below 80 percent, it can indicate a dispatch issue, and the kernel may need to be adjusted for more optimal dispatch. For 3D cases, when GPU / Thread Dispatcher: PS Thread Ready for Dispatch on Slice <N> Subslice <M> is greater than 80 percent, the bottleneck is in the shader dispatch logic. Reduce the shader’s thread payload (for example, register usage) to improve thread dispatch.
Setup Back-End (SBE)
Metric Name Description
GPU / Rasterizer / Early Depth Test: Slice<N> Post-Early Z Pixel Data Ready
Percentage of time that early depth/stencil had pixel data ready for dispatch.
When GPU / Rasterizer / Early Depth Test: Slice <N> Post-Early Z Pixel Data Ready is above 80 percent, it can indicate the pixel shader constant data and/or attributes are loading slowly from the graphics cache (L3). To resolve, improve the memory access patterns to constants and attributes.
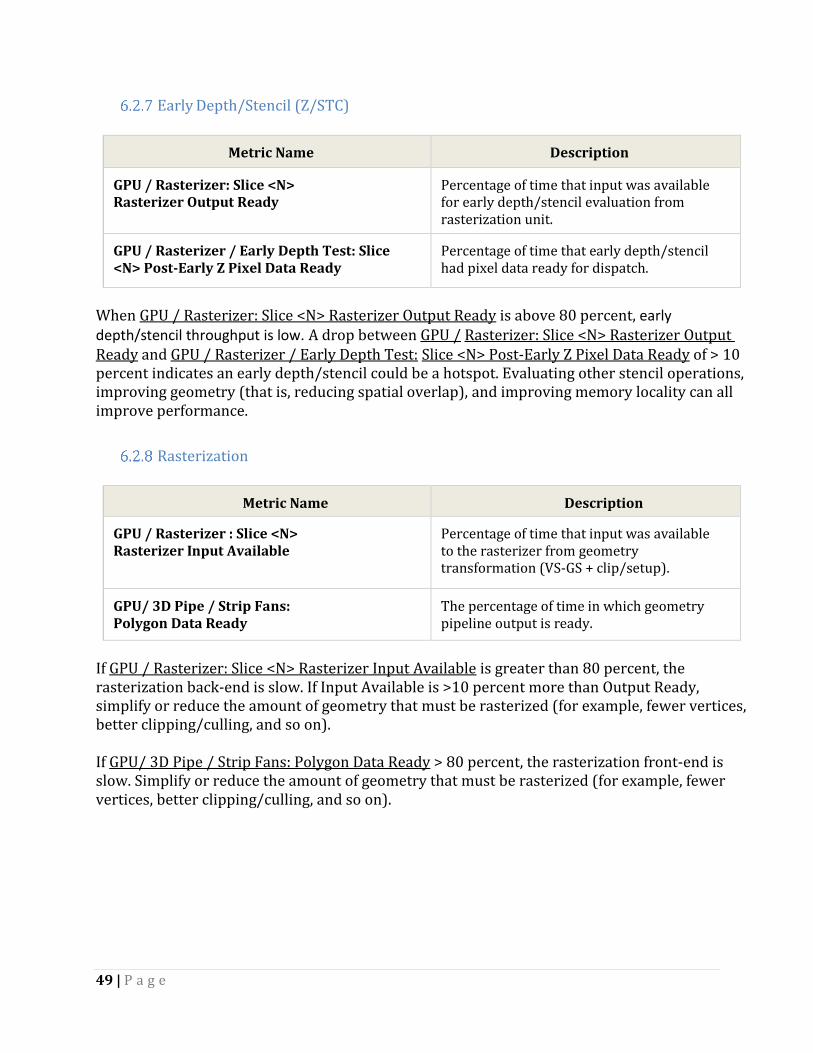
49 | P a g e
Early Depth/Stencil (Z/STC)
Metric Name Description
GPU / Rasterizer: Slice <N> Rasterizer Output Ready
Percentage of time that input was available for early depth/stencil evaluation from rasterization unit.
GPU / Rasterizer / Early Depth Test: Slice <N> Post-Early Z Pixel Data Ready
Percentage of time that early depth/stencil had pixel data ready for dispatch.
When GPU / Rasterizer: Slice <N> Rasterizer Output Ready is above 80 percent, early depth/stencil throughput is low. A drop between GPU / Rasterizer: Slice <N> Rasterizer Output Ready and GPU / Rasterizer / Early Depth Test: Slice <N> Post-Early Z Pixel Data Ready of > 10 percent indicates an early depth/stencil could be a hotspot. Evaluating other stencil operations, improving geometry (that is, reducing spatial overlap), and improving memory locality can all improve performance.
Rasterization
Metric Name Description
GPU / Rasterizer : Slice <N> Rasterizer Input Available
Percentage of time that input was available to the rasterizer from geometry transformation (VS-GS + clip/setup).
GPU/ 3D Pipe / Strip Fans: Polygon Data Ready
The percentage of time in which geometry pipeline output is ready.
If GPU / Rasterizer: Slice <N> Rasterizer Input Available is greater than 80 percent, the rasterization back-end is slow. If Input Available is >10 percent more than Output Ready, simplify or reduce the amount of geometry that must be rasterized (for example, fewer vertices, better clipping/culling, and so on). If GPU/ 3D Pipe / Strip Fans: Polygon Data Ready > 80 percent, the rasterization front-end is slow. Simplify or reduce the amount of geometry that must be rasterized (for example, fewer vertices, better clipping/culling, and so on).
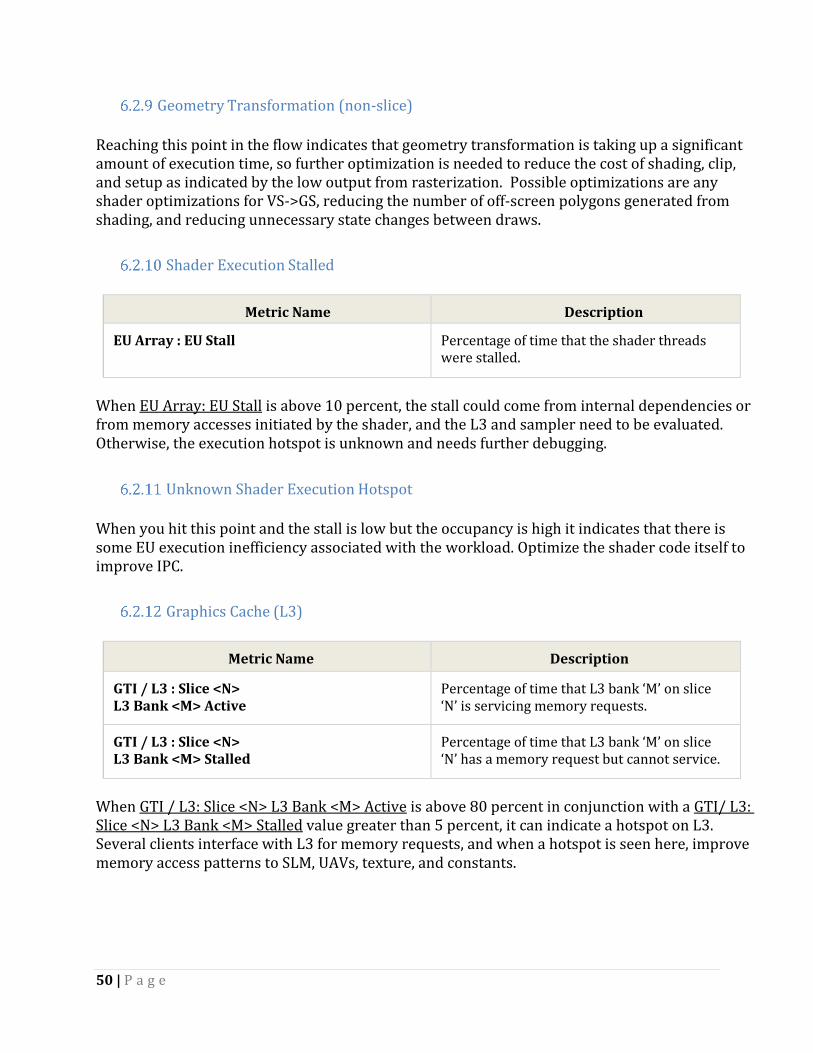
50 | P a g e
Geometry Transformation (non-slice)
Reaching this point in the flow indicates that geometry transformation is taking up a significant amount of execution time, so further optimization is needed to reduce the cost of shading, clip, and setup as indicated by the low output from rasterization. Possible optimizations are any shader optimizations for VS->GS, reducing the number of off-screen polygons generated from shading, and reducing unnecessary state changes between draws.
Shader Execution Stalled
Metric Name Description
EU Array : EU Stall Percentage of time that the shader threads were stalled.
When EU Array: EU Stall is above 10 percent, the stall could come from internal dependencies or from memory accesses initiated by the shader, and the L3 and sampler need to be evaluated. Otherwise, the execution hotspot is unknown and needs further debugging.
Unknown Shader Execution Hotspot
When you hit this point and the stall is low but the occupancy is high it indicates that there is some EU execution inefficiency associated with the workload. Optimize the shader code itself to improve IPC.
Graphics Cache (L3)
Metric Name Description
GTI / L3 : Slice <N> L3 Bank <M> Active
Percentage of time that L3 bank ‘M’ on slice ‘N’ is servicing memory requests.
GTI / L3 : Slice <N> L3 Bank <M> Stalled
Percentage of time that L3 bank ‘M’ on slice ‘N’ has a memory request but cannot service.
When GTI / L3: Slice <N> L3 Bank <M> Active is above 80 percent in conjunction with a GTI/ L3: Slice <N> L3 Bank <M> Stalled value greater than 5 percent, it can indicate a hotspot on L3. Several clients interface with L3 for memory requests, and when a hotspot is seen here, improve memory access patterns to SLM, UAVs, texture, and constants.
51 | P a g e
Sampler
Metric Name Description
GPU / Sampler : Slice <N> Subslice<M> Sampler Input Available
Percentage of time there is input from the EUs on slice ‘N’ and subslice ‘M’ to the sampler.
GPU / Sampler : Slice <N> Subslice<M> Sampler Output Ready
Percentage of time there is output from the sampler to EUs on slice ‘N’ and subslice ‘M’.
When Input Available is >10 percent greater than Output Ready, the sampler is not returning data back to the EUs as fast as it is being requested. The sampler is probably the hotspot. This comparison only indicates a significant hotspot when the samplers are relatively busy.
The sampler has multiple paths that can hotspot internally. Adjust the sampling access pattern, filtering mode, surface type/format, and the number of surfaces sampled to speed up the sampler.
Unknown Shader Stall
Indicates that while a stall was seen during shader execution, the root cause is not clear. Further debugging will be required to determine it. Reduce internal dependencies within the shader code and improve memory access pattern for all memory operations accessed during execution.
52 | P a g e
7. Appendix: Developer Resources
7.1. The Intel® Software Developer Zone and Game Dev Websites
Intel regularly releases to the developer community code samples covering a variety of topics. For the most up-to-date samples and links, please see the following resources:
Intel® Software Developer Zone GitHub* Intel Repository
Below are samples that may also be of interest to developers targeting current Intel® systems. Click on any subheading to access the desired information.
GPU Detect
This DirectX sample demonstrates how to get the vendor and ID from the GPU. For Intel Processor Graphics, the sample also demonstrates a default graphics quality preset (low, medium, or high), support for DirectX 9 and DirectX 11 extensions, and the recommended method for querying the amount of video memory. If supported by the hardware and driver, it also shows the recommended method for querying the minimum and maximum frequencies.
The sample uses a configuration file that lists many of Intel Processor Graphics by vendor ID and device ID, along with a suggested graphics quality level for each device. To maximize performance, you should test some representative devices with your application and decide which quality level is right for each. Be careful with relying only on device ID, as a platform’s performance also depends heavily on the available power, which can be set by the device manufacturer to something lower than the optimal thermal design point.
Fast ISPC Texture Compression
This sample performs high-quality BC7, BC6H, ETC1, and ASTC compression on the CPU using the Intel® SPMD Program Compiler (Intel® SPC) to exploit SIMD instruction sets.
Asteroids and DirectX* 12
An example of how to use the DirectX 12 graphics API to achieve performance and power benefits over previous APIs.
53 | P a g e
Multi-Adapter Support with DirectX 12
This sample shows how to implement an explicit multi-adapter application using DirectX 12. Intel’s integrated GPU and a discrete NVIDIA GPU are used to share the workload of ray- tracing a scene. The parallel use of both GPUs allows for an increase in performance and for more complex workloads.
Early-Z Rejection
This sample demonstrates two ways to take advantage of early Z rejection: Front to back rendering and z prepass. With a z prepass the first pass populates the Z buffer with depth values from all opaque geometry. A null pixel shader is used, and the color buffer is not updated. For the second pass, the geometry is resubmitted with Z writes disabled but Z testing on, and full vertex and pixel shading is performed.
Additional Code Samples Other code samples that you may find useful include the following:
Dynamic Resolution Rendering Conservative Morphological Anti-Aliasing Article and Sample Software Occlusion Culling Sparse Procedural Volumetric Rendering Sample Distribution Shadow Maps Programmable Blend with Pixel Shader Ordering Adaptive Volumetric Shadow Maps Adaptive Transparency Paper CPU Texture Compositing with Instant Access OpenGL Fragment Shader Ordering Extension OpenGL Map Texture Extension
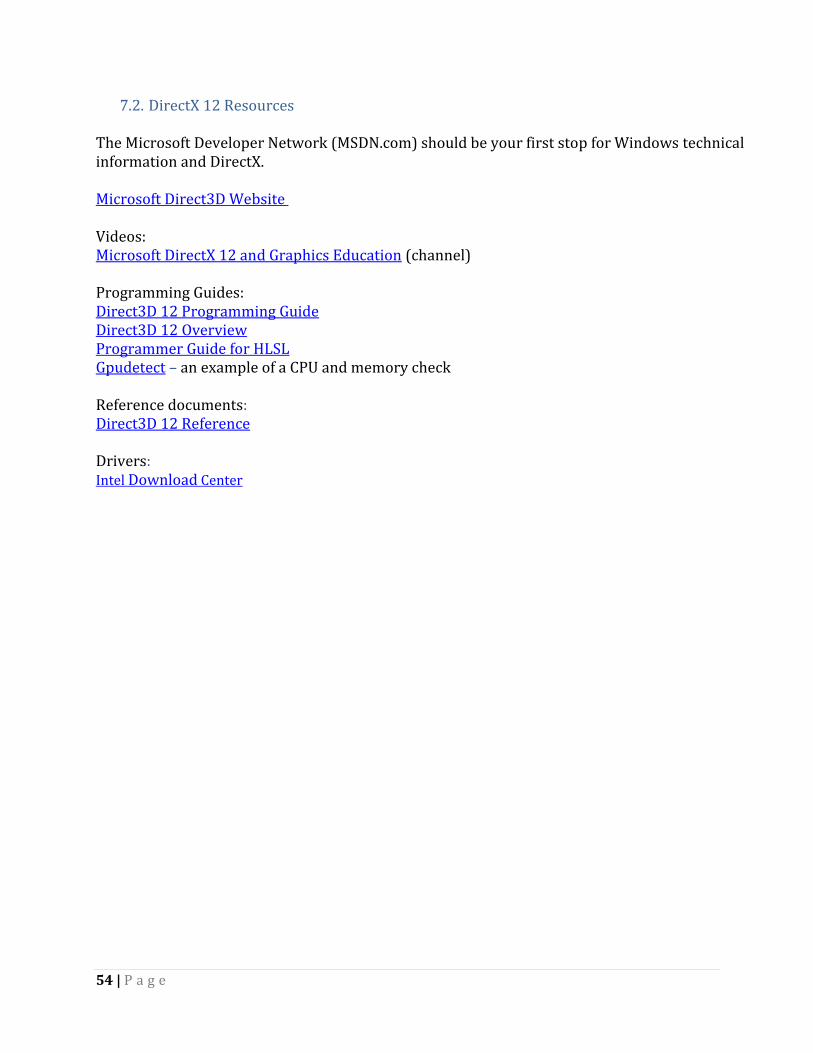
54 | P a g e
7.2. DirectX 12 Resources
The Microsoft Developer Network (MSDN.com) should be your first stop for Windows technical information and DirectX. Microsoft Direct3D Website Videos: Microsoft DirectX 12 and Graphics Education (channel) Programming Guides: Direct3D 12 Programming Guide Direct3D 12 Overview Programmer Guide for HLSL Gpudetect – an example of a CPU and memory check Reference documents: Direct3D 12 Reference Drivers: Intel Download Center
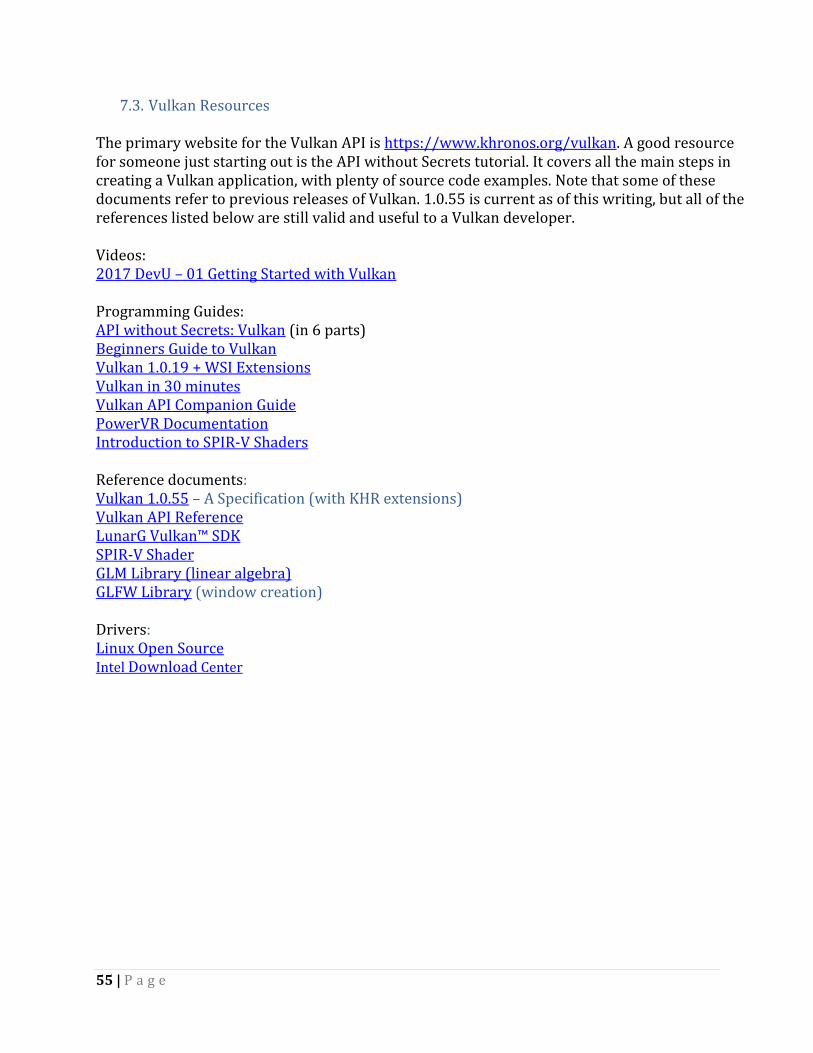
55 | P a g e
7.3. Vulkan Resources The primary website for the Vulkan API is https://www.khronos.org/vulkan. A good resource for someone just starting out is the API without Secrets tutorial. It covers all the main steps in creating a Vulkan application, with plenty of source code examples. Note that some of these documents refer to previous releases of Vulkan. 1.0.55 is current as of this writing, but all of the references listed below are still valid and useful to a Vulkan developer. Videos: 2017 DevU – 01 Getting Started with Vulkan Programming Guides: API without Secrets: Vulkan (in 6 parts) Beginners Guide to Vulkan Vulkan 1.0.19 + WSI Extensions Vulkan in 30 minutes Vulkan API Companion Guide PowerVR Documentation Introduction to SPIR-V Shaders Reference documents: Vulkan 1.0.55 – A Specification (with KHR extensions) Vulkan API Reference LunarG Vulkan™ SDK SPIR-V Shader GLM Library (linear algebra) GLFW Library (window creation) Drivers: Linux Open Source Intel Download Center
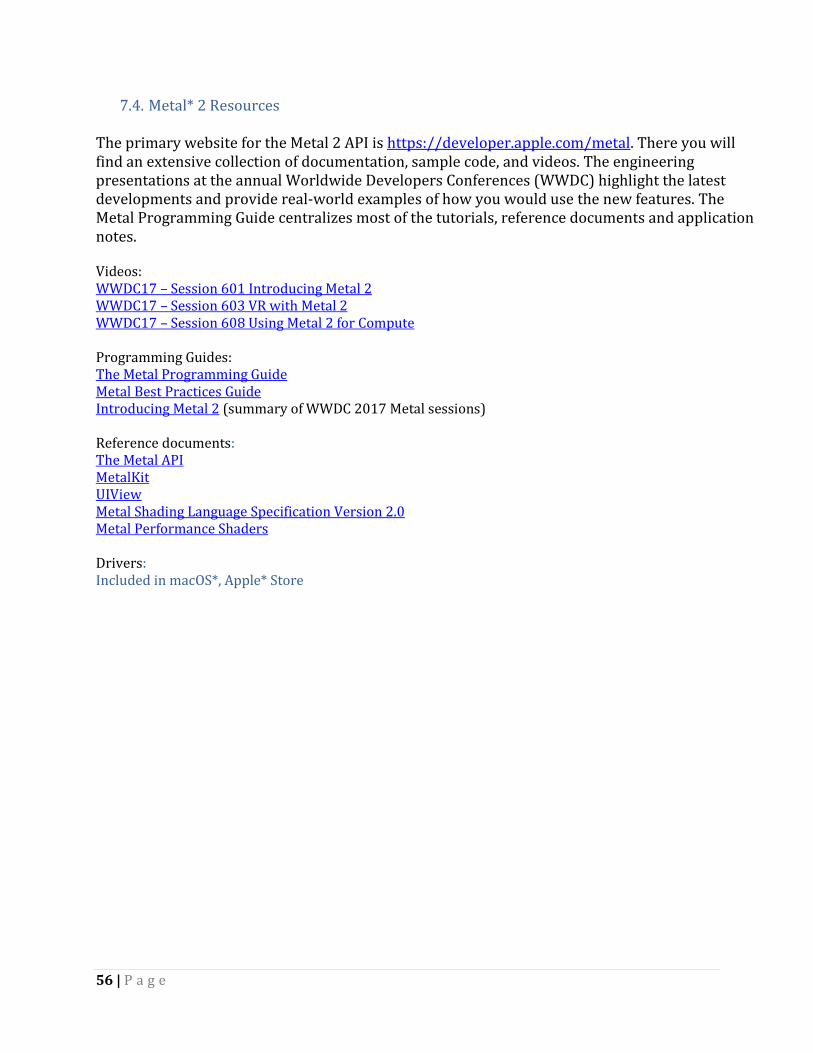
56 | P a g e
7.4. Metal* 2 Resources The primary website for the Metal 2 API is https://developer.apple.com/metal. There you will find an extensive collection of documentation, sample code, and videos. The engineering presentations at the annual Worldwide Developers Conferences (WWDC) highlight the latest developments and provide real-world examples of how you would use the new features. The Metal Programming Guide centralizes most of the tutorials, reference documents and application notes. Videos: WWDC17 – Session 601 Introducing Metal 2 WWDC17 – Session 603 VR with Metal 2 WWDC17 – Session 608 Using Metal 2 for Compute Programming Guides: The Metal Programming Guide Metal Best Practices Guide Introducing Metal 2 (summary of WWDC 2017 Metal sessions) Reference documents: The Metal API MetalKit UIView Metal Shading Language Specification Version 2.0 Metal Performance Shaders Drivers: Included in macOS*, Apple* Store
57 | P a g e
7.5. OpenGL* Resources
There are abundant resources for the OpenGL developer. As an open specification, a lot of home-made videos and tutorials are available on the Internet. A few are really good, but many others are out of date. Anything prior to OpenGL 3.0 is no longer relevant. Some of the better ones are listed below: OpenGL Websites OpenGL.org – SDK, tutorials, sample code, community The Khronos Group – API registry, forums, resources Videos: Sigraph University: An Introduction to OpenGL Programming Programming Guides: OpenGL Tutorial Learn OpenGL OpenGL-Tutorial Reference documents: OpenGL 4.5 OpenGL Extension Wrangler (GLEW) Library (Extensions) GLM Library (linear algebra) GLFW Library (window creation) Drivers: Linux* Open Source Windows 7, 8.1, 10

58 | P a g e
8. Notices
No license (express or implied, by estoppel or otherwise) to any intellectual property rights is granted by this document.
Intel disclaims all express and implied warranties, including without limitation, the implied warranties of merchantability, fitness for a particular purpose, and non-infringement, as well as any warranty arising from course of performance, course of dealing, or usage in trade.
This document contains information on products, services and/or processes in development. All information provided here is subject to change without notice. Contact your Intel representative to obtain the latest forecast, schedule, specifications and roadmaps.
Intel may make changes to specifications and product descriptions at any time, without notice. Designers must not rely on the absence or characteristics of any features or instructions marked "reserved" or "undefined". Intel reserves these for future definition and shall have no responsibility whatsoever for conflicts or incompatibilities arising from future changes to them. The information here is subject to change without notice. Do not finalize a design with this information. The products and services described may contain defects or errors known as errata which may cause deviations from published specifications. Current characterized errata are available on request.
Contact your local Intel sales office or your distributor to obtain the latest specifications and before placing your product order. Copies of documents which have an order number and are referenced in this document may be obtained by calling 1-800-548-4725 or by visiting www.intel.com/design/literature.htm.
This sample source code is released under the Intel Sample Source Code License Agreement.
Intel, the Intel logo, Intel Core, Intel Speed Step, and VTune are trademarks of Intel Corporation in the U.S. and/or other countries.
* Microsoft, Windows, and the Windows logo are trademarks, or registered trademarks of Microsoft
Corporation in the United States and/or other countries. Other names and brands may be claimed as the property of others.
© 2017 Intel Corporation.