Embed Size (px)
Citation preview
Graphical Flip-chart of Nuclear & Energy Related Topics
5-2-10 Periodic Safety Review of Nuclear Power Plant and Measures for Aging Management5-2-11 Aseismic Measures Taken by Nuclear Power Plants5-3-1 Historical Trends in Reported Incidents and Failures at NPPs in Japan5-3-3 Unplanned Automatic Scrams per 7,000 Hours Critical in Major Countries5-3-4 Historical Trends in Capacity Factors of NPPs in Major Countries5-4-3 Causes of the Accident at Chernobyl NPP5-8-1 Disaster Prevention Systems during Nuclear Emergencies5-8-5 Nuclear Damage Compensation System6-3-4 Acute Radiation Eff ects6-3-12 Relative Cancer Risk Estimation for Radiation Exposure and Lifestyle Factors6-4-2 Controls in a Nuclear Power Plant by Area6-4-3 Radiation Exposure Control for Radiation Workers6-4-6 Environmental Radiation Monitoring around Nuclear Facilities7-1-3 Nuclear Fission inside Light Water Reactors7-1-4 Utilization of Uranium Resources7-2-1 Nuclear Fuel Cycle7-2-2 Nuclear Fuel Cycle (Including FBR)7-2-5 Outline of JNFL's Nuclear Fuel Cycle Facilities7-4-1 Flow of Reprocessing7-5-6 MOX Fuel Use in LWRs in the World7-6-1 Mechanism of Fast Breeder Reactor (FBR)7-7-3 Spent Fuel Interim Storage Facility7-8-1 Safety Regulation Flow of Nuclear Fuel Transport7-8-5 Transport Casks for Spent Fuel7-8-6 Transport Vessels for Spent Fuel8-2-1 Structure of Low-level Radioactive Waste Disposal Facility8-3-2 Transport Casks for High-level Radioactive Waste (Vitrifi ed Waste)8-3-3 Transport Vessels for High-level Radioactive Waste (Vitrifi ed Waste)8-3-4 Temporary Storage for High-level Radioactive Waste (Vitrifi ed Waste)8-3-7 Geological Disposal of High-level Radioactive Waste9-2-2 Safeguards System in Japan9-3-1 Electric Power Development based on the Three Laws9-4-1 Japan’s Energy Policy9-4-2 Outline of Basic Energy Plan (the Strategic Energy Plan)9-4-3 Framework for Nuclear Energy Policy10-1-1 Outline of the Tohoku-Pacifi c Ocean Earthquake10-1-2 Tsunami Height by the Tohoku-Pacifi c Ocean Earthquake10-2-1 Current Status of NPPs Aff ected by the Earthquake10-2-2 Safety Function of Fukushima Daiichi NPPs Aff ected by the Earthquake10-2-3 Tsunami and Inundation at Fukushima Daiichi NPPs10-3-1 Outline of Safety Measures after Fukushima Daiichi Accident10-3-2 Examples of Safety Measures after Fukushima Daiichi Accident
APPENDIX
1-1-2 World Population Projections1-1-3 World Population and Energy Consumption1-1-4 Primary Energy Consumption per Capita1-1-6 Proven Reserves of Energy Resources1-1-7 The World’s Primary Energy Consumption1-1-8 Primary Energy Consumption in Major Countries1-1-10 Electricity Consumption per Capita in Major Countries1-1-11 Dependence on Imported Energy Sources in Major Countries1-2-2 Changes of Japan’s Primary Energy Supply Structure1-2-3 Historical Trend of Japan’s Primary Energy Supply1-2-4 Japan’s Fossil Fuel Imports by Country of Origin1-2-5 Japan’s Dependence on Middle East Crude Oil of Total Imports1-2-7 Historical Trend of Power Generation Volume by Source1-2-8 Historical Trend of Generation Capacity by Source1-2-11 Optimal Combination of Power Sources to Correspond to Demands2-1-1 Mechanism of Greenhouse Eff ect2-1-2 Contribution of Greenhouse Gases to Global Warming2-1-3 Changes in CO2 Emissions from Fossil Fuels and Atmospheric CO2 Concentration2-1-4 Historical Trends in World’s CO2 Emissions2-1-8 Kyoto Protocol Targets and Current Status of GHG Emissions2-1-9 Lifecycle Assessment CO2 Emissions Intensity for Japan’s Erergy Source2-1-11 Japan’s Changes in CO2 Emissions by Sector2-1-12 Changes in GHGs Emissions in Japan2-1-13 Increase/Decrease in CO2 Emissions by Sector2-1-14 Changes in CO2 Emissions by Energy Source2-1-15 Measures by Japan’s Electric Power Industry to Reduce CO2 Emissions2-1-16 Historical Trends in CO2 Emissions from Electricity Production in Japan2-1-17 Thermal Effi ciency and T&D Loss Factor in Japan2-1-18 Comparison of CO2 Emissions Intensity by Country2-2-2 SOx and NOx Emissions per Unit of Electricity Generated in Major Countries3-1-1 What is New Energy?3-1-2 Evaluation & Problems of New Energy3-1-4 Photovoltaic Power Generation Capacity in Japan and the World3-1-5 Wind Power Generation Capacity in Japan and the World3-1-7 Mechanism of Heat Pump System Utilizing CO2 Refrigerant3-1-9 Mega Solar Power Generation Plant Projects in Japan3-1-10 Basic Concept of Smart-Grid in Japan3-1-11 Outline of Feed-in Tariff Scheme for Renewable Energies4-1-1 Comparison of Various Fuels Required to Operate a 1GW Power Plant per Year4-1-2 Proven Reserves and Japan's Procurement of Uranium4-1-3 Nuclear Power Plants in Japan4-2-1 Generating Capacity of Nuclear Power Plants in Major Countries4-2-2 Power Generation Composition by Source in Major Countries4-2-3 Electricity Generated and Share of Nuclear Power in Major Countries
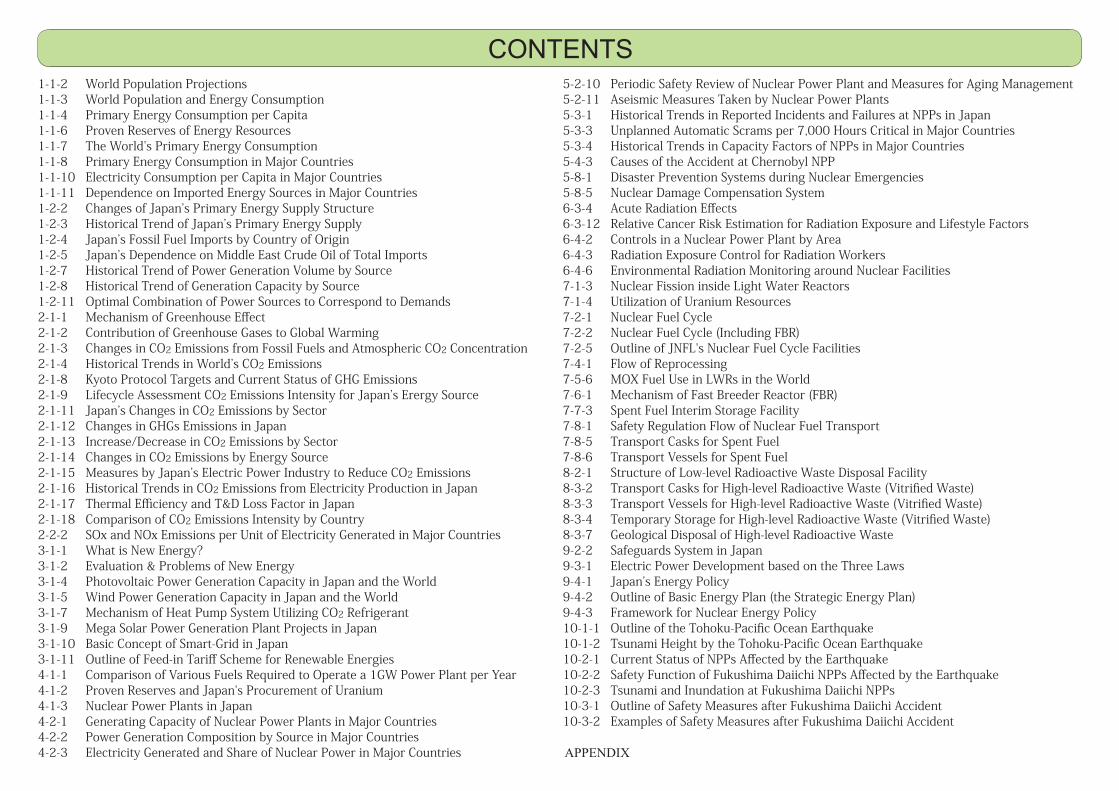
CONTENTS
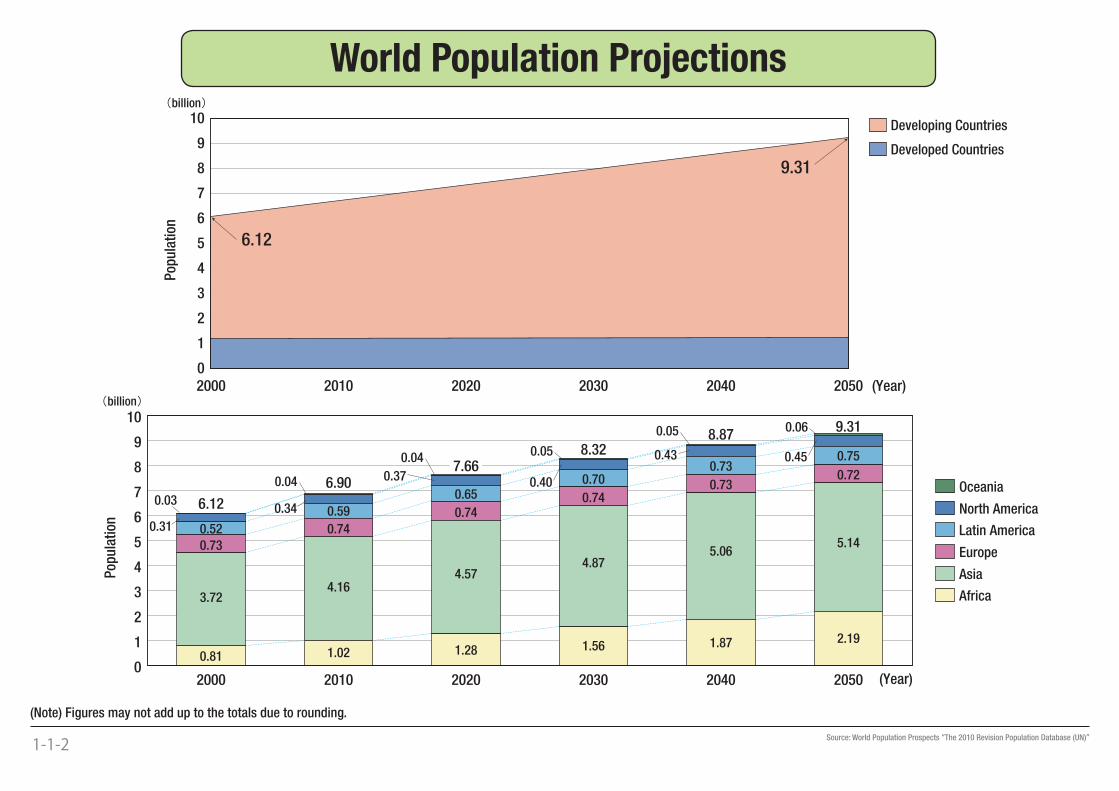
Oceania
North America
Latin America
Europe
Asia
Africa
billion
(Year)0
1
2
3
4
5
6
7
8
9
10
2000
0.81
3.72
0.73
0.52
6.12
6.12
9.31
0.03
0.31
2010 2020 2030 2040 2050
billion
(Year)
Pop
ula
tion
Pop
ula
tion
0
1
2
3
4
5
6
7
8
9
10
2000 2010 2020 2030 2040 2050
Developing Countries
Developed Countries
1.02
4.16
0.74
0.59
6.900.04
0.34
1.28
4.57
0.74
0.65
7.660.04
0.37
1.56
4.87
0.74
0.70
8.320.05
0.40
1.87
5.06
0.73
0.73
8.870.05
0.43
2.19
5.14
0.72
0.75
9.310.06
0.45
1-1-2 Source: World Population Prospects “The 2010 Revision Population Database (UN)”
(Note) Figures may not add up to the totals due to rounding.
World Population Projections
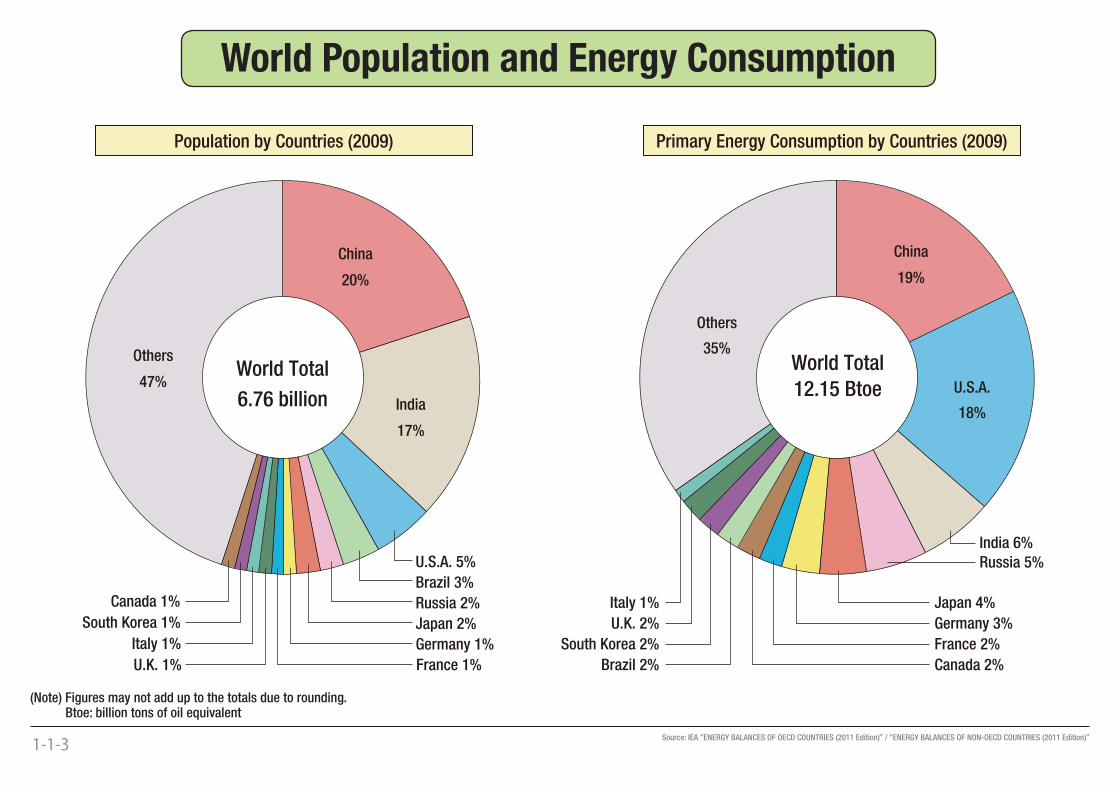
Population by Countries (2009)
World Total
6.76 billion
Primary Energy Consumption by Countries (2009)
World Total
12.15 Btoe
Others
47%
Canada 1%
South Korea 1%
Italy 1%
U.K. 1% France 1%
Germany 1%
Japan 2%
Russia 2%
Brazil 3%
U.S.A. 5%
India
17%
Others
35%
Italy 1%
U.K. 2%
South Korea 2%
Brazil 2% Canada 2%
France 2%
Germany 3%
Japan 4%
China
19%
U.S.A.
18%
China
20%
India 6%
Russia 5%
1-1-3 Source: IEA “ENERGY BALANCES OF OECD COUNTRIES (2011 Edition)” / “ENERGY BALANCES OF NON-OECD COUNTRIES (2011 Edition)”
(Note) Figures may not add up to the totals due to rounding. Btoe: billion tons of oil equivalent
World Population and Energy Consumption
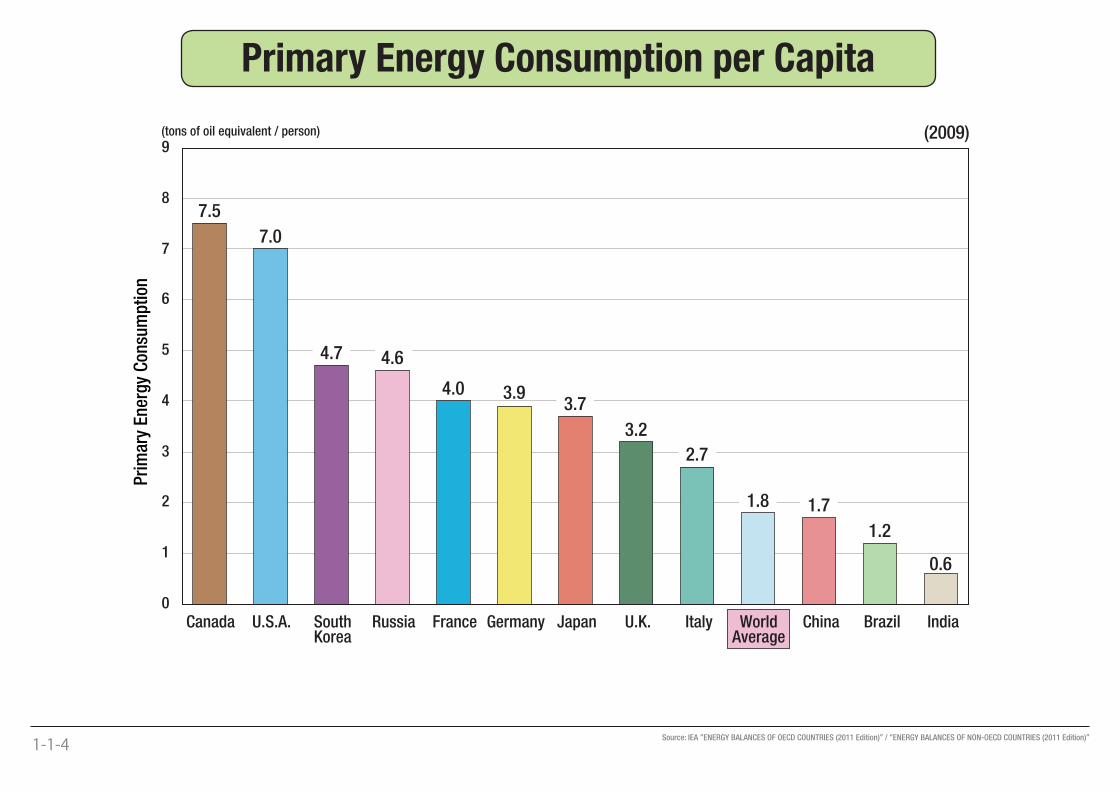
Canada U.S.A. SouthKorea
Russia France Germany Japan U.K. Italy WorldAverage
China Brazil India
7.5
7.0
4.7 4.6
4.0 3.93.7
3.2
2.7
1.8 1.7
1.2
0.6
0
1
2
3
4
5
6
7
8
9(tons of oil equivalent / person) (2009)
Pri
mar
y E
ner
gy
Con
sum
pti
on
1-1-4
Source: IEA “ENERGY BALANCES OF OECD COUNTRIES (2011 Edition)” / “ENERGY BALANCES OF NON-OECD COUNTRIES (2011 Edition)”
Primary Energy Consumption per Capita
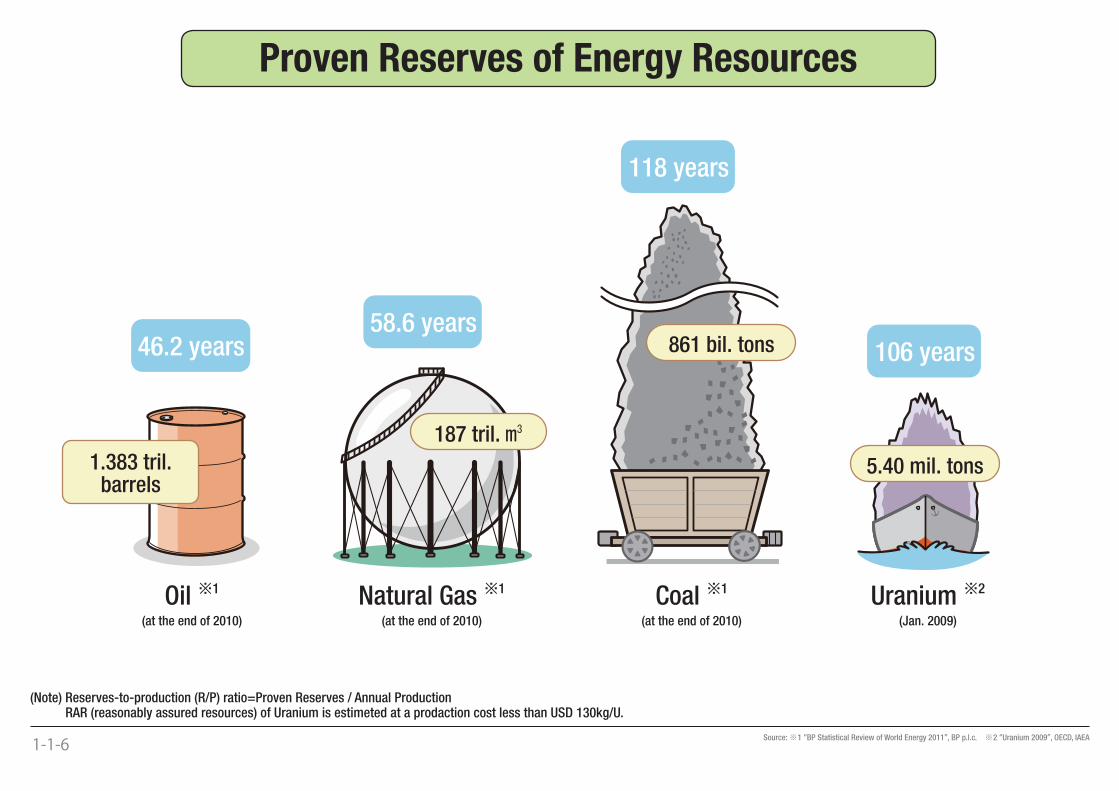
Oil 1
(at the end of 2010)
Natural Gas 1
(at the end of 2010)
Coal 1
(at the end of 2010)
Uranium 2
(Jan. 2009)
1.383 tril.barrels
187 tril.
861 bil. tons
5.40 mil. tons
46.2 years58.6 years
118 years
106 years
1-1-6 Source: ※ 1 “BP Statistical Review of World Energy 2011”, BP p.l.c. ※ 2 “Uranium 2009”, OECD, IAEA
(Note) Reserves-to-production (R/P) ratio=Proven Reserves / Annual Production RAR (reasonably assured resources) of Uranium is estimeted at a prodaction cost less than USD 130kg/U.
Proven Reserves of Energy Resources
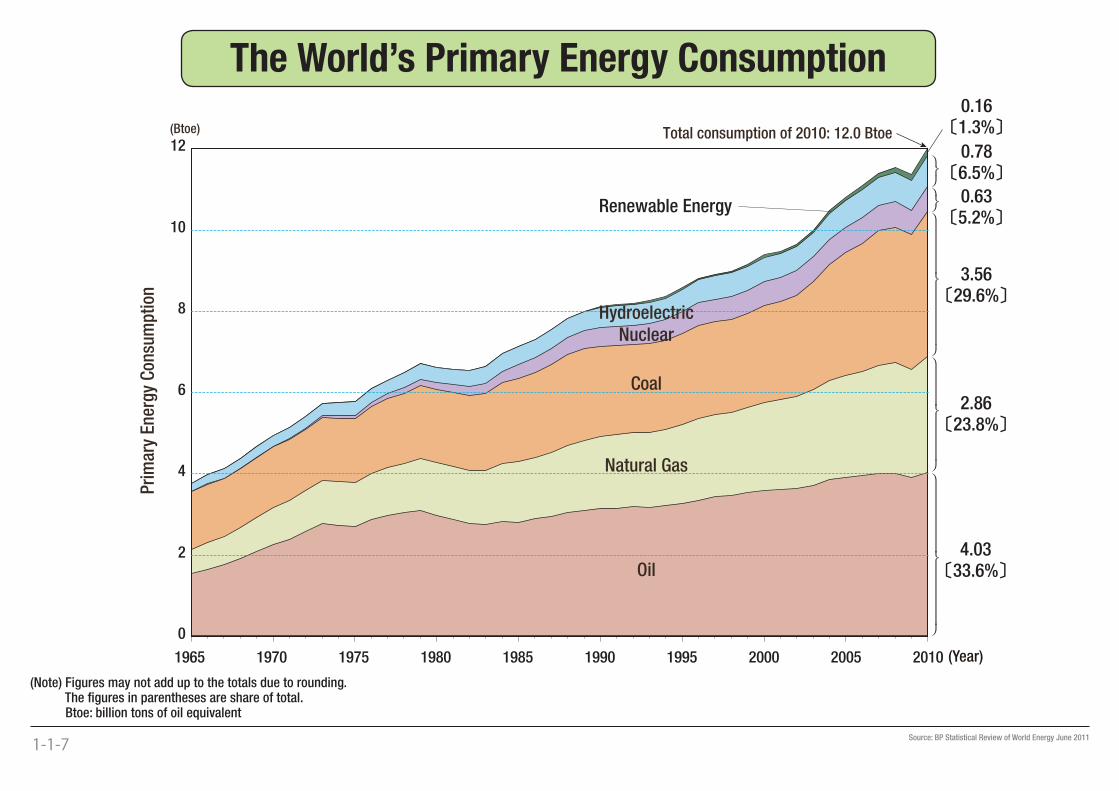
0
2
4
6
8
10
12Total consumption of 2010: 12.0 Btoe
0.786.5%
0.161.3%
0.635.2%
3.5629.6%
2.8623.8%
4.0333.6%
Renewable Energy
Pri
mar
y E
ner
gy
Con
sum
pti
on
1965 1970 1975 1980 1985 1990 1995 2000 2005 2010 (Year)
(Btoe)
Hydroelectric
Coal
Natural Gas
Oil
Nuclear
1-1-7
The World’s Primary Energy Consumption
(Note) Figures may not add up to the totals due to rounding. The fi gures in parentheses are share of total. Btoe: billion tons of oil equivalent
Source: BP Statistical Review of World Energy June 2011
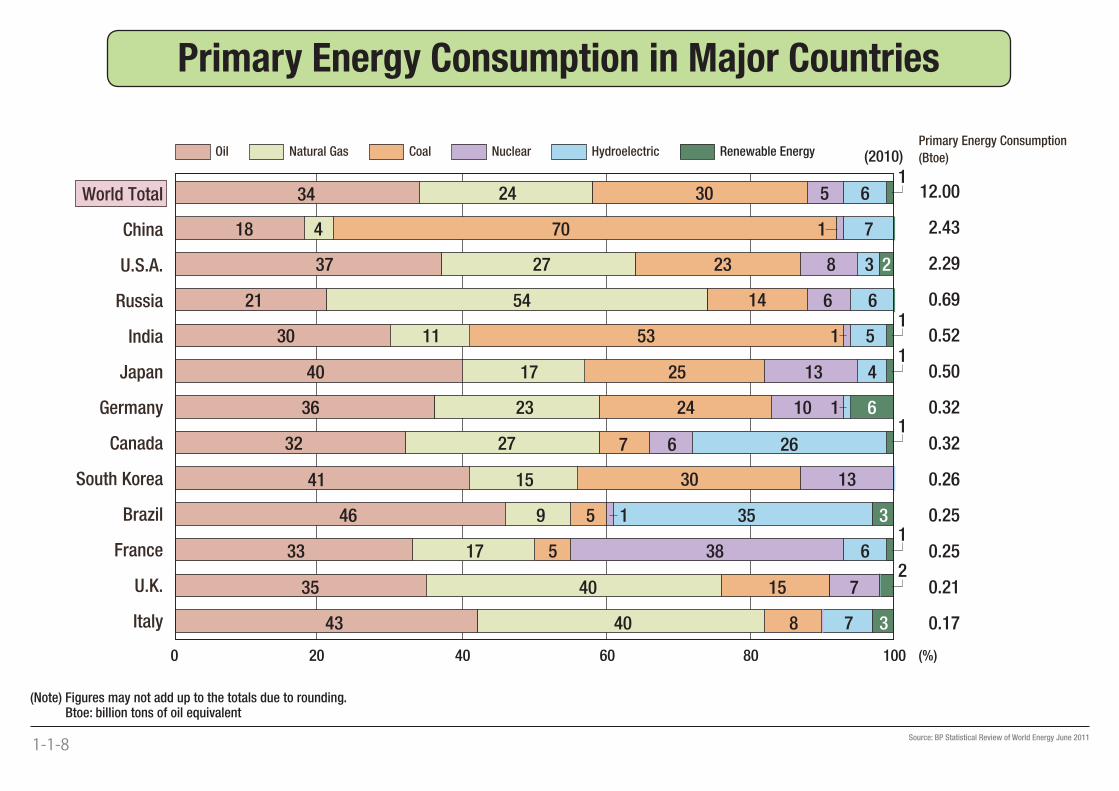
Japan
Italy
U.K.
Brazil
South Korea
France
Canada
Germany
India
Russia
U.S.A.
China
World Total
40 17 25 13 4
(2010)
(%)
Primary Energy Consumption
(Btoe)
12.00
2.43
2.29
0.69
0.52
0.50
0.32
0.32
0.26
0.25
0.25
0.21
0.17
HydroelectricNuclearCoalNatural GasOil
34
18
37
21
30
36
32
41
46
33
35
43 40 8 7 3
40 15 7
17 5 38 6
9 5 1 35 3
15
27 7 266
23 24 10 1 6
11 53 1 5
54 6 6
27 23 8 3 2
4 70 1 7
24 30 5 61
1
1
1
1
2
0 20 40 60 80 100
Renewable Energy
13
14
30
1-1-8 Source: BP Statistical Review of World Energy June 2011
(Note) Figures may not add up to the totals due to rounding. Btoe: billion tons of oil equivalent
Primary Energy Consumption in Major Countries
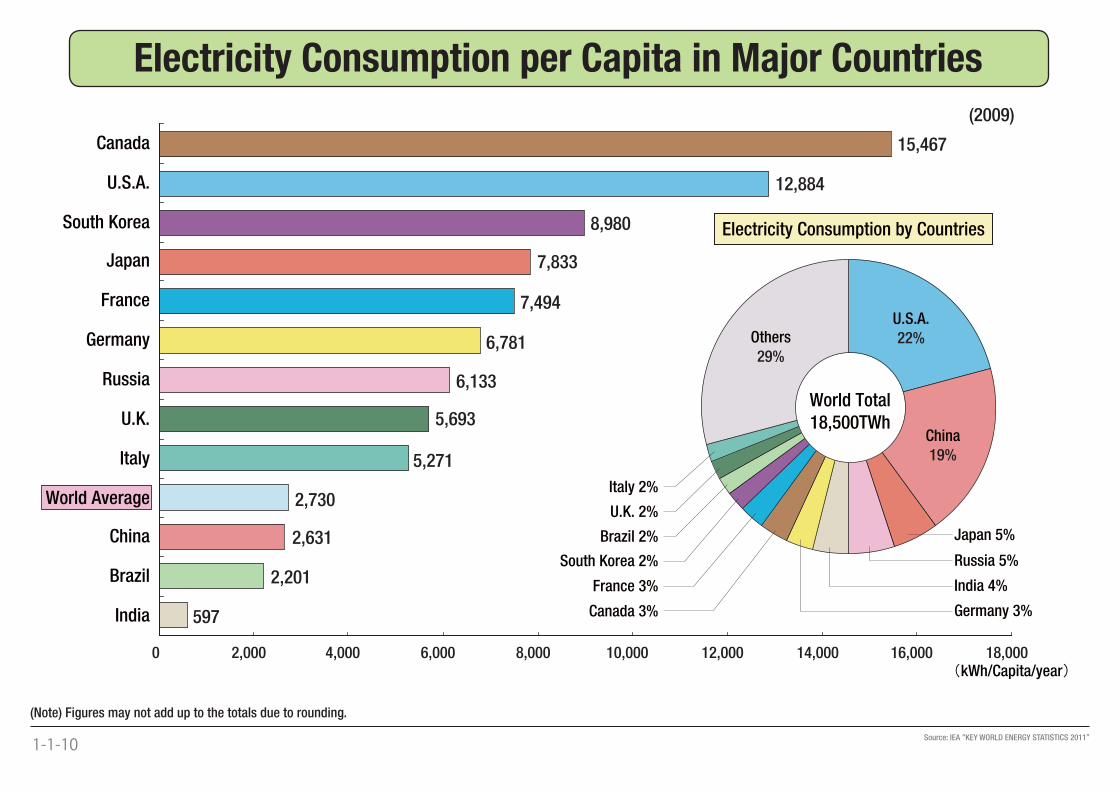
597
2,201
2,631
2,730
5,271
5,693
6,133
6,781
7,494
7,833
8,980
12,884
15,467
0 2,000 4,000 6,000 8,000 10,000 12,000 14,000 16,000 18,000
India
Brazil
China
World Average
Italy
U.K.
Russia
Germany
France
Japan
South Korea
U.S.A.
Canada
U.S.A.
22%
China
19%
Japan 5%
Russia 5%
India 4%
Canada 3% Germany 3%
France 3%
South Korea 2%
Brazil 2%
U.K. 2%
Italy 2%
Others
29%
Electricity Consumption by Countries
World Total
18,500TWh
(2009)
kWh/Capita/year
1-1-10 Source: IEA “KEY WORLD ENERGY STATISTICS 2011”
(Note) Figures may not add up to the totals due to rounding.
Electricity Consumption per Capita in Major Countries
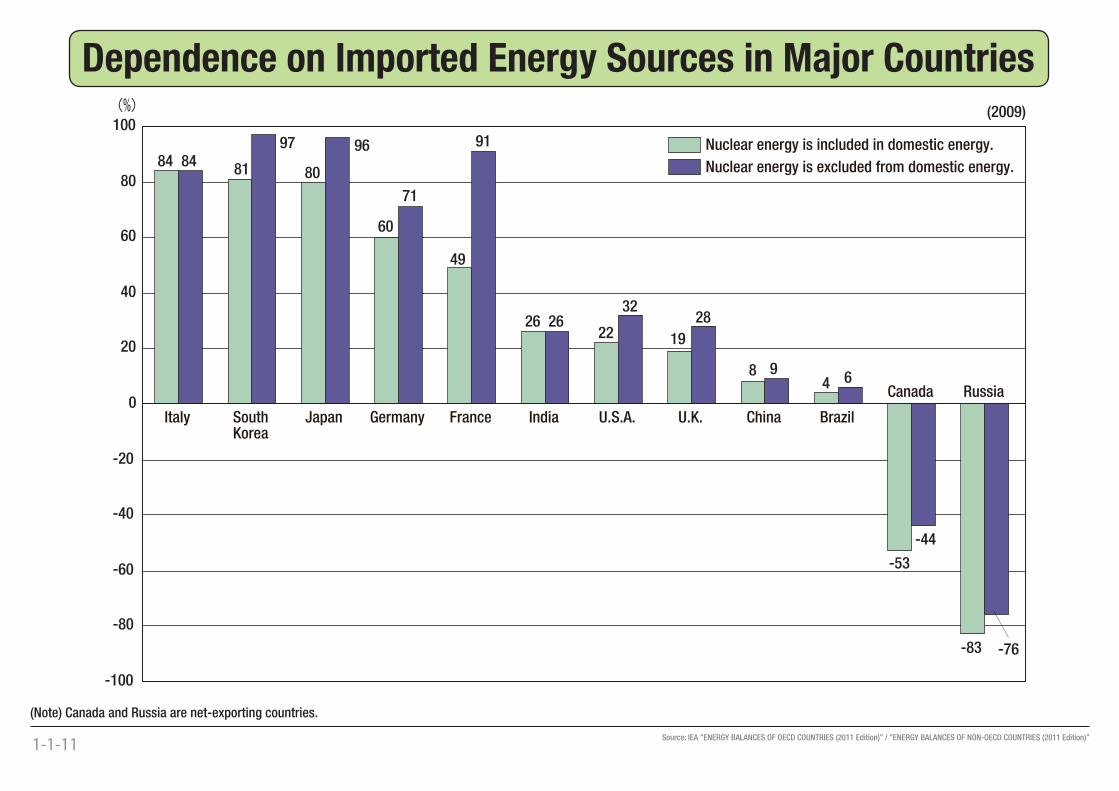
848081
60
49
2226
19
48
-53
-83
849697
71
91
3226 28
69
-44
-76
(2009)
-100
-80
-60
-40
-20
0
20
40
60
80
100
Nuclear energy is included in domestic energy.
Nuclear energy is excluded from domestic energy.
Italy JapanSouthKorea
Germany France U.S.A.India U.K. BrazilChina
Canada Russia
1-1-11 Source: IEA “ENERGY BALANCES OF OECD COUNTRIES (2011 Edition)” / “ENERGY BALANCES OF NON-OECD COUNTRIES (2011 Edition)”
(Note) Canada and Russia are net-exporting countries.
Dependence on Imported Energy Sources in Major Countries
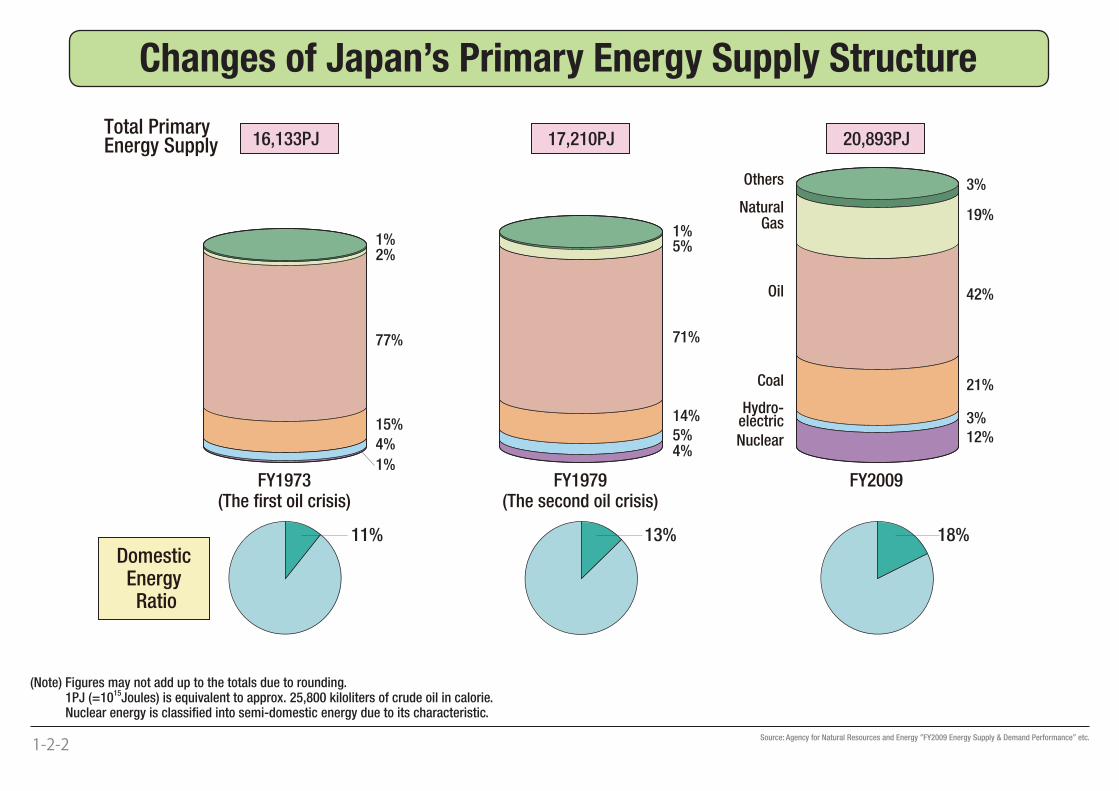
Total Primary Energy Supply 16,133PJ
FY1973(The first oil crisis)
FY1979(The second oil crisis)
FY2009
1%2%
77%
15%
4%
1%
1%
3%
19%
42%
21%
3%12%
5%
71%
14%
5%4%
11% 13% 18%
17,210PJ
Domestic Energy Ratio
20,893PJ
Others
Natural Gas
Oil
Coal
Hydro-electric
Nuclear
1-2-2 Source: Agency for Natural Resources and Energy “FY2009 Energy Supply & Demand Performance” etc.
(Note) Figures may not add up to the totals due to rounding. 1PJ (=1015Joules) is equivalent to approx. 25,800 kiloliters of crude oil in calorie. Nuclear energy is classifi ed into semi-domestic energy due to its characteristic.
Changes of Japan’s Primary Energy Supply Structure
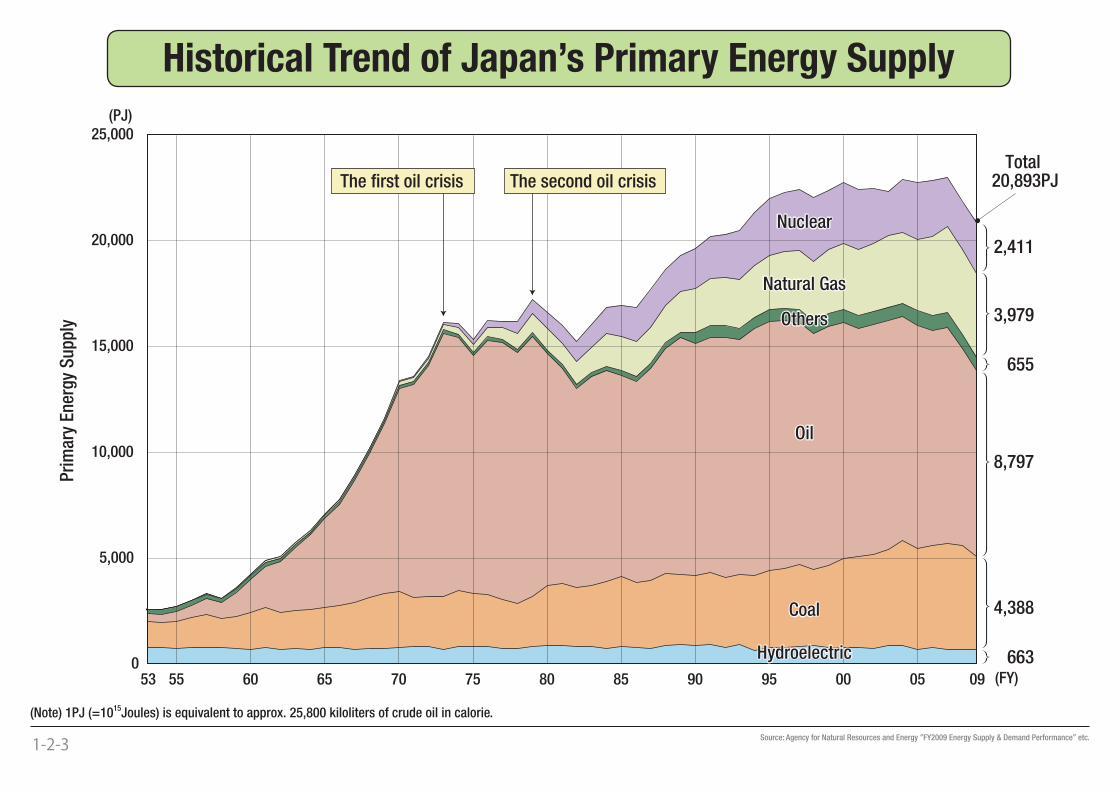
0
5,000
10,000
15,000
20,000
25,000(PJ)
(FY)53 55 60 65 70 75 80 85 90 95 00 05 09
663
655
Coal
Natural Gas
Oil
Nuclear
Total 20,893PJThe second oil crisisThe first oil crisis
2,411
3,979
8,797
4,388
Pri
mar
y E
ner
gy
Su
pp
ly
Hydroelectric
Others
1-2-3 Source: Agency for Natural Resources and Energy “FY2009 Energy Supply & Demand Performance” etc.
(Note) 1PJ (=1015Joules) is equivalent to approx. 25,800 kiloliters of crude oil in calorie.
Historical Trend of Japan’s Primary Energy Supply
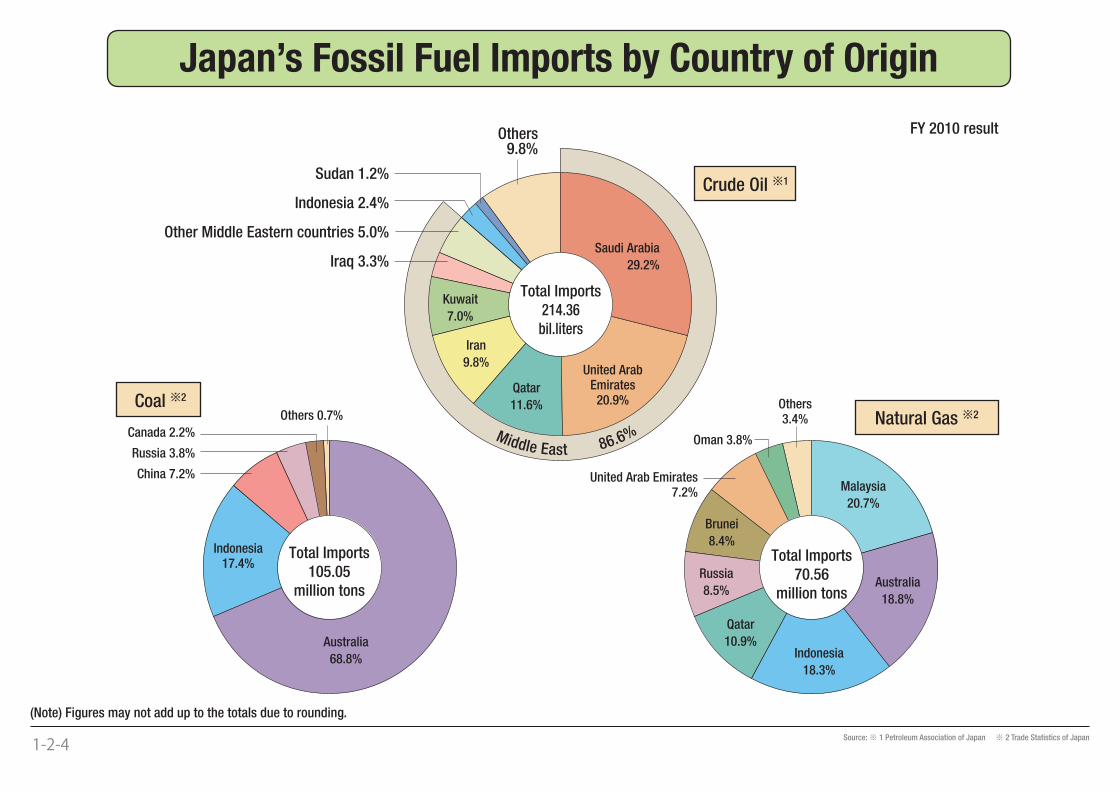
Sudan 1.2%
Indonesia 2.4%
Other Middle Eastern countries 5.0%
Iraq 3.3%
Kuwait
7.0%
Qatar
11.6%
Iran
9.8%United Arab
Emirates20.9%
Saudi Arabia
29.2%
Others9.8%
Australia
68.8%
Indonesia17.4%
Canada 2.2%
Russia 3.8%
China 7.2%
Others 0.7%
Malaysia
20.7%
Australia
18.8%
Qatar
10.9%
Brunei
8.4%
Russia
8.5%
United Arab Emirates7.2%
Oman 3.8%
Others3.4%
Indonesia
18.3%
Total Imports105.05
million tons
Total Imports70.56
million tons
Total Imports214.36bil.liters
Natural Gas 2Coal 2
Crude Oil 1
FY 2010 result
Middle East 86.6%
1-2-4 Source: ※ 1 Petroleum Association of Japan ※ 2 Trade Statistics of Japan
(Note) Figures may not add up to the totals due to rounding.
Japan’s Fossil Fuel Imports by Country of Origin
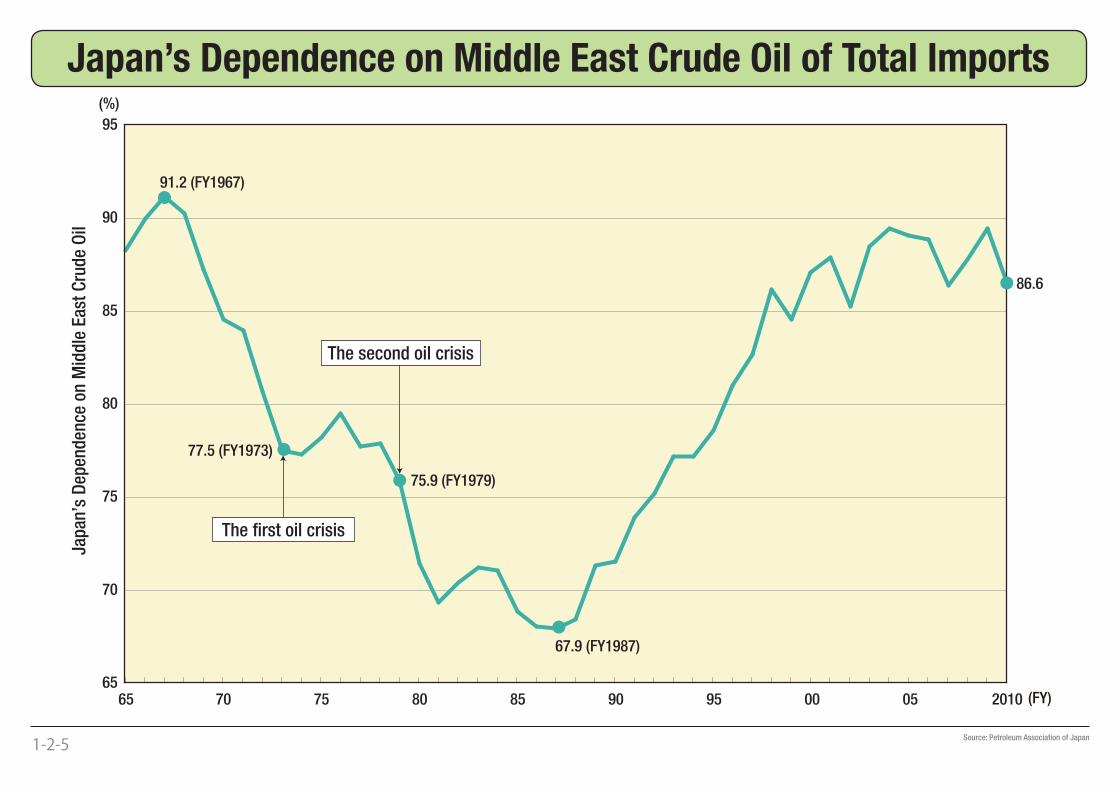
65
70
75
80
85
90
95
65 70 75 80 85 90 95 00 05 2010 (FY)
(%)
Jap
an’s
Dep
end
ence
on
Mid
dle
Eas
t C
rud
e O
il
91.2 (FY1967)
77.5 (FY1973)
75.9 (FY1979)
67.9 (FY1987)
86.6
The second oil crisis
The first oil crisis
1-2-5
Source: Petroleum Association of Japan
Japan’s Dependence on Middle East Crude Oil of Total Imports
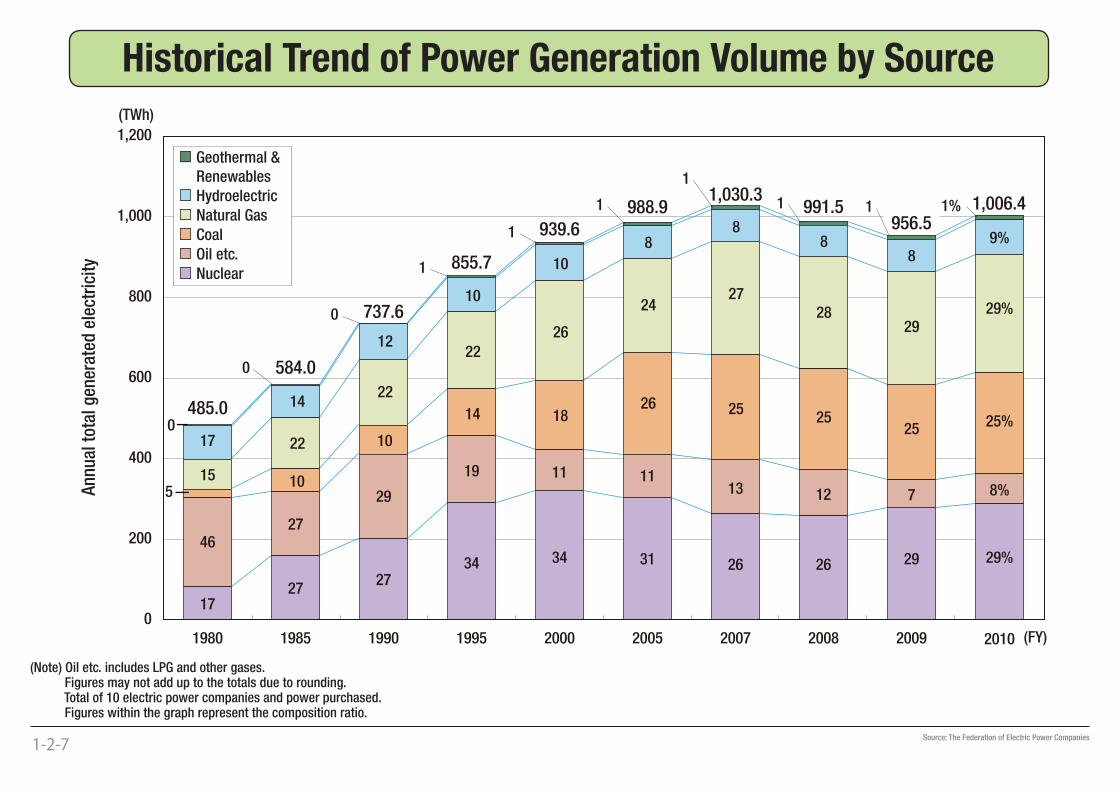
(FY)
(TWh)
An
nu
al t
otal
gen
erat
ed e
lect
rici
ty
0
200
400
600
800
1,000
1,200
1727
2734 34 31 26 29 29%
4627
29
19 11 1113 7 8%5
10
10
14 1826 25
2525%
15
22
22
22
26
2427
2929%
17
485.0
584.0
737.6
855.7
939.6988.9 1,006.4
14
12
10
10
88
89%
0
1%
1980 1985 1990 1995 2000 2005 2007 20092008 2010
1 1
1
1
1
1
0
0
1,030.3
26
12
25
28
8
991.5956.5
Geothermal &
Renewables
Hydroelectric
Natural Gas
Coal
Oil etc.
Nuclear
1-2-7 Source: The Federation of Electric Power Companies
(Note) Oil etc. includes LPG and other gases. Figures may not add up to the totals due to rounding. Total of 10 electric power companies and power purchased. Figures within the graph represent the composition ratio.
Historical Trend of Power Generation Volume by Source
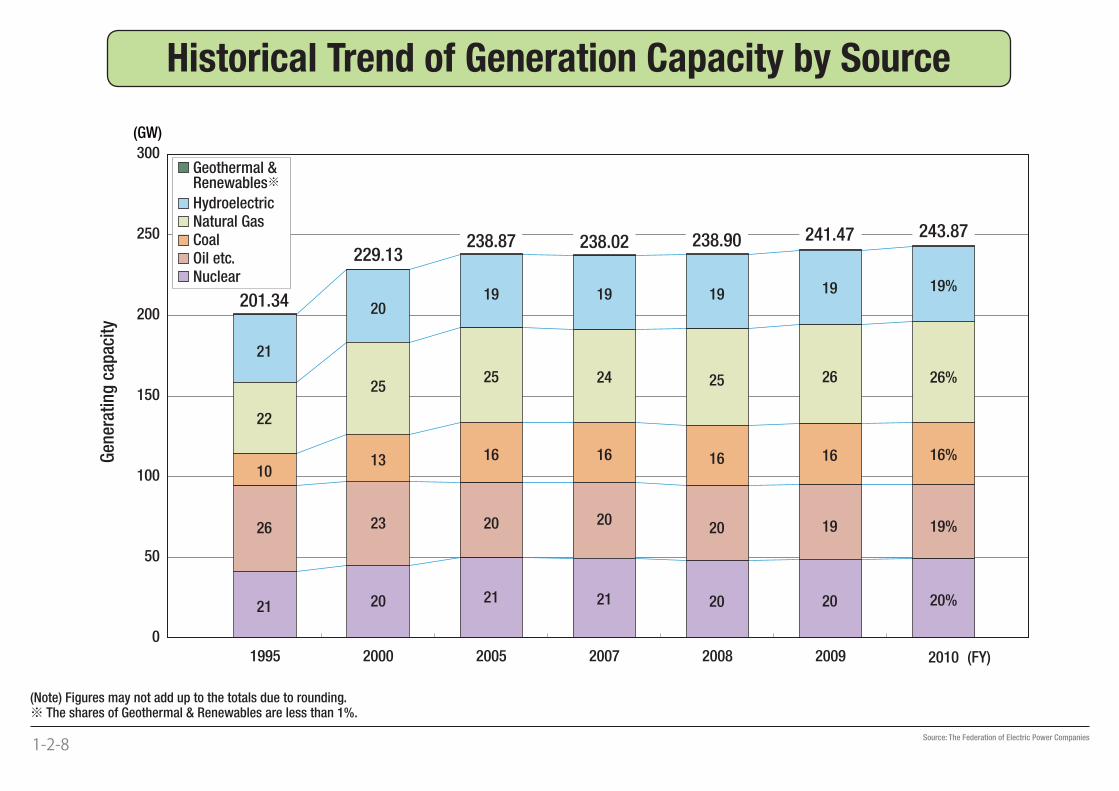
(FY)
(GW)
Gen
erat
ing
cap
acit
y
0
50
100
150
200
250
300
21
26
10
22
21
201.34
20
23
13
25
20
229.13
21
20
16
25
19
238.87
21
20
16
24
19
238.02
20
20
16
25
19
238.90
20
19
16
26
19
241.47
20%
19%
16%
26%
19%
243.87
1995 2000 2005 2007 20092008 2010
Geothermal &Renewables※
HydroelectricNatural GasCoalOil etc.Nuclear
1-2-8
Historical Trend of Generation Capacity by Source
Source: The Federation of Electric Power Companies
(Note) Figures may not add up to the totals due to rounding.※ The shares of Geothermal & Renewables are less than 1%.
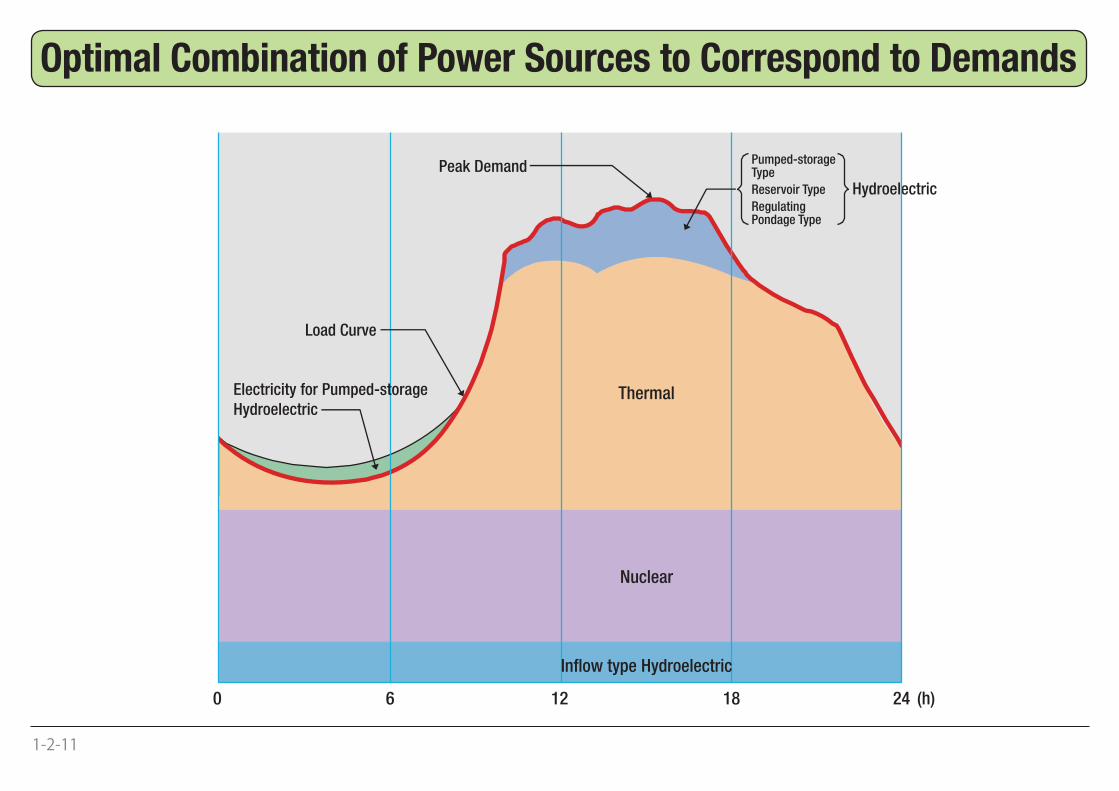
Peak Demand
Load Curve
Electricity for Pumped-storage
Hydroelectric
(h)
Hydroelectric
Thermal
Nuclear
Inflow type Hydroelectric
Pumped-storageType
Reservoir Type
RegulatingPondage Type
0 6 12 18 24
1-2-11
Optimal Combination of Power Sources to Correspond to Demands
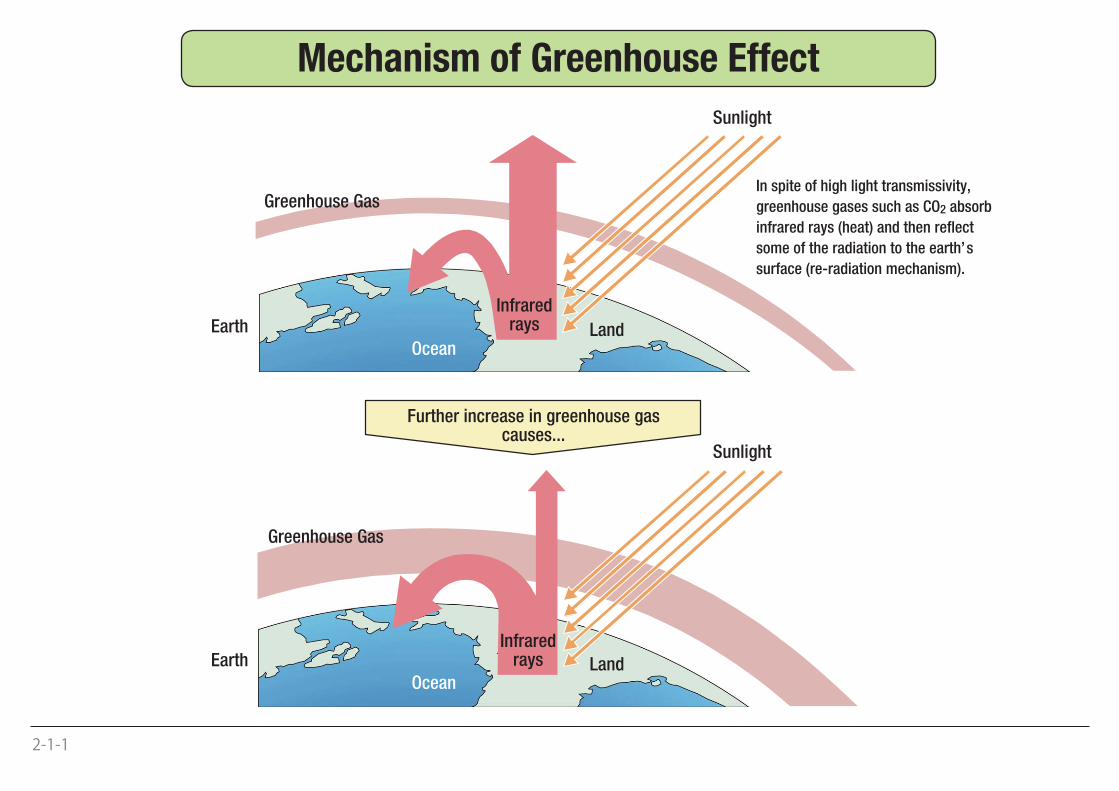
In spite of high light transmissivity,
greenhouse gases such as CO2 absorb
infrared rays (heat) and then reflect
some of the radiation to the earth’s
surface (re-radiation mechanism).
Sunlight
Infraredrays
Infraredrays
Greenhouse Gas
Earth Land
Sunlight
Greenhouse Gas
Earth Land
Further increase in greenhouse gascauses...
Ocean
Ocean
2-1-1
Mechanism of Greenhouse Effect
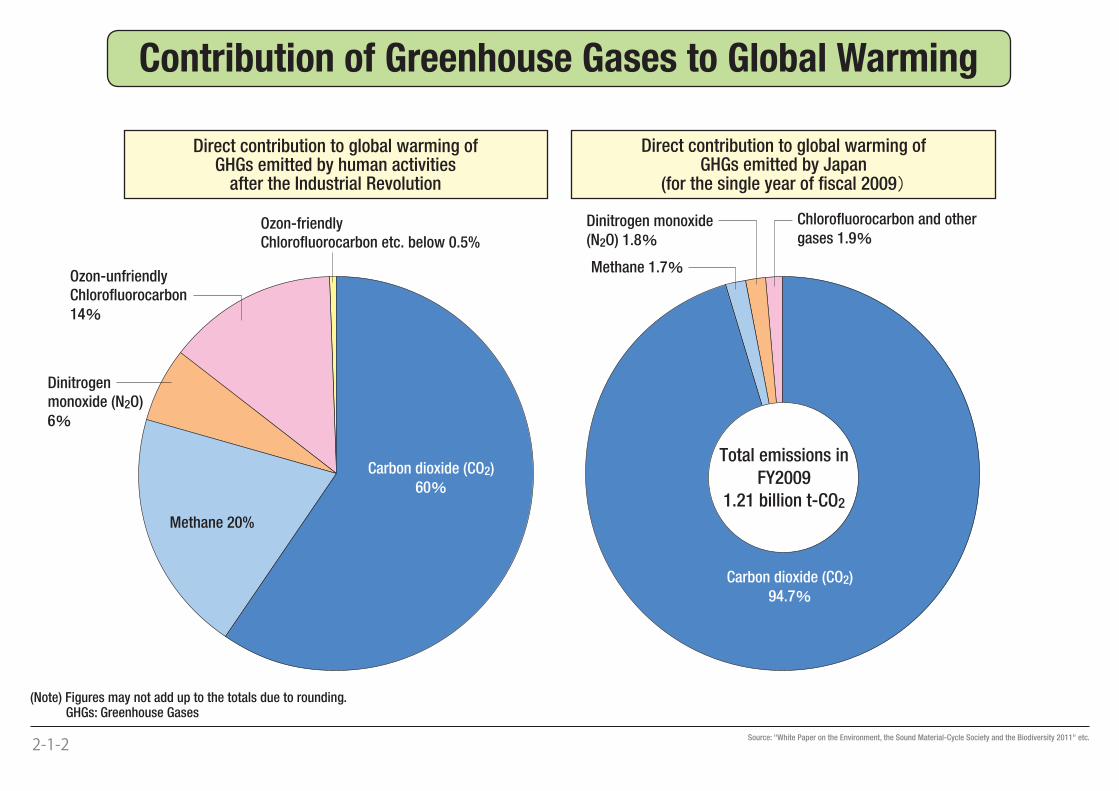
Direct contribution to global warming ofGHGs emitted by human activities
after the Industrial Revolution
Ozon-unfriendlyChlorofluorocarbon14
Ozon-friendlyChlorofluorocarbon etc. below 0.5%
Dinitrogenmonoxide (N2O)6
Methane 20%
Carbon dioxide (CO2)60
Direct contribution to global warming ofGHGs emitted by Japan
(for the single year of fiscal 2009
Total emissions in
FY2009
1.21 billion t-CO2
Chlorofluorocarbon and othergases 1.9
Carbon dioxide (CO2)94.7
Methane 1.7
Dinitrogen monoxide(N2O) 1.8
2-1-2 Source: "White Paper on the Environment, the Sound Material-Cycle Society and the Biodiversity 2011" etc.
(Note) Figures may not add up to the totals due to rounding. GHGs: Greenhouse Gases
Contribution of Greenhouse Gases to Global Warming
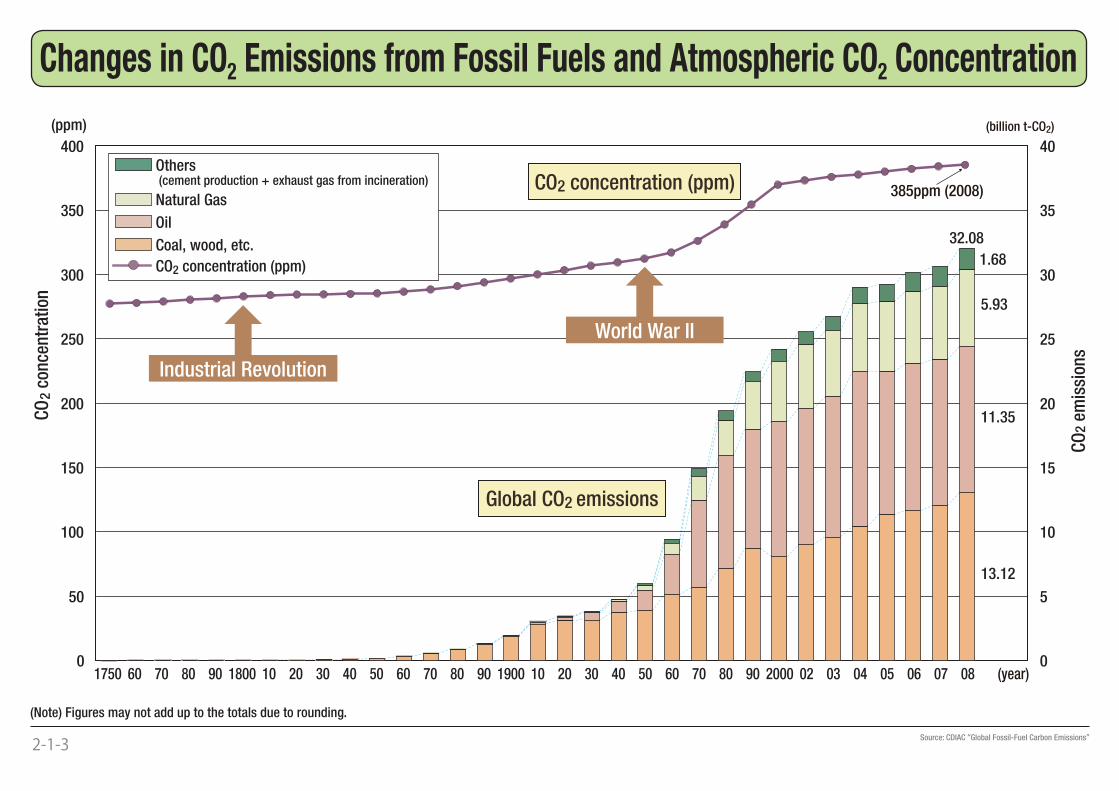
0
50
100
150
200
250
300
350
400
(ppm) (billion t-CO2)
1750 60 70 80 90 1800 10 20 30 40 50 60 70 80 90 1900 10 20 30 40 50 60 70 80 90 2000 02 03 04 05 080706 (year)0
5
10
15
20
25
30
35
40
CO
2 c
once
ntr
atio
n
CO
2 e
mis
sion
s
CO2 concentration (ppm)
Global CO2 emissions
385ppm (2008)
32.08
1.68
5.93
11.35
13.12
Industrial Revolution
World War II
Others (cement production + exhaust gas from incineration)
Natural Gas
Oil
Coal, wood, etc.
CO2 concentration (ppm)
2-1-3 Source: CDIAC “Global Fossil-Fuel Carbon Emissions”
(Note) Figures may not add up to the totals due to rounding.
Changes in CO2 Emissions from Fossil Fuels and Atmospheric CO2 Concentration
0
5
10
15
20
25
35
30
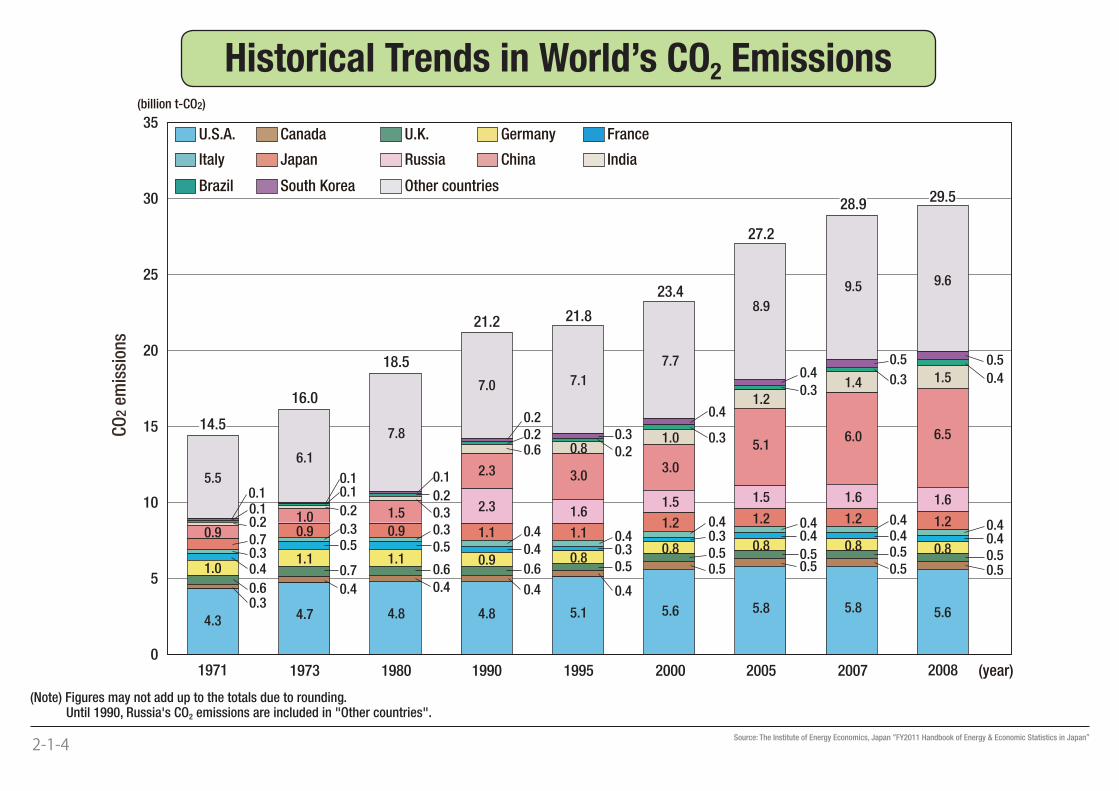
(year)200820072005200019951990198019731971
(billion t-CO2)
4.3 4.7 4.8 4.8 5.1 5.6 5.8 5.65.80.30.4 0.4 0.4 0.4
0.5 0.5 0.50.50.6 0.6 0.50.5 0.5 0.50.5
1.01.1 1.1 0.9 0.8
0.8 0.8 0.80.8
0.4
0.5 0.5 0.4 0.30.3 0.4 0.40.4
0.3
0.3 0.3 0.4 0.40.4 0.4 0.40.4
0.9 0.9 1.1 1.11.2 1.2 1.21.2
1.61.5 1.5 1.61.6
0.91.0 1.5 2.3
2.3 3.0
0.8
3.0
5.16.56.0
0.20.2 0.3
0.61.0
1.2
1.51.4
0.1 0.2
0.2
0.20.3
0.30.40.3
0.10.1
0.20.3
0.4
0.40.50.5
5.5
6.1
7.8
7.0 7.1
7.7
8.9
9.69.5
0.1
0.7
0.1
0.7
0.6
14.5
16.0
18.5
21.2 21.8
23.4
27.2
29.528.9Other countriesSouth KoreaBrazil
IndiaChinaRussiaJapanItaly
FranceGermanyU.K.CanadaU.S.A.C
O2 e
mis
sion
s
2-1-4 Source: The Institute of Energy Economics, Japan “FY2011 Handbook of Energy & Economic Statistics in Japan”
(Note) Figures may not add up to the totals due to rounding. Until 1990, Russia's CO2 emissions are included in "Other countries".
Historical Trends in World’s CO2 Emissions
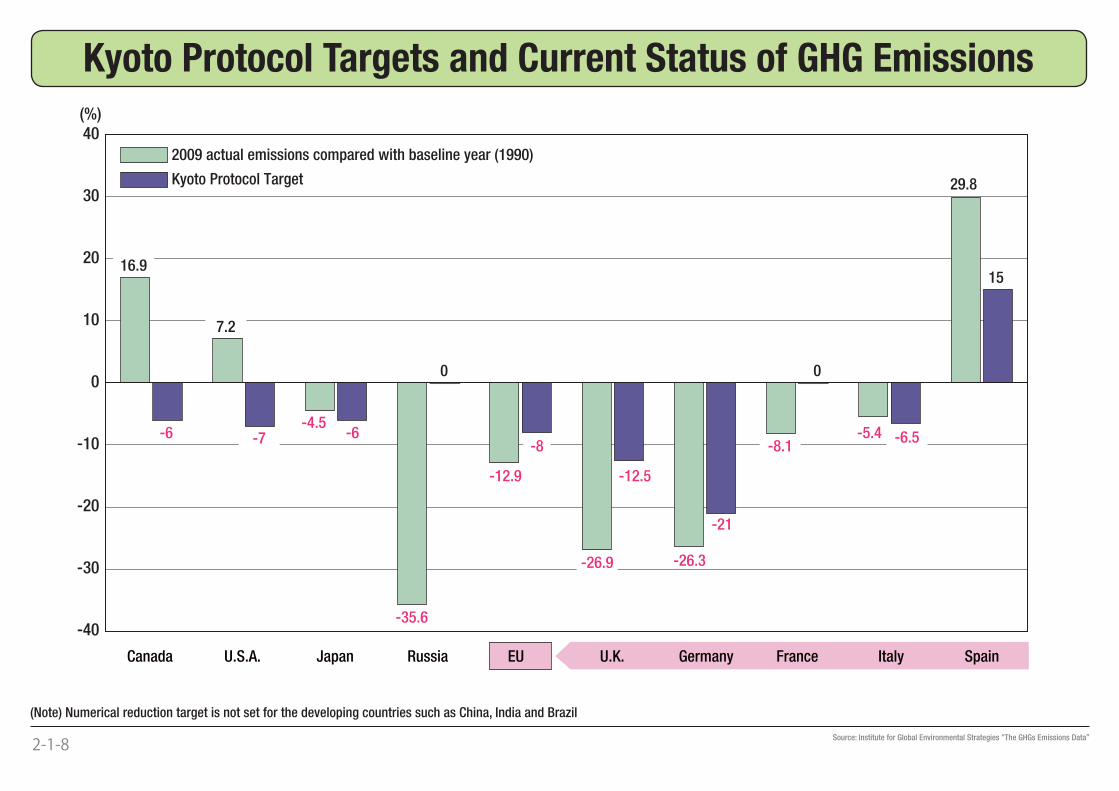
2009 actual emissions compared with baseline year (1990)
Kyoto Protocol Target
Canada U.S.A. Japan Russia EU U.K. Germany France Italy Spain
7.2
0 0
29.8
16.9
-7 -6
-35.6
-6
-12.9
-26.9 -26.3
-8.1-6.5
-21
-8
-4.5
-12.5
-5.4
15
40(%)
30
20
10
0
-10
-20
-30
-40
2-1-8 Source: Institute for Global Environmental Strategies “The GHGs Emissions Data”
(Note) Numerical reduction target is not set for the developing countries such as China, India and Brazil
Kyoto Protocol Targets and Current Status of GHG Emissions
0
100
200
300
400
500
600
700
800
900
1,000
79
943
738
599
474
43123 98
864
695476
376
38 25 20 13 11
[g-CO2/kWh (sending end)]
CO
2 e
mis
sion
s in
ten
sity
Power
SourcesCoal Fired Oil Fired LNG
FiredLNG
CombinedSolar Wind Nuclear Geothermal Hydroelectric
(small &medium-sized)
Fuel Conbustion
Facilities/Operations
2-1-9
Source: Central Research Institute of Electric Power Industry “Evaluation of Life Cycle CO2 Emissiows of Power Genevations technologies (July 2010)”
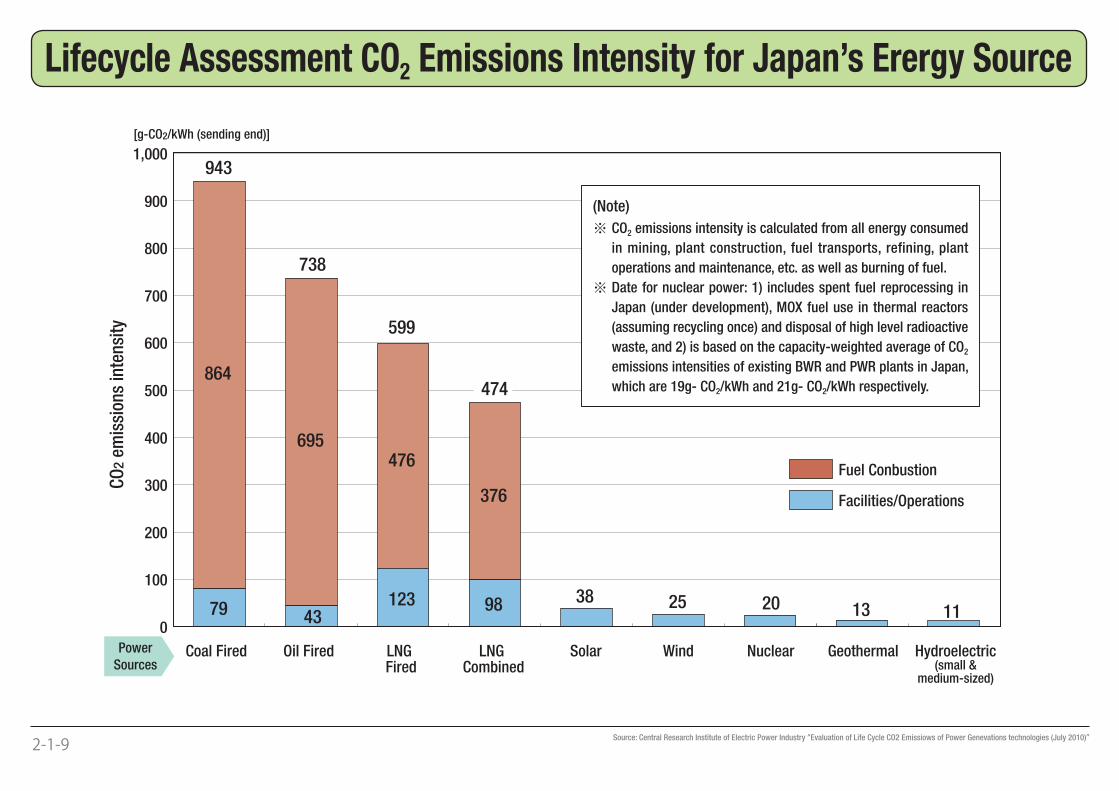
Lifecycle Assessment CO2 Emissions Intensity for Japan’s Erergy Source
(Note)
※ CO2 emissions intensity is calculated from all energy consumed
in mining, plant construction, fuel transports, refining, plant
operations and maintenance, etc. as well as burning of fuel.
※ Date for nuclear power: 1) includes spent fuel reprocessing in
Japan (under development), MOX fuel use in thermal reactors
(assuming recycling once) and disposal of high level radioactive
waste, and 2) is based on the capacity-weighted average of CO2
emissions intensities of existing BWR and PWR plants in Japan,
which are 19g- CO2/kWh and 21g- CO2/kWh respectively.
0
2
4
6
8
10
12
14
0.7 0.7 0.7 0.7 0.80.7 0.8 0.7 0.8
4.8 4.7 4.7 4.83.9
4.7 4.6 4.7 4.6
2.2 2.32.5 2.6
2.3
2.7 2.6 2.6 2.5
1.6 1.71.8 1.8
2.2
2.1 2.3 2.3 2.3
1.3 1.41.5
1.5
1.6
1.61.7 1.7 1.70.6 0.6
0.6 0.6
0.4
0.50.5 0.5 0.5
0.2 0.2
0.3 0.3
0.3
0.8
4.2
2.4
2.3
1.7
0.5
0.30.3 0.3 0.3 0.3
1990 1992 1994 1996 2009
0.7
4.4
2.6
1.9
1.4
0.5
0.3
1998 2000 2002 2004 2006 2008
CO
2 e
mis
sion
s
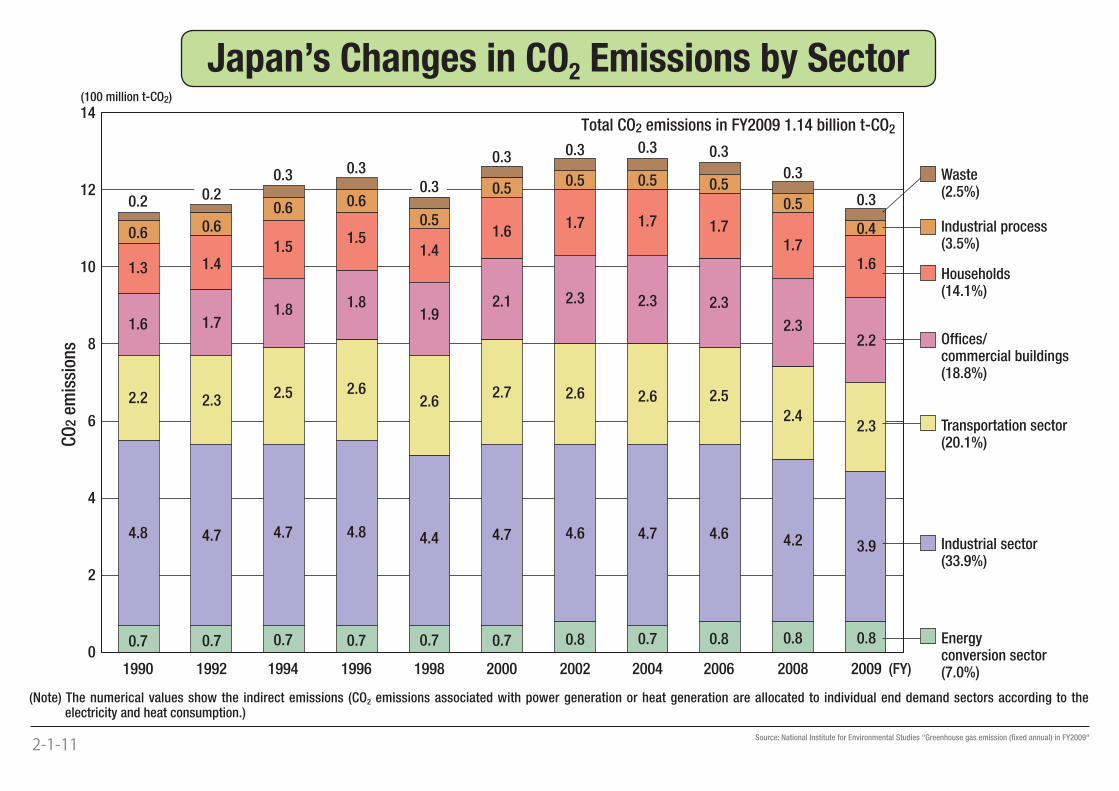
(100 million t-CO2)
(FY)
Waste(2.5%)
Industrial process(3.5%)
Households(14.1%)
Offices/commercial buildings(18.8%)
Transportation sector(20.1%)
Industrial sector(33.9%)
Energy conversion sector(7.0%)
Total CO2 emissions in FY2009 1.14 billion t-CO2
2-1-11 Source: National Institute for Environmental Studies "Greenhouse gas emission (fi xed annual) in FY2009"
(Note) The numerical values show the indirect emissions (CO2 emissions associated with power generation or heat generation are allocated to individual end demand sectors according to the electricity and heat consumption.)
Japan’s Changes in CO2 Emissions by Sector
0
800
1,000
1,200
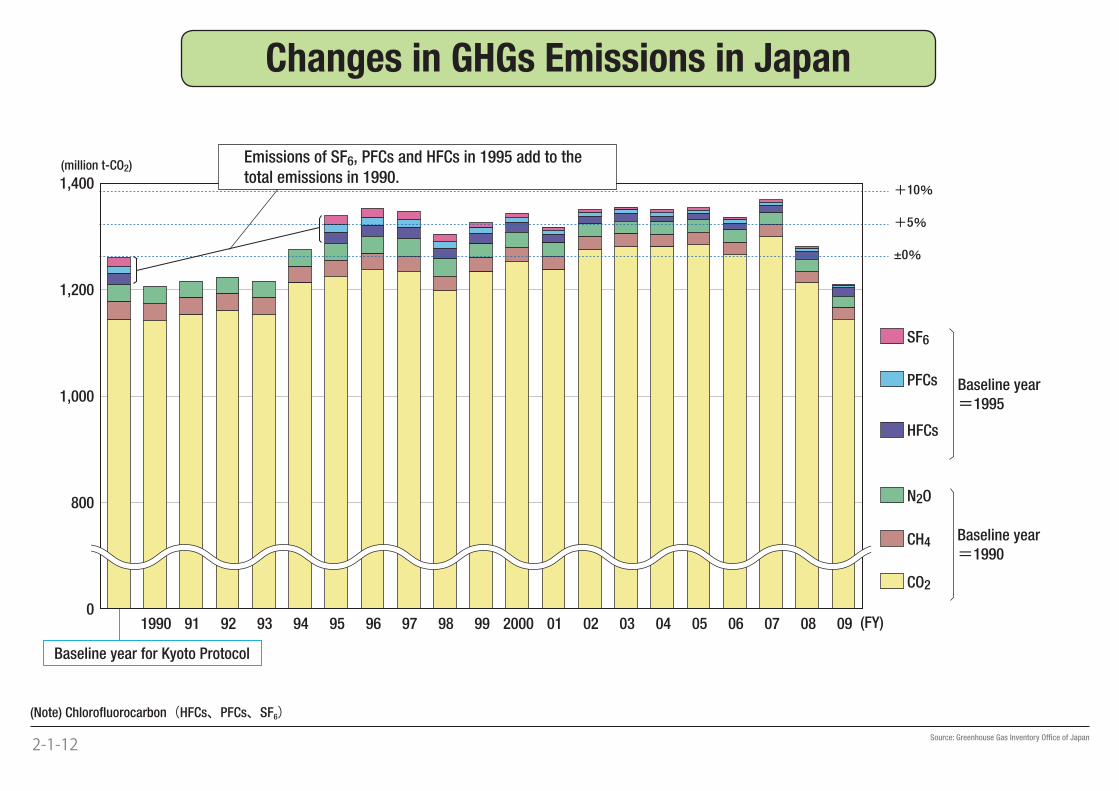
1,400(million t-CO2)
Baseline year for Kyoto Protocol
1990 91 92 93 94 95 96 97 98 99 2000 01 02 03 04 05 06 07 0908 (FY)
±0
5
10
Emissions of SF6, PFCs and HFCs in 1995 add to the
total emissions in 1990.
SF6
PFCs
HFCs
N2O
CH4
CO2
Baseline year
1995
Baseline year
1990
2-1-12 Source: Greenhouse Gas Inventory Offi ce of Japan
(Note) Chlorofl uorocarbon(HFCs、PFCs、SF6)
Changes in GHGs Emissions in Japan
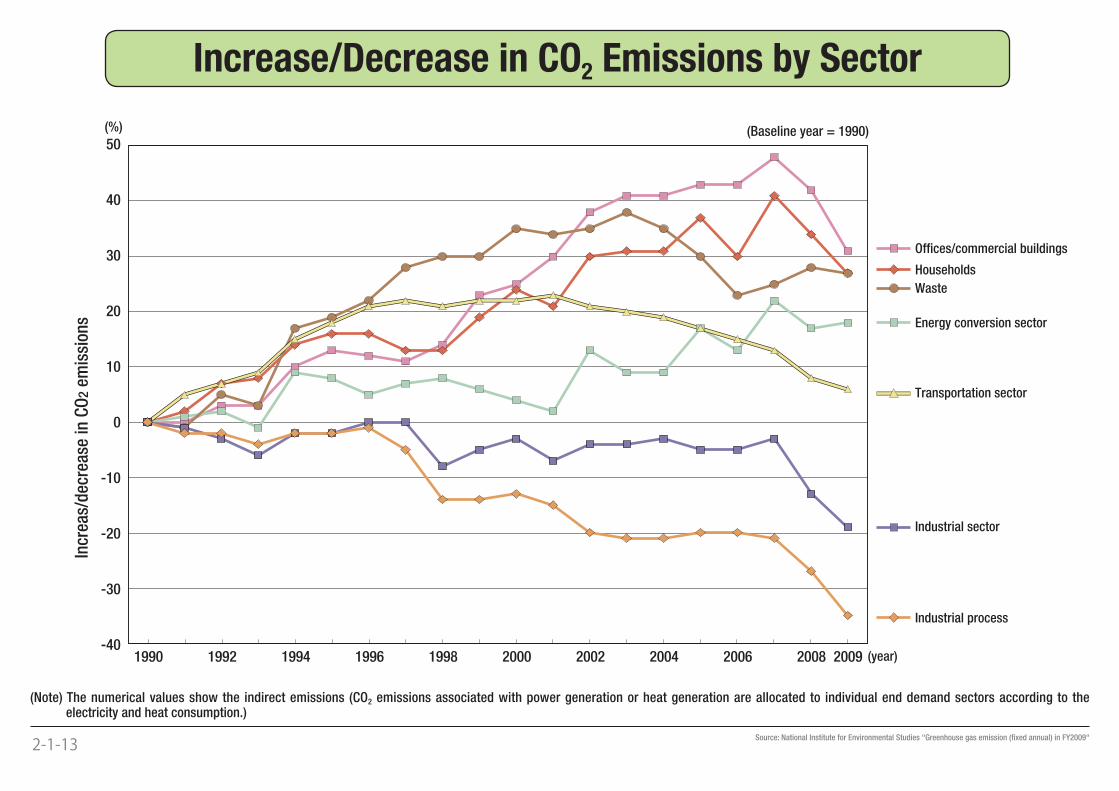
-20
-30
-40
-10
0
10
20
30
40
50(%)
1990 1992 1994 1996 1998 2000 2002 2004 2006 20092008
(Baseline year = 1990)
Incr
eas/
dec
reas
e in
CO
2 e
mis
sion
s
(year)
Energy conversion sector
Industrial sector
Transportation sector
Offices/commercial buildings
Households
Industrial process
Waste
2-1-13 Source: National Institute for Environmental Studies "Greenhouse gas emission (fi xed annual) in FY2009"
(Note) The numerical values show the indirect emissions (CO2 emissions associated with power generation or heat generation are allocated to individual end demand sectors according to the electricity and heat consumption.)
Increase/Decrease in CO2 Emissions by Sector
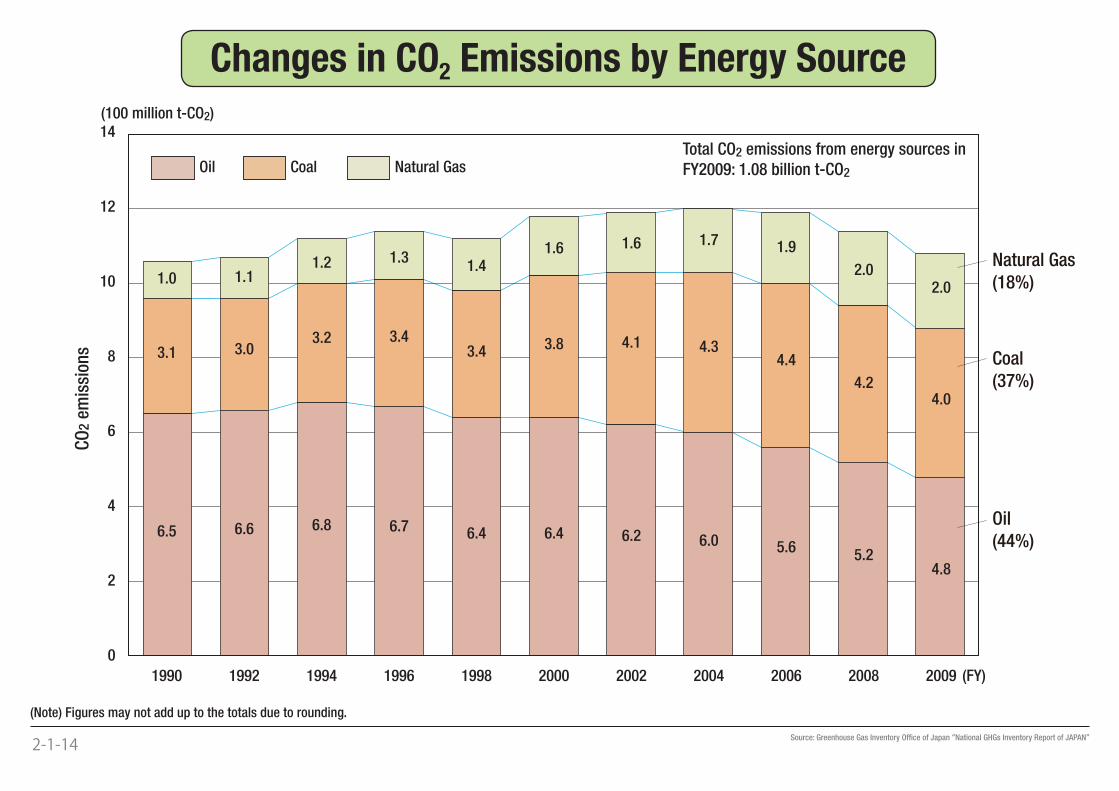
(FY)
6.5
3.1
1.0
6.6
3.0
1.1
6.8
3.2
1.2
6.7
3.4
1.3
6.4
3.4
1.4
6.4
3.8
1.6
6.2
4.1
1.6
6.0
4.3
1.7
5.6
4.4
1.9
4.8
4.0
2.0
5.2
4.2
2.0
0
1990 1992 1994 1996 1998 2000 2002 2004 2006 2008 2009
2
4
6
8
10
12
14(100 million t-CO2)
CO
2 e
mis
sion
s
Total CO2 emissions from energy sources in
FY2009: 1.08 billion t-CO2Coal Natural GasOil
Natural Gas
(18%)
Coal
(37%)
Oil
(44%)
2-1-14 Source: Greenhouse Gas Inventory Offi ce of Japan “National GHGs Inventory Report of JAPAN”
(Note) Figures may not add up to the totals due to rounding.
Changes in CO2 Emissions by Energy Source
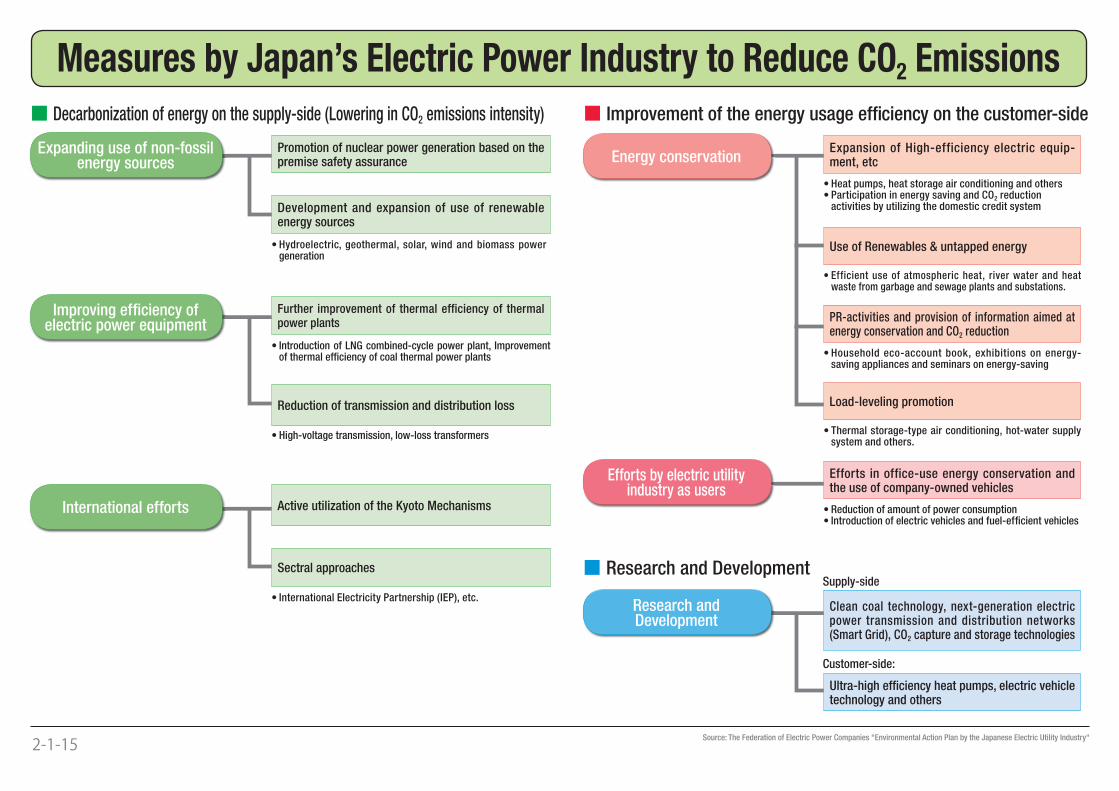
2-1-15
Source: The Federation of Electric Power Companies "Environmental Action Plan by the Japanese Electric Utility Industry"
Measures by Japan’s Electric Power Industry to Reduce CO2 Emissions
Expanding use of non-fossil energy sources
Improving effi ciency of electric power equipment
Energy conservation
Efforts by electric utilityindustry as users
Research andDevelopment
International efforts
Promotion of nuclear power generation based on the premise safety assurance
Further improvement of thermal efficiency of thermal power plants
Active utilization of the Kyoto Mechanisms
Development and expansion of use of renewable energy sources
Reduction of transmission and distribution loss
Sectral approaches
Ultra-high effi ciency heat pumps, electric vehicle technology and others
• Hydroelectric, geothermal, solar, wind and biomass power generation
• Introduction of LNG combined-cycle power plant, Improvement of thermal effi ciency of coal thermal power plants
Expansion of High-efficiency electric equip-ment, etc
• Heat pumps, heat storage air conditioning and others• Participation in energy saving and CO2 reduction
activities by utilizing the domestic credit system
Efforts in office-use energy conservation and the use of company-owned vehicles
• Reduction of amount of power consumption• Introduction of electric vehicles and fuel-effi cient vehicles
Clean coal technology, next-generation electric power transmission and distribution networks (Smart Grid), CO2 capture and storage technologies
Use of Renewables & untapped energy
• Efficient use of atmospheric heat, river water and heat waste from garbage and sewage plants and substations.
PR-activities and provision of information aimed at energy conservation and CO2 reduction
• Household eco-account book, exhibitions on energy-saving appliances and seminars on energy-saving
Load-leveling promotion
• Thermal storage-type air conditioning, hot-water supply system and others.
• High-voltage transmission, low-loss transformers
• International Electricity Partnership (IEP), etc.
■ Decarbonization of energy on the supply-side (Lowering in CO2 emissions intensity) ■ Improvement of the energy usage effi ciency on the customer-side
■ Research and DevelopmentSupply-side
Customer-side:
0
0.2
0.4
0.6 9
6
3
0
0.8
0
250
500
750
1,000
1975 1980 1985 1990 1995 2000 2005 2010 2015
0.413
0.350
288.2
3.17
906.0
3.74
(FY)
(kg-CO2/kWh)
CO
2 e
mis
sion
s in
ten
sity
CO
2 e
mis
sion
s
(billion t-CO2)
The 1st commitment period
of the Kyoto Protocol
approx.0.34kg-CO2/kWh
reduction for the
average of 5 years
Electric power consumption
CO2 emissions
CO2 emissions intesity
Nuclear power production
(TWh)
Nu
clea
r p
ower
pro
du
ctio
n/E
lect
ric
pow
er c
onsu
mp
tion
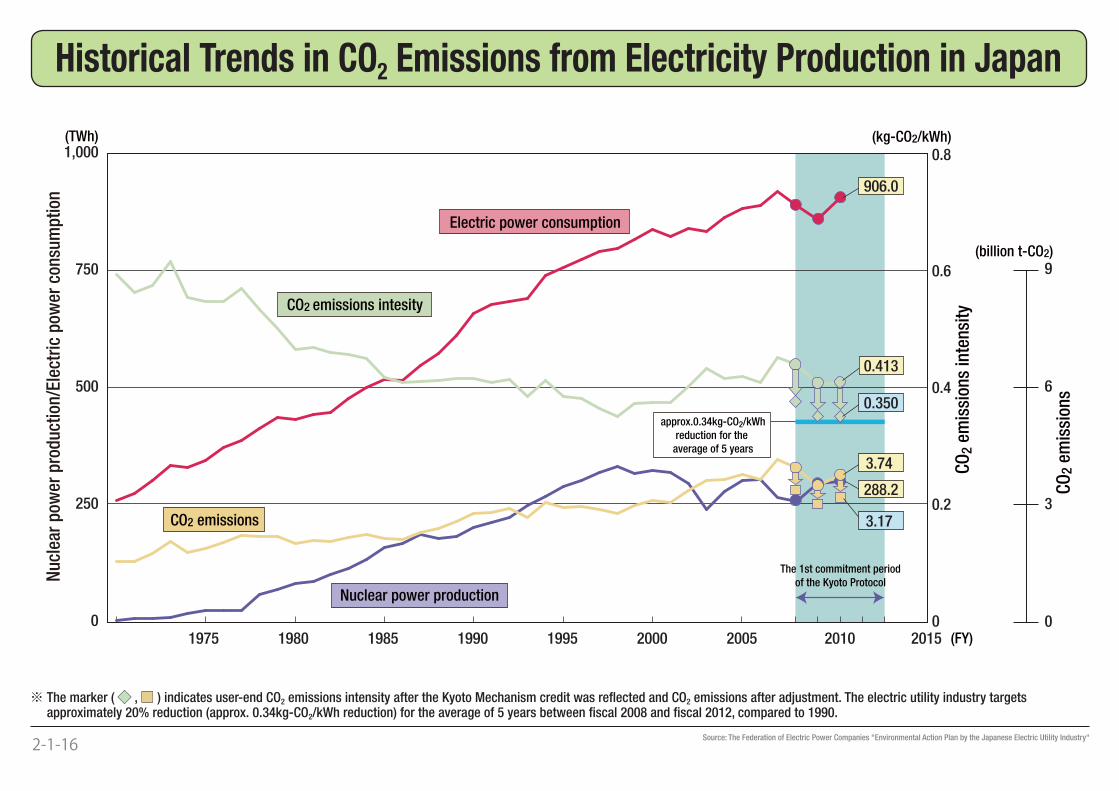
2-1-16 Source: The Federation of Electric Power Companies "Environmental Action Plan by the Japanese Electric Utility Industry"
※ The marker (◆◆ , ■■ ) indicates user-end CO2 emissions intensity after the Kyoto Mechanism credit was refl ected and CO2 emissions after adjustment. The electric utility industry targets approximately 20% reduction (approx. 0.34kg-CO2/kWh reduction) for the average of 5 years between fi scal 2008 and fi scal 2012, compared to 1990.
Historical Trends in CO2 Emissions from Electricity Production in Japan
0
10
20
30
40
50
60
(%)
(FY)2000 2005 2010 199519901985198019751970196519601955
5.2 (2012)
44.9 (2010)48.6
51.8
55.6 (1999)
59 (2007)
Gross thermal efficiency
maximum designed value
Transmission and distribution loss rate
Gross thermal efficiency (actual average)
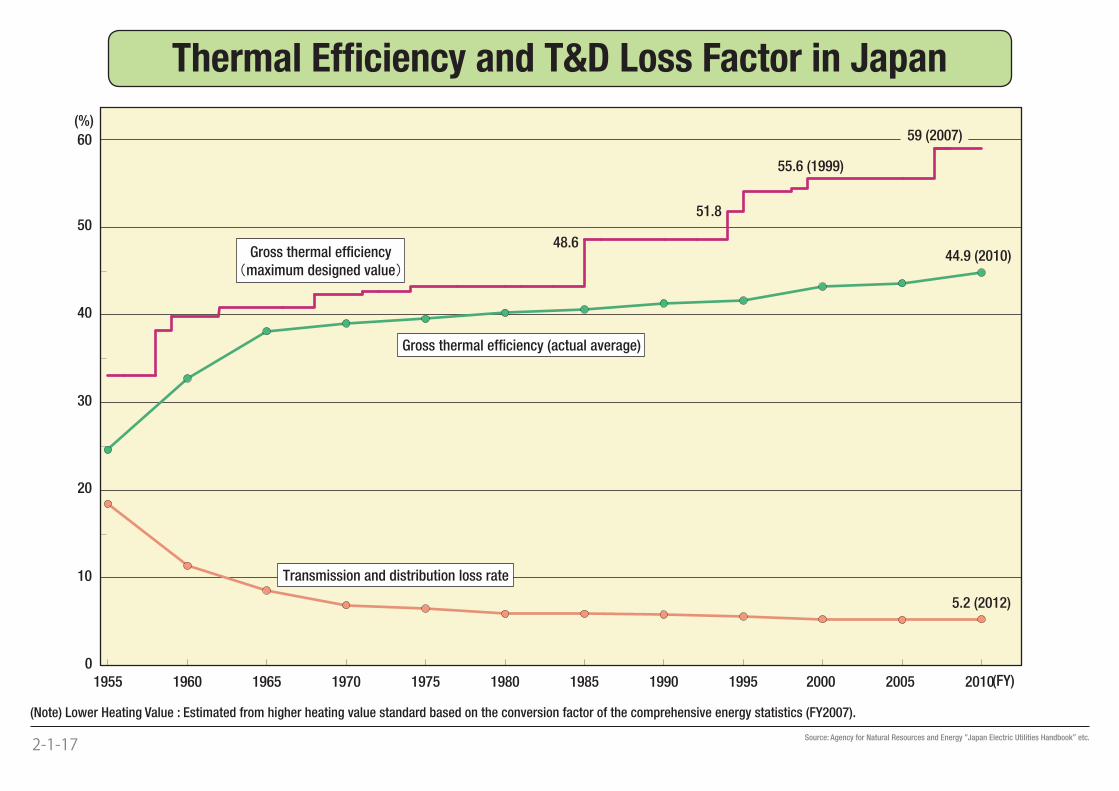
2-1-17 Source: Agency for Natural Resources and Energy “Japan Electric Utilities Handbook” etc.
(Note) Lower Heating Value : Estimated from higher heating value standard based on the conversion factor of the comprehensive energy statistics (FY2007).
Thermal Effi ciency and T&D Loss Factor in Japan
0.090.17
0.430.390.470.45
0.52
0.80
0.97
0
0.2
0.4
0.6
0.8
1.2
1.0
11
60
8
271
37
16 12
76
15 17 19 23 202 2
2
3
2
73
6
15 41
0
20
40
60
80
100
(%)
CO
2 e
mis
sion
s in
ten
sity
Bra
ekd
own
of
Non
-fos
sil-
fuel
Gen
erat
ion
France Canada Japan Italy U.K. Germany U.S.A. China India
Hydroelectric
Nuclear
Renewables
(kg-CO2/kWh)
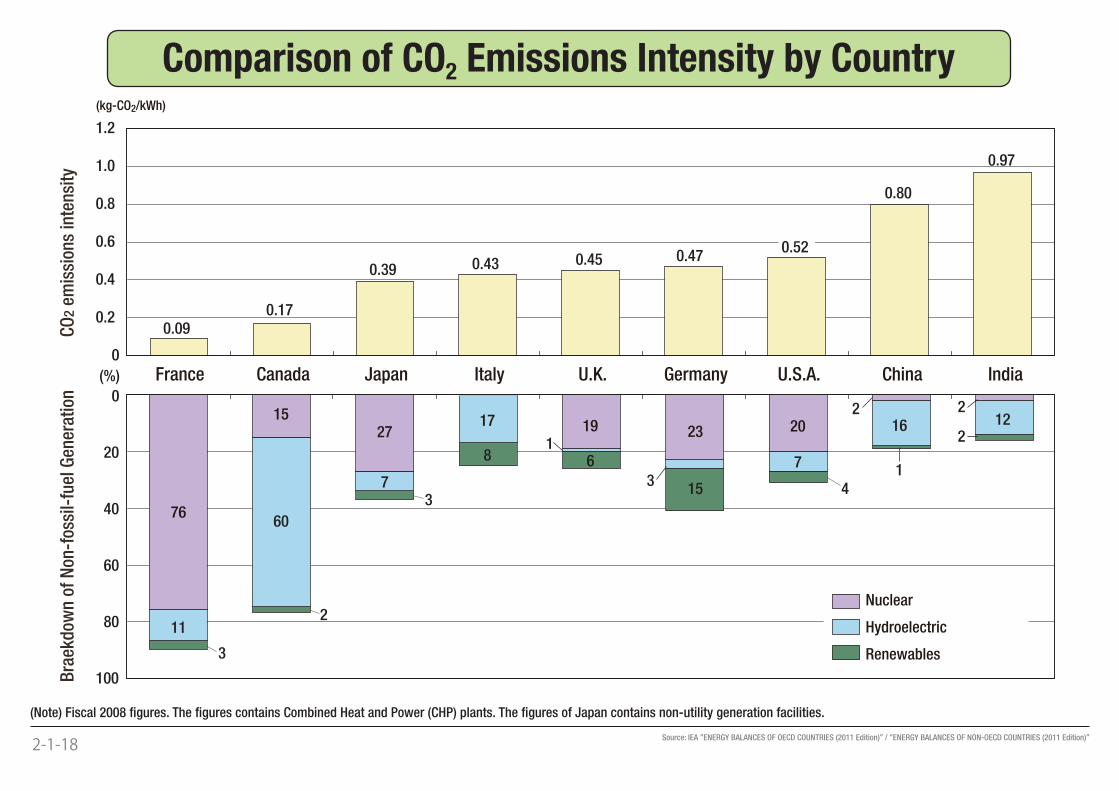
2-1-18 Source: IEA “ENERGY BALANCES OF OECD COUNTRIES (2011 Edition)” / “ENERGY BALANCES OF NON-OECD COUNTRIES (2011 Edition)”
(Note) Fiscal 2008 fi gures. The fi gures contains Combined Heat and Power (CHP) plants. The fi gures of Japan contains non-utility generation facilities.
Comparison of CO2 Emissions Intensity by Country
0
0.5
1.0
1.5
2.0
2.5
3.0
3.5
4.0(g/kWh)
U.S.A.(2005)
Canada(2005)
U.K.(2005)
France(2005)
Germany(2005)
Italy(2005)
Japan(2010) (year)
SOx: sulfur oxides
NOx: nitrogen oxides
3.3
1.2
3.4
1.6
1.4 1.4
3.13.2
0.70.8 0.8
0.6
0.2 0.2
※
Em
issi
ons
(Thermal Power Plant)
2-2-2
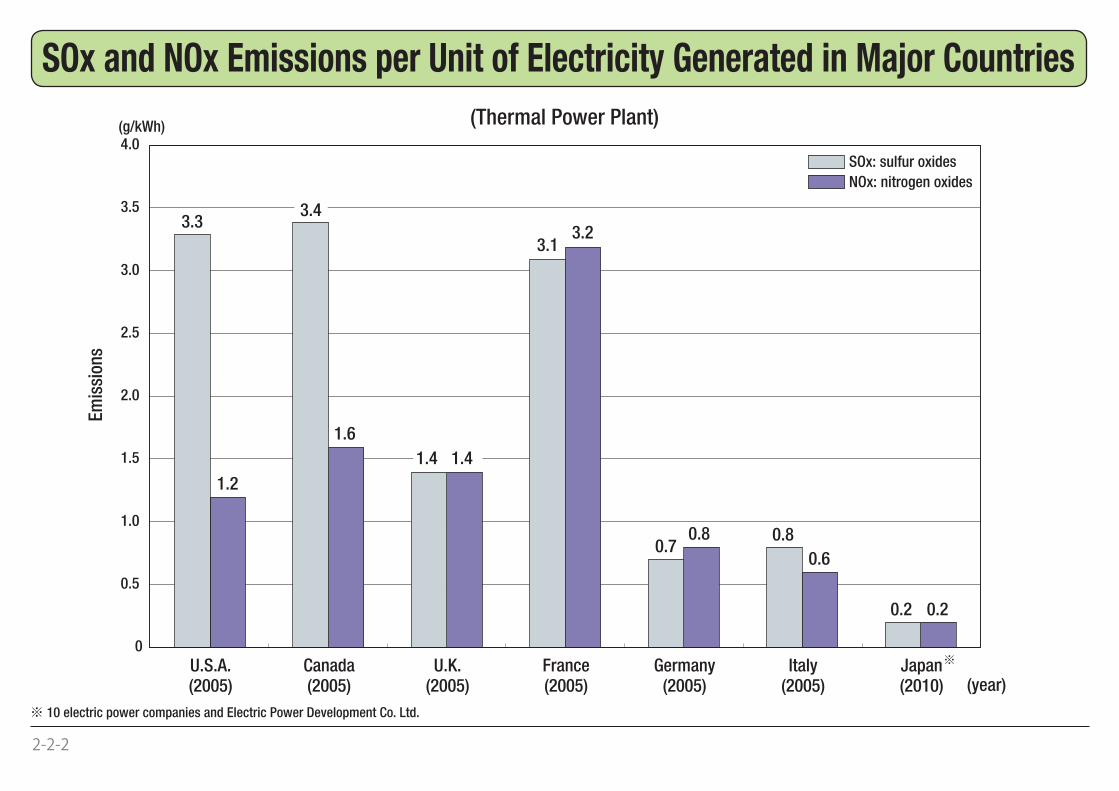
※ 10 electric power companies and Electric Power Development Co. Ltd.
SOx and NOx Emissions per Unit of Electricity Generated in Major Countries
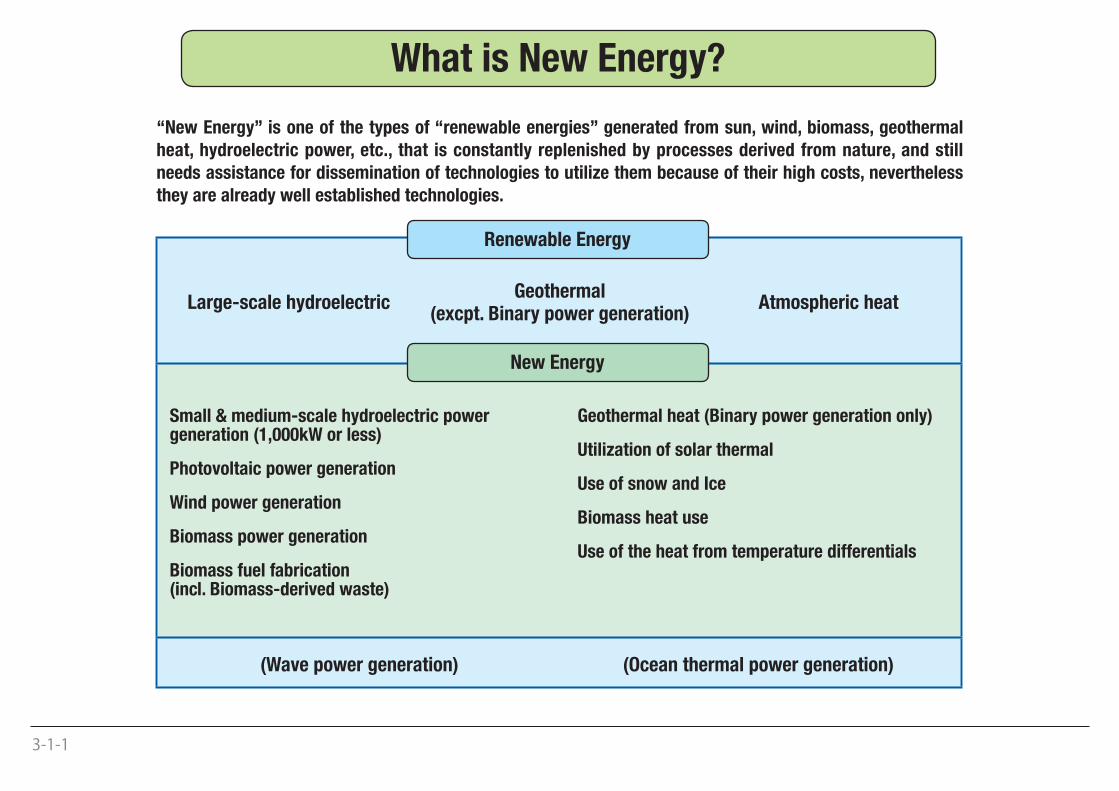
“New Energy” is one of the types of “renewable energies” generated from sun, wind, biomass, geothermal
heat, hydroelectric power, etc., that is constantly replenished by processes derived from nature, and still
needs assistance for dissemination of technologies to utilize them because of their high costs, nevertheless
they are already well established technologies.
Renewable Energy
New Energy
Large-scale hydroelectricGeothermal
(excpt. Binary power generation)Atmospheric heat
(Wave power generation) (Ocean thermal power generation)
Small & medium-scale hydroelectric powergeneration (1,000kW or less)
Photovoltaic power generation
Wind power generation
Biomass power generation
Biomass fuel fabrication(incl. Biomass-derived waste)
Geothermal heat (Binary power generation only)
Utilization of solar thermal
Use of snow and Ice
Biomass heat use
Use of the heat from temperature differentials
3-1-1
What is New Energy?
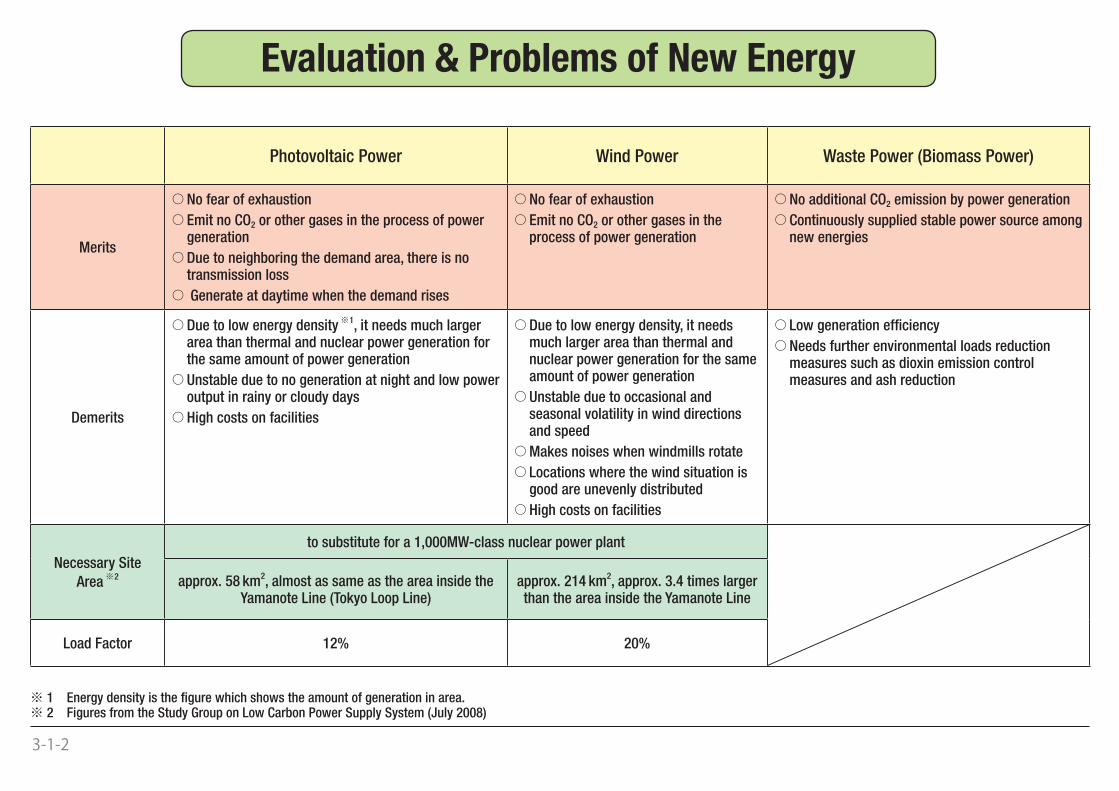
Photovoltaic Power Wind Power Waste Power (Biomass Power)
Merits
○ No fear of exhaustion
○ Emit no CO2 or other gases in the process of power generation
○ Due to neighboring the demand area, there is no transmission loss
○ Generate at daytime when the demand rises
○ No fear of exhaustion
○ Emit no CO2 or other gases in the process of power generation
○ No additional CO2 emission by power generation
○ Continuously supplied stable power source among new energies
Demerits
○ Due to low energy density※ 1, it needs much larger area than thermal and nuclear power generation for the same amount of power generation
○ Unstable due to no generation at night and low power output in rainy or cloudy days
○ High costs on facilities
○ Due to low energy density, it needs much larger area than thermal and nuclear power generation for the same amount of power generation
○ Unstable due to occasional and seasonal volatility in wind directions and speed
○ Makes noises when windmills rotate
○ Locations where the wind situation is good are unevenly distributed
○ High costs on facilities
○ Low generation effi ciency
○ Needs further environmental loads reduction measures such as dioxin emission control measures and ash reduction
Necessary Site
Area※ 2
to substitute for a 1,000MW-class nuclear power plant
approx. 58 km2, almost as same as the area inside the Yamanote Line (Tokyo Loop Line)
approx. 214 km2, approx. 3.4 times larger than the area inside the Yamanote Line
Load Factor 12% 20%
3-1-2
※ 1 Energy density is the fi gure which shows the amount of generation in area.※ 2 Figures from the Study Group on Low Carbon Power Supply System (July 2008)
Evaluation & Problems of New Energy
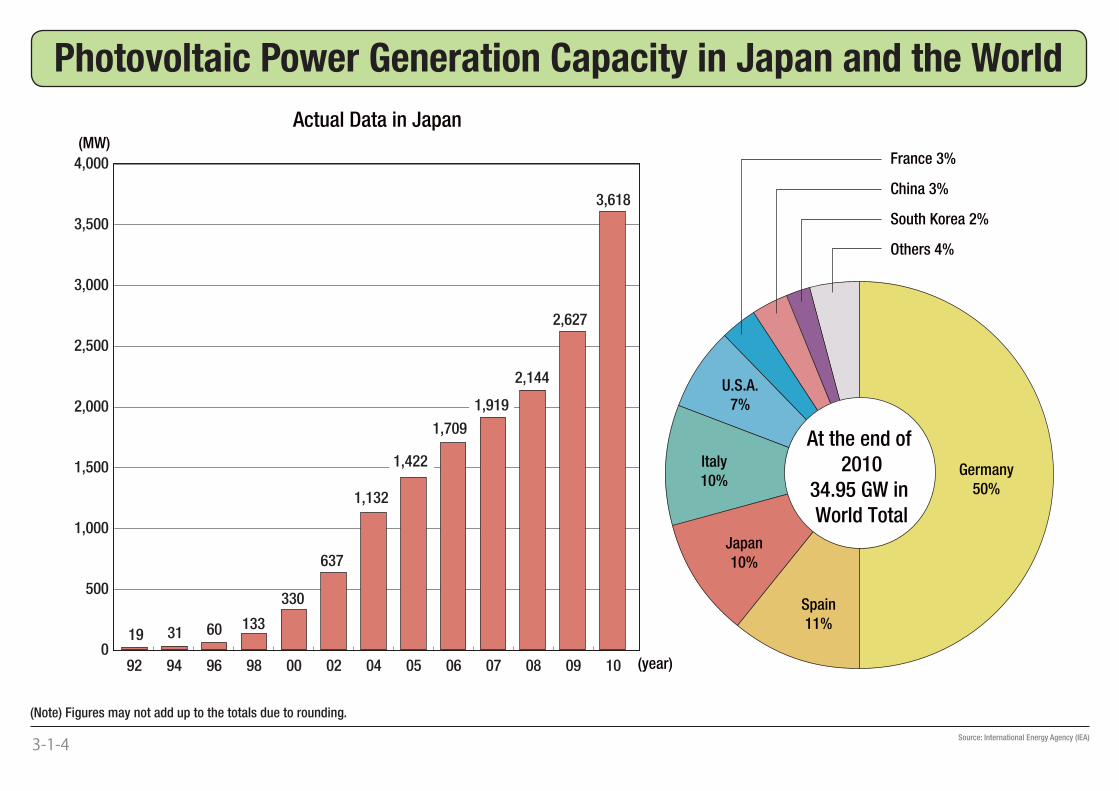
0
500
1,000
1,500
2,000
4,000
3,500
3,000
2,500
92 94 96 98 00 02 04 05 06 07 100908
19 31 60 133
330
637
1,132
1,422
1,709
1,919
3,618
2,627
2,144
Germany
50%
Spain
11%
Japan
10%
U.S.A.
7%
China 3%
France 3%
Italy
10%
South Korea 2%
Others 4%
At the end of
2010
34.95 GW in
World Total
(year)
Actual Data in Japan(MW)
3-1-4 Source: International Energy Agency (IEA)
(Note) Figures may not add up to the totals due to rounding.
Photovoltaic Power Generation Capacity in Japan and the World
0
500
1,000
1,500
2,500
2,000
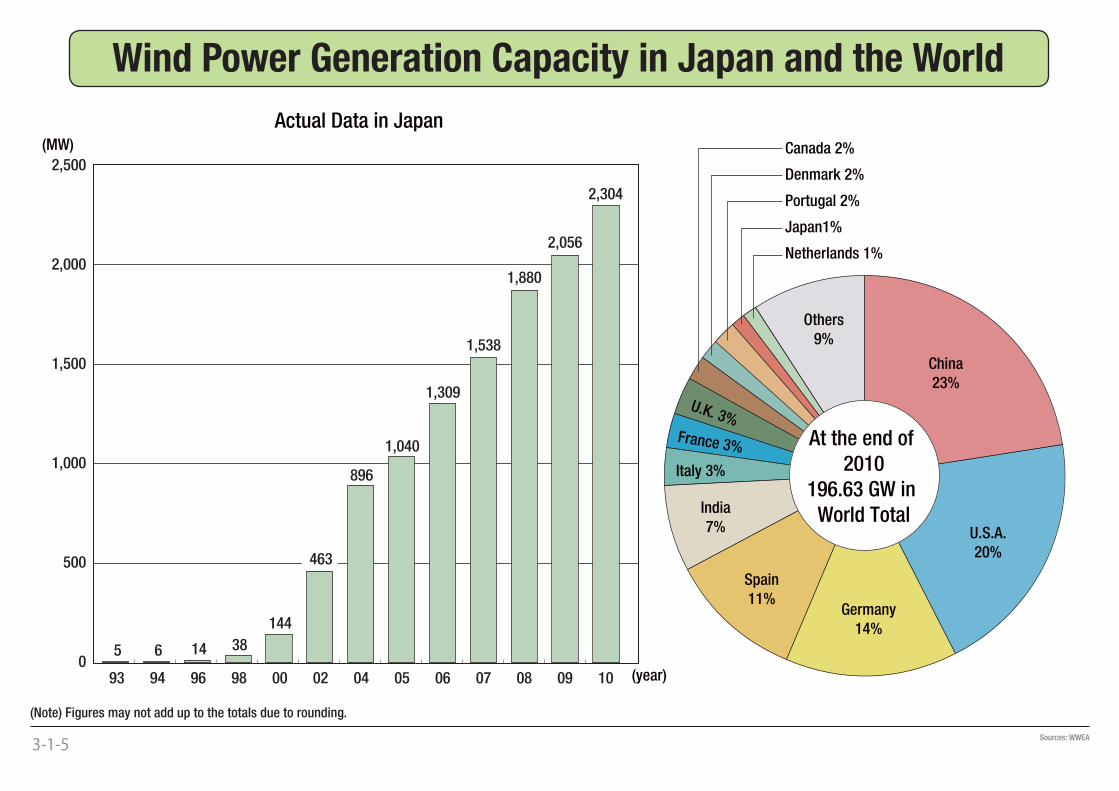
93 94 96 98 00 02 04 05 06 07 100908
5 6 14 38
144
463
896
1,040
1,309
1,538
2,304
2,056
1,880
U.S.A.
20%
Germany
14%
Spain
11%
China
23%
India
7%
Italy 3%
France 3%
U.K. 3%
Denmark 2%
Portugal 2%
Canada 2%
Netherlands 1%
Japan1%
Others
9%
At the end of
2010
196.63 GW in
World Total
(MW)
Actual Data in Japan
(year)
3-1-5 Sources: WWEA
(Note) Figures may not add up to the totals due to rounding.
Wind Power Generation Capacity in Japan and the World
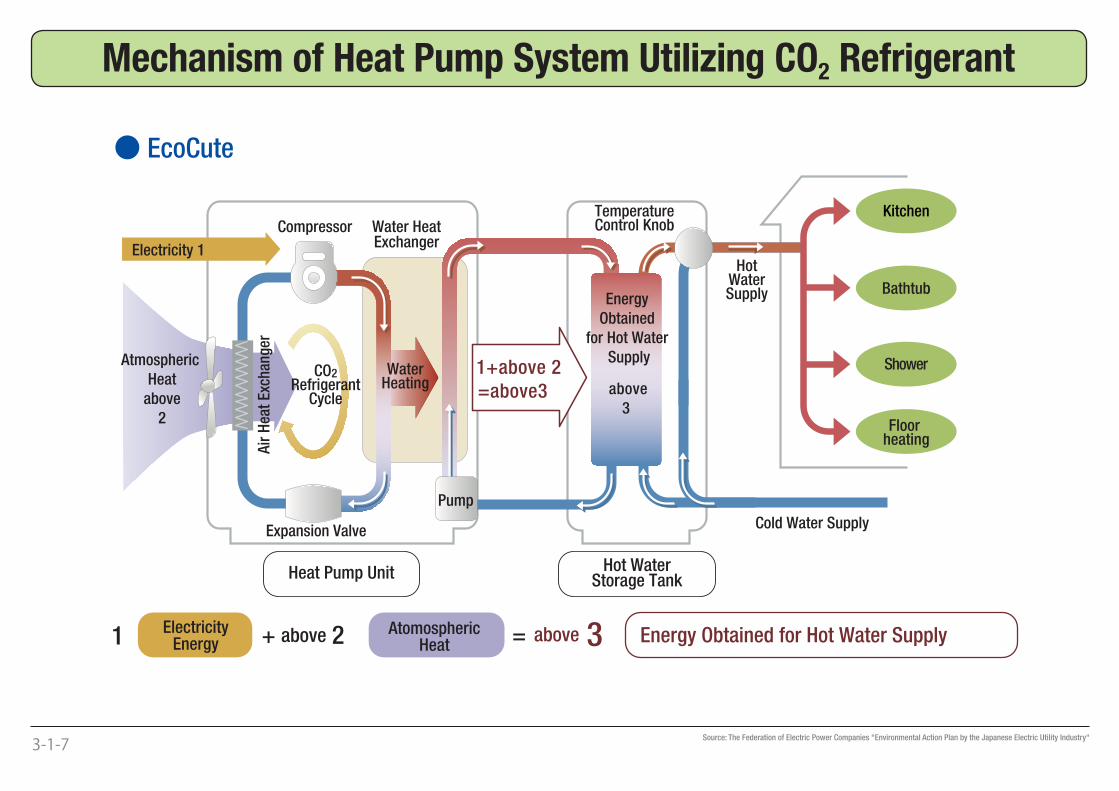
Water HeatExchanger
Cold Water Supply
Compressor
CO2Refrigerant
Cycle
Expansion Valve
Pump
Electricity 1
Bathtub
Shower
Floor heating
Heat Pump Unit
1+above 2
=above3
= above 3+ above 2
TemperatureControl Knob
HotWaterSupply
above
3
ElectricityEnergy
AtomosphericHeat1 Energy Obtained for Hot Water Supply
WaterHeating
Atmospheric
Heat
above
2
Air
Hea
t E
xch
ang
er
Kitchen
Energy
Obtained
for Hot Water
Supply
Hot WaterStorage Tank
● EcoCute
3-1-7
Source: The Federation of Electric Power Companies "Environmental Action Plan by the Japanese Electric Utility Industry"
Mechanism of Heat Pump System Utilizing CO2 Refrigerant
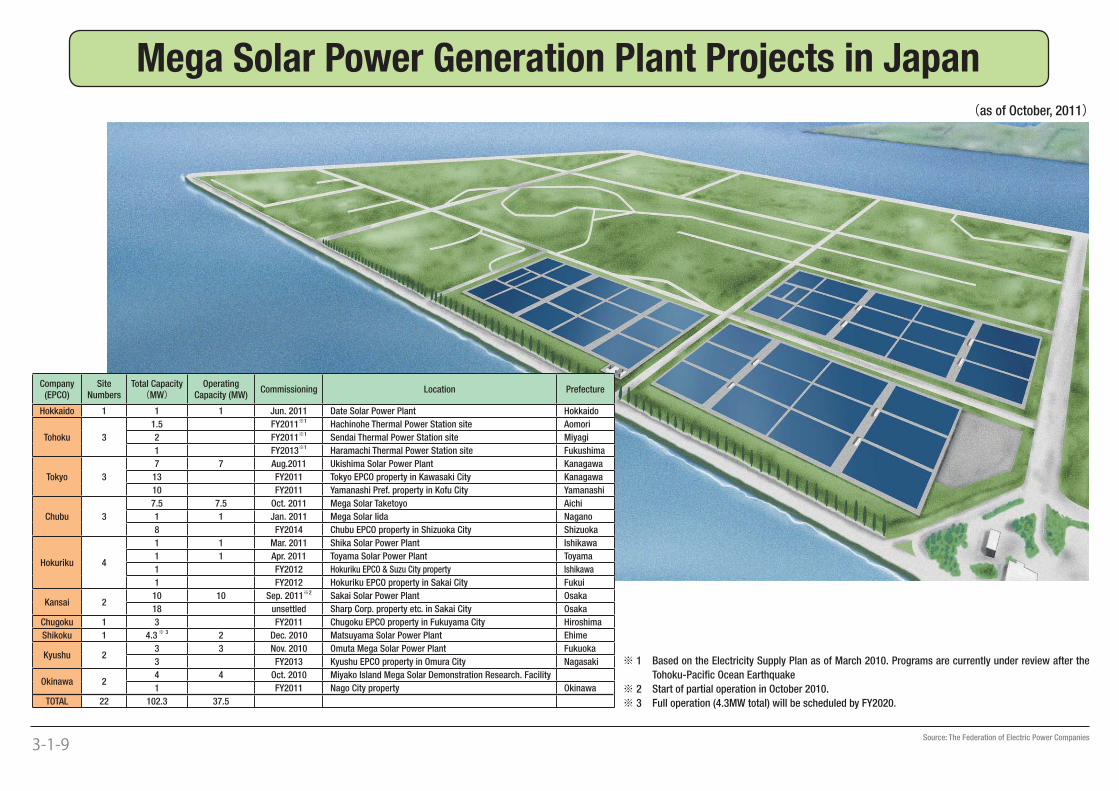
(as of October, 2011)
3-1-9
Mega Solar Power Generation Plant Projects in Japan
Source: The Federation of Electric Power Companies
※ 1 Based on the Electricity Supply Plan as of March 2010. Programs are currently under review after the
Tohoku-Pacifi c Ocean Earthquake
※ 2 Start of partial operation in October 2010.
※ 3 Full operation (4.3MW total) will be scheduled by FY2020.
Company (EPCO)
Site Numbers
Total Capacity (MW)
Operating Capacity (MW)
Commissioning Location Prefecture
Hokkaido 1 1 1 Jun. 2011 Date Solar Power Plant Hokkaido
Tohoku 3
1.5 FY2011※1 Hachinohe Thermal Power Station site Aomori
2 FY2011※1 Sendai Thermal Power Station site Miyagi
1 FY2013※1 Haramachi Thermal Power Station site Fukushima
Tokyo 3
7 7 Aug.2011 Ukishima Solar Power Plant Kanagawa
13 FY2011 Tokyo EPCO property in Kawasaki City Kanagawa
10 FY2011 Yamanashi Pref. property in Kofu City Yamanashi
Chubu 3
7.5 7.5 Oct. 2011 Mega Solar Taketoyo Aichi
1 1 Jan. 2011 Mega Solar Iida Nagano
8 FY2014 Chubu EPCO property in Shizuoka City Shizuoka
Hokuriku 4
1 1 Mar. 2011 Shika Solar Power Plant Ishikawa
1 1 Apr. 2011 Toyama Solar Power Plant Toyama
1 FY2012 Hokuriku EPCO & Suzu City property Ishikawa
1 FY2012 Hokuriku EPCO property in Sakai City Fukui
Kansai 210 10 Sep. 2011※2 Sakai Solar Power Plant Osaka
18 unsettled Sharp Corp. property etc. in Sakai City Osaka
Chugoku 1 3 FY2011 Chugoku EPCO property in Fukuyama City Hiroshima
Shikoku 1 4.3※ 3 2 Dec. 2010 Matsuyama Solar Power Plant Ehime
Kyushu 23 3 Nov. 2010 Omuta Mega Solar Power Plant Fukuoka
3 FY2013 Kyushu EPCO property in Omura City Nagasaki
Okinawa 24 4 Oct. 2010 Miyako Island Mega Solar Demonstration Research. Facility
1 FY2011 Nago City property Okinawa
TOTAL 22 102.3 37.5
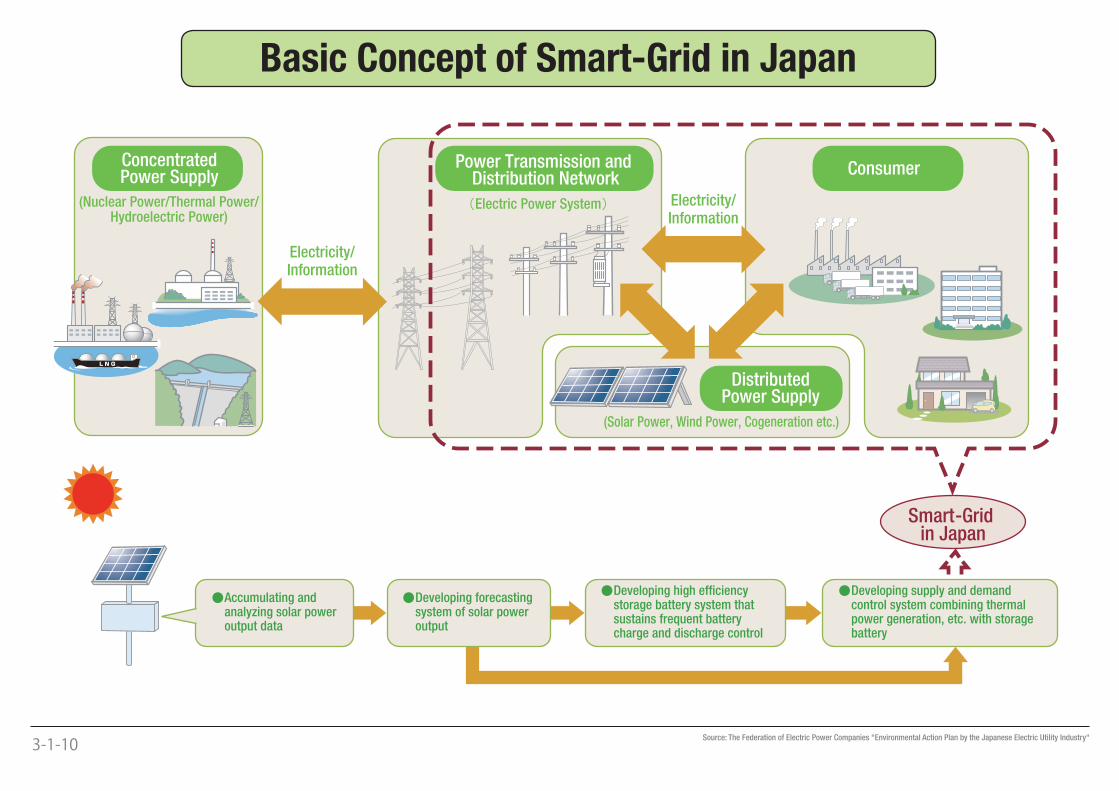
Electricity/Information
Electric Power System(Nuclear Power/Thermal Power/Hydroelectric Power)
(Solar Power, Wind Power, Cogeneration etc.)
Electricity/Information
ConcentratedPower Supply ConsumerPower Transmission and
Distribution Network
DistributedPower Supply
Accumulating and analyzing solar power output data
Developing forecasting system of solar power output
Developing supply and demand control system combining thermal power generation, etc. with storage battery
Developing high efficiency storage battery system that sustains frequent battery charge and discharge control
Smart-Grid in Japan
3-1-10
Source: The Federation of Electric Power Companies "Environmental Action Plan by the Japanese Electric Utility Industry"
Basic Concept of Smart-Grid in Japan
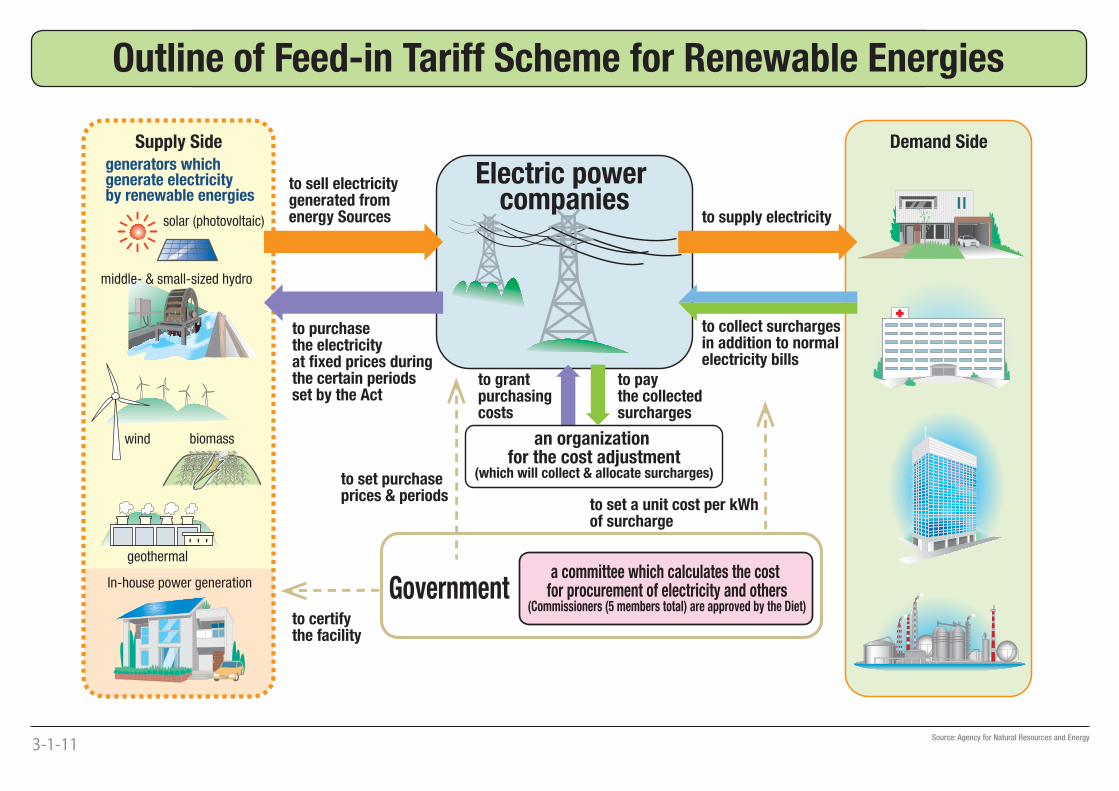
generators which generate electricity by renewable energies
geothermal
In-house power generation
to sell electricity generated from energy Sources
to purchase the electricity at fixed prices during the certain periods set by the Act
to set purchase prices & periods
to certify the facility
Electric power companies
to pay the collected surcharges
to supply electricity
to grant purchasing costs
to collect surcharges in addition to normal electricity bills
to set a unit cost per kWh of surcharge
solar (photovoltaic)
middle- & small-sized hydro
wind biomass
Government
an organization for the cost adjustment
(which will collect & allocate surcharges)
Supply Side Demand Side
a committee which calculates the cost for procurement of electricity and others
(Commissioners (5 members total) are approved by the Diet)
�
3-1-11
Source: Agency for Natural Resources and Energy
Outline of Feed-in Tariff Scheme for Renewable Energies
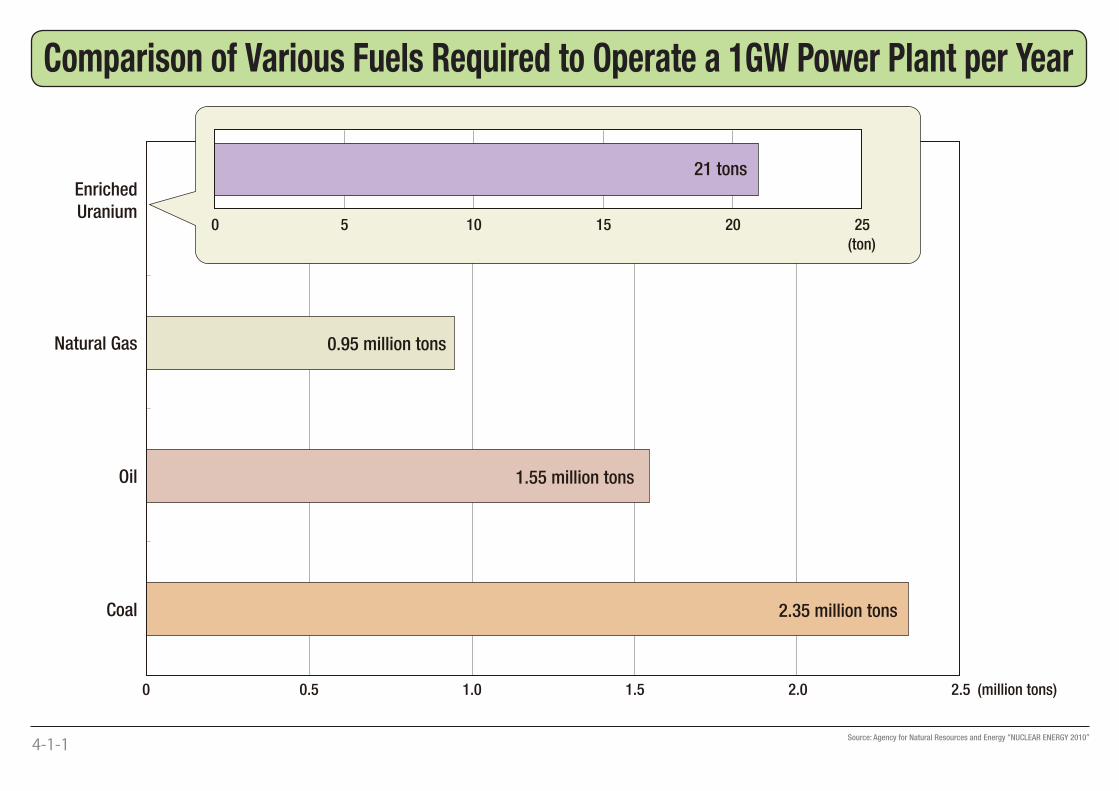
2.35 million tons
1.55 million tons
0.95 million tons
0 0.5 1.0 1.5 2.0 2.5 (million tons)
Coal
Oil
Natural Gas
Enriched
Uranium
21 tons
0 5 10 15 20 25
(ton)
4-1-1
Source: Agency for Natural Resources and Energy “NUCLEAR ENERGY 2010”
Comparison of Various Fuels Required to Operate a 1GW Power Plant per Year
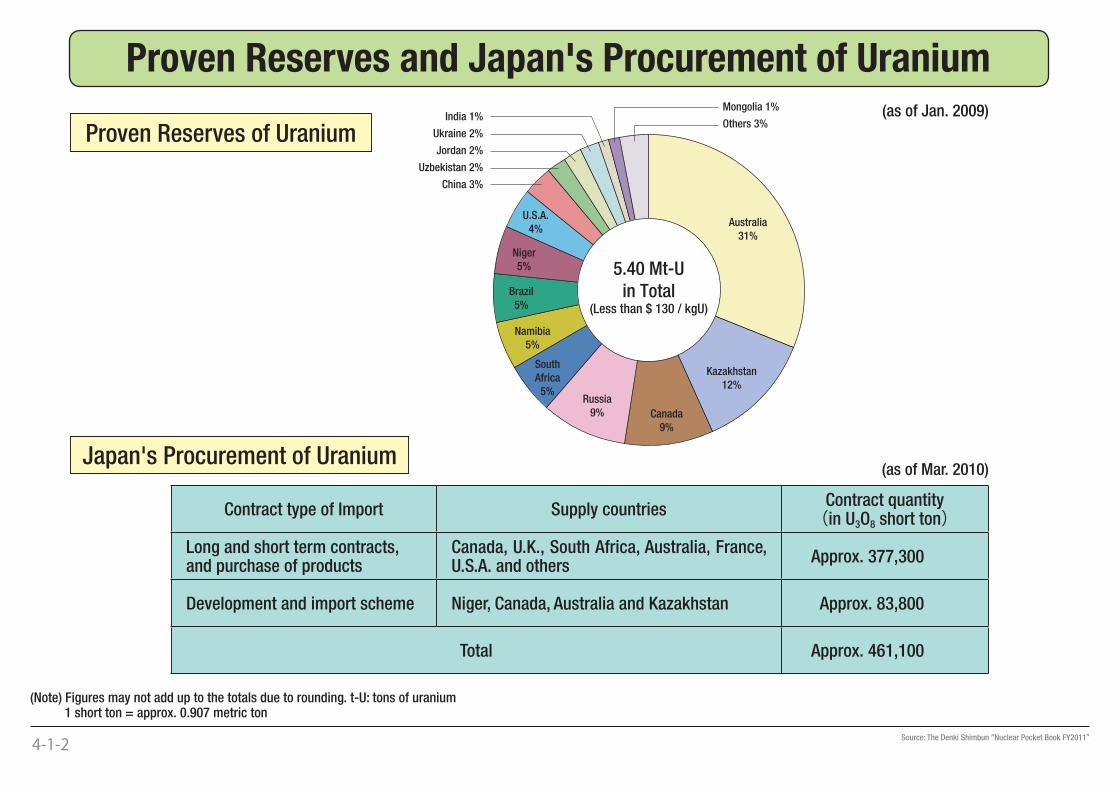
Australia
31%
Kazakhstan
12%
Russia
9%
South
Africa
5%
Canada
9%
U.S.A.
4%
Brazil
5%
Namibia
5%
Niger
5%
Mongolia 1%
Others 3%
5.40 Mt-U
in Total(Less than $ 130 / kgU)
India 1%
Ukraine 2%
Jordan 2%
Uzbekistan 2%
China 3%
Proven Reserves of Uranium
Japan's Procurement of Uranium
Contract type of Import Supply countriesContract quantity(in U3O8 short ton)
Long and short term contracts,and purchase of products
Canada, U.K., South Africa, Australia, France, U.S.A. and others
Approx. 377,300
Development and import scheme Niger, Canada, Australia and Kazakhstan Approx. 83,800
Total Approx. 461,100
(as of Mar. 2010)
(as of Jan. 2009)
4-1-2 Source: The Denki Shimbun “Nuclear Pocket Book FY2011”
(Note) Figures may not add up to the totals due to rounding. t-U: tons of uranium 1 short ton = approx. 0.907 metric ton
Proven Reserves and Japan's Procurement of Uranium
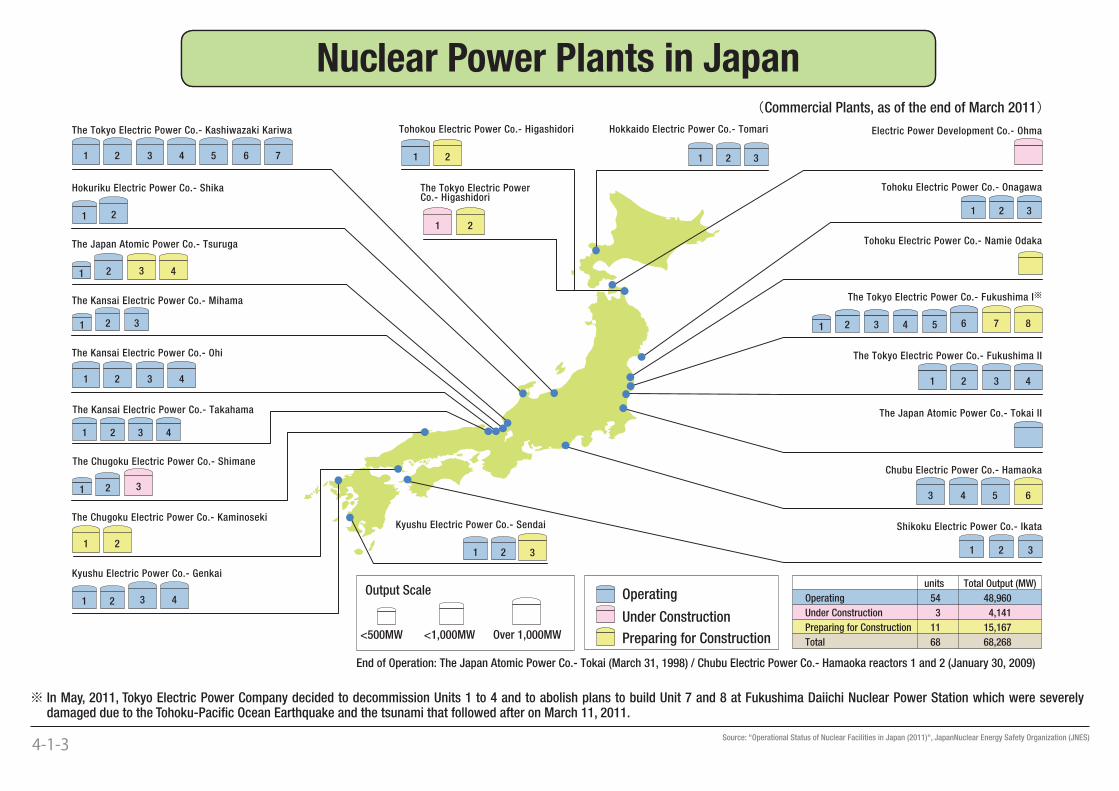
Output Scale
Over 1,000MW<1,000MW<500MW Preparing for Construction
Under Construction
Operating
68,26868Total
15,16711Preparing for Construction
4,1413Under Construction
48,96054Operating
Total Output (MW)units
End of Operation: The Japan Atomic Power Co.- Tokai (March 31, 1998) / Chubu Electric Power Co.- Hamaoka reactors 1 and 2 (January 30, 2009)
1 2
The Tokyo Electric Power Co.- Kashiwazaki Kariwa
Hokuriku Electric Power Co.- Shika
The Japan Atomic Power Co.- Tsuruga
The Kansai Electric Power Co.- Mihama
The Kansai Electric Power Co.- Ohi
The Chugoku Electric Power Co.- Kaminoseki
Kyushu Electric Power Co.- Genkai
Tohokou Electric Power Co.- Higashidori Hokkaido Electric Power Co.- Tomari
The Tokyo Electric PowerCo.- Higashidori
Kyushu Electric Power Co.- Sendai
Electric Power Development Co.- Ohma
Tohoku Electric Power Co.- Onagawa
Tohoku Electric Power Co.- Namie Odaka
The Tokyo Electric Power Co.- Fukushima I
The Tokyo Electric Power Co.- Fukushima II
The Japan Atomic Power Co.- Tokai II
Chubu Electric Power Co.- Hamaoka
Shikoku Electric Power Co.- Ikata
1 2 1 2 3
3 4 5
2 3 41
6 7 83 4 51 2
31 2
1 2
1 2
2 3 41 5 6 7
21
2 3 41
31 2
2 3 41
The Kansai Electric Power Co.- Takahama
3 41 2
The Chugoku Electric Power Co.- Shimane
1 2 3
21
1 2 3 4
6
Commercial Plants, as of the end of March 2011
3
3
�
4-1-3
Nuclear Power Plants in Japan
Source: "Operational Status of Nuclear Facilities in Japan (2011)", JapanNuclear Energy Safety Organization (JNES)
※ In May, 2011, Tokyo Electric Power Company decided to decommission Units 1 to 4 and to abolish plans to build Unit 7 and 8 at Fukushima Daiichi Nuclear Power Station which were severely damaged due to the Tohoku-Pacifi c Ocean Earthquake and the tsunami that followed after on March 11, 2011.
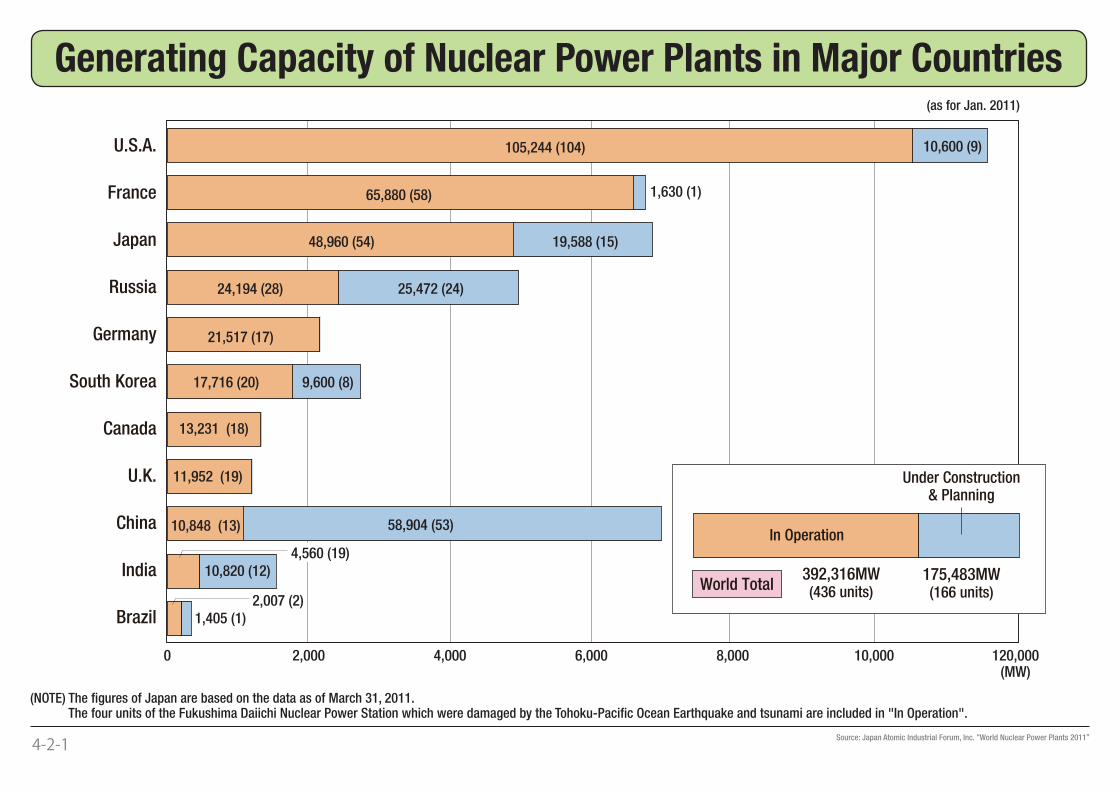
4,560 (19)
10,848 (13)
11,952 (19)
13,231 (18)
17,716 (20)
21,517 (17)
24,194 (28)
48,960 (54)
65,880 (58)
105,244 (104)
10,820 (12)
0 2,000 4,000 6,000 8,000 10,000 120,000(MW)
58,904 (53)
1,405 (1)
9,600 (8)
25,472 (24)
19,588 (15)
1,630 (1)
10,600 (9)
2,007 (2)
India
China
U.K.
Canada
Brazil
South Korea
Germany
Russia
Japan
France
U.S.A.
392,316MW(436 units)
In Operation
Under Construction& Planning
175,483MW(166 units)
World Total
(as for Jan. 2011)
4-2-1
(NOTE) The fi gures of Japan are based on the data as of March 31, 2011. The four units of the Fukushima Daiichi Nuclear Power Station which were damaged by the Tohoku-Pacifi c Ocean Earthquake and tsunami are included in "In Operation".
Source: Japan Atomic Industrial Forum, Inc. “World Nuclear Power Plants 2011”
Generating Capacity of Nuclear Power Plants in Major Countries
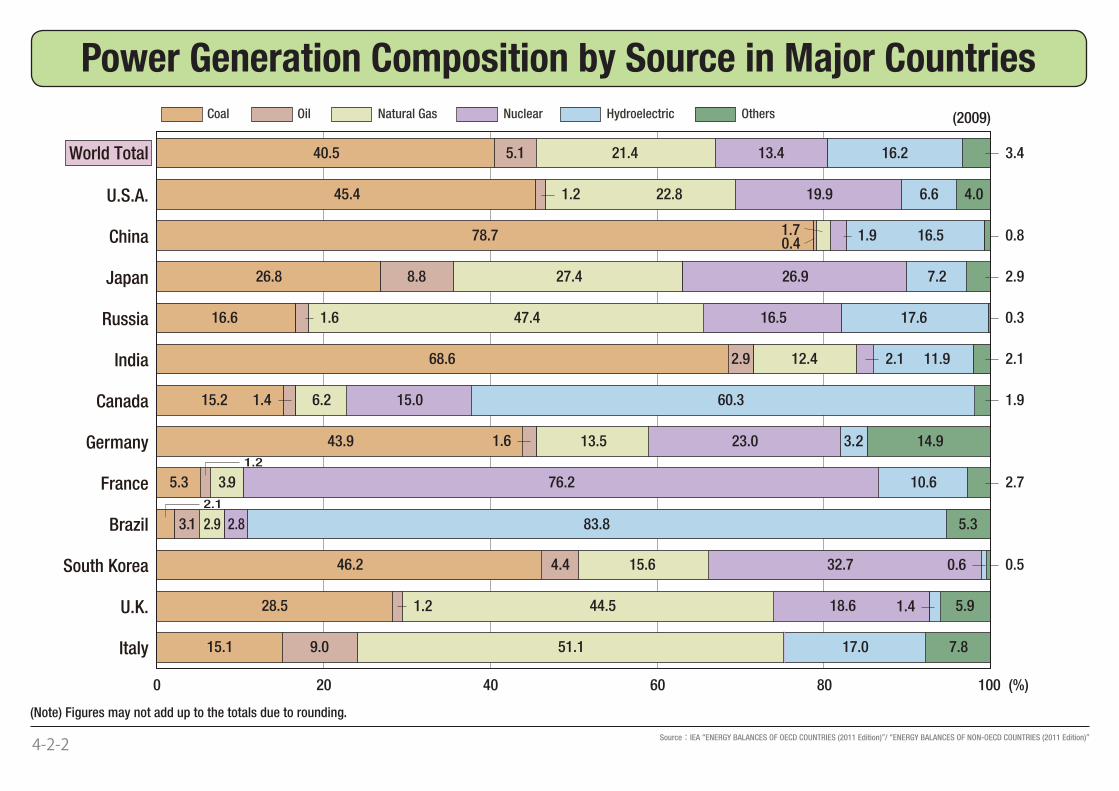
0 20 40 60 80 100 (%)
(2009)
40.5 5.1 21.4 13.4 16.2
45.4 22.8 19.9 6.6
78.7 16.5
26.8 8.8 27.4 26.9 7.2
16.6 47.4 16.5 17.6
68.6 2.9 12.4 11.9
15.2 6.2 15.0 60.3
43.9 13.5 23.0 3..2 14.9
5.3 3.9 76.2 10.6
3.1 2.82.9 83.8 5.3
46.2 4.4 15.6 32.7
28.5 44.5 18.6 5.9
15.1 9.0 51.1 17.0 7.8
3.4
4.01.2
0.81.9
2.9
0.31.6
2.12.1
1.91.4
1.4
1.6
2.7
0.5
1.2
0.41.7
1.2
2.1
0.6
World Total
Italy
U.K.
South Korea
Brazil
France
Germany
Canada
India
Russia
Japan
China
U.S.A.
Hydroelectric OthersNuclearCoal Natural GasOil
4-2-2 Source:IEA “ENERGY BALANCES OF OECD COUNTRIES (2011 Edition)”/ “ENERGY BALANCES OF NON-OECD COUNTRIES (2011 Edition)”
(Note) Figures may not add up to the totals due to rounding.
Power Generation Composition by Source in Major Countries
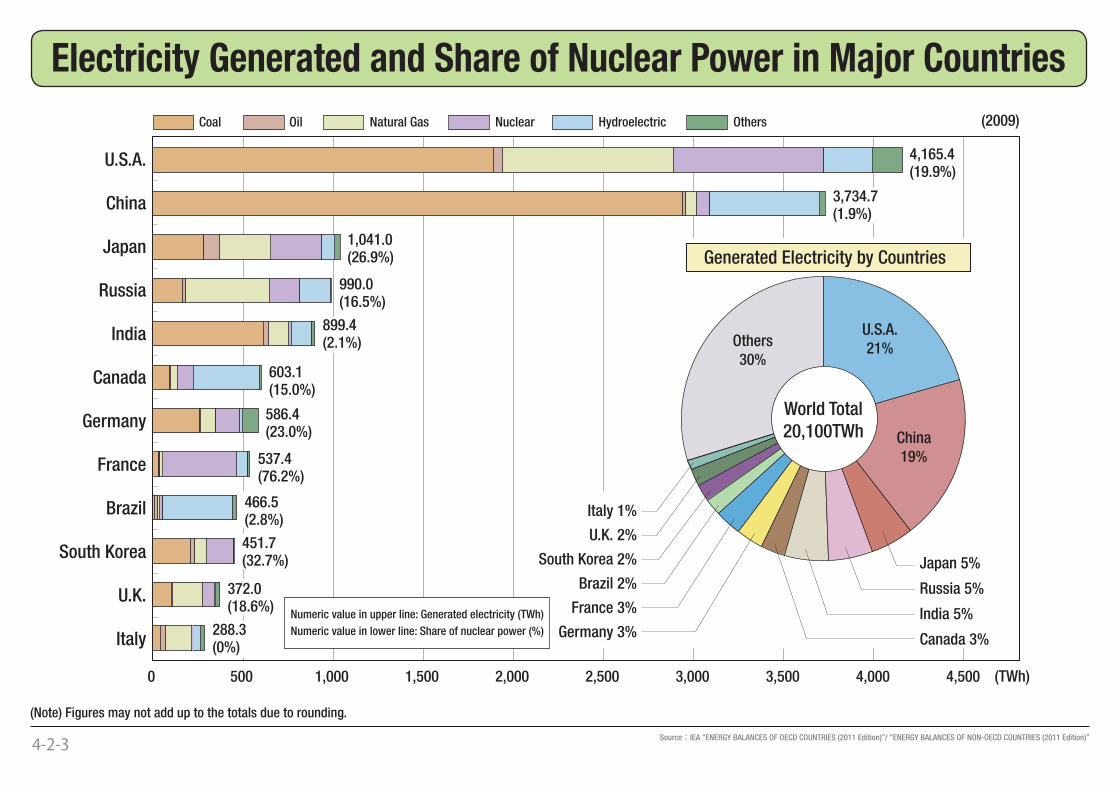
0 500 1,000 1,500 2,000 2,500 3,000 3,500 4,000 4,500
4,165.4(19.9%)
3,734.7(1.9%)
1,041.0(26.9%)
990.0(16.5%)
899.4(2.1%)
603.1(15.0%)
586.4(23.0%)
537.4(76.2%)
466.5(2.8%)
451.7(32.7%)
372.0(18.6%)
288.3(0%)
Hydroelectric OthersNuclearCoal Natural GasOil (2009)
Generated Electricity by Countries
(TWh)
Italy
U.K.
South Korea
Brazil
France
Germany
Canada
India
Russia
Japan
China
U.S.A.
Numeric value in upper line: Generated electricity (TWh)
Numeric value in lower line: Share of nuclear power (%)
U.S.A.21%
China19%
Japan 5%
Russia 5%
India 5%
Canada 3%Germany 3%
France 3%
Brazil 2%
South Korea 2%
U.K. 2%
Italy 1%
Others30%
World Total
20,100TWh
4-2-3 Source:IEA “ENERGY BALANCES OF OECD COUNTRIES (2011 Edition)”/ “ENERGY BALANCES OF NON-OECD COUNTRIES (2011 Edition)”
(Note) Figures may not add up to the totals due to rounding.
Electricity Generated and Share of Nuclear Power in Major Countries
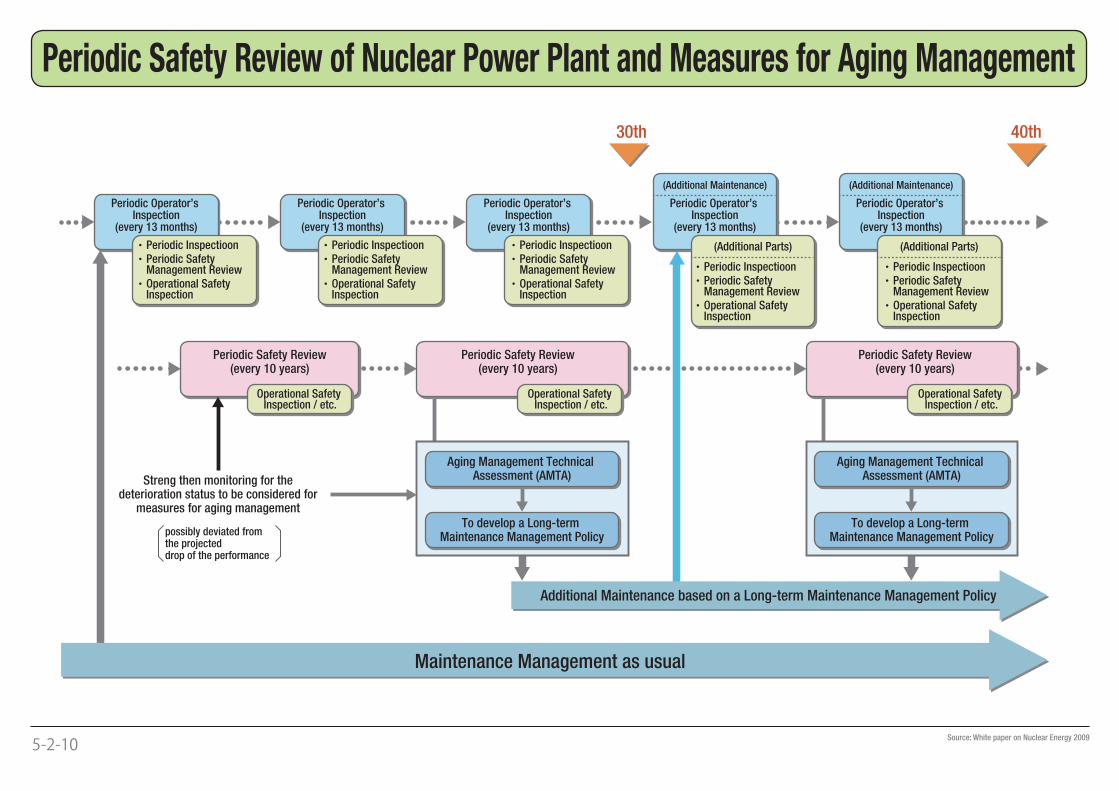
Periodic Operator’s Inspection
(every 13 months)
Periodic Operator’s Inspection
(every 13 months)
Periodic Operator’s Inspection
(every 13 months)
Periodic Operator’s Inspection
(every 13 months)
Periodic Operator’s Inspection
(every 13 months)
・Periodic Inspectioon
・Periodic Safety Management Review
・Operational Safety Inspection
・Periodic Inspectioon
・Periodic Safety Management Review
・Operational Safety Inspection
・Periodic Inspectioon
・Periodic Safety Management Review
・Operational Safety Inspection
・Periodic Inspectioon
・Periodic Safety Management Review
・Operational Safety Inspection
・Periodic Inspectioon
・Periodic Safety Management Review
・Operational Safety Inspection
(Additional Maintenance) (Additional Maintenance)
30th 40th
Periodic Safety Review(every 10 years)
Periodic Safety Review(every 10 years)
Periodic Safety Review(every 10 years)
possibly deviated from the projecteddrop of the performance
Aging Management Technical Assessment (AMTA)
To develop a Long-term Maintenance Management Policy
Aging Management Technical Assessment (AMTA)
To develop a Long-term Maintenance Management Policy
Maintenance Management as usual
Operational Safety Inspection / etc.
Operational Safety Inspection / etc.
Operational Safety Inspection / etc.
(Additional Parts) (Additional Parts)
Additional Maintenance based on a Long-term Maintenance Management Policy
Streng then monitoring for the deterioration status to be considered for
measures for aging management
5-2-10
Source: White paper on Nuclear Energy 2009
Periodic Safety Review of Nuclear Power Plant and Measures for Aging Management
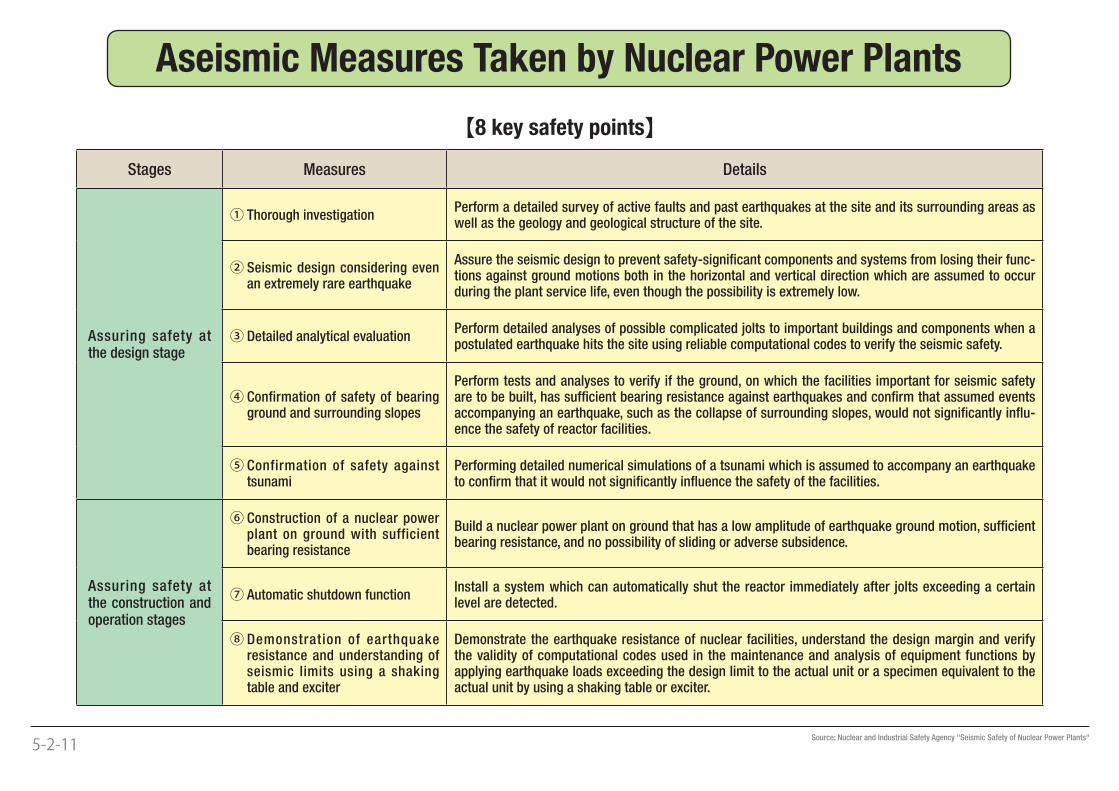
Stages Measures Details
Assuring safety at the design stage
① Thorough investigationPerform a detailed survey of active faults and past earthquakes at the site and its surrounding areas as well as the geology and geological structure of the site.
② Seismic design considering even an extremely rare earthquake
Assure the seismic design to prevent safety-signifi cant components and systems from losing their func-tions against ground motions both in the horizontal and vertical direction which are assumed to occur during the plant service life, even though the possibility is extremely low.
③ Detailed analytical evaluationPerform detailed analyses of possible complicated jolts to important buildings and components when a postulated earthquake hits the site using reliable computational codes to verify the seismic safety.
④ Confirmation of safety of bearing ground and surrounding slopes
Perform tests and analyses to verify if the ground, on which the facilities important for seismic safety are to be built, has suffi cient bearing resistance against earthquakes and confi rm that assumed events accompanying an earthquake, such as the collapse of surrounding slopes, would not signifi cantly infl u-ence the safety of reactor facilities.
⑤ Confirmation of safety against tsunami
Performing detailed numerical simulations of a tsunami which is assumed to accompany an earthquake to confi rm that it would not signifi cantly infl uence the safety of the facilities.
Assuring safety at the construction and operation stages
⑥ Construction of a nuclear power plant on ground with sufficient bearing resistance
Build a nuclear power plant on ground that has a low amplitude of earthquake ground motion, suffi cient bearing resistance, and no possibility of sliding or adverse subsidence.
⑦ Automatic shutdown functionInstall a system which can automatically shut the reactor immediately after jolts exceeding a certain level are detected.
⑧ Demonstration of earthquake resistance and understanding of seismic limits using a shaking table and exciter
Demonstrate the earthquake resistance of nuclear facilities, understand the design margin and verify the validity of computational codes used in the maintenance and analysis of equipment functions by applying earthquake loads exceeding the design limit to the actual unit or a specimen equivalent to the actual unit by using a shaking table or exciter.
【8 key safety points】
5-2-11
Source: Nuclear and Industrial Safety Agency "Seismic Safety of Nuclear Power Plants"
Aseismic Measures Taken by Nuclear Power Plants
82
67
83
72
84
46
85
47
86
49
87
41
88
48
89
35
90
35
91
24
92
32
93
24
94
19
95
29
96
22
97
25
98
20
99
29
00
26
01
15
02
12
03
13
04
20
05 06
15 15
07
23
100908
1215
23
(FY)
0.5
0.0
1.0
1.5
2.0
2.5
3.0
3.5
4.5
4.0
Notification based reportsLegally required reportsReports per unit
Commercial NPPs in Japan
0
10
20
30
40
50
60
70
80
90
81
81
Nu
mb
er o
f R
epor
ts
Rep
orts
per
Un
it
3.2
2.8
2.8
1.41.3
1.4
1.2
1.3
0.9
0.9
0.6
0.8
0.50.4
0.6
0.4
0.5
0.4
0.60.5
0.30.2
0.30.4
0.3 0.30.2
0.30.4 0.4
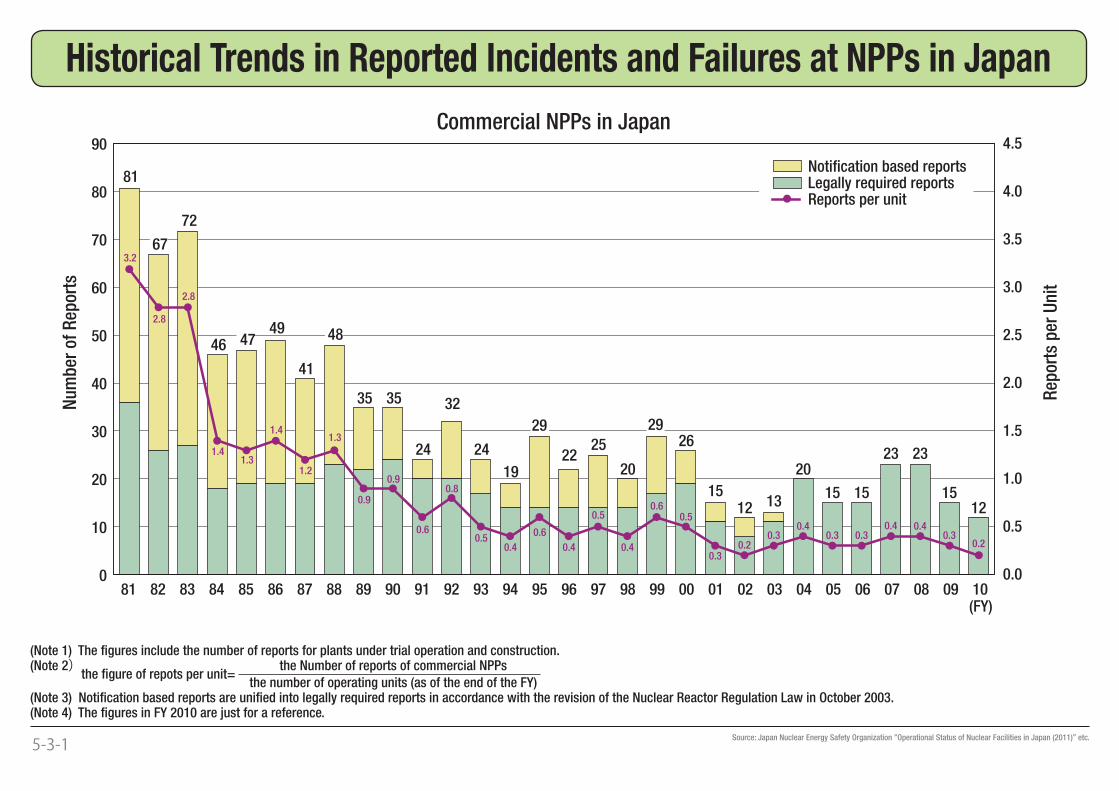
5-3-1 Source: Japan Nuclear Energy Safety Organization “Operational Status of Nuclear Facilities in Japan (2011)” etc.
(Note 1) The fi gures include the number of reports for plants under trial operation and construction.(Note 2) the Number of reports of commercial NPPs the fi gure of repots per unit= the number of operating units (as of the end of the FY)(Note 3) Notifi cation based reports are unifi ed into legally required reports in accordance with the revision of the Nuclear Reactor Regulation Law in October 2003.(Note 4) The fi gures in FY 2010 are just for a reference.
Historical Trends in Reported Incidents and Failures at NPPs in Japan
1.15
0.73
0
0.13
0.26
0.38
0.75
0.28
0.05
0 0.6 1.2
Sweden
Spain
Finland
South Korea
Germany
Russia
France
U.S.A.
Japan
The unplanned automatic scrams per 7,000 hours critical (UA7)
total unplanned scrams while critical in the previous 4 qtrs × 7,000 hrs
total number of hours critical in the previous 4 qtrs=
(2009)
5-3-3
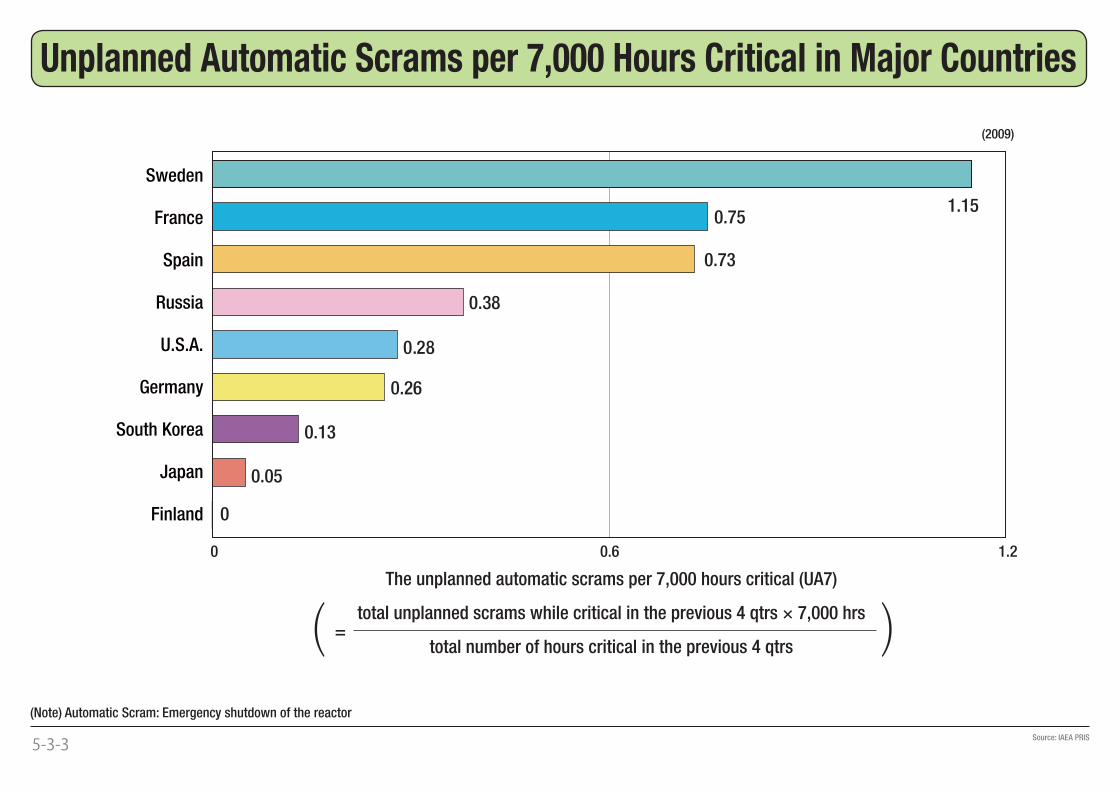
(Note) Automatic Scram: Emergency shutdown of the reactor
Source: IAEA PRIS
Unplanned Automatic Scrams per 7,000 Hours Critical in Major Countries
0
50
60
70
80
90
100
(%)
81 82 83 84 85 86 87 88 89 90 91 92 93 94 95 96 97 98 99 00 01 02 03 04 05 06 07 100908 (FY)
67.8
55.1
52.7
61.0
57.4
68.3
74.174.1
77.7
91.1×
Cap
acit
y Fa
ctor
FranceGermanyCanada
JapanU.S.A.
5-3-4
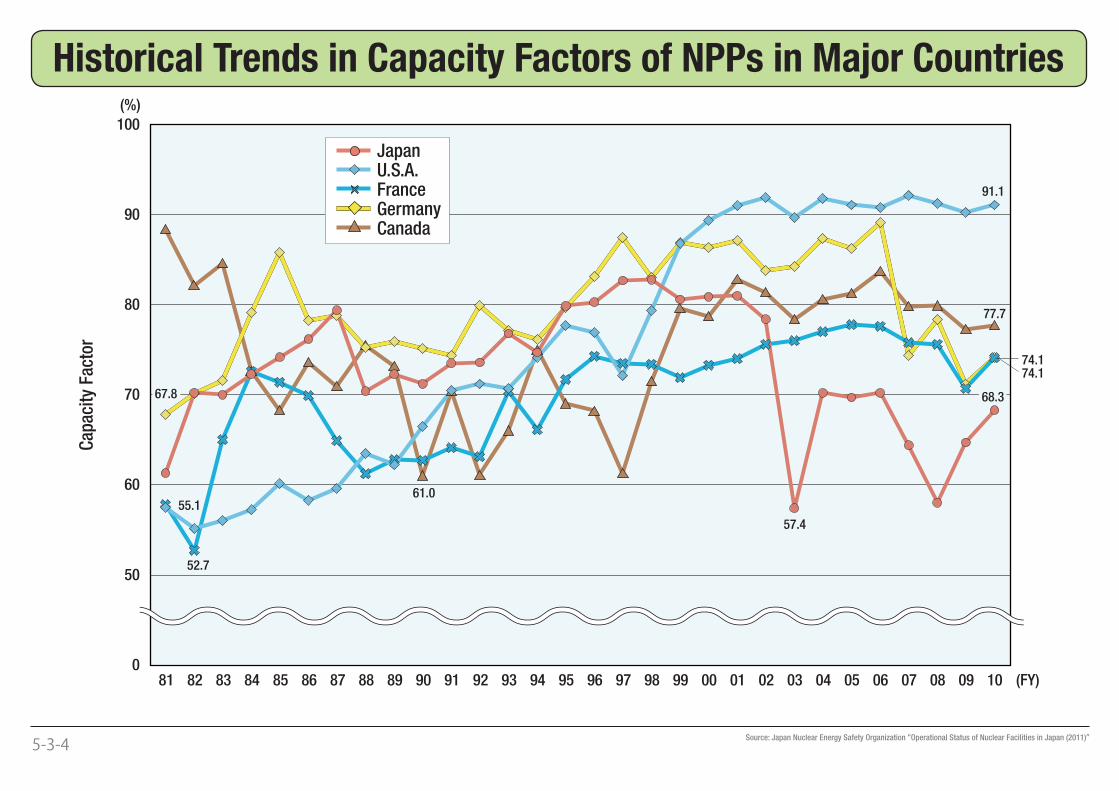
Source: Japan Nuclear Energy Safety Organization “Operational Status of Nuclear Facilities in Japan (2011)”
Historical Trends in Capacity Factors of NPPs in Major Countries
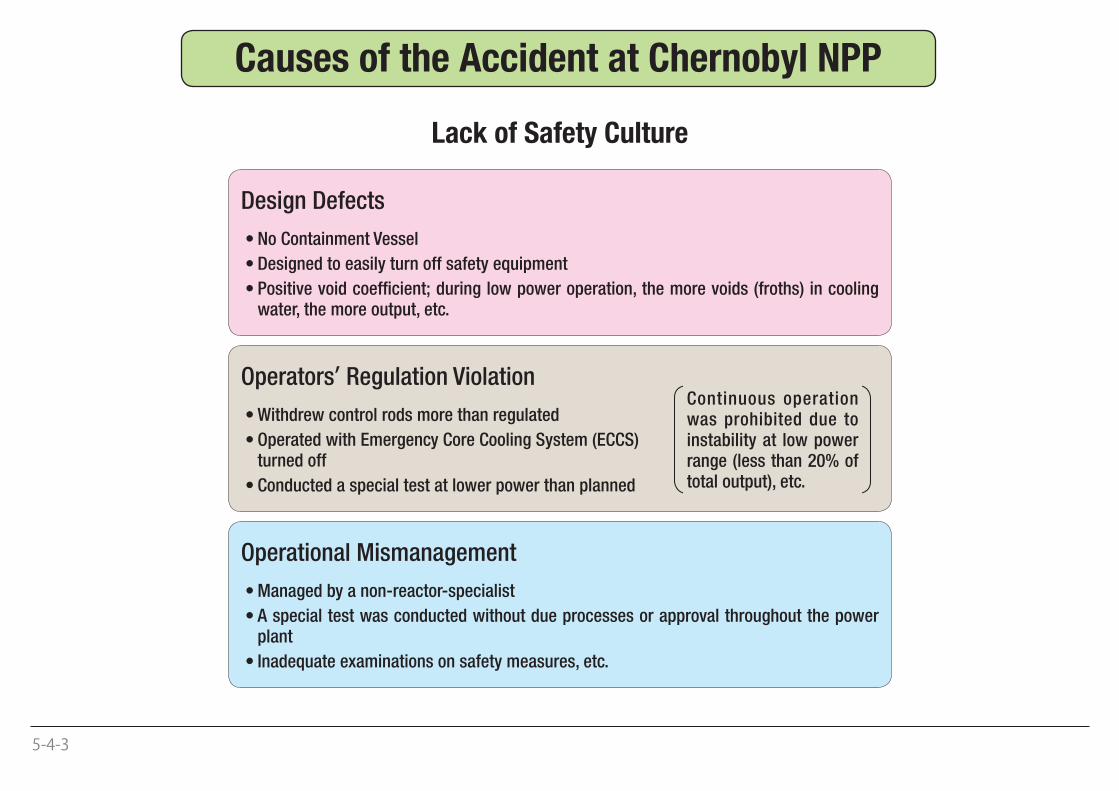
Lack of Safety Culture
Design Defects
• No Containment Vessel
• Designed to easily turn off safety equipment
• Positive void coeffi cient; during low power operation, the more voids (froths) in cooling water, the more output, etc.
Operators’ Regulation Violation
• Withdrew control rods more than regulated
• Operated with Emergency Core Cooling System (ECCS) turned off
• Conducted a special test at lower power than planned
Operational Mismanagement
• Managed by a non-reactor-specialist
• A special test was conducted without due processes or approval throughout the power plant
• Inadequate examinations on safety measures, etc.
Continuous operation was prohibited due to instability at low power range (less than 20% of total output), etc.
5-4-3
Causes of the Accident at Chernobyl NPP
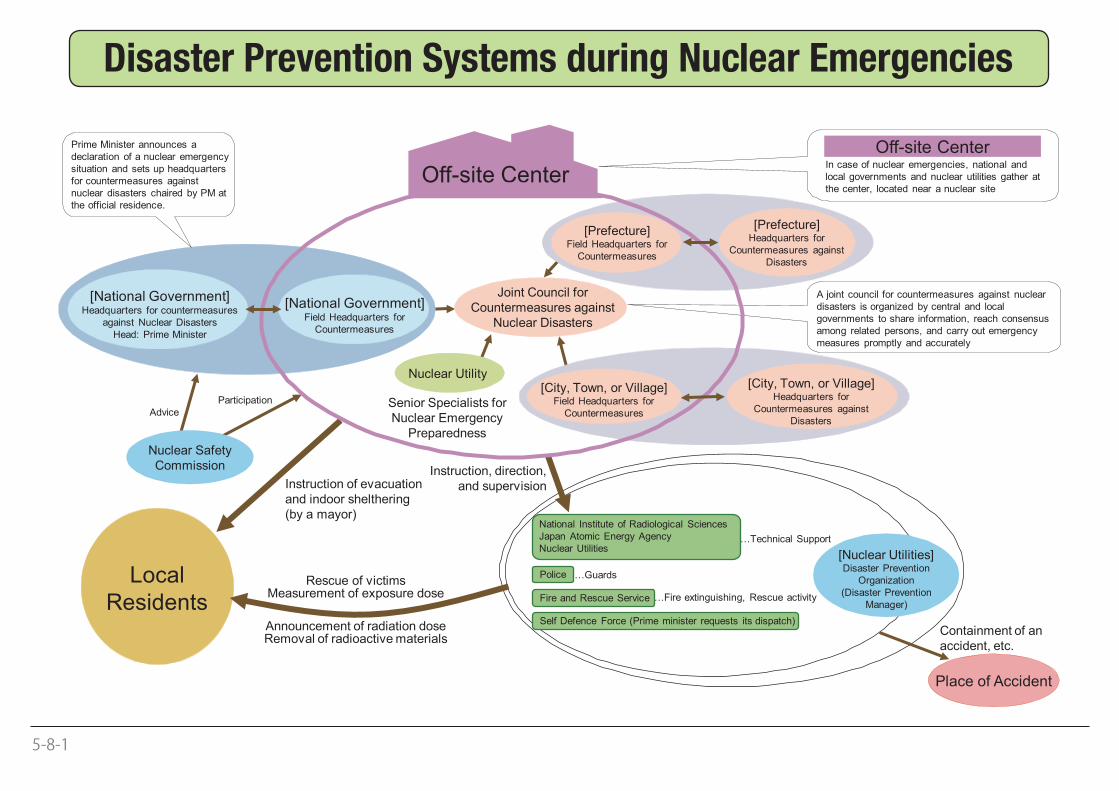
Joint Council for Countermeasures against
Nuclear Disasters
Nuclear Safety Commission
[National Government]Headquarters for countermeasures
against Nuclear DisastersHead: Prime Minister
[National Government]Field Headquarters for
Countermeasures
AdviceParticipation
Instruction of evacuationand indoor shelthering(by a mayor)
Rescue of victimsMeasurement of exposure dose
[Nuclear Utilities]Disaster Prevention
Organization(Disaster Prevention
Manager)
Place of Accident
Containment of an accident, etc.
Instruction, direction,and supervision
Senior Specialists forNuclear Emergency
Preparedness
[Prefecture]Field Headquarters for
Countermeasures
[Prefecture]Headquarters for
Countermeasures against Disasters
[City, Town, or Village]Field Headquarters for
Countermeasures
[City, Town, or Village]Headquarters for
Countermeasures againstDisasters
Off-site CenterIn case of nuclear emergencies, national and local governments and nuclear utilities gather at the center, located near a nuclear site
Nuclear Utility
Announcement of radiation doseRemoval of radioactive materials
A joint council for countermeasures against nuclear disasters is organized by central and localgovernments to share information, reach consensus among related persons, and carry out emergencymeasures promptly and accurately
Prime Minister announces a declaration of a nuclear emergency situation and sets up headquarters for countermeasures against nuclear disasters chaired by PM at the official residence.
Local Residents
Off-site Center
…Technical Support
…Guards
…Fire extinguishing, Rescue activity
National Institute of Radiological SciencesJapan Atomic Energy AgencyNuclear Utilities
Police
Fire and Rescue Service
Self Defence Force (Prime minister requests its dispatch)
5-8-1
Disaster Prevention Systems during Nuclear Emergencies
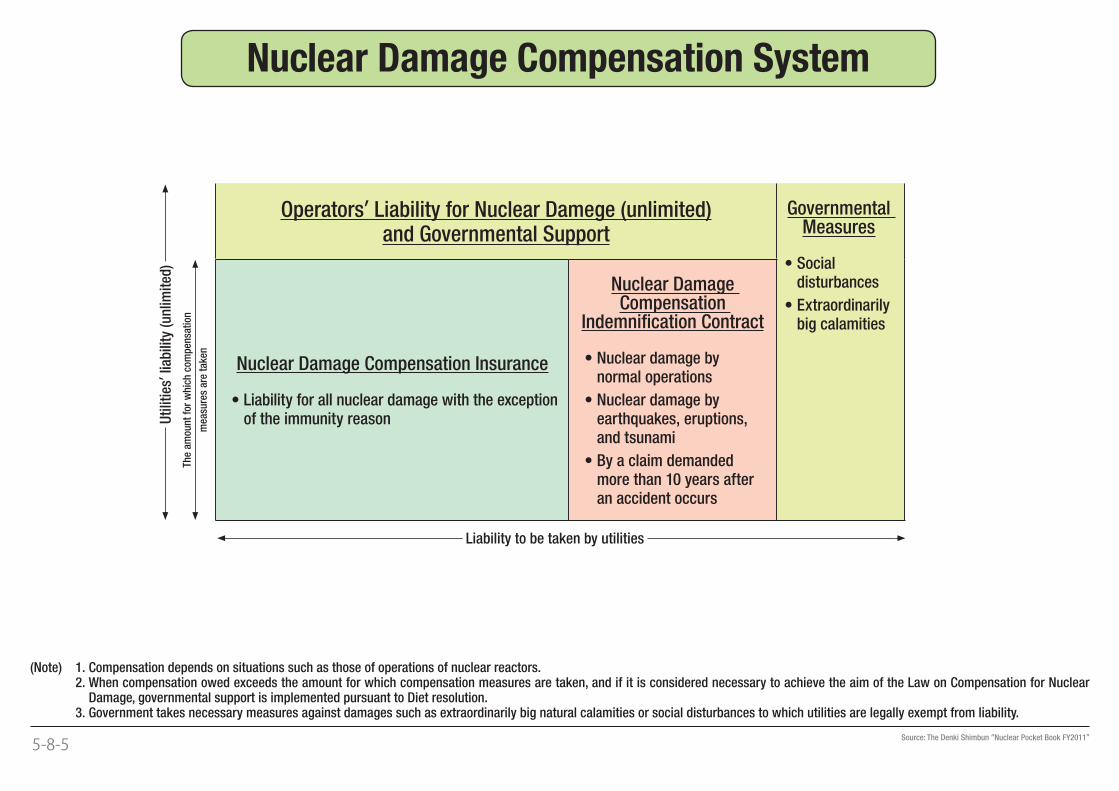
Operators’ Liability for Nuclear Damege (unlimited)and Governmental Support
Governmental Measures
• Social disturbances
• Extraordinarily big calamities
Nuclear Damage Compensation Insurance
• Liability for all nuclear damage with the exception of the immunity reason
Nuclear Damage Compensation
Indemnifi cation Contract
• Nuclear damage by normal operations
• Nuclear damage by earthquakes, eruptions, and tsunami
• By a claim demanded more than 10 years after an accident occurs
◀ Liability to be taken by utilities ▶
◀
Uti
litie
s’ lia
bili
ty (
un
limit
ed)
▶
The
amou
nt
for
wh
ich
com
pen
sati
on◀
▶m
easu
res
are
take
n
5-8-5
(Note) 1. Compensation depends on situations such as those of operations of nuclear reactors. 2. When compensation owed exceeds the amount for which compensation measures are taken, and if it is considered necessary to achieve the aim of the Law on Compensation for Nuclear
Damage, governmental support is implemented pursuant to Diet resolution. 3. Government takes necessary measures against damages such as extraordinarily big natural calamities or social disturbances to which utilities are legally exempt from liability.
Source: The Denki Shimbun “Nuclear Pocket Book FY2011”
Nuclear Damage Compensation System
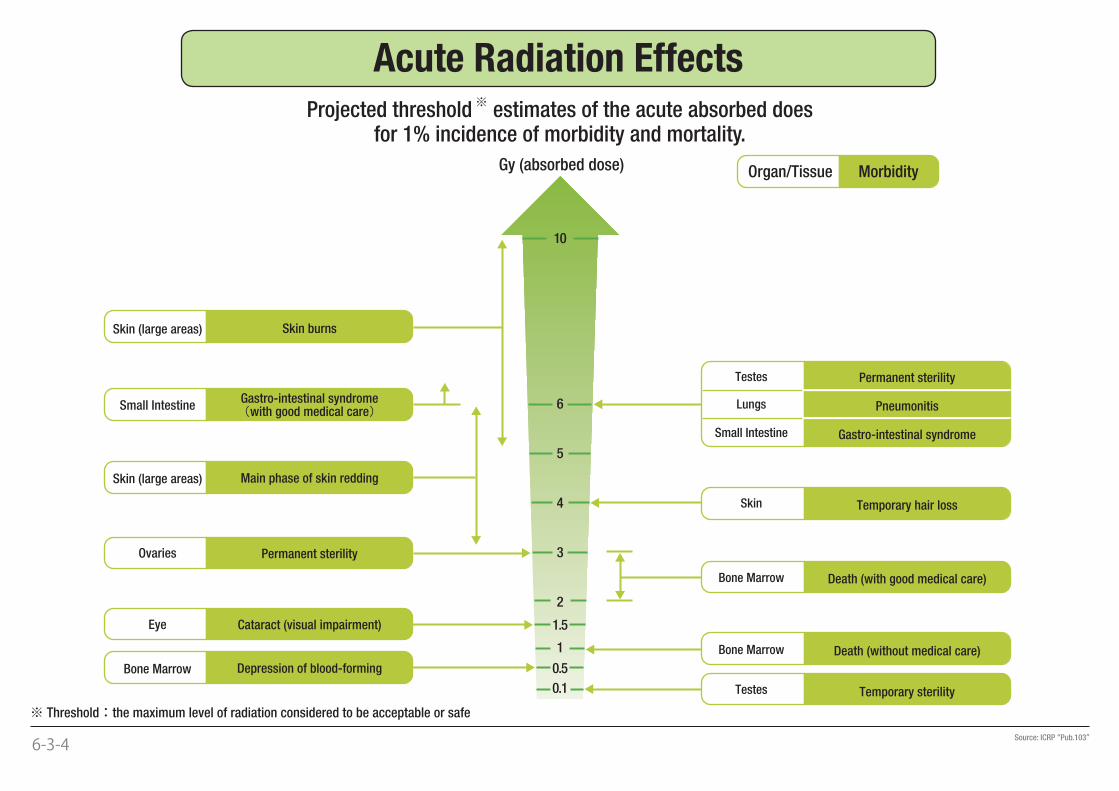
Skin burns
Small IntestineGastro-intestinal syndrome
with good medical care
Skin (large areas) Main phase of skin redding
Ovaries Permanent sterility
Eye Cataract (visual impairment)
Bone Marrow Depression of blood-forming
Testes Temporary sterility
Bone Marrow Death (without medical care)
Bone Marrow Death (with good medical care)
Skin Temporary hair loss
Testes Permanent sterility
Lungs Pneumonitis
Small Intestine Gastro-intestinal syndrome
Gy (absorbed dose) Organ/Tissue Morbidity
Skin (large areas)
10
6
5
4
3
2
1
0.1
0.5
1.5
6-3-4
Acute Radiation Effects
Source: ICRP “Pub.103”
※ Threshold:the maximum level of radiation considered to be acceptable or safe
Projected threshold※ estimates of the acute absorbed doesfor 1% incidence of morbidity and mortality.
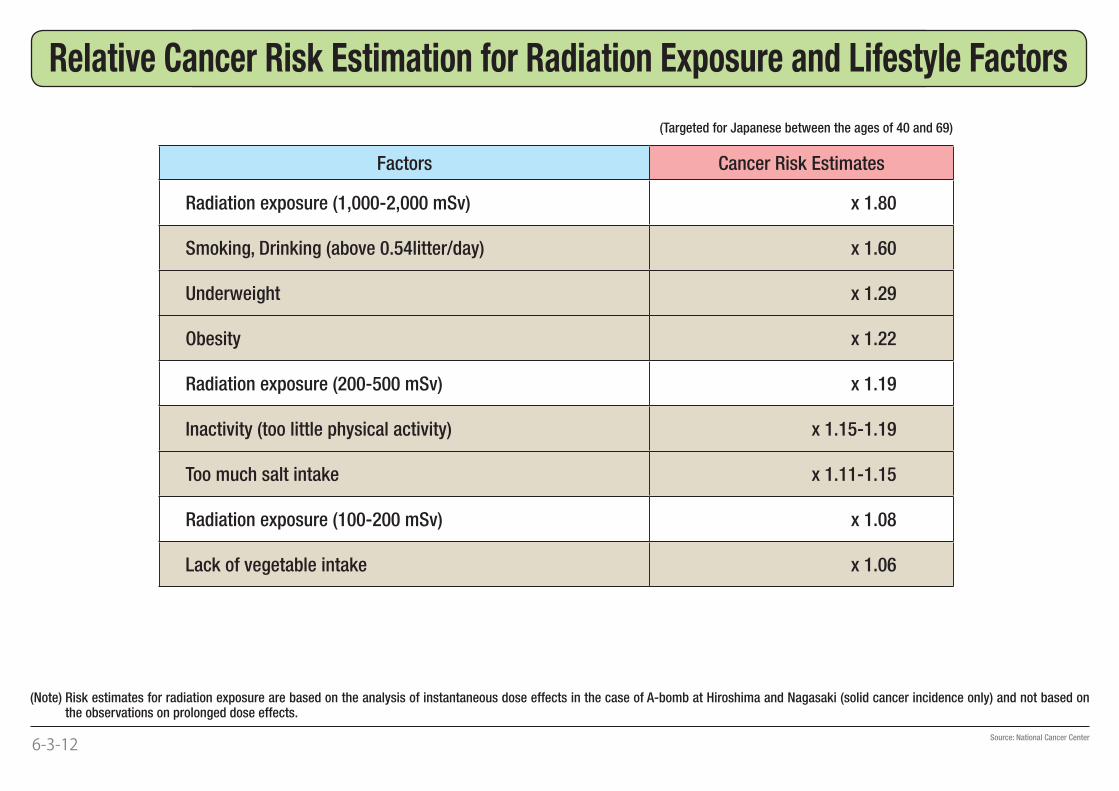
Factors Cancer Risk Estimates
Radiation exposure (1,000-2,000 mSv) x 1.80
Smoking, Drinking (above 0.54litter/day) x 1.60
Underweight x 1.29
Obesity x 1.22
Radiation exposure (200-500 mSv) x 1.19
Inactivity (too little physical activity) x 1.15-1.19
Too much salt intake x 1.11-1.15
Radiation exposure (100-200 mSv) x 1.08
Lack of vegetable intake x 1.06
(Targeted for Japanese between the ages of 40 and 69)
�
6-3-12
(Note) Risk estimates for radiation exposure are based on the analysis of instantaneous dose effects in the case of A-bomb at Hiroshima and Nagasaki (solid cancer incidence only) and not based on
the observations on prolonged dose effects.
Source: National Cancer Center
Relative Cancer Risk Estimation for Radiation Exposure and Lifestyle Factors
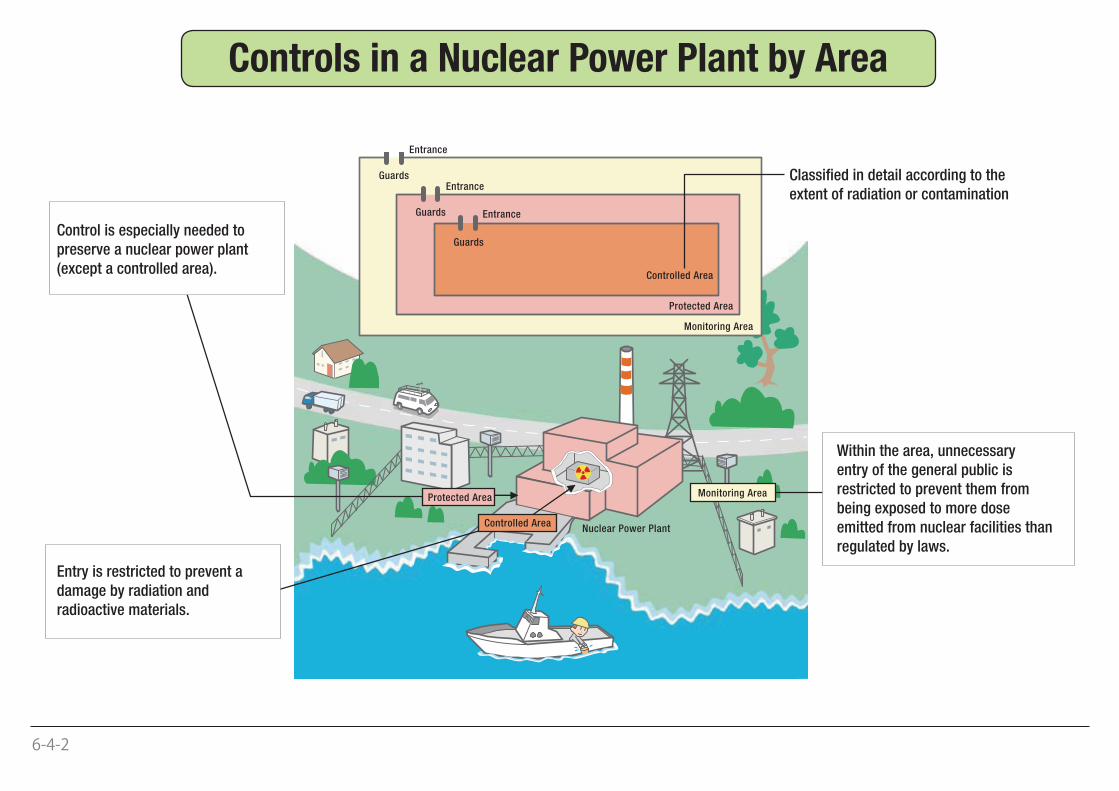
Entrance
Entrance
Entrance
Guards
Guards
Guards
Controlled Area
Classified in detail according to theextent of radiation or contamination
Protected Area
Monitoring Area
Control is especially needed topreserve a nuclear power plant
(except a controlled area).
Entry is restricted to prevent adamage by radiation and
radioactive materials.
Monitoring AreaProtected Area
Within the area, unnecessaryentry of the general public is
restricted to prevent them frombeing exposed to more doseemitted from nuclear facilities than
regulated by laws.
Nuclear Power PlantControlled Area
6-4-2
Controls in a Nuclear Power Plant by Area
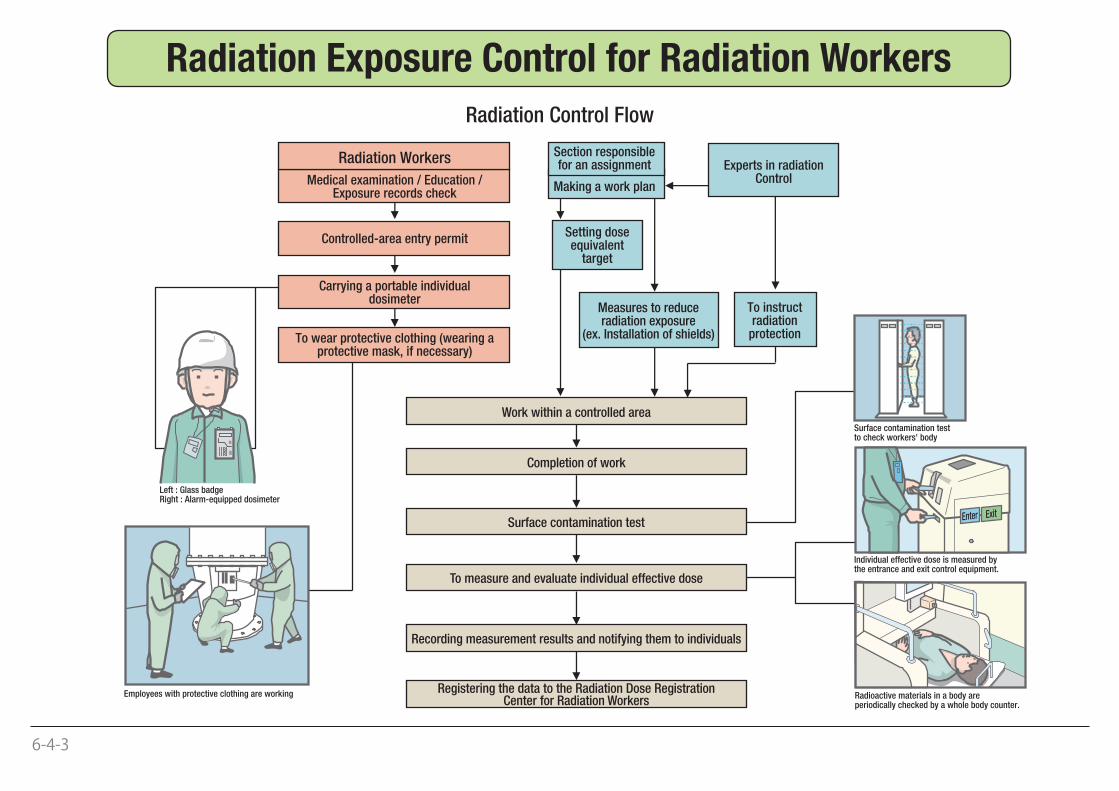
Radiation Control Flow
Medical examination / Education /Exposure records check
Radiation Workers
Controlled-area entry permit
Carrying a portable individualdosimeter
To wear protective clothing (wearing aprotective mask, if necessary)
Making a work plan
Section responsiblefor an assignment
Setting doseequivalent
target
Measures to reduceradiation exposure
(ex. Installation of shields)
To instructradiation
protection
Experts in radiationControl
Work within a controlled area
Completion of work
Surface contamination test
To measure and evaluate individual effective dose
Recording measurement results and notifying them to individuals
Registering the data to the Radiation Dose RegistrationCenter for Radiation Workers
Surface contamination testto check workers' body
Individual effective dose is measured bythe entrance and exit control equipment.
Radioactive materials in a body areperiodically checked by a whole body counter.
Left : Glass badgeRight : Alarm-equipped dosimeter
Employees with protective clothing are working
Enter Exit
6-4-3
Radiation Exposure Control for Radiation Workers
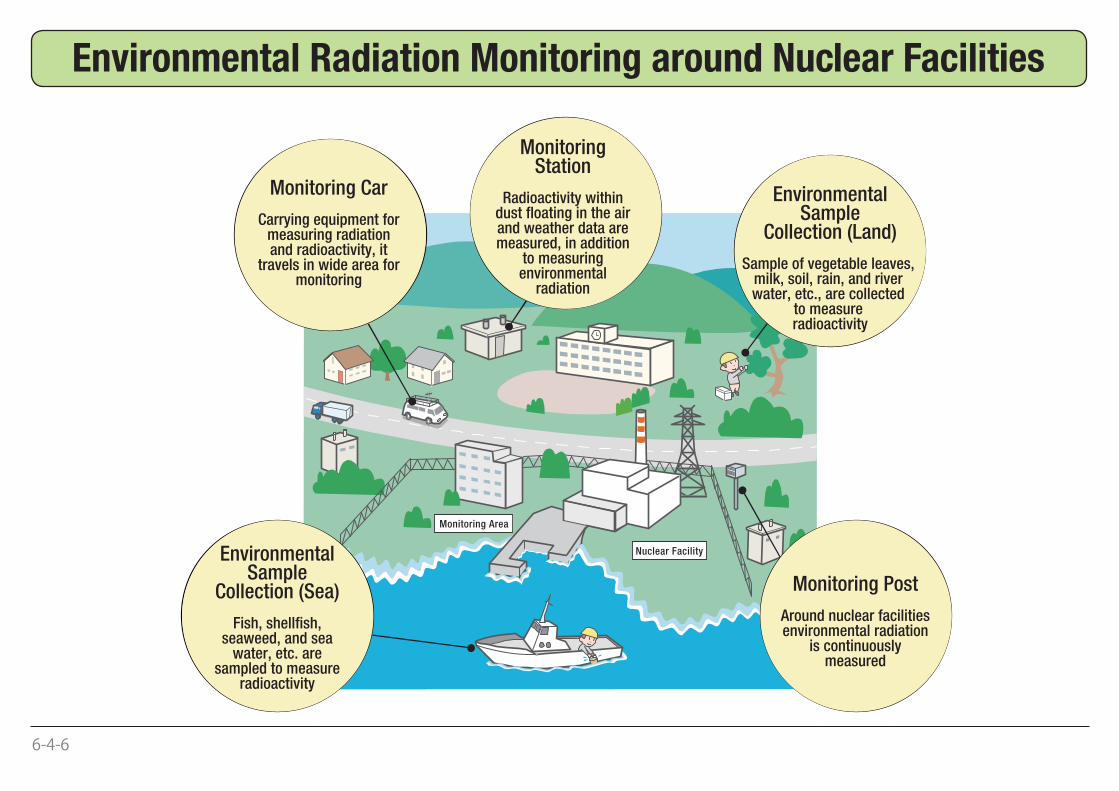
MonitoringStation
Radioactivity withindust floating in the airand weather data aremeasured, in addition
to measuringenvironmental
radiation
EnvironmentalSample
Collection (Land)
Sample of vegetable leaves, milk, soil, rain, and river water, etc., are collected
to measure radioactivity
EnvironmentalSample
Collection (Sea)
Fish, shellfish,seaweed, and sea
water, etc. aresampled to measure
radioactivity
Monitoring Post
Around nuclear facilitiesenvironmental radiation
is continuouslymeasured
Monitoring Car
Carrying equipment formeasuring radiationand radioactivity, it
travels in wide area formonitoring
Monitoring Area
Nuclear Facility
6-4-6
Environmental Radiation Monitoring around Nuclear Facilities
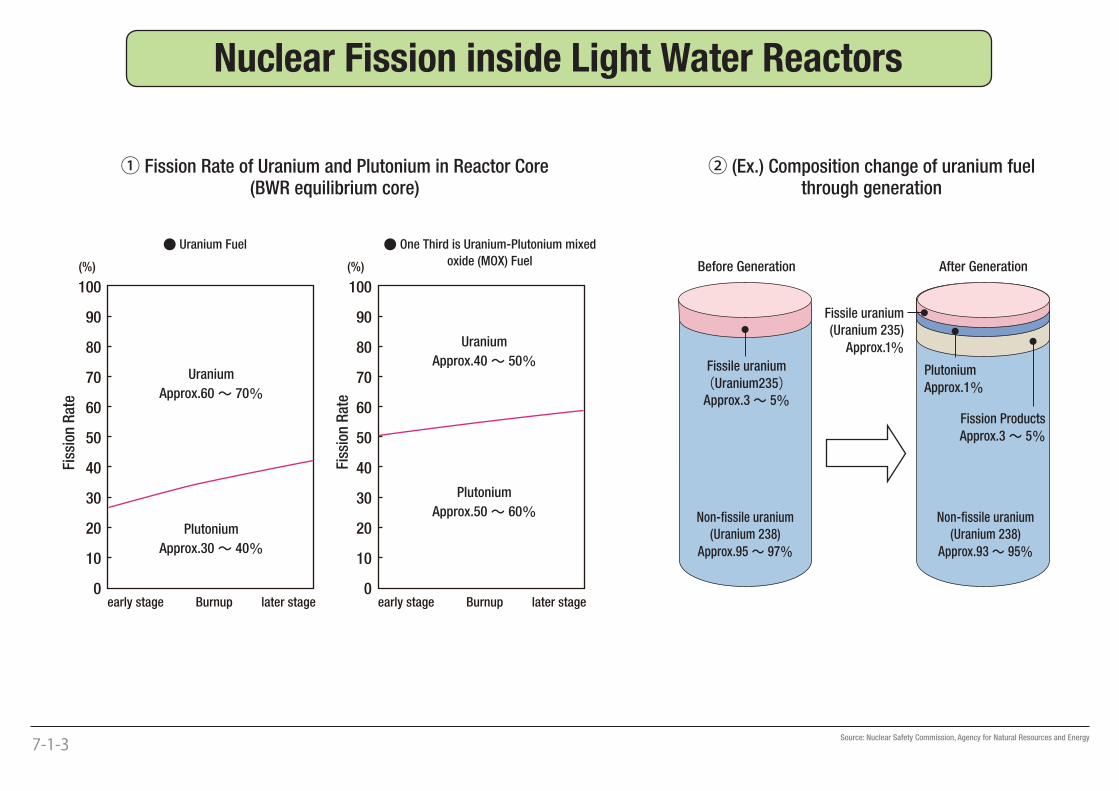
7-1-3
Nuclear Fission inside Light Water Reactors
Source: Nuclear Safety Commission, Agency for Natural Resources and Energy
100
90
80
70
60
50
40
30
20
10
0early stage Burnup later stage
(%) (%)
100
90
80
70
60
50
40
30
20
10
0early stage Burnup later stage
Fiss
ion
Rat
e
Fiss
ion
Rat
e
● Uranium Fuel ● One Third is Uranium-Plutonium mixed
oxide (MOX) Fuel
② (Ex.) Composition change of uranium fuelthrough generation
Fissile uranium
(Uranium235)Approx.3~ 5%
Non-fissile uranium
(Uranium 238)
Approx.95~ 97%
Plutonium
Approx.1%
Non-fissile uranium
(Uranium 238)
Approx.93~ 95%
Fission Products
Approx.3~ 5%
Fissile uranium
(Uranium 235)
Approx.1%
Uranium
Approx.60~ 70%
Plutonium
Approx.30~ 40%
Uranium
Approx.40~ 50%
Plutonium
Approx.50~ 60%
① Fission Rate of Uranium and Plutonium in Reactor Core(BWR equilibrium core)
Before Generation After Generation
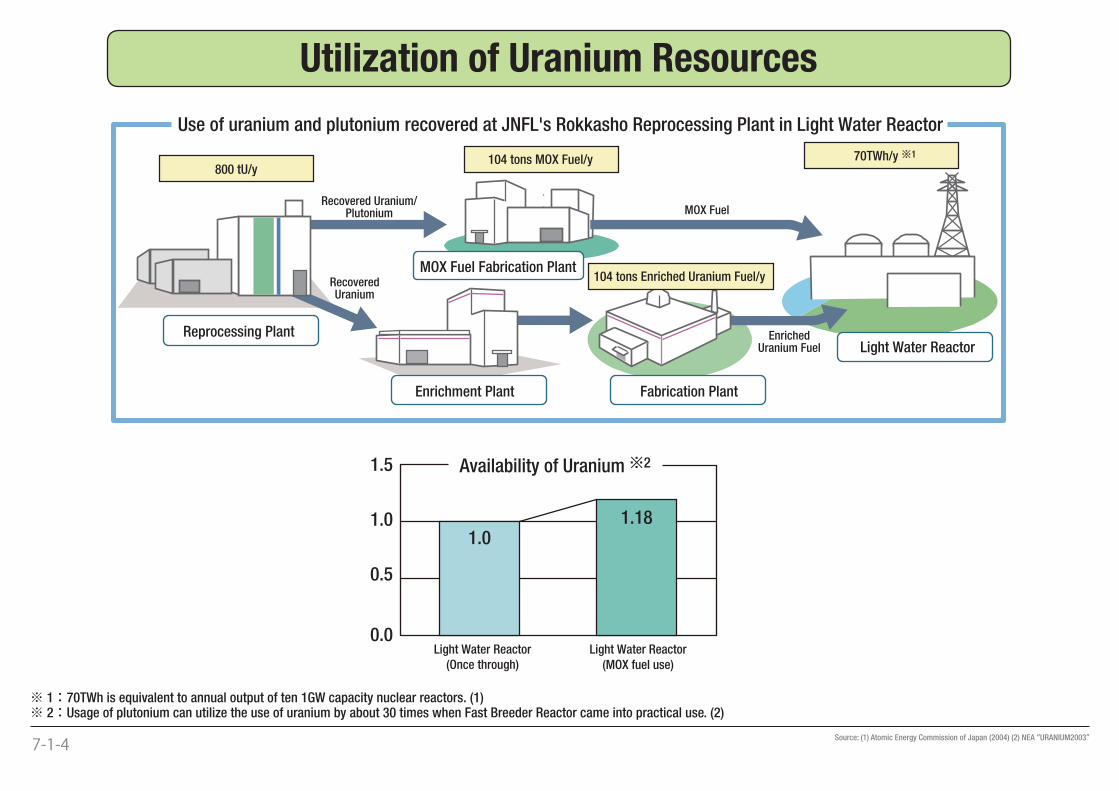
Availability of Uranium 2
Light Water Reactor
(Once through)Light Water Reactor
(MOX fuel use)
Use of uranium and plutonium recovered at JNFL's Rokkasho Reprocessing Plant in Light Water Reactor
800 tU/y104 tons MOX Fuel/y 70TWh/y 1
104 tons Enriched Uranium Fuel/y
Reprocessing Plant
Enrichment Plant Fabrication Plant
Light Water Reactor
Recovered Uranium/Plutonium MOX Fuel
RecoveredUranium
EnrichedUranium Fuel
MOX Fuel Fabrication Plant
1.5
1.01.0
1.18
0.5
0.0
7-1-4
Utilization of Uranium Resources
Source: (1) Atomic Energy Commission of Japan (2004) (2) NEA “URANIUM2003”
※ 1:70TWh is equivalent to annual output of ten 1GW capacity nuclear reactors. (1)※ 2:Usage of plutonium can utilize the use of uranium by about 30 times when Fast Breeder Reactor came into practical use. (2)
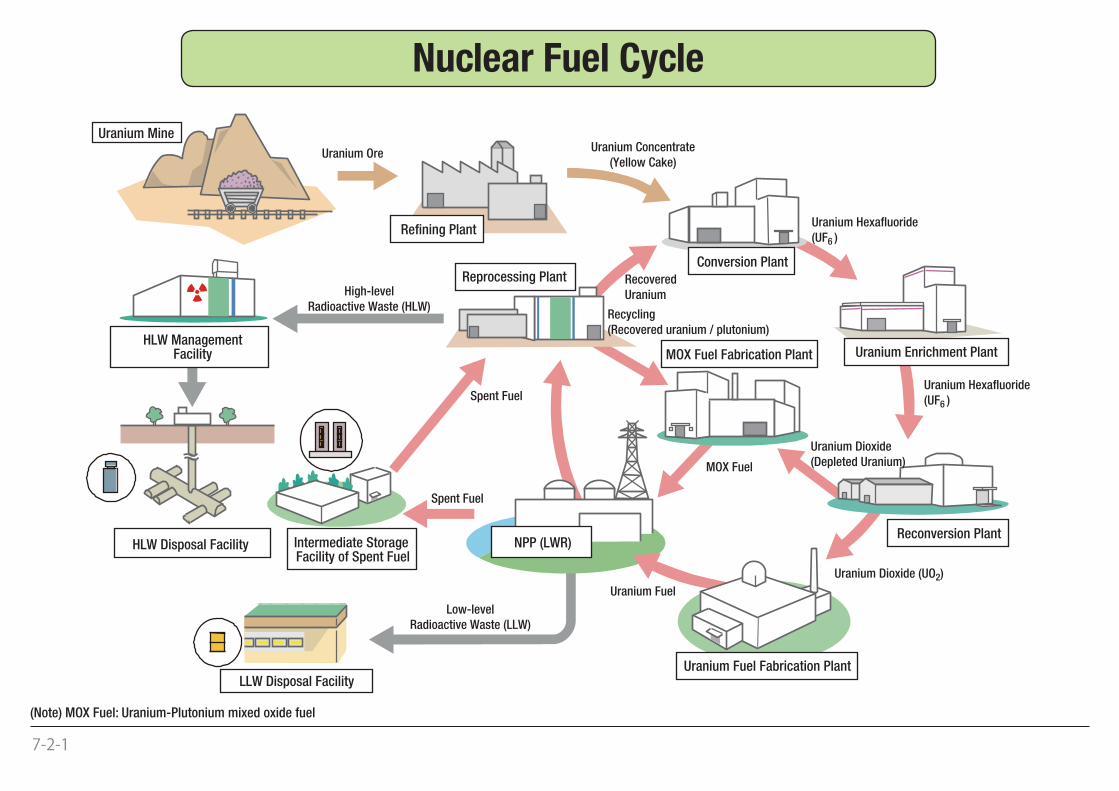
Uranium OreUranium Concentrate
(Yellow Cake)
Uranium Mine
Refining PlantUranium Hexafluoride
(UF6 )
HLW ManagementFacility
High-level
Radioactive Waste (HLW)
Reprocessing Plant
Recycling
(Recovered uranium / plutonium)
Uranium Enrichment PlantMOX Fuel Fabrication Plant
Uranium Fuel Fabrication Plant
Reconversion PlantIntermediate Storage Facility of Spent Fuel
LLW Disposal Facility
HLW Disposal Facility NPP (LWR)
Conversion Plant
Recovered
Uranium
Uranium Hexafluoride
(UF6 )
Uranium Dioxide (UO2)
Uranium Fuel
Spent Fuel
Spent Fuel
MOX Fuel
Low-level
Radioactive Waste (LLW)
Uranium Dioxide
(Depleted Uranium)
7-2-1
(Note) MOX Fuel: Uranium-Plutonium mixed oxide fuel
Nuclear Fuel Cycle
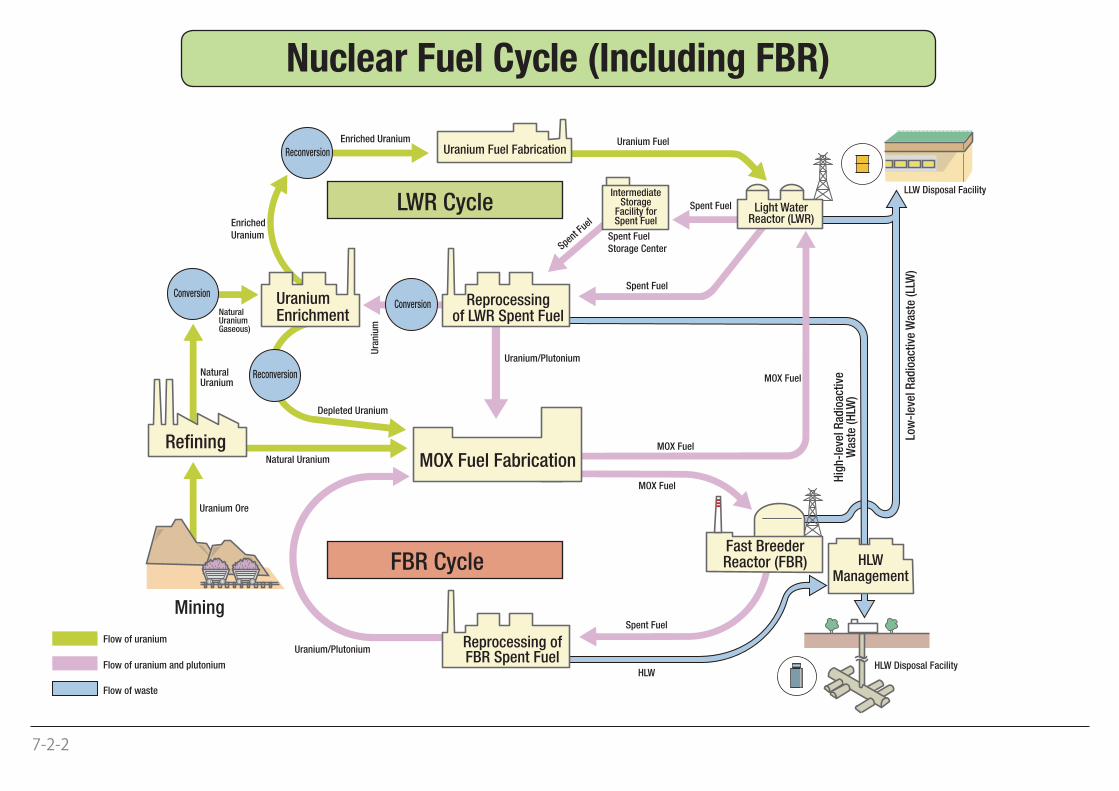
LWR Cycle
FBR Cycle
Uranium Fuel
Spent Fuel
Enriched
Uranium
NaturalUranium
Uranium Ore
Refining
Mining
MOX Fuel Fabrication
UraniumEnrichment
Reprocessingof LWR Spent Fuel
IntermediateStorage
Facility forSpent Fuel
Light WaterReactor (LWR)
Spent Fuel
Ura
niu
m
Depleted Uranium
MOX Fuel
Reprocessing ofFBR Spent Fuel
Spent Fuel
HLW
Fast BreederReactor (FBR) HLW
Management
HLW Disposal Facility
LLW Disposal Facility
Uranium Fuel Fabrication
Hig
h-l
evel
Rad
ioac
tive
Was
te (
HLW
)
Low
-lev
el R
adio
acti
ve W
aste
(LL
W)
Conversion
Natural Uranium
Enriched Uranium
Spent Fuel
Storage Center
MOX Fuel
MOX Fuel
Uranium/Plutonium
Conversion
Reconversion
Reconversion
Uranium/Plutonium
NaturalUraniumGaseous)
Flow of uranium
Flow of uranium and plutonium
Flow of waste
Spent F
uel
7-2-2
Nuclear Fuel Cycle (Including FBR)
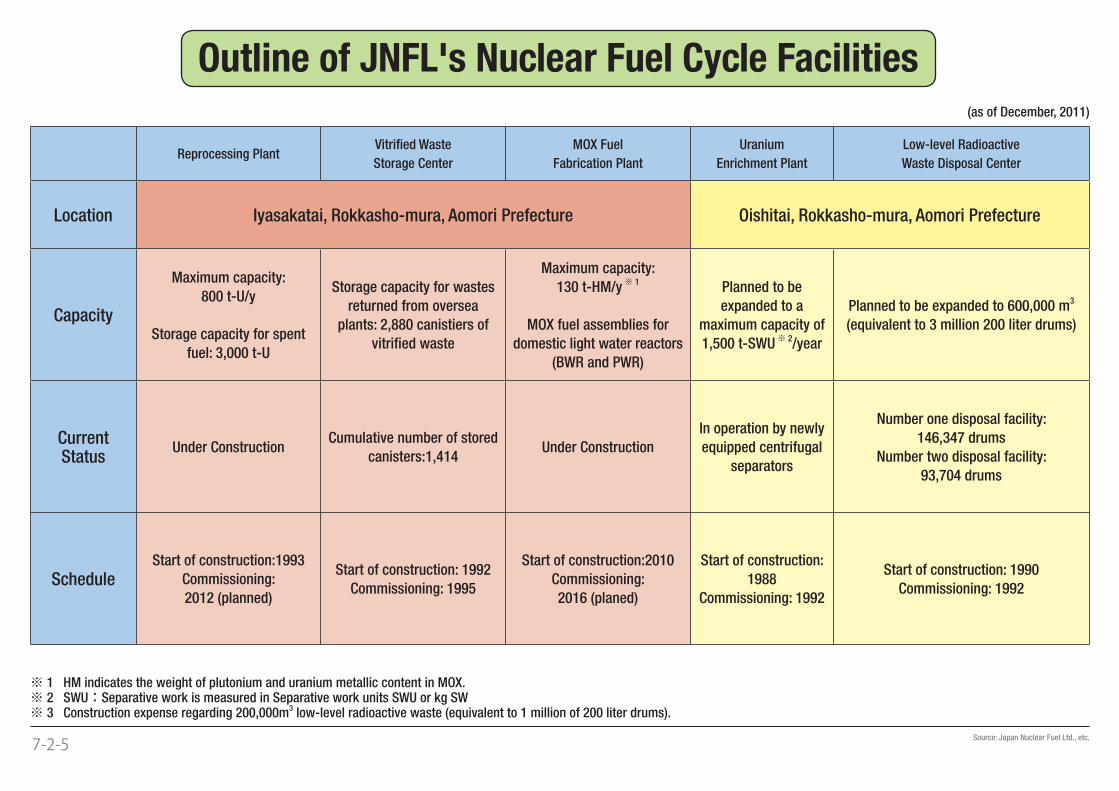
(as of December, 2011)
Reprocessing PlantVitrifi ed Waste
Storage Center
MOX Fuel
Fabrication Plant
Uranium
Enrichment Plant
Low-level Radioactive
Waste Disposal Center
Location Iyasakatai, Rokkasho-mura, Aomori Prefecture Oishitai, Rokkasho-mura, Aomori Prefecture
Capacity
Maximum capacity:
800 t-U/y
Storage capacity for spent
fuel: 3,000 t-U
Storage capacity for wastes
returned from oversea
plants: 2,880 canistiers of
vitrifi ed waste
Maximum capacity:
130 t-HM/y※ 1
MOX fuel assemblies for
domestic light water reactors
(BWR and PWR)
Planned to be
expanded to a
maximum capacity of
1,500 t-SWU※ 2/year
Planned to be expanded to 600,000 m3
(equivalent to 3 million 200 liter drums)
CurrentStatus
Under ConstructionCumulative number of stored
canisters:1,414Under Construction
In operation by newly
equipped centrifugal
separators
Number one disposal facility:
146,347 drums
Number two disposal facility:
93,704 drums
ScheduleStart of construction:1993
Commissioning:
2012 (planned)
Start of construction: 1992
Commissioning: 1995
Start of construction:2010
Commissioning:
2016 (planed)
Start of construction:
1988
Commissioning: 1992
Start of construction: 1990
Commissioning: 1992
7-2-5 Source: Japan Nuclear Fuel Ltd., etc.
Outline of JNFL's Nuclear Fuel Cycle Facilities
※ 1 HM indicates the weight of plutonium and uranium metallic content in MOX.※ 2 SWU:Separative work is measured in Separative work units SWU or kg SW※ 3 Construction expense regarding 200,000m3 low-level radioactive waste (equivalent to 1 million of 200 liter drums).
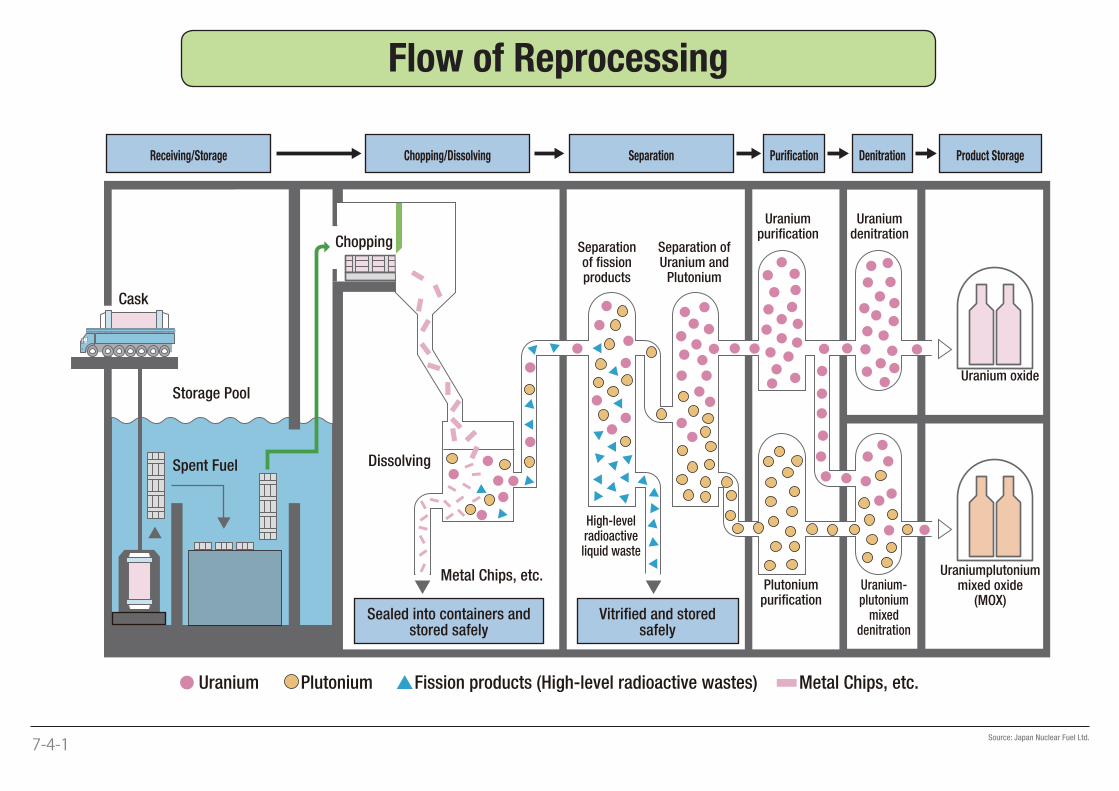
Uranium Plutonium Fission products (High-level radioactive wastes) Metal Chips, etc.
Uraniumplutoniummixed oxide
(MOX)Uranium-plutonium
mixeddenitration
Plutoniumpurification
High-levelradioactiveliquid waste
Uranium oxide
Uraniumdenitration
Uraniumpurification
Separation ofUranium and
Plutonium
Separationof fissionproducts
Metal Chips, etc.
Dissolving
Chopping
Spent Fuel
Storage Pool
Cask
Sealed into containers andstored safely
Receiving/Storage Chopping/Dissolving Separation Purification Denitration Product Storage
Vitrified and storedsafely
7-4-1
Source: Japan Nuclear Fuel Ltd.
Flow of Reprocessing
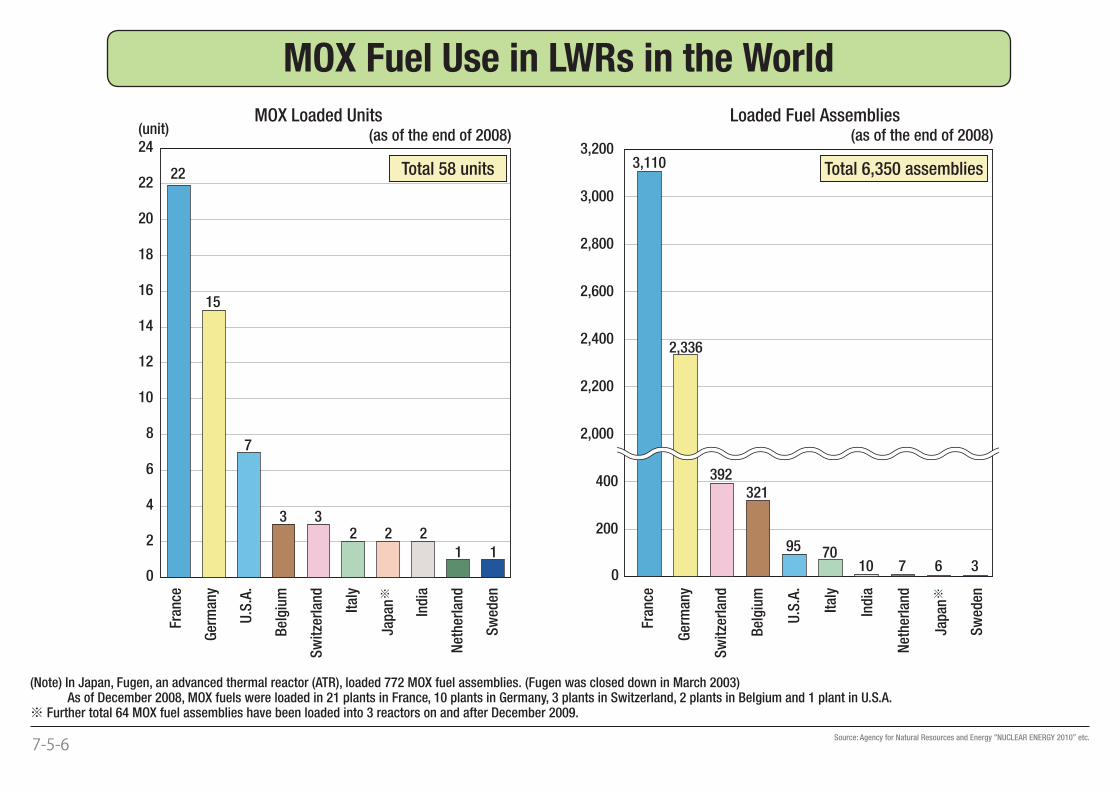
3,110
2,336
392321
95 7010 7 6 3
0
200
400
2,000
2,200
2,400
2,600
2,800
3,000
3,200
22
15
7
3 32 2 2
1 1
0
2
4
6
8
10
12
14
16
18
20
22
24(unit) (as of the end of 2008) (as of the end of 2008)
Total 6,350 assembliesTotal 58 unitsFr
ance
Ger
man
y
U.S
.A.
Bel
giu
m
Sw
itze
rlan
d
Ital
y
Jap
an※
Ind
ia
Net
her
lan
d
Sw
eden
Fran
ce
Ger
man
y
Sw
itze
rlan
d
Bel
giu
m
U.S
.A.
Ital
y
Ind
ia
Net
her
lan
d
Jap
an※
Sw
eden
MOX Loaded Units Loaded Fuel Assemblies
7-5-6 Source: Agency for Natural Resources and Energy “NUCLEAR ENERGY 2010” etc.
MOX Fuel Use in LWRs in the World
(Note) In Japan, Fugen, an advanced thermal reactor (ATR), loaded 772 MOX fuel assemblies. (Fugen was closed down in March 2003) As of December 2008, MOX fuels were loaded in 21 plants in France, 10 plants in Germany, 3 plants in Switzerland, 2 plants in Belgium and 1 plant in U.S.A.※ Further total 64 MOX fuel assemblies have been loaded into 3 reactors on and after December 2009.
ReactorVessel
Control rod
Reactor ContainmentVessel
Eva
por
ator
Turbine Generator
Tank
Secondary system sodium
Intermediate heatexchanger
Steam
Pump
Secondarysystem sodium
Pump
Pump
Pump
Condenser
Seawater
Air cooler
Primarysystem sodium
Fuel
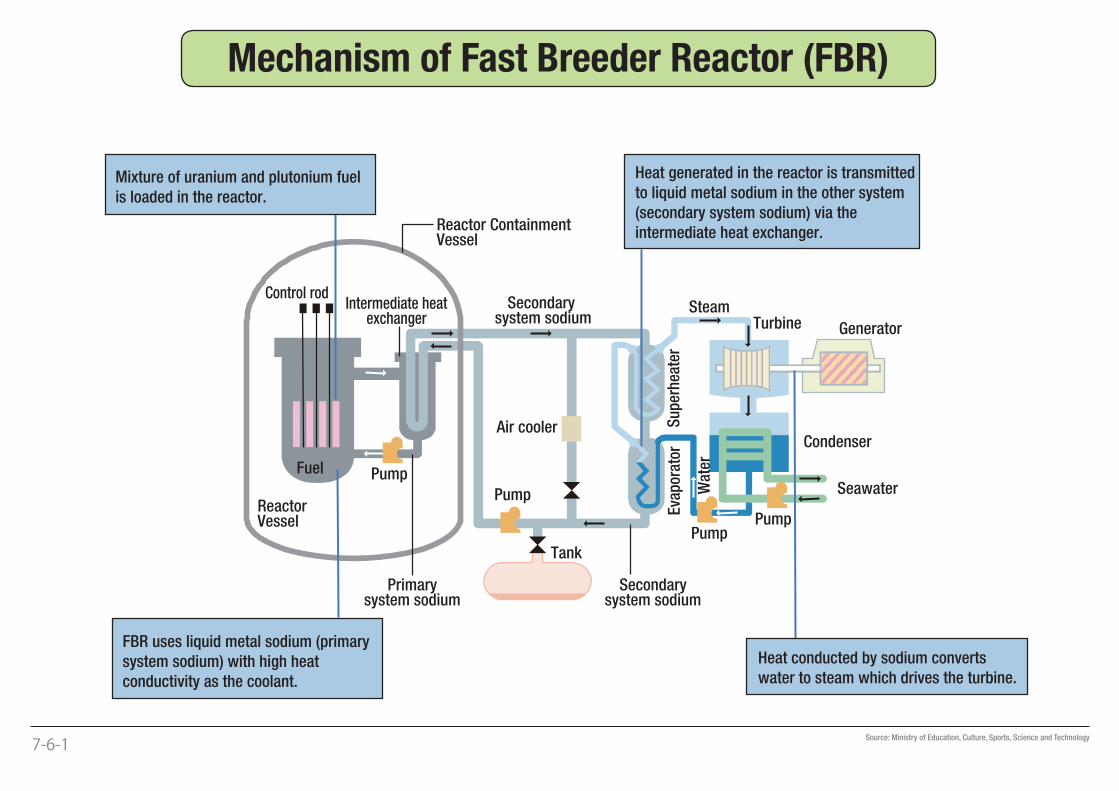
FBR uses liquid metal sodium (primary
system sodium) with high heat
conductivity as the coolant.
Heat conducted by sodium converts
water to steam which drives the turbine.
Mixture of uranium and plutonium fuel
is loaded in the reactor.
Heat generated in the reactor is transmitted
to liquid metal sodium in the other system
(secondary system sodium) via the
intermediate heat exchanger.
Wat
er
Su
per
hea
ter
7-6-1
Source: Ministry of Education, Culture, Sports, Science and Technology
Mechanism of Fast Breeder Reactor (FBR)
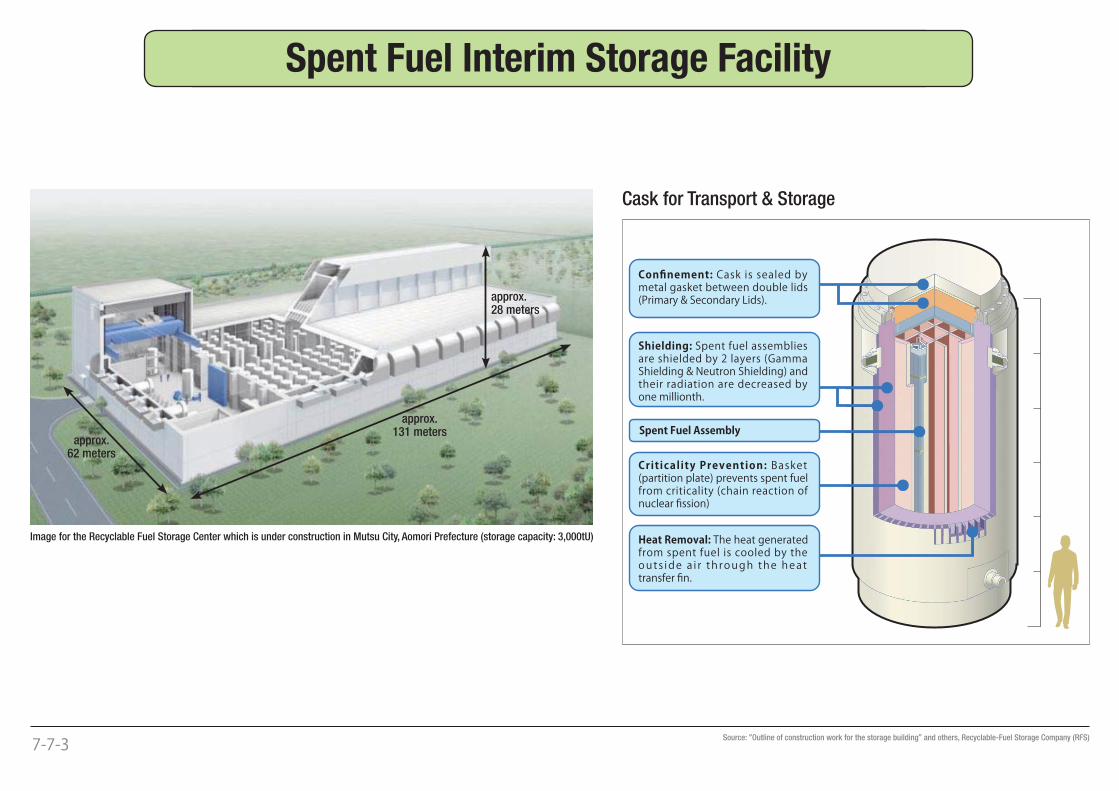
Confinement: Cask is sealed by metal gasket between double lids (Primary & Secondary Lids).
Shielding: Spent fuel assemblies are shielded by 2 layers (Gamma Shielding & Neutron Shielding) and their radiation are decreased by one millionth.
Criticality Prevention: Basket (partition plate) prevents spent fuel from criticality (chain reaction of nuclear fission)
Heat Removal: The heat generated from spent fuel is cooled by the outs ide a i r th rough the heat transfer fin.
Spent Fuel Assembly
Image for the Recyclable Fuel Storage Center which is under construction in Mutsu City, Aomori Prefecture (storage capacity: 3,000tU)
Cask for Transport & Storage
approx. 62 meters
approx. 131 meters
approx. 28 meters
�
7-7-3
Source: “Outline of construction work for the storage building” and others, Recyclable-Fuel Storage Company (RFS)
Spent Fuel Interim Storage Facility
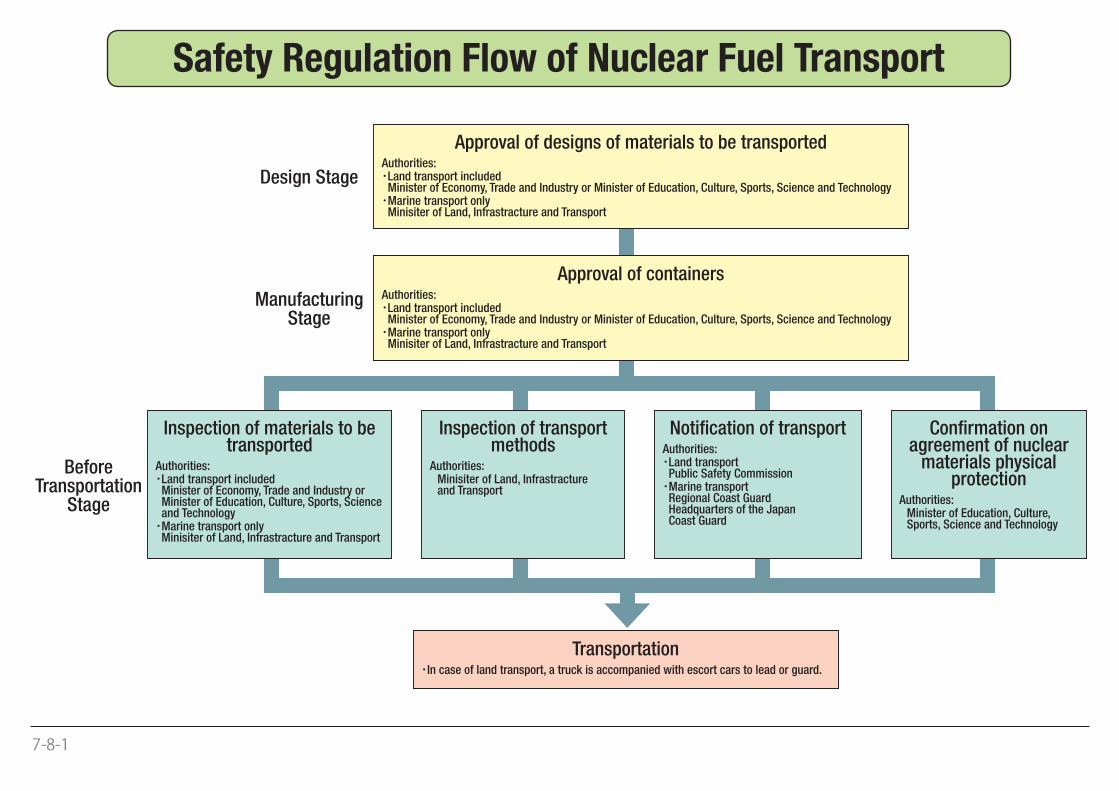
7-8-1
Safety Regulation Flow of Nuclear Fuel Transport
Design Stage
Approval of designs of materials to be transportedAuthorities:・ Land transport included
Minister of Economy, Trade and Industry or Minister of Education, Culture, Sports, Science and Technology・ Marine transport only
Minisiter of Land, Infrastracture and Transport
Manufacturing Stage
Approval of containersAuthorities:・ Land transport included
Minister of Economy, Trade and Industry or Minister of Education, Culture, Sports, Science and Technology・ Marine transport only
Minisiter of Land, Infrastracture and Transport
BeforeTransportation
Stage
Inspection of materials to betransported
Authorities:・ Land transport included
Minister of Economy, Trade and Industry or Minister of Education, Culture, Sports, Science and Technology・ Marine transport only
Minisiter of Land, Infrastracture and Transport
Inspection of transportmethods
Authorities:Minisiter of Land, Infrastractureand Transport
Notifi cation of transportAuthorities:・ Land transport
Public Safety Commission・ Marine transport
Regional Coast GuardHeadquarters of the JapanCoast Guard
Confi rmation on agreement of nuclear
materials physical protection
Authorities:Minister of Education, Culture,Sports, Science and Technology
Transportation・In case of land transport, a truck is accompanied with escort cars to lead or guard.
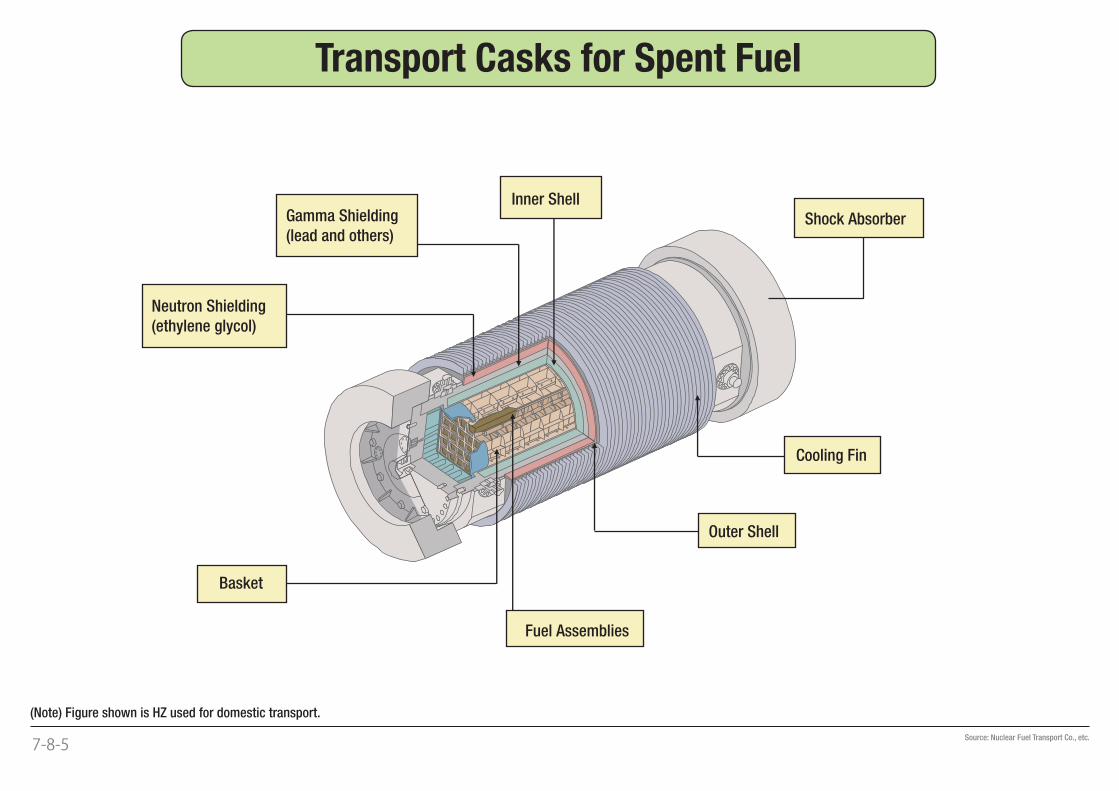
Neutron Shielding
(ethylene glycol)
Gamma Shielding
(lead and others)
Inner Shell
Basket
Fuel Assemblies
Outer Shell
Cooling Fin
Shock Absorber
7-8-5 Source: Nuclear Fuel Transport Co., etc.
(Note) Figure shown is HZ used for domestic transport.
Transport Casks for Spent Fuel
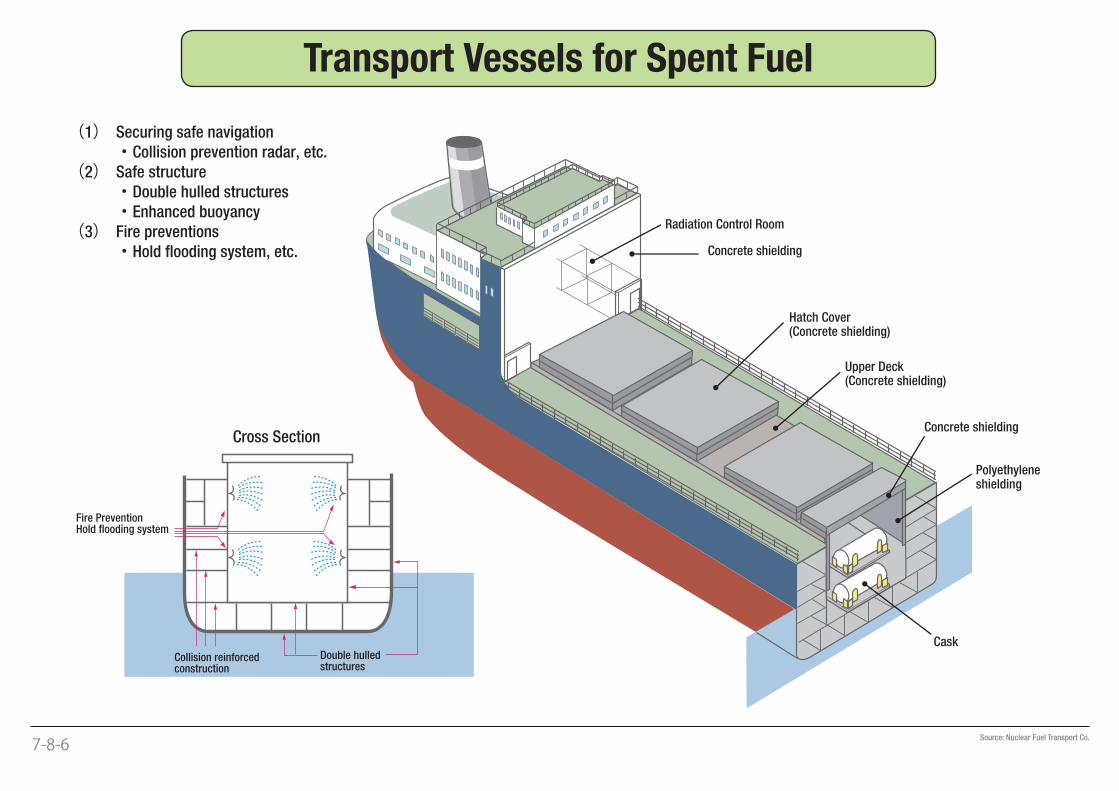
(1) Securing safe navigation
・Collision prevention radar, etc.
(2) Safe structure
・Double hulled structures
・Enhanced buoyancy
(3) Fire preventions
・Hold flooding system, etc.
Cross Section
Double hulledstructures
Collision reinforcedconstruction
Radiation Control Room
Concrete shielding
Hatch Cover(Concrete shielding)
Concrete shielding
Polyethyleneshielding
Upper Deck(Concrete shielding)
Cask
Fire PreventionHold flooding system
7-8-6
Source: Nuclear Fuel Transport Co.
Transport Vessels for Spent Fuel
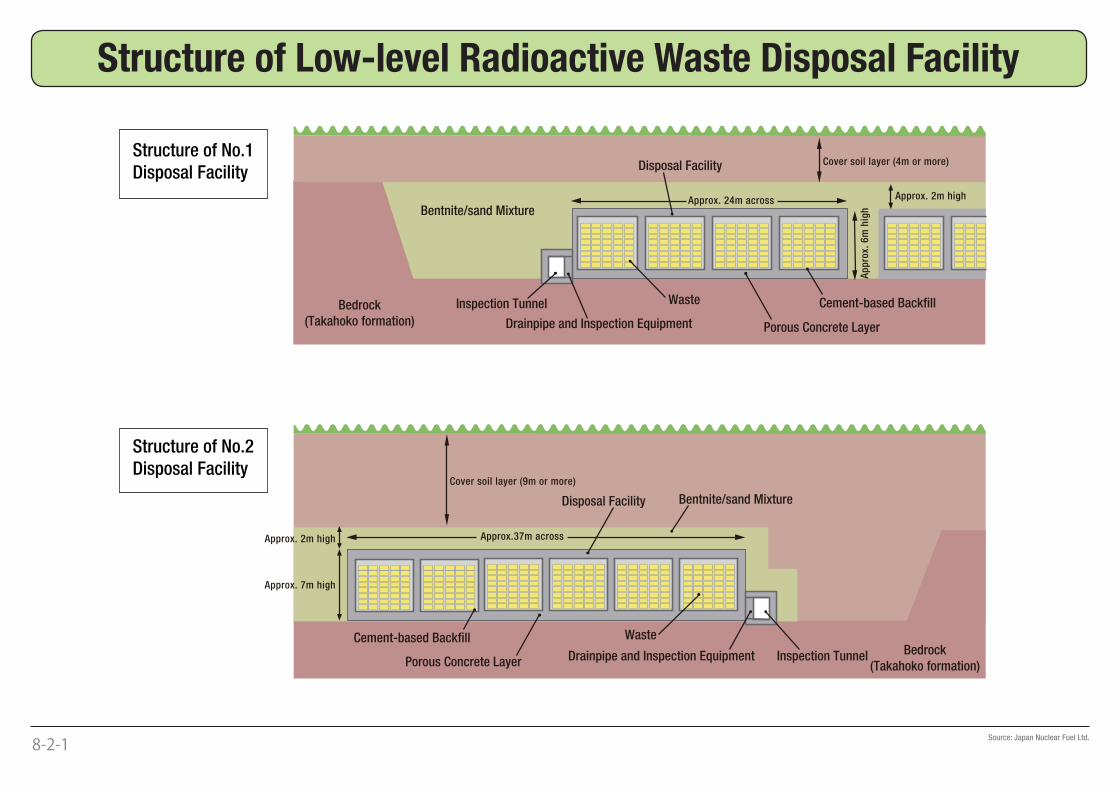
Structure of No.1
Disposal Facility
Structure of No.2
Disposal Facility
Disposal Facility
Disposal Facility
Cover soil layer (4m or more)
Bentnite/sand Mixture
Bentnite/sand Mixture
Approx. 24m across Approx. 2m high
Ap
pro
x. 6
m h
igh
Bedrock(Takahoko formation)
Bedrock(Takahoko formation)
Inspection Tunnel
Inspection Tunnel
Drainpipe and Inspection Equipment
Drainpipe and Inspection Equipment
Waste
Waste
Cement-based Backfill
Cement-based Backfill
Porous Concrete Layer
Porous Concrete Layer
Approx.37m across
Approx. 7m high
Cover soil layer (9m or more)
Approx. 2m high
8-2-1
Source: Japan Nuclear Fuel Ltd.
Structure of Low-level Radioactive Waste Disposal Facility
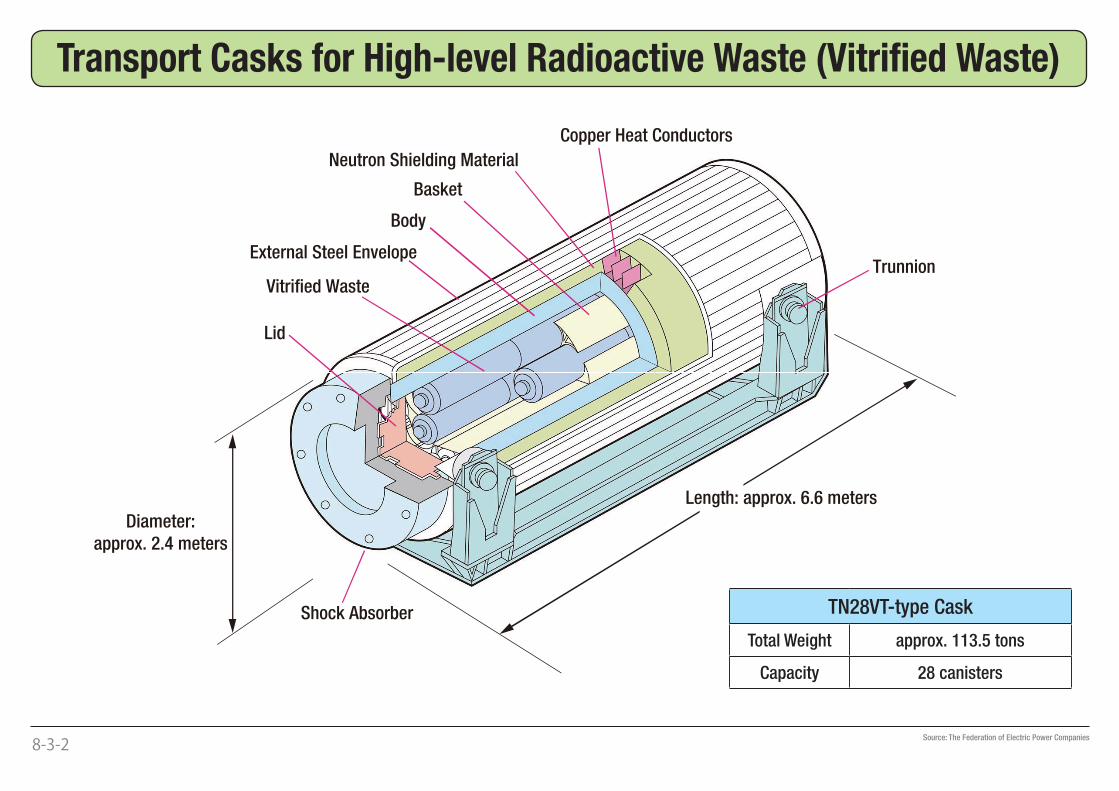
Neutron Shielding Material
Copper Heat Conductors
Basket
Body
Vitrified Waste
External Steel Envelope
Lid
Shock Absorber
Diameter:
approx. 2.4 meters
Trunnion
Length: approx. 6.6 meters
8-3-2
Source: The Federation of Electric Power Companies
Transport Casks for High-level Radioactive Waste (Vitrifi ed Waste)
TN28VT-type Cask
Total Weight approx. 113.5 tons
Capacity 28 canisters
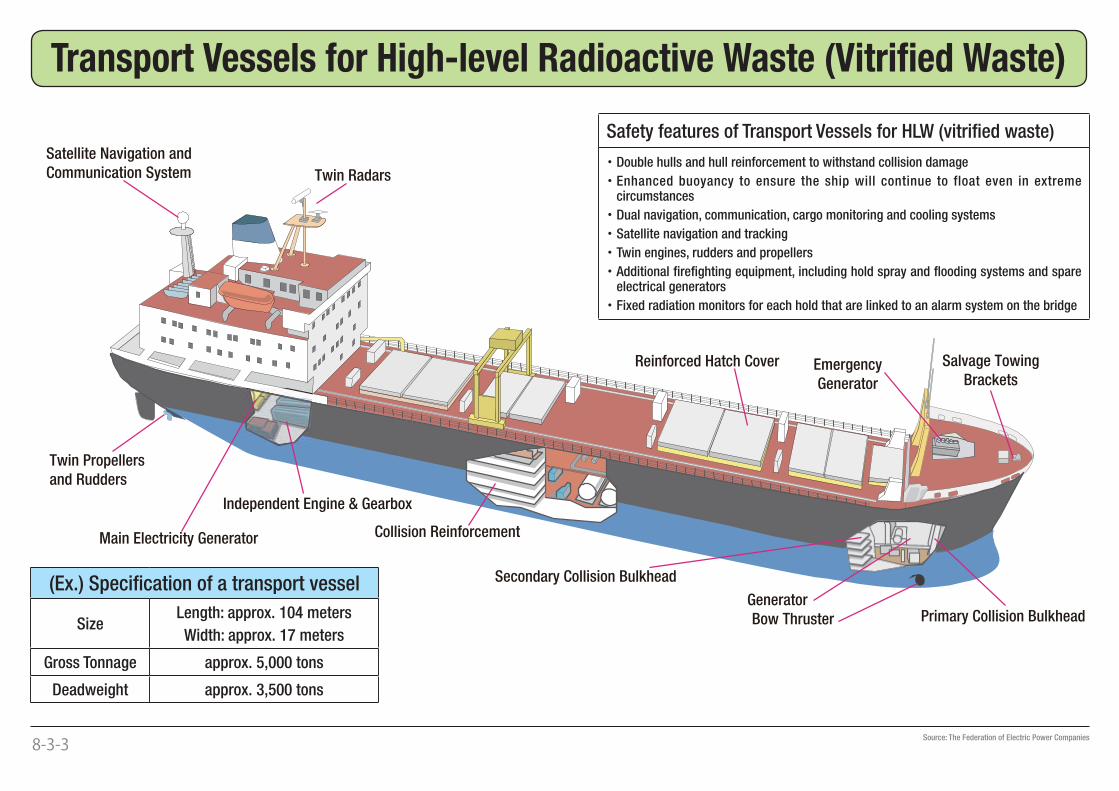
Twin Radars
Main Electricity Generator
EmergencyGenerator
Reinforced Hatch Cover
Collision Reinforcement
Secondary Collision Bulkhead
Generator
Bow Thruster Primary Collision Bulkhead
Salvage TowingBrackets
Satellite Navigation andCommunication System
Twin Propellersand Rudders
Independent Engine & Gearbox
Safety features of Transport Vessels for HLW (vitrifi ed waste)
・Double hulls and hull reinforcement to withstand collision damage
・ Enhanced buoyancy to ensure the ship will continue to float even in extreme circumstances
・ Dual navigation, communication, cargo monitoring and cooling systems
・Satellite navigation and tracking
・Twin engines, rudders and propellers
・ Additional fi refi ghting equipment, including hold spray and fl ooding systems and spare electrical generators
・ Fixed radiation monitors for each hold that are linked to an alarm system on the bridge
8-3-3
Source: The Federation of Electric Power Companies
Transport Vessels for High-level Radioactive Waste (Vitrifi ed Waste)
(Ex.) Specifi cation of a transport vessel
SizeLength: approx. 104 meters
Width: approx. 17 meters
Gross Tonnage approx. 5,000 tons
Deadweight approx. 3,500 tons
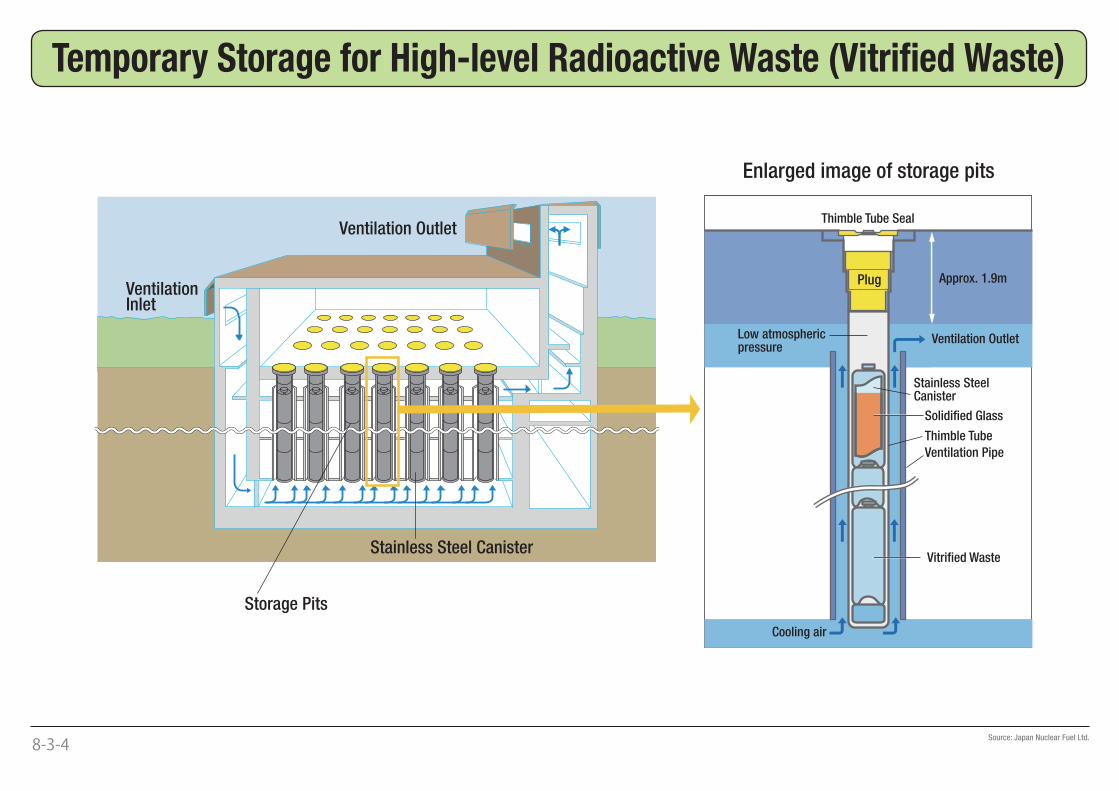
Ventilation Outlet
Ventilation Inlet
Storage Pits
Stainless Steel Canister
Stainless SteelCanister
Solidified Glass
Thimble Tube
Ventilation Pipe
Vitrified Waste
Approx. 1.9m
Thimble Tube Seal
Cooling air
Ventilation OutletLow atmosphericpressure
Plug
Enlarged image of storage pits
8-3-4
Source: Japan Nuclear Fuel Ltd.
Temporary Storage for High-level Radioactive Waste (Vitrifi ed Waste)
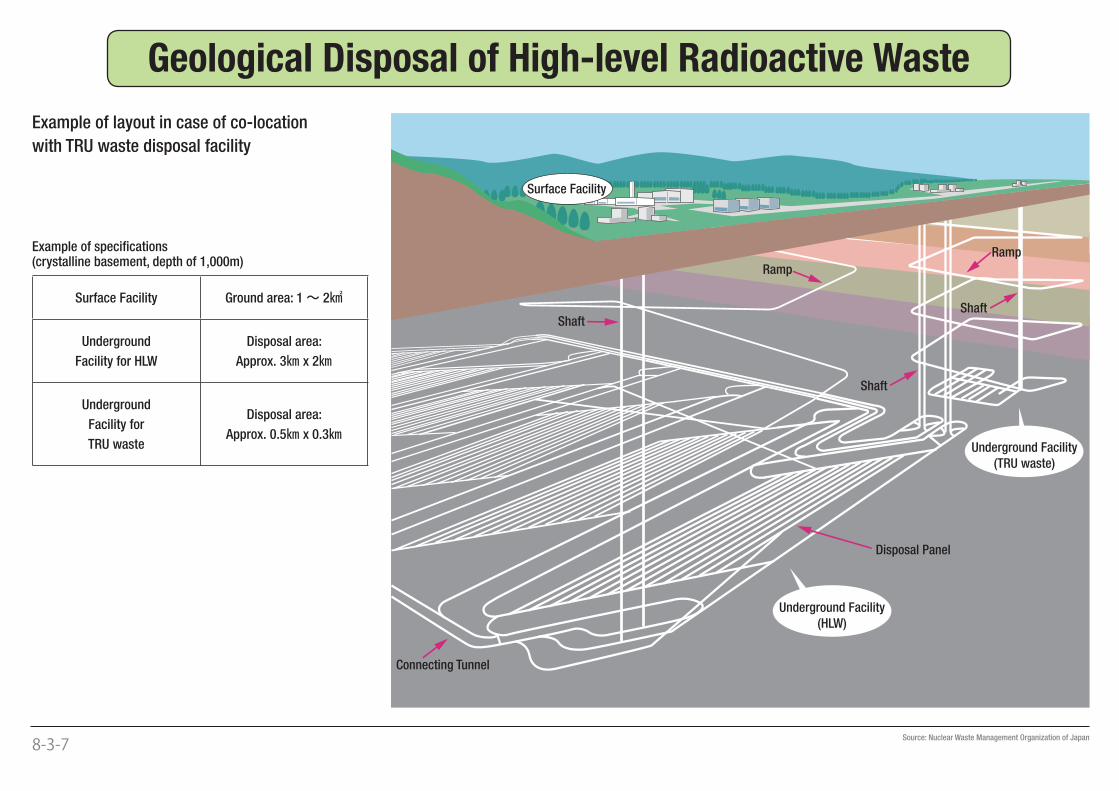
Ramp
Ramp
Surface Facility
Underground Facility
(TRU waste)
Underground Facility
(HLW)
Disposal Panel
Shaft
Connecting Tunnel
Shaft
Shaft
Example of layout in case of co-location
with TRU waste disposal facility
Example of specifi cations(crystalline basement, depth of 1,000m)
Surface Facility Ground area: 1~ 2㎢
Underground
Facility for HLW
Disposal area:
Approx. 3㎞ x 2㎞
Underground
Facility for
TRU waste
Disposal area:
Approx. 0.5㎞ x 0.3㎞
8-3-7
Geological Disposal of High-level Radioactive Waste
Source: Nuclear Waste Management Organization of Japan
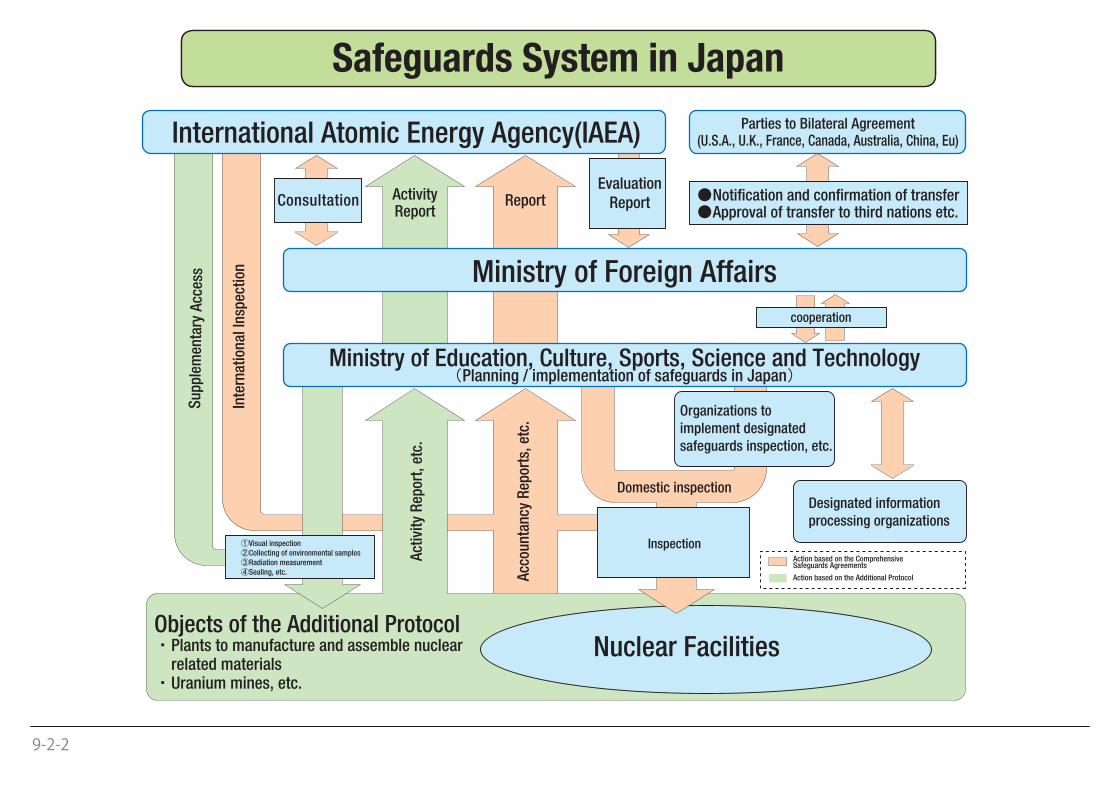
�
Parties to Bilateral Agreement(U.S.A., U.K., France, Canada, Australia, China, Eu)
Notification and confirmation of transferApproval of transfer to third nations etc.
ConsultationEvaluation
Report
Designated information
processing organizations
Inte
rnat
ion
al In
spec
tion
Act
ivit
y R
epor
t, e
tc.
Acc
oun
tan
cy R
epor
ts,
etc.
Su
pp
lem
enta
ry A
cces
s
Domestic inspection
Action based on the ComprehensiveSafeguards Agreements
Visual inspection
Collecting of environmental samples
Radiation measurement
Sealing, etc.
International Atomic Energy Agency(IAEA)
Ministry of Education, Culture, Sports, Science and TechnologyPlanning / implementation of safeguards in Japan
Organizations to
implement designated
safeguards inspection, etc.
Nuclear Facilities
Inspection
Objects of the Additional ProtocolPlants to manufacture and assemble nuclear related materials
Uranium mines, etc.
Action based on the Additional Protocol
ReportActivityReport
cooperation
Ministry of Foreign Affairs
9-2-2
Safeguards System in Japan
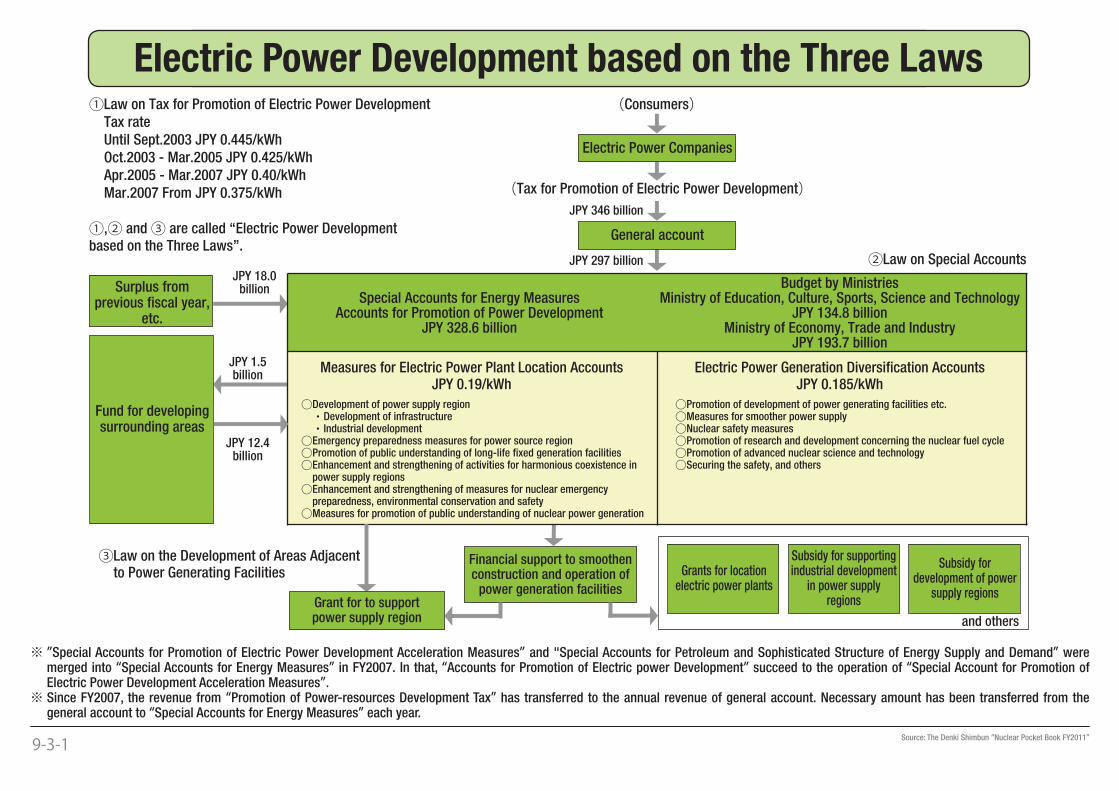
�
①Law on Tax for Promotion of Electric Power Development
Tax rate
Until Sept.2003 JPY 0.445/kWh
Oct.2003 - Mar.2005 JPY 0.425/kWh
Apr.2005 - Mar.2007 JPY 0.40/kWh
Mar.2007 From JPY 0.375/kWh
①,② and ③ are called “Electric Power Developmentbased on the Three Laws”.
(Consumers)
Electric Power Companies
(Tax for Promotion of Electric Power Development)
General account
②Law on Special Accounts
JPY 346 billion
JPY 297 billionJPY 18.0
billion
JPY 12.4billion
JPY 1.5billion
Surplus fromprevious fiscal year,
etc.
Fund for developingsurrounding areas
③Law on the Development of Areas Adjacent to Power Generating Facilities
Special Accounts for Energy MeasuresAccounts for Promotion of Power Development
JPY 328.6 billion
Measures for Electric Power Plant Location AccountsJPY 0.19/kWh
○Development of power supply region ・Development of infrastructure ・Industrial development○Emergency preparedness measures for power source region○Promotion of public understanding of long-life fixed generation facilities○Enhancement and strengthening of activities for harmonious coexistence in power supply regions○Enhancement and strengthening of measures for nuclear emergency preparedness, environmental conservation and safety○Measures for promotion of public understanding of nuclear power generation
Budget by MinistriesMinistry of Education, Culture, Sports, Science and Technology
JPY 134.8 billionMinistry of Economy, Trade and Industry
JPY 193.7 billion
Electric Power Generation Diversification AccountsJPY 0.185/kWh
○Promotion of development of power generating facilities etc.○Measures for smoother power supply○Nuclear safety measures○Promotion of research and development concerning the nuclear fuel cycle○Promotion of advanced nuclear science and technology○Securing the safety, and others
Grant for to supportpower supply region
Financial support to smoothenconstruction and operation of
power generation facilities
Grants for locationelectric power plants
Subsidy for supportingindustrial development
in power supplyregions
Subsidy fordevelopment of power
supply regions
and others
9-3-1 Source: The Denki Shimbun “Nuclear Pocket Book FY2011”
※ ”Special Accounts for Promotion of Electric Power Development Acceleration Measures” and "Special Accounts for Petroleum and Sophisticated Structure of Energy Supply and Demand” were merged into “Special Accounts for Energy Measures” in FY2007. In that, “Accounts for Promotion of Electric power Development” succeed to the operation of “Special Account for Promotion of Electric Power Development Acceleration Measures”.
※ Since FY2007, the revenue from “Promotion of Power-resources Development Tax” has transferred to the annual revenue of general account. Necessary amount has been transferred from the general account to “Special Accounts for Energy Measures” each year.
Electric Power Development based on the Three Laws
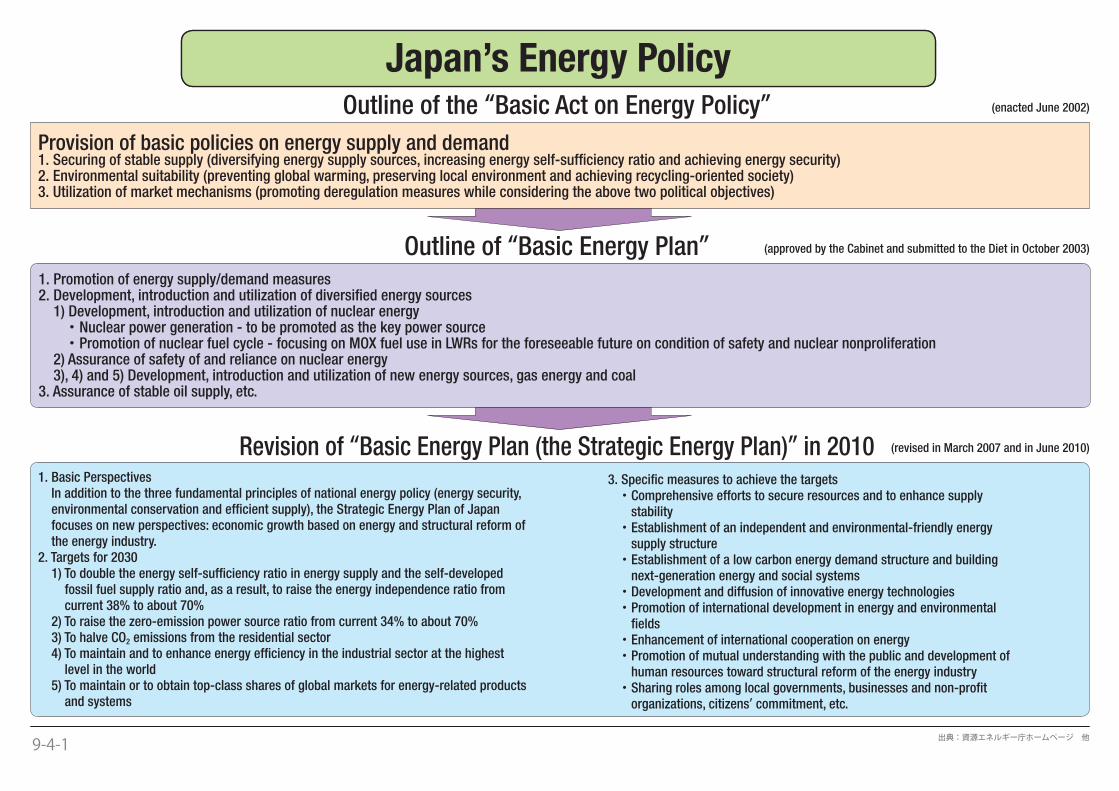
�
Outline of the “Basic Act on Energy Policy” (enacted June 2002)
Provision of basic policies on energy supply and demand1. Securing of stable supply (diversifying energy supply sources, increasing energy self-suffi ciency ratio and achieving energy security)2. Environmental suitability (preventing global warming, preserving local environment and achieving recycling-oriented society)3. Utilization of market mechanisms (promoting deregulation measures while considering the above two political objectives)
Outline of “Basic Energy Plan” (approved by the Cabinet and submitted to the Diet in October 2003)
1. Promotion of energy supply/demand measures2. Development, introduction and utilization of diversifi ed energy sources 1) Development, introduction and utilization of nuclear energy ・Nuclear power generation - to be promoted as the key power source ・Promotion of nuclear fuel cycle - focusing on MOX fuel use in LWRs for the foreseeable future on condition of safety and nuclear nonproliferation 2) Assurance of safety of and reliance on nuclear energy 3), 4) and 5) Development, introduction and utilization of new energy sources, gas energy and coal3. Assurance of stable oil supply, etc.
Revision of “Basic Energy Plan (the Strategic Energy Plan)” in 2010 (revised in March 2007 and in June 2010)
1. Basic Perspectives In addition to the three fundamental principles of national energy policy (energy security, environmental conservation and effi cient supply), the Strategic Energy Plan of Japan focuses on new perspectives: economic growth based on energy and structural reform of the energy industry.2. Targets for 2030 1) To double the energy self-suffi ciency ratio in energy supply and the self-developed fossil fuel supply ratio and, as a result, to raise the energy independence ratio from current 38% to about 70% 2) To raise the zero-emission power source ratio from current 34% to about 70% 3) To halve CO2 emissions from the residential sector 4) To maintain and to enhance energy effi ciency in the industrial sector at the highest level in the world 5) To maintain or to obtain top-class shares of global markets for energy-related products and systems
9-4-1
Japan’s Energy Policy
出典:資源エネルギー庁ホームページ 他
3. Specifi c measures to achieve the targets ・Comprehensive efforts to secure resources and to enhance supply stability ・Establishment of an independent and environmental-friendly energy supply structure ・Establishment of a low carbon energy demand structure and building next-generation energy and social systems ・Development and diffusion of innovative energy technologies ・Promotion of international development in energy and environmental fi elds ・Enhancement of international cooperation on energy ・Promotion of mutual understanding with the public and development of human resources toward structural reform of the energy industry ・Sharing roles among local governments, businesses and non-profi t organizations, citizens’ commitment, etc.
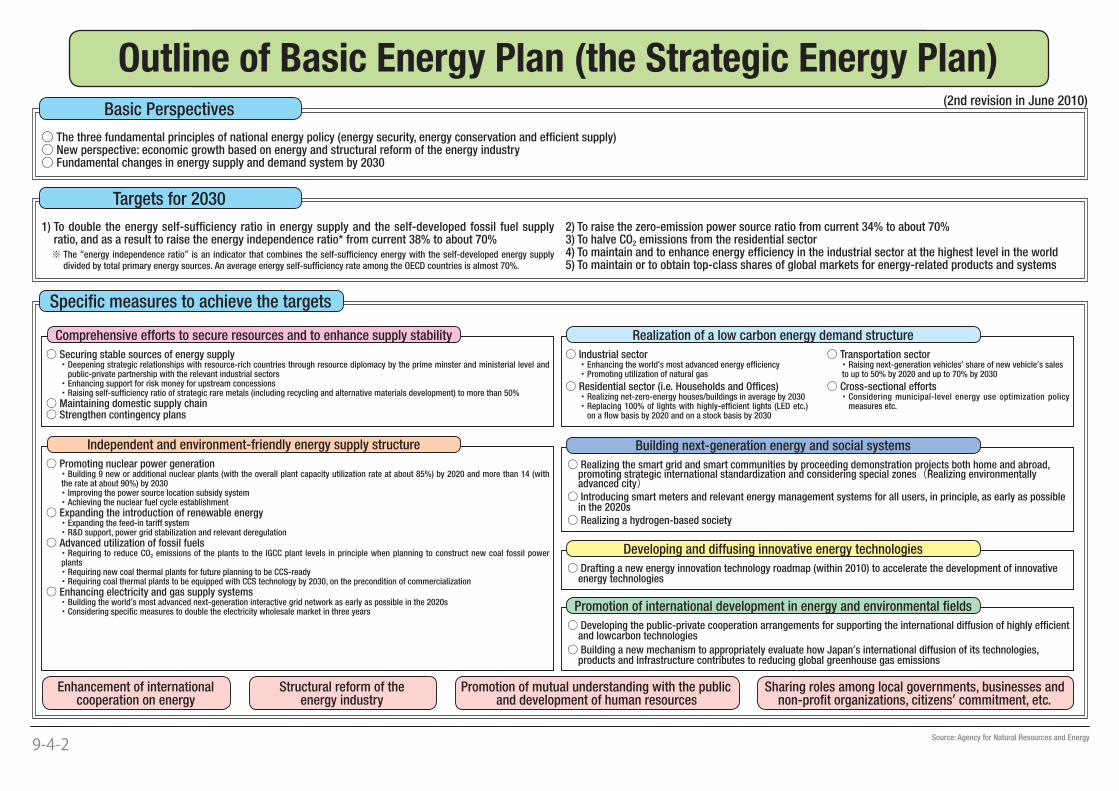
�
(2nd revision in June 2010)
○ The three fundamental principles of national energy policy (energy security, energy conservation and effi cient supply)○ New perspective: economic growth based on energy and structural reform of the energy industry○ Fundamental changes in energy supply and demand system by 2030
1) To double the energy self-suffi ciency ratio in energy supply and the self-developed fossil fuel supply ratio, and as a result to raise the energy independence ratio* from current 38% to about 70%
※ The “energy independence ratio” is an indicator that combines the self-suffi ciency energy with the self-developed energy supply divided by total primary energy sources. An average energy self-suffi ciency rate among the OECD countries is almost 70%.
2) To raise the zero-emission power source ratio from current 34% to about 70%3) To halve CO2 emissions from the residential sector4) To maintain and to enhance energy effi ciency in the industrial sector at the highest level in the world5) To maintain or to obtain top-class shares of global markets for energy-related products and systems
Basic Perspectives
Targets for 2030
Enhancement of internationalcooperation on energy
Structural reform of theenergy industry
Promotion of mutual understanding with the public and development of human resources
Sharing roles among local governments, businesses and non-profi t organizations, citizens’ commitment, etc.
Specifi c measures to achieve the targets
○ Securing stable sources of energy supply・ Deepening strategic relationships with resource-rich countries through resource diplomacy by the prime minster and ministerial level and
public-private partnership with the relevant industrial sectors・ Enhancing support for risk money for upstream concessions・ Raising self-suffi ciency ratio of strategic rare metals (including recycling and alternative materials development) to more than 50%
○ Maintaining domestic supply chain○ Strengthen contingency plans
○ Promoting nuclear power generation・Building 9 new or additional nuclear plants (with the overall plant capacity utilization rate at about 85%) by 2020 and more than 14 (with the rate at about 90%) by 2030・Improving the power source location subsidy system・Achieving the nuclear fuel cycle establishment
○ Expanding the introduction of renewable energy・Expanding the feed-in tariff system・R&D support, power grid stabilization and relevant deregulation
○ Advanced utilization of fossil fuels・Requiring to reduce CO2 emissions of the plants to the IGCC plant levels in principle when planning to construct new coal fossil power plants・Requiring new coal thermal plants for future planning to be CCS-ready・Requiring coal thermal plants to be equipped with CCS technology by 2030, on the precondition of commercialization
○ Enhancing electricity and gas supply systems・Building the world’s most advanced next-generation interactive grid network as early as possible in the 2020s・Considering specifi c measures to double the electricity wholesale market in three years
○ Industrial sector・ Enhancing the world’s most advanced energy effi ciency・ Promoting utilization of natural gas
○ Residential sector (i.e. Households and Offi ces)・ Realizing net-zero-energy houses/buildings in average by 2030・ Replacing 100% of lights with highly-effi cient lights (LED etc.)
on a fl ow basis by 2020 and on a stock basis by 2030
○ Transportation sector・ Raising next-generation vehicles’ share of new vehicle’s salesto up to 50% by 2020 and up to 70% by 2030
○ Cross-sectional efforts・ Considering municipal-level energy use optimization policy
measures etc.
○ Realizing the smart grid and smart communities by proceeding demonstration projects both home and abroad, promoting strategic international standardization and considering special zones(Realizing environmentally advanced city)
○ Introducing smart meters and relevant energy management systems for all users, in principle, as early as possible in the 2020s
○ Realizing a hydrogen-based society
○ Drafting a new energy innovation technology roadmap (within 2010) to accelerate the development of innovative energy technologies
○ Developing the public-private cooperation arrangements for supporting the international diffusion of highly effi cient and lowcarbon technologies
○ Building a new mechanism to appropriately evaluate how Japan’s international diffusion of its technologies, products and infrastructure contributes to reducing global greenhouse gas emissions
Comprehensive efforts to secure resources and to enhance supply stability
Independent and environment-friendly energy supply structure
Realization of a low carbon energy demand structure
Building next-generation energy and social systems
Developing and diffusing innovative energy technologies
Promotion of international development in energy and environmental fi elds
9-4-2
Source: Agency for Natural Resources and Energy
Outline of Basic Energy Plan (the Strategic Energy Plan)
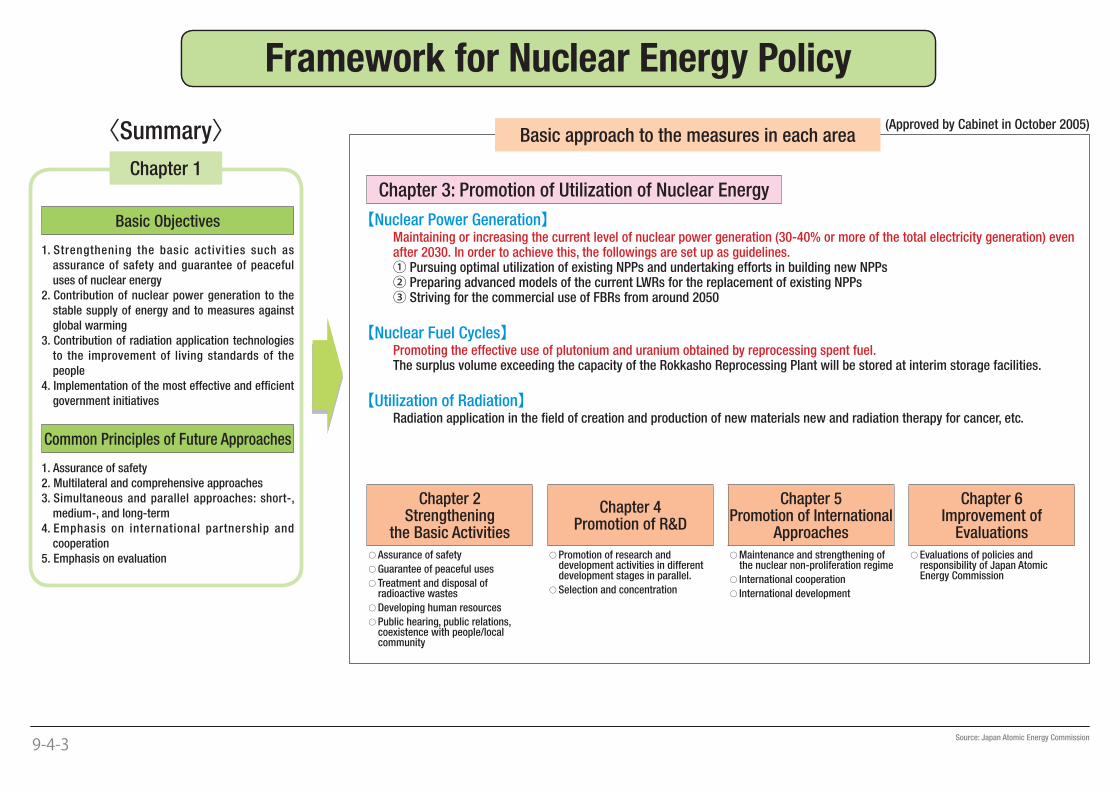
�
Chapter 1
Basic approach to the measures in each area(Approved by Cabinet in October 2005)〈Summary〉
Basic Objectives
1. Strengthening the basic activities such as
assurance of safety and guarantee of peaceful
uses of nuclear energy
2. Contribution of nuclear power generation to the
stable supply of energy and to measures against
global warming
3. Contribution of radiation application technologies
to the improvement of living standards of the
people
4. Implementation of the most effective and effi cient
government initiatives
Common Principles of Future Approaches
1. Assurance of safety
2. Multilateral and comprehensive approaches
3. Simultaneous and parallel approaches: short-,
medium-, and long-term
4. Emphasis on international partnership and
cooperation
5. Emphasis on evaluation
Chapter 3: Promotion of Utilization of Nuclear Energy
【Nuclear Power Generation】Maintaining or increasing the current level of nuclear power generation (30-40% or more of the total electricity generation) even after 2030. In order to achieve this, the followings are set up as guidelines.① Pursuing optimal utilization of existing NPPs and undertaking efforts in building new NPPs② Preparing advanced models of the current LWRs for the replacement of existing NPPs③ Striving for the commercial use of FBRs from around 2050
【Nuclear Fuel Cycles】Promoting the effective use of plutonium and uranium obtained by reprocessing spent fuel.The surplus volume exceeding the capacity of the Rokkasho Reprocessing Plant will be stored at interim storage facilities.
【Utilization of Radiation】Radiation application in the fi eld of creation and production of new materials new and radiation therapy for cancer, etc.
Chapter 2Strengthening
the Basic Activities
○ Assurance of safety
○ Guarantee of peaceful uses
○ Treatment and disposal of radioactive wastes
○ Developing human resources
○ Public hearing, public relations, coexistence with people/local community
Chapter 5Promotion of International
Approaches
○Maintenance and strengthening of the nuclear non-proliferation regime
○ International cooperation
○ International development
Chapter 4Promotion of R&D
○ Promotion of research and development activities in different development stages in parallel.
○ Selection and concentration
Chapter 6Improvement of
Evaluations
○ Evaluations of policies and responsibility of Japan Atomic Energy Commission
9-4-3 Source: Japan Atomic Energy Commission
Framework for Nuclear Energy Policy
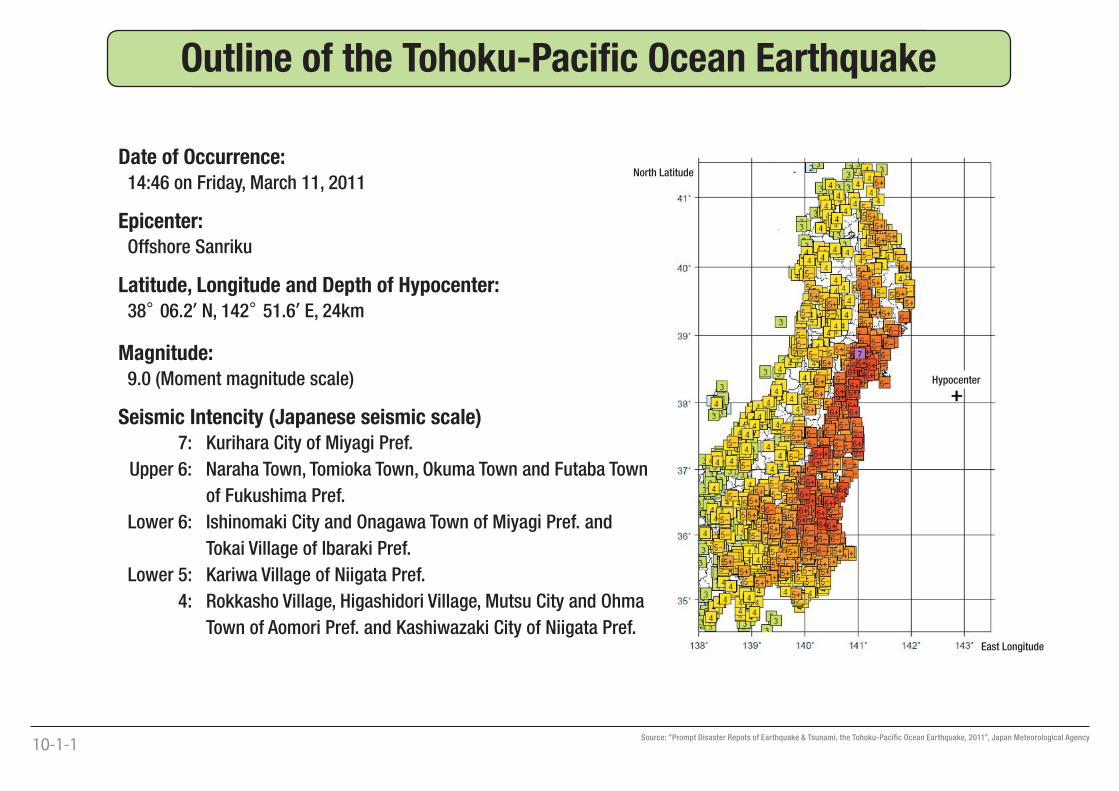
Date of Occurrence: 14:46 on Friday, March 11, 2011
Epicenter: Offshore Sanriku
Latitude, Longitude and Depth of Hypocenter: 38°06.2’ N, 142°51.6’ E, 24km
Magnitude: 9.0 (Moment magnitude scale)
Seismic Intencity (Japanese seismic scale) 7: Kurihara City of Miyagi Pref.
Upper 6: Naraha Town, Tomioka Town, Okuma Town and Futaba Town
of Fukushima Pref.
Lower 6: Ishinomaki City and Onagawa Town of Miyagi Pref. and
Tokai Village of Ibaraki Pref.
Lower 5: Kariwa Village of Niigata Pref.
4: Rokkasho Village, Higashidori Village, Mutsu City and Ohma
Town of Aomori Pref. and Kashiwazaki City of Niigata Pref.
Hypocenter
North Latitude
East Longitude
�
10-1-1 Source: “Prompt Disaster Repots of Earthquake & Tsunami, the Tohoku-Pacifi c Ocean Earthquake, 2011”, Japan Meteorological Agency
Outline of the Tohoku-Pacifi c Ocean Earthquake
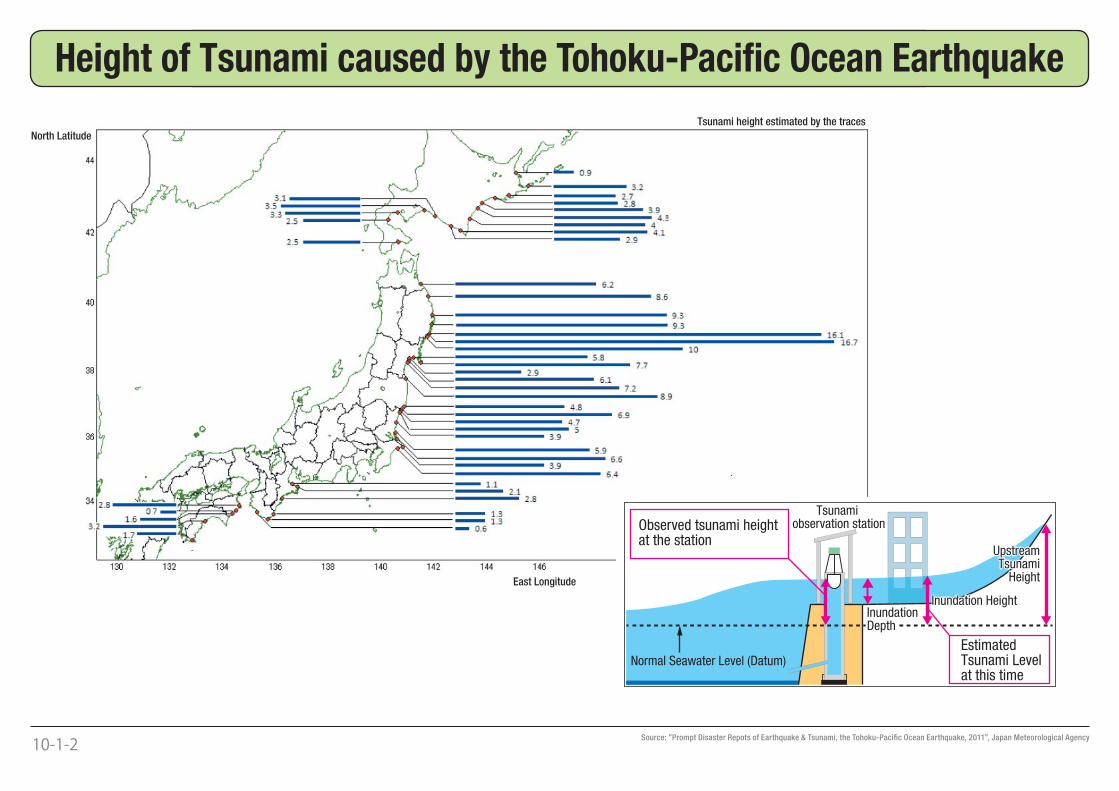
Observed tsunami height at the station
Estimated Tsunami Level at this time
Tsunami observation station
Normal Seawater Level (Datum)
Inundation Depth
UpstreamTsunami
Height
Inundation Height
(緯度)North Latitude
Tsunami height estimated by the traces
East Longitude
�
10-1-2 Source: “Prompt Disaster Repots of Earthquake & Tsunami, the Tohoku-Pacifi c Ocean Earthquake, 2011”, Japan Meteorological Agency
Height of Tsunami caused by the Tohoku-Pacifi c Ocean Earthquake
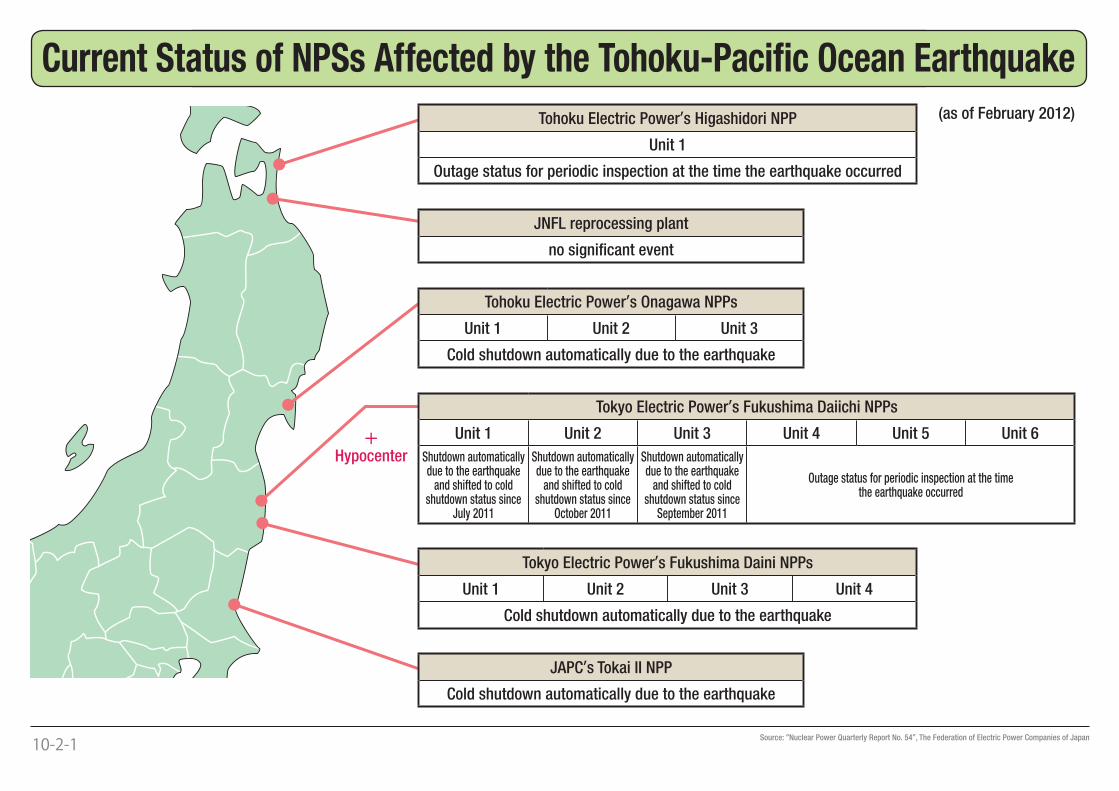
Tohoku Electric Power’s Higashidori NPP
Unit 1
Outage status for periodic inspection at the time the earthquake occurred
JNFL reprocessing plant
no signifi cant event
Tohoku Electric Power’s Onagawa NPPs
Unit 1 Unit 2 Unit 3
Cold shutdown automatically due to the earthquake
Tokyo Electric Power’s Fukushima Daiichi NPPs
Unit 1 Unit 2 Unit 3 Unit 4 Unit 5 Unit 6
Shutdown automatically due to the earthquake
and shifted to cold shutdown status since
July 2011
Shutdown automatically due to the earthquake
and shifted to cold shutdown status since
October 2011
Shutdown automatically due to the earthquake
and shifted to cold shutdown status since
September 2011
Outage status for periodic inspection at the time the earthquake occurred
Tokyo Electric Power’s Fukushima Daini NPPs
Unit 1 Unit 2 Unit 3 Unit 4
Cold shutdown automatically due to the earthquake
JAPC’s Tokai II NPP
Cold shutdown automatically due to the earthquake
+Hypocenter
(as of February 2012)
�
10-2-1 Source: “Nuclear Power Quarterly Report No. 54”, The Federation of Electric Power Companies of Japan
Current Status of NPSs Affected by the Tohoku-Pacifi c Ocean Earthquake
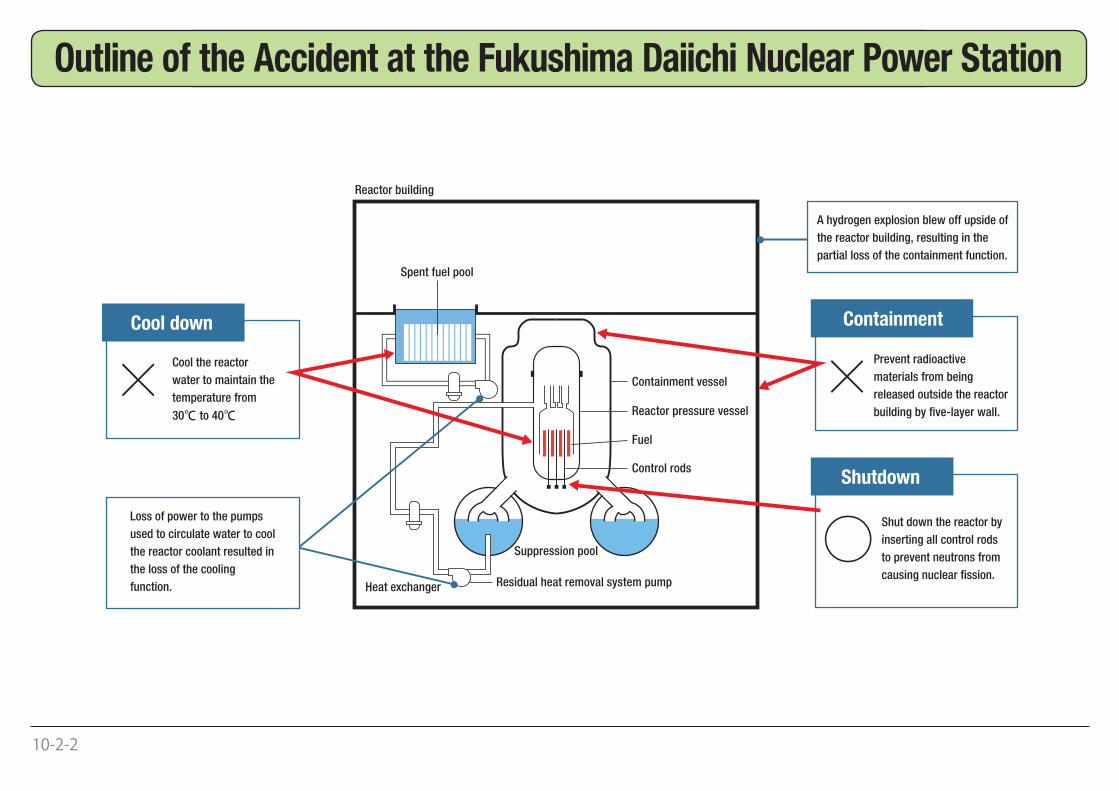
Spent fuel pool
Reactor building
Containment vessel
Reactor pressure vessel
Fuel
Control rods
Suppression pool
Residual heat removal system pumpHeat exchanger
Shut down the reactor by
inserting all control rods
to prevent neutrons from
causing nuclear fission.
○Shutdown
Cool the reactor
water to maintain the
temperature from
30℃ to 40℃
Loss of power to the pumps
used to circulate water to cool
the reactor coolant resulted in
the loss of the cooling
function.
×Cool down
Prevent radioactive
materials from being
released outside the reactor
building by five-layer wall.
×Containment
A hydrogen explosion blew off upside of
the reactor building, resulting in the
partial loss of the containment function.
�
10-2-2
Outline of the Accident at the Fukushima Daiichi Nuclear Power Station
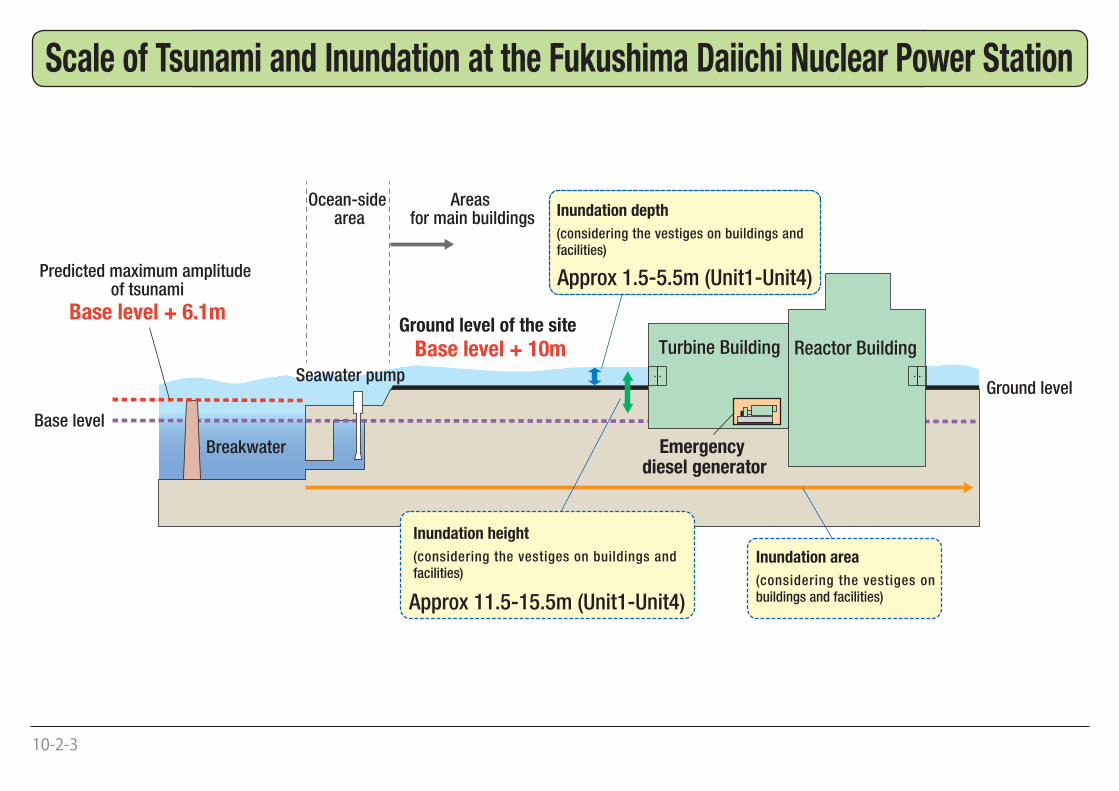
Predicted maximum amplitude of tsunami
Base level + 6.1m
Ocean-side area
Areas for main buildings
Ground level of the site
Base level + 10mSeawater pump
Ground level
Turbine Building
Emergency diesel generator
Base level
Breakwater
Reactor Building
Inundation depth
(considering the vestiges on buildings and facilities)
Approx 1.5-5.5m (Unit1-Unit4)
Inundation height
(considering the vestiges on buildings and facilities)
Approx 11.5-15.5m (Unit1-Unit4)
Inundation area
(considering the vestiges on buildings and facilities)
�
10-2-3
Scale of Tsunami and Inundation at the Fukushima Daiichi Nuclear Power Station
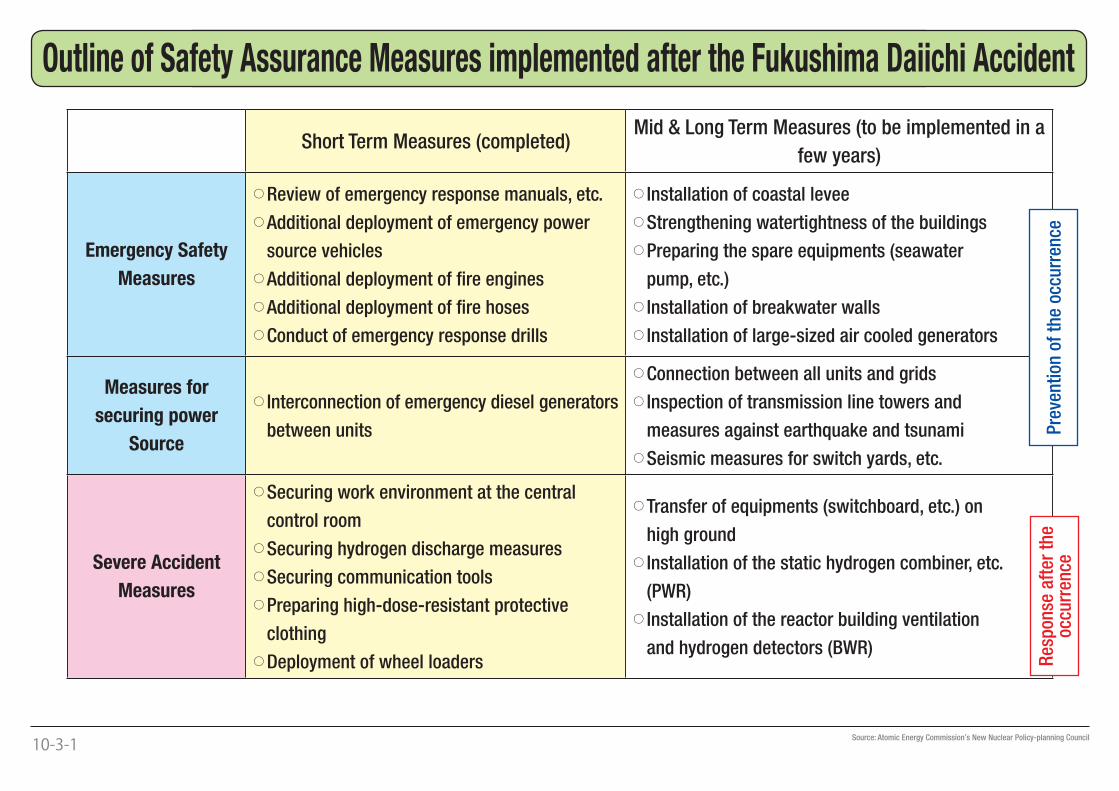
Short Term Measures (completed)Mid & Long Term Measures (to be implemented in a
few years)
Emergency Safety
Measures
○ Review of emergency response manuals, etc.
○ Additional deployment of emergency power
source vehicles
○ Additional deployment of fi re engines
○ Additional deployment of fi re hoses
○ Conduct of emergency response drills
○ Installation of coastal levee
○ Strengthening watertightness of the buildings
○ Preparing the spare equipments (seawater
pump, etc.)
○ Installation of breakwater walls
○ Installation of large-sized air cooled generators
Measures for
securing power
Source
○ Interconnection of emergency diesel generators
between units
○ Connection between all units and grids
○ Inspection of transmission line towers and
measures against earthquake and tsunami
○ Seismic measures for switch yards, etc.
Severe Accident
Measures
○ Securing work environment at the central
control room
○ Securing hydrogen discharge measures
○ Securing communication tools
○ Preparing high-dose-resistant protective
clothing
○ Deployment of wheel loaders
○ Transfer of equipments (switchboard, etc.) on
high ground
○ Installation of the static hydrogen combiner, etc.
(PWR)
○ Installation of the reactor building ventilation
and hydrogen detectors (BWR)
Pre
ven
tion
of
the
occu
rren
ceR
esp
onse
aft
er t
he
occu
rren
ce
�
10-3-1 Source: Atomic Energy Commission’s New Nuclear Policy-planning Council
Outline of Safety Assurance Measures implemented after the Fukushima Daiichi Accident
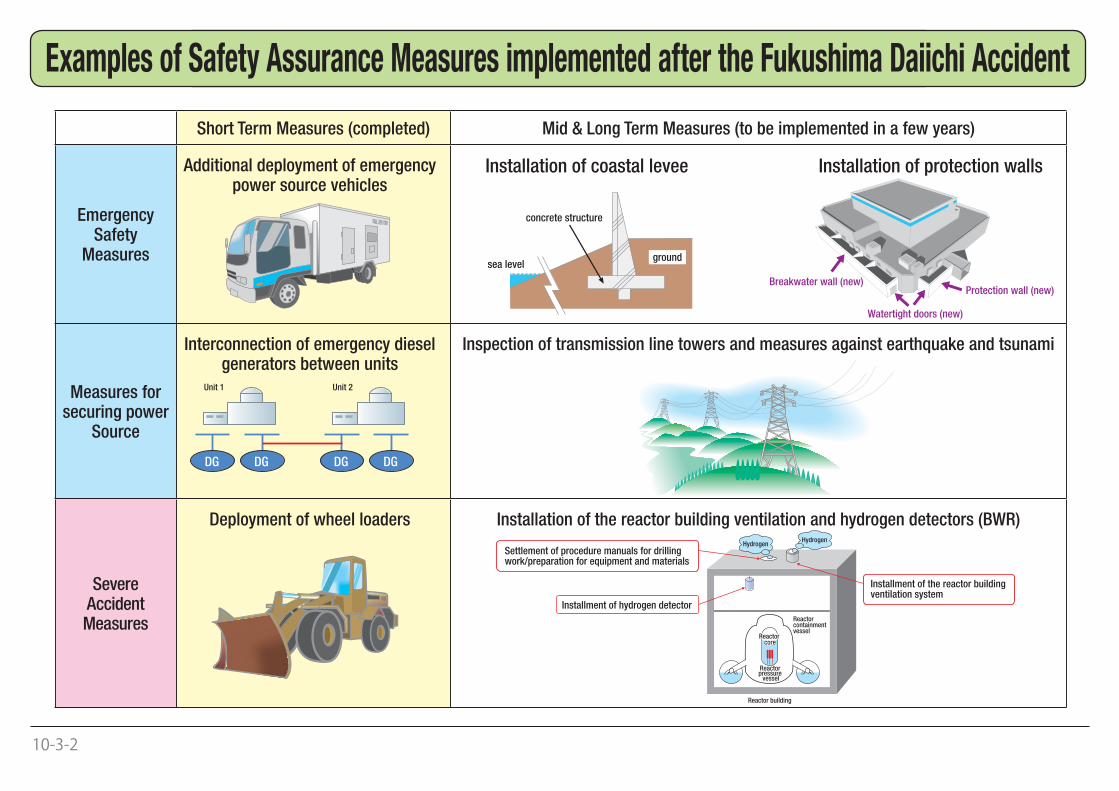
Short Term Measures (completed) Mid & Long Term Measures (to be implemented in a few years)
Emergency Safety
Measures
Additional deployment of emergency power source vehicles
Installation of coastal levee Installation of protection walls
Measures for securing power
Source
Interconnection of emergency diesel generators between units
Inspection of transmission line towers and measures against earthquake and tsunami
Severe Accident Measures
Deployment of wheel loaders Installation of the reactor building ventilation and hydrogen detectors (BWR)
DG
Unit 1 Unit 2
DG DG DG
concrete structure
sea levelground
Breakwater wall (new)
Watertight doors (new)
Protection wall (new)
Reactor pressure
vessel
Reactor containment vessel
Reactor core
Reactor building
HydrogenHydrogen
Installment of the reactor building ventilation system
Installment of hydrogen detector
Settlement of procedure manuals for drilling work/preparation for equipment and materials
�
10-3-2
Examples of Safety Assurance Measures implemented after the Fukushima Daiichi Accident
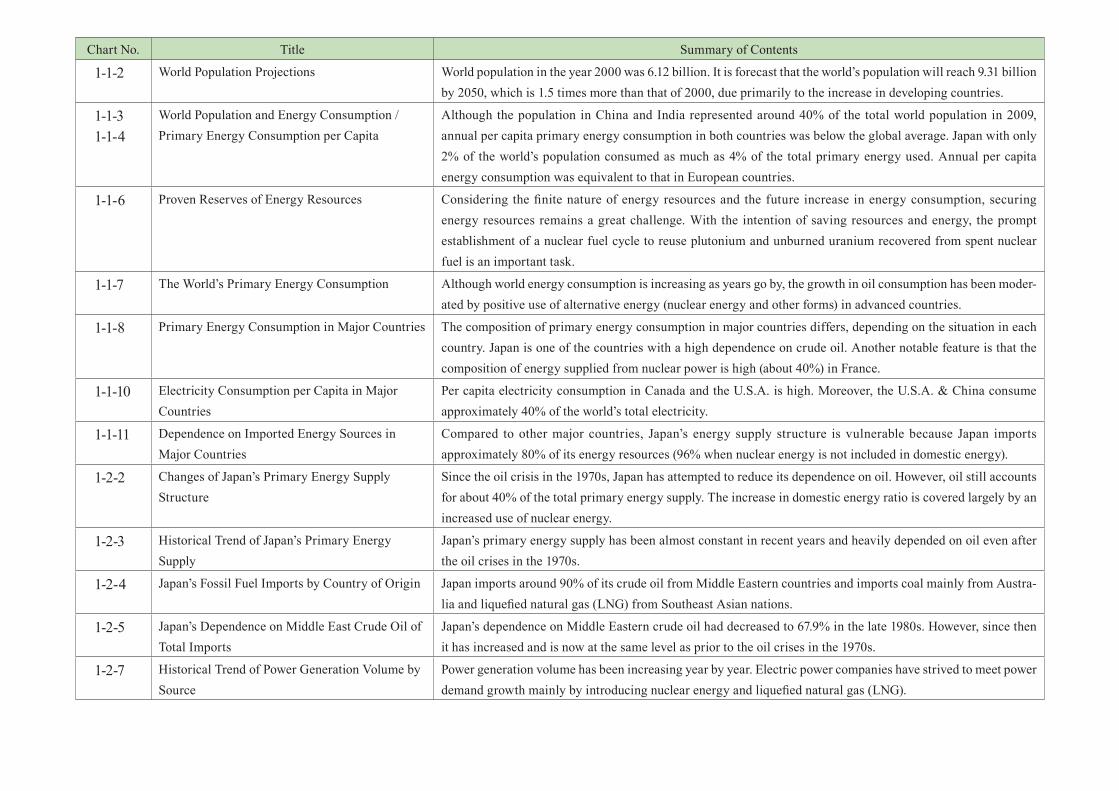
Chart No. Title Summary of Contents
1-1-2 World Population Projections World population in the year 2000 was 6.12 billion. It is forecast that the world’s population will reach 9.31 billion by 2050, which is 1.5 times more than that of 2000, due primarily to the increase in developing countries.
1-1-31-1-4
World Population and Energy Consumption /Primary Energy Consumption per Capita
Although the population in China and India represented around 40% of the total world population in 2009, annual per capita primary energy consumption in both countries was below the global average. Japan with only 2% of the world’s population consumed as much as 4% of the total primary energy used. Annual per capita energy consumption was equivalent to that in European countries.
1-1-6 Proven Reserves of Energy Resources Considering the fi nite nature of energy resources and the future increase in energy consumption, securing energy resources remains a great challenge. With the intention of saving resources and energy, the prompt establishment of a nuclear fuel cycle to reuse plutonium and unburned uranium recovered from spent nuclear fuel is an important task.
1-1-7 The World’s Primary Energy Consumption Although world energy consumption is increasing as years go by, the growth in oil consumption has been moder-ated by positive use of alternative energy (nuclear energy and other forms) in advanced countries.
1-1-8 Primary Energy Consumption in Major Countries The composition of primary energy consumption in major countries differs, depending on the situation in each country. Japan is one of the countries with a high dependence on crude oil. Another notable feature is that the composition of energy supplied from nuclear power is high (about 40%) in France.
1-1-10 Electricity Consumption per Capita in Major Countries
Per capita electricity consumption in Canada and the U.S.A. is high. Moreover, the U.S.A. & China consume approximately 40% of the world’s total electricity.
1-1-11 Dependence on Imported Energy Sources in Major Countries
Compared to other major countries, Japan’s energy supply structure is vulnerable because Japan imports approximately 80% of its energy resources (96% when nuclear energy is not included in domestic energy).
1-2-2 Changes of Japan’s Primary Energy Supply Structure
Since the oil crisis in the 1970s, Japan has attempted to reduce its dependence on oil. However, oil still accounts for about 40% of the total primary energy supply. The increase in domestic energy ratio is covered largely by an increased use of nuclear energy.
1-2-3 Historical Trend of Japan’s Primary Energy Supply
Japan’s primary energy supply has been almost constant in recent years and heavily depended on oil even after the oil crises in the 1970s.
1-2-4 Japan’s Fossil Fuel Imports by Country of Origin Japan imports around 90% of its crude oil from Middle Eastern countries and imports coal mainly from Austra-lia and liquefi ed natural gas (LNG) from Southeast Asian nations.
1-2-5 Japan’s Dependence on Middle East Crude Oil of Total Imports
Japan’s dependence on Middle Eastern crude oil had decreased to 67.9% in the late 1980s. However, since then it has increased and is now at the same level as prior to the oil crises in the 1970s.
1-2-7 Historical Trend of Power Generation Volume by Source
Power generation volume has been increasing year by year. Electric power companies have strived to meet power demand growth mainly by introducing nuclear energy and liquefi ed natural gas (LNG).
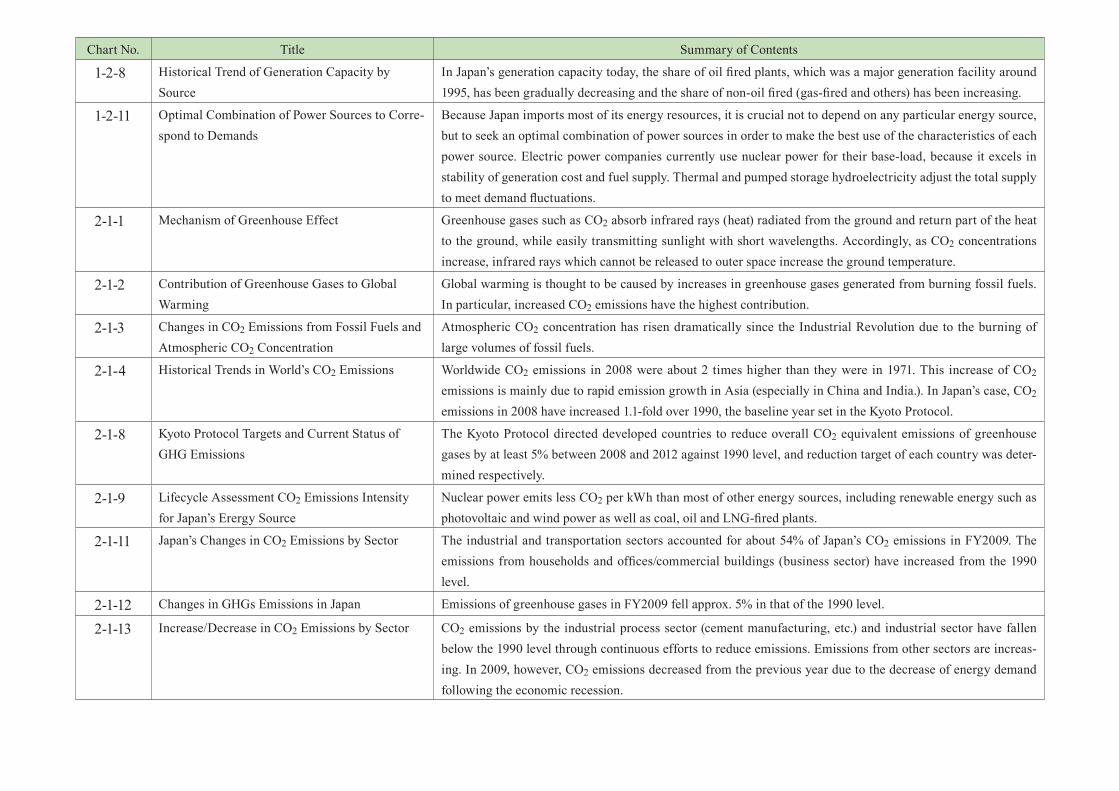
Chart No. Title Summary of Contents
1-2-8 Historical Trend of Generation Capacity by Source
In Japan’s generation capacity today, the share of oil fi red plants, which was a major generation facility around 1995, has been gradually decreasing and the share of non-oil fi red (gas-fi red and others) has been increasing.
1-2-11 Optimal Combination of Power Sources to Corre-spond to Demands
Because Japan imports most of its energy resources, it is crucial not to depend on any particular energy source, but to seek an optimal combination of power sources in order to make the best use of the characteristics of each power source. Electric power companies currently use nuclear power for their base-load, because it excels in stability of generation cost and fuel supply. Thermal and pumped storage hydroelectricity adjust the total supply to meet demand fl uctuations.
2-1-1 Mechanism of Greenhouse Effect Greenhouse gases such as CO2 absorb infrared rays (heat) radiated from the ground and return part of the heat to the ground, while easily transmitting sunlight with short wavelengths. Accordingly, as CO2 concentrations increase, infrared rays which cannot be released to outer space increase the ground temperature.
2-1-2 Contribution of Greenhouse Gases to Global Warming
Global warming is thought to be caused by increases in greenhouse gases generated from burning fossil fuels. In particular, increased CO2 emissions have the highest contribution.
2-1-3 Changes in CO2 Emissions from Fossil Fuels and Atmospheric CO2 Concentration
Atmospheric CO2 concentration has risen dramatically since the Industrial Revolution due to the burning of large volumes of fossil fuels.
2-1-4 Historical Trends in World’s CO2 Emissions Worldwide CO2 emissions in 2008 were about 2 times higher than they were in 1971. This increase of CO2 emissions is mainly due to rapid emission growth in Asia (especially in China and India.). In Japan’s case, CO2 emissions in 2008 have increased 1.1-fold over 1990, the baseline year set in the Kyoto Protocol.
2-1-8 Kyoto Protocol Targets and Current Status of GHG Emissions
The Kyoto Protocol directed developed countries to reduce overall CO2 equivalent emissions of greenhouse gases by at least 5% between 2008 and 2012 against 1990 level, and reduction target of each country was deter-mined respectively.
2-1-9 Lifecycle Assessment CO2 Emissions Intensity for Japan’s Erergy Source
Nuclear power emits less CO2 per kWh than most of other energy sources, including renewable energy such as photovoltaic and wind power as well as coal, oil and LNG-fi red plants.
2-1-11 Japan’s Changes in CO2 Emissions by Sector The industrial and transportation sectors accounted for about 54% of Japan’s CO2 emissions in FY2009. The emissions from households and offi ces/commercial buildings (business sector) have increased from the 1990 level.
2-1-12 Changes in GHGs Emissions in Japan Emissions of greenhouse gases in FY2009 fell approx. 5% in that of the 1990 level.
2-1-13 Increase/Decrease in CO2 Emissions by Sector CO2 emissions by the industrial process sector (cement manufacturing, etc.) and industrial sector have fallen below the 1990 level through continuous efforts to reduce emissions. Emissions from other sectors are increas-ing. In 2009, however, CO2 emissions decreased from the previous year due to the decrease of energy demand following the economic recession.
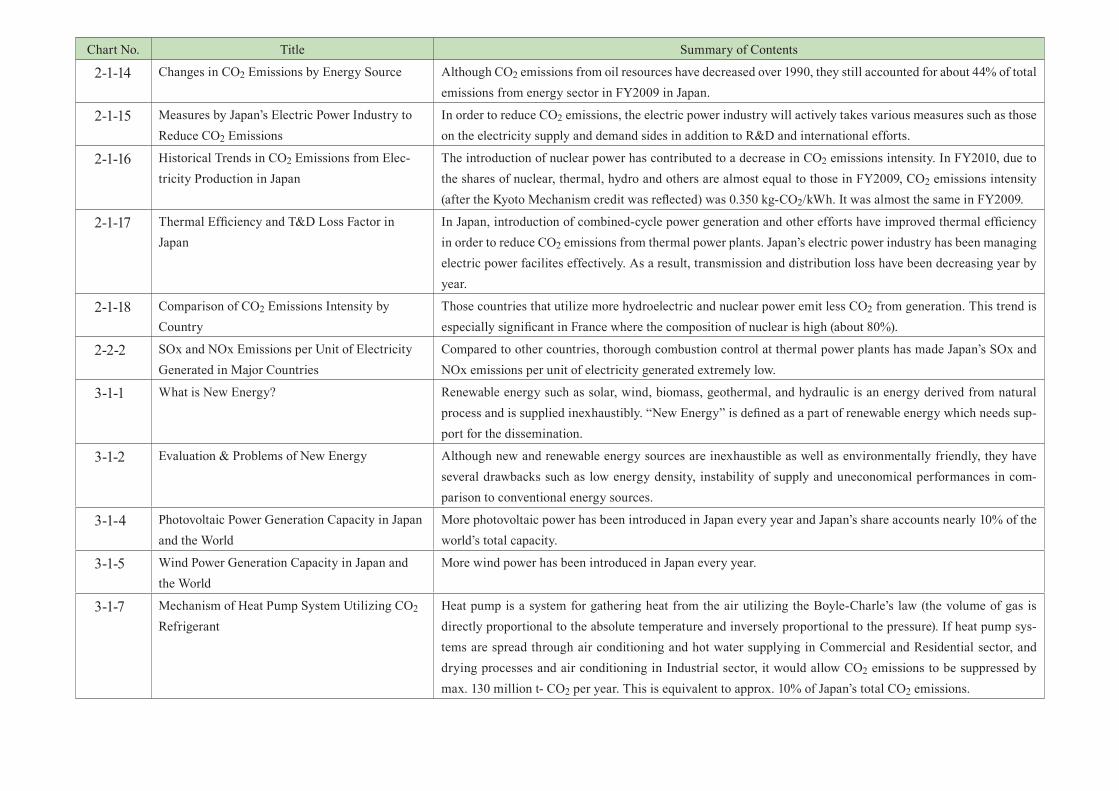
Chart No. Title Summary of Contents
2-1-14 Changes in CO2 Emissions by Energy Source Although CO2 emissions from oil resources have decreased over 1990, they still accounted for about 44% of total emissions from energy sector in FY2009 in Japan.
2-1-15 Measures by Japan’s Electric Power Industry to Reduce CO2 Emissions
In order to reduce CO2 emissions, the electric power industry will actively takes various measures such as those on the electricity supply and demand sides in addition to R&D and international efforts.
2-1-16 Historical Trends in CO2 Emissions from Elec-tricity Production in Japan
The introduction of nuclear power has contributed to a decrease in CO2 emissions intensity. In FY2010, due to the shares of nuclear, thermal, hydro and others are almost equal to those in FY2009, CO2 emissions intensity (after the Kyoto Mechanism credit was refl ected) was 0.350 kg-CO2/kWh. It was almost the same in FY2009.
2-1-17 Thermal Effi ciency and T&D Loss Factor in Japan
In Japan, introduction of combined-cycle power generation and other efforts have improved thermal effi ciency in order to reduce CO2 emissions from thermal power plants. Japan’s electric power industry has been managing electric power facilites effectively. As a result, transmission and distribution loss have been decreasing year by year.
2-1-18 Comparison of CO2 Emissions Intensity by Country
Those countries that utilize more hydroelectric and nuclear power emit less CO2 from generation. This trend is especially signifi cant in France where the composition of nuclear is high (about 80%).
2-2-2 SOx and NOx Emissions per Unit of Electricity Generated in Major Countries
Compared to other countries, thorough combustion control at thermal power plants has made Japan’s SOx and NOx emissions per unit of electricity generated extremely low.
3-1-1 What is New Energy? Renewable energy such as solar, wind, biomass, geothermal, and hydraulic is an energy derived from natural process and is supplied inexhaustibly. “New Energy” is defi ned as a part of renewable energy which needs sup-port for the dissemination.
3-1-2 Evaluation & Problems of New Energy Although new and renewable energy sources are inexhaustible as well as environmentally friendly, they have several drawbacks such as low energy density, instability of supply and uneconomical performances in com-parison to conventional energy sources.
3-1-4 Photovoltaic Power Generation Capacity in Japan and the World
More photovoltaic power has been introduced in Japan every year and Japan’s share accounts nearly 10% of the world’s total capacity.
3-1-5 Wind Power Generation Capacity in Japan and the World
More wind power has been introduced in Japan every year.
3-1-7 Mechanism of Heat Pump System Utilizing CO2 Refrigerant
Heat pump is a system for gathering heat from the air utilizing the Boyle-Charle’s law (the volume of gas is directly proportional to the absolute temperature and inversely proportional to the pressure). If heat pump sys-tems are spread through air conditioning and hot water supplying in Commercial and Residential sector, and drying processes and air conditioning in Industrial sector, it would allow CO2 emissions to be suppressed by max. 130 million t- CO2 per year. This is equivalent to approx. 10% of Japan’s total CO2 emissions.
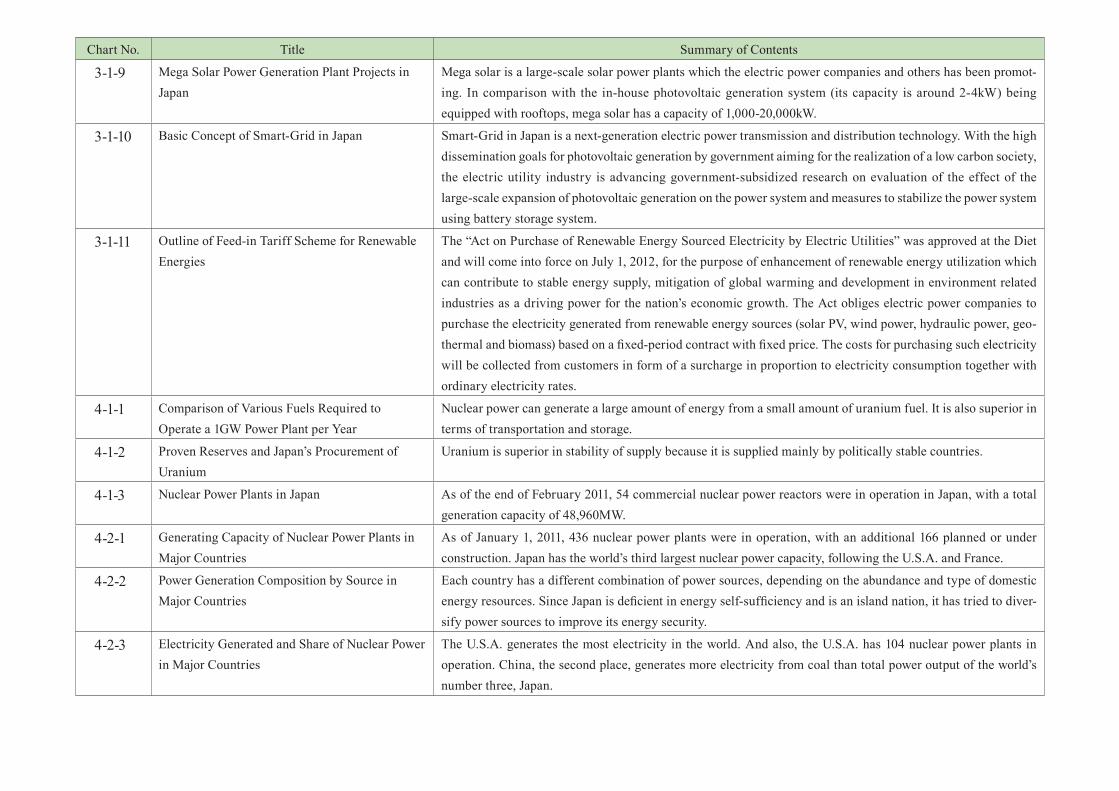
Chart No. Title Summary of Contents
3-1-9 Mega Solar Power Generation Plant Projects in Japan
Mega solar is a large-scale solar power plants which the electric power companies and others has been promot-ing. In comparison with the in-house photovoltaic generation system (its capacity is around 2-4kW) being equipped with rooftops, mega solar has a capacity of 1,000-20,000kW.
3-1-10 Basic Concept of Smart-Grid in Japan Smart-Grid in Japan is a next-generation electric power transmission and distribution technology. With the high dissemination goals for photovoltaic generation by government aiming for the realization of a low carbon society, the electric utility industry is advancing government-subsidized research on evaluation of the effect of the large-scale expansion of photovoltaic generation on the power system and measures to stabilize the power system using battery storage system.
3-1-11 Outline of Feed-in Tariff Scheme for Renewable Energies
The “Act on Purchase of Renewable Energy Sourced Electricity by Electric Utilities” was approved at the Diet and will come into force on July 1, 2012, for the purpose of enhancement of renewable energy utilization which can contribute to stable energy supply, mitigation of global warming and development in environment related industries as a driving power for the nation’s economic growth. The Act obliges electric power companies to purchase the electricity generated from renewable energy sources (solar PV, wind power, hydraulic power, geo-thermal and biomass) based on a fi xed-period contract with fi xed price. The costs for purchasing such electricity will be collected from customers in form of a surcharge in proportion to electricity consumption together with ordinary electricity rates.
4-1-1 Comparison of Various Fuels Required to Operate a 1GW Power Plant per Year
Nuclear power can generate a large amount of energy from a small amount of uranium fuel. It is also superior in terms of transportation and storage.
4-1-2 Proven Reserves and Japan’s Procurement of Uranium
Uranium is superior in stability of supply because it is supplied mainly by politically stable countries.
4-1-3 Nuclear Power Plants in Japan As of the end of February 2011, 54 commercial nuclear power reactors were in operation in Japan, with a total generation capacity of 48,960MW.
4-2-1 Generating Capacity of Nuclear Power Plants in Major Countries
As of January 1, 2011, 436 nuclear power plants were in operation, with an additional 166 planned or under construction. Japan has the world’s third largest nuclear power capacity, following the U.S.A. and France.
4-2-2 Power Generation Composition by Source in Major Countries
Each country has a different combination of power sources, depending on the abundance and type of domestic energy resources. Since Japan is defi cient in energy self-suffi ciency and is an island nation, it has tried to diver-sify power sources to improve its energy security.
4-2-3 Electricity Generated and Share of Nuclear Power in Major Countries
The U.S.A. generates the most electricity in the world. And also, the U.S.A. has 104 nuclear power plants in operation. China, the second place, generates more electricity from coal than total power output of the world’s number three, Japan.
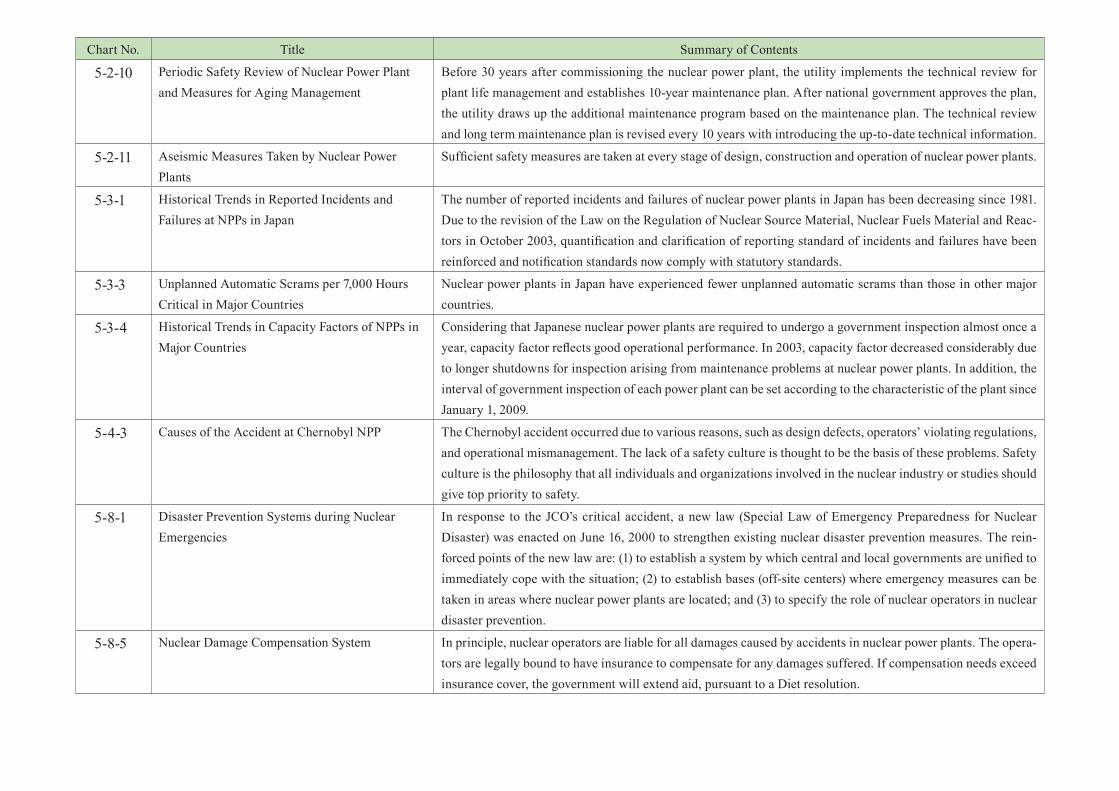
Chart No. Title Summary of Contents
5-2-10 Periodic Safety Review of Nuclear Power Plant and Measures for Aging Management
Before 30 years after commissioning the nuclear power plant, the utility implements the technical review for plant life management and establishes 10-year maintenance plan. After national government approves the plan, the utility draws up the additional maintenance program based on the maintenance plan. The technical review and long term maintenance plan is revised every 10 years with introducing the up-to-date technical information.
5-2-11 Aseismic Measures Taken by Nuclear Power Plants
Suffi cient safety measures are taken at every stage of design, construction and operation of nuclear power plants.
5-3-1 Historical Trends in Reported Incidents and Failures at NPPs in Japan
The number of reported incidents and failures of nuclear power plants in Japan has been decreasing since 1981. Due to the revision of the Law on the Regulation of Nuclear Source Material, Nuclear Fuels Material and Reac-tors in October 2003, quantifi cation and clarifi cation of reporting standard of incidents and failures have been reinforced and notifi cation standards now comply with statutory standards.
5-3-3 Unplanned Automatic Scrams per 7,000 Hours Critical in Major Countries
Nuclear power plants in Japan have experienced fewer unplanned automatic scrams than those in other major countries.
5-3-4 Historical Trends in Capacity Factors of NPPs in Major Countries
Considering that Japanese nuclear power plants are required to undergo a government inspection almost once a year, capacity factor refl ects good operational performance. In 2003, capacity factor decreased considerably due to longer shutdowns for inspection arising from maintenance problems at nuclear power plants. In addition, the interval of government inspection of each power plant can be set according to the characteristic of the plant since January 1, 2009.
5-4-3 Causes of the Accident at Chernobyl NPP The Chernobyl accident occurred due to various reasons, such as design defects, operators’ violating regulations, and operational mismanagement. The lack of a safety culture is thought to be the basis of these problems. Safety culture is the philosophy that all individuals and organizations involved in the nuclear industry or studies should give top priority to safety.
5-8-1 Disaster Prevention Systems during Nuclear Emergencies
In response to the JCO’s critical accident, a new law (Special Law of Emergency Preparedness for Nuclear Disaster) was enacted on June 16, 2000 to strengthen existing nuclear disaster prevention measures. The rein-forced points of the new law are: (1) to establish a system by which central and local governments are unifi ed to immediately cope with the situation; (2) to establish bases (off-site centers) where emergency measures can be taken in areas where nuclear power plants are located; and (3) to specify the role of nuclear operators in nuclear disaster prevention.
5-8-5 Nuclear Damage Compensation System In principle, nuclear operators are liable for all damages caused by accidents in nuclear power plants. The opera-tors are legally bound to have insurance to compensate for any damages suffered. If compensation needs exceed insurance cover, the government will extend aid, pursuant to a Diet resolution.
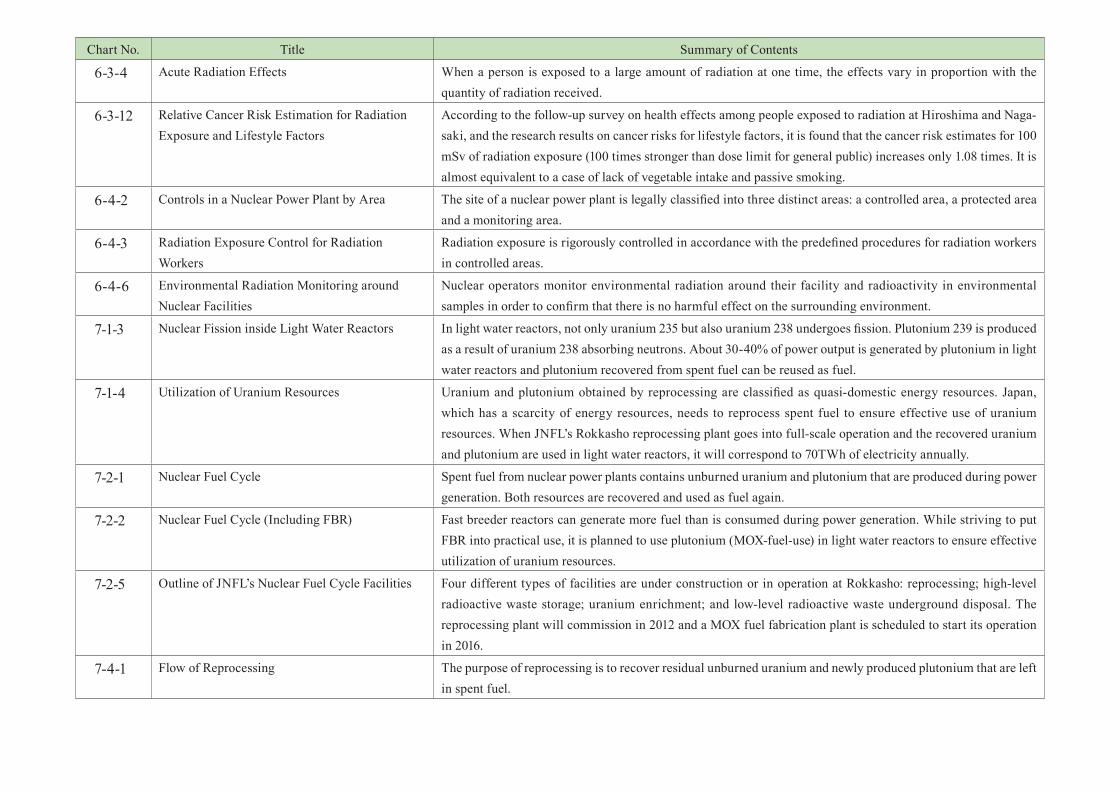
Chart No. Title Summary of Contents
6-3-4 Acute Radiation Effects When a person is exposed to a large amount of radiation at one time, the effects vary in proportion with the quantity of radiation received.
6-3-12 Relative Cancer Risk Estimation for Radiation Exposure and Lifestyle Factors
According to the follow-up survey on health effects among people exposed to radiation at Hiroshima and Naga-saki, and the research results on cancer risks for lifestyle factors, it is found that the cancer risk estimates for 100 mSv of radiation exposure (100 times stronger than dose limit for general public) increases only 1.08 times. It is almost equivalent to a case of lack of vegetable intake and passive smoking.
6-4-2 Controls in a Nuclear Power Plant by Area The site of a nuclear power plant is legally classifi ed into three distinct areas: a controlled area, a protected area and a monitoring area.
6-4-3 Radiation Exposure Control for Radiation Workers
Radiation exposure is rigorously controlled in accordance with the predefi ned procedures for radiation workers in controlled areas.
6-4-6 Environmental Radiation Monitoring around Nuclear Facilities
Nuclear operators monitor environmental radiation around their facility and radioactivity in environmental samples in order to confi rm that there is no harmful effect on the surrounding environment.
7-1-3 Nuclear Fission inside Light Water Reactors In light water reactors, not only uranium 235 but also uranium 238 undergoes fi ssion. Plutonium 239 is produced as a result of uranium 238 absorbing neutrons. About 30-40% of power output is generated by plutonium in light water reactors and plutonium recovered from spent fuel can be reused as fuel.
7-1-4 Utilization of Uranium Resources Uranium and plutonium obtained by reprocessing are classifi ed as quasi-domestic energy resources. Japan, which has a scarcity of energy resources, needs to reprocess spent fuel to ensure effective use of uranium resources. When JNFL’s Rokkasho reprocessing plant goes into full-scale operation and the recovered uranium and plutonium are used in light water reactors, it will correspond to 70TWh of electricity annually.
7-2-1 Nuclear Fuel Cycle Spent fuel from nuclear power plants contains unburned uranium and plutonium that are produced during power generation. Both resources are recovered and used as fuel again.
7-2-2 Nuclear Fuel Cycle (Including FBR) Fast breeder reactors can generate more fuel than is consumed during power generation. While striving to put FBR into practical use, it is planned to use plutonium (MOX-fuel-use) in light water reactors to ensure effective utilization of uranium resources.
7-2-5 Outline of JNFL’s Nuclear Fuel Cycle Facilities Four different types of facilities are under construction or in operation at Rokkasho: reprocessing; high-level radioactive waste storage; uranium enrichment; and low-level radioactive waste underground disposal. The reprocessing plant will commission in 2012 and a MOX fuel fabrication plant is scheduled to start its operation in 2016.
7-4-1 Flow of Reprocessing The purpose of reprocessing is to recover residual unburned uranium and newly produced plutonium that are left in spent fuel.
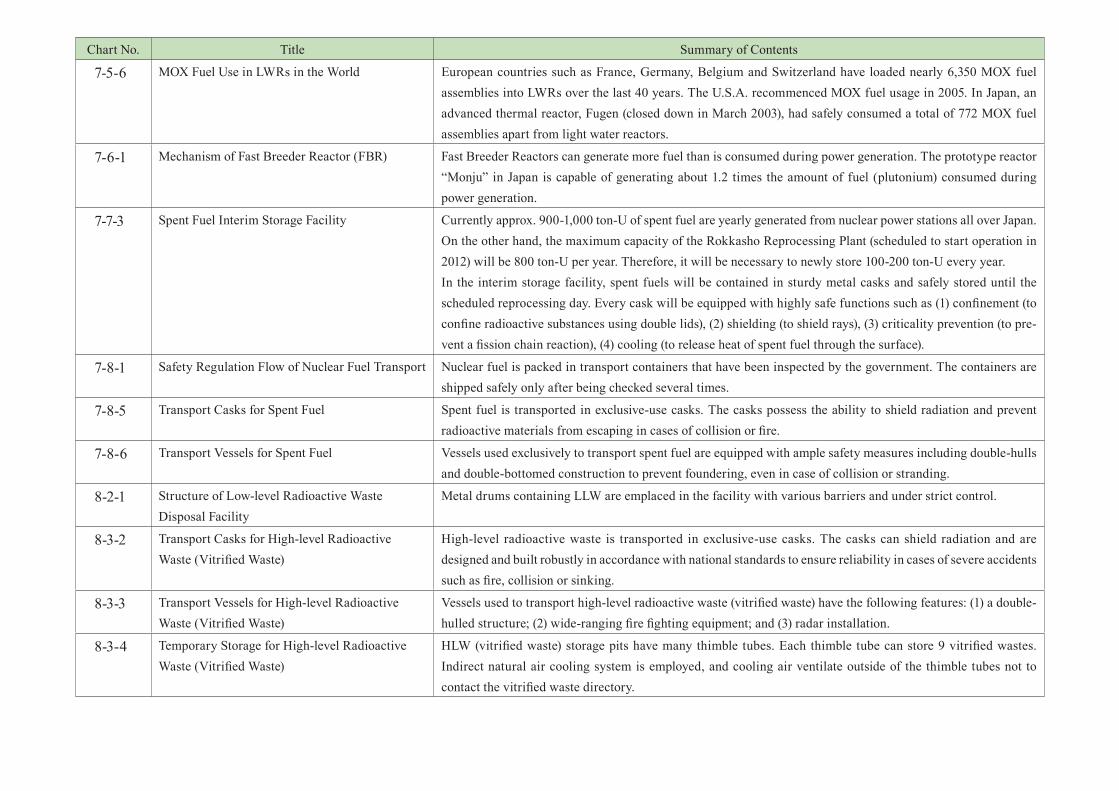
Chart No. Title Summary of Contents
7-5-6 MOX Fuel Use in LWRs in the World European countries such as France, Germany, Belgium and Switzerland have loaded nearly 6,350 MOX fuel assemblies into LWRs over the last 40 years. The U.S.A. recommenced MOX fuel usage in 2005. In Japan, an advanced thermal reactor, Fugen (closed down in March 2003), had safely consumed a total of 772 MOX fuel assemblies apart from light water reactors.
7-6-1 Mechanism of Fast Breeder Reactor (FBR) Fast Breeder Reactors can generate more fuel than is consumed during power generation. The prototype reactor “Monju” in Japan is capable of generating about 1.2 times the amount of fuel (plutonium) consumed during power generation.
7-7-3 Spent Fuel Interim Storage Facility Currently approx. 900-1,000 ton-U of spent fuel are yearly generated from nuclear power stations all over Japan. On the other hand, the maximum capacity of the Rokkasho Reprocessing Plant (scheduled to start operation in 2012) will be 800 ton-U per year. Therefore, it will be necessary to newly store 100-200 ton-U every year.In the interim storage facility, spent fuels will be contained in sturdy metal casks and safely stored until the scheduled reprocessing day. Every cask will be equipped with highly safe functions such as (1) confi nement (to confi ne radioactive substances using double lids), (2) shielding (to shield rays), (3) criticality prevention (to pre-vent a fi ssion chain reaction), (4) cooling (to release heat of spent fuel through the surface).
7-8-1 Safety Regulation Flow of Nuclear Fuel Transport Nuclear fuel is packed in transport containers that have been inspected by the government. The containers are shipped safely only after being checked several times.
7-8-5 Transport Casks for Spent Fuel Spent fuel is transported in exclusive-use casks. The casks possess the ability to shield radiation and prevent radioactive materials from escaping in cases of collision or fi re.
7-8-6 Transport Vessels for Spent Fuel Vessels used exclusively to transport spent fuel are equipped with ample safety measures including double-hulls and double-bottomed construction to prevent foundering, even in case of collision or stranding.
8-2-1 Structure of Low-level Radioactive Waste Disposal Facility
Metal drums containing LLW are emplaced in the facility with various barriers and under strict control.
8-3-2 Transport Casks for High-level Radioactive Waste (Vitrifi ed Waste)
High-level radioactive waste is transported in exclusive-use casks. The casks can shield radiation and are designed and built robustly in accordance with national standards to ensure reliability in cases of severe accidents such as fi re, collision or sinking.
8-3-3 Transport Vessels for High-level Radioactive Waste (Vitrifi ed Waste)
Vessels used to transport high-level radioactive waste (vitrifi ed waste) have the following features: (1) a double-hulled structure; (2) wide-ranging fi re fi ghting equipment; and (3) radar installation.
8-3-4 Temporary Storage for High-level Radioactive Waste (Vitrifi ed Waste)
HLW (vitrifi ed waste) storage pits have many thimble tubes. Each thimble tube can store 9 vitrifi ed wastes. Indirect natural air cooling system is employed, and cooling air ventilate outside of the thimble tubes not to contact the vitrifi ed waste directory.
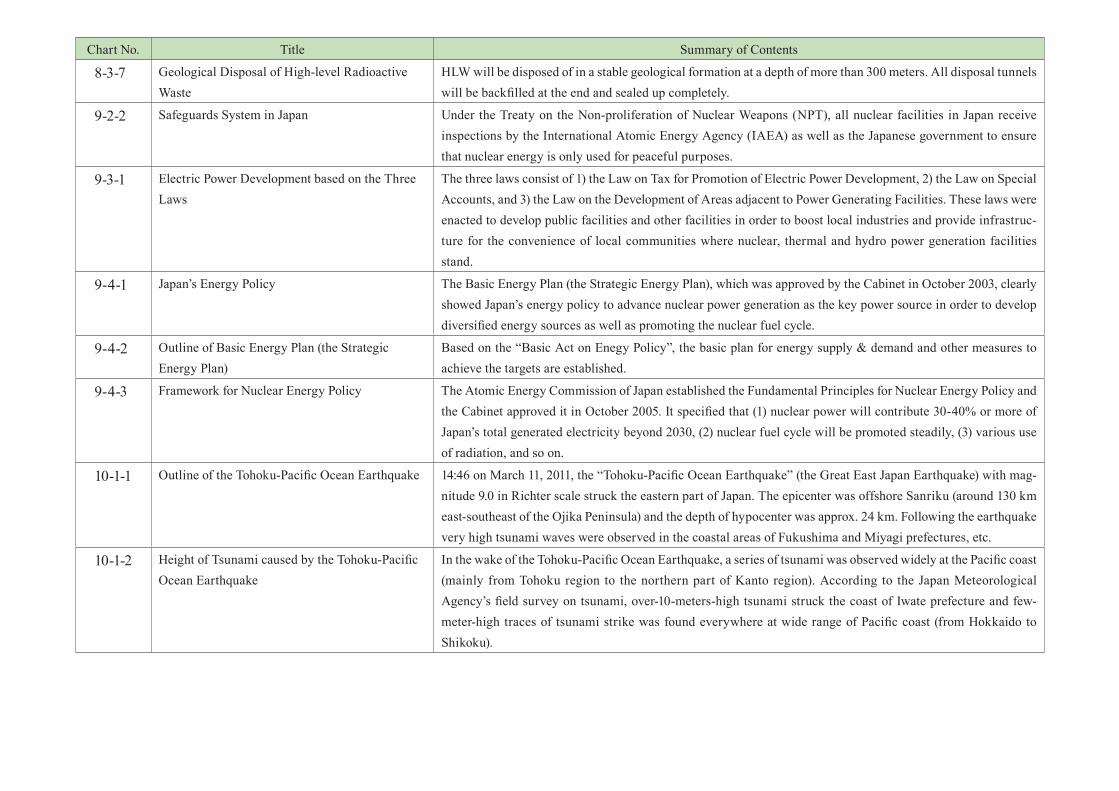
Chart No. Title Summary of Contents
8-3-7 Geological Disposal of High-level Radioactive Waste
HLW will be disposed of in a stable geological formation at a depth of more than 300 meters. All disposal tunnels will be backfi lled at the end and sealed up completely.
9-2-2 Safeguards System in Japan Under the Treaty on the Non-proliferation of Nuclear Weapons (NPT), all nuclear facilities in Japan receive inspections by the International Atomic Energy Agency (IAEA) as well as the Japanese government to ensure that nuclear energy is only used for peaceful purposes.
9-3-1 Electric Power Development based on the Three Laws
The three laws consist of 1) the Law on Tax for Promotion of Electric Power Development, 2) the Law on Special Accounts, and 3) the Law on the Development of Areas adjacent to Power Generating Facilities. These laws were enacted to develop public facilities and other facilities in order to boost local industries and provide infrastruc-ture for the convenience of local communities where nuclear, thermal and hydro power generation facilities stand.
9-4-1 Japan’s Energy Policy The Basic Energy Plan (the Strategic Energy Plan), which was approved by the Cabinet in October 2003, clearly showed Japan’s energy policy to advance nuclear power generation as the key power source in order to develop diversifi ed energy sources as well as promoting the nuclear fuel cycle.
9-4-2 Outline of Basic Energy Plan (the Strategic Energy Plan)
Based on the “Basic Act on Enegy Policy”, the basic plan for energy supply & demand and other measures to achieve the targets are established.
9-4-3 Framework for Nuclear Energy Policy The Atomic Energy Commission of Japan established the Fundamental Principles for Nuclear Energy Policy and the Cabinet approved it in October 2005. It specifi ed that (1) nuclear power will contribute 30-40% or more of Japan’s total generated electricity beyond 2030, (2) nuclear fuel cycle will be promoted steadily, (3) various use of radiation, and so on.
10-1-1 Outline of the Tohoku-Pacifi c Ocean Earthquake 14:46 on March 11, 2011, the “Tohoku-Pacifi c Ocean Earthquake” (the Great East Japan Earthquake) with mag-nitude 9.0 in Richter scale struck the eastern part of Japan. The epicenter was offshore Sanriku (around 130 km east-southeast of the Ojika Peninsula) and the depth of hypocenter was approx. 24 km. Following the earthquake very high tsunami waves were observed in the coastal areas of Fukushima and Miyagi prefectures, etc.
10-1-2 Height of Tsunami caused by the Tohoku-Pacifi c Ocean Earthquake
In the wake of the Tohoku-Pacifi c Ocean Earthquake, a series of tsunami was observed widely at the Pacifi c coast (mainly from Tohoku region to the northern part of Kanto region). According to the Japan Meteorological Agency’s fi eld survey on tsunami, over-10-meters-high tsunami struck the coast of Iwate prefecture and few-meter-high traces of tsunami strike was found everywhere at wide range of Pacifi c coast (from Hokkaido to Shikoku).
Chart No. Title Summary of Contents
10-2-1 Current Status of NPSs Affected by the Tohoku-Pacifi c Ocean Earthquake
In the wake of the Tohoku-Pacifi c Ocean Earthquake, all the reactors operating at the moment at Tohoku Electric Power’s Onagawa Nuclear Power Station, Tokyo Electric Power’s Fukushima Daini Nuclear Power Station and Japan Atomic Power’s Tokai No.2 Power Station were shutdown automatically and their cooling systems properly functioned. Therefore, all these reactors went to “cold shutdown” in a few days. On the other hand, though all the reactors operating at the moment of the earthquake at Tokyo Electric Power’s Fukushima Daiichi Nuclear Power Station shut down automatically, all cooling functions at the reactors and the spent fuel pools of unit 1-4 were lost due to the loss of the external AC power caused by tsunami. Consequently, hydrogen explosions occurred and terribly damaged the upper parts of the reactor buildings. Finally, the unit 1, 2 and 3 could not avoid releasing radioactive materials into the atmosphere.
10-2-2 Outline of the Accident at the Fukushima Daiichi Nuclear Power Station
Units 1, 2 and 3 of the Fukushima Daiichi Nuclear Power Station shut down automatically sensing the earthquake but all external power sources were lost. Though emergency diesel generators started up once, following tsunami struck and destroyed cooling water pumps and emergency diesel generators at the units. Thus, the cooling functions to release heat of the reactors into the sea were lost at the units. The reactor cores which had been left unable to cool down for a considerable period went exposed out of the cooling water and reached to meltdown. A chemical reaction between cladding tubes and steam generated a large amount of hydrogen and eroded clad-ding tubes resulting leakage of the radioactive substances from the fuel rods into the reactor containment vessels.Then, hydrogen explosions occurred and terribly damaged the upper parts of the reactor buildings. Finally, the unit 1, 2 and 3 could not avoid releasing radioactive materials into the atmosphere.
10-2-3 Scale of Tsunami and Inundation at the Fuku-shima Daiichi Nuclear Power Station
The operators on nuclear power plants in Japan had taken measures against tsunami at each site in compliance with the guideline, considering the maximum height of tsunami which may possibly occur around the site based on researches on the past records and estimation by simulation analyses. The Fukushima Daiichi Nuclear Power Station had taken countermeasures against tsunami based on the estima-tion that tsunami which is 5.7 meters higher than the base level of the sea could occur around the site. In addition, the ground level of unit 1, 2, 3 and 4 is 10 meters high above the base level. In spite of those, the tsunami exceeded the prediction struck the units from the seafront of the station and submerged not only the seafront areas where seawater pumps were installed but also nearly all of the areas for main buildings including reactor buildings and turbine buildings by 4-5 meter depth.
Chart No. Title Summary of Contents
10-3-1 Outline of Safety Assurance Measures imple-mented after the Fukushima Daiichi Accident
Recognizing the severity of the accident at the Fukushima Daiichi nuclear power station where all power sources for units 1, 2, 3 and 4 failed due to the earthquake and the tsunami, the electric power companies in Japan have committed to reinforcing safety assurance measures at their nuclear power plants focusing on measures against tsunami.The companies have taken both tangible and intangible measures immediately following the Fukushima acci-dent, including deploying additional emergency power source vehicles and fi re engines, preparing manuals, and implementing emergency drills, as emergency safety measures to prevent fuel damage by continuously cooling the reactor and spent fuel pit under any circumstances.The electric power companies have taken diverse measures to ensure that these measures are effective, such as reinforcing the on-site communication system and preparing high-dose resistant protective clothing to allow necessary actions to be taken even in case of a severe accident. The companies are also taking medium- to long-term measures which include installing additional permanent emergency power supply units on high ground, constructing coastal levees, modifying watertight facilities, and large-capacity temporary seawater pumps, in case of a station blackout and loss of sea water cooling systems, and to increase their safety margin.The companies are also performing stress tests to comprehensively evaluate the safety of their nuclear power plants, including introducing the above-mentioned emergency safety measures.
10-3-2 Examples of Safety Assurance Measures imple-mented after the Fukushima Daiichi Accident
After the earthquake the electric power companies promptly additionally took emergency safety measures including deploying additional emergency power source vehicles and wheel loaders, etc.The companies are also taking medium- to long-term measures which include constructing coastal levees and tide walls in order to increase safety margin of the nuclear power stations.
The Federation of
Electric Power Companies of Japan
Keidanren-kaikan,
1-3-2, Otemachi, Chiyoda-ku, Tokyo
100-8118, Japan
http://www.fepc.or.jp/english/index.html


![Lwl Flip Chart[1]](https://img.pdfslide.us/doc/110x75/547e22d3b4795984508b4aa0/lwl-flip-chart1.jpg)