Embed Size (px)
Citation preview
Graphclusteringtodetectnetworkmodules
Computa9onalNetworkBiologyBiosta2s2cs&MedicalInforma2cs826
ComputerSciences838hBps://compnetbiocourse.discovery.wisc.edu
Nov1st2016
SomematerialisadaptedfromlecturesfromIntroduc2ontoBioinforma2cs
Topicsinthissec9on
• Modulesinbiologicalnetworks• Algorithmsforgraphclusteringtofindtopologicalmodules
• Algorithmsforfunc2onalmoduledetec2on– Integrateinterac2ons(possiblymul2pletypes)withnodeproper2es
Goalsfortoday
• Definingmodulesandmodularityinnetworks• Shortoverviewofclustering• Girvan-Newmanalgorithmtofindmodules• Hierarchicalagglomera2veclusteringongraphs
Modularityinnetworks
• Modularity“referstoagroupofphysicallyorfunc2onallylinkednodesthatworktogethertoachieveadis2nctfunc2on”--Barabasi&Oltvai
• Modularityisanimportantprincipleofbiologicalsystems• Genestendtointeractwithaselectsetofothergenes
exhibi2ngaclusteringofinterac2ons• Moduledetec2oncanhelpto
– Understandtheorganiza2onalproper2esofthenetwork– Canbeusedtopredictfunc2onofgenesbasedontheirgroupingbehavior

Differenttypesofnetworkmodules• Topologicalmodules
– Definedsolelybasedonthegraphconnec2vityofnodes
• Func2onalmodules– Basedongraphconnec2vity&othernodeaBributes
– Canbefurthergroupedinto• Ac2vemodules• Integra2vemodules• Diseasemodules
Albert-LászloBarabási,NataliGulbahce,andJosephLoscalzo,NatureReviewGene2cs2011,Mitraetal.,NatureReviewGene2cs2014
C��6QRQNQIKECN�OQFWNG D��(WPEVKQPCN�OQFWNG E��&KUGCUG�OQFWNG
6QRQNQIKECNN[�ENQUGIGPGU�QT�RTQFWEVU�
(WPEVKQPCNN[�UKOKNCTIGPGU�QT�RTQFWEVU�
&KUGCUG�IGPGUQT�RTQFWEVU�
$KFKTGEVKQPCNKPVGTCEVKQPU
&KTGEVGFKPVGTCEVKQPU
0CVWTG�4GXKGYU�^�)GPGVKEU
EdgeticEdgetic perturbations denote mutations that do not result in the complete loss of a gene product, but affect one or several interactions (and thus functions) of a protein. From a network perspective, an edgetic perturbation removes one or several links, but leaves the other links and the node unaffected.
Shared gene hypothesis and the human disease network. The linkage of a gene to different disease pathopheno-types often indicates that these diseases have a common genetic origin. Motivated by this hypothesis, Goh et al.42 used the gene–disease associations that are collected in the OMIM database to build a network of diseases that are linked if they share one or more genes. In the obtained human disease network (HDN), 867 of 1,284 diseases with an associated gene are connected to at least one other disease, and 516 of them belong to a single disease cluster (FIG. 5). The clustering of nodes of similar colour in FIG. 5, denoting the disease class, reflects the fact that similar pathophenotypes have a higher likeli-hood of sharing genes than do pathophenotypes that belong to different disease classes. For example, cancers form a tightly interconnected and easily detectable clus-ter, which is held together by a small group of genes that are associated with multiple cancers.
To determine whether the sharing of genes has con-sequences for disease occurrence in populations, the comorbidity between linked disease pairs has been examined90 (FIG. 5). This analysis indicates that a patient is twice as likely to develop a particular disease if that disease shares a gene with the patient’s primary disease. But many disease pairs that share genes do not show sig-nificant comorbidity. One explanation is that different mutations in the same gene can have different effects on the gene product, and therefore different pathological consequences91 that are organ and context dependent. Such ‘edgetic’ alleles affect a specific subset of links in the interactome92. Consistent with this view, disease pairs that are associated with mutations that affect
the same functional domain of a protein show higher comorbidity than do disease pairs with mutations that occur in different functional domains90 (FIG. 5).
Shared metabolic pathway hypothesis and the meta-bolic disease network. An enzymatic defect that affects the flux of one reaction can potentially affect the fluxes of all downstream reactions in the same path-way, leading to disease phenotypes that are normally associated with these downstream reactions. Thus, for metabolic diseases, links that are induced by shared metabolic pathways are expected to be more relevant than are links based on shared genes. In support of this hypothesis, Lee et al.93 constructed a metabolic disease network (MDN) in which two disorders are connected if the enzymes associated with them cata-lyse adjacent reactions (FIG. 5b). The visually apparent clustering of the MDN mirrors distinct metabolic path-ways. For example, purine metabolism consists of 62 reactions associated with 33 diseases, including nucle-oside phosphorylase deficiency and congenital dys-erythropoietic anaemia, which form a visually distinct cluster. Comorbidity analysis confirms the functional relevance of metabolic coupling: disease pairs that are linked in the MDN have a 1.8-fold increased comor-bidity compared to disease pairs that are not linked metabolically93. Comorbidity is even more pronounced if the fluxes of the reactions that are catalysed by the respective disease genes are themselves coupled; that is, changes in one flux induce significant changes in the other flux, even if the corresponding reactions are not adjacent.
Figure 2 | Disease modules. Schematic diagram of the three modularity concepts that are discussed in this Review. a | Topological modules correspond to locally dense neighbourhoods of the interactome, such that the nodes of the module show a higher tendency to interact with each other than with nodes outside the module. As such, topological modules represent a pure network property. b | Functional modules correspond to network neighbourhoods in which there is a statistically significant segregation of nodes of related function. Thus, a functional module requires us to define some nodal characteristics (shown as grey nodes) and relies on the hypothesis that nodes that are involved in closely related cellular functions tend to interact with each other and are therefore located in the same network neighbourhood. c | A disease module represents a group of nodes whose perturbation (mutations, deletions, copy number variations or expression changes) can be linked to a particular disease phenotype, shown as red nodes. The tacit assumption in network medicine is that the topological, functional and disease modules overlap, so that functional modules correspond to topological modules and a disease can be viewed as the breakdown of a functional module.
REVIEWS
NATURE REVIEWS | GENETICS VOLUME 12 | JANUARY 2011 | 61
© 2011 Macmillan Publishers Limited. All rights reserved
Studyingmodularityinbiologicalsystems
• Givenanetworkisitmodular?• Givenanetworkwhatarethemodulesinthenetwork?
Givenagraph,isitmodular?
• Givenagraph,wewouldliketoknowifitismodular• Thisrequiresustoquan2ymodularity• Differentmeasuresofmodularityexist– Clusteringcoefficient– QModularity:measurestherela2vedensityofedgesbetweenandwithinthegroups
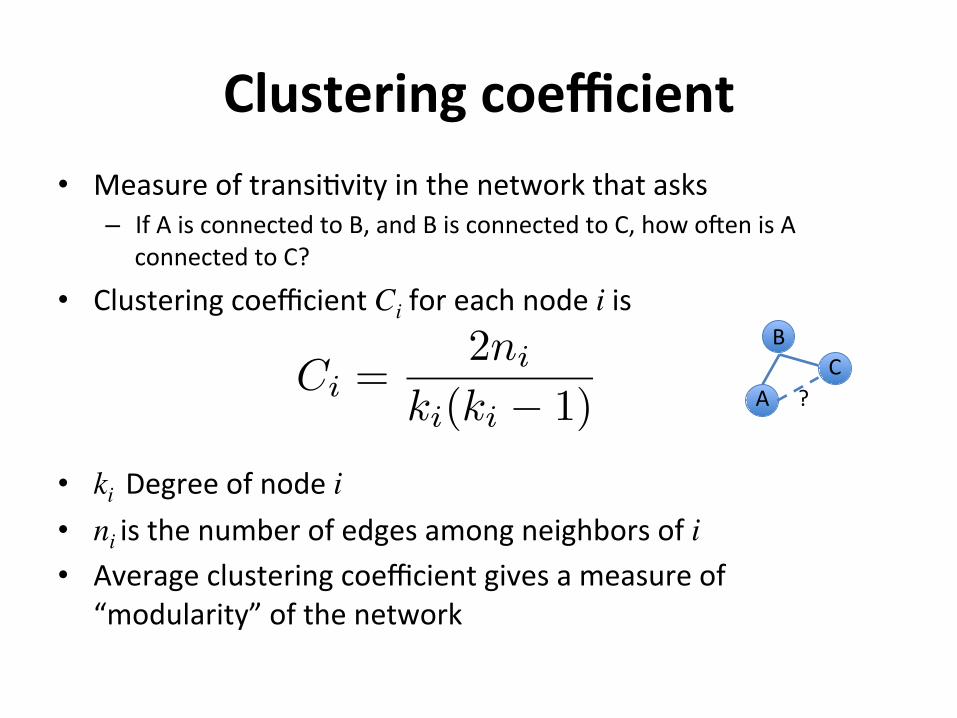
Clusteringcoefficient• Measureoftransi2vityinthenetworkthatasks
– IfAisconnectedtoB,andBisconnectedtoC,howogenisAconnectedtoC?
• ClusteringcoefficientCiforeachnodeiis
• kiDegreeofnodei• niisthenumberofedgesamongneighborsofi• Averageclusteringcoefficientgivesameasureof
“modularity”ofthenetwork
A
BC
?Ci =
2ni
ki(ki � 1)
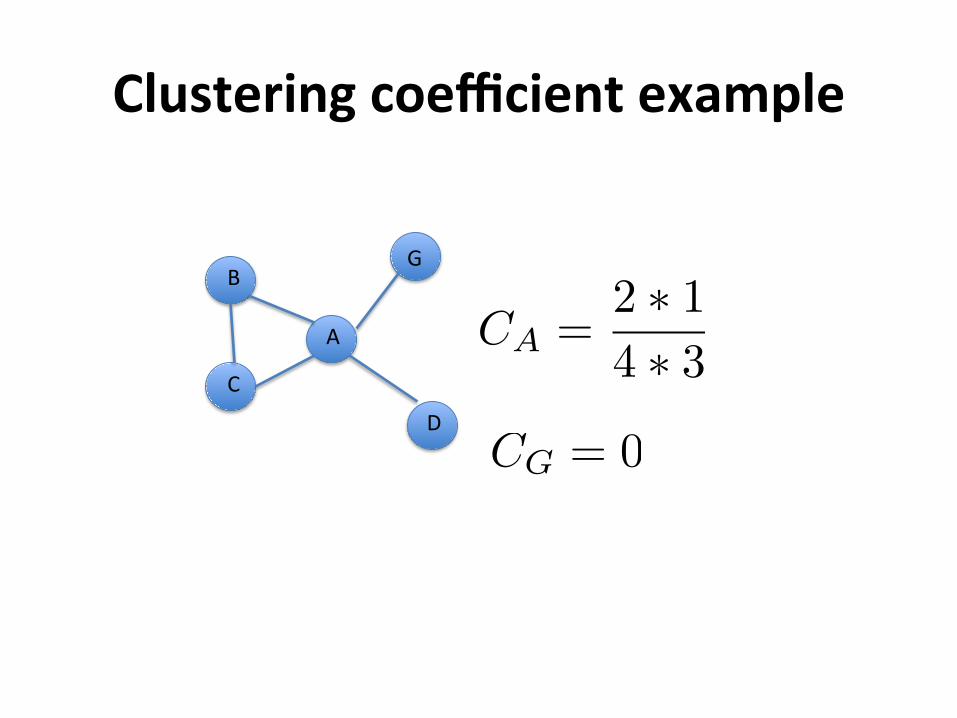
Clusteringcoefficientexample
A
C
BG
D
CA =2 ⇤ 14 ⇤ 3
CG = 0
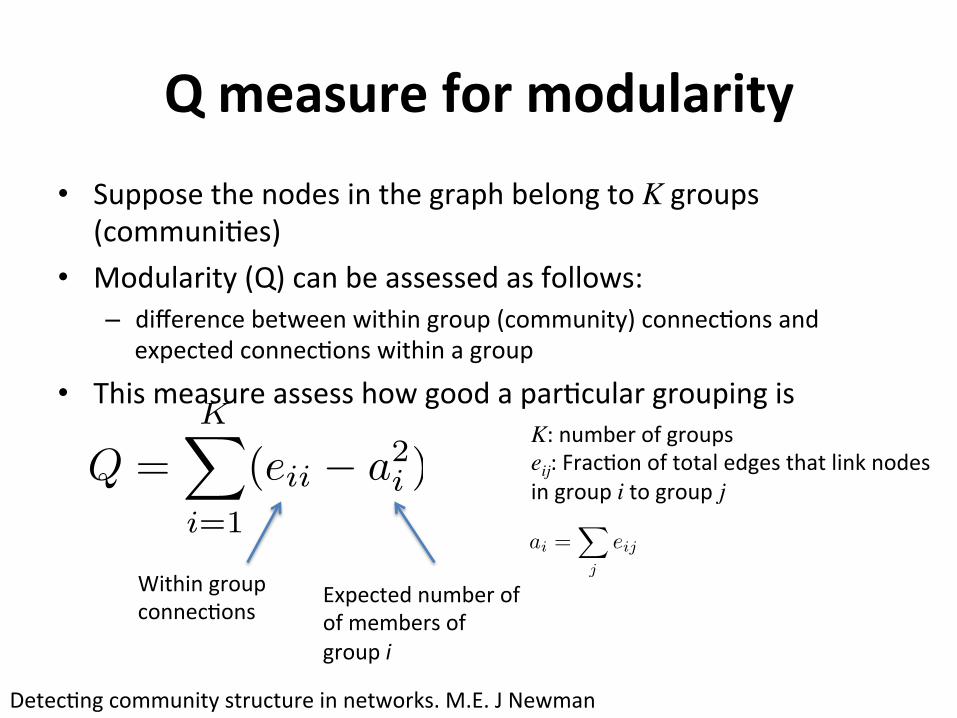
Qmeasureformodularity• SupposethenodesinthegraphbelongtoKgroups
(communi2es)• Modularity(Q)canbeassessedasfollows:
– differencebetweenwithingroup(community)connec2onsandexpectedconnec2onswithinagroup
• Thismeasureassesshowgoodapar2culargroupingis
Q =KX
i=1
(eii � a2i )
K:numberofgroupseij:Frac2onoftotaledgesthatlinknodesingroupitogroup j
ai =X
j
eij
Detec2ngcommunitystructureinnetworks.M.E.JNewman
Withingroupconnec2ons
Expectednumberofofmembersofgroupi
Studyingmodularityinbiologicalsystems
• Givenanetworkisitmodular?• Givenanetworkwhatarethemodulesinthenetwork?
Givenagraph,whatarethemodules
• Givenagraphfindthemodules– Modulesarerepresentedbydenselyconnectedsubgraphs
• Thegraphcanbepar22onedintomodulesusing“Graphclustering”
Problemdefini9onof(topological)moduledetec9on
• Given:– Agraph– Ameasureofclusterquality
• Do– Par22onthever2cesintogroupssuchthattheyformdenselyconnectedsubgraphs(e.g.asmeasuredbytheclusterquality)

Commongraphclusteringalgorithms
• Hierarchicalorflatclusteringusingano2onofsimilaritybetweennodes
• Girvan-Newmanalgorithm• HierarchicalAgglomera2veclustering• Spectralclustering• Markovclusteringalgorithm
Goalsfortoday
• Definingmodulesandmodularityinnetworks• Shortoverviewofclustering• Girvan-Newmanalgorithmtofindmodules• Hierarchicalagglomera2veclusteringongraphs
Clustering
• Typesofclustering– Flatclustering
• K-means• Gaussianmixturemodels
– Hierarchicalclustering• Clusteringalgorithmsdifferinthedistancemeasureusedtogroupobjectstogether
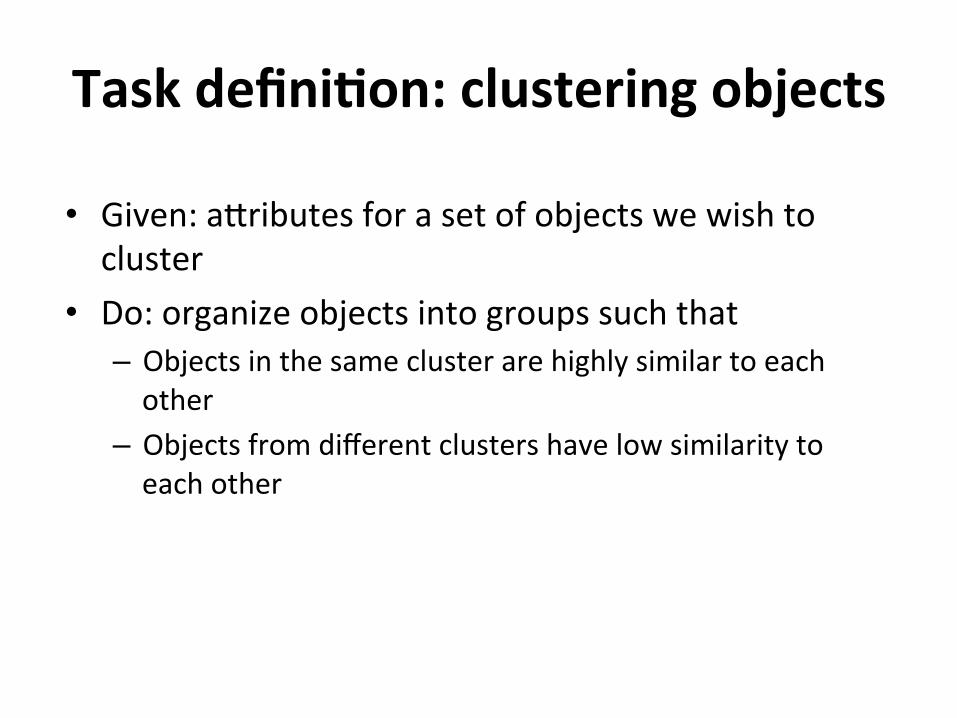
Taskdefini9on:clusteringobjects
• Given:aBributesforasetofobjectswewishtocluster
• Do:organizeobjectsintogroupssuchthat– Objectsinthesameclusterarehighlysimilartoeachother
– Objectsfromdifferentclustershavelowsimilaritytoeachother

Flatclustering
• ClusterobjectsintoKclusters• K:numberofclustersisauserdefinedargument• Twoexamplealgorithms– K-means– Gaussianmixturemodel-basedclustering
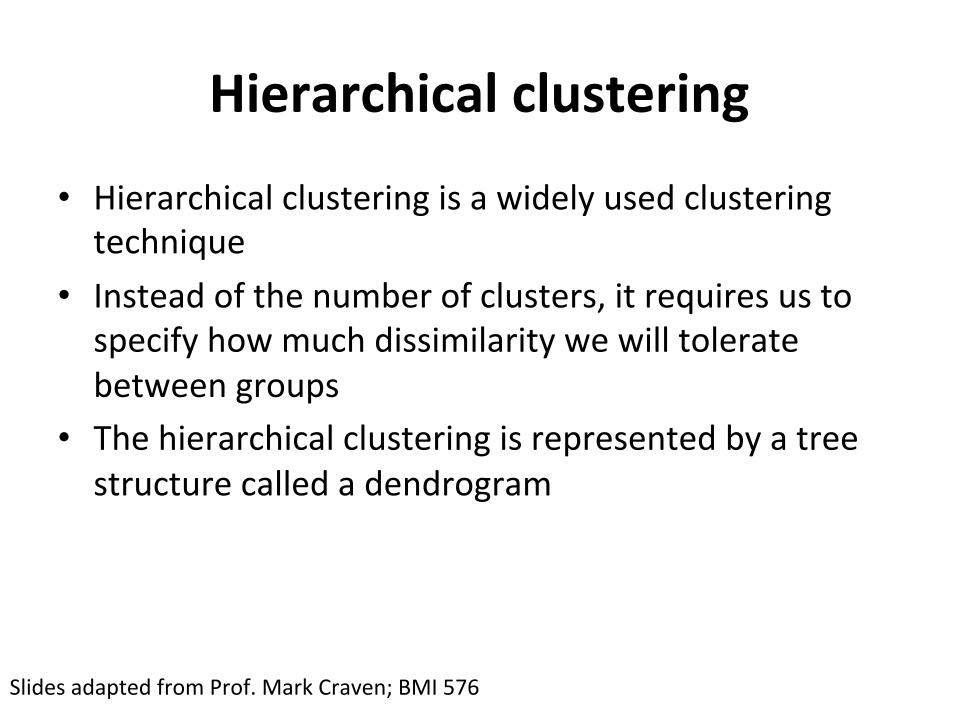
Hierarchicalclustering
• Hierarchicalclusteringisawidelyusedclusteringtechnique
• Insteadofthenumberofclusters,itrequiresustospecifyhowmuchdissimilaritywewilltoleratebetweengroups
• Thehierarchicalclusteringisrepresentedbyatreestructurecalledadendrogram
SlidesadaptedfromProf.MarkCraven;BMI576

Hierarchicalclustering
leavesrepresentobjectstobeclustered(e.g.genesorsamples)
heightofbarindicatesdegreeofdistancewithincluster
distancesc
ale
0
SlidesfromProf.MarkCraven
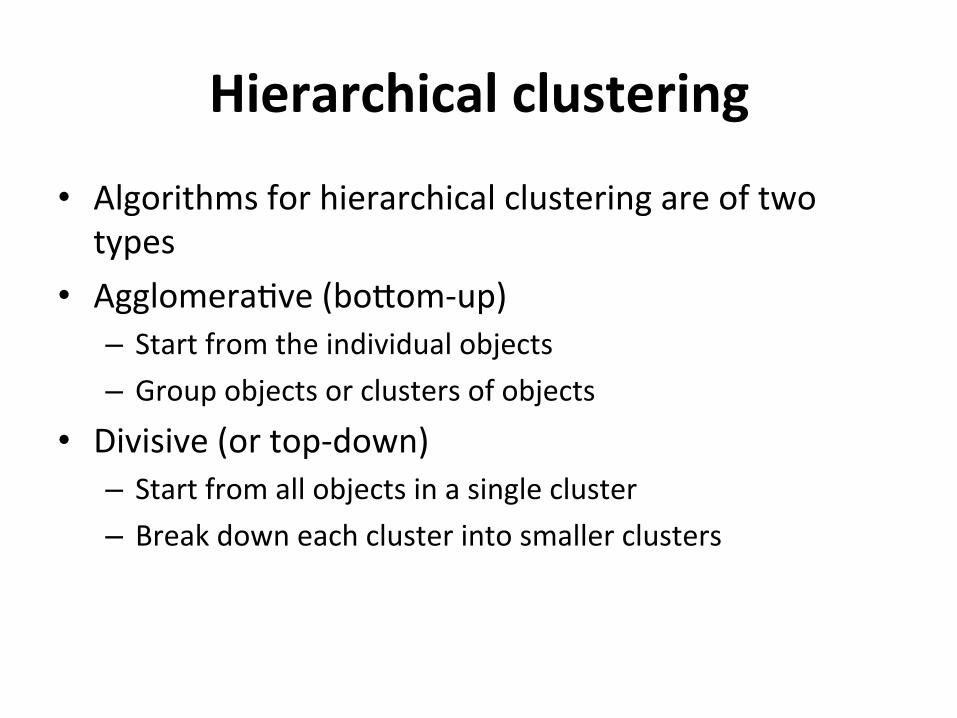
Hierarchicalclustering
• Algorithmsforhierarchicalclusteringareoftwotypes
• Agglomera2ve(boBom-up)– Startfromtheindividualobjects– Groupobjectsorclustersofobjects
• Divisive(ortop-down)– Startfromallobjectsinasinglecluster– Breakdowneachclusterintosmallerclusters
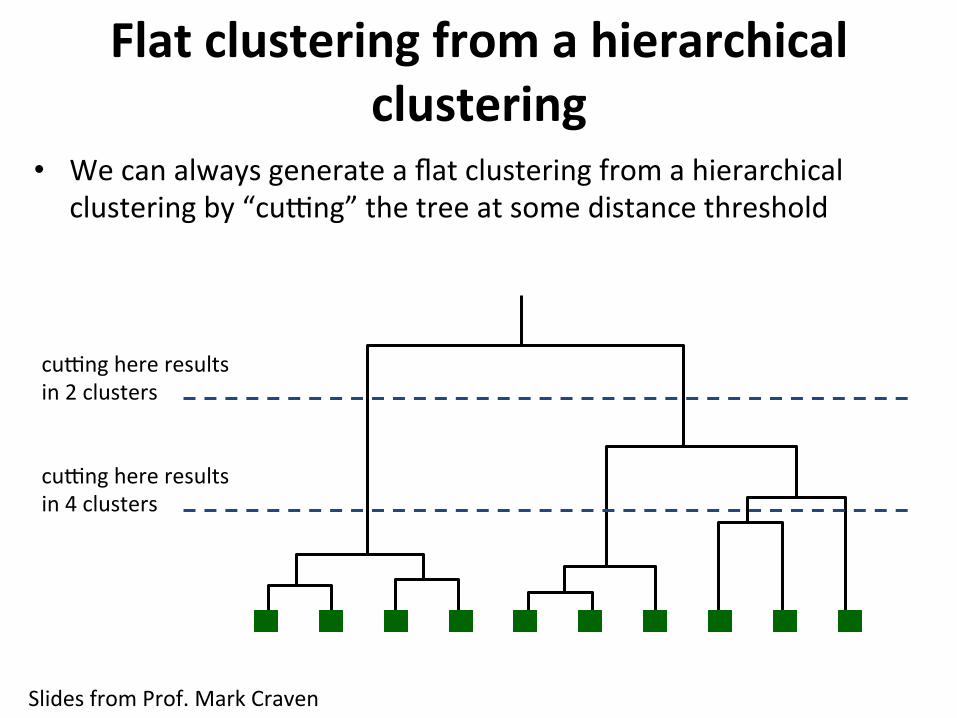
Flatclusteringfromahierarchicalclustering
cuqnghereresultsin2clusters
cuqnghereresultsin4clusters
• Wecanalwaysgenerateaflatclusteringfromahierarchicalclusteringby“cuqng”thetreeatsomedistancethreshold
SlidesfromProf.MarkCraven
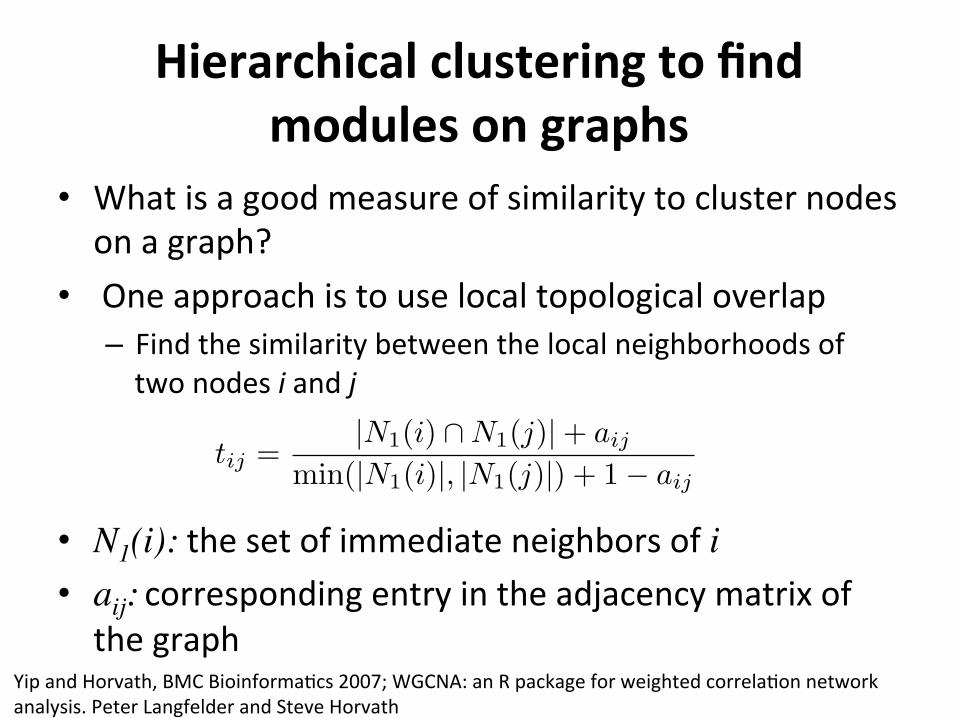
Hierarchicalclusteringtofindmodulesongraphs
• Whatisagoodmeasureofsimilaritytoclusternodesonagraph?
• Oneapproachistouselocaltopologicaloverlap– Findthesimilaritybetweenthelocalneighborhoodsoftwonodesiandj
• N1(i):thesetofimmediateneighborsofi• aij: correspondingentryintheadjacencymatrixofthegraph
YipandHorvath,BMCBioinforma2cs2007;WGCNA:anRpackageforweightedcorrela2onnetworkanalysis.PeterLangfelderandSteveHorvath
Goalsfortoday
• Definingmodulesandmodularityinnetworks• Shortoverviewofclustering• Girvan-Newmanalgorithmtofindmodules• Hierarchicalagglomera2veclusteringongraphs
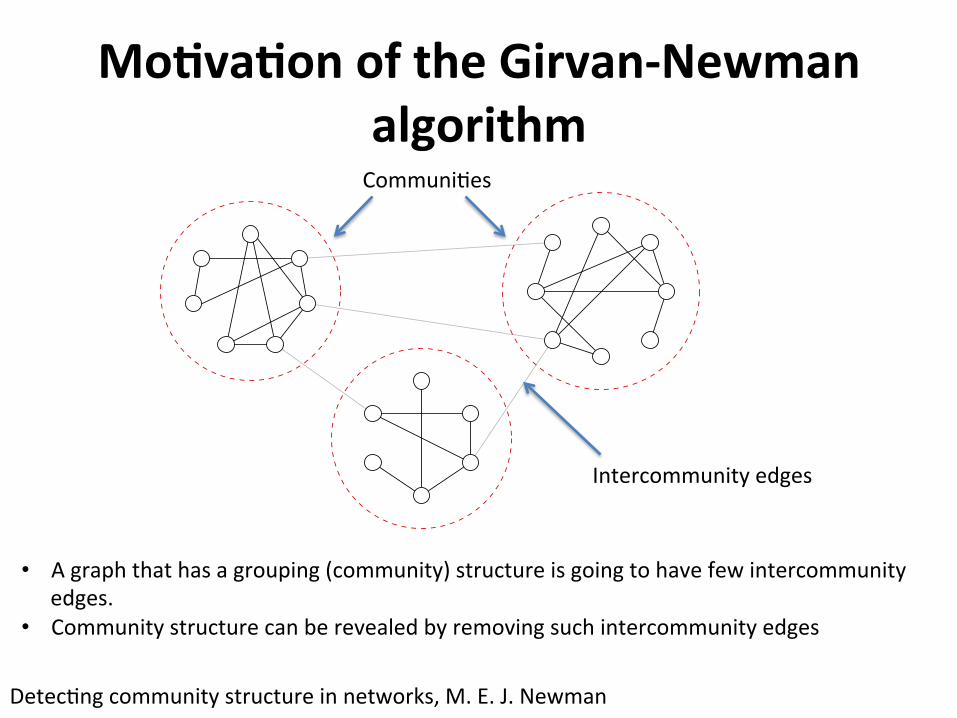
Mo9va9onoftheGirvan-Newmanalgorithm
Detecting community structure in networks
M. E. J. NewmanDepartment of Physics and Center for the Study of Complex Systems,
University of Michigan, Ann Arbor, MI 48109–1120
There has been considerable recent interest in algorithms for finding communities in networks—groups of vertices within which connections are dense, but between which connections are sparser.Here we review the progress that has been made towards this end. We begin by describing sometraditional methods of community detection, such as spectral bisection, the Kernighan–Lin algorithmand hierarchical clustering based on similarity measures. None of these methods, however, is idealfor the types of real-world network data with which current research is concerned, such as Internetand web data and biological and social networks. We describe a number of more recent algorithmsthat appear to work well with these data, including algorithms based on edge betweenness scores,on counts of short loops in networks and on voltage differences in resistor networks.
I. INTRODUCTION
In the continuing flurry of research activity withinphysics and mathematics on the properties of networks,a particular recent focus has been the analysis of com-munities within networks [1–10]. In the simplest case, anetwork or graph can be represented as a set of points,or vertices, joined in pairs by lines, or edges. Many net-works, it is found, are inhomogeneous, consisting notof an undifferentiated mass of vertices, but of distinctgroups. Within these groups there are many edges be-tween vertices, but between groups there are fewer edges,producing a structure like that sketched in Fig. 1.
The ability to find communities within large networksin some automated fashion could be of considerable use.Communities in a web graph for instance might cor-respond to sets of web sites dealing with related top-ics [11, 12], while communities in a biochemical networkor an electronic circuit might correspond to functionalunits of some kind [4, 5, 13, 14]. In this paper we discusscomputer algorithms for the extraction of communitiesfrom raw network data.
FIG. 1: A small network with community structure of thetype considered in this paper. In this case there are threecommunities, denoted by the dashed circles, which have denseinternal links but between which there are only a lower densityof external links.
The outline of the paper is as follows. In Sec. II we de-scribe some of the historical approaches to finding com-munities including spectral partitioning and hierarchicalclustering. Then in Sec. III we describe some newer meth-ods that have appeared in the last few years, includingthe edge betweenness method of Girvan and Newman anda number of variations on it proposed by other authors.In Sec. IV we give our conclusions.
II. TRADITIONAL APPROACHES
The methods described in this paper all assume thatwe are given a network structure that we wish to divideinto communities in such a way that every vertex belongsto one of the communities. We assume that the networkis of the simplest kind possible, with a single type ofundirected, unweighted edge connecting unweighted ver-tices of a single type, although generalizations to moresophisticated network types have been given for some ofthe algorithms described.
The problem of finding good divisions of networks hasbeen studied for some decades now in two fields in par-ticular, computer science and sociology, which have de-veloped quite different approaches as we now describe.
A. Computer science approaches
The typical problem in computer science is that ofdividing the vertices of a network into some number gof groups with roughly equal size, while minimizing thenumber of edges that run between vertices in differentgroups. Computer scientists refer to this task as graphpartitioning. Graph partitioning problems arise for ex-ample in the optimal allocation of processes to proces-sors in a parallel computer. In practice, most approachesto graph partitioning have been based on iterative bi-section: we find the best division we can of the com-plete graph into two groups, and then further subdividethose two until we have the required number of groups.Among the many algorithms suggested for the problem,
• Agraphthathasagrouping(community)structureisgoingtohavefewintercommunityedges.
• Communitystructurecanberevealedbyremovingsuchintercommunityedges
Detec2ngcommunitystructureinnetworks,M.E.J.Newman
Communi2es
Intercommunityedges

Betweennessofanedge
B(e) =Shortest path including e
Number of total shortest paths
• Betweennessofanedgeeisdefinedasthenumberofshortestpathsthatincludee
• Edgesthatliebetweencommuni2estendtohavehighbetweenness
Girvan-Newmanalgorithm
• Generalidea:“Iftwocommuni2esarejoinedbyonlyafewinter-communityedges,thenallpathsthroughthenetworkfromver2cesinonecommunitytover2cesintheothermustpassalongoneofthosefewedges.”
• Communitystructurecanberevealedbyremovingedgesthatwithhighbetweenness
M.E.J.NewmanandM.Girvan.Findingandevalua2ngcommunitystructure
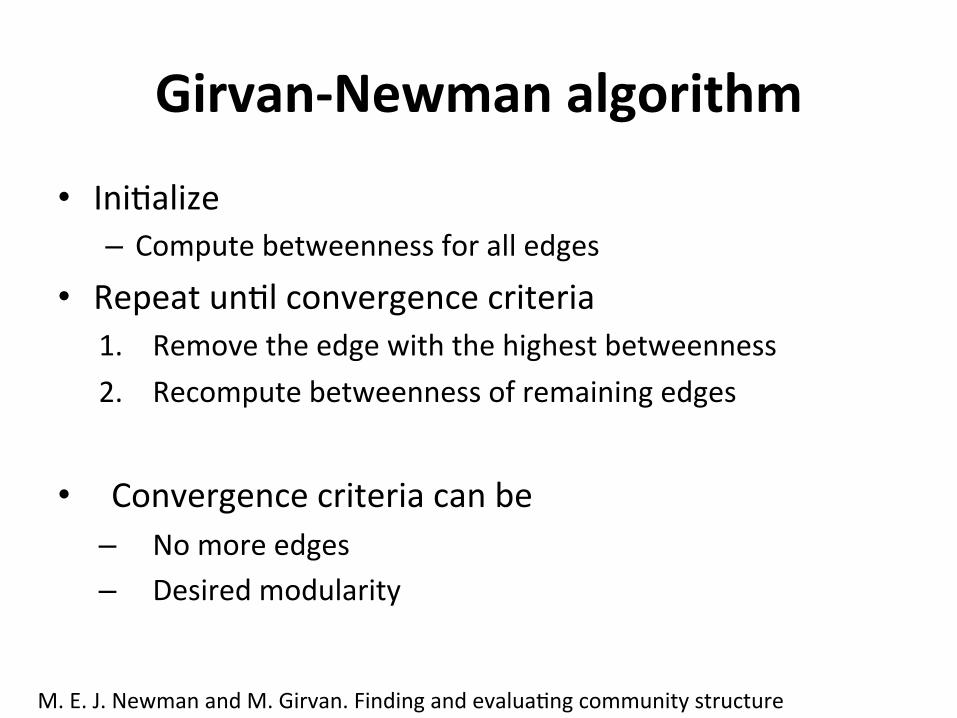
Girvan-Newmanalgorithm
• Ini2alize– Computebetweennessforalledges
• Repeatun2lconvergencecriteria1. Removetheedgewiththehighestbetweenness2. Recomputebetweennessofremainingedges
• Convergencecriteriacanbe– Nomoreedges– Desiredmodularity
M.E.J.NewmanandM.Girvan.Findingandevalua2ngcommunitystructure
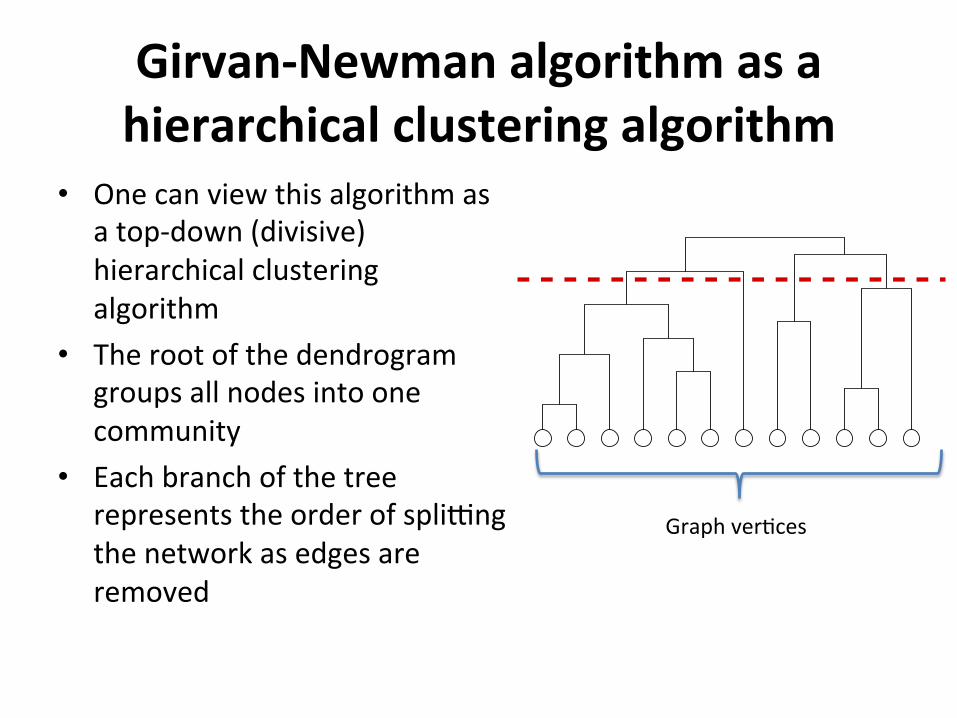
Girvan-Newmanalgorithmasahierarchicalclusteringalgorithm
• Onecanviewthisalgorithmasatop-down(divisive)hierarchicalclusteringalgorithm
• Therootofthedendrogramgroupsallnodesintoonecommunity
• Eachbranchofthetreerepresentstheorderofspliqngthenetworkasedgesareremoved
2
FIG. 2: A hierarchical tree or dendrogram illustrating thetype of output generated by the algorithms described here.The circles at the bottom of the figure represent the indi-vidual vertices of the network. As we move up the tree thevertices join together to form larger and larger communities,as indicated by the lines, until we reach the top, where all arejoined together in a single community. Alternatively, we thedendrogram depicts an initially connected network splittinginto smaller and smaller communities as we go from top tobottom. A cross-section of the tree at any level, as indicatedby the dotted line, will give the communities at that level.The vertical height of the split-points in the tree are indica-tive only of the order in which the splits (or joins) took place,although it is possible to construct more elaborate dendro-grams in which these heights contain other information.
ious metrics of similarity or strength of connection be-tween vertices. They fall into two broad classes, agglom-erative and divisive [19], depending on whether they fo-cus on the addition or removal of edges to or from the net-work. In an agglomerative method, similarities are cal-culated by one method or another between vertex pairs,and edges are then added to an initially empty network(n vertices with no edges) starting with the vertex pairswith highest similarity. The procedure can be halted atany point, and the resulting components in the networkare taken to be the communities. Alternatively, the en-tire progression of the algorithm from empty graph tocomplete graph can be represented in the form of a treeor dendrogram such as that shown in Fig. 2. Horizontalcuts through the tree represent the communities appro-priate to different halting points.
Agglomerative methods based on a wide variety of sim-ilarity measures have been applied to different networks.Some networks have natural similarity metrics built in.For example, in the widely studied network of collabo-rations between film actors [21, 22], in which two actorsare connected if they have appeared in the same film, onecould quantify similarity by how many films actors haveappeared in together [23]. Other networks have no natu-ral metric, but suitable ones can be devised using correla-tion coefficients, path lengths, or matrix methods. A wellknown example of an agglomerative clustering method isthe Concor algorithm of Breiger et al. [24].
Agglomerative methods have their problems however.One concern is that they fail with some frequency to findthe correct communities in networks were the commu-nity structure is known, which makes it difficult to placemuch trust in them in other cases. Another is their ten-
FIG. 3: Agglomerative clustering methods are typically goodat discovering the strongly linked cores of communities (boldvertices and edges) but tend to leave out peripheral vertices,even when, as here, most of them clearly belong to one com-munity or another.
dency to find only the cores of communities and leaveout the periphery. The core nodes in a community of-ten have strong similarity, and hence are connected earlyin the agglomerative process, but peripheral nodes thathave no strong similarity to others tend to get neglected,leading to structures like that shown in Fig. 3. In thisfigure, there are a number of peripheral nodes whose com-munity membership is obvious to the eye—in most casesthey have only a single link to a specific community—but agglomerative methods often fail to place such nodescorrectly.
In this paper, therefore, we focus on divisive meth-ods. These methods have been relatively little studiedin the previous literature, either in social network the-ory or elsewhere, but, as we will see, seem to offer alot of promise. In a divisive method, we start with thenetwork of interest and attempt to find the least similarconnected pairs of vertices and then remove the edgesbetween them. By doing this repeatedly, we divide thenetwork into smaller and smaller components, and againwe can stop the process at any stage and take the com-ponents at that stage to be the network communities.Again, the process can be represented as a dendrogramdepicting the successive splits of the network into smallerand smaller groups.
The approach we take follows roughly these lines,but adopts a somewhat different philosophical viewpoint.Rather than looking for the most weakly connected ver-tex pairs, our approach will be to look for the edges in thenetwork that are most “between” other vertices, meaningthat the edge is, in some sense, responsible for connect-ing many pairs of others. Such edges need not be weakat all in the similarity sense. How this idea works out inpractice will become clear in the course of the presenta-tion.
Briefly then, the outline of this paper is as follows.In Sec. II we describe the crucial concepts behind ourmethods for finding community structure in networks andshow how these concepts can be turned into a concreteprescription for performing calculations. In Sec. III wedescribe in detail the implementation of our methods. In
Graphver2ces

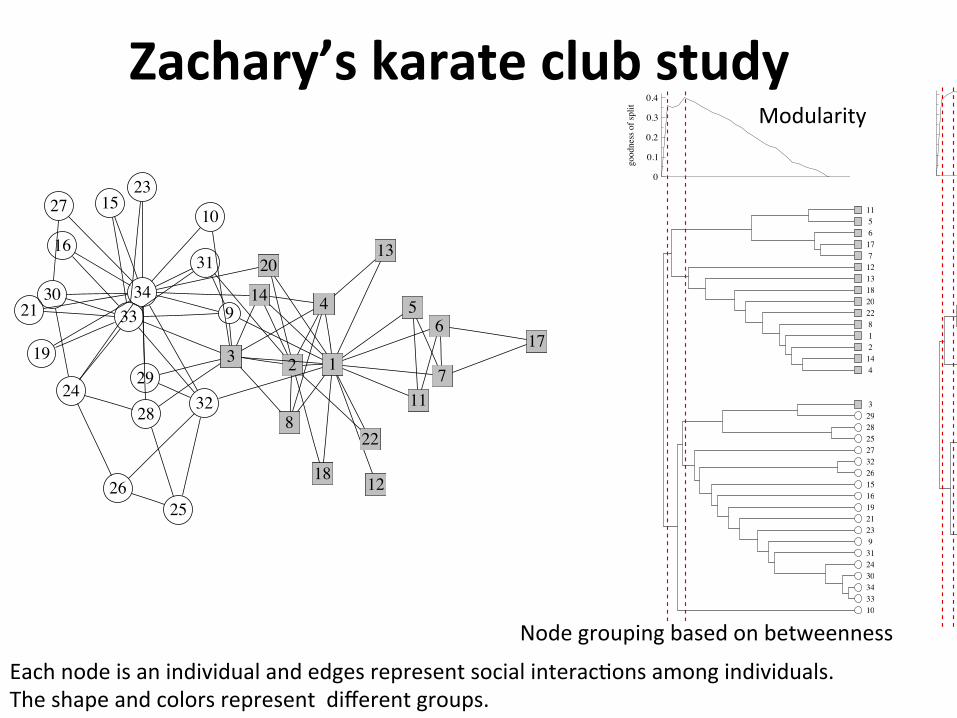
ApplyingtheGirvan-NewmanalgorithmtoZachary’skarateclub
network• Zachary’skarateclubnetworkisawell-knownexampleofasocialnetworkwithcommunitystructure
• Networkrepresentsthefriendshipsamongmembersofakarateclub
• Duetoadisputetheclubsplitintotwofac2ons• Canagraphclustering/moduledetec2onalgorithmpredictthefac2ons?
Zachary’skarateclubstudy10
123
4 56
7
811
12
13
14
18
20
22
9
32
31
28
29
33
10
17
34
15
16
21
23
24
26
30
25
27
19
FIG. 8: The network of friendships between individuals inthe karate club study of Zachary [35]. The administrator andthe instructor are represented by nodes 1 and 33 respectively.Shaded squares represent individuals to who ended up align-ing with the club’s administrator after the fission of the club,open circles those who aligned with the instructor.
trator and its principal karate teacher over whether toraise club fees, and as a result the club eventually splitin two, forming two smaller clubs, centered around theadministrator and the teacher.
In Fig. 8 we show a consensus network structure ex-tracted from Zachary’s observations before the split.Feeding this network into our algorithms we find the re-sults shown in Fig. 9. In the left-most two panels weshow the dendrograms generated by the shortest-pathand random-walk versions of our algorithm, along withthe modularity measures for the same. As we see, bothalgorithms give reasonably high values for the modularitywhen the network is split into two communities—around0.4 in each case—indicating that there is a strong nat-ural division at this level. What’s more, the divisionsin question correspond almost perfectly to the actual di-visions in the club revealed by which group each clubmember joined after the club split up. (The shapes ofthe vertices representing the two factions are the same asthose of Fig. 8.) Only one vertex, vertex 3, is misclassi-fied by the shortest-path version of the method, and noneare misclassified by the random-walk version—the lattergets a perfect score on this test. (On the other hand, thetwo-community split fails to produce a local maximum inthe modularity for the random-walk method, unlike theshortest-path method for which there is a local maximumprecisely at this point.)
In the last panel of Fig. 9 we show the dendrogramand modularity for an algorithm based on shortest-pathbetweenness but without the crucial recalculation stepdiscussed in Sec. II. As the figure shows, without thisstep, the algorithm fails to find the division of the net-work into the two known groups. Furthermore, the mod-ularity doesn’t reach nearly such high values as in thefirst two panels, indicating that the divisions suggested
are much poorer than in the cases with the recalculation.
C. Collaboration network
For our next example, we look at a collaboration net-work of scientists. Figure 10a shows the largest com-ponent of a network of collaborations between physi-cists who conduct research on networks. (The authorsof the present paper, for instance, are among the nodesin this network.) This network (which appeared previ-ously in Ref. 36) was constructed by taking names ofauthors appearing in the lengthy bibliography of Ref. 4and cross-referencing with the Physics E-print Archive atarxiv.org, specifically the condensed matter section ofthe archive where, for historical reasons, most papers onnetworks have appeared. Authors appearing in both wereadded to the network as vertices, and edges between themindicate coauthorship of one or more papers appearingin the archive. Thus the collaborative ties represented inthe figure are not limited to papers on topics concerningnetworks—we were interested primarily in whether peo-ple know one another, and collaboration on any topic isa reasonable indicator of acquaintance.
The network as presented in Fig. 10a is difficult to in-terpret. Given the names of the scientists, a knowledge-able reader with too much time on their hands could, nodoubt, pick out known groupings, for instance at partic-ular institutions, from the general confusion. But werethis a network about which we had no a priori knowledge,we would be hard pressed to understand its underlyingstructure.
Applying the shortest-path version of our algorithmto this network we find that the modularity, Eq. (5),has a strong peak at 13 communities with a value ofQ = 0.72 ± 0.02. Extracting the communities from thecorresponding dendrogram, we have indicated them withcolors in Fig. 10b. The knowledgeable reader will againbe able to discern known groups of scientists in this ren-dering, and more easily now with the help of the colors.Still, however, the structure of the network as a wholeand the of the interactions between groups is quite un-clear.
In Fig. 10c we have reduced the network to only thegroups. In this panel, we have drawn each group as acircle, with size varying roughly with the number of indi-viduals in the group. The lines between groups indicatecollaborations between group members, with the thick-ness of the lines varying in proportion to the number ofpairs of scientists who have collaborated. Now the over-all structure of the network becomes easy to see. Thenetwork is centered around the middle group shown incyan (which consists of researchers primarily in southernEurope), with a knot of inter-community collaborationsgoing on between the groups on the lower right of thepicture (mostly Boston University physicists and theirintellectual descendants). Other groups (including theauthors’ own) are arranged in various attitudes further
Eachnodeisanindividualandedgesrepresentsocialinterac2onsamongindividuals.Theshapeandcolorsrepresentdifferentgroups.
Nodegroupingbasedonbetweenness
11
134
1428
201822131267
175
11
2532
24289
3433191631151023302127
2629
0
0.1
0.2
0.3
0.4
good
ness
of s
plit
0
0.1
0.2
0.3
0.4
good
ness
of s
plit
11561771213182022812144
329282527322615161921239312430343310
0
0.1
0.2
0.3
0.4
good
ness
of s
plit
12177611510161523211932292830272426252218343320319143138421
without recalculationrandom walkshortest pathshortest path
FIG. 9: Community structure in the karate club network. Left: the dendrogram extracted by the shortest-path betweennessversion of our method, and the resulting modularity. The modularity has two maxima (dotted lines) corresponding to splitsinto two communities (which match closely the real-world split of the club, as denoted by the shapes of the vertices) and fivecommunities (though one of those five contains only one individual). Only one individual, number 3, is incorrectly classified.Center: the dendrogram for the random walk version of our method. This version classifies all 34 vertices correctly into thefactions that they actually split into (first dotted line), although the split into four communities gets a higher modularity score(second dotted line). Right: the dendrogram for the shortest-path algorithm without recalculation of betweennesses after eachedge removal. This version of the calculation fails to find the split into the two factions.
out.One of the problems created by the sudden availability
in recent years of large network data sets has been ourlack of tools for visualizing their structure [4]. In theearly days of network analysis, particularly in the socialsciences, it was usually enough simply to draw a pictureof a network to see what was going on. Networks in thosedays had ten or twenty nodes, not 140 as here, or severalbillion as in the world wide web. We believe that methodslike the one presented here, of using community structurealgorithms to make a meaningful “coarse graining” of anetwork, thereby reducing its level of complexity to onethat can be interpreted readily by the human eye, willbe invaluable in helping us to understand the large-scalestructure of these new network data.
D. Other examples
In this section, we briefly describe example applica-tions of our methods to three further networks. The firstis a non-human social network, a network of dolphins, thesecond a network of fictional characters, and the third nota social network at all, but a network of web pages andthe links between them.
In Fig. 11 we show the social network of a communityof 62 bottlenose dolphins living in Doubtful Sound, NewZealand. The network was compiled by Lusseau [37] fromseven years of field studies of the dolphins, with ties be-tween dolphin pairs being established by observation ofstatistically significant frequent association. The networksplits naturally into two large groups, represented by the
Modularity


![Susumu Kunifuji George Angelos Papadopoulos …utopia.duth.gr/~kdemertz/papers/HIMDAM.pdfinstance, Chin et al. [7] used a 2-means clustering [21] of apps’ call activities, to detect](https://img.pdfslide.us/doc/110x75/5e43d5c1fb7fb116e800550b/susumu-kunifuji-george-angelos-papadopoulos-kdemertzpapershimdampdf-instance.jpg)