Embed Size (px)
Citation preview
International Research Journal of Geology and Mining (IRJGM) (2276-6618) Vol. 3(4) pp. 158-178, May 2013 Available online http://www.interesjournals.org/IRJGM Copyright©2013 International Research Journals
Full Length Research Paper
Granulometric analysis and heavy mineral studies of the sandstone facies exposed near Igbile, south-
western Nigeria
*1Ikhane PR, 1*Akintola AI, 2Bankole SI, 1Oyebolu OO and 1Ogunlana EO
1Department of Earth Sciences, Olabisi Onabanjo University, Ago-Iwoye
2Department of Geosciences, University of Lagos
Abstract
The knowledge of particle size distribution and the assemblages of heavy minerals in sedimentary rocks particularly in the Earth’s crust make it possible to effectively locate and use essential minerals to predict their dispersal pattern when they re-enter the natural environment. Particle size distribution of Sandstone facies exposed near Igbile, South western Nigeria were described to study the provenance and deduce the transportation history, environment of deposition and source area of the sediment. Twenty four (24) surface samples collected from the study area were subjected to granulometric analysis in order to determine their grain size distribution using sieves method of mesh size ranging from 1.00M to 90μm. Twelve samples were selected from the twenty four samples for heavy mineral studies to describe the heavy mineral make-up, using float and sink procedure with dense liquid, thin section studies was also done. Result of the granulometric studies of the sediments are medium to coarse grained, moderately sorted and finely skewed. The mean value ranges from 0.67-1.30, which suggests high to low energy of transportation, Inclusive standard deviation (sorting) ranges from 0.70-1.15, with more samples falling under moderately sorted, it suggest that the have been transported relatively farer away from their source with relatively low energy of transportation at a regular intervals that permitted fair hydraulic sorting at a lower course of a river. Inclusive graphic skewness ranges from 0.28-0.89. Only location 2B falls under finely skewed while the rest are severely finely skewed which exhibits sediments imput from various sources of tributaries and also implies a low velocity than normal. The heavy mineral assemblage shows the presence of opaque and non-opaque minerals such as zircon, tourmaline, rutile, stourolite, garnet, epidote, apatite, silimanite and kyanite. The calculated Zircon-Tourmaline-Rutile (ZTR) index shows that majority of the sample location have >50% ZTR index which suggest that almost all the location contain mineralogically immature sediments. Distribution bar chart of the ZTR index shows that majority of the sample locations have greater than 40% ZTR which is suggestive of texturally immature sediments. All locations except location 2B did not contain garnet and Kyanite heavy minerals which are indicative of metamorphic source. The mono-source characteristic could also be responsible for the moderately well sorted exhibited by particles deposited in the location. Also, all locations except location 4B is characterized by sediment input from volcanic source due to the presence of Apatite heavy mineral which is a source indicator. Keywords: Granulometric analysis, heavy minerals, provenance, Zircon-Tourmaline-Rutile (ZTR) index.
INTRODUCTION Sedimentary rocks contain numerous clues to their origin and the environment in which they were deposited. This information can be determined from the shape and *Corresponding Author Email: [email protected]
sequence of rock layers, from the sediment grains and the sedimentary structures such as fossils, cross-beds, ripple marks, and mud cracks that are contained in the rock. Sedimentary rocks are wide spread, about three-fourths (3/4) of the surface of the continents is blanketed with a relatively thin skin of sedimentary rocks. They are important components of the solid earths system and
Ikhane et al. 159
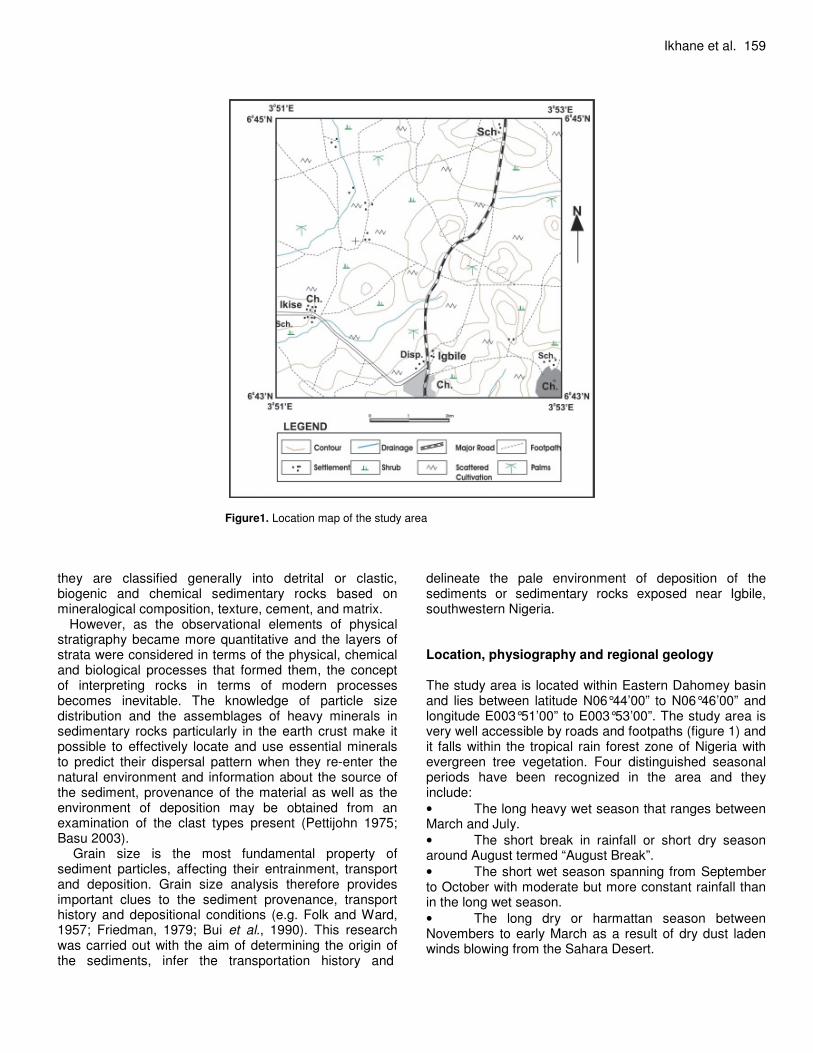
Figure1. Location map of the study area
they are classified generally into detrital or clastic, biogenic and chemical sedimentary rocks based on mineralogical composition, texture, cement, and matrix.
However, as the observational elements of physical stratigraphy became more quantitative and the layers of strata were considered in terms of the physical, chemical and biological processes that formed them, the concept of interpreting rocks in terms of modern processes becomes inevitable. The knowledge of particle size distribution and the assemblages of heavy minerals in sedimentary rocks particularly in the earth crust make it possible to effectively locate and use essential minerals to predict their dispersal pattern when they re-enter the natural environment and information about the source of the sediment, provenance of the material as well as the environment of deposition may be obtained from an examination of the clast types present (Pettijohn 1975; Basu 2003).
Grain size is the most fundamental property of sediment particles, affecting their entrainment, transport and deposition. Grain size analysis therefore provides important clues to the sediment provenance, transport history and depositional conditions (e.g. Folk and Ward, 1957; Friedman, 1979; Bui et al., 1990). This research was carried out with the aim of determining the origin of the sediments, infer the transportation history and
delineate the pale environment of deposition of the sediments or sedimentary rocks exposed near Igbile, southwestern Nigeria. Location, physiography and regional geology The study area is located within Eastern Dahomey basin and lies between latitude N06°44’00” to N06°46’00” and longitude E003°51’00” to E003°53’00”. The study area is very well accessible by roads and footpaths (figure 1) and it falls within the tropical rain forest zone of Nigeria with evergreen tree vegetation. Four distinguished seasonal periods have been recognized in the area and they include:
• The long heavy wet season that ranges between March and July.
• The short break in rainfall or short dry season around August termed “August Break”.
• The short wet season spanning from September to October with moderate but more constant rainfall than in the long wet season.
• The long dry or harmattan season between Novembers to early March as a result of dry dust laden winds blowing from the Sahara Desert.
160 Int. Res. J. Geo. Min.
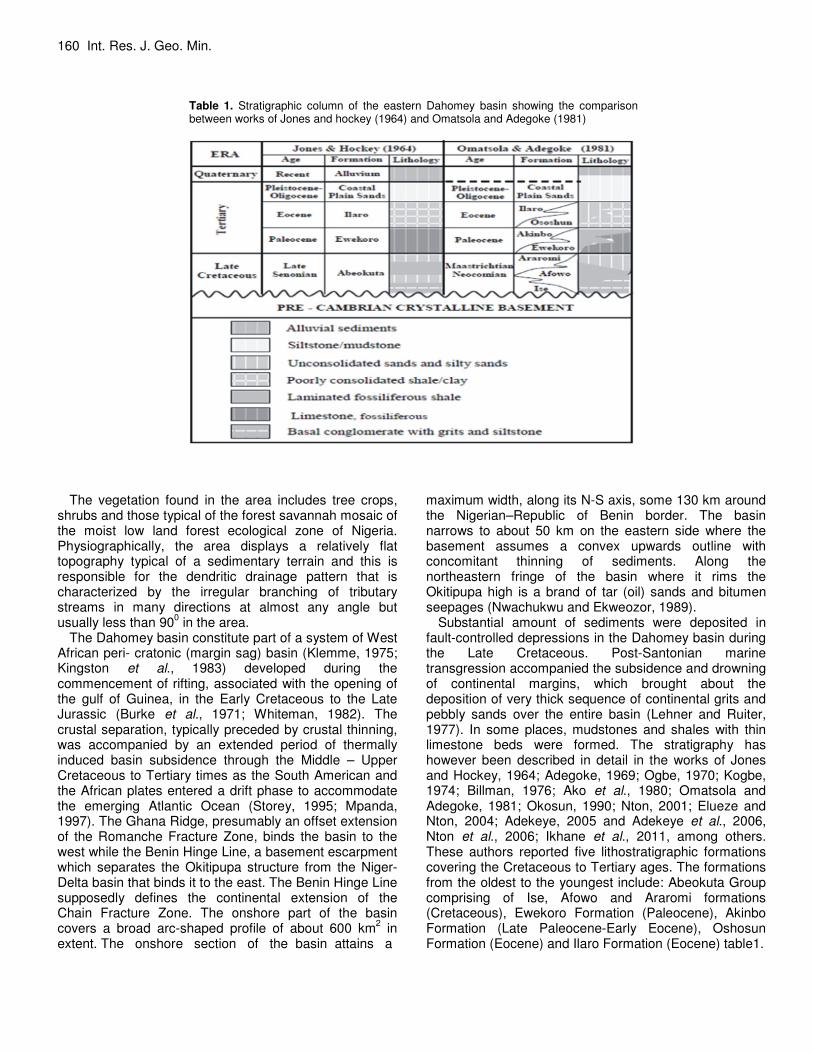
Table 1. Stratigraphic column of the eastern Dahomey basin showing the comparison between works of Jones and hockey (1964) and Omatsola and Adegoke (1981)
The vegetation found in the area includes tree crops, shrubs and those typical of the forest savannah mosaic of the moist low land forest ecological zone of Nigeria. Physiographically, the area displays a relatively flat topography typical of a sedimentary terrain and this is responsible for the dendritic drainage pattern that is characterized by the irregular branching of tributary streams in many directions at almost any angle but usually less than 90
0 in the area.
The Dahomey basin constitute part of a system of West African peri- cratonic (margin sag) basin (Klemme, 1975; Kingston et al., 1983) developed during the commencement of rifting, associated with the opening of the gulf of Guinea, in the Early Cretaceous to the Late Jurassic (Burke et al., 1971; Whiteman, 1982). The crustal separation, typically preceded by crustal thinning, was accompanied by an extended period of thermally induced basin subsidence through the Middle – Upper Cretaceous to Tertiary times as the South American and the African plates entered a drift phase to accommodate the emerging Atlantic Ocean (Storey, 1995; Mpanda, 1997). The Ghana Ridge, presumably an offset extension of the Romanche Fracture Zone, binds the basin to the west while the Benin Hinge Line, a basement escarpment which separates the Okitipupa structure from the Niger- Delta basin that binds it to the east. The Benin Hinge Line supposedly defines the continental extension of the Chain Fracture Zone. The onshore part of the basin covers a broad arc-shaped profile of about 600 km
2 in
extent. The onshore section of the basin attains a
maximum width, along its N-S axis, some 130 km around the Nigerian–Republic of Benin border. The basin narrows to about 50 km on the eastern side where the basement assumes a convex upwards outline with concomitant thinning of sediments. Along the northeastern fringe of the basin where it rims the Okitipupa high is a brand of tar (oil) sands and bitumen seepages (Nwachukwu and Ekweozor, 1989).
Substantial amount of sediments were deposited in fault-controlled depressions in the Dahomey basin during the Late Cretaceous. Post-Santonian marine transgression accompanied the subsidence and drowning of continental margins, which brought about the deposition of very thick sequence of continental grits and pebbly sands over the entire basin (Lehner and Ruiter, 1977). In some places, mudstones and shales with thin limestone beds were formed. The stratigraphy has however been described in detail in the works of Jones and Hockey, 1964; Adegoke, 1969; Ogbe, 1970; Kogbe, 1974; Billman, 1976; Ako et al., 1980; Omatsola and Adegoke, 1981; Okosun, 1990; Nton, 2001; Elueze and Nton, 2004; Adekeye, 2005 and Adekeye et al., 2006, Nton et al., 2006; Ikhane et al., 2011, among others. These authors reported five lithostratigraphic formations covering the Cretaceous to Tertiary ages. The formations from the oldest to the youngest include: Abeokuta Group comprising of Ise, Afowo and Araromi formations (Cretaceous), Ewekoro Formation (Paleocene), Akinbo Formation (Late Paleocene-Early Eocene), Oshosun Formation (Eocene) and Ilaro Formation (Eocene) table1.
Ise Formation This is the oldest formation in the group and it unconformably overlies the basement complex of Southwestern Nigeria, consisting of conglomerates and grits at the base which is in turn overlain by coarse to medium grained sands with inter-bedded kaolinite. The conglomerates are unimbricated and at some locations ironstones occur (Nton, 2001). An age range of Neocomian-Albian is assigned to this formation based on paleontological assemblages. Afowo Formation Afowo formation overlies the Ise formation, and composed of coarse to medium grained sandstone with variable but thick interbedded shale, siltstone and claystone. The sandy facies are tar-bearing while shales are organic-rich (Enu, 1985). The lower part of this formation is transitional with mixed brackish to marginal horizons that alternate with well sorted, sub-rounded sands indicating a littoral or estuarine near-shore environment of deposition. Afowo Formation thus indicates the commencement of deposition in a transitional environment after the entire basal and continental Ise Formation. Using palynological assemblage, a Turonian age is assigned to the Lower part of this formation, while the upper part ranges into Maastrichtian. Araromi Formation This is the youngest Cretaceous formation in the group. It conformably overlies the Afowo formation. The formation is composed of fine to medium grained sandstone at the base, overlain by shales, siltstone with thin inter-beds of limestone, marl and lignite bands (Omatsola and Adegoke, 1981; Agagu, 1985). This Formation is highly fossiliferous containing abundant planktonic foraminifera, ostracods, pollen and spores. Omatsola and Adegoke (1981) assigned a Maastrichtian to Palaeocene age to this formation based on faunal content. Ewekoro Formation The Ewekoro Formation directly overlies the Abeokuta Group as observed from the sections at Ewekoro and Sagamu quarries as well as the cored sections at Ibeshe. It is an extensive limestone body, which is traceable over a distance of about 320km from Ghana in the west, towards the eastern margin of the Dahomey basin in Nigeria (Jones and Hockey, 1964). Elueze and Nton, (2004) has reported that the limestone is of shallow
Ikhane et al. 161 marine origin owing to abundance of coralline algae, gastropods, pelecypods, echnoid fragments and other skeletal debris . It is made up of grayish white and occasionally greenish limestone which is sandy toward the base and having a thickness that varies between 15-30m. This formation is dated Paleocene age. Akinbo Formation The Akinbo Formation is mostly found in the western part of the basin, directly overlying the Ewekoro Formation. It constitutes the upper part of the Imo Group. It is made up of shale and clayey sequence (Ogbe, 1972). The claystones are concretionary and are predominantly kaolinite (Nton and Elueze, 2005).The base of the formation is defined by the presence of glauconitic band with lenses of limestones (Ogbe, 1972; Nton, 2001). It is essentially greenish, highly fossiliferous and thickly laminated. The age of Akinbo Formation is considered Paleocene to Eocene. Oshosun Formation The Oshosun Formation overlies the Akinbo Formation and consists of greenish – grey or beige clay and shale with interbeds of sandstones. The shale is thickly laminated and glauconitic. According to Okosun (1998), the basal beds consist of any of the following facies; sandstones, mudstones, claystones, clay-shale or shale. This formation is phosphate- bearing (Jones and Hockey, 1964; Nton, 2001). Ilaro Formation The Ilaro Formation overlies conformably the Oshosun Formation and consists of massive, yellowish, poorly consolidated, fine to coarse, cross-bedded sandstones, clays and shales with occasional thin bands of phosphate beds being observed at Ilaro. The formation is Eocene in age. METHODS Detailed field work in which close observation and study were made on the exposed lithologic section within a shallow depression in the area noting the rock types, colour and sedimentary textures (see figures 2 and 3). Twenty four fresh samples were collected procedurally both vertically and laterally at different locations. Two samples were collected for each location, except for location four where four samples were collected and location ten to thirteen where one sample was collected
162 Int. Res. J. Geo. Min.
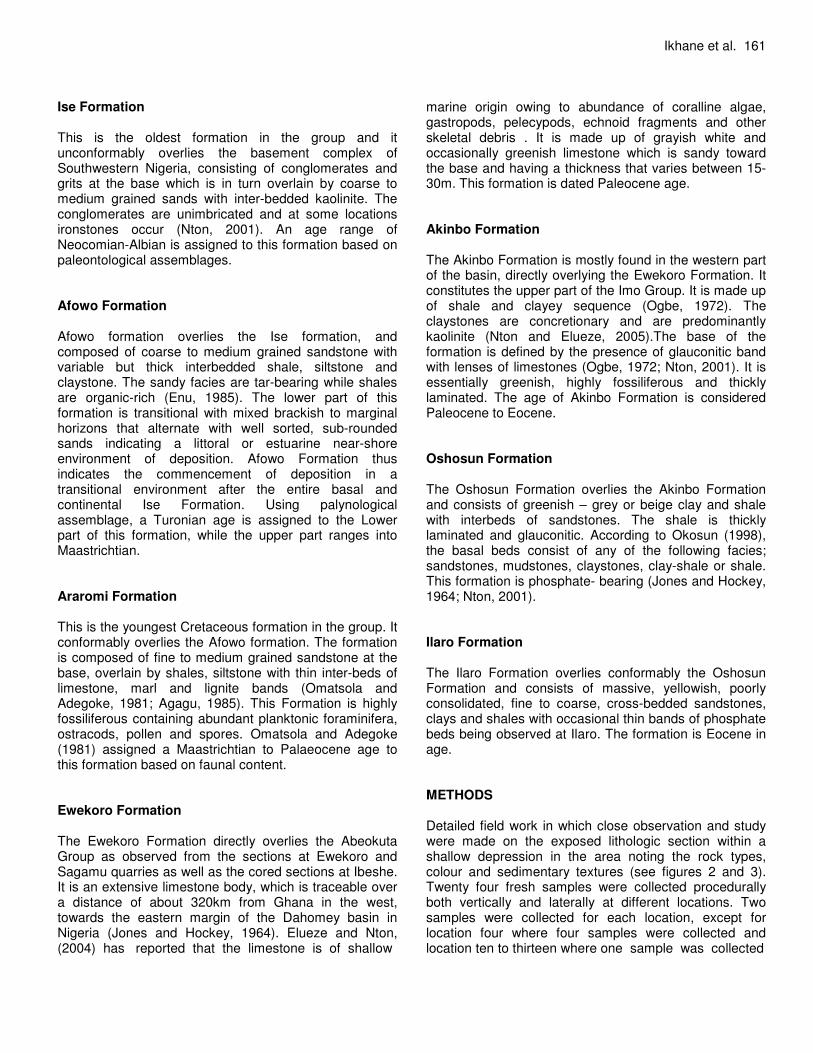
Figure 2. Exposed outcrop from road cut near Igbile, southwestern Nigeria
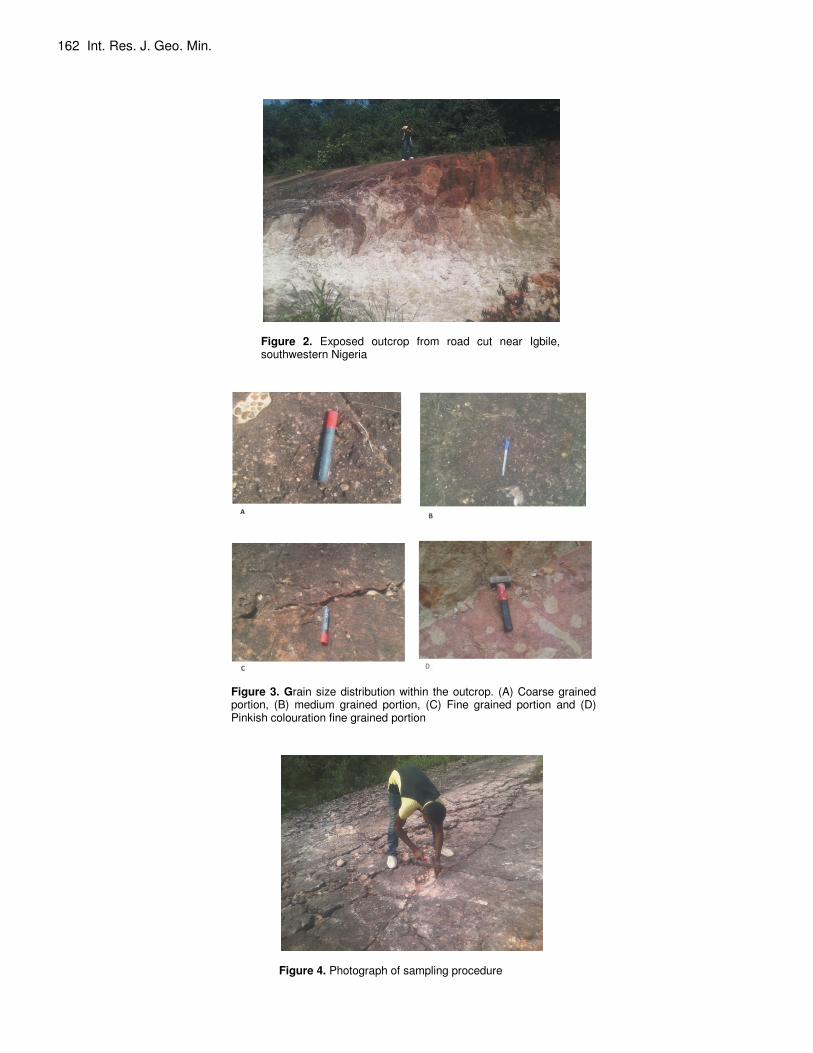
Figure 3. Grain size distribution within the outcrop. (A) Coarse grained portion, (B) medium grained portion, (C) Fine grained portion and (D) Pinkish colouration fine grained portion
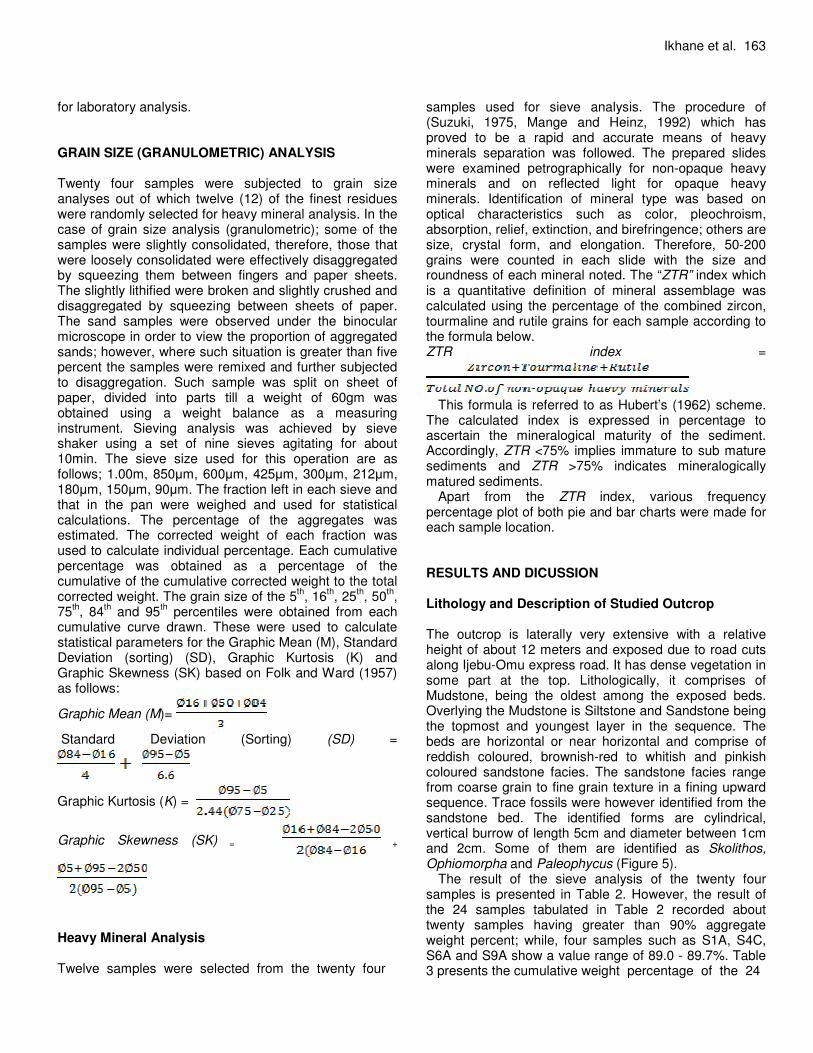
Figure 4. Photograph of sampling procedure
Ikhane et al. 163 for laboratory analysis. GRAIN SIZE (GRANULOMETRIC) ANALYSIS Twenty four samples were subjected to grain size analyses out of which twelve (12) of the finest residues were randomly selected for heavy mineral analysis. In the case of grain size analysis (granulometric); some of the samples were slightly consolidated, therefore, those that were loosely consolidated were effectively disaggregated by squeezing them between fingers and paper sheets. The slightly lithified were broken and slightly crushed and disaggregated by squeezing between sheets of paper. The sand samples were observed under the binocular microscope in order to view the proportion of aggregated sands; however, where such situation is greater than five percent the samples were remixed and further subjected to disaggregation. Such sample was split on sheet of paper, divided into parts till a weight of 60gm was obtained using a weight balance as a measuring instrument. Sieving analysis was achieved by sieve shaker using a set of nine sieves agitating for about 10min. The sieve size used for this operation are as follows; 1.00m, 850μm, 600μm, 425μm, 300μm, 212μm, 180μm, 150μm, 90μm. The fraction left in each sieve and that in the pan were weighed and used for statistical calculations. The percentage of the aggregates was estimated. The corrected weight of each fraction was used to calculate individual percentage. Each cumulative percentage was obtained as a percentage of the cumulative of the cumulative corrected weight to the total corrected weight. The grain size of the 5
th, 16
th, 25
th, 50
th,
75th, 84
th and 95
th percentiles were obtained from each
cumulative curve drawn. These were used to calculate statistical parameters for the Graphic Mean (M), Standard Deviation (sorting) (SD), Graphic Kurtosis (K) and Graphic Skewness (SK) based on Folk and Ward (1957) as follows:
Graphic Mean (M)=
Standard Deviation (Sorting) (SD) =
Graphic Kurtosis (K) =
Graphic Skewness (SK) = +
Heavy Mineral Analysis Twelve samples were selected from the twenty four
samples used for sieve analysis. The procedure of (Suzuki, 1975, Mange and Heinz, 1992) which has proved to be a rapid and accurate means of heavy minerals separation was followed. The prepared slides were examined petrographically for non-opaque heavy minerals and on reflected light for opaque heavy minerals. Identification of mineral type was based on optical characteristics such as color, pleochroism, absorption, relief, extinction, and birefringence; others are size, crystal form, and elongation. Therefore, 50-200 grains were counted in each slide with the size and roundness of each mineral noted. The “ZTR” index which is a quantitative definition of mineral assemblage was calculated using the percentage of the combined zircon, tourmaline and rutile grains for each sample according to the formula below. ZTR index =
This formula is referred to as Hubert’s (1962) scheme. The calculated index is expressed in percentage to ascertain the mineralogical maturity of the sediment. Accordingly, ZTR <75% implies immature to sub mature sediments and ZTR >75% indicates mineralogically matured sediments.
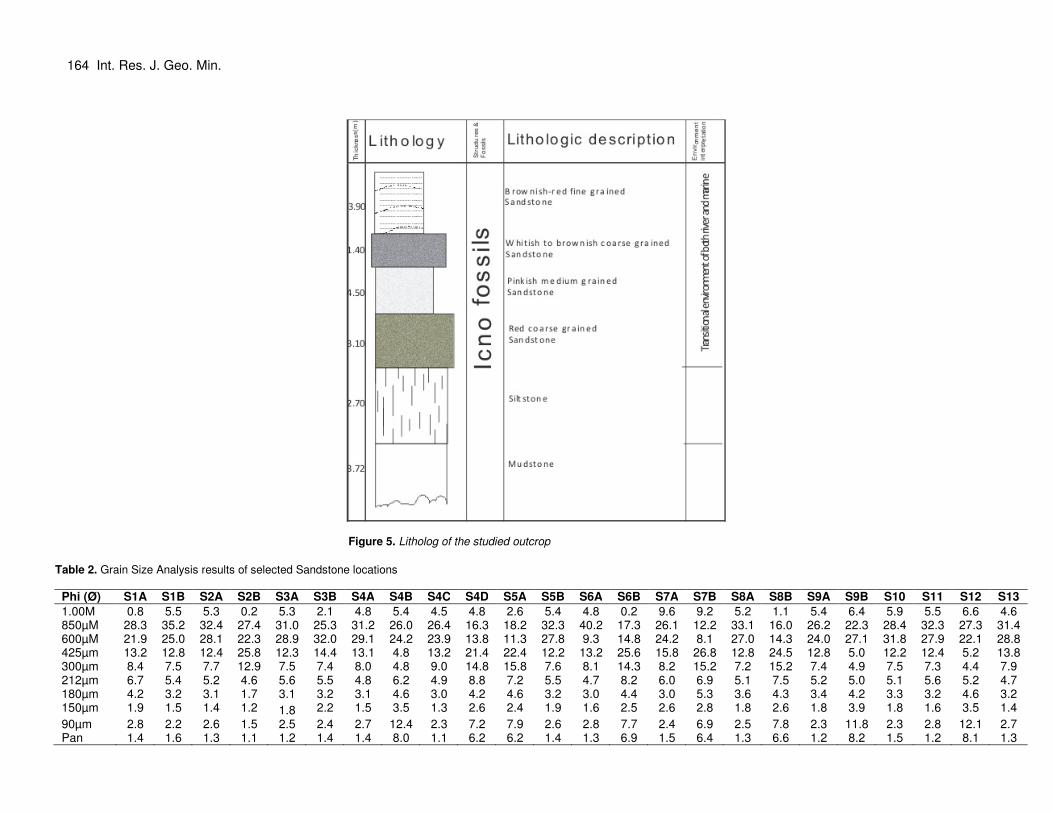
Apart from the ZTR index, various frequency percentage plot of both pie and bar charts were made for each sample location. RESULTS AND DICUSSION Lithology and Description of Studied Outcrop The outcrop is laterally very extensive with a relative height of about 12 meters and exposed due to road cuts along Ijebu-Omu express road. It has dense vegetation in some part at the top. Lithologically, it comprises of Mudstone, being the oldest among the exposed beds. Overlying the Mudstone is Siltstone and Sandstone being the topmost and youngest layer in the sequence. The beds are horizontal or near horizontal and comprise of reddish coloured, brownish-red to whitish and pinkish coloured sandstone facies. The sandstone facies range from coarse grain to fine grain texture in a fining upward sequence. Trace fossils were however identified from the sandstone bed. The identified forms are cylindrical, vertical burrow of length 5cm and diameter between 1cm and 2cm. Some of them are identified as Skolithos, Ophiomorpha and Paleophycus (Figure 5).
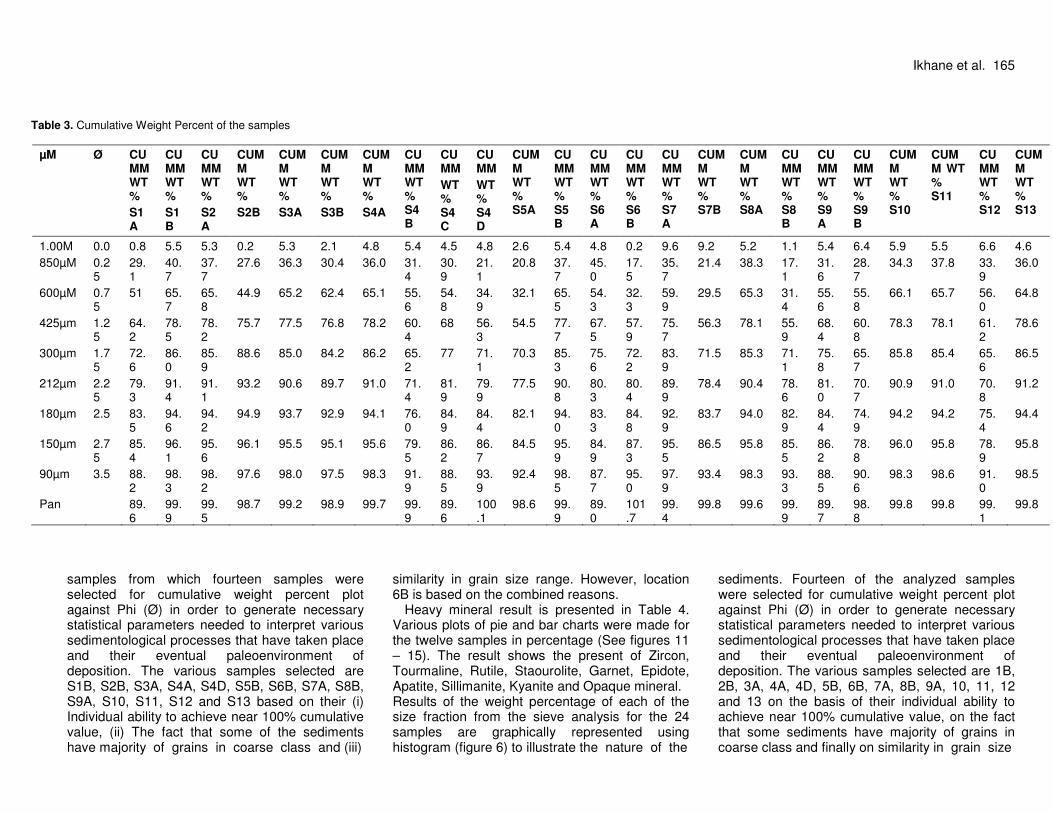
The result of the sieve analysis of the twenty four samples is presented in Table 2. However, the result of the 24 samples tabulated in Table 2 recorded about twenty samples having greater than 90% aggregate weight percent; while, four samples such as S1A, S4C, S6A and S9A show a value range of 89.0 - 89.7%. Table 3 presents the cumulative weight percentage of the 24
164 Int. Res. J. Geo. Min.
Figure 5. Litholog of the studied outcrop
Table 2. Grain Size Analysis results of selected Sandstone locations
Phi (Ø) S1A S1B S2A S2B S3A S3B S4A S4B S4C S4D S5A S5B S6A S6B S7A S7B S8A S8B S9A S9B S10 S11 S12 S13
1.00M 0.8 5.5 5.3 0.2 5.3 2.1 4.8 5.4 4.5 4.8 2.6 5.4 4.8 0.2 9.6 9.2 5.2 1.1 5.4 6.4 5.9 5.5 6.6 4.6 850µM 28.3 35.2 32.4 27.4 31.0 25.3 31.2 26.0 26.4 16.3 18.2 32.3 40.2 17.3 26.1 12.2 33.1 16.0 26.2 22.3 28.4 32.3 27.3 31.4 600µM 21.9 25.0 28.1 22.3 28.9 32.0 29.1 24.2 23.9 13.8 11.3 27.8 9.3 14.8 24.2 8.1 27.0 14.3 24.0 27.1 31.8 27.9 22.1 28.8 425µm 13.2 12.8 12.4 25.8 12.3 14.4 13.1 4.8 13.2 21.4 22.4 12.2 13.2 25.6 15.8 26.8 12.8 24.5 12.8 5.0 12.2 12.4 5.2 13.8 300µm 8.4 7.5 7.7 12.9 7.5 7.4 8.0 4.8 9.0 14.8 15.8 7.6 8.1 14.3 8.2 15.2 7.2 15.2 7.4 4.9 7.5 7.3 4.4 7.9 212µm 6.7 5.4 5.2 4.6 5.6 5.5 4.8 6.2 4.9 8.8 7.2 5.5 4.7 8.2 6.0 6.9 5.1 7.5 5.2 5.0 5.1 5.6 5.2 4.7 180µm 4.2 3.2 3.1 1.7 3.1 3.2 3.1 4.6 3.0 4.2 4.6 3.2 3.0 4.4 3.0 5.3 3.6 4.3 3.4 4.2 3.3 3.2 4.6 3.2 150µm 1.9 1.5 1.4 1.2 1.8 2.2 1.5 3.5 1.3 2.6 2.4 1.9 1.6 2.5 2.6 2.8 1.8 2.6 1.8 3.9 1.8 1.6 3.5 1.4
90µm 2.8 2.2 2.6 1.5 2.5 2.4 2.7 12.4 2.3 7.2 7.9 2.6 2.8 7.7 2.4 6.9 2.5 7.8 2.3 11.8 2.3 2.8 12.1 2.7 Pan 1.4 1.6 1.3 1.1 1.2 1.4 1.4 8.0 1.1 6.2 6.2 1.4 1.3 6.9 1.5 6.4 1.3 6.6 1.2 8.2 1.5 1.2 8.1 1.3
Ikhane et al. 165
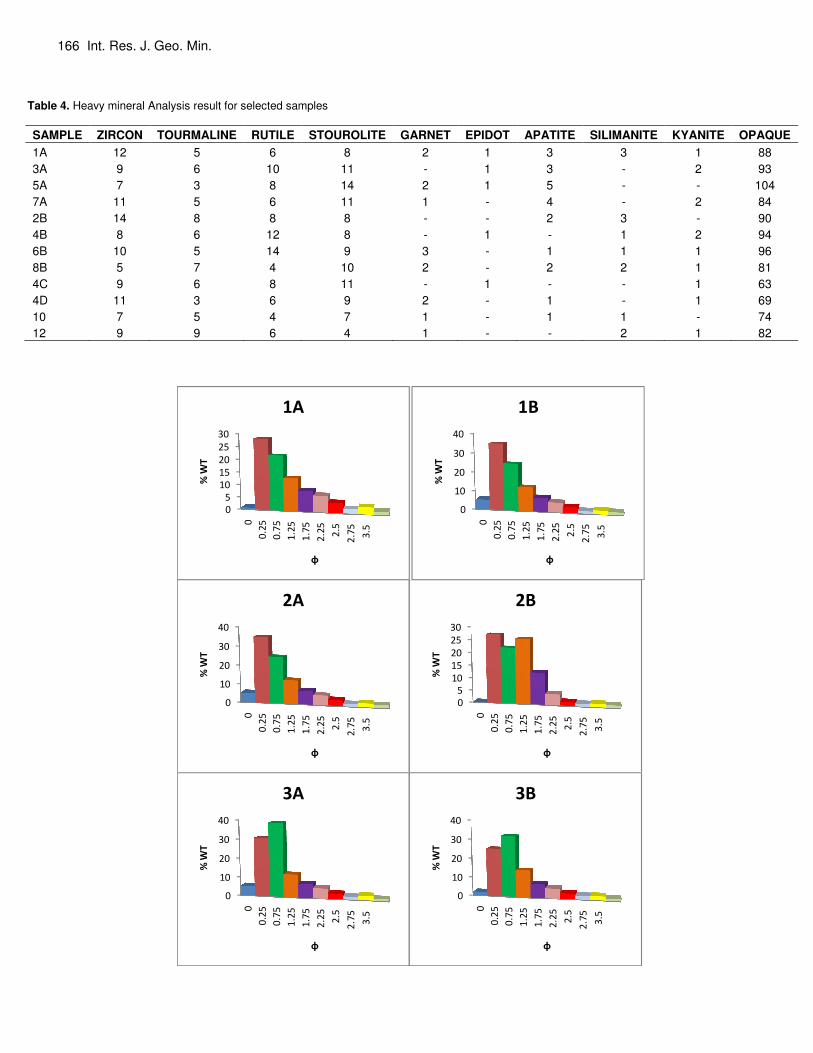
Table 3. Cumulative Weight Percent of the samples
µM Ø CUMM WT %
S1A
CUMM WT %
S1B
CUMM WT %
S2A
CUMM WT %
S2B
CUMM WT %
S3A
CUMM WT %
S3B
CUMM WT %
S4A
CUMM WT % S4B
CUMM
WT% S4C
CUMM
WT% S4D
CUMM WT % S5A
CUMM WT % S5B
CUMM WT % S6A
CUMM WT % S6B
CUMM WT % S7A
CUMM WT % S7B
CUMM WT % S8A
CUMM WT % S8B
CUMM WT % S9A
CUMM WT % S9B
CUMM WT % S10
CUMM WT % S11
CUMM WT % S12
CUMM WT % S13
1.00M 0.0 0.8 5.5 5.3 0.2 5.3 2.1 4.8 5.4 4.5 4.8 2.6 5.4 4.8 0.2 9.6 9.2 5.2 1.1 5.4 6.4 5.9 5.5 6.6 4.6
850µM 0.25
29.1
40.7
37.7
27.6 36.3 30.4 36.0 31.4
30.9
21.1
20.8 37.7
45.0
17.5
35.7
21.4 38.3 17.1
31.6
28.7
34.3 37.8 33.9
36.0
600µM 0.75
51 65.7
65.8
44.9 65.2 62.4 65.1 55.6
54.8
34.9
32.1 65.5
54.3
32.3
59.9
29.5 65.3 31.4
55.6
55.8
66.1 65.7 56.0
64.8
425µm 1.25
64.2
78.5
78.2
75.7 77.5 76.8 78.2 60.4
68 56.3
54.5 77.7
67.5
57.9
75.7
56.3 78.1 55.9
68.4
60.8
78.3 78.1 61.2
78.6
300µm 1.75
72.6
86.0
85.9
88.6 85.0 84.2 86.2 65.2
77 71.1
70.3 85.3
75.6
72.2
83.9
71.5 85.3 71.1
75.8
65.7
85.8 85.4 65.6
86.5
212µm 2.25
79.3
91.4
91.1
93.2 90.6 89.7 91.0 71.4
81.9
79.9
77.5 90.8
80.3
80.4
89.9
78.4 90.4 78.6
81.0
70.7
90.9 91.0 70.8
91.2
180µm 2.5 83.5
94.6
94.2
94.9 93.7 92.9 94.1 76.0
84.9
84.4
82.1 94.0
83.3
84.8
92.9
83.7 94.0 82.9
84.4
74.9
94.2 94.2 75.4
94.4
150µm 2.75
85.4
96.1
95.6
96.1 95.5 95.1 95.6 79.5
86.2
86.7
84.5 95.9
84.9
87.3
95.5
86.5 95.8 85.5
86.2
78.8
96.0 95.8 78.9
95.8
90µm 3.5 88.2
98.3
98.2
97.6 98.0 97.5 98.3 91.9
88.5
93.9
92.4 98.5
87.7
95.0
97.9
93.4 98.3 93.3
88.5
90.6
98.3 98.6 91.0
98.5
Pan 89.6
99.9
99.5
98.7 99.2 98.9 99.7 99.9
89.6
100.1
98.6 99.9
89.0
101.7
99.4
99.8 99.6 99.9
89.7
98.8
99.8 99.8 99.1
99.8
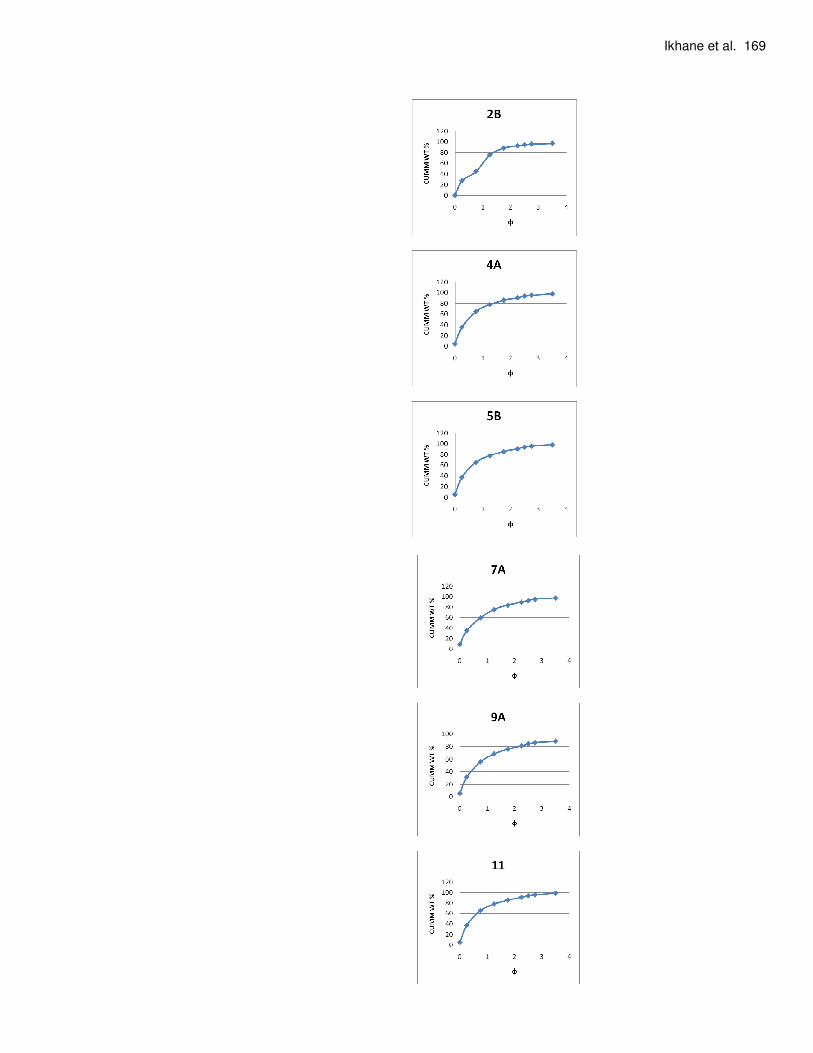
samples from which fourteen samples were selected for cumulative weight percent plot against Phi (Ø) in order to generate necessary statistical parameters needed to interpret various sedimentological processes that have taken place and their eventual paleoenvironment of deposition. The various samples selected are S1B, S2B, S3A, S4A, S4D, S5B, S6B, S7A, S8B, S9A, S10, S11, S12 and S13 based on their (i) Individual ability to achieve near 100% cumulative value, (ii) The fact that some of the sediments have majority of grains in coarse class and (iii)
similarity in grain size range. However, location 6B is based on the combined reasons.
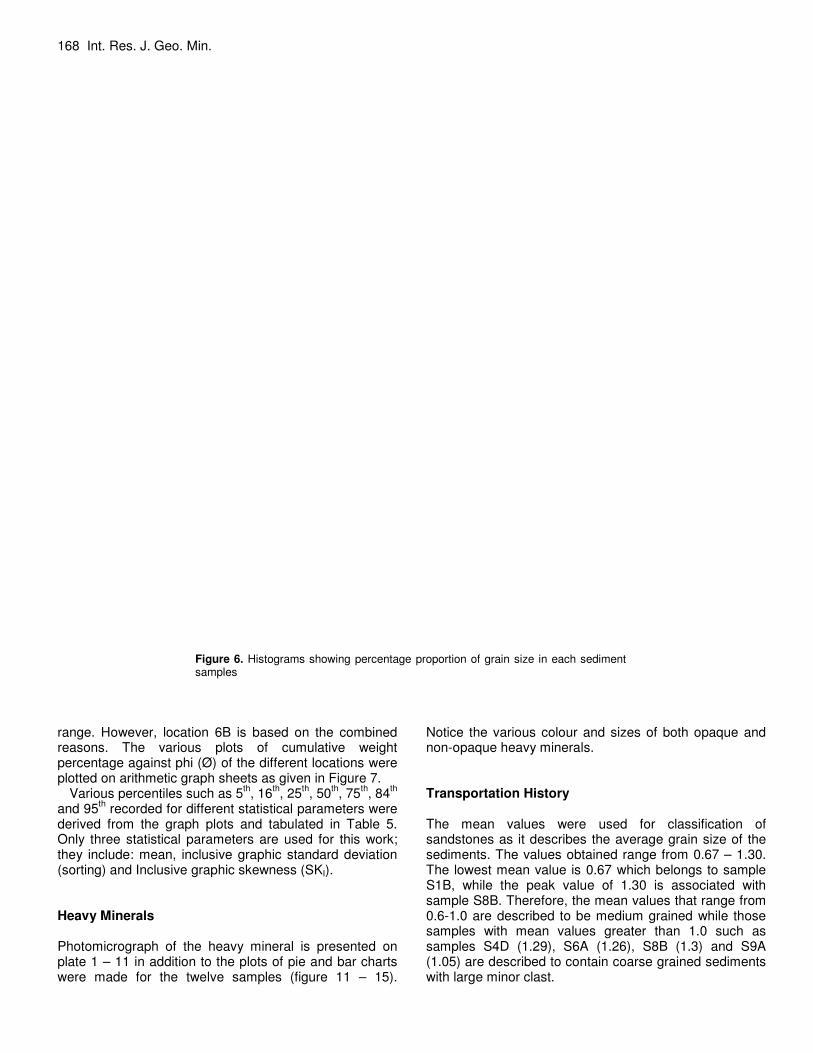
Heavy mineral result is presented in Table 4. Various plots of pie and bar charts were made for the twelve samples in percentage (See figures 11 – 15). The result shows the present of Zircon, Tourmaline, Rutile, Staourolite, Garnet, Epidote, Apatite, Sillimanite, Kyanite and Opaque mineral. Results of the weight percentage of each of the size fraction from the sieve analysis for the 24 samples are graphically represented using histogram (figure 6) to illustrate the nature of the
sediments. Fourteen of the analyzed samples were selected for cumulative weight percent plot against Phi (Ø) in order to generate necessary statistical parameters needed to interpret various sedimentological processes that have taken place and their eventual paleoenvironment of deposition. The various samples selected are 1B, 2B, 3A, 4A, 4D, 5B, 6B, 7A, 8B, 9A, 10, 11, 12 and 13 on the basis of their individual ability to achieve near 100% cumulative value, on the fact that some sediments have majority of grains in coarse class and finally on similarity in grain size
166 Int. Res. J. Geo. Min.
Table 4. Heavy mineral Analysis result for selected samples
SAMPLE ZIRCON TOURMALINE RUTILE STOUROLITE GARNET EPIDOT APATITE SILIMANITE KYANITE OPAQUE
1A 12 5 6 8 2 1 3 3 1 88
3A 9 6 10 11 - 1 3 - 2 93
5A 7 3 8 14 2 1 5 - - 104
7A 11 5 6 11 1 - 4 - 2 84
2B 14 8 8 8 - - 2 3 - 90
4B 8 6 12 8 - 1 - 1 2 94
6B 10 5 14 9 3 - 1 1 1 96
8B 5 7 4 10 2 - 2 2 1 81
4C 9 6 8 11 - 1 - - 1 63
4D 11 3 6 9 2 - 1 - 1 69
10 7 5 4 7 1 - 1 1 - 74
12 9 9 6 4 1 - - 2 1 82
0
5
10
15
20
25
30
0
0.2
5
0.7
5
1.2
5
1.7
5
2.2
5
2.5
2.7
5
3.5
% W
T
φ
1A
0
10
20
30
40
0
0.2
5
0.7
5
1.2
5
1.7
5
2.2
5
2.5
2.7
5
3.5
% W
T
φ
1B
0
10
20
30
40
0
0.2
5
0.7
5
1.2
5
1.7
5
2.2
5
2.5
2.7
5
3.5
% W
T
φ
2A
0
5
10
15
20
25
30
0
0.2
5
0.7
5
1.2
5
1.7
5
2.2
5
2.5
2.7
5
3.5
% W
T
φ
2B
0
10
20
30
40
0
0.2
5
0.7
5
1.2
5
1.7
5
2.2
5
2.5
2.7
5
3.5
% W
T
φ
3A
0
10
20
30
40
0
0.2
5
0.7
5
1.2
5
1.7
5
2.2
5
2.5
2.7
5
3.5
% W
T
φ
3B

Ikhane et al. 167
168 Int. Res. J. Geo. Min.
Figure 6. Histograms showing percentage proportion of grain size in each sediment samples
range. However, location 6B is based on the combined reasons. The various plots of cumulative weight percentage against phi (Ø) of the different locations were plotted on arithmetic graph sheets as given in Figure 7.
Various percentiles such as 5th, 16
th, 25
th, 50
th, 75
th, 84
th
and 95th recorded for different statistical parameters were
derived from the graph plots and tabulated in Table 5. Only three statistical parameters are used for this work; they include: mean, inclusive graphic standard deviation (sorting) and Inclusive graphic skewness (SKI). Heavy Minerals Photomicrograph of the heavy mineral is presented on plate 1 – 11 in addition to the plots of pie and bar charts were made for the twelve samples (figure 11 – 15).
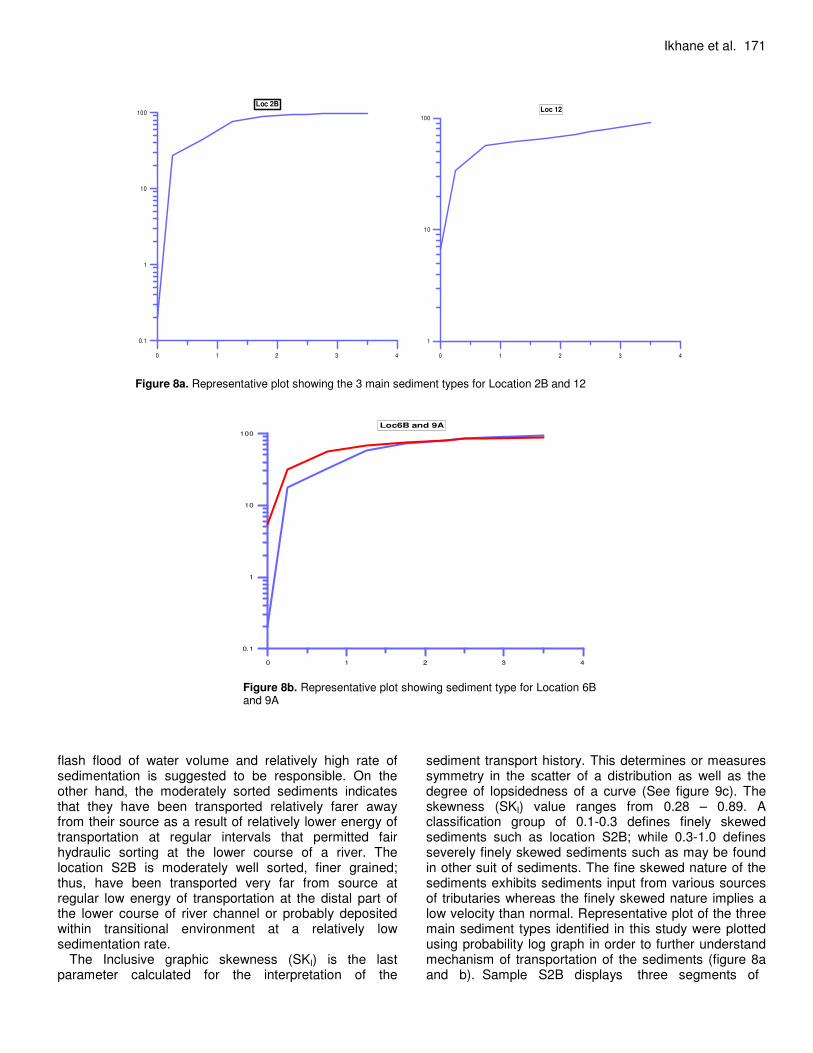
Notice the various colour and sizes of both opaque and non-opaque heavy minerals. Transportation History The mean values were used for classification of sandstones as it describes the average grain size of the sediments. The values obtained range from 0.67 – 1.30. The lowest mean value is 0.67 which belongs to sample S1B, while the peak value of 1.30 is associated with sample S8B. Therefore, the mean values that range from 0.6-1.0 are described to be medium grained while those samples with mean values greater than 1.0 such as samples S4D (1.29), S6A (1.26), S8B (1.3) and S9A (1.05) are described to contain coarse grained sediments with large minor clast.
Ikhane et al. 169
170 Int. Res. J. Geo. Min.
Figure 7. Cumulative percentage plots of the analysed samples
Table 5. Percentile values of selected sample locations
Percentile 1B 2B 3A 4A 4D 5B 6B 7A 8B 9A 10 11 12 13
5 0.0 0.05 0.0 0.0 0.0 0.0 0.06 0.0 0.05 0.0 0.0 0.0 0.0 0.0
16 0.08 0.15 0.08 0.10 0.26 0.08 0.28 0.08 0.25 0.08 0.1 0.08 0.05 0.03
25 0.15 0.22 0.15 0.18 0.5 0.15 0.45 0.15 0.43 0.2 0.15 0.20 0.1 0.15
50 0.35 0.7 0.40 0.45 1.10 0.4 1.05 0.43 1.05 0.58 0.4 0.4 0.36 0.45
75 1.08 1.25 1.15 1.15 1.95 1.10 1.9 1.10 2.0 1.65 1.12 1.10 1.10 1.12
84 1.58 1.52 1.65 1.60 2.5 1.65 2.45 1.60 2.6 2.5 1.60 1.65 1.65 1.6
95 2.65 2.45 2.75 2.65 3.6 2.60 3.45 2.65 3.63 3.6 2.65 2.60 2.65 2.6
Table 6. Values obtained from the calculated Mean, Inclusive standard deviation, and Inclusive graphic skewness of the selected sample locations
Percentile 1B 2B 3A 4A 4D 5B 6B 7A 8B 9A 10 11 12 13
Mean 0.67 0.79 0.71 0.72 1.29 0.71 1.26 0.70 1.3 1.05 0.7 0.71 0.69 0.69
Inclusive Standard Deviation(sorting) 0.78 0.70 0.81 0.78 1.11 0.78 1.05 0.78 1.13 1.15 0.78 0.78 0.8 0.78
Inclusive Graphic Skewness 0.69 0.28 0.69 0.60 0.32 0.88 0.71 0.61 0.38 0.89 0.65 0.65 0.67 0.56
Therefore, two main sediment size types which varies from coarse to medium grain are present. The coarse conglomeratic natured sediments observed were associated with high energy conditions in which smaller grains were washed away leaving the coarse, pebbly grains that were too heavy due to gravity to be carried away by the water current. Such sediments are suggested to be within the upper course of a river regime. On the contrary, the medium grained sediments of the other samples are suggested to have been carried further down the river channel at a relatively lower energy of transportation. Moreover, sample location S2B is suggested to be the finest of the three classes in grain size and as such transported farer than the other two groups of relative sand size class; with a more relatively low energy of transportation. Hence, a form of lateral gradation or down grading phenomenon is obtained, whereby, sample from locations S4D, S6B, S8B and SS9A were weathered, transported and deposited at the upper course of the river, while, sample from locations S1B, S3A, S4A, S5B, S7A, S10, S11, S12 and S13 were deposited further down- stream and location 2B was
probably deposited at the mouth of the river. Another important statistical parameter utilized for the
deduction of the transport history is Inclusive standard deviation (sorting). The sorting measures the scatter around the mean and the greater the scatter, the higher the standard deviation and the poorer the sorting. The statistical calculation indicated a sorting values range from 0.70 - 1.15. The lowest value (0.70) corresponds to location S2B while the highest (sorting) value (1.15) belongs to location S9A. The classification class of 0.5 – 0.71 defined as moderately well sorted is only found in location S2B; 0.71 – 1.0 defined as moderately sorted encompasses sample locations S1B, S3A, S4A, S5B, S7A, S10, S11, S12, and S13; while value range 1.0-2.0 defined as poorly sorted is associated with sample locations S4D, S6B, S8B and S9A. The spread of sorting values is a reflection of distance of transportation, energy and environment of deposition as described for “mean”. Therefore, the poorly sorted sediments of locations S4D, S6B, S8B and S9A have not been transported far away from their source; high energy of transportation which did not permit hydraulic sorting and probably associated with
Ikhane et al. 171
0 1 2 3 4
Phi
0.1
1
10
100
Loc 2B
0 1 2 3 4
Phi
1
10
100
Loc 12
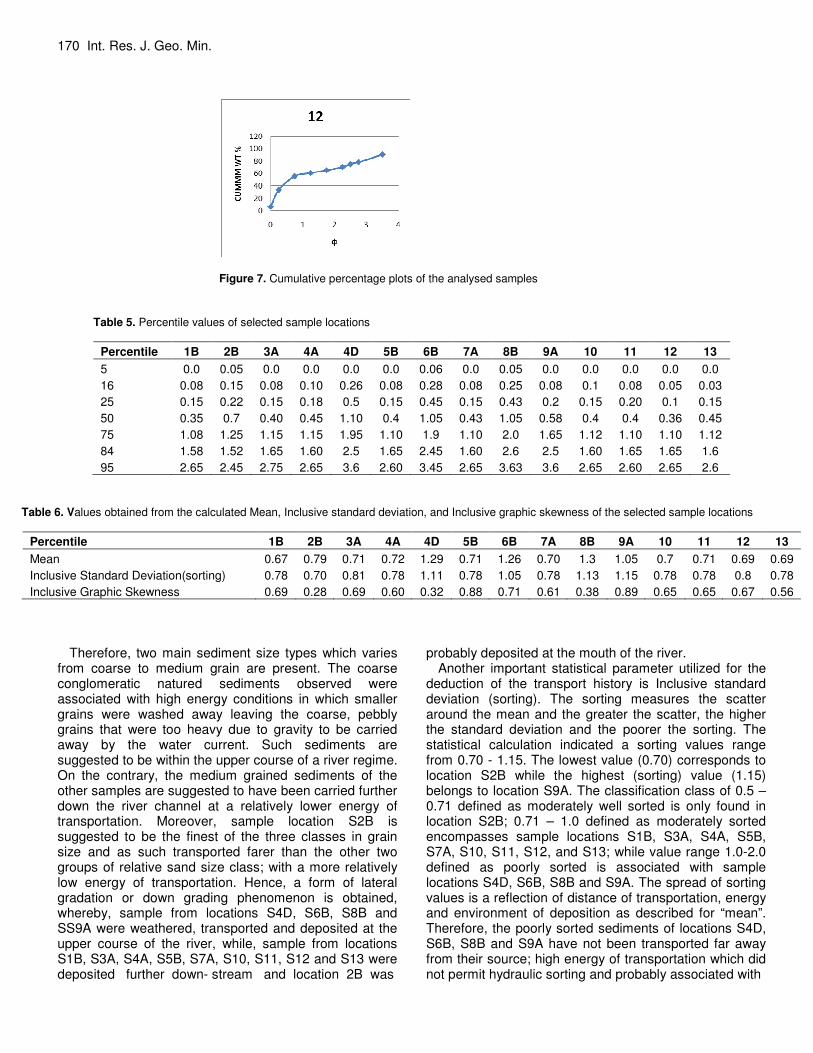
Figure 8a. Representative plot showing the 3 main sediment types for Location 2B and 12
0 1 2 3 4
Phi
0.1
1
10
100
Loc6B and 9A
Figure 8b. Representative plot showing sediment type for Location 6B and 9A
flash flood of water volume and relatively high rate of sedimentation is suggested to be responsible. On the other hand, the moderately sorted sediments indicates that they have been transported relatively farer away from their source as a result of relatively lower energy of transportation at regular intervals that permitted fair hydraulic sorting at the lower course of a river. The location S2B is moderately well sorted, finer grained; thus, have been transported very far from source at regular low energy of transportation at the distal part of the lower course of river channel or probably deposited within transitional environment at a relatively low sedimentation rate.
The Inclusive graphic skewness (SKI) is the last parameter calculated for the interpretation of the
sediment transport history. This determines or measures symmetry in the scatter of a distribution as well as the degree of lopsidedness of a curve (See figure 9c). The skewness (SKI) value ranges from 0.28 – 0.89. A classification group of 0.1-0.3 defines finely skewed sediments such as location S2B; while 0.3-1.0 defines severely finely skewed sediments such as may be found in other suit of sediments. The fine skewed nature of the sediments exhibits sediments input from various sources of tributaries whereas the finely skewed nature implies a low velocity than normal. Representative plot of the three main sediment types identified in this study were plotted using probability log graph in order to further understand mechanism of transportation of the sediments (figure 8a and b). Sample S2B displays three segments of
172 Int. Res. J. Geo. Min.
0
0.5
1
1.5
2
0 5 10 15
Me
an
Sample location
Mean
Figure 9a. Variogram of mean for the selected locations
0
0.2
0.4
0.6
0.8
1
1.2
1.4
0 5 10 15
ST
D
Sample location
STD
Figure 9b. Variogram of inclusive standard deviation for the selected locations
0
0.1
0.2
0.3
0.4
0.5
0.6
0.7
0.8
0.9
1
0 2 4 6 8 10 12 14 16
SK
I
Sample location
SKI
Figure 9c. Variogram of Inclusive graphic skewness for the selected sample locations
Ikhane et al. 173
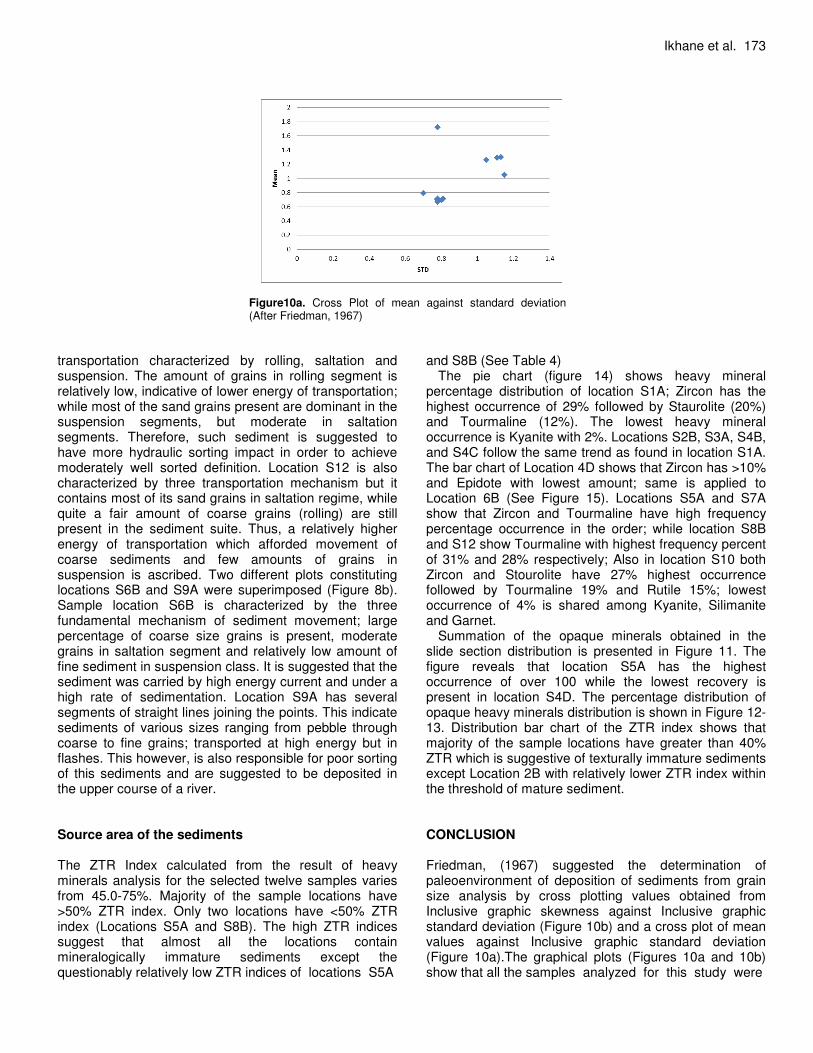
Figure10a. Cross Plot of mean against standard deviation (After Friedman, 1967)
transportation characterized by rolling, saltation and suspension. The amount of grains in rolling segment is relatively low, indicative of lower energy of transportation; while most of the sand grains present are dominant in the suspension segments, but moderate in saltation segments. Therefore, such sediment is suggested to have more hydraulic sorting impact in order to achieve moderately well sorted definition. Location S12 is also characterized by three transportation mechanism but it contains most of its sand grains in saltation regime, while quite a fair amount of coarse grains (rolling) are still present in the sediment suite. Thus, a relatively higher energy of transportation which afforded movement of coarse sediments and few amounts of grains in suspension is ascribed. Two different plots constituting locations S6B and S9A were superimposed (Figure 8b). Sample location S6B is characterized by the three fundamental mechanism of sediment movement; large percentage of coarse size grains is present, moderate grains in saltation segment and relatively low amount of fine sediment in suspension class. It is suggested that the sediment was carried by high energy current and under a high rate of sedimentation. Location S9A has several segments of straight lines joining the points. This indicate sediments of various sizes ranging from pebble through coarse to fine grains; transported at high energy but in flashes. This however, is also responsible for poor sorting of this sediments and are suggested to be deposited in the upper course of a river. Source area of the sediments The ZTR Index calculated from the result of heavy minerals analysis for the selected twelve samples varies from 45.0-75%. Majority of the sample locations have >50% ZTR index. Only two locations have <50% ZTR index (Locations S5A and S8B). The high ZTR indices suggest that almost all the locations contain mineralogically immature sediments except the questionably relatively low ZTR indices of locations S5A
and S8B (See Table 4) The pie chart (figure 14) shows heavy mineral
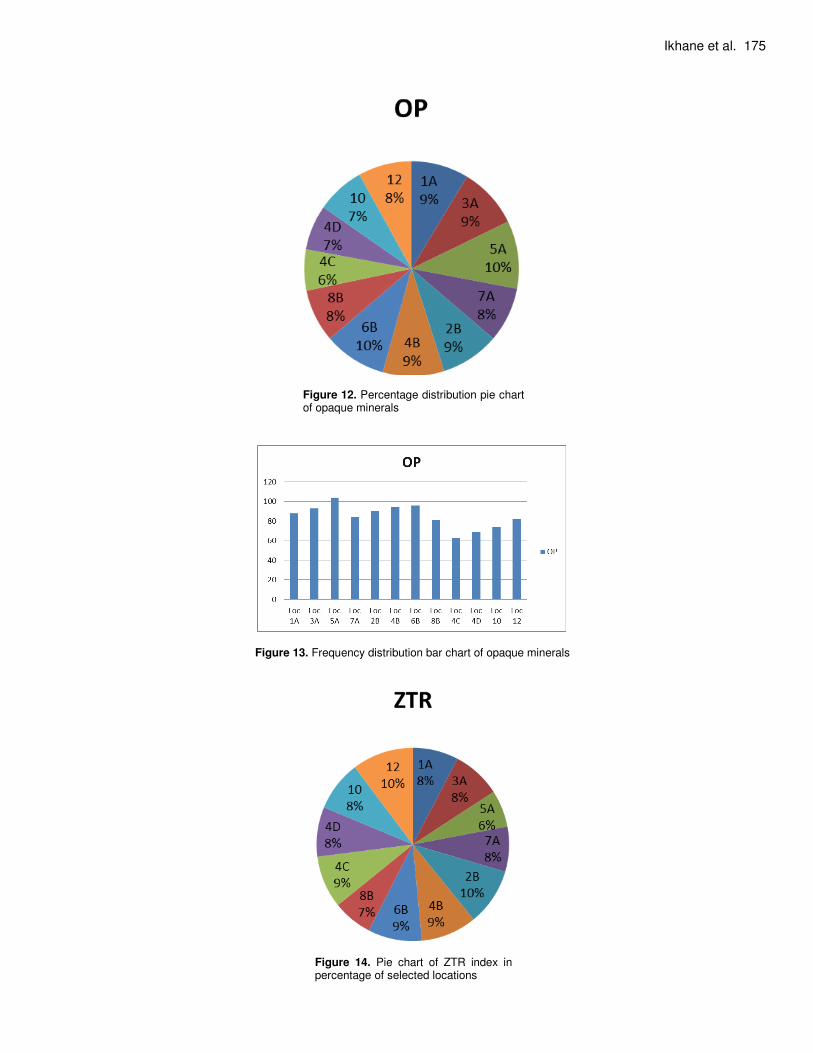
percentage distribution of location S1A; Zircon has the highest occurrence of 29% followed by Staurolite (20%) and Tourmaline (12%). The lowest heavy mineral occurrence is Kyanite with 2%. Locations S2B, S3A, S4B, and S4C follow the same trend as found in location S1A. The bar chart of Location 4D shows that Zircon has >10% and Epidote with lowest amount; same is applied to Location 6B (See Figure 15). Locations S5A and S7A show that Zircon and Tourmaline have high frequency percentage occurrence in the order; while location S8B and S12 show Tourmaline with highest frequency percent of 31% and 28% respectively; Also in location S10 both Zircon and Stourolite have 27% highest occurrence followed by Tourmaline 19% and Rutile 15%; lowest occurrence of 4% is shared among Kyanite, Silimanite and Garnet.
Summation of the opaque minerals obtained in the slide section distribution is presented in Figure 11. The figure reveals that location S5A has the highest occurrence of over 100 while the lowest recovery is present in location S4D. The percentage distribution of opaque heavy minerals distribution is shown in Figure 12-13. Distribution bar chart of the ZTR index shows that majority of the sample locations have greater than 40% ZTR which is suggestive of texturally immature sediments except Location 2B with relatively lower ZTR index within the threshold of mature sediment. CONCLUSION Friedman, (1967) suggested the determination of paleoenvironment of deposition of sediments from grain size analysis by cross plotting values obtained from Inclusive graphic skewness against Inclusive graphic standard deviation (Figure 10b) and a cross plot of mean values against Inclusive graphic standard deviation (Figure 10a).The graphical plots (Figures 10a and 10b) show that all the samples analyzed for this study were
174 Int. Res. J. Geo. Min.
0
0.1
0.2
0.3
0.4
0.5
0.6
0.7
0.8
0.9
1
0 0.2 0.4 0.6 0.8 1 1.2 1.4
SK
ISTD
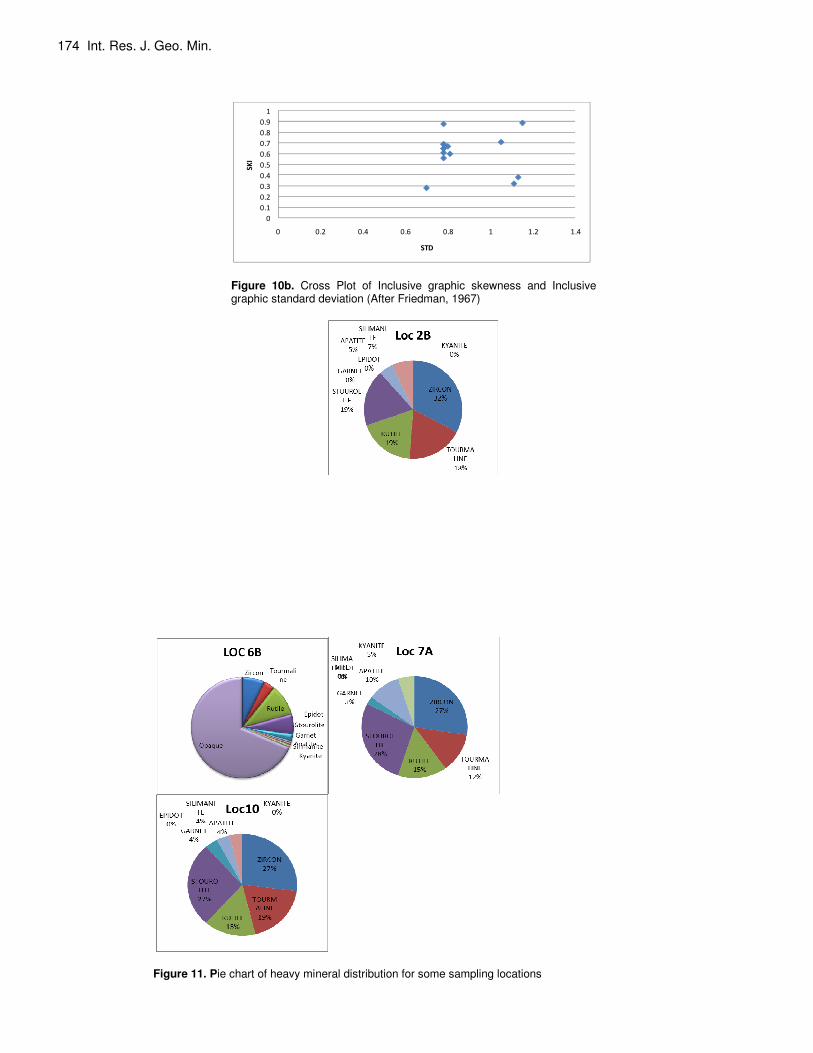
Figure 10b. Cross Plot of Inclusive graphic skewness and Inclusive graphic standard deviation (After Friedman, 1967)
Figure 11. Pie chart of heavy mineral distribution for some sampling locations
Ikhane et al. 175
Figure 12. Percentage distribution pie chart of opaque minerals
Figure 13. Frequency distribution bar chart of opaque minerals
Figure 14. Pie chart of ZTR index in percentage of selected locations
176 Int. Res. J. Geo. Min.
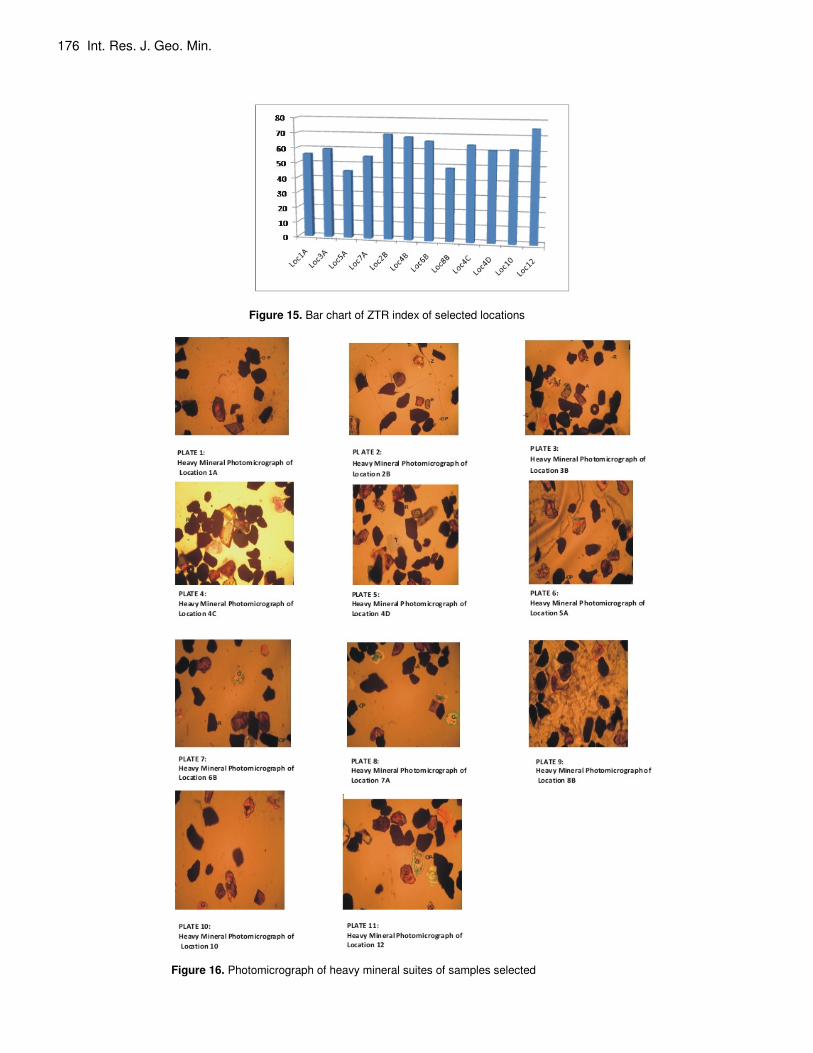
Figure 15. Bar chart of ZTR index of selected locations
Figure 16. Photomicrograph of heavy mineral suites of samples selected
Ikhane et al. 177 deposited by a river. However, a close observation as shown in Figure 10b shows that sample S2B was deposited at the fringe of the beach environment or better described to be influenced by transitional environment of both river and marine effects. The combined unidirectional and multiple directional water wave effect is suggested to be responsible for moderately well sorted impact on the sediment. Lateral grading or down grading is also apparent; whereby samples S9A, S8B, S6B continued to improve in sorting, though they are all poorly sorted, but gradually become moderately sorted as the sediments get closer towards marine environment. This is reflected in locations S1B and S3A. Thus, the sediments of samples S4D, S6B, S8B and S9A are texturally immature while as the downgrading progresses samples S1B, S3A, S4A, S5A, S7A, S10, S11, S12 and S13 are texturally sub mature while sample S2B is texturally mature because of its proximity to beach environment. Some of the sediments in the locations studied are suggested to be from both igneous and metamorphic rocks and also possibly from volcanic source. All locations except location S2B did not contain garnet and Kyanite heavy minerals which are indicative of metamorphic source. The mono-source characteristic could also be responsible for the moderately well sorted exhibited by particles deposited in the location. Also, all locations except location S4B is characterized by sediment input from volcanic source due to the presence of Apatite heavy mineral which is a source indicator. The combined suites of sediment source characterized by different geologic evolution could be an additional factor responsible for degree of weathering imparted on the sand grains; consequently, they have different degrees of sorting. REFERENCES Adegoke OS (1969). Eocene stratigraphy of southern Nigeria, bulletin
de research geologic et miners memoirs pp. 22 – 48. Adeigbe OC, Salufu AE (2009). Geology and depositional environment
of Campano-Maastrichtian sediments in the Anambah basin, southeastern Nigeria: evidence from field relationship and sedimentological study. Earth Sci. Res. J. 13(2):148-166
Adekoya JA, Aluko AF, Opeloye SA (2011). Sedimentological characteristics of ajali sandstone in the Benin flank of Anambra basin, Nigeria. Ife J. Sci. 13: 2.
Agagu OA (1985). A geological scale guide to bituminous sediments in southwestern Nigeria, Upd/rept. Dept of geology, university of Ibadan
Akinmosin A, Oredein OS, Odewande AA (2008). Sedimentological and reservoir description of Afowo oil sand deposits, Southwestern Nigeria. Ife J. sci. 8(1): 35 – 45.
Akinmosin A, Osinowo OO (2008). Sedimentological characteristics of the Nigerian tar sand deposits in parts of southwestern Nigeria. Continental J. Earth Sci. 3:8-21, 2008.
Akinmosin AA, Omosanya KO, Ikhane PR, Mosuro GO, Goodluck I (2012). Characterization of a bitumen seepage in Eastern Dahomey Basin, SW, Nigeria. Adv. Appl. Sci. Res. 2012, 3(4):2078-2089.
Akintola AI, Ikhane PR, Okunlola OA, Akintola GO, Oyebolu OO, Owoseni FR (2012). Mineralogical and geochemical studies of sandstone in Imobi study area and its environs, southwestern Nigeria. J. Environ. Earth Sci. 2(10):2224-3216
Ako BD, Alabi AO, Adegoke OS, Enu EL (1983). Application of
resistivity sounding in exploration of Nigerian tar sand, energy exploration and exploitation, 2(2):155–164.
America Bulletin, 25: 655-744 Andrew CM, Claire H (2003). Identifying provenance, specific features
of detrital heavy mineral assamblages in sandstone, 90: 241 – 256. Basu A (2003) Provenance. In: Encyclopedia of Sediments and
Sedimentary Rocks (Ed. Middleton, G.V.). Kluwer Academic Publishers, Dordrecht; pp. 544–549.
Billman HG (1976). Offshore stratigraphy and paleontology of Dahomey embayment, West Africa. Proc 7
th African micropaleontology coll. Ile
Ife, Nigeria. Billman HG (1992). Offshore stratigraphy and paleontology of Dahomey
(Benin) embayment nape bulletin 70(02):121 – 130. Bui EN, Mazullo J, Wilding LP (1990). Using quartz grain size and
shape analysis to distinguish between aeolian and fluvial deposits in the Dallol Bosso of Niger (West Africa). Earth Surface Processes and Landforms 14: 157–166.
Burke KCB, Dessauvagie TFJ, Whiteman AJ (1971). The opening of the gulf guinea and the geological history of Benue depression and Niger Delta. Nature physical science 233(38):51 – 55.
Coker SJL (2002). Field excursion guide to tar sand outcrops in Benin basin nape mini-conference pp. 32.
Dickson WR, Suczek CA (1979). Plate tectonics and sandst5one compositions: American association of petroleum geologist 63:2164–2182.
Durham KN, Pickett CR (1966). Oil mining lease 44, lekki borehole Programme, rep. Tenesse Nigeria inc.
Fayose EA (1970). Stratigraphy paleontology of Afowo well, Southwestern Nigeria. J. Niger. Mining, J. sedimentary petrol. 5: 1-99.
Feo-codecido G (1956). Heavy mineral techniques and their application to Venezuelan stratigraphy Pp. 40.
Folk RL (1954). The distinction between grain size and mineral composition in sedimentary rock nomenclature, J. Geol. 62:344-359.
Folk RL (1966). A review of grain-size parameters, Sedimentology 6:73–93.
Folk RL, Ward WC (1957). Brazos river bar: a study in the significance of grain size parameters. J. Sediment petrol., 27: 3 – 26.
Friedman GM (1961). Distiction between Dune, Beach and river sands from textural characteristics, Journal of Sedimentary petrology, 31:514 -529.
Friedman GM (1967). Dynamic processes and statistical parameter compared for size frequency distribution of beach and river sands. J. Sedimentary petrol. 37:327-354.
Friedman GM (1979). Differences in size distribution of population of particles among sands of various origins, J. Sedimentolgy, 8, pp 45-53.
Friedman GM, Sanders JE (1978). Principles of Sedimentology, Wiley New York, pp. 792.
Gary N (2009). Sedimentology and Stratigraphy. A John Wiley & Sons, Ltd., Publication, pp.432
Hubert JT (1962). Zircon-tourmaline-rutile maturity index and interdependence of the composition of heavy minerals assemblages with the gross composition and texture of sandstones. J. Sed pet. 32:440–450.
Hyne NJ (2001). Non-technical guide to petroleum geology, exploration, drilling and production
IKhane PR, Akintola AI, Akintola GO, Okunlola OA, Oyebolu OO, Udo IU (2012). Petrography and geochemical appraisal of Afowo sandstone facies, Dahomey basin, southwestern Nigeria, Chemistry and Materials Research 2(5) :2224- 3224
Jones HA, Hockey RD (1964). The geology of part of southwestern Nigeria, geological survey bull. Geol. Surv. 31: 1 – 101.
Joshua EO, Oyebanjo OA, Jibiri NN, Fasunwon OO (2010). Osun River Basin Sediments Heavy Mineral Distribution. Pacific J. Sci. Technol. 11(1):598-605.
Kingston DR, Dishroon CP, Williams PA (1983). Global basin classification system. American association of petroleum geologist bulletin, 67:2175 – 2193.
Klemme HD (1974). Geothermal gradients, heatfiow and hrdrocarbon recovery. In: a.g. fisher and s. Judson (eds), petroleum and global tectonics. Princeton, new jersey, Princeton univ. press, pp. 251 – 304

178 Int. Res. J. Geo. Min. Kohl CP, Nishiizumi K (1992). Chemical isolation of quartz for
measurement of in situproduced cosmogenic nuclides: Geochimica et Cosmochimica Acta, 56: 3583–3587.
Krumbein WC (1934). Size frequency distributions of sediments, J. Sedimentary Petrol. 4: 65–77.
Krumbein WC (1938). Size frequency distribution of sediments and the normal phi curve. J. Sedimentary Petrol. 8: 84–90.
Krumbein WC, Pettijohn FJ (1938). Manual of Sedimentary Petrography. Appleton-Century-Crofts: New York.
Krumbien WC (1938). Application of logarithimic moments to size frequency distribution of sediments, J. Sedimentary petrol. 6: 35- 47.
McCammon RB (1962). Efficiencies of percentile measures for describing the mean size and sorting of sedimentary particles, J. Geol. 70: 453–465.
Nton NE, Ikhane PR, Tijani MN (2009). Aspect of Rock-Eval studies of the Maastrichtian-Eocene sediments from subsurface, in the Eastern Dahomey basin, southwestern Nigeria. Eur. J. sci. Res. 25(3):417 – 427.
Ogbe FAG (1972). Stratigraphy of strata exposed in ewekoro quarry, southwestern Nigeria, African geology, pp. 305 – 322.
Omali AO, Imasuen OI, Okiotor ME (2012). Sedimentological Characteristics of Lokoja Sandstone Exposed At Mount Patti Bida Basin, Nigeria. Adv. Appl. Sci. Res. 2011, 2(2):227-245.
Omatsola ME, Adegoke OS (1981). Tectonic evolution and cretaceous stratigraphy of the Dahomey Basin, Niger. J. mining and geol. 18(01):130 - 137.
Omosanya KO, Ariyo SO, Ikhane PR, Laniyan TA (2011). Geology of Nigeria (field trip guide), pp. 25
Onuigbo EN, Etu-Efeotor JO, Okoro AU (2012). Palynology, Paleoenvironment and Sequence Stratigraphy of the Campanian- Maastrichtian Deposits in the Anambra Basin, Southeastern Nigeria. Eur. J. Sci. Res. ISSN 1450-216X, 78(3):333-348
Otto GH (1939), A modified logarithmic probability graph for the interpretation of mechanical analyses of sediments. J. Sedimentary petrol. 9: 62-72.
Parrado-Román JM, Achab M (1999). Grain-size trends associated with
sediment transport patterns in Cadiz Bay (southwest Iberian Peninsula). Bol. Inst. Esp. Oceanogr. 15(1-4):269-282.
Pettijohn FJ (1975). Sedimentary Rocks (3rd edition). Harper and Row, New York
Pettijohn FJ (1984). Sedimentary rocks 3rd Ed.CBS publ. and distributors Delhi, Pp 1-16
Pettijohn FJ, Potter PE, Siever R (1987) Sand and Sandstone. Springer-Verlag, New York, Pp. 628.
Plummer CC, McGeary D, Carlson DH (1996). Physical geology the McGeary-Hill companies, Inc. Pp. 580.
Reyment RA (1965). Aspect of the geology of Nigeria, Ibadan university press, pp. 78 – 145.
Sato T (1966). Heavy minerals in sandstone. Geology monthly, Japan, 141:34-38.
Simon JB, Kenneth P (2001). A grain size distribution and statistics package for the analysis of unconsolidated sediments. Earth Surf. Process. Landforms 26:1237–1248
Udden JA (1914). Mechanical composition of clastic sediments, Geological society of America Bulletin, 25:655-744
Vijayakumar V, Vasudevan S, Pruthiviraj T (2011). Sedimentological characteristics of Perumal lake Cuddalore District Tamilnadu South India Int. J. Environ. Sci. 1(7):2018 - 2027
Von-eynatten H, Carles B, Vera P (2003). Composition and discrimination of sandstones: a statistical evaluation of different analytical methods. J. sedimentary Res. 73(1):47–57
Weber KJ, Daukoru E (1975). Petroleum geology of the Niger Delta ninth world petroleoum congress 2:209-221.
Wentworth CK (1922). A scale of grade and class terms for clastic sediments. J. Geol. 30:377–394.
Whiteman AJ (1982). Nigeria: Its petroleum geology, resources and potential, graham and trotman, London, 2: 394.