Embed Size (px)
Citation preview

The 5 Star Toilet Campaign: Improving toilet use in rural Gujarat
Kavita Chauhan, London School of Hygiene and Tropical Medicine (LSHTM)
Wolf Peter Schmidt, LSHTM
Robert Aunger, LSHTM
Balaji Gopalan, Upward Spiral
Deepak Saxena, Indian Institute of Public Health Gandhinagar
S Yashobant, Indian Institute of Public Health Gandhinagar
Vebhav Patwardhan, Upward Spiral
Val Curtis, LSHTM
Grantee Final Report
Accepted by 3ie: August 2019

2
Note to readers This impact evaluation has been submitted in partial fulfilment of the requirements of grant TW14.1002 issued under Promoting Latrine Use in Rural India Evidence Programme. This version is being published online as it was received. A copy-edited and formatted version will be available in the 3ie Impact Evaluation Report Series in the near future.
All content is the sole responsibility of the authors and does not represent the opinions of 3ie, its donors or its board of commissioners. Any errors and omissions are the sole responsibility of the authors. All affiliations of the authors listed in the title page are those that were in effect at the time the report was accepted. Any comments or queries should be directed to the corresponding author, Kavitha Chauhan at [email protected].
The 3ie technical quality assurance team comprises Neeta Goel, Radhika Menon, Sayak Khatua, Shaon Lahiri, Anmol Narain, Rosaine Yegbemey, Marie Gaarder an anonymous external impact evaluation design expert reviewer and an anonymous external sector expert reviewer, with overall technical supervision by Marie Gaarder.
Funding for this impact evaluation was provided by the Bill & Melinda Gates Foundation. A complete listing of all of 3ie’s donors is available on the 3ie website.
Suggested citation: Chauhan, K, Schmidt, WP, Aunger, R, Gopalan, B, Saxena, D, Yashobant, S, Patwardhan, V and Curtis, V, 2019. The 5 Star Toilet Campaign: Improving toilet use in rural Gujarat, 3ie Grantee Final Report. New Delhi: International Initiative for Impact Evaluation (3ie)

3
Acknowledgements
The 5 Star Toilet Campaign (TW14.1002) was supported by the International Initiative for Impact Evaluation (3ie) and the Research Institute for Compassionate Economics (r.i.c.e).
Special thanks to the Government of Gujarat for their support. We express gratitude to communities for their participation in this trial. We thank Neeta Goel, Radhika Menon (3ie) and Sangita Vyas (r.i.c.e) for their valuable feedback from time to time. We thank our collaborators Upward Spiral led by Balaji Gopalan and Nipa Desai for their meticulous efforts in designing the intervention and Ketan Hingu and the team of facilitators employed by Coastal Salinity Prevention Cell for delivering the intervention. We thank 3ie team comprising of Asha Gosain, Sibasish Mishra, Shaon Lahiri, Anmol Narain, Jyotsna Siddhartha and Sayak Khatua, for their operational and coordination support. We thank Divyang Waghela and Amitanshu Choudhury from TATA Trusts for their guidance to the project. We thank all the researchers and practitioners, whose work we reviewed and referenced, for their contribution to this important area of public health. We thank LSHTM for sponsoring the trial and Research Ethics Committees at LSHTM and IIPHG for providing ethical clearance to the study. We thank AIM and SARAL for conducting the end line data collection.
The analysis and recommendations of this report do not necessarily reflect the official views of the donors or its agencies. Textual material may be freely reproduced with complete citation, as appropriate.
4
Abbreviations
3ie International Initiative for Impact Evaluation
AWC Anganwadi Centre
BC Behaviour Change
BCC Behaviour Change Communication
BCD Behaviour Centred Design
CAG Comptroller and Auditor General of India
CLTS Community Led Total Sanitation
CRT Cluster Randomised Trial
CSC Community Sanitary Complexes
CSPC Coastal Salinity Prevention Cell
GoG Government of Gujarat
GoI Government of India
IEC Information, Education and Communication
IHouseholdL Individual Household Latrines
IIPHG Indian Institute of Public Health Gandhinagar
ITT Intention to Treat
LSHTM London School of Hygiene and Tropical Medicine
MoDWS Ministry of Drinking Water and Sanitation
MoHFW Ministry of Health and Family Welfare
OD Open Defaecation
ODF Open Defaecation Free
PHFI Public Health Foundation of India
QCI Quality Council of India
SBM-G Swachh Bharat Mission- Gramin
SLWM Solid and Liquid Waste Management
US Upward Spiral
WaSH Water Sanitation and Hygiene
WHO World Health Organisation

5
CONTENTS Summary----------------------------------------------------------------------------------------------------------------------6
1. Introduction -------------------------------------------------------------------------------------------------------------7-10
2. Intervention ------------------------------------------------------------------------------------------------------------11-19 2.1 Description 2.2 Theory of change 2.3 Monitoring plan
3. Evaluation---------------------------------------------------------------------------------------------------------------20-28 3.1 Primary and secondary question 3.2 Design and methods 3.3 Ethics 3.4 Sampling and data collection
4. Findings-----------------------------------------------------------------------------------------------------------------29-49 4.1 Process evaluation 4.2 Impact evaluation
5. Cost analysis --------------------------------------------------------------------------------------------------------------50
6. Discussion -------------------------------------------------------------------------------------------------------------51-56 6.1 Introduction 6.2 Policy and programme relevance: evidence uptake and use 6.3 Challenges and lessons
7. Conclusions and recommendations ------------------------------------------------------------------------------57
Bibliography --------------------------------------------------------------------------------------------------------------58-60
Annexures ----------------------------------------------------------------------------------------------------------------61-111 Annex 1: Evidence from past trials Annex 2: Findings of formative research Annex 3: The 5 Star toilet campaign’s design process Annex 4: The 5 Star toilet campaign’s theory of change Annex 5: Monitoring data Annex 6: Pre-Analysis Plan Annex 7: End line survey tool Annex 8: Behaviour Centred Design Annex 9: Photographs Annex 10: Map

6
Summary
Over the past four decades, the Government of India has taken several steps to improve toilet coverage. In 2014, the launch of Swachh Bharat Mission (SBM) provided impetus to toilet construction and focus on toilet use increased through communication and behaviour change activities. The ‘5 Star Toilet’ campaign was conducted in the context of SBM. It was based on the theory and process of Behaviour Centred Design (BCD). The overall purpose of this programme was to learn about how to change toilet use behaviours by addressing the key drivers of toilet use. This study was a cluster randomised trial with 94 clusters (47 clusters each in treatment and control arms) of the identified blocks (Mahuva, Talaja and Palitana) in Bhavnagar, Gujarat (Annex 10). The primary unit of analysis for the trial was the household and the outcome of interest was the proportion of households (assessed in n=30 households per cluster) that report use of toilets by all household members, measured 6 weeks after intervention delivery through self-reported/proxy-reported questionnaire survey and an additional tool masking open defecation questions as a physical activity survey. The end line study consisted of: 1) the physical activity survey administered in 30 households and 2 members per household in 94 clusters, followed by 2) a questionnaire survey to understand toilet use in 30 households in 94 clusters and 3) process data collected from 4 clusters (2 from each study arm) during and after the intervention delivery period to assess implementation of the campaign.
The end line study findings did not show clear evidence for a relevant effect of the intervention on toilet use in the intervention setting. The small increase in toilet use by all household members aged above 5 years was below the anticipated effect size for which the study was powered. We observed a small increase in toilet use of 7.0% points (95%CI 1.4 / 12.6), which was attenuated to 5.5% (95%CI 0.0 / 11.0) after adjusting for sample population imbalances. The physical activity tool which attempted to measure toilet use less intrusively showed a 4.4% points lower prevalence of toilet use with only a 1.7% points higher prevalence in the intervention arm (95%CI -3.2 / 6.7). The process evaluation suggested that low exposure of the target population to the intervention may be a possible cause for the results. Only about 10-15% of the intervention households showed evidence of exposure to the intervention. Further analysis revealed that this small exposure was insufficient to change the population’s perceptions around toilet ownership and other relevant sanitation-related factors. Small positive changes in toilet features and proxy markers of current use were observed but statistical support for these small changes was low and could have occurred by chance. The intervention also failed to change practices around child defecation, although the intervention design did not specifically target this behaviour. There is already evidence of another form of impact, however, in that the campaign concept and components have been taken up by other important actors in the sector, including the regional government and Tata Trusts. This kind of impact on government and other civil actors may eventually result in the research having real consequences for toilet use in Gujarat, and further afield.
This study presents important lessons for designing programmes related to behaviour change. The intervention was delivered in clusters with already high levels of toilet coverage and use which appears to have reduced the proportion of the population that could have benefitted from the intervention. Thus, the results underscore the need to identify a suitable target population for future interventions aiming at increasing use of existing toilets. From the implementation perspective, this strongly reduces the efficiency of an intervention if it mainly consists of activities performed at the community level. Better targeting of the intervention to households that are not currently using their toilet fully could be key to improving the effectiveness of the campaign and making it more efficient from the cost perspective. Sufficient time and resources for iterative intervention development and pilot testing could help to maximise the potential of this kind of an intervention approach.

7
1. INTRODUCTION
Open defecation (OD), a practice of defecating outside in open spaces, is a persistent public health challenge in several countries, including India, which, until recently, had more than 60% of the global population that defecates in the open (World Health Organizaton 2015). For more than three decades, the Government of India has made efforts to improve sanitation in rural India mainly by providing subsidy for toilet construction with some information, education and communication (IEC) activities. The erstwhile efforts such as the Central Rural Sanitation Programme (CRSP), the Total Sanitation Campaign (TSC) and the Nirmal Bharat Abhiyan emphasized increasing awareness and demand for sanitary facilities. However, the past strategy was criticised for a lack of consistent implementation strategy to roll out the larger national programme, inadequate capacities and facilitation skills of staff to implement sanitation programmes, political interference, and challenges in accessing government financial incentives for latrine construction. A report by the India Parliamentary Standing Committee listed "traditional behavioural patterns, lack of awareness, socio-cultural issues and habits" as reasons for OD (Committee et al. 2002). In 2014, through the launch of Swachh Bharat Mission-Gramin (SBM-G), the pace of toilet construction accelerated with additional funds provision (SBM, 2014). Renewed strategies include a decentralised approach to improving sanitation coverage and use by augmenting the capacity of State governments to undertake behaviour change activities by ensuring roll out of the programme and incentivizing performance. Financial incentives are provided to Below Poverty Line (BPL) households for construction and usage of individual household latrines (IHHL). Gram Panchayats (village councils) that achieve “open defecation free" (ODF) status receive monetary rewards and publicity, which recognises their achievements. In addition, SBM-Gramin focused on mass media campaigns and village level events to address people’s toilet use behaviour. The status of toilet coverage and use in rural India, as reported by various surveys varies. While the coverage has improved, villages are far from the mark of universal sanitation coverage where every household has access to a functional toilet. The data on use also varies due to varying sample size and lack of standardised measurements. Recent surveys show improvement in provision of toilets; however, they also raise the concern around inadequate use. The Swachhta Status Report (NSSO 2016) found that around 52% of the country still defecated in the open. A survey conducted by r.i.c.e reported that 40% of households that had a working toilet had at least one person who regularly defecated in the open. Further, less than half of households with a government-built toilet used it regularly (SQUAT, 2014). A recent survey suggests that 44% of the rural population in Bihar, Madhya Pradesh, Uttar Pradesh and Rajasthan still defecate in the open (r.i.c.e. 2018). For example, the present study was conducted in Bhavnagar, Gujarat. Bhavnagar is typical of rural India in many respects with high levels of agricultural production alongside the rapid growth of industry (for example onion processing, ship-breaking and diamond polishing). The Quality Council of India (QCI, 2016) survey, found that the percentage of people using household and /or community toilets (out of households having a toilet) was 96% for Gujarat. The National Annual Rural Sanitation Survey (NARSS) 2017-18, conducted in 6136 randomly selected villages (including households, Anganwadi centres and schools), found that about 77% homes in rural areas have access to toilets and over 93% households in villages who have access to toilets were reported to be using them. However, according to a recent report of the Comptroller and Auditor General of India (CAG) a survey conducted in 120-gram panchayats in eight districts of Gujarat found that nearly 30% of the households had no access to toilets, either individual or public (CAG, 2018). 1.1 Scientific background and rationale

8
Improving sanitation coverage and use is a public health priority in India and in countries where open defecation remains high. A limited number of effectiveness trials (see Annex 1), evaluating the health impact of improved sanitation/toilet coverage, have been conducted in rural India and other countries. However, evidence on the effectiveness of interventions to improve behaviour related to sanitation use and hygiene practices is much more limited. A recent systematic review by Freeman and colleagues (Freeman et al. 2017) found positive impact of sanitation on aspects of health (diarrhoea, soil transmitted helminths infections, trachoma, schistosomiasis, and nutritional status). In their assessment (of effectiveness trials) the authors found few studies reporting coverage and use. The authors propose that, since sanitation acts as a barrier to lessen faecal exposure (both individual and communal), assessments of community level coverage and use, not just at individual level, may provide meaningful and relevant insights. The authors emphasise the need for experimental cluster randomised trials to provide data on the role of increased sanitation coverage and use and research that describes interventions and their implementation.
Garn et al. carried out another systematic review and meta-analysis of 64 studies to assess the impact of sanitation on toilet coverage and use. Their review found that most sanitation interventions had a limited impact on increasing latrine coverage and use which may be due to high baseline coverage level which may have restricted the absolute increase in coverage as there is less room for improvement. The review found that most of the studies did not assess sustained adoption of interventions beyond the initial impacts of the interventions on toilet coverage or use. The review quantitatively characterized which sanitation interventions increase latrine coverage and latrine use, and factors associated with higher use of latrines. Different types of household-based sanitation interventions that increased latrine use included the Government of India’s Total Sanitation Campaign, latrine subsidy/provision interventions, other latrine subsidy/provision interventions that also incorporated education components, sewerage interventions, sanitation education interventions, and CLTS interventions. The review found that people were more likely to use a toilet which was functional, well maintained, accessible, clean, private, and provided amenities for practicing hygienic behaviours like anal cleaning and menstrual management (defined as adequate sanitation -- that meets the needs of the user) (Garn et al. 2017).
As Schmidt points out, if an intervention is unable to achieve a reasonable change in sanitation coverage and use (demand) then it is unlikely to have any effect on health outcomes (Schmidt 2015). Interventions providing toilets in rural areas may have not substantially improved health, likely because of incomplete coverage and low usage (Duflo et al. 2015).
Taken together, the above studies suggest that though improving toilet coverage is, of course, one important component in the reduction of open defecation, it is not the whole solution. Efforts should always be made to ensure that toilets that are built are also used. This is a particularly marked problem in India, where there is a strong history of OD. As Luby concludes: we need to develop and assess interventions that both improve coverage, and significantly shift defecation behaviour, so reducing environmental contamination (Luby 2014).
The literature also highlights serious problems with the measurement of toilet use – particularly the potential measurement biases of self-reported toilet use. Curtis therefore suggests that there is a need to invest in the design, management, rigorous measurement and evaluation of large-scale, sanitation and hygiene promotion programmes (Curtis et al. 2011). Although building sanitation infrastructure is an important step in delivery of sanitation services, individual and community behaviour must change to ensure that there is demand for these services. There is an important role for behaviour change interventions to address these determinants of toilets use.
1.1 The 5 Star Toilet Campaign

9
The Government of Gujarat has reported steady progress in improving availability of toilets in rural areas and in October 2017 all districts in Gujarat were declared ODF. The Government of Gujarat recognises the need to move to a new phase of activity which makes toilets and their use sustainable, to account for households that were not covered in the previous targets, such as those with now defunct toilets, and those households that did not exist in the 2012 baseline survey. They recognise that a sharper focus on influencing behavioural determinants of toilet use may help achieve the desired effects -- i.e. improved toilet use and better health indicators. Despite improved coverage of toilets, the consistent use of these toilets by all family members remains a problem. Through our discussions with the state government and key stakeholders working in Gujarat, we understand that the government of Gujarat is looking for solutions to further improve sustained use of toilets.
During the formative research phase of our study (see Annex 2), we found that not all toilets built through government support were being used, and in some villages -- even if the government had approved toilet construction or approved the release of the financial subsidy -- the realisation of those funds by households and the construction and completion of some toilets is still pending. We also found that men in households were more reluctant than females to use their new toilets. Thus, intervention components in the ‘5 Star Toilet’ campaign are targeted at men (toilet makeover, pit emptying, community events).
This study of the ‘5 Star Toilet’ campaign is a cluster randomised trial (CRT) of an innovative, theory-based intervention which aims to improve toilet use in select clusters of Bhavnagar. The trial tested an intervention based on Behaviour Centred Design (BCD) to address determinants of toilet use in three blocks of Bhavnagar district in rural Gujarat. The 5 Star Toilet campaign was delivered at cluster level and the evaluation was conducted on a randomised sample of 30 households (with government/contractor-built toilets) per cluster in 94 clusters (47 clusters in each study arm). The process evaluation helped to identify the causes of success and/or failure of the intervention on improving toilet use behaviours and to study the hypothesised pathways to change of intervention components. From a methodological point of view, it is difficult to ascertain toilet use, typically measured through different self-reported questionnaires, as responses are difficult to validate, and outcomes are not easily comparable. Thus, in addition to self-reported measures, our study used an alternative tool, masking open defecation questions as a physical activity survey, to measure toilet use. The trial team includes Principal Investigator from the London School of Hygiene and Tropical Medicine (LSHTM) (Professor Val Curtis), Behaviour Centred Design co-founder from LSHTM (Dr Robert Aunger), lead-study statistician from LSHTM (Dr Wolf Peter Schmidt), a Research Fellow and trial coordinator from LSHTM (Kavita Chauhan), co-principal investigator from the Indian Institute of Public Health, Gandhinagar (IIPHG) (Professor Dileep Mavalankar), a field epidemiologist from IIPHG (Dr Deepak Saxena) and Research Assistants from IIPHG (S Yasobant, Vebhav Patwardhan and Priya Bhavsar). The intervention was managed by a Programme Manager (Ketan Hingu) and delivered by trained facilitators of the local implementing partner organisation (Coastal Salinity Prevention Cell), trained community level volunteers and professional artists engaged locally. The creative development agency Upward Spiral (led by Balaji Gopalan and Nipa Desai) developed the intervention design and supervised the quality of intervention delivery. 1.3. About the report

10
This report is organised into seven Chapters and 10 Annexes. Chapter 2 of this report describes the process followed to develop the intervention, its theory of change and the intervention components. We then present the intervention monitoring plan. In Chapter 3 we present the CRT methodology. The findings of this study from process and impact evaluations are presented in Chapter 4. In Chapter 5 we present cost analysis of the intervention delivery and discussion is presented in Chapter 6. The study recommendations are presented in concluding Chapter 7.

11
2. INTERVENTION
2.1 Description The overall purpose of our study was to learn how to improve toilet use in rural India. The aim of this study was to evaluate the effect of the ‘5 Star Toilet’ campaign on toilet use by all members of a household aged 5 years or older. The intervention aimed to address the complex determinants of low toilet use in rural Gujarat and improve toilet use among all members of a household in households with government/contractor-built toilets in selected villages of Bhavnagar, Gujarat. 2.2 Diagnostic process followed to design the intervention The ‘5 Star Toilet’ campaign used the BCD framework and theory of change (ToC) to design its intervention (Aunger & Curtis 2016) (see Figure 1, also see Annex 8). BCD uses design thinking for the process of designing and testing interventions. BCD addresses both psychological and environmental determinants of behaviour and has a built-in design process suitable for intervention design and delivery. It has provided guidance to successful behaviour change interventions in India for handwashing with soap (Biran et al. 2014), oral rehydration solution (ORS) use in Zambia (Greenland et al. 2017), food hygiene in Nepal (Gautam et al. 2017), infant feeding behaviour in Indonesia (White et al. 2016), and post-operative exercise Ireland (Doyle 2015) and has also been applied to the marketing of sanitation and hygiene products.
The 5 Star Toilet campaign’s design process involved a double diamond concept (British Design Council, 2007) which maps the divergent (where number of possible ideas are created) and convergent (refining and narrowing down to the best idea) stages of the design process, showing the different modes of thinking that were used to develop the intervention (see Annex 3).
Figure 2.1: Behaviour Centred Design (Aunger and Curtis, 2016)
BCD’s theory of change involves five steps: Assess (research); Build (field-based data collection); Create (creativity and imagination); Deliver (implementation) and; Evaluate (analysis).

12
In ‘A’ we started by listing basic assumptions on drivers of toilet use followed by a review of published and grey literature and held a Framing Workshop with inputs from local and international expertise to specify the target behaviours, their hypothetical drivers and additional insights. This included the factors that were discovered in the literature review as well as other hypotheses that were developed by the study team/experts on the basis of experience. This was important as small-scale interventions and innovative programmes are often not documented in the public domain. These insights were then organised using the BCD checklist of potential factors in the environment, setting and brain and included: water availability, caste related taboos, pit filling, knowledge about disease, manners, shame, dignity, safety, comfort, nurture, routine and habit (see Annex 3).
Table 2.1 below outlines the remaining steps in the diagnostic process, based on BDC, followed to design and develop the intervention.
Table 2.1: Diagnostic process followed to develop the intervention.
Process Steps Activities B BUILD A formative research was conducted in the inception phase of the
project to identify the key determinants of toilet use/non-use in the study population and to arrive at a design brief. The research methods included structured conversations with the help of a discussion guide and varied research tools (stories, games, personifications etc.) and survey in 200 households to understand toilet coverage and functionality.
B1 Interviews/survey In-depth interviews with key informants and survey in randomly selected 10 households per cluster in 20 clusters of Bhavnagar.
B2 Brainstorming To consolidate the design brief (design challenges & insights)
C CREATE The intervention was based on the design brief, developed using a Creative Development Research (CDR) process. The philosophy of this ‘development’ approach (as against a ‘testing’ approach) is that it focusses on gaining insights to develop an idea to its full potential rather than a simple ‘yes’ or ‘no’ answer. The process is iterative when necessary i.e. based on responses, the idea is reworked and researched again.
C1 Ideation This process involved creative brainstorming and reflection to generate specific ideas to address the key determinants of toilet use.
C2 Orchestration To develop the ideas into a finished form and products (films, song, virtual reality film, posters), we worked with a range of organisations/people who had the required skills such as Graphic Design, Film Production, Script writing, VR (Virtual Reality), Learning Models and Song Production.
C3 Concept Some creative ideas were researched at the concept level such as the central campaign branding idea and the film scripts. Respondents were exposed to the concept briefly (e.g. shown the logo) and their responses were taken to improve the concept.
C4 Execution Some creative ideas were researched at the execution level such as skit, toilet makeover and demonstration for reducing anxiety around pit

13
Process Steps Activities filling. Respondents were exposed to the idea in a live context (e.g. performance of a skit) and their responses were taken to improve the execution.
C5 Package During the stages C3 and C4, the creative ideas are researched as individual elements. In C5, the whole package was researched, and responses taken from the audience to improve the package.
Note: The creative development process is not linear. For instance, C1 or C2 could follow any round of creative development research steps (C3, C4 or C5). D DELIVER Intervention delivery involved planning, organization of different
resources, training of human resources, providing guidance, reviewing performance and addressing challenges.
D1 Planning To plan for different resources and timelines, there were extended discussions between Upward Spiral, CSPC and LSHTM.
D2 Organisation CSPC organized different resources that were required for the project implementation such as human, infrastructure and materials.
D3 Training Three rounds of training were conducted for the implementation team of facilitators and CSPC staff– two at the beginning and one mid-way. The method of training was experiential (involved personal experiments and role-pays). One round of training (25 volunteers) and a refresher training (20 volunteers) was provided to volunteers.
D4 Guidance The teams were provided guidance on the ground during the first few days of the rollout.
D5 Reviews Direct observations of filed level activities and two reviews were conducted with the implementation team – one mid-way during the implementation and one at the end. The mid-way review was conducted to know about implementers’ experience and to provide training for the next round of implementation. The review at the end of the implementation cycle was done to understand their experience, challenges faced and community response to the intervention.
D6 Learning Group A learning group was created in WhatsApp. Through this group, the implementation team could interact with the trainers to clarify doubts and raise issues they faced. The implementers also shared pictures from each day’s activity with the project team.
The ‘5 Star Toilet’ intervention (see Tables 2 and 3) emerged from this iterative design process and was rolled out by our implementation partner Coastal Salinity Prevention Cell from mid-September to December 2018. The intervention was delivered by two teams comprised of three trained facilitators per team and locally trained performing artists. The time gap between Day 1 and Day 2 intervention delivery in each cluster was around 4 weeks. This was based on the overall project timeline and intervention schedule. The intervention was delivered in Talaja (21 clusters), Mahuva (19 clusters) and Palitana (7 clusters) blocks of Bhavnagar, Gujarat.

14
2.3 The 5 Star Toilet campaign: Theory of change The ‘5 Star Toilet campaign’s theory of change consists of different streams of activity, each of which has its own logic in the ToC (see Annex 4). It was intended that family members and men will improve and use their contractor-built toilets, as measured by follow up evaluation six weeks post-intervention delivery. The overall campaign theme was the ‘world is getting smarter’, and ‘smart people build smart toilets’. A smart toilet was one with 5 Stars/ 5 Star+. The central concept is that ‘smart’ people have modern toilets, which are like ‘5 star’ hotels in being the best quality. This introduces a sense of social competition within a village to have the best toilet, and associates household sanitation with the social status of that household in the community. In this concept, each star stood for an aspect of comfort (light, ventilation, water), aesthetics (paints/ patterns and cleanliness) and ‘+’ stood for inclusivity (support and toilet chair for old, disabled). The intervention components include 5 Star Toilet makeover promotion, addressing pit filling/emptying anxiety (i.e. it takes longer for a pit to fill and the compost doesn’t smell), community motivational events (all the smart people are using toilets because it saves time and effort) and to create new social norms aiming to change the environment of the target population. The campaign aimed to inspire the community and encourage them to revalue their toilets by recognizing that they provide benefits associated with the motives of hoard, create, convenience (comfort) and affiliation, and provide a reward pathway for transitioning to a new toilet use routine. The intervention was delivered at cluster level to reach households with government/contractor-built toilets. Our assumption was that exposure to this environmental change will influence the psychology of those in the target population -- i.e. all members in a household, especially men, to value their toilets -- and thus modify their government-built toilets by painting the walls and installing features like ventilation, light, toilet chair for disabled or old people etc. that enhance the user experience. This was expected to prompt them to improve their existing toilets and change their behaviour from open defecation to using their contractor-built toilets which, in turn, may impact health and well-being in the long term. The households were not provided any materials or money to undertake these changes. The intervention aimed to initiate a cascade of changes by providing activities that are surprising, cause revaluation of the target behaviour and affect the performance of the behaviour in its setting.
Table 2.2 and 2.3 outlines the steps involved in the delivery of the 5 Star Toilet campaign. Below is a brief description of materials used in the delivery of the campaign. 1. Campaign Van: A van was used to carry material and team of facilitators to clusters. In the
cluster the van was used for street events and making announcements. The van design was customised to display the campaign theme.
2. Song: A song was composed for the campaign which communicated the core message of the intervention i.e. the world is getting smarter, people are getting smarter, therefore, use a toilet.
3. World of toilets: Slides with pictures of toilets from different parts of the world displayed on a light box.
4. Toilet model: A small toilet model which looked similar to the government-built toilets, with all features of the 5 Star Toilet promoted by the campaign.
5. Virtual Reality (VR) experience: This included a VR experience of a 5 Star Toilet. People could experience what it feels like to enter a clean toilet with cross ventilation, light, water inside the toilet and painted/tiles on the wall.
6. Skit: A skit was performed where a man and a woman reverse their roles for a day to experience each other’s life and its associated intricacies including issues related to open

15
defecation. The core message of the skit was that given the complexities of life, both men and women need to use a toilet to save time and for comfort and convenience.
7. Short Films: 6 short films were produced for the campaign to communicate that toilet use saves time and effort and promote the concept of comfort and convenience associated with it, to reduce anxiety around pit filling, to share the experience of a family that had undertaken toilet makeover and to talk about toilet chair and its benefits.
8. Toilet board: A display board placed in the village square with photographs of families that had improved their toilet or had a 5 Star Toilet.
9. Compost guessing game: Six jars were filled with different kinds of soil, sand, pebbles, compost and the audience was asked to come forward and guess which jar had compost. Purpose of this game was to dispel the myth that compost smells and to share with people that faeces is converted into compose which can be used in farmland.
10. Life size pit: A standee of the life size pit was shown to people and they were asked to guess the time it takes for a pit to fill.
11. Certificates and Stickers: Stickers were pasted on the toilets of families which has a 5 Star Toilet or had converted their toilet into one. Later, the families were awarded a certificate.
12. SMART network Wi-Fi: A Wi-Fi dongle was placed in the van so that community members could freely download the films and song produced by the campaign.
Figure2.2: The 5 Star Toilet Campaign Theme
“The World is Getting Smarter” • Smart people build smart toilets • A smart toilet was one with 5 Stars
and each star stood for an aspect of – Comfort: light (natural and
light bulb), cross ventilation and water
– Aesthetics: paint, patterns on the wall and cleanliness
– +: inclusivity (such as handle and toilet chair)

16
`Table 2.2: Day 1 Activities Activity Description Tools
Pre-intervention delivery
Meetings to seek support
Meetings were held with village leaders to discuss the campaign and get support to plan and organize day 1 event.
Facilitation script.
Recruitment of volunteers
1 volunteer identified from each village with help of local NGO partner/ Sarpanch who would promote 5 Star Toilet concept, help the team of facilitators to deliver the day 1 and day 2 intervention and follow up with community members for 5 Star Toilet makeovers.
Training of volunteers.
3 Days before day 1 event
Call/s were made to each village volunteer to ensure the WhatsApp broadcast groups are formed to share information on the campaign with the community members, mobile teasers have been passed around, leaders met with and locations identified for event/s.
WhatsApp teasers, phone calls
DAY 1
Announcements A customized campaign vehicle to go around the village to make announcements and carry all the material for the events.
Vehicle design, announcement script, song recording, media player
Interaction with volunteer
Facilitators, with the help pf volunteer, identify location for the evening event and create a route plan for the household visits and street events.
Interaction with children
Expose children to a virtual reality (VR) experience of a 5 Star Toilet Design and the idea of 5 Star Toilets and teach them slogans around 5 star toilets.
VR App on 5 star toilet design, VR googles, phone
Household Visits
Two teams of facilitators + Artists + Van + Children go from street to street, making household visits. Expose the idea of 5 Star Toilets, enquire if they would like to know the rating for their toilets, rate their toilet and express appreciation for what they already have. If they have 5 star: Award them with a 5 Star Toilet sticker and paste it on their toilet and invite them to the evening event to receive certification. Take photographs. If they don’t have 5 Stars: Explain what they need to do to get 5 Star.
5 Star Toilet leaflet 5 Star Toilet poster
Van in the community
Park the van in the street and make announcements, play songs, display 3D photographs of different toilet innovations from around the world, display small toilet model, and VR experience of a 5 Star Toilet.
Music player, photographs, mobile, VR goggles, VR App

17
Activity Description Tools
Preparations for the evening event
Set up the venue for the evening event: AV + seating arrangement for community members, download photographs of the day’s activities from phone/camera and write certificates for 5 Star Toilet awardees.
Certificates, AV system, rug for seating arrangement
Enrolment Corner
In parallel create an enrolment corner for households willing to improve their existing toilets into a 5 Star Toilet with a standee on 5 star toilets, a table to showcase 5 Star Toilet model and a toilet chair on display for differently abled people.
Leaflets and documentation sheet, toilet chair, smart network Wi-Fi
Evening Event 1. Play the campaign song and interact with the children and make announcements 2. Play Films – Saving Time and Saving Effort 3. Skit performance 4. World of Toilets (slide show) 5. Toilet makeover films and toilet chair films 6. Celebrate those with 5 Star Toilets/ 5 Star+ by awarding certificates 7. Introduce those who have enrolled – call them to the front and celebrate them 8. Farewell – “All the best! We will come back in 2-3 weeks to celebrate again”.
AV equipment, films, artists, certificates
Table 2.2: Day 2

18
Activity Description Tools
Follow up Volunteers promote 5 Star toilet makeovers between day 1 and day 2 events. Take photographs of families who have modified their existing toilets.
Home visits and follow up on phone
Share films and song
Share films and campaign song in the village WhatsApp groups. WhatsApp, YouTube link https://www.youtube.com/channel/UCqmL6DxtcDpAKeIU4Io33ig
DAY 2
Organize All the pre-post toilet makeover photographs from the village are compiled into a presentation – clearly marking the names of people.
Laptop/Tablet
Announcements Make announcements about the evening event. Van, audio system, announcement script. Testimonial Videos
Record videos of families that undertook 5 Star toilet makeover. Phone camera
Evening community event
Make preparations, identify site.
Guessing Contest Pit Filling
Participants asked to guess how fast a pit fills up. This is done through a life size pit standee. The facilitator explains the time it takes for a pit to fill and explains the process of composting.
Live sized pit standee
Guessing Contest Compost
Jars with normal soil and compost are kept on a table. Participants are invited to guess which jar contains compost.
Glass jars with soil and compost.
Films of pit filling and testimonial videos
Films of pit filling are showcased and videos of people who undertook toilet makeovers are played.
Testimonial films, short films
Toilet Board Photographs of people who did toilet makeover are displayed on a board and the board in placed in village centre or Panchayat Gahr.
Board, pictures, printer
Toilet Makeover Presentation of certificates to those who improved toilets. Invite participants to come and share their experience with those in attendance.
Pre/post presentation.
Farewell People are thanked for their participation.

19
2.4 Implementation monitoring The implementing team, based on the intervention design protocol and in discussion with collaborators, developed a set of input and process indicators to monitor roll out of intervention in the study clusters. The indicators were developed to capture the delivery of specific activities and attendance of participants in the events. In order to have regular updates on the programmatic activities and the data, a WhatsApp group was formed during the implementation phase. Data from each day’s activity was reported to the project coordinator by the facilitators in WhatsApp and through paper records of the event. The implementation team of facilitators recorded attendance, number of events/activities conducted, challenges faced and any unintended consequences. This data along with photographs from the day were shared over WhatsApp and through field notes of the facilitators. At the end of each day, both teams also shared information on participants, number of 5 Star Toilets identified and commitments made. This was done through an assessment sheet designed to assess 5 Star eligibility. Data entry was done by the CSPC’s Project Coordinator at block level (see Annex 5). Table 2.4: List of indicators used to monitor the activities of day 1 and day 2 events
1. No of people who visited the street events; (men, women and children) 2. No of people who attended the evening event (men, women and children) 3. No of times activities conducted in Street Events (Toilet model, Toilet chair, VR – No. of
people experienced VR) 4. Day 1 Activities conducted in the evening event (Photographs from the day and
household visit, Skit, Films on saving time and effort, Toilet makeover film, Toilet chair film)
5. Day 2 Activities conducted in the evening event (Smart Village Board, Testimonial videos, Films on pit filling, Compost guessing game, Pit emptying.
6. 5 Star Toilet (No of people who enrol in 5 Star toilet makeover, no of people who report a 5 Star Toilet, Certificates awarded to 5 Star Toilets)
7. Most liked activity of the day 8. Least liked activity of the day 9. Unintended consequences (positive /negative)
The intervention delivery reports were reviewed every fortnight by the Monitoring Officer, CSPC. Activities conducted were mapped against the plan and feedback was discussed with the Programme Manager and Project Coordinator. CSPCs Programme Manager visited the treatment villages periodically and reviewed the data capturing process at field level, reviewed progress and guided the field team by demonstrating/anchoring at the village level events. The Project Coordinator made logistic arrangements such as providing vehicles, audio-visual system, lodging of team and artists, coordination with the local government authorities, coordination with village Sarpanch (village Head) and reporting activities to the programme manager. The creative design team from Upward Spiral and researchers from LSHTM provided feedback to the implementation team based on information posted on WhatsApp by the facilitators and through periodic visits to the field. Skype calls were held to seek an update on the progress and provide inputs to the intervention delivery process. The frequency of these calls was around 3-4 calls per month during the design phase and 2 calls per month during the implementation phase. In addition, the team shared regular updates via a management group on WhatsApp which comprised of LSHTM team (PI, BDC co-founder, and programme manager) US team and CSPC programme manager.

20
3. EVALUATION 3.1 Research question and hypothesis of the impact evaluation The ‘5 Star Toilet’ campaign was a cluster randomised trial conducted in 94 clusters in four blocks (taluks) of Bhavnagar district in Gujarat which aimed to evaluate the effect of this intervention on toilet use behaviours. As can be seen in Figure 3.1., the baseline survey had included about 10 households per village, which were then excluded from the endline survey. The endline survey enrolled a new set of households from the census data. Throughout the report, we refer to the baseline data for information purposes, even though these data did not feed directly into the analysis. The key research question of this study was, “Does an innovative, theory-based intervention increase toilet use of all members in a household with government/contractor-built toilets in intervention clusters compared to control clusters in Bhavnagar, Gujarat, India?” (see Annex 6 for Pre-Analysis Plan (PAP)).
Figure 3.1. Trial flow diagram
Our primary hypothesis was that an innovative theory-based behavioural intervention can improve toilet use amongst households with government/ contractor-built toilets in high coverage areas of rural Gujarat. Toilet use for the primary outcome was defined as the proportion of households where all members above the age of 5 years are reported to use the toilet (the last

21
time they defecate), and where the toilet is observed by field staff to be in use. To make the primary outcome more meaningful and valid, it was decided to add apparent use status as observed by field staff to the definition of the primary outcome. Apparent use was based on on-the-spot observation of the enumerators. This included several indicators including availability of water and water container inside/outside the toilet, cleanliness, availability of cleaning supplies near the toilet, and observation of ‘the toilet in use’. This judgement was eventually made by the field enumerator and cross checked on the spot and using photos by the field supervisors. Thus, toilet use for the primary outcome was defined as the proportion of households where all members are reported to use the toilet (the last time they defecate), and where the toilet is observed by field staff to be in use. In our outcome evaluation study, in addition to this primary outcome measure which is based on reported use, we used an alternative tool, a short questionnaire on physical activity, to compare the outcomes across the tools1. Thus, as an additional outcome we conducted a questionnaire survey with up to 2 household members where a question on toilet use and open defecation was embedded in a questionnaire on physical activity with the aim of reducing socially desirable responses / responder bias (see Table 3.1).
Table 3.1: Outcome indicators
Outcome Indicator Data source Measurement Prevalence of households with contractor-built toilets reporting toilet use by all family members aged 5 years or older during the last time they defecated + toilet is in apparent use as judged by field staff
Primary outcome measure
Combination of self-reported use assessed by a standardised questionnaire (in a household roster for each household member individually in households that own government/ contractor-built toilets) for all members in a household. In case members are not present, other family members or the primary respondent are asked about where the person defecated last time. Mothers are asked about the defecation behaviour of younger children. Information about all members in a household over 5 is obtained. (see Annex 7)
Assessed 6 weeks after intervention delivery.
Prevalence of open defecation in individual household members
Secondary outcome measure
“Physical activity questionnaire” that asks individual household members about time spent on different physical activities (e.g. field work, cow herding, water fetching, going to open defecation). (see Annex 8)
Assessed in a separate survey prior to the main latrine use questionnaire
3.2 Purpose of the process evaluation The process evaluation aimed to understand the reasons for the results of the 5 Star Toilet Campaign. Data collection methods and sources used to assess the process included the following: 1. Document review (reports, newspaper clippings, and government BCC strategy paper) was
done to understand the context of evaluation. 2. Field observations (n=6) and review of activity logs was done to assess intervention fidelity, and
participation of community. 1 Please note the primary and secondary outcome measurement was a divergence from the original stated outcome in the Pre Analysis Plan.

22
3. Semi-structured interviews (n=14) were conducted with SBM officials, the design team, intervention delivery team, and participants from intervention and non-recipients from control clusters. These were used to understand the SBM context, implementation and the design teams’ perspectives, recruitment strategies and participant response and perspectives on the campaign.
4. Focus Group Discussions (n=6) were held with programme staff (n=1) and participants (2 each with women and men, 8-10 participants per group and one mixed group FGD) to solicit participant views on the campaign and the perspectives on toilet use/ non-use.
5. End line survey tool administered in 30 HHs per cluster in 94 clusters was used to capture socio-demographic variables of the study context and assess reach of the intervention.
3.3 Geographical area of the study
The study sites include three blocks (Mahuva, Talaja and Palitana) of Bhavnagar district, Gujarat. The blocks were selected based on recommendation of the state government and considering the operational feasibility of roll out, as CSPC, the implementing partner, has presence in these blocks. Bhavnagar is situated in the south-eastern part of Gujarat. According to the Census of 2011, Bhavnagar district has a total population of 2,880,365, out of which 1,182,401 is urban while 1,697,964 is rural. The average literacy rate of Bhavnagar is 76% which is slightly less than the state average (79%). Livelihood options include plastic monofilaments, ship breaking, diamond polishing, agricultural production and onion processing. The state has 29 districts, which in turn have been further sub-divided into Talukas (blocks). In Gujarat, the community development blocks are co-terminus with the Talukas. The Talukas contain large number of villages and possibly several towns. The villages are administered by Gram Panchayats (village council). A Gram Panchayat may constitute of one revenue village, several revenue villages (group panchayat) or be a part of a larger village. Mahuva has total population of 452,011 (229,719 are males while 222,292 are females) according to Census 2011. In 2011 there were total 77,075 families residing in Mahuva and the Average Sex Ratio of Mahuva is 968 (highest in the state). There are 3 towns and 131 villages within Mahuva. Palitana has total population of 230,271 (117,629 are males 112,642 females) as per the Census 2011. In 2011 there were total 41,260 families residing in Palitana. The Average Sex Ratio of Palitana Taluka is 958. There is 1 town and 93 villages within Palitana. Talaja has total population of 325,667 (174,482 are males and 151,185 females). In 2011 there were total 58,712 families residing in Talaja. The Average Sex Ratio of Talaja Taluka is 866 (lowest in the state). There are 3 towns and 113 villages within Talaja Taluka. Development partners such as the World Bank, Tata Trusts and multiple NGOs provide technical and on-ground support to SBM implementation on the ground. SBM activities in the state included providing subsidies, organising the building of individual household toilets (nominally through self-help groups), making construction material available, capacity building of service providers and community mobilisation through IEC (information, education and communication). The 5 Star Toilet campaign was delivered in a context where subsidies for toilet construction were no longer provided but government continued its effort to identify households without a toilet/ left out beneficiaries from the 2012 baseline survey and NGOs continued to promote toilet construction in some clusters.

23
3.4 Design and methods The primary unit of analysis for the trial is the household; the outcome of interest is the proportion of households (n=30 households per cluster) that report use of toilets by all household members, more than 5 years of age, measured 6 weeks after intervention delivery through self-reported questionnaire survey and a physical activity survey.
The end line study consisted of: 1) a physical activity survey administered in 30 households and 2 members per household in 94 clusters of the identified blocks (Mahuva, Talaja and Palitana) in Bhavnagar, followed by 2) a questionnaire survey to understand toilet use in 30 households in all clusters, and 3) process data collected from 4 clusters (2 from each study arm) during and after the intervention delivery period to assess implementation of the 5 star campaign (recruitment strategies, fidelity, dose delivered and participant response) measured through event logs maintained by implementing partner CSPC, unannounced field observations (n=6), semi-structured interviews (n=14) and focus group discussion (n=5) with campaign facilitators, CSPC project coordinators, participants in intervention arms and unexposed individuals in control arm, and creative design team and through the end line household survey. 3.5 Ethics
LSHTM and IIPHG obtained ethical approval for conducting the study from their Institutional Review Boards (IRBs). LSHTM received trial insurance and sponsorship from the Research Governance and Integrity Office (RGIO) at LSHTM. The trail was registered on the RIDIE registry2. Written informed consent was requested, prior to surveying/interviewing, from participants in their native language (Gujarati); each form was assigned a unique identifying number. Participants were fully informed of the aims and objectives of the study and of their right to decline to participate at any point. The intervention collected a minimum of personally identifying information and did not involve any medical treatment or collection of biological specimens. Respondents had the freedom to discontinue or withdraw their participation if they felt uncomfortable. Observations were made with consent of members of the household. Trained enumerators conducted the survey. All senior project staff received prior training of human subject research ethics. Questions were asked cordially, and observations were recorded in a non-interfering, non-intimidating and non-judgmental manner. No information was asked which may have negative impact on the respondent. The filled consent forms were stored securely and will be kept for review by senior project staff only. This information is not linked to data in processing, analysing or reporting of results.
3.6 Sampling and data collection
3.6.1 Selection of clusters
In the inception phase of the study, the project team had a discussion with the Commissioner Rural Development, Government of Gujarat, who recommended Bhavnagar district as site for this trial. Our local implementing partner, the Coastal Salinity Prevention Cell (CSPC), has long presence in Bhavnagar, which made it operationally feasible to implement the project. The selection of clusters for this study was based on discussion with implementing partner CSPC and other NGOs working in the district on sanitation.
2 RIDIE Link: http://ridie.3ieimpact.org/index.php?r=search/detailView&id=736

24
As a first step, we obtained a list of all villages in Mahuva, Talaja and Palitana. According to the National Census, there are total 335 villages (clusters) from 325 Gram Panchayats (GPs) in the Mahuva, Talaja and Palitana blocks of Bhavnagar (see Figure 3.1). In north Gujarat, especially Saurashtra region, group panchayats are not common, therefore, in most cases 1 GP consists of one village. For the purpose of this study, we consider one village sampled from one Gram Panchayat (GP) – in case there are multiple villages in a GP – as one cluster. In discussion with the stakeholders working on sanitation in Bhavnagar -- which includes UNICEF, Aga Khan Agency for Habitat India, Mahiti, Coastal Salinity Prevention Cell, Gram Nirman Samaj and SBM officials – the study team decided that the clusters with >70% toilet coverage would be included in the study so that sufficiently many households could be found that met our eligibility criteria (i.e., a household which includes a shared kitchen, have received any assistance, either monetary or any other, under any government programme to construct a toilet and a functional toilet). As per SBM-G data, Bhavnagar district was declared ODF in October 2017, which means that all clusters have 100% toilet coverage. These figures were judged implausible by local NGO partners. Therefore, we enrolled villages based on records from NGOs working on water and sanitation in Bhavnagar. As per the toilet coverage data from these records, we identified 137 clusters/villages where the toilet coverage was deemed to be >70% and where each cluster belonged to a different GP. In case multiple eligible clusters belonged to a single GP, we randomly sampled only 1 cluster where the toilet coverage was >70%. Although the required study sample size was 94 clusters, we decided to sample 20% additional clusters, for a total 110 clusters, to account for any potential loss of entire communities because of inadequate toilet coverage, non-response, seasonality or not meeting the study eligibility criteria. Thus, from the list of 137 clusters with >70% toilet coverage, 110 clusters were selected using probability proportional to size (PPS) sampling where the size was the population as per Census 2011. A census (household listing) survey was done in 106 of the 110 clusters (4 were excluded due to logistics) and finally 94 clusters were selected for the study.
The end line survey took place between mid-January and early March 2019. Data collection was done simultaneously in intervention and control clusters. We administered the physical activity survey followed by the toilet use measurement survey. A gap of approximately 5- 7 days was kept between the two surveys based on the available timeframe. This was done to ensure a maximum gap between the two surveys. Data analysis and report writing took place in March-April 2019. The process evaluation was interspersed with the intervention delivery. Four randomly selected clusters (2 from each study arm) were identified for the qualitative data collection. Figure 3.1: Sampling process

25
3.6.2 Randomization
The 94 identified clusters were randomised into intervention (n= 47) and control clusters (n= 47) using a combination of stratification (13 strata based on village level toilet coverage and tap water access) and restricted randomisation based on the balancing of six socio-economic variables collected in the census. Randomisation was carried out using the census data (not the reported toilet use data) using a combination of stratified and restricted randomisation. First, we created 5 different strata of toilet coverage (0-24%, 25%-44%, 45%-59%, 60%-74%, 75%+) and 3 different strata of household tap water coverage at village level (0% to 49%, 50% to 74%, 75%+). These two variables were thought to possibly correlate with toilet use and the success of the intervention. The combination of these two strata resulted in 13 different strata (stratum size ranging from 2 to 20 villages). Randomisation was carried out within these strata, ensuring overall equal numbers of control and intervention clusters. We largely followed methods described in Hayes/Moulton, 2nd edition, Cluster Randomised Trials, Chapter 6. The restriction was using overall mean village level proportions. Restricting the randomisation procedure to the 30 households per village enrolled for endline was not possible because at the time of randomisation, this information was not yet available. We restricted randomisation by only accepting randomisations resulting in balance across the following cluster level variables: proportion of lower caste households, proportion of general caste households, proportion of pukka houses, proportion of kutcha houses, proportion of literate respondents, proportion of landowning households. Balance was assumed if the difference in any of these variables was 2 percentage points or less. Randomisations not meeting this criterion were rejected. The number of possible allocations was about 4.8x10²¹. Therefore, we did not enumerate each possible randomisation. Randomisation was done using a random algorithm in Stata. In a first step the algorithm sorted the 94 clusters by the toilet coverage strata, the tap water coverage strata and a uniform random number (in this order). In a second step, the ranked clusters were in an alternating way assigned to 0 or 1 (control or intervention). In a third step, the resulting randomisation was explored by comparing the means of the balance variables between intervention and control. If any of the comparisons of the 6 variables resulted in an intervention/control imbalance >2% points, the randomisation was deleted. The first randomisation in the algorithm that met these criteria was chosen as allocation. However, we ran 10,000 randomisations overall to estimate the proportion of randomisations that met the balance criteria. This showed that about 1% of allocations (93 out of 10,000) met the balance criteria, resulting in more than 1019 possible allocations. Given the large number of clusters and of possible allocations we did not conduct formal bias and validity checks of the randomisation procedure. A minimum 3 km distance was maintained between intervention and control clusters.
3.6.3 Sampling households
Identification of 335 GPs
Census of India
Identification of all GPs with toilet coverage
of >70%, selection of
one village per GP
Random selection of
110 villages of 137 eligible
villagesProbability
proportional to size
Census done in 106 villages (4 excluded due
to logistics), 94 villages
selected for study
excluding lowest coverage villages
Endline survey in 94 villages
(30 Households per village)
Physical activity survey in 94 villages (2 members per Household in
30Households )

26
The study used the Census definition of household -- i.e., a ‘household’ is a group of persons related or unrelated or a mix of both, who normally live together and take their meals from a common kitchen, unless the exigencies of work prevent any of them from doing so. Households within the randomised clusters were recruited based on study selection criteria, which includes a shared kitchen, have received any assistance, either monetary or any other, under any government programme to construct a toilet and have a functional toilet. A functional toilet includes having 1) a pan that is not broken, and 2) a functional connection to a pit (single or twin pits). At the beginning of the study, a census survey (a house-listing exercise) was done in 106 clusters. Since the toilet coverage identified in the census was lower than expected, we excluded clusters/villages with the lowest coverage until 94 clusters remained. Out of the 94 clusters, three clusters had population more than 300 households. Therefore, we used chunking to segment the village in multiple parts and select two segments of approximately 150 households which were both enrolled as the same cluster.
Thus, in each of the 94 clusters, among eligible households meeting these criteria, a simple random sample of 40 households was selected in STATA. From these 40, 10 households were randomly selected for the baseline household survey and the rest were the sample for the end line survey. Since not all villages had 40 eligible households, the initial list of households comprised 1384 households in the intervention arm and 1333 households in the control arm. To account for non-availability of households due to migration/not found, refusal to take part in the survey and other related factors, we identified additional 15 randomly selected households per cluster, or fewer depending on availability. The data collection teams selected from this additional list households to replace households that were not available. For the physical activity tool (which was delivered about 5-7 days before the endline questionnaire), household sampling also started with the same list of up to 30 households per village. However, often only one eligible person was available for the interview. An eligible person was primarily a male member, more than 18 years of age and preferably one responsible for making decisions in the household. In these cases, the team continued to enrol additional households from the list in random order until they reached the target number of 60 individuals or no further eligible households were available in that village. The enrolment of additional households was done randomly using the Survey CTO tool. Replacement households were randomly selected from the complete list of randomised households in each cluster. As the two teams for the physical activity tool and the endline toilet use questionnaire worked independently, their final samples overlapped but were not identical. Of the 1384 intervention households selected for the endline survey prior to the intervention, 351 (25.3%) could not be found or did not in fact have a latrine (were ineligible), and 26 (1.9%) did not consent. 271 households were added from the list in random order, resulting in 1278 households enrolled for the endline survey. Of the 1333 control households selected for the endline survey prior to the intervention, 331 (24.8%) could not be found or did not in fact have a latrine (were ineligible), and 33 (2.5%) did not consent. 245 households were added from the list in random order, resulting in 1214 households enrolled for the endline survey. Figure 3.2 Evaluation timeline
Qualitative Data collection Nov 2018- Jan 2019

27
3.6.4 Data description
Physical activity survey: A questionnaires was developed for this survey in English which was translated to Gujarati and field tested before finalisation. We developed and tested a quick survey tool, which camouflages the real purpose of the inquiry by asking 20 short questions related to intake of food and physical activity. This makes use of the fact that going for open defecation may not be a stigmatised behaviour if physical activity is the perceived purpose of a questionnaire. This questionnaire was administered before the toilet use survey. Toilet use survey: A questionnaire was developed to include standard measures on toilet use being reported by all TW14 teams, including questions on exposure to the intervention and norms around toilet use. An earlier version of this tool was developed and tested during the formative research phase and baseline survey. We used the standard questions suggested by 3ie to measure key indicators being reported by all TW14 teams (SQUAT, 2014 and Guidelines on Measuring Toilet Use, 3ie 2017). Qualitative interviews: A qualitative data collection tool with semi-structured questionnaire was developed in English. It was then translated in Gujarati and field tested before finalisation. The data was collected with support from two interpreters (one male and one female) who translated the questions in Guajarati and Hindi for the benefit of participants and the researcher. Data collection was interspersed with the intervention delivery. 3.7 Quality control
Survey tool: The quantitative survey was done using Android application on SAAS model (Software as a Solution) in tablet/mobile build on Survey CTO platform. Survey CTO is based on Open Data Kit (ODK) technology. The user subscription is hosted on fixed, stable Linux servers that are maintained by the company itself. Selection of agency: An open call for proposals was invited from agencies to undertake the end line survey. All proposals were reviewed by a procurement committee at CSPC with representation from LSHTM and IIPHG. The final proposal was selected after detailed review of technical and financial proposals and an in-person meeting. Two separate agencies were recruited to administer the survey questionnaires. This was done to ensure the physical activity survey team is kept blind to the real purpose of the survey and to complete the survey within the project timelines. Training of enumerators: Two separate classroom-based training sessions were organised for enumerators from the two teams at IIPHG campus. In this training enumerators were informed about the process of seeking consent, a detailed briefing was provided on the questionnaire followed by training on operating the tablets, administering the questionnaire using the tablets and mock interviews. This was followed by a field training in Gandhinagar. Each team of enumerators was assigned the task to interview two individuals per village. Supervisor’s accompanied each enumerator to observer the data collection process. This was followed by a debriefing session in IIPHG where experience of enumerators was shared and key problems in administering the tool were addressed.
Baseline May-Jun 2018
Intervention Delivery
end Sept- Dec 2018
Endline Evaluaiton
mid Jan- early Mar 2019
Data Analysis Mar-Apr 2019

28
A second round of field training was organised in Bhavnagar, in a non-intervention village. Both teams asked enumerators to fill 2-3 questionnaires each. This was followed by a debriefing session and troubleshooting related to the application being used for data collection. Field supervision: During the survey, regular debriefing sessions were conducted in the field. The signed consent forms were reviewed and arranged according to clusters. GPS location of each household was taken to monitor data collection. LSHTM and IIPHG teams were provided login credentials for real time monitoring of data. To ensure data security, a separate instance was created at server dedicated for the project. The data collection agency reviewed the data at backend and sent feedback to field supervisor or team leader in case discrepancies were observed. Data collection: Enumerators and households included in the study were not aware of the status of the clusters viz. intervention group and control group. Trained supervisors were available in the field and during baseline data collection, 10% of the forms were field-validated. All data collectors received training at IIPHG, mock data collection exercises were conducted, and field-testing was done. During the supervision process errors in not adhering to the criteria were further corrected in the field during the daily debriefing meetings with the data collectors. The survey was simultaneously administered in intervention and control clusters. Intervention clusters where the campaign roll out completed first were included first in the survey and a gap of 6 weeks was maintained between campaign roll out and end line data collection. This was based on the available budget, project timeframe, logistical feasibility and LSHTM’s past experience with similar trials. The physical activity survey took place from 1-26 February and the toilet use survey from 6 February to 8 March 2019 (approximately 5-7 days after the physical activity tool in any given village). Qualitative data was collected between October 2018 and early January 2019.

29
4. FINDINGS
4.1 Process Evaluation We first look into how much of the sample population was exposed to the intervention, and how they responded. In this section we present findings from the endline survey and qualitative interviews/ discussions held with participants, non-recipients, camping staff and the design team. 4.1.1 Intervention implementation fidelity Key variables for measuring the 5 Star Toilet campaign’s implementation include assessment of participant recruitment, fidelity, reach and participant response. Recruitment strategies for engaging participants may affect the implementation of an intervention (as a moderating factor). Based on field observations (n=6), review meetings with US design team, CSPC staff and intervention facilitators (n=2) and focus group discussion with facilitators (n=1) we found that recruitment of participants was a key challenge that took longer than anticipated. Thorough our discussions with the facilitators we found that in more than half of the intervention clusters, volunteers assisted the team of 3 facilitators in identifying toilets that met the 5 Star toilet criteria and also enrol households who committed to improve their existing government/contractor-built toilets. However, their role remained weak as the implementation team could not recruit volunteers in each cluster and in some clusters their engagement could not be sustained beyond the day 1 event (Quote1). According to the implementers, the volunteers did not think of this work as remunerating as a full-time job. In some clusters, people volunteered to help the team on the day of intervention delivery, whereas in almost 10 clusters the team could not recruit volunteers. Overall 37 volunteers were recruited. This affected the identification and enrolment of eligible households for a 5 Star Toilet makeover and subsequent follow up with the households who committed to improving their toilets. Quote 1:” Volunteer support was not adequate, and, in several clusters, we had to identify volunteer on the day of intervention delivery.” (Campaign Facilitator) It took significant time for the facilitators to make arrangements in the field, and the time available to conduct intervention activities was limited as a consequence. Seasonality was another factor, as due to hot weather people did not want to step out of their homes during the afternoons to participate in the street events. Through our interactions with the participants and a village volunteer we found that due to ongoing agricultural work or other livelihood activities some people were either living on the farm land (vadi vistaar) or returned home around 7 pm in the evening. Women’s participation was further limited due to household work; in fact, most were available only after 8 pm, when they finished cooking dinner for their families. Some sections of the community did not encourage their women to participate in evening events (Quote 2). Quote 2:” Participation from Rajput community was less in the evening event as there is a pardha system3. It is about honour and women are not encouraged to go out to village centre at night.” (Village Volunteer)
3 Pardah (“screen,” or “veil”), a social practice involves the seclusion of women from public observation by means of concealing clothing (including the veil).

30
Also, the time spent by the facilitators in each cluster was less than what was originally proposed (5-6 hours versus 9-10 hours). Further, the scattered population made it difficult to reach all households within the time available as it was difficult to cover the entire cluster in one day. According to the creative design team, delivery over 2-3 days and more time for follow up would have improved the coverage of intervention in the clusters. However, this was limited due to overall timeframe of the project and operational feasibility. Implementation is monitored to understand the steps involved in intervention delivery and their consistency to the intervention protocol, known as fidelity and adherence (Breitenstein et al. 2012). Fidelity refers to the extent to which intervention components were implemented as per intended plan. This measure is important to ensure impartial comparison of treatments (internal validity) and generalizability of results as it provides information about the implementation of the different components of the intervention package (Mbuya et al. 2015). Adherence is a dimension of fidelity which is defined as the degree to which an intervention is conducted according to intervention protocol or the extent to which the behaviour of individuals implementing the intervention conforms to the protocol. A standardised methodology for measuring this aspect in complex intervention trials is yet to be evolved as past studies have used various indicators of adherence to the original, intended plan and competence of implementers (Breitenstein et al. 2012)(Hasson 2010)(Mars et al. 2013)(Carroll et al. 2007). Fidelity helps to identify if any changes were made to the core components of the intervention delivery (Holliday 2014). The level of fidelity may be moderated by certain other variable as such as the complexity of an intervention, facilitation strategies, quality of intervention delivery, and participant responsiveness (Carroll et al. 2007). It is particularly difficult to measure fidelity in the present case, as modifications were made to the intervention plan even after the beginning of intervention delivery, due to adaptive programming. For example, the original campaign design involved conducting activities in a tent, located at a convenient place within the cluster so that participants would be attracted to participate. However, during the initial delivery, setting up the tent took 2-4 hours, which resulted in lower footfall once the tent was set up and limited time for the facilitators to interact with participants. This was rectified by moving to street events (without a tent) to extend the exposure to the campaign and increase the number of participants. Other factors also limited fidelity. All facilitators were trained in the field and in a workshop setting. However, soon after the roll out began, two facilitators left the project. This situation was redressed by the implementing partner by recruiting another facilitator who was trained on the job. According to the implementers, recruitment of facilitators was also a challenge as the implementing partner did not have sufficient human resources in house, and it was difficult to find trained personnel for the short duration of the project. All these factors may have also impacted the reach of the intervention (Quote 3-4). Quote 3: “It was difficult to recruit experienced people for projects of shorter duration. Preference is given to long term projects.” (Project Manager) Quote 4: “A more intensive training was required to get them (Facilitators) to the level that we wanted. Also, going forward, there is a need to look at incentive structures for sustaining their interest.” (Creative Design Team) As verified through field observations (n=6), the facilitators delivered the intervention largely as per the final plan. Intervention components were interactive and innovative, therefore, the facilitators

31
found it easy to convey key messaged to the participants and the participants found these activities novel, appealing, surprising and entertaining (Quotes 5, 6, 7, 8). Quote 5: “Initially we were sceptical about talking to the community about toilet use. However, we received good response. Some people told us that we should have done their earlier. Concept of cross ventilation and twin pit was new to many.” (Campaign Facilitator) Quote 6: “The ‘Mad Scientist’ film, VR experience was popular as it was new technology. People called it goggles (chashma) for film. World of toilets and golden toilet was very popular, people had not seen such things before.” (Campaign Facilitator) Quote 7: “The skit performance and the films were most popular during the campaign. It is the best medium to mobilize community. The effective part of it is the artists had dialogue with the community and involved them in the skit. Films effectively covered the messages through humour. There were elements of routine life of the community. It helps to connect with the community.” (CSPC, Project Manager) Quote 8: “The short skit was a key highlight of the evening event as messages which can’t be explained in general conversations were discussed and presented in an entertaining manner. “ (Campaign Facilitator) According to the observations made by the design team, occasionally the facilitators did not approach the street events in a consistent manner and revised the order of activities or skipped some activities which did not find sufficient audience or faced technical issues. These were reported to the programme manager at CSPC and on the WhatsApp group. For example, the Wi-Fi network was discontinued due to technical issues, the 3D poster of a toilet was discontinued and sometimes the VR film was not feasible as it could only be experienced by one person at a time. 4.1.2 Reach of the intervention
Table 4.1.A reports on the reach of the intervention, i.e., the proportion of all the participants in the target population that were exposed to (at least some components of) the intervention. Compared to the control group, intervention households more often reported having heard of or attended community events on sanitation, and nearly all of the campaign-specific elements, such as pit filling demonstrations, using a chair for assisting the disabled in the toilet, or seeing a small model of a 5 Star Toilet. Perhaps as a consequence, a significantly higher proportion of respondents in the intervention arm reported making changes to their toilets.
As observed by the district government officials, participation of community in the 5 Star Toilet campaign was higher compared to the behaviour change activities rolled out by the government. On an average, the evening events were attended by 100-150 people (women, men and children) (Annex 5).
However, overall campaign exposure was low. For example, only about 14% of intervention households had heard the term “5 Star Toilet” (3% in control). Four percent could show a certificate (almost nobody in the control arm). Only 18% of households in the intervention arm had seen the skit (5% in control arm), and 13% had seen the toilet model (2% in control arm). Exposure to most other campaign items showed an intervention-control difference of less than 10% points.
Table 4.1.A Exposure to Intervention

32
Item Control Intervention PD, %
95% CI APD%
95% CI
N % N %
Recently heard about toilets in any of these contexts (in last 6 months)
Conversation with others 1214 6.7 1278 9.9 3.1 0.6/5.6 2.8 0.3/5.4
Visits to neighbours 1214 3.1 1278 4.5 1.3 -0.2/2.8 1.2 -0.3/2.8
WhatsApp message 1214 2.1 1278 3.1 1.0 -0.7/2.7 0.4 -1.1/2.0
Village meeting 1214 14.3 1278 23.5 9.1 5.1/13.1 8.4 4.3/12.4
Event in community 1214 13.1 1278 30.0 16.7 11.4/22 16.3 11/21.6
Posters /stickers 1214 6.9 1278 13.2 6.5 3.6/9.5 6.2 3.2/9.2
Radio 1214 0.4 1278 0.6 0.1 -0.4/0.7 0.0 -0.1/0.1
TV 1214 21.9 1278 22.9 1.3 -3.3/5.8 0.0 -0.5/4.4
What did you hear
One should construct a toilet if a household doesn’t have one
1214 14.4 1278 19.9 5.6 2.0/9.2 5.2 1.6/8.9
One should improve one’s toilet if it is poor quality
1214 6.7 1278 12.1 5.4 3.1/7.7 5.2 2.8/7.5
One should use toilet for defecation instead of going out in the open
1214 18.5 1278 25.0 6.3 2.5/10.1 5.8 2.1/9.5
After hearing this did you make changes to your toilet or done anything as a consequence?
talked with someone 1214 15.0 1278 18.3 3.4 -0.1/7.5 3.1 -1.1/7.3
made changes to my toilet 1214 8.0 1278 12.8 4.6 1.3/7.8 4.0 0.8/7.2
saved money for a toilet 1214 3.5 1278 3.6 -0.1 -1.8/1.8 0.2 -1.6/2.0
Heard of any community event that talks about toilet in the past 6 months
1214 18.5 1278 39.1 20.7 15.4/26.0 19.7 14.3/25.1
Attended such an event 1214 8.3 1278 22.3 13.9 10.6/17.1 13.3 9.9/16.7
Promote toilet improvement 1214 6.5 1278 18.3 11.7 8.8/14.6 11.2 8.1/14.2
Commit to improve toilet 1214 22.8 1278 12.3 -12.3
-21.2/-3.5 -12.5 -21.4/-3.5
Heard the phrase ‘5 Star Toilet’ 1214 2.6 1278 13.9 11.3 8.9/13.8 10.9 8.5/13.4
Where did you hear it
TV 1214 0.7 1278 1.6 0.1 0.0/1.9 0.1 0.0/1.9
Village meeting 1214 1.2 1278 5.2 3.9 2.6/5.2 0.4 2.4/5.1
Community event 1214 1.8 1278 10.9 9.1 6.7/11.5 8.8 6.4/11.2

33
WhatsApp message 1214 0.3 1278 0.5 0.1 -0.4/0.6 0.1 -0.4/0.1
Posters/stickers 1214 0.7 1278 4.1 3.4 1.9/5.0 3.2 1.8/4.7
Virtual Reality film 1214 0.4 1278 0.9 0.5 -0.2/1.3 0.5 -0.3/1.3
Friend/relative 1214 0.3 1278 0.7 0.4 -0.3/1.1 0.3 -0.4/1.1
Certificate for a 5-star toilet 1214 0.4 1278 4.5 4.0 0.3/5.1 3.8 2.7/4.8
Picture of your family on the village ‘Toilet Board’ poster 1214 0.2 1278 4.8 4.5 3.3/5.7 4.3 3.2/5.5
Skit about toilet convenience 1214 4.9 1278 18.2 13.1 10.0/16.3 12.6 9.4/15.8
Seen small-sized 5-star toilet model 1214 1.9 1278 12.5 10.7 8.2/13.1 10.3 7.8/12.8
Certificate about your toilet, or know anyone who has 1214 1.5 1278 7.4 5.9 4.2/7.6 5.7 3.9/7.5
Seen a certificate give-away 1214 2.0 1278 11.2 9.2 0.7/11.4 9.0 6.7/11.3
Someone talking about or showing a movie about pit filling
1214 2.4 1278 10.1 7.6 5.5/9.7 7.4 5.2/9.7
Movie about using a chair in the toilet for disabled or elderly people
1214 2.9 1278 11.0 8.0 6.0/10.1 7.8 5.6/10.1
Use any of the following
Facebook 1214 18.2 1278 23.6 5.2 1.3/9.1 2.1 -1.6/5.7
WhatsApp 1214 24.0 1278 31.2 7.1 3.0/11.2 3.0 -0.6/6.7
Instagram 1214 6.0 1278 8.7 2.6 0.0/5.2 0.8 -1.5/3.1
YouTube 1214 19.2 1278 22.1 2.7 -1.4/6.8 -0.8 -4.5/2.9
Ever got or sent a message on WhatsApp about toilets 1214 2.3 1278 2.8 0.6 -0.7/1.9 -0.1 -1.3/1.2
Heard about Swachh Sunder Shauchalay campaign
1214 40.6 1278 45.8 5.3 0.6/10.1 3.7 -0.8/8.2
Swachh Sunder Shauchalay campaign is about
Paint your toilet walls 1214 7.9 1278 8.8 0.9 -1.5/3.3 0.7 -1.8/3.1
Decorate your toilets 1214 28.1 1278 32.6 4.5 0.2/8.7 3.4 -0.8/7.6
PD – prevalence difference4, calculated using linear regression (function: Gaussian, link: identity). Clustering at village level was adjusted for by using generalised estimating equations and robust standard errors. APD – adjusted prevalence difference. Pd was adjusted for asset index5 (continuous 4 Prevalence difference is the difference between two proportions expressed as percentage points. For example, if one group has a prevalence of 20% for a given item, and another group has 25%, then the PD is 5%. 5 The asset index was constructed using physical capital owned by the households (i.e. land for farming in the same village/ vicinity, animals (Livestock) , a car/four wheeler, a motorbike, a bicycle , radio , television, satellite cable connection, mobile telephone/key pad phone, smart phone/Android phone, refrigerator, computer, internet, a household water tap, electricity gas stove and bore well. Only variables with an eigenvector of >0.25 were retained. These were land for farming in the same

34
variable) and maximum male education level (dichotomised into primary or less vs secondary or higher).
Table 4.1.B shows the comparison of socio-economic variables among the treatment arm those who have heard about 5 Star Toilet. Those who heard about the campaign had slightly higher household sizes, higher male and female education, and were more often in higher asset quartiles. They also tended to more often live in pukka houses.
4.1.B Comparison of socio-economic variables among the treatment arm those who have heard about 5 Star Toilet.
Item Didn’t hear about 5star Heard about 5star P value N % N %
Total 1100 86.1 178 13.9 Household size 1-3 241 21.9 26 14.0 0.007 4-5 377 34.3 59 33.2 6-7 276 25.1 48 26.9 8+ 206 18.7 45 25.9 Caste SC/ST 36 3.3 03 1.7 0.166 OBC 672 61.1 120 67.4 General 308 28.0 49 27.5 Prefer not to
disclose 84 7.6 06 3.4
Religion Hindu 1089 99 175 98.3 0.415 Muslim 11 1 3 1.7 Highest female education level (n= 1,270)
No formal schooling 236 21.6 23 12.9 0.001
Primary 161 14.7 20 11.2 Secondary 603 55.2 113 63.5 Diploma 07 0.6 03 1.7 graduate 85 7.9 19 10.7 Highest male education level (n= 1,261)
No formal schooling 78 7.2 04 2.3 0.037
Primary 138 12.7 22 12.4 Secondary 625 57.8 102 57.3 Diploma 15 1.4 08 4.4 graduate 227 20.9 42 23.6 Asset index quartile
Lowest 258 23.5 36 20.2 0.034 Low
intermediate 252 22.9 36 20.2
village/ vicinity, owning animals (Livestock), car, television, smart phone, refrigerator, gas stove and borehole. The index was collapsed into quartiles.

35
High intermediate
299 27.1 41 23.1
Highest 291 26.5 65 36.5 House structure Kutcha 144 13.1 21 11.8 0.189 Semi-pukka 550 50.0 81 45.5 Pukka 406 36.9 76 42.7
The district government officials met the project team in December 2019 and found the intervention material interesting and different from what was being delivered through the government channel. The government asked the team for campaign materials and expressed interest to roll it out in another block of Bhavnagar. In January 2019, the government of India launched Swachh Sunder Shauchlayay contest, which included a month-long campaign to mobilize rural households to beautify their toilets by painting them, designing local art and placing SBM logo on the walls. This message was communicated in all blocks of Bhavnagar in December 2018, including the study and control clusters, both of which reported high levels of exposure to it. This overlapped with the ‘5 Star Toilet’ campaign theme and was an unanticipated event just before the end-line evaluation survey. Further, during this time, a local NGO, with support from Pidilite industries accelerated the pace of toilet improvements in Mahuva block of Bhavnagar. Another NGO in Mahuva block provided water tank and construction supplies to households for construction of toilets. This may have been a confounding factor and may explain some of the exposures in the control arm.
4.1.3 Reception of the Intervention
As shown in Table 4.1.C, the intervention had practically no effect on the likelihood that a respondent perceived toilet ownership or use as conferring increased social status in the community. There was a 6%point higher agreement with the statement that if a household has a toilet, people will regard this household as modern or ‘smart’. However, given the large number of comparisons, this could be due to chance. (Note that this does not mean individuals exposed to the intervention were not psychologically influenced; only that there were not enough of such individuals in the sample population to reach statistical significance, perhaps due to the low level of reach.)
Table 4.1.C Perceptions around toilet ownership in the community
Item Control Intervention PD, %
95% CI APD%
95% CI N % N %
If a household in this community does not have a toilet what would others think of them? Nothing 1214 10.3 1278 11.7 1.6 -1.6/4.8 2.0 -1.3/5.2 People may gossip
about them 1214 47.6 1278 50.2 2.5 -1.9/6.9 2.3 -2.1/6.8
They may be ridiculed to their faces
1214 10.0 1278 9.9 -0.1 -3.2/3.0 -0.5 -3.6/2.6
They may be publicly identified as having a bad toilet
1214 8.3 1278 7.7 -0.1 -0.4/2.3 -1.1 -4.1/2.0
They are not literate 1214 20.4 1278 23.1 2.7 -1.7/7.1 2.6 -1.7/7.0 People may think
they are poor 1214 4.5 1278 5.2 0.1 -1.6/3.0 0.1 -1.7/3.0
If a household in this community does have a toilet what would others think of them? Nothing 1214 12.2 1278 12.6 0.4 -2.6/0.3 0.1 -0.2/4.0

36
Item Control Intervention PD, %
95% CI APD%
95% CI N % N %
People will think of them as modern/smart
1214 36.4 1278 42.2 5.9 1.4/10.5 5.3 0.9/9.6
They are considered as educated people of community
1214 24.7 1278 25.1 0.3 -3.9/4.5 0.0 -4.2/4.3
People may thing they have lived in cities
1214 5.6 1278 7.4 1.6 -0.1/4.4 1.2 -1.6/4.0
People may think they are rich 1214 31.7 1278 31.3 -
0.2 -5.5/5.1 -0.4 -5.6/4.9
They may be publicly identified as having a good toilet
1214 22.0 1278 21.0 -1.0 -5.0/3.1 -1.0 -5.2/3.2
PD – prevalence difference, calculated using linear regression (function: Gaussian, link: identity). Clustering at village level was adjusted for by using generalised estimating equations and robust standard errors. APD – adjusted prevalence difference. PD was adjusted for asset index (continuous variable) and maximum male education level (dichotomised into primary or less vs secondary or higher).
Similarly, as shown in Table 4.1.D the intervention had no major effects on sanitation-related perceptions among respondents. There was little difference between intervention and control regarding agreement with statements reflecting important campaign messages such as “Toilets are not just for women; men should use them too”, “A smart person is one who uses a toilet”, or “Toilet pits fill quickly if too many people in the household use them” (negative statement of campaign message). Consistent with the finding (above) that intervention arm respondents reported improving their toilets, so too did they more often report a perception that those around them were improving their toilets.
Table 4.1.D. Agreement with sanitation related statements among respondents
Item Control Intervention PD
, % 95% CI APD% 95% CI
N % N %
Most people around here use a toilet regularly. 1214 83.6 1278 89.5 5.2 1.0/9.4 4.6 0.5/8.7
Everyone in my household uses a toilet. 1214 87.0 1278 90.9 3.8 -1.0/ 8.6 2.8 -1.9/7.5
Many people around here are improving their toilets. 1214 71.6 1278 77.2 5.5 1.1/ 9.9 5.6 1.2/10.1
Using a toilet saves time and effort compared to open defecation.
1214 97.9 1278 98.2 0.3 -1.0/1.6 0.3 -1.0/1.6
Using a toilet builds your reputation in the community. 1214 97.6 1278 97.9 0.2 -1.2/1.7 0.0 -1.5/1.5
A smart person is one who uses a toilet. 1214 53.0 1278 51.6 -
1.2 -6.5/4.2 -1.1 -6.4/4.3

37
It is possible to feel proud of one’s toilet. 1214 94.9 1278 96.6 1.7 -0.2/3.5 1.4 -0.4/3.2
Most people around here think it’s good to use a toilet. 1214 96.1 1278 96.9 0.7 -1.3/2.8 0.5 -1.6/2.6
Using a latrine gives me a ‘packed’ (claustrophobic) feeling.
1214 6.7 1278 5.5 -1.3 -3.3/0.7 -0.8 -2.8/1.1
Toilets are not just for women; men should use them too. 1214 81.0 1278 79.4 -
1.2 -6.3/4.0 -1.0 -6.2/4.2
It is appropriate to have a toilet as good as your house. 1214 98.4 1278 98.6 0.1 -0.9/1.2 0.0 -1.0/1.1
It is ok for poor people to practice open defecation. 1214 21.6 1278 17.7 -
4.0 -7.1/-1.0 -3.3 -6.2/-0.4
Toilet pits fill quickly if too many people in the household use them.
1214 66.1 1278 65.7 0.1 -4.7/5.0 0.5 -4.2/5.3
Most of the people I care about think I should use a toilet. 1214 96.0 1278 95.9 -
0.1 -1.9/1.7 -0.2 -1.9/1.4
People around here think a household should have a good toilet.
1214 97.9 1278 98.0 0.1 -1.1/1.3 0.1 -1.1/1.3
Even if no one else around here had a good toilet, I would still make sure I had one.
1214 91.4 1278 94.1 2.7 -0.4/5.8 2.1 -0.9/5.2
During farming season, most people around here defecate in the field/open
1214 68.7 1278 62.5 -5.9 -11.0/0.8 -4.9 -9.8/0.1
Defecating in the field is more convenient than using a toilet 1214 18.4 1278 17.8 -
0.5 -4.1/3.2 0.4 -3.3/4.1
Having a good toilet at home is a mark of better status in the village
1214 98.1 1278 98.1 -0.1 -1.3/1.2 -0.1 -1.3/1.1
PD – prevalence difference, calculated using linear regression (function: Gaussian, link: identity). Clustering at village level was adjusted for by using generalised estimating equations and robust standard errors. APD – adjusted prevalence difference. PD was adjusted for asset index (continuous variable) and maximum male education level (dichotomised into primary or less vs secondary or higher).
We explored perceptions related to the campaign theme ‘the world is getting smarter’ through qualitative interviews and discussions with participants in the intervention arm and non-recipients in the control arm. Respondents associated the theme with progressive thinking, advancement in science and technology, smart cities, smart political leaders, improvement in agricultural tools and equipment, smart phones, cooking gas, electric motors, grinding machines, educational opportunities for children, smaller family size and motorbikes and smart shauchalayay (smart toilet).

38
During interaction with the community members, in both intervention and control clusters, participants linked ‘SMART’ with words such as saru/haru (good), saras (excellent), sunder (beautiful), samajhdaar (sensible) and intelligent. However, more participants in the intervention cluster had heard this word compared to non-recipients. The 5 Star Toilet concept resonated with the intervention recipients (Quotes 9, 10, 11). Through our discussions with the participants, almost all respondents agreed that it is possible to have a 5 Star toilet (Quote 12).
Quote 9: “People were surprised to hear 5 Star Toilet as until now they had only heard of a 5 Star hotel. This created curiosity and excitement among people.” (Volunteer) Quote 10: “5 Star Toilet was popularly called as suvidha wala sauchalaya (toilet with convenience).” (Campaign Facilitator) Quote 11: “A 5 Star Toilet is long lasting, good looking, comfortable, cost effective and saves time.” (Respondent) Quote 12: “Film on toilet makeover from Ratol village made people believe that it is possible to improve their existing toilets.” (Campaign Facilitator) For the community the definition of a 5 Star Toilet could include having water inside the toilet, tiles, water tank on the roof, ventilation, good smell, geyser to heat water, wash basin and toilet cleaning supplies. Almost all respondents in the intervention clusters and some respondents in control clusters (on probing) listed key attributes actually promoted by the 5 Star Toilet campaign.
However, the majority of respondents felt that a 5 Star Toilet is expensive compared to government subsidised toilets and costs between INR 20,000-80,000 depending on the preferred toilet features. Few people in the control cluster had heard about the 5 Star Toilet. However, all agreed that it is possible to make a 5 Star Toilet if one has desire, resources and the space to construct one. Some respondents felt that government subsidy has made people dependent on external help for making a toilet (Quote 13).
Quote 13: “Government does not always provide benefits for constructing a house. Then why do people save money to construct a home? People have become dependent on government for toilets.” (Respondent)
Community norms and people’s perceptions related to open defecation were explored with intervention recipients and non-recipients in the control arm through discussions. The commonly cited reasons for people to defecate in the open include: poverty, waiting for subsidy from the government/ payment of subsidy pending, lack of resources to construct a toilet, lack of space to construct a toilet within the household, laziness, “old mentality”, old habits, low aspirations in life, convenience during work on agricultural land, the need to keep a toilet clean, the belief that having a toilet at home may contaminate drinking water, or having a temple at home. Perceptions related to the kinds of people who use a toilet include: educated people use a toilet, care about family status, people care about toilets, so they invest their own resources, exposure to toilets or city life, having the space and resources available to construct a toilet. The benefits perceived for using a toilet included that it saves time and effort, is convenient for all including elders and women, prevents diseases, convenient for children to use and elders don’t need to accompany them to OD spots and protects the honour of women. Everyone reported that people who have a toilet at home use it, however, they also admitted to going out to defecate in the field during farming season (especially men), or when water is scarce.
During field observations (n=6) and exit interviews (n=6) with participants after the day 1 and day 2 events, we found that participants had largely understood the campaign messages. The messages

39
most frequently mentioned after the Day 1 event were related to comfort and convenience (suvidha) of using a toilet at home. However, some participants also complained about not being able to access the subsidy and about pending payments. Not all participants in the evening events were exposed to the campaign materials such as toilet model, world of toilets and VR film showcased during the street events. In evening event where certificates were awarded to those with 5 Star Toilets, participants in large numbers expressed the desire to get their toilets 5 Star certified (affiliation). The skit was the most recalled event of Day 1 event. Participant’s recall of day 2 event activities included the process of how shit converts into compost, the mad scientist video on reducing pit filling anxiety and the board with pictures of families with a 5 Star Toilet. Several participants mentioned that their toilet pit size was much bigger than the government promoted pit size. Therefore, they felt less anxious about pit filling. Through discussions with participants, the most commonly reported motives for toilet improvement included comfort, convenience, affiliation, status and honour related to women’s safety. The reasons stated by respondents for making toilet improvements included saving time, not worrying about scheduling OD visits, safety of women at night and during odd hours, status in front of guests and during groom search for daughters and convenience for older parents and disabled people (Quotes 14, 15, 16, 17). These reasons or behavioural motives associated with toilet use relate to the intervention’s theory of change and key motives addressed by the intervention i.e. enhance status, affiliation, comfort and convenience related to toilet use.
Quote 14: “People would not marry into your family if you do not have a toilet. So, engagement of children becomes problematic.” (Respondent) Quote 15: “Having a toilet at home adds to the family’s standing in the community.” (Respondent) Quote 16: “Guests praise you if you have a toilet at home. Guests from Ahmadabad (city) feel ashamed and find it difficult to go for OD.” (Respondent) Quote 17: “A toilet adds to the reputation. Everyone in the village has a toilet. More than money, manners (toilet use) add to the status of a family.” (Respondent) The most commonly stated reason for not constructing a toilet at home included lack of space. Households in Gujarat have large courtyards and toilets are often constructed in one corner of the courtyard. In many households, especially those of the socio-economically poorer sections of the community, space is limited. Therefore, although there is technically sufficient space to construct a toilet, families do not prioritize the need to utilise that available space for constructing a toilet. Instead they use it to keep cattle, farm equipment, to dry utensils after washing and drying grains/farm harvest in the sun. Although, water is available every alternate day for up to 1 hour in each cluster, some households have constructed underground reserve tanks in addition to overhead tanks.
Through our discussions with the facilitators we explored their experience and overall response to the campaign delivery in the clusters. While they reported that initially they were sceptical, with regular support from the team and positive response from community they found the delivery if intervention exciting (Quote 18). Quote 18: “Through this project we learned to interact with different age groups of people and also to manage situation/crisis in community setting. Sometimes we felt like celebrities as community members would recognise us in public places and mention that they participated in the evening events. This was a huge motivation.”

40
(Campaign Facilitator) A final area of investigation was observed modifications to or upgrading of the household facilities. As shown in Table 4.1.E, the intervention had only a limited effect on observed toilet characteristics. Minor effects were found including a 6.4% point increase for availability of a water container, slippers and cleaning materials, as well as in 4 of the 5 Star elements (painted walls, cleanliness, light bulb, water available), but the confidence intervals were wide, while the effect sizes were reduced after adjusting for asset index and male education. Slightly more toilets in the intervention arm than in the control arm were found to be in apparent use.
Table 4.1.E: Effect of intervention on observed toilet characteristics
Item Control Intervention PD, %
95% CI APD%
95% CI
N % N %
Latrine use for other purpose
1214 9.6 1278 6.3 -3.3
-6.4/-0.2 -2.6
-5.6/ -0.4
Clogging of squatting pan
1214 15.0 1278 10.6 -4.2
-8.4/0.0 -3.2
-7.4/ 1.0
Availability of water container
1214 84.9 1278 89.1 4.2 -0.7/9.0 3.3 `-1.6/ 8.1
Availability of slippers
1214 19.8 1278 24.9 4.8 0.1/ 9.4 3.0 -1.8/ 7.7
Availability of cleaning materials
1214 77.6 1278 84.3 6.4 0.8/ 12.0 5.0 -0.7/ 10.6
Toilet is in apparent use
1214 86.1 1278 90.4 4.3 -0.6/ 9.2 3.1 -1.8/ 8.0
Made any changes in last 6 months
1214 6.3 1278 6.0 -0.2
-2.4/ 1.9 -0.3
-2.5/ 1.9
Plan to make any changes
1214 27.6 1278 22.9 -4.7
-9.3/ 0 -3.6
-8.3/ 1.2
Five star items
Painted walls 1214 44.9 1278 52.9 8.1 1.9/14.2 5.3 -0.8/11.5
Clean 1214 68.5 1278 76.0 7.4 1.3/13.4 5.7 -0.4/11.7
Light bulb 1214 53.4 1278 62.4 9.3 1.8/16.8 6.9 -0.3/14.1
Ventilation 1214 18.0 1278 18.8 0.8 -3.0/4.7 0.4 -3.6/4.3
Water 1214 39.0 1278 47.6 8.9 2.2/15.6 5.3 -1.0/11.7
PD – prevalence difference, calculated using linear regression (function: Gaussian, link: identity). Clustering at village level was adjusted for by using generalised estimating equations and robust standard errors. APD – adjusted prevalence difference. PD was adjusted for asset index (continuous variable) and maximum male education level (dichotomised into primary or less vs secondary or higher).
Although during the day 1 event, a large number of people had enrolled for upgrading their toilet into a 5 Star Toilet (see Annex 5 for enrolment figures), only a small number of households were able to

41
report makeovers. Through interviews with participants we found that people felt the need to improve their existing toilets (Quotes 19, 20) and although they were interested in converting their toilets into a 5 Star Toilet, some could not find time to engage a mason, or buy material in the busy farming season. Some respondents felt that people save and spend money on mobile phone but toilets. So, while there may be financial constraints in making improvements to existing toilets, some people do not think it important to make these changes.
Quote 19: “Yes I am proud of my toilet, but people will not say it publicly. Others talk about it. If home is not good it’s ok, but toilet and bath is important. People copy each other.” (Respondent) Quote 20: “Every person aspires for a good-looking toilet with light, water so that it is comfortable to use. People make improvements based on their needs and available resources.” (Respondent)
4.2 Impact analysis
We now move to findings related to the outcome variables.
4.2.1 Primary outcomes
The primary outcome (endline questionnaire) was assessed in 2483 households (1208 control, 1278 intervention). In the control arm, primary outcome data were unavailable in 6 households for which other data were available. The mean number of households enrolled for the primary outcome per cluster was 26.4 (min 2, max 31, SD 6.7). In addition, toilet use was estimated by the physical activity tool in 1295 control households (2253 participants) and 1401 intervention households (2483 participants). The mean number of households enrolled in the physical activity survey per cluster was 28.7 (min 4, max 40, SD 8.2). The study flow diagramme is shown in Figure 4.2.1.
Table 4.2.1A shows the association between the proportion of households with reported toilet use by all members aged >5 years and important socio-economic characteristics. Higher toilet use was associated with a decreasing household size, higher education level (male and female), and higher asset index. Toilet use was also higher among Muslims, general caste members and those with pukka houses. As there were zero non-users among Muslims, the model did not converge. Ignoring clustering, the Fisher Exact test shows a p value of 0.025.
Table 4.2.1A: Socio-economic characteristics and toilet use
Item N % of Households
with complete use
Prevalence difference,
%
95% CI
Lower upper
Total 2483 87.0 - - -
Household size
1-3 517 91.7 ref
4-5 832 86.9 -4.8 -8.1 -1.5
6-7 686 84.7 -7.0 -10.6 -3.4
8+ 448 85.3 -6.4 -10.5 -2.4
Caste

42
Item N % of Households
with complete use
Prevalence difference,
%
95% CI
Lower upper
SC/ST 95 88.4 3.3 -3.3 10.0
OBC 1,515 85.1 ref
General 670 92.1 7.0 4.3 9.7
Prefer not to disclose 203 83.7 -1.3 -6.7 4.0
Religion
Hindu 2,455 86.8 ref - -
Muslim 28 100 13.2 - -
Highest female education level (n= 2467)
No formal schooling 534 85.4 ref
Primary 342 85.4 -0.04 -4.8 4.8
Secondary 1,391 87.0 1.6 -1.9 5.1
Diploma 19 100.0 - - -
graduate 181 93.4 7.9 3.3 12.7
Highest male education level (n=2449)
No formal schooling 163 84.8 ref
Primary 314 84.7 0.0 -6.8 6.7
Secondary 1,496 85.9 1.1 -4.6 7.0
Diploma 52 92.3 7.6 -1.5 16.6
graduate 424 92.9 8.2 2.2 14.2
Asset index quartile
Lowest 637 81.0 ref
Low intermediate 605 83.1 2.1 -2.1 6.4
High intermediate 633 89.4 8.4 4.5 12.3
Highest 608 94.6 13.6 10.0 17.1
House structure
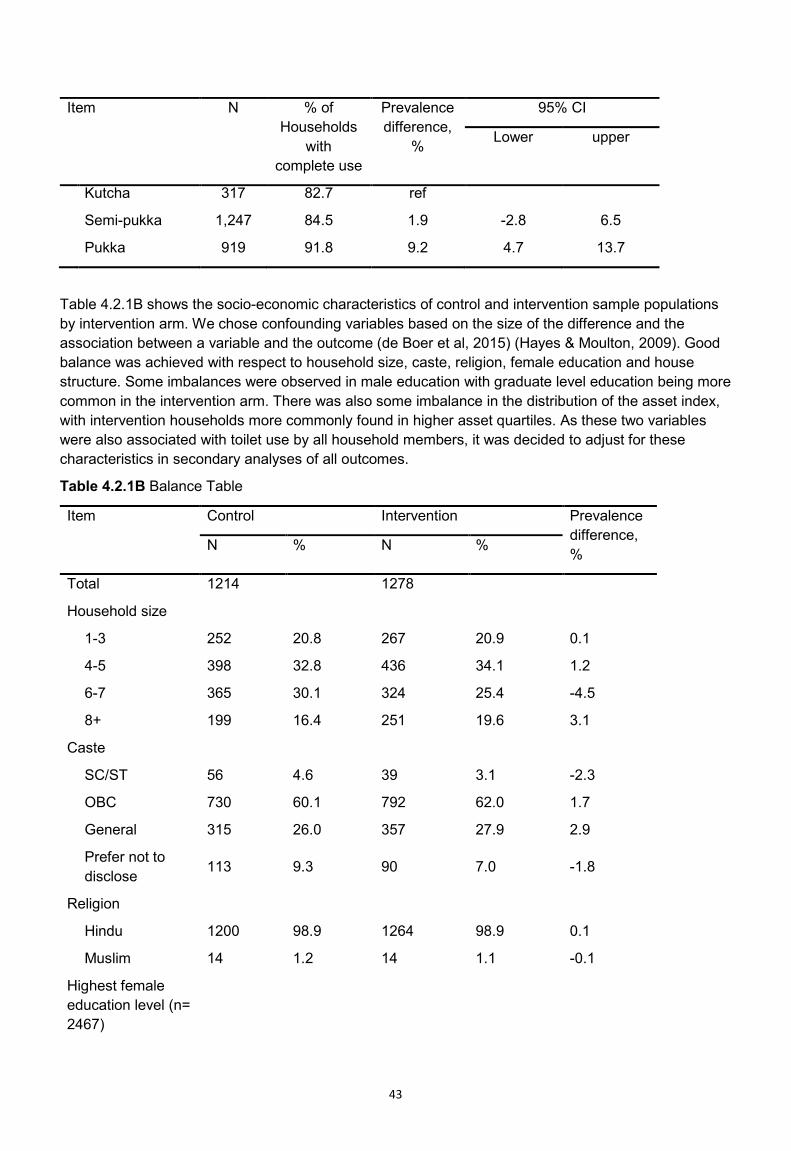
43
Item N % of Households
with complete use
Prevalence difference,
%
95% CI
Lower upper
Kutcha 317 82.7 ref
Semi-pukka 1,247 84.5 1.9 -2.8 6.5
Pukka 919 91.8 9.2 4.7 13.7
Table 4.2.1B shows the socio-economic characteristics of control and intervention sample populations by intervention arm. We chose confounding variables based on the size of the difference and the association between a variable and the outcome (de Boer et al, 2015) (Hayes & Moulton, 2009). Good balance was achieved with respect to household size, caste, religion, female education and house structure. Some imbalances were observed in male education with graduate level education being more common in the intervention arm. There was also some imbalance in the distribution of the asset index, with intervention households more commonly found in higher asset quartiles. As these two variables were also associated with toilet use by all household members, it was decided to adjust for these characteristics in secondary analyses of all outcomes.
Table 4.2.1B Balance Table
Item Control Intervention Prevalence difference, % N % N %
Total 1214 1278
Household size
1-3 252 20.8 267 20.9 0.1
4-5 398 32.8 436 34.1 1.2
6-7 365 30.1 324 25.4 -4.5
8+ 199 16.4 251 19.6 3.1
Caste
SC/ST 56 4.6 39 3.1 -2.3
OBC 730 60.1 792 62.0 1.7
General 315 26.0 357 27.9 2.9
Prefer not to disclose 113 9.3 90 7.0 -1.8
Religion
Hindu 1200 98.9 1264 98.9 0.1
Muslim 14 1.2 14 1.1 -0.1
Highest female education level (n= 2467)

44
Item Control Intervention Prevalence difference, % N % N %
No formal schooling 277 23.0 259 20.4 -2.5
Primary 161 13.4 181 14.3 1.1
Secondary 682 56.6 716 56.4 -0.3
Diploma 9 0.8 10 0.8 0.1
graduate 77 6.4 104 8.2 1.7
Highest male education level (n=2449)
No formal schooling 83 6.9 82 6.5 -0.3
Primary 156 13.0 160 12.7 0.1
Secondary 774 64.7 727 57.7 -7.0
Diploma 29 2.4 23 1.8 -0.5
graduate 156 13.0 269 21.3 8.6
Asset index quartile
Lowest 348 28.7 294 23.0 -5.6
Low intermediate 319 26.3 288 22.5 -4.1
High intermediate 295 24.3 340 26.6 2.6
Highest 252 20.8 356 27.9 7.4
House structure
Kutcha 158 13.0 165 12.9 -0.1
Semi-pukka 619 51.0 631 49.4 -1.5
Pukka 437 36.0 482 37.7 1.7
Table 4.2.1C shows the effect of the intervention on primary study outcomes. At baseline toilet use by all household members was 87.0% in the control and 83.4% in the intervention arm. If counting only households with a perceived functional latrine in the outcome, then 70.2% of control and 73.0% of intervention households were complete users (modified primary outcome).
At endline, use of toilet by all household members in households where the latrine is in apparent use was 7% points higher in the intervention arm than the control arm (modified primary outcome). Of the 2,160 households that reported complete use, 66 (3.1%) had a toilet observed to be not in use by the field team. A similar effect size (6%) was observed in use of the toilet by all household members irrespective of apparent toilet use and in reported individual toilet use (not collapsed at household level). These effect sizes were slightly attenuated after adjusting for asset index (as continuous

45
variable) and highest male education in a household (dichotomised into illiterate to primary vs secondary or higher). Overall, toilet use by all household members at baseline (85%) was similar to toilet use by all household members observed in the control arm at follow up (84%), suggesting an absence of a temporal trend from baseline to follow up, or an absence of an effect of the trial procedures on reporting behaviour. However, field staff at endline observed more toilets in apparent use at baseline than at follow up. As a result, the prevalence primary outcome measure (Use of toilet by all household members in households where latrine is in apparent use) increased from 71% at baseline (intervention + control) to 81% in the control arm at endline. This is probably due to the much closer supervision of field staff at endline, and results in the prevalence of the modified primary outcome to be very close to original primary outcome (use of toilet by all household members (irrespective of apparent toilet use).
The physical activity tool produced a 4.4% point lower overall estimate of individual toilet use than the endline tool (84.5% vs 88.9%). No major effects of the intervention on toilet use assessed using the physical activity tool were observed, with or without adjusting for asset index and male education.
The total number of physical activity questionnaire conducted was 4736 of which 3114 (66%) were from households also included in the main survey. The estimates were not greatly affected by including or excluding the 34% of households not part of the main survey (Table 4.2.1C).
Table 4.2.1C: Study outcomes
Item Control Intervention
PD, %
95% CI APD%
95% CI ICC
N % N %
Baseline
Use of toilet by all household members in households where latrine is in apparent use.
265 70.2 264 73.0 1.3 -
Use of toilet by all household members (irrespective of apparent toilet use)
328 87.0 303 83.4 -4.9
-
Endline
Primary outcome
Use of toilet by all household members in households where latrine is in apparent use.
1208 80.9 1275 87.6 7.0 1.4 / 12.6 5.5 0.0 / 11.0 0.14
Secondary outcomes
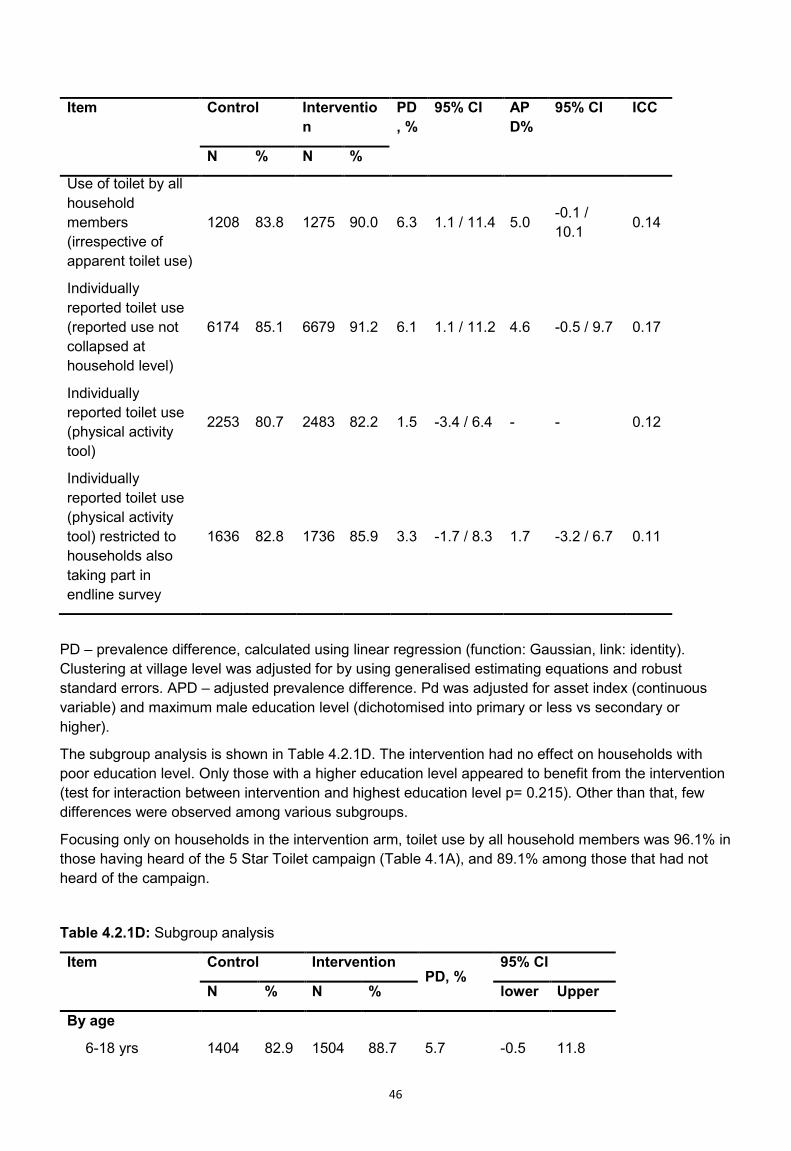
46
Item Control Intervention
PD, %
95% CI APD%
95% CI ICC
N % N %
Use of toilet by all household members (irrespective of apparent toilet use)
1208 83.8 1275 90.0 6.3 1.1 / 11.4 5.0 -0.1 / 10.1 0.14
Individually reported toilet use (reported use not collapsed at household level)
6174 85.1 6679 91.2 6.1 1.1 / 11.2 4.6 -0.5 / 9.7 0.17
Individually reported toilet use (physical activity tool)
2253 80.7 2483 82.2 1.5 -3.4 / 6.4 - - 0.12
Individually reported toilet use (physical activity tool) restricted to households also taking part in endline survey
1636 82.8 1736 85.9 3.3 -1.7 / 8.3 1.7 -3.2 / 6.7 0.11
PD – prevalence difference, calculated using linear regression (function: Gaussian, link: identity). Clustering at village level was adjusted for by using generalised estimating equations and robust standard errors. APD – adjusted prevalence difference. Pd was adjusted for asset index (continuous variable) and maximum male education level (dichotomised into primary or less vs secondary or higher).
The subgroup analysis is shown in Table 4.2.1D. The intervention had no effect on households with poor education level. Only those with a higher education level appeared to benefit from the intervention (test for interaction between intervention and highest education level p= 0.215). Other than that, few differences were observed among various subgroups.
Focusing only on households in the intervention arm, toilet use by all household members was 96.1% in those having heard of the 5 Star Toilet campaign (Table 4.1A), and 89.1% among those that had not heard of the campaign.
Table 4.2.1D: Subgroup analysis
Item Control Intervention PD, %
95% CI
N % N % lower Upper
By age
6-18 yrs 1404 82.9 1504 88.7 5.7 -0.5 11.8

47
19-49 yrs. 2658 85.4 3150 91.3 5.8 0.9 10.7
>50 yrs. 1193 87.1 1435 93.5 7.2 2.2 12.2
By gender
Male 2576 84.2 3047 91.4 6.6 1.5 11.8
Female 2679 86.1 3042 90.9 5.5 0.3 10.6
By highest education level of any household member
Primary or less 170 85.3 173 87.3 -0.1 -9.4 9.3
Secondary or more 867 83.5 997 90.5 6.9 1.7 12.1
By asset index
Below median 529 79.9 490 84.5 4.0 -2.3 10.2
Above median 483 88.5 658 94.7 6.9 1.9 11.8
PD – prevalence difference, calculated using linear regression (function: Gaussian, link: identity). Clustering at village level was adjusted for by using generalised estimating equations and robust standard errors.
As shown in Table 4.2.1E, the intervention had no effect on child defecation pattern of children less than 5 years of age, and in particular not on the proportion of children defecating in the latrine and the proportion of child faeces disposal into the latrine. More people in intervention arm reported taking their children inside the compound to defecate on the ground 25.6%) compared to control arm (21.3). This may indicate that the campaign led to some social pressure regarding child defecation norms. However, statistical support for this observation is not great and unexpected findings as this have a high chance of having occurred by chance.
Table 4.2.1E: Child defecation pattern
Item Control Intervention
PD % 95% CI
N % N %
Last defecation of child ≤5 years
On ground outside compound 489 22.9 554 16.8 -6.1 -12.4/0.2
On ground inside compound 489 21.3 554 25.6 5.3 -1.1/11.8
On ground in latrine cubicle 489 4.1 554 4.3 0.7 -1.7/3.0
In potty 489 6.1 554 9.2 3.2 0.0/6.5
In cloth nappy/diaper 489 1.4 554 2.2 0.8 -0.9/2.5
In pants/clothing 489 2.5 554 2.4 0.04 -2.0/2.1
On bed 489 0.2 554 0 -0.2 -0.5/0.2
In bedpan 489 0.8 554 2.0 1.3 -0.1/2.7
In latrine 489 39.5 554 37 -3.3 -10.4/3.9
Stool disposal (if not using latrine)
Put/rinsed into Latrine/latrine 296 11.8 349 12.0 -1.8 -9.3/5.6
Put/rinsed into drain/ditch/open field 296 1.0 349 4.3 3.4 0.5/6.2

48
Thrown into garbage 296 64.5 349 65.9 2.2 -7.3/11.8
Buried 296 0 349 0.3 0.3 -0.2/ 0.8
Washed (water ends up somewhere else)
296 7.4 349 7.2 0.5 -4.6/5.5
Left in open 296 13.9 349 9.7 -3.4 -11.5/4.6
Other 296 1.4 349 0.6 -1.0 -2.5/0.6
PD – prevalence difference, calculated using linear regression (function: Gaussian, link: identity). Clustering at village level was adjusted for by using generalised estimating equations and robust standard errors.
Pit emptying practices are shown in Table 4.2.1F. Only a small percentage of households in control (3%) and intervention (3.2%) arms had ever experienced latrine pit filling. In control arm, 66.7% only emptied the pit, however, 8.3% built a new pit, 2.8% switched to another pit, about 8.3% stopped using and another 2.8% reduced the use frequency. In the intervention arm, 80.5% emptied the pit, however, 7.3% built a new one, 2.4% switched to another, 7.3% stopped using and 2.4% reduced the frequency of use. Among those who emptied in the control arm, 70.8% hired someone to manually emptying it, 8.3% hired tanker to empty and 12.5% households reported doing it by family members. Similarly, in the intervention arm, 75.8% hired someone to do it manually, whereas 9.1%% hired a tanker, and in 12.1% households it was done by a family member.
4.2.1F Table: Toilet Pit Emptying
Item Control (N= 1214) Intervention (N= 1278)
P value
N % N % Latrine Pit ever filled Up 36 3.0 41 3.2 0.723 What did they do with the pit after it filled up? 0.402 Emptied 36 66.7 41 80.6 Built a new pit 36 8.3 41 7.3
Switched to using second pit 36 2.8 41 2.4
Everyone stopped using the latrine altogether
36 8.3 41 7.3
Restricted use to a select few members 36 2.8 41 2.4
Other 36 11.1 41 0
How was it emptied? 0.850 Hired someone to manually empty 24 70.9 33 75.8 Hired tanker to empty 24 8.3 33 9.1
Someone in family manually emptied 24 12.5 33 12.1
Other 24 8.3 33 3.0

49

50
5. Cost Analysis
Overall, we found the 5 Star Toilet campaign would cost US$ 1,23,502 to reach 2,483 households. Cost per household covered over the study period was US$ 49.74 at 2018 USD conversion rate. Intervention development accounted for 42% of the overall cost, the rest being intervention roll out cost (Table 5.1). Obviously, this proportion of cost would not be necessary for those adopting its use in other contexts.
During the study period, the intervention resulted in 7% (CI: 1.4 to 12.6) increase in use of toilets by household members where the latrine is in apparent use. Cost per unit increase in use of toilet was US$ 17,643 and it ranges from US$ 9,802 (assuming 12.6 percent point increase in use of toilet) to US$ 22,455 (assuming 5.5 percent point increase in use of toilet) (Table 5.2).
Table 5.1: Programme cost
Item US$ in 2018 price
Development Cost (one time) Personnel 40,057 Travel 6,657 Equipment 687 Indirect Cost 4,604 Total intervention development cost 52,005 Roll out cost (Recurring) Personnel 29,590 Development of materials for campaign
23,713
Office Expenses 1,867 Travel for staff 9,827 Overhead @ 10% 6,500 Total roll out cost 71,497 Total cost over the intervention period
1,23,502
Table 5.2: Cost-effectiveness Analysis
Total households in the study area 2,483 Cost per HH coverage 49.74 Percent difference in use of toilet by all HH members where latrine is in apparent use (CI)
7 (1.4 – 12.6)
Cost (in US$) per percent unit increase in use of toilet @ 7 pp
17,643
Cost (in US$) per percent unit increase in use of toilet @ 5.5 pp
22,455
Cost (in US$) per percent unit increase in use of toilet @ lower limit 5.5 pp
88,216
Cost (in US$) per percent unit increase in use of toilet @ upper limit 12.6 pp
9,802

51
6. Discussion
6.1 Introduction The results provide no clear evidence for a relevant effect of the intervention on toilet use in a rural Indian setting with high pre-existing toilet coverage and probable high levels of use. Gujarat was declared Open Defecation Free (ODF) by the Government in October 2017. This meant that all clusters in Gujarat had 100% toilet coverage. However, toilet coverage is far too low to judge Gujarat ODF in actual fact (CAG, 2018). According to our discussions with the district officials, no active behaviour change activities were being conducted in Bhavnagar. The government is working towards including households who were left out in the 2012 baseline survey as potential beneficiaries for receiving toilet construction subsidy. This means that not all households in Gujarat have access to a toilet and government continues to identify and disburse subsidy to eligible households. The small increase in toilet use by all household members aged above 5 years was below the anticipated effect size for which the study was powered and was not confirmed by the physical activity data which attempted to measure toilet use less intrusively. We observed a small increase in toilet use of 7.0% which was attenuated to 5.5% after adjusting for imbalances. The process evaluation suggested possible reasons for the failure of the intervention to meet its objectives. This is supported by the observation that among those intervention households able to remember the term “5 Star Toilet campaign”, reported use by all household members was 96%, as opposed to 89% in those unable to remember. Although such per protocol analyses are often subject to confounding, it is possible that the same intervention with better reach would have led to higher reported latrine use among all households. This may suggest the campaign Most notably, the exposure of the target population to the intervention was very low. Only about 10-15% of the intervention households showed evidence of exposure to the intervention. A further analysis revealed that this small exposure was insufficient to change the population’s perceptions around toilet ownership and other relevant sanitation-related factors. Small positive changes in toilet features and proxy markers of current use were observed but statistical support for these small changes was low and could have occurred by chance. The intervention also failed to change practices around child defecation. There also appeared to be interference from a similar sanitation promotion program sponsored by the government in the same area at the same time. The ‘5 Star Toilet’ concept was nested within the campaign theme of ‘The World is Getting Smarter’ and a lifestyle is not ‘completely smart’ until people have a toilet that matches the quality of their other ‘smart’ belongings such as smart phones, laptops, gadgets etc. The campaign was delivered by trained facilitators and follow up in community was done through village volunteers. The word ‘smart’ was translated as saru, saras by the facilitators while delivering the campaign. Younger people were also able to understand and the word ‘smart’. In this manner the campaign mainstreamed the toilet concept by placing it in the context of all the other desirable, modern things. The tone and tenor of the campaign was light while keeping to the main points. The surprising presentation of toilets which the intervention recipients received was not delivered through other government and non-governmental interventions. Exposure to different kinds of toilets in the world generated excitement and opened people’s minds to what a toilet can be. The compost guessing game was able to initiate discussion and reduce disgust as some participants came forward to touch, feel and smell compost. However, what clearly sticks out from the qualitative interviews with respondents is their response to the ‘5 Star Toilet’ concept, which was not only attractive but inspirational, making them believe that it is possible and desirable to improve one’s toilet in order to be perceived as modern and high-status. This was demonstrated through the enrolment figures of people wanting to improve their existing toilet and through interviews with intervention recipients.

52
However, the reach of the intervention was clearly insufficient to produce changes at population level. Therefore, a lesson for future scale up is to make sure sufficient time is kept for follow up and a suitable incentive/engagement plan for volunteers is developed. The findings are difficult to compare with previous studies. Published randomised controlled trials on improving sanitation have often focused on construction of toilets. A sanitation trial in Indonesia achieved an increase in household sanitation coverage from 60% to 64% (Cameron 2013). A trial in Maharashtra, India, explored the effect of an intervention that increased coverage from perhaps 16% to 24%, an 8% difference (Hammer & Spears 2013). Similarly, access to any form of latrine increased from just 57% to 65% in a trial in Tanzania (Briceno 2015). A 19% increase in latrine ownership was achieved in a trial in Madhya Pradesh, India (from 22% to 41%) (Patil 2014), a figure that was exceeded only by the trial in Orissa (from 9% to 63%) (Clasen 2014). However, in the latter, nearly half of the constructed latrines were not functional one-year post-intervention. Further, there is evidence that in all three Indian sites, use of newly constructed latrines was low, and that open defecation continued, largely unabated. None of these earlier trials showed any impact on health, except for the trial in Maharashtra that suggested an improvement in child growth. Given the low sanitation coverage achieved, this finding is implausible and may have been due to chance. The Indian trials were conducted in the context of the Government of India’s Total Sanitation Campaign (TSC), which included behaviour change components. In this sense, the present trial is in line with the earlier failures of TSC to increase use of previously constructed latrines. A stronger behaviour change component compared to TSC is usually implemented in interventions following the principles of Community-Led Total Sanitation (CLTS). For example, Pickering and colleagues testing a CLTS intervention in Mali, found an increase in private latrine ownership from 35% to 65% (Pickering 2015). Access to any latrine was improved from about 66% to 90% (Pickering). Open defecation may have decreased from 33% to about 10%, due to a combination of increased access to toilets and higher use. Sanitation is likely to be most effective if the vast majority of a neighbourhood or village practice it. At low or intermediate coverage, open defecation by remaining households may keep environmental exposure to pathogens fairly constant, even for those using a latrine. Increasing sanitation coverage from about 60% to 90% as in Mali (“closing the gap”) may therefore have a greater potential to improve health than increasing it from about 10% to 40% as in the Orissa and Madhya Pradesh trials. The setting of our trial was reminiscent of the Mali trial in that pre-existing toilet coverage and use was high. However, toilet quality was better in our setting, which meant that for the majority of households, there was no need for improving them further. In contrast to Mali where toilet quality was generally poor, our challenge was to identify households that could benefit from the intervention. Therefore, community-level interventions such as our intervention or CLTS (in the Mali trial) may be harder to conduct and less cost-effective in our settings (see below – challenges and lessons). More generally, the study findings are in line with other WASH-related behaviour change campaigns, especially those targeting handwashing behaviour. Intense small-scale hygiene interventions such as our earlier Superamma trial in Andhra Pradesh (Biran 2014) have demonstrated changes to handwashing behaviour, but larger campaigns at scale have failed to produce relevant effects (Huda 2012, Briceno 2017, Lewis 2018). Limitations of the present study include the use of a self-reported behaviour to measure the primary outcome, imbalances in some socio-economic variables across study arms, and the short time frame between randomisation and outcome assessment. The study relied on self- or proxy-reported toilet use as the primary outcome, which is likely to lead to over-reporting of socially desirable behaviours. In the setting of a randomised trial testing the effect of an intervention on socially desirable behaviours (here: toilet use), there is the additional risk

53
of differential reporting behaviour between intervention and control arm. Study participants in the intervention arm who have just been exposed to an intervention may be more prone to over-reporting toilet use than participants in the control arm, for who the survey may simply appear as just another household survey, unlinked to an intervention. Higher over-reporting of toilet use in the intervention would cause a spurious effect of the intervention on toilet use. We tried to explore the potential for differential over-reporting influencing the study results, by employing a newly developed tool to measure toilet use and open defecation – the physical activity tool. In this tool, going for open defecation is one of many questionnaire items related to different physical activities throughout the day, alongside other questions related to chronic non-communicable diseases including dietary pattern. This tool found a 4.4% points lower toilet use among study participants, and there was no evidence for any increase in toilet use among the intervention households. These findings are compatible with the presence of over-reporting in the primary outcome and suggest that the observed effect of 5% (adjusted) to 7% (unadjusted) percentage point increase in toilet use may be due to differential over-reporting. In the absence of a gold standard to measure toilet use, this interpretation needs to be treated with caution. The samples for the main tool and the physical activity tool only partially overlapped. We wanted the physical activity questionnaire to be administered independently, by a different team. The teams replaced households using the same list of households using Survey CTQ app, but the physical activity tool did not re-assess eligibility of a household – the tool did not require a toilet to be present. With hindsight, we could have added the same eligibility criteria as in the main survey. We did not anticipate the fairly large number of households from the baseline census that proved unavailable or ineligible at endline. Further, the physical activity survey required 60 interviews per villages. As many households only had one person available for interview, the team continued to enrol until 60 questionnaires were completed. Therefore, the number of households in the physical activity tool was higher than in the main tool and included some households that were probably ineligible.
Having observed unexpectedly high reported toilet use in the baseline survey, we decided to modify the primary outcome measure by adding the requirement of a toilet being in apparent use to meet the primary outcome. However, the prevalence of toilets being in apparent use was much higher at endline than at baseline in both arms, which most likely was due to the better staff supervision in the endline survey. This meant that the results of the modified primary outcome (Use of toilet by all household members in households where latrine is in apparent use) were very similar to those obtained when using the original outcome (use of toilet by all household members irrespective of apparent toilet use as observed by field staff). We further tried to reduce the potential for over-reporting by not repeating questions related to sanitation and toilet use in the same households at baseline and at follow up. Households undergoing these questions at baseline were discarded from further study. This strategy appears to have been successful. Toilet use by all household members at baseline (85%) was similar to toilet use by all household members observed in the control arm at follow up (84%), suggesting that the trial procedures did not influence reporting behaviour. These findings further suggest that administration of the physical activity tool which was done about 10 to 14 days before the endline tool, did not influence responses of the endline tool, possibly by successfully camouflaging the purpose of the physical activity survey. The lack of baseline toilet use data in the households included in the endline survey meant that we could not adjust the effect estimates for any imbalances in the primary outcome or use the data for restricted randomisation to achieve balance. Randomisation was further compromised by the great time pressure to randomise before all census and baseline data were available, as a consequence of unexpected delays in payments for the field surveys, and the requirement for the r.i.c.e

54
measurement team to know treatment allocation for their survey. We further suspect that due to deficient staff supervision at baseline, the data used for randomisation was of poor quality. Some endline imbalances were observed in variables associated with the primary outcome (asset index and male education). Adjusting for these variables attenuated the observed effect sizes but did not fundamentally change the interpretation of the results. On the whole we believe that minimising over-reporting and bias is more important than achieving a high degree of balance across arms. Bias is impossible to address analytically whereas imbalances are due to a chance process which can be adjusted for (at least to some extent) and interpreted in the light of confidence intervals and the results of other studies (in meta-analysis). The apparent poor quality of the baseline data may also be behind the high proportion of census households that were reportedly eligible for the endline survey but could either not be found at endline or were found to be ineligible. These were replaced by additional households from the list we provided, but this meant that the two teams working on the physical activity tool and the endline questionnaire enrolled somewhat different though overlapping study populations. In our study design, the 10 households per village enrolled in the baseline toilet use questionnaire were sampled at random from the total list used for the endline survey. The results show very similar self-reported toilet use between baseline and endline in the control arm. Thus, despite the issues with the baseline data, this is a reassuring finding, suggesting that the baseline findings are reliable, while also lending support to our approach of not revisiting households at endline. 6.2 Challenges and lessons
The trial highlighted the need to identify a suitable target population for interventions aiming at increasing use of existing toilets. In our case, toilet use was already at a high level. Many households had high quality toilets that were an integral part of the house. This is in striking contrast to many other Indian settings where toilets are often located away from the house, as if constructed as an afterthought and with the aim of keeping the toilet as far from the main building as possible. The apparently high acceptance of toilets in the study population appears to have reduced the proportion of the population that could have benefitted from the intervention. If between 75% to 85% of households are already complete toilet users, then the target population whose behaviour can be changed forms a small minority of households. From the programme perspective, this strongly reduces the efficiency of an intervention if it mainly consists of activities performed at the community level such as public events and road shows. Intervention resources are then wasted on a majority of people attending such events which have no need to change their behaviour. Apart from choosing a suitable target population with a lower prevalence of toilet use, the findings suggest that better targeting of the intervention to households that are not currently using their toilet fully could be key to improving the effectiveness of the campaign and making it more efficient from the cost perspective. It may be assumed that community events are more cost-effective than individual household interventions and can also serve to change community social norms by allowing for the target population to experience behaviour change interventions jointly. This assumption may however change if only a small proportion of households are the true targets of an intervention (those 10%-15% currently not using toilets). Identifying such households within a given community is however not easy. It seems difficult to target them without in-depth knowledge from inside the community and serial households visits to increase intervention exposure in those who could benefit from it most. Further research is needed to explore how this can be done. Approaches to identify households not using toilets need to be design in a way that avoids stigmatising households based on income, caste and other status-related characteristics.

55
The intervention concept and components underwent significant, iterative modifications in response to in-field testing by the creative team, resulting in a final design that seemed to generate considerable interest among those coming into contact with it. Many of the components do not need to be delivered in the context of community events, as demonstrated by their use in street-level events in the current implementation, and could be even more precisely targeted, although with an attendant increase in cost per household. However, in the light of the failure of large-scale behaviour change interventions in the WaSH sector, one may also question whether relatively low-intensity, short-lived behaviour change campaigns (lasting for two or three visits, without a follow up or support of mass media and sustained efforts), can bring about lasting changes in sanitation related behaviour. Recent demonstration campaigns in other countries suggest it might be possible (Tidwell et al., 2019), but replications at scale are required to ensure this possibility. The Indian government’s sanitation campaigns are frequently criticised for their emphasis on toilet construction rather than behaviour change (e.g., Routray 2017). It has however been argued that no-one has developed a scalable approach to do it better (Schmidt 2015). The present study suggests that once people have built good quality toilets, they are quite likely to use them consistently, at least in this setting in Gujarat. According to general community perception, a good quality toilet includes more space, where people feel less claustrophobic and is less stinking, with tiles on the wall which help in keeping the toilet clean and make it look beautiful, availability of water for cleaning and flushing and light inside the toilet. The superiority of behaviour change campaigning as opposed to toilet construction, pursued for example in the CLTS approach has not been proven in the case of India. Government subsidies to support the transition from a predominantly open defecation population to one that is using toilets seem appropriate in this light. Increases in toilet use appear to occur in India, and it seems possible that the driving factor behind this increase is the change in the behaviour setting / environment (i.e., availability of a toilet). Our campaign emphasised and supported people in making their toilets easier to use and ‘nicer’ with the aim of making the behaviour setting more favourable for toilet use. The reach of these activities was insufficient, and needed to target those who do not already own a high-quality toilet (households which were relatively rare). Gujarat was declared ODF in October 2017. This meant that all households in a village had access to a toilet. Although, in reality this number was far less, the government continues to identify potential beneficiaries who were not able to access toilet subsidy earlier. This is improved toilet coverage built using government subsidy or using personal resources by households. To what extent behaviour change campaigns can contribute to changing norms and increase construction of toilets (not part of the campaign described here) and their subsequent use (the emphasis of this intervention) remains unclear. Through our experience we noted that creative design and development process is an important aspect of intervention delivery. However, it is often ignored or undermined as it requires focused and continuous engagement and adequate funds for field testing, prototype development and the iterative production of creatives. Similarly, for behaviour change to occur, there is a need for sustained government-supported efforts, involving communities, at district, block and gram panchayat levels. Our efforts to use village volunteers and social media to sustain behaviour change activities do not appear to have been successful. Finally, a core challenge of the study was some unforeseen circumstances which delayed disbursement of funds and subsequently impacted the project timeline. This especially had an impact on the baseline study which was done by the data collection agency without them having received any funding by the time of the study. This may have compromised the quality of the baseline data, as fewer quality checks were put in place than would have been desirable.
6.3 Policy and programme relevance: evidence uptake and use
56
While it is currently too early to determine the ultimate degree of evidence uptake and programme use by policy-makers, there is already some evidence that the research project has had an impact on other efforts to improve sanitation in the context of SBM. The campaign theme and contents resonated strongly with the people and implementers. Further, the campaign was received well by the district level officials of the Government of Gujarat. All campaign materials were reviewed by the District Development Officer, District IEC Coordinator and the Block Development Officer. The District government was excited about the campaign materials as they look attractive and communicate messages related to reducing anxiety around pit filling and improving existing toilets. This, according to the district government, is important to reach out to people who have built toilets but may not be using them. The government is currently planning to scale up the campaign to other blocks of Bhavnagar. The Smart Toilet Campaign team assisted the Government of Gujarat to develop this scale up plan. Messages related to solid-liquid waste management and clean village were added to the existing package. However, since the general election code of conduct was announced, the scale up was postposed to a later date by the district administration.
The government is looking for more effective strategies to encourage use of toilets by all members in a household. Over the past years, the government IEC efforts have mainly focused on messages related to toilet use without addressing the core determinants. The government felt that door-to-door activities have greater potential to reach people compared to triggering activities alone, which is in agreement with our conclusion from this research. In addition, they also agreed that sustained efforts, over a period of time, with improved implementation arrangements, are needed as one-time activities often have limited impact on the people. Members from TATA Trusts observed the intervention delivery and invited the study team to learn more about the BCD process and steps followed to design the ‘5 Star Toilet’ campaign. Previously, the Trust has implemented a campaign, based in BCD, to improve toilet coverage and they see value in the intense theory driven approach to behaviour change for sanitation. The team shared study results with them. The TATA Trusts have expressed interest to roll out the campaign in 30-50 villages in Gujarat.

57
7. CONCLUSIONS AND RECOMMENDATIONS
This behaviour change intervention aiming at increasing use of toilets in households owning a government supported toilet was delivered in the context of a cluster-randomised trial. Only a small increase in self-or proxy reported toilet use was observed in the intervention arm, compared to the control. Insufficient campaign intensity and exposure of the target population to the intervention are likely to have contributed to the low impact of the campaign. Subgroup analyses suggested even smaller effect of the intervention in households with a low level of education, while no differential effect was observed between men and women. The pre-existing high coverage of high-quality toilets that appeared to be used by at least around 80% of the target population meant that only a minority of households could be potential beneficiaries of the intervention. Overall, the limited exposure of the target population to the intervention points to implementation issues as the main cause for the lack of effect. Despite the lack of evidence of effectiveness from this trial, the campaign concept and components have generated considerable interest, such that they have already been taken up for implementation by others, including the Indian government and Tata Trusts. Based on our quantitative and qualitative findings we make the following recommendations: 1. Policy makers need to be aware that large scale, one-off behaviour change campaigns have not
been shown to achieve relevant changes in sanitation behaviour if they are not supported by sustained efforts on the ground.
2. Programme managers need to estimate the proportion of the target population that can benefit
from an intervention prior to deciding on how to design a campaign. Interventions only working at community level without visits to individual households may be cheap and scalable but may become inefficient if only a minority of the population are potential beneficiaries. Targeted household level interventions may be more cost-efficient than community level interventions if there is a straightforward way of identifying potential beneficiaries (in this case households with access to a toilet but low use).
3. Researchers need to develop better tools for assessing toilet use that are not prone to over-
reporting and in particular differential over-reporting between an intervention and a control arm. Trials should not rely on explicitly self-reported toilet use as the only method for outcome assessment.
4. Changing sanitation behaviour and assessing the effect of interventions to test different
approaches takes time. Donors should allow for sufficient time to achieve changes and measure impacts if they wish to improve the evidence base of their decisions.
5. Future research could be directed to how to better target large scale sanitation interventions to
sub-populations at greatest need, without stigmatising economically and socially disadvantaged groups. Future research further needs to determine the minimum “dose” an intervention must achieve in order to change behaviour. It further needs to be established how large-scale sanitation campaigns can be incorporated into the overall sanitation strategy at local, district, state and national level. The use of volunteers was not successful in this intervention. Most intervention activities were conducted by dedicated staff. Since volunteers’ groups such as girls’ groups or self-help groups are often officially included in sanitation programmes under SBM, ways of making them more effective need to be explored.
BIBLIOGRAPHY
58
• Aunger, R. & Curtis, V., 2015. A Guide to Behaviour Centred Design. , (April). • Aunger, R. & Curtis, V., 2016. Behaviour Centred Design: towards an applied science of
behaviour change. Health Psychology Review, 10(4), pp.425–446. • Barnard, S. et al., 2013. Impact of Indian Total Sanitation Campaign on Toilet Coverage and
Use: A Cross-Sectional Study in Orissa Three Years following Programme Implementation. PLoS ONE, 8(8).
• Bicchieri C et al. Social Networks and Norms: Sanitation in Bihar and Tamil Nadu, India, progress report 2017 BMGF.
• Biran A, Schmidt WP, Varadharajan KS, Rajaraman D, Kumar R, Greenland K, Gopalan B, Aunger R, Curtis V. Effect of a behaviour-change intervention on handwashing with soap in India (SuperAmma): a cluster-randomised trial. Lancet Glob Health. 2014 Mar;2(3):e145-54.
• Briceno B, Coville A, Gertler P, Martinez S, 2017. Are there synergies from combining hygiene and sanitation promotion campaigns: Evidence from a large-scale cluster-randomized trial in rural Tanzania. PLoS One 12:e0186228.
• Briceno B, Coville A, Martinez S. Promoting Handwashing and Sanitation: Evidence from a Large-Scale Randomized Trial in Rural Tanzania. The World Bank - Water Global Practice Group & Development Research Group. Policy Research Working Paper 7164. Washington; 2015
• Cameron L, Shah M, Olivia S. Impact Evaluation of a Large-Scale Rural Sanitation Project in Indonesia. The World Bank - Sustainable Development Network WaSP. Policy Research Working Paper 6360. Washington; 2013.
• Clasen T, Boisson S, Routray P, Torondel B, Bell M, Cumming O, et al. Effectiveness of a rural sanitation programme on diarrhoea, soil-transmitted helminth infection, and child malnutrition in Odisha, India: a cluster-randomised trial. Lancet Glob Health. 2014; 2(11): e645-53.
• Coffey, D. & Spears, D., 2014. How can a large sample survey monitor open defecation in rural India for the Swachh Bharat Abhiyan? RICE working paper, pp.1–13.
• Coffey, D. et al., 2014. Revealed Preference for Open Defecation. Economic and Political Weekly, 49(38), pp.43–55.
• Coffey, D. et al., 2015a. Culture and the Health of Transition: Undestanding Sanitation Behavior in Rural north India. , (April).
• Coffey, D. et al., 2015b. Understanding exceptionally poor sanitation in rural India: Purity, pollution & untouchability. Economic and Political Weekly, pp.1–51.
• Craig, P. et al., 2008. Developing and Evaluating Complex Interventions: New Guidance. Medical Research Council, pp.1–39.
• Curtis, V. & Cairncross, S., 2003. Effects of washing hands with soap on diarrhea in the community: a systematic review. Lancet, 3(0), pp.81–275.
• Curtis, V. et al., 2011. Hygiene: New hopes, new horizons. The Lancet Infectious Diseases, 11(4), pp.312–321.
• Curtis, V.C. 2000. Domestic hygiene and diarrhoea. Tropical Medicine and International Health; 2000, 5(1), pp.22–32.
• de Boer, M. R., Waterlander, W. E., Kuijper, L. D., Steenhuis, I. H., & Twisk, J. W. (2015). Testing for baseline differences in randomized controlled trials: an unhealthy research behavior that is hard to eradicate. The international journal of behavioral nutrition and physical activity, 12, 4. doi:10.1186/s12966-015-0162-z
• Duflo, Esther and Greenstone, Michael and Guiteras, Raymond P. and Clasen, Thomas, Toilets Can Work: Short and Medium Run Health Impacts of Addressing Complementarities and Externalities in Water and Sanitation (September 2015). NBER Working Paper No. w21521. Available at SSRN: https://ssrn.com/abstract=2656904
• Emerson, P.M. et al., 2004. Role of flies and provision of toilets in trachoma control: Cluster-randomised controlled trial. Lancet, 363(9415), pp.1093–1098.

59
• Freeman, M.C. et al., 2017. The impact of sanitation on infectious disease and nutritional status: A systematic review and meta-analysis. International Journal of Hygiene and Environmental Health, 220(6), pp.928–949.
• Garn, J. V. et al., 2017. The impact of sanitation interventions on toilet coverage and toilet use: A systematic review and meta-analysis. International Journal of Hygiene and Environmental Health, 220(2), pp.329–340.
• Gautam O, Schmidt W, Cairncross S, Cavill S, Curtis V. Trial of a novel intervention to improve multiple food hygiene behaviors in Nepal. Am J Trop Med Hyg 2017; 96: 1415–26.
• Hammer J, Spears D. Village sanitation externalities and children's human capital: Evidence from a randomized experiment by the Maharashtra government. Policy Research Working Paper. Princeton; 2013.
• Hargreaves, James R M. Goodman, Catherine. Davey, Calum. Willey, Barbara A. Avan, Bilal Iqbal. Schellenberg, Joanna RM Armstrong. Health Policy and Planning, Volume 31, Issue 7, September 2016, Pages 860–867, https://doi.org/10.1093/heapol/czw001
• Hayes and Moulton, 2009, Cluster Randomised Trials - CRC Press Book. • Huda TM, Unicomb L, Johnston RB, Halder AK, Yushuf Sharker MA, Luby SP, 2012. Interim
evaluation of a large scale sanitation, hygiene and water improvement programme on childhood diarrhea and respiratory disease in rural Bangladesh. Soc Sci Med 75:604-611.
• International Initiaitve for Impact Evaluaiton: Guidelines on Measuring Toilet Use, 2017 • Lewis HE, Greenland K, Curtis V, Schmidt WP. Am J Trop Med Hyg. 2018 Aug 13. doi:
10.4269/ajtmh.18-0187. [Epub ahead of print]Effect of a School-Based Hygiene Behavior Change Campaign on Handwashing with Soap in Bihar, India: Cluster-Randomized Trial.
• Luby, S., 2014. Is targeting access to sanitation enough? The Lancet Global Health, 2(11), pp.e619–e620.
• McCarthy, J., 2014. How a lack of toilet’s puts India’s women at risk of assault. Npr, pp.1–7. • Ministry of Drinking Water and Sanitation, 2014. Swachh Bharat Mission-Gramin. • Ministry of Drinking Water and Sanitation, 2019. Swachh Bharat Mission (Gramin) Dashboard.
Swachh Bharat Mission Portal. • Mohanty, S. & Satyasai, K.J., Feeling the pulse: Indian pulses sector. , 10. • Moore, G.F. et al., 2015. Process evaluation of complex interventions: Medical Research
Council guidance. Bmj, 350(mar19 6), pp.h1258–h1258. • NSSO, 2016. Swachhta Status Report 2016. , pp.1–104. • Patil SR, Arnold BF, Salvatore AL, Briceno B, Ganguly S, Colford JM, Jr., et al. The effect of
India's total sanitation campaign on defecation behaviors and child health in rural Madhya Pradesh: a cluster randomized controlled trial. PLoS Med. 2014; 11(8): e1001709.
• Pickering AJ, Djebbari H, Lopez C, Coulibaly M, Alzua ML. Effect of a community-led sanitation intervention on child diarrhoea and child growth in rural Mali: a cluster-randomised controlled trial. Lancet Glob Health. 2015 Nov;3(11):e701-11.
• Routray P, Torondel B, Jenkins MW, Clasen T, Schmidt WP. Processes and challenges of community mobilisation for latrine promotion under Nirmal Bharat Abhiyan in rural Odisha, India. BMC Public Health. 2017 May 16;17(1):453.
• Schmidt, W.P., 2015. Seven trials, seven question marks. The Lancet Global Health, 3(11), pp.e659–e660.
• Tidwell, James B, Jenala Chipungu, Samuel Bosomprah, Valerie Curtis, Robert Aunger, and Roma Chilengi. in press. “Effect of a behaviour-change intervention on peri-urban sanitation quality in Lusaka, Zambia: a randomized, controlled trial.” Lancet Global Health
• UNICEF, W.J. 2015, Progress_on_Sanitation_and_Drinking_Water_2015_Update_.pdf. • Water, D. & Audit, S.P., 2015. Total Sanitation Campaign / Nirmal Bharat Abhiyan lQ + kbZ esa
HkykbZ. , 2015(28). • World Health Organization, UNICEF & FAO, 2012. Communication for Behavioural Impact

60
(Combi). Communication for Behavioural Impact (Combi), pp.3–14. • World Health Organizaton, 2015. Improving nutrition outcomes with better water, sanitation and
hygiene: Improving Nutrition with Better WASH.

61
ANNEX 1: EVIDENCE FROM PAST TRIALS Title Design Intervention Outcome Measures Results
Promoting Handwashing and Sanitation:
Evidence from a Large-Scale Randomized Trial
in Rural Tanzania
(Briceno et al. 2015)
A cluster randomized trial
135 intervention and 46 control wards (181 rural wards) of 10 districts of Tanzania.
Follow up survey in 3,619 households and 5,768 children under five
1. Handwashing intervention alone: training of community activists, direct consumer contact through road shows, mass-media campaigns and promotional activities, and technical assistance to build handwashing stations with local materials.
2. Sanitation intervention alone: Community Led Total Sanitation (CLTS) triggering events followed by the creation of a village sanitation committee in charge of ensuring sustained behaviour change, train local masons in toilet construction and marketing.
3. Both interventions 4. No intervention (control)
• Access to improved toilet
• Open defecation • Caregiver
handwashing practice
• Diarrhoea • Anaemia • Anthropometry
Coverage: Toilet ownership increased from 50% to 65%; Self-reported OD decreased from 23 % to 11% in sanitation promotion only wards.
Handwashing: Marginal improvements in handwashing behaviour related to food preparation but not at other critical junctures in handwashing promotion only wards.
No detectable interaction effects for the combined intervention.
Health effects: Final effects on child health measured through diarrhoea, anaemia, stunting and wasting were absent in all treatment groups
Impact Evaluation of a Large-Scale
Rural Sanitation
A cluster randomised trial
1. Community Led Total Sanitation (CLTS) and Behaviour Change Communication (BCC) Campaign
Changes in perceptions of consequences of poor sanitation;
Coverage: Moderate effect in rate of toilet construction 4% points higher for households residing in treatment districts compared to the control group.
Self-reported OD: Decreased 6% point in treatment communities among

62
Title Design Intervention Outcome Measures Results
Project in Indonesia
(Cameron et al. 2013)
10 villages per arm in 29 rural districts of East Java
2. Strengthening the Supply of Affordable Toilets and Services for households
3. Strengthening enabling environment by improving implementation capacity, supporting methodology and policy level engagement.
Toilet construction and access to improved sanitation;
Reduction in open defecation);
Child health outcomes: diarrhoea prevalence, intestinal parasite infections, stunting and wasting, iron deficiency anaemia and cognitive and motor development.
households that had no sanitation at baseline
Health effects: Diarrhoea prevalence (7-day and 2-day recall) lowered by 1 percentage points from 5 percentage points among communities receiving the intervention (largely by non-poor households that did not have adequate sanitation facilities at the beginning of the project).
Instance of parasitic infection in treatment communities was lower, as was the instance of refusal to eat and instance of blood or mucous in stool.
Effect of a community-led sanitation intervention on child
diarrhoea and child growth in rural Mali: a cluster-randomised
controlled trial.
A cluster randomised trial in 121 villages
CLTS intervention implemented by Government of Mali including triggering sessions / community mobilisation and toilet designs built with local and available materials encouraged.
Diarrhoea (primary outcome),
Height for age, weight for age, stunting, and underweight among children younger than 5 years.
Coverage: Access to private toilets was almost twice as high in intervention villages [65%] compared to [35%] and reported open defecation was reduced in female [9%] from [33%] and in male [10%] to [33%].
Self-reported open defecation: Decreased by 23% points among adult women (71% reduction), by 24 percentage points (71%) among adult men, by 43% points (49%) among children aged 5–10 years, and by 43 percentage points (51%) among children younger than 5 years. Of those

63
Title Design Intervention Outcome Measures Results
(Pickering et al. 2015)
households with access to a private toilet (2034 [50%] of 4031 households), 1972 (98%) of 2018 households reported the toilet as the prime defecation location for female adults and 1915 (98%) of 1960 households reported the toilet as the prime defecation location for adult males.
Health effects: No differences were observed in terms of diarrhoeal prevalence among children in CLTS [22%] and control [24%] villages.
Children in CLTS villages were taller (0·18 increase in height-for-age Z score) and less likely to be stunted (35% vs 41%, PR 0·86, 95% CI 0·74–1·0) than children in control villages. 22% of children were underweight in CLTS compared with 26% in control villages (PR 0·88, 95% CI 0·71–1·08), and the difference in mean weight-for-age Z score was 0·09 (95% CI –0·04 to 0·22) between groups.
The Effect of India’s Total Sanitation Campaign on
A cluster-randomized, controlled trial in 80 rural villages.
Total Sanitation Campaign (TSC) implemented with a
concurrent program named
Nirmal Vatika (Clean House) to provide additional financial and material subsidies to households.
Measure the effect of the TSC on availability of individual household toilets (IHLs)
Coverage: Increase in percentage of households with improved sanitation facilities by an average of 19% (95% CI for difference: 12%–26%; group means: 22% control versus 41% intervention)
Self-reported OD: Decreased among adults by an average of 10% (95% CI for

64
Title Design Intervention Outcome Measures Results
Defecation Behaviours and Child Health in Rural Madhya
Pradesh: A Cluster Randomized Controlled Trial
(Patil et al. 2015)
TSC involved a series of community ‘‘triggering’’ exercises, highlighting the magnitude of the practice of open defecation, elicit shame and disgust, and mobilize community action to end open defecation. This was followed by community follow-up actions that are supported by facilitators.
Defecation behaviours, and
Child health (diarrhoea, highly credible gastrointestinal illness [HCGI], parasitic infections, anaemia, growth).
difference: 4%–15%; group means: 73% intervention versus 84% control).
Health effects: However, the intervention did not improve child health measured in terms of multiple health outcomes.
Village
sanitation
and child
health: Effects and external
validity in a
randomized
field experiment
in rural India
A randomized controlled trial of community sanitation in 30 villages of District Ahmednagar, Maharashtra
TSC implemented by government of Maharashtra with support from the World Bank.
1. Subsidised construction of toilets
2. Village level sanitation motivation by representatives
Effect of rural sanitation on child health outcomes
Health effects: The study found an effect of approximately 0.3 height-for-age standard deviations.

65
Title Design Intervention Outcome Measures Results
(Hammer & Spears 2013)
Effectiveness of a rural sanitation programme on diarrhoea,
soil-transmitted helminth infection, and child malnutrition in Odisha, India: a cluster-randomised trial.
(Clasen et al. 2014)
A cluster-randomised controlled trial in 100 rural villages in Odisha, India.
Toilet promotion and construction or to receive no intervention (control).
The intervention consisted of toilet promotion and construction, in accordance with the Government of
India’s Total Sanitation Campaign, which combines social mobilisation with a post-hoc subsidy.
The primary endpoint was 7-day prevalence of reported diarrhoea in children younger than 5 years.
Coverage: Mean village-level toilet coverage increased from 9% of households to 63%, compared with an increase from 8% to 12% in control villages.
Toilet use: Nearly five times higher for women than for men or children (indicators include smell of faeces, wet pan except when rainy, stain from faeces or urine, presence of soap, presence of water bucket or can, presence of a broom or brush for cleaning, or presence of slippers).
Health effects: 7-day prevalence of reported diarrhoea in children younger than 5 years was 8·8% in the intervention group and 9·1% in the control group (period prevalence ratio 0·97, 95% CI 0·83–1·12). 162 participants died in the intervention group (11 children younger than 5 years) and 151 died in the control group (13 children younger than 5 years).
Role of flies and provision of
Cluster-randomised
controlled trial
Intervention groups included
1. Treatment: Regular insecticide spraying or
Primary outcomes were fly-eye contact
Health effects: Number of Musca sorbens flies caught from children’s eyes was reduced by 88% (95% CI 64–100;
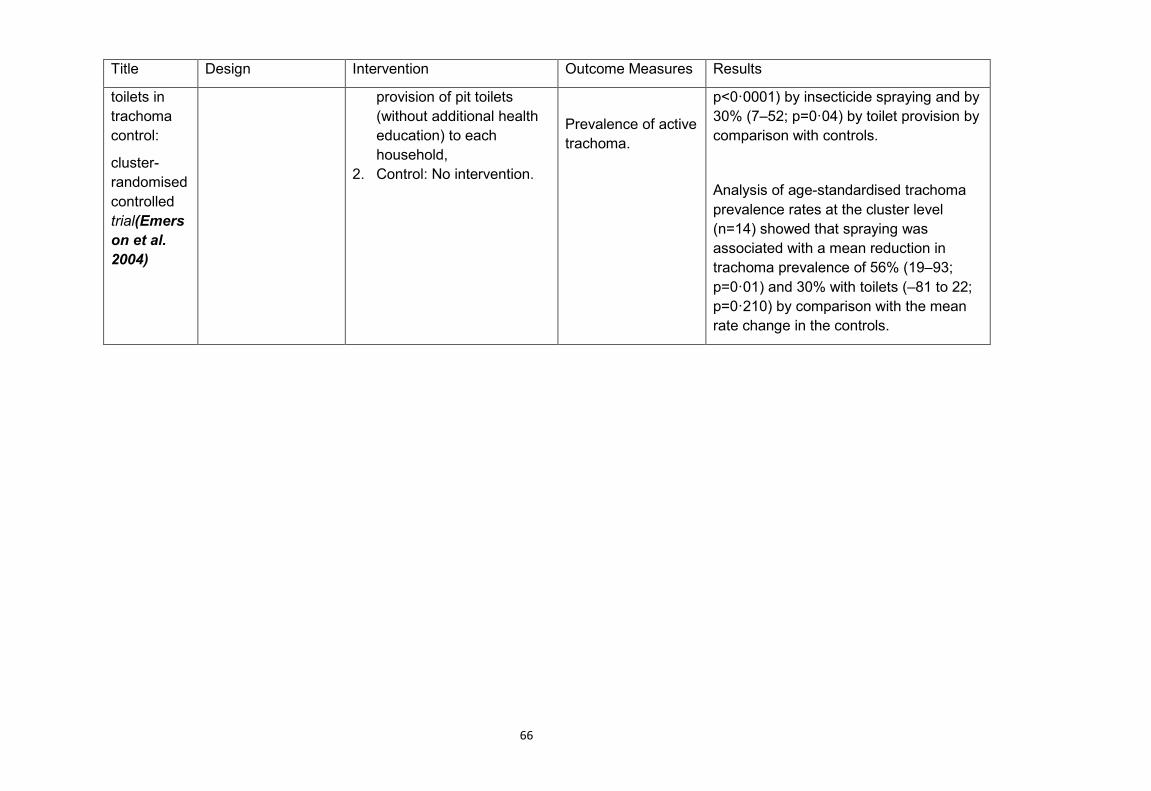
66
Title Design Intervention Outcome Measures Results
toilets in trachoma control:
cluster-randomised controlled trial(Emerson et al. 2004)
provision of pit toilets (without additional health education) to each household,
2. Control: No intervention.
Prevalence of active trachoma.
p<0·0001) by insecticide spraying and by 30% (7–52; p=0·04) by toilet provision by comparison with controls.
Analysis of age-standardised trachoma prevalence rates at the cluster level (n=14) showed that spraying was associated with a mean reduction in trachoma prevalence of 56% (19–93; p=0·01) and 30% with toilets (–81 to 22; p=0·210) by comparison with the mean rate change in the controls.

67
ANNEX 2: FINDINGS OF FORMATIVE RESEARCH The villages had high toilet coverage. Most households have built a single pit toilet and some households have built double pit toilets. The SBM provided a fillip to toilet construction; as a result, many new toilets have been built since 2014. However, these new toilets were small, cheaply constructed, sometimes dysfunctional and were accepted because they were provided free of charge (apart from some labour contribution). A large number of people still defecate in the open. Reasons include: Lack of orientation on toilet use: People were not given information on the toilet design, and use. As a result, there are anxieties around pit filling, water required for toilet use, design etc.
Incomplete construction: Some contractor-built toilet are incomplete. They may not have one of the following: Pit, Roof, Toilet Seat and Door. This makes the toilet unusable.
Uncomfortable, unattractive: Current toilets are often uncomfortable to use (e.g. ‘packed’ feeling) and are unattractive (e.g. unpainted walls). This is a disincentive to use the toilet.
Irregular water supply: Despite households now all having access to pied water, supply is limited – sometimes half an hour to an hour on alternative days, with low pressure. The water is saved in multiple containers and used carefully. As with pits, the relationship with water is to ‘hoard’. Water for toilets may therefore only be allowed for only those who really need it.
Pit emptying: People overestimate the duration of pit filling – they expect the pit to get filled in 6 months – 2 years, for a pit that will take 5 years to fill. People’s relationship with pit is one of ‘hoarding space’ as people, especially men, are anxious that it would get filled if they were to use it regularly. People are unsure of how pit can be emptied once it is full. There are possible caste associations with emptying. As a result, some families end up building large pits so that they don’t have to empty for long. Many think that there must be services with the Government sanitation workers (‘Safai Karamchari’) who can do the job, but are not sure about it. Some (Muslims) were open to emptying it themselves or look at digging a new pit.
Seasonality: On one hand toilet use is preferred during monsoon season as OD spots are often waterlogged and not safe to use. At the same time, people fear that during monsoons pit will get filled quicker due to water table.
Lack of engagement: Men have little engagement with contractor-built toilets, having been not involved or consulted about location or design.
Comfort/Convenience: Much behaviour around OD/Toilet usage is driven by convenience. For example, kids and workers may save time in the morning, waiting for the dark results in discomfort of holding. However, as with most new products – the problems of not having a toilet and the benefits of having one are not so obvious until people have decided to try to use it themselves.
Disgust: The idea of using toilets as ‘good habits’ most likely stems from the fact that going outside is ‘disgusting’. However, disgust doesn’t seem to be a strong driver of usage by itself.

68
ANNEX 3: THE 5 STAR TOILET CAMPAIGN’S DESIGN PROCESS INVOLVED A DOUBLE DIAMOND CONCEPT The 5 Star Toilet campaign design used a triple diamond approach (adapted from the Double Diamond concept of the British Design Council) which maps the divergent stages (of possible ideas that are created) and convergent stages (of refining and narrowing down of the best ideas). This figure and the figure on the next page shows the different modes of thinking that were used to develop the intervention. We started with a limited set of ideas to which more ideas were added based on review of evidence and experience. In a framing workshop, these ideas were narrowed down and new questions for research were listed. This was followed by formative research which threw new set of ideas. These were further discussed in a creative workshop and finally led to the identification of core motives for the campaign on which the intervention was based. This process did not stop at this level as the ideas were further executed in the field and the best ones were included in the final campaign design. A creative workshop was held to prioritise and rank ideas (by relevance, richness, power to change behaviour, to shape desired behaviours, novelty and acceptability). We again organised these factors using the BCD checklist and insights were assessed on a scale of relevance (high to low) i.e. how important is this insight to the target audience? and strength (high to low) i.e. how strong is the logic that links the insight to the target behaviour? This helped us to prioritise them, narrowing the drivers to the motives of Status, Create, Convenience, Affiliation, and Hoard, as well as Transition to a new habit.

69

70
ANNEX 4: THE SMART TOILET CAMPAIGN- THEORY OF CHANGE

ANNEX 5 Table: Day 1 event attendance and activities
1 Total Nos of Street Events 134 2 Attendance (Male) 1230 Attendance (female) 843 Attendance (children) 1130 3 Evening events 47 Attendance (Male) 2213 Attendance (Female) 1419 Attendance (Children) 1230 4 Nos of families identified having a five star toilets 362 5 Nos of families enrolled for having 5 star toilet 718 6 Nos of families did the changes for having 5 star toilet 127
Table: Day 2 event attendance and activities
1 Total Nos of Video Recording Done of 5 star toilet 199 2 Attendance (Male) 112 Attendance (Female) 39 Attendance (Children) 48 3 Evening events 47 Attendance (Male) 1855 Attendance (Female) 960 Attendance (Children) 1581 4 Number of families included in “Smart Toilet Board” 693 5 Nos of additional families did the changes for having 5
star toilet 50

ANNEX 6: PRE ANALYSIS PLAN
1. Intervention
1.1. Theoretical framework
Vaparshun! used the Behaviour Centred Design (BCD) framework and theory of change (ToC) to design its intervention (Aunger & Curtis 2016). BCD has provided guidance to the design and delivery of successful behaviour change interventions in India for handwashing with soap (Biran et al. 2014), ORS use in Zambia (Greenland et al. 2017), food hygiene in Nepal (Gautam et al. 2017), infant feeding behaviour in Indonesia (White, Schmidt, et al. 2016), sanitation promotion in Tanzania, post-operative exercise Ireland (Doyle 2015) and has also been applied to the marketing of sanitation and hygiene products (clients include Kimberly Clarke, GoJo and Unilever).
BCD is a logical and comprehensive approach to designing and evaluating behaviour change programmes (Aunger & Curtis 2016). This model, derived from reinforcement learning theory (Sutton & Barto 2017), develops a fundamental taxonomy of needs based in evolutionary biology, shows how the disruption of ‘behaviour settings’ is key, and sets out the steps involved in programming for behaviour change. In addition, it provides means of identifying the levers to change behaviour, provides guidance for intervention and tool design process for creating, delivering and measuring behaviour change programmes (Aunger & Curtis 2015). Thus, a BCD ToC indicates how an intervention aims to change the environment of the target population, how exposure to this environmental change influences the psychology of those in the target population, and how this prompts them to change their behaviour (which, in turn, impacts health and well-being). The intervention has to initiate this cascade of changes by providing activities that are surprising, cause revaluation of the target behaviour and affect the performance of the behaviour in its setting.
Vaparshun! intervention aims to inspire the target audience to revalue their toilets by recognizing that they provide benefits associated with the motives of hoard, create, convenience (comfort) and affiliation, and provide a reward pathway for transitioning to a new toilet use routine (please see Figure 1).
1.2. Intervention summary
Vaparshun! is using the BCD framework and ToC (Please see Figure 1) to design its intervention. Figure 1: Vaparshun! Theory of Change

Our intervention consists of four different streams of activity, each of which has its own logic in the ToC (see Figure 1). The outcome is that family members and men improve and use their contractor-built toilets. 1. Create Motive: Toilet Makeover: Conduct a lottery and perform makeovers of select government built toilets in the village, with the involvement of the community. Demonstrate improvements in comfort (light, space, ventilation, latrine chair/handle) and aesthetics (stencil painting of door and walls). Challenge/Opportunity: Many of the ‘contractor’ toilets are built with low engagement from family members and are uncomfortable to use. People are left with toilets they are not proud of or engaged with. Insight (from ‘makeover’ trial): If families invest in creating an attractive toilet they are be more likely adopt and use them. Inputs: Materials for the physical and aesthetic improvement of a toilet, manuals for conducting the community event. Outputs: Greater engagement with, and pride in, the toilet after makeover; others in the village inspired to conduct their own makeover. Those who use the upgraded toilet find it a more comfortable experience than they had expected causing reinforcement learning. 2. Hoard motive: Pit Emptying Demo and Pit Filling Estimation Demo” A community event-based experience of the ‘real’ aspects related to pit filling/emptying designed to graphically overcome their perceptual barriers (e.g., squeezing a watermelon to show how little material there is in faeces).
Challenge/Opportunity: People over-estimate the speed at which a pit fills and are uncertain about the emptying process. Therefore they hoard the ‘limited’ pit space by using the toilet only partially.

Insight from FR: There are gaps between perception and reality which can be addressed. For example; water doesn’t stay in the pit but seeps into the soil, faeces are composed mainly of water, decomposition reduces volume, compost doesn’t smell and twin pits can be used interchangeably forever. Inputs: Scripts for ‘emo-demos’ (emotional demonstrations). Outputs: Participants are less anxious about pit filling and emptying. 3. Affiliation/convenience motives: Community Motivational Events: Small and large community events such as street plays, films, posters and pledging activities to bring alive convenience/comfort motives by amplifying problems associated with OD and rewards of using toilets; use of affiliation through testimonials films, posters, village maps, etc.
Challenge/Opportunity: Even if the barriers around pits and toilet comfort are addressed, it may still not be enough to motivate men with entrenched habits of OD to start using toilets. Insights: Convenience/comfort can be a powerful drive for toilet usage. Those who use toilets in the village (women, children and elderly) find it is much more convenient and therefore do not return to OD. However, men who are non-users may not have experienced this and need to be convinced. Affiliation can be another strong drive for toilet usage. It is possible to exploit the emerging norms of toilet use and encourage men ‘not to be left behind’. Inputs: Scripts, props, invitations, loud hailers, audio-visual equipment, etc. Outputs: Men use toilets because they ‘get’ how convenient they are, and so as not to be ‘left behind’. 4. Transition Nudge This would include incentives for usage and/or environmental or audio-visual nudges to support initialization of toilet use and habit formation. Every household can participate in the game. Those who have used the toilet 100% enter into a lottery to win. There is no cash incentive. The gifts would be either for adults (e.g. mobile phone) or children (e.g. bicycle). Every household can participate in the game. Those who have used the toilet 100% enter into a lottery to win. There is no cash. The gifts would be either for adults (e.g. mobile phone) or children (e.g. bicycle). Challenge/Opportunity: Those who use toilets for a specific period tend to stick with the habit; however, some people, especially men, do not try out the toilet or find the first experience unpleasant. Insight: Reward the use of toilets for a specific period so new habits can form. Inputs: Stimuli and nudges. Outputs: The entire family, especially men, form the habit of using a toilet. In addition, village authorities will also be recruited to support delivery of the intervention.
2. Evaluation Questions and Hypotheses
2.1. What are the main evaluation question(s) the study seeks to answer?
Outcome Evaluation

1. How far can an innovative theory-based, scalable intervention improve toilet use behaviour of all family members amongst households with government/contractor-built toilets in areas of high coverage in rural Gujarat? (Primary outcome)
2. How much can the intervention affect toilet use in men? 3. How comparable are the study methods used (survey, sticker diaries and structured
observations)?
Process Evaluation 4. Which components worked or did not work as expected according to the Theory of
Change (ToC), and where did unexpected consequences arise? (Process evaluation)
Based on the formative research, we found that HHs with a government built toilet were less likely to use their toilets regularly. However, HHs with self-built toilet had better quality construction and features. They were also more likely to use it regularly. Therefore, we aim to focus on HHs with contractor built/government built toilets. 2.2. What are the hypotheses to be tested throughout the causal chain?
The proposed intervention aims to inspire the target audience to revalue their toilets by recognizing that they provide benefits associated with the motives of hoard, create, convenience (comfort) and affiliation, and provide a reward pathway for transitioning to a new toilet use routine. Hypothesis: Vaparshun! uses the Behaviour Centred Design (BCD) framework and theory of change (ToC) to design its intervention (Aunger & Curtis 2016). Vaparshun’s theory of change consists of four different streams of activity, each of which has its own logic in the ToC (see Figure). The outcome is that family members and men will improve and use their contractor-built toilets, as measured by follow up evaluation 2 months post-intervention delivery. The intervention components of toilet makeover demonstration, pit emptying demonstration, community motivational events to create new social norms and transition nudges aiming to change the environment of the target population by inspiring them to revalue their toilets by recognizing that they provide benefits associated with the motives of hoard, create, convenience (comfort) and affiliation, and provide a reward pathway for transitioning to a new toilet use routine, which we hope households will continue to practice. Our assumption is that exposure to this environmental change will influence the psychology of those in the target population (all members in a household, especially men) to value their toilets, to modify their government built toilets (by making changes to the infrastructure, making toilets beautiful by painting the walls and installing features like handle, ventilation, light, toilet chair for disabled or old people etc. that enhance the user experience). This will prompt them to change their behaviour from open defecation to using their contractor built toilets (which, in turn, may impact health and well-being in the long term). The intervention will initiate a cascade of changes by providing activities that are surprising, cause revaluation of the target behaviour and affect the performance of the behaviour in its setting. As the intervention will be delivered at cluster level a cluster randomised trial is the most suitable study design. The intervention to be studied will be delivered to and affect households with contractor built toilets, rather than individuals. Since people within a cluster are more likely to be similar, the outcome for each participant cannot be assumed to be independent of that for any other participant. The CRT will be an assessment of a complex intervention (addressing the complex determinants of low toilet use through activities delivered at cluster level), with the

analyses of endpoints measuring multiple behaviours. The intervention will not measure health outcomes. Primary hypothesis: • An innovative theory-based, behavioural intervention can improve toilet use amongst
households with government/ contractor-built toilets in high coverage areas of rural Gujarat. Toilet use for the primary outcome is defined as the proportion of households where all members use the toilet (the last time they defecate), measured through self-report or as reported by the questionnaire respondent on behalf of other members. We will use the 3ie standardised questionnaire to measure this outcome.
Secondary hypothesis: • The intervention increases toilet use among household members as observed through
structured observation and the newly developed sticker diary methodology. • The intervention increases toilet use among men as observed through structured
observation and the newly developed sticker diary methodology. • The exposure to intervention (toilet makeover, emo-demo’s and community events targeted
at men) will exposure to our intervention will lead people to valuing their toilets and adoption of improved practices and use (less anxiety around pit filling (hoard), recognizing that they provide benefits associated with the motives create, convenience (comfort) and affiliation (pathways to change). Measured through questionnaire survey, structured observations and newly developed sticker diary methodology.
3. Sampling
3.1. Sampling frame
Sampling frame for the Census and Baseline will be the 2011 Census. The target enrolment for each of the clusters will be (45 control and 45 intervention) will be 30 HHs per cluster. Only one individual per HHs will be sampled for recruitment. Eligibility criteria for participation in the survey included: resides in the home is above 18 years of age per confirmed date of birth. Written informed consent will be obtained from all participants in the survey and will be offered in the local language Gujarati. The survey will be interviewer-administered in Gujarati using a tablet in which the interviewer will directly enter responses into a tablet. The CRT will involve three blocks (taluks) of Bhavnagar district in Gujarat. Baseline data will be collected from randomly selected eligible households in identified clusters of Bhavnagar, Gujarat. Bhavnagar has relatively high rates of toilet coverage but also high rates of non-use of toilets (particularly by men, and particularly with respect to contractor-built toilets). Bhavnagar is typical of rural India in many respects with high levels of agricultural production alongside the rapid growth of industry (for example onion processing, ship-breaking and diamond polishing). It will happen in the context of existing Government efforts to improve sanitation coverage. The eligible population for the study is households that have functional latrines (defined by having a pit, pan, and pipe connecting the two). Information will be collected on sanitation coverage and health indicators etc. through Census. As of now, all districts in Gujarat have been declared ODF. However, as per our formative research and discussion with partners working in the field, not all toilets built by the government support are being used and in some villages even if toilets are sanctioned by the government but the construction is pending, villages were declared ODF.

3.1.1. Please list any additional inclusion and/or exclusion criteria for the eligible population.
Government built/ contractor built functional latrine (defined by having a pit, pan, and pipe connecting the two).
3.1.2. What are the main characteristics of your population?
The CRT will involve three blocks (taluks) of Bhavnagar district in Gujarat. In 2011, Bhavnagar had population of 2,880,365 of which male and female were 1,490,201 and 1,390,164 respectively. Average literacy rate of Bhavnagar in 2011 were 75% compared to 66% of 2001. Male and female literacy were 84% and 66% respectively. Total literate in Bhavnagar District were 1,887,255 of which male and female were 1,087,371 and 799,884 respectively. In 2011 census, child sex ratio is 891 girls per 1000 boys. More than 91 % of the population is Hindu, followed by 7% Muslims and remaining population includes Jain, Buddhist, Christian and Sikhs. Bhavnagar has relatively high rates of toilet coverage but also high rates of non-use of toilets (particularly by men, and particularly with respect to contractor-built toilets). Bhavnagar is typical of rural India in many respects with high levels of agricultural production alongside the rapid growth of industry (for example onion processing, ship-breaking and diamond polishing).
3.1.3. What is the expected sample size?
30 HHs per cluster in 45 treatment and 45 control clusters. Clusters are defined as villages. The study uses the Census definition of household i.e. a ‘household’ is a group of persons related or unrelated or a mix of both, who normally live together and take their meals from a common kitchen, unless the exigencies of work prevent any of them from doing so. However, if a group of unrelated persons live in a Census house but do not take their meals from the common kitchen, then they are not constituent of a common household.
3.1.4. Is there any reason to believe that the sample differs from the population? If so, how
does it differ?
Sample will be HHs with a government built/ contractor built latrine.
Clusters in this study are defined as villages (with up to 200-300 HHs) with high toilet coverage (>75%). In larger villages (>300 HH), consisting of several hamlets (smaller settlements, usually a sub-division of a village) which are spread out, only one hamlet with high contractor built toilet coverage will be randomly selected for intervention and evaluation. All households in the clusters are eligible for participation. Clusters with high toilet coverage i.e. >75%. Households’ within these clusters may include HHs with (government built and self-built) or without toilets. The study uses the Census definition of household i.e. a ‘household’ is a group of persons related or unrelated or a mix of both, who normally live together and take their meals from a common kitchen, unless the exigencies of work prevent any of them from doing so. However, if a group of unrelated persons live in a Census house but do not take their meals from the common kitchen, then they are not constituent of a common household. Households will be recruited based on study selection criteria which includes a shared kitchen, having a government built/ contractor built, functional latrine. A functional latrine includes having 1) a pan that is not broken, and 2) a functional connection to a pit (single or twin pits) that exists. This is a subset of the total population living in the area, as the latter also includes households

that built toilets on their own initiative without external funding/support and households that do not have any toilet access.
3.1.5. Please describe the anticipated subgroups, which will be studied, if relevant. For quantitative sub-group analysis, please explain how you are powered to do so. If you intend to conduct qualitative sub-group analysis, please clarify how you will do this.
Latrine use among men will be studied in sub-group analysis. This is because during formative phase this group was found to be most reluctant to use a toilet. The power of this analysis depends on the proportion of households with male inhabitants, and the proportion of households where some males do not use the latrine. This is difficult to anticipate at this stage. Power may be only slightly lower than the main analysis as most households will have male members, and men among the household members are most likely not to use the latrine. Note: Since behaviour change interventions require village-level clustering to prevent spillovers, studies will likely not be adequately powered to conduct subgroup analysis, and subgroup analysis is not expected. Proposals to do subgroup analysis should be accompanied by an explanation of how studies will be able to detect differences between subgroups.
3.2. Statistical power
3.2.1. What is the effect size that you will be able to detect?
For our sample size calculation we assume that 65% of households with a government supported latrine will be using this latrine consistently. This figure is based on our formative research that found that about 44% of households have members who go for open defecation. We expect full-use households to increase to 75% after the intervention, which is an effect size of public health interest. Using a sample size formula for the comparison of two proportions results in 349 households per arm to detect this difference with 80% power and an alpha of 0.05. Assuming an ICC of 0.1 results in relatively large design effects, which means that sampling many households in a single village will be inefficient. We are choosing 30 households per cluster as enrolling more than that only marginally reduces the number of required clusters. As a result, we will enrol 45 villages per arm, and 30 households per village at a design effect of 3.9.
3.2.1.1. What are your assumptions about your alpha level?
0.05
3.2.1.2. What are your assumptions about your statistical power?
80%
3.2.1.3. What are your assumptions about variability in your effect size? The effect size will be
relative to the variability in the population and sample. Practically, this is a justification of your chosen intra-cluster correlation coefficient and standard deviation. You may consider presenting references to previous literature (including rice’s work) in support of this point.
Our outcomes are binary hence there is no requirement of specifying a standard deviation. We chose the ICC based on our data on reported latrine use from the Orissa trial. The ICC in that trial was 0.106. These data are unpublished to date but we are happy to share them if needed.

3.2.1.4. How many clusters will you have?
There are 90 clusters for outcome evaluation i.e. 45 clusters in intervention arm and 45 clusters in control arm.
3.2.1.5. How many people will you have in each cluster?
We will have 30 HHs per cluster in each intervention and control arms (a total of 2700 HHs).
3.2.1.6. How sensitive is your effect size to changes in your parameters?
The sample size is sensitive to changes in the ICC. A lower effect size would also lead to a larger sample size but we agree a lower effect size would be of little public health relevance and is hence not accounted for.
3.2.2. If you plan to include covariates in your analysis, what share of variance do you expect
to predict with your co-variates? Note: It is not required that you include covariates
NA.
3.3. Assignment to treatment
3.3.1. How will individuals be assigned to treatment and control conditions? Please list the characteristics and justification on which you will match the clusters?
We currently favour stratified randomisation with strata chosen based on variables deemed predictive of the outcome, or identified as such in the baseline survey. Most likely we will randomise within 5-10 strata of village level toilet coverage (depending on the distribution of this indicator). We may add substrata of a socio-economic / socio-demographic summary indicator and randomise within. In addition we may reject randomisations where a relevant number of intervention villages is within 3km of a control village. Pair matching remains an option but we do not currently see a need for it. The final decision will be made based on the census and baseline data. Matching / stratifying variables may include for example, population density, toilet coverage (government/contractor built toilets), level of education, and the number of different sub-castes/ communities (size of schedule caste community vs to other backward classes vs general category).
3.3.2. How will you check that individuals in the treatment condition received treatment as anticipated?
A detailed process evaluation, following the theory of change will be conducted. Activity logs will be checked as well.
4. Data Collection
4.1. Primary data collection instruments 4.1.1. What data collection instruments will you employ for quantitative and qualitative analysis?
Quantitative methods (Outcome evaluation)
• Sticker Diaries (30 HHs per cluster in 90 clusters) • Structured Observations (200 HHs per intervention arm i.e. 400 HHs in total)

• Survey questionnaire ( 30 HHs per cluster in 90 clusters)
Qualitative methods (Process evaluation)
• Field observations • Semi structured interviews • Focus group discussions
4.1.2. What is the hypothesised list of interviewees (i.e. key actors who will be interviewed,
anticipated interview formats and expected number of respondents)? You may wish to present this information in a table.
Instrument Respondent No. Survey Head of the household or an
elder member of the household. Caretakers of children under 7 years would be interviewed and each present member of the HH will be asked questions about his/her defecation behaviour.
Baseline: 10 HHs per cluster in intervention and control arms Outcome:30 HHs per cluster in intervention and control arms
Sticker diaries One member only per HH (men/ women)
30 HHs per cluster in intervention and control arms
Structured observations Observations only 400 observations (200 per study arm) Structured observations will be conducted on all members present in the household.
In-depth interviews Implementation team, village leaders and representatives of the target population (men/women)
20 interviews
Focus Group Discussions Representatives of intervention recipients
12 focus group discussions
Field observations 5 per intervention component
20 field observations of intervention events. This involves observation of how intervention is being delivered, response and engagement of participants and their reaction.
4.1.3. What (groups of) indicators will each instrument cover?
Instrument (Outcome Evaluation)
Indicator
Survey Primary outcome and sub group analysis Sticker diaries Primary outcome and sub group analysis Structured observations Primary and sub group analysis Instrument (Process Evaluation)
Information to be obtained.
In-depth interviews Recruitment strategies, ffidelity, dose, pathways to change

Focus Group Discussions Pathways to change, Reception- participant engagement and acceptability and participant response
Field observations Recruitment strategies, ffidelity, dose We will use structured observations and sticker diaries to assess how comparable are the study methods used (survey, sticker diaries and structured observations)
Outcome Indicator Definition Measurement Households with contractor-built toilets in intervention clusters report toilet use by all family members during the last time they defecated and in the last 24 hours
Post intervention reported use of HH toilets by members of household Number of members in a household that report toilet use (during all times in last 24 hours and the last time they defecated) compared with total number of members in a household.
Members in a household that report toilet use during last time they defecated. This will be self-reported using a standardised questionnaire (in a household roster for each household member individually in households that own government/ contractor built toilets) for all members in a household. In case members are not present, other family members or the primary respondent will be asked about where the person defecated last time. Mothers will be asked about the defecation behaviour of younger children. Information about all members in a household will be obtained.
Assessed 2 months after intervention delivery. 3ie prescribed Survey questionnaire (30 HHs per cluster in 90 clusters)

Table 1: Process evaluation dimensions Component Questions Intervention Method Data to be collected Phase # Clusters Data Analysis Objective 1: To understand the context and participant recruitment process: Context Elements of physical (location, staff skills, resources), social (culture, caste) and political environment (existing programs, elections) that may directly/indirectly affect the intervention delivery and assess generalisability
What contextual factors (coverage of toilets,existing programs, availability of men to participate in intervention) in Bhavnagar enabled or impeded the implementation of intervention in the setting? How did it affect the delivery of intervention? What was done to address those factors (mid-course corrections)?
All four components
Review of project reports Interviews with implementers
Key features of clusters, ongoing activities in those clusters, data on delivery and receipt in those clusters. Variables include influence of external programmes, secular trends in related behaviours etc.
Through intervention lifecycle
4 clusters and overall experience from select clusters
Description of the context External and internal influence or contanimation if any.
Recruitment Enrolment or mobilisatio of participants into the intervention activities.
How were participants recruited for each intervention component? Did it affect the reach? Which sub group of individuals were more or less likely to be recruited?
All four components
Semi structured interviews Implementation reports Field observations Routine data
Steps taken to recruit participants, challenges faced if any and how were they addressed Patterns of reach
Inception phase of the intervention and 2 week post intervention delivery phase
2 intervention clusters
Description of activity areas, participnt selection, recruitment and mobilization strategy

Component Questions Intervention Method Data to be collected Phase # Clusters Data Analysis Why? Was the recruitment process consistently appied across all clusters?
Objective 2: To understand the factors that affected implementation of the intervention: Fidelity Adhering to protocol of intervention delivery and competency to deliver the intervention by implementers
How (structure, sequence and content of 4 intervention activitie- toilet makeover, emo-demo, community events, transition nudges) and what was the quality of intervention delivered as compared to intended plan? Did it depart from what was originally intended? If yes, how and what explains it?
All four components
Routine data from implementing partner Observations Semi structured interviews Implementation reports Field observations
Nuber and type of interventions delivered Checklist and creative partner’s (Upward Spiral) perspective on content delivery Success and challenges faced by implementers Participant perspectives on the content and quality of intervention activities Any deviations from planned activities? Reasons?
Beginning and midway
All 90 clusters 2 clusters
Actual no of activities delivered (extent) over the planned number of activities (fidelity of implementaiton) Conent, timings and locaitons of interveniton delivery Methods of delivery and explanation provided
Dose Quanity/number of activities/events delivered
Dose delivered: What was delivered to the participants and what prortion of
All components
Routine data (activity logs) from implementing partner
Recall and recognition of intervention components delivered and messages
2 months post intervention
All 90 clusters
Proportion of participants that correclty recall key messges and activities

Component Questions Intervention Method Data to be collected Phase # Clusters Data Analysis the intended intervention was actually delivered to the intended audience? Dose received: what proportion of creative material/messages did partiicpants receive?
Survey Focus Group Discusison
accompanying those creative concepts.
2 intervention clusters
delivered under Vaparshun! What percentage or creative materials and messages was used by participants?
Reach The extent to which the intended audience particpates in the intervention.
To what extent does the intervention contact target population? Which sub-groups (men, women, young people, older people) are exposed to/participate in the intervention events? What explains the pattern of reach?
All four components
Household survey to understand exposure to the intervention components
Proportion of sample reporting participation in each intervention activity in intervention arm Sub-group of participants that attend each intewrvention component
2 months post intervention delivery
All 90 clusters (30HHs per cluster)
Number of events/activities over the number receiving the interventions Barriers and facilitators
Objecitve 3: To understand the hypothesised pathways to change: Participant engagement and response The extent to which the target
Did the intervention meet the information needs of the target population? Do they understand
All four components Toilet makeover & community events
Semi structured interviews Implementation reports Field observations
Comprehension of messages and response to the intervention components
Through intervention lifecycle
4 clusters
Proportion of sample able to recall messages and recognize

Component Questions Intervention Method Data to be collected Phase # Clusters Data Analysis population engages with the intervention events/activities.
and retain the key messages related to pit fillling esimation, conveneint and comfort of using tilets and toilet makeover? Did the implementers accept the activities delivered?
targeted at men
Focus group discussions
Verifications questions will provide more detail about the event attended/ exposure to intervention component. Participant and implementer perspectives on messages and activities delivered as part of the intervention
Midway and 2 weeks post intervention delivery
intervention concepts Preferred intervention components
Mediators Intermediate processes that explain the change in outcome.
Do behavioural determinants (affiliaiton, convenience and comfort) change as a result of the intervention delivery according to Vaparshun’s theory of change?
Toilet makeover & emo- demo, community events targeted at men
Survey Focus group discussions (recipients and non-recipients) In-depth interviews
Indicators related to hypothesized behavioural determinants -understanding the motives associated with intervention components.
2 weeks post intervention delivery
All 90 clusters (30HHs per cluster) 4 clusters
Receptiveness to the intervention Particionants’ response on norms and motivators i.e. desire for imprived toilets, belief that toilet use saves time and is conveneint and knowledge about time it takes for a toilet pit to fill.

The Process evaluation will employ a combination of data sources analysed according to the categories in the table and will be published. Process evaluation data will be analysed in two stages as done in other trials (Oakley et. all, 2006), (Elford J et al, 2002). In the first stage, process data will be analysed separately from the outcome data to minimize bias in interpretation of results. Descriptive statistics for implementation of intervention components such as number of sessions delivered, number of events held, and number of participants will be used to characterize the sample and to analyse the process measures. In the second stage, we will conduct analysis to understand the relation between study outcomes and variation between the quality and extent of implementation of the intervention (fidelity, reach). This will also be used to understand the process that might mediate the observed relation between intervention components and outcomes (pathways to change) and to understand if and why toilet use among men differs in the intervention arms.
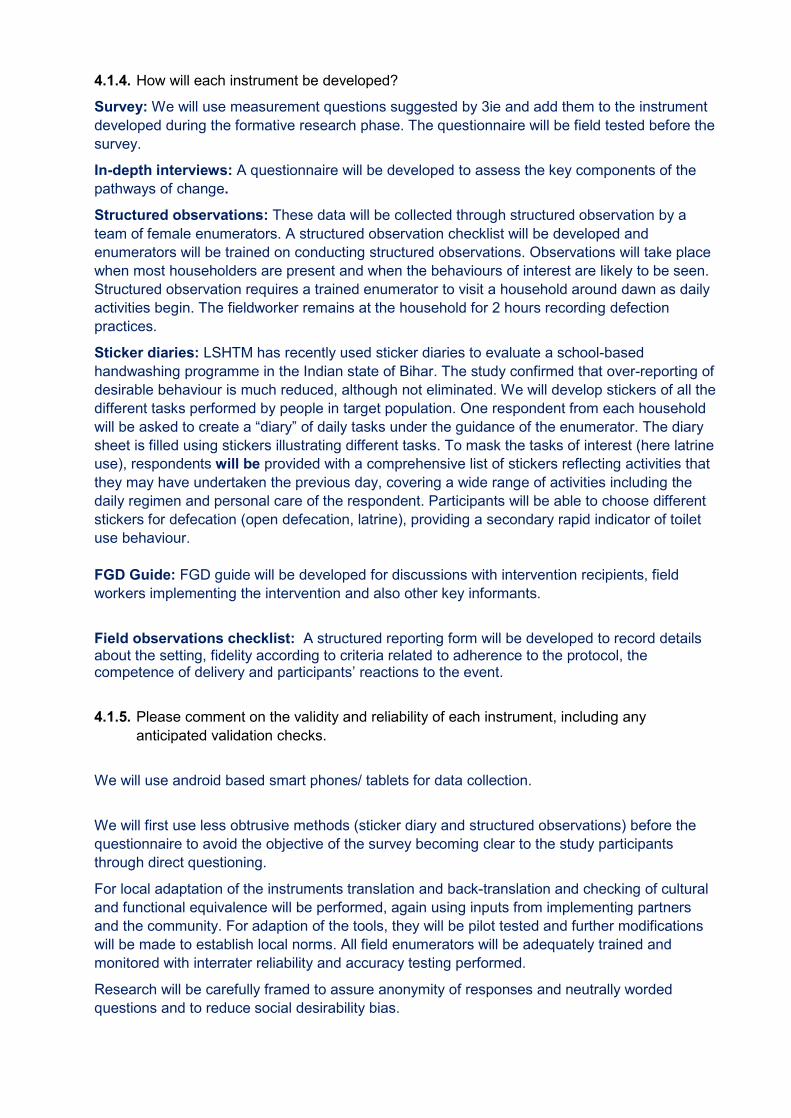
4.1.4. How will each instrument be developed? Survey: We will use measurement questions suggested by 3ie and add them to the instrument developed during the formative research phase. The questionnaire will be field tested before the survey.
In-depth interviews: A questionnaire will be developed to assess the key components of the pathways of change.
Structured observations: These data will be collected through structured observation by a team of female enumerators. A structured observation checklist will be developed and enumerators will be trained on conducting structured observations. Observations will take place when most householders are present and when the behaviours of interest are likely to be seen. Structured observation requires a trained enumerator to visit a household around dawn as daily activities begin. The fieldworker remains at the household for 2 hours recording defection practices.
Sticker diaries: LSHTM has recently used sticker diaries to evaluate a school-based handwashing programme in the Indian state of Bihar. The study confirmed that over-reporting of desirable behaviour is much reduced, although not eliminated. We will develop stickers of all the different tasks performed by people in target population. One respondent from each household will be asked to create a “diary” of daily tasks under the guidance of the enumerator. The diary sheet is filled using stickers illustrating different tasks. To mask the tasks of interest (here latrine use), respondents will be provided with a comprehensive list of stickers reflecting activities that they may have undertaken the previous day, covering a wide range of activities including the daily regimen and personal care of the respondent. Participants will be able to choose different stickers for defecation (open defecation, latrine), providing a secondary rapid indicator of toilet use behaviour. FGD Guide: FGD guide will be developed for discussions with intervention recipients, field workers implementing the intervention and also other key informants.
Field observations checklist: A structured reporting form will be developed to record details about the setting, fidelity according to criteria related to adherence to the protocol, the competence of delivery and participants’ reactions to the event.
4.1.5. Please comment on the validity and reliability of each instrument, including any anticipated validation checks.
We will use android based smart phones/ tablets for data collection.
We will first use less obtrusive methods (sticker diary and structured observations) before the questionnaire to avoid the objective of the survey becoming clear to the study participants through direct questioning.
For local adaptation of the instruments translation and back-translation and checking of cultural and functional equivalence will be performed, again using inputs from implementing partners and the community. For adaption of the tools, they will be pilot tested and further modifications will be made to establish local norms. All field enumerators will be adequately trained and monitored with interrater reliability and accuracy testing performed.
Research will be carefully framed to assure anonymity of responses and neutrally worded questions and to reduce social desirability bias.

Staff will be blinded as to intervention status to reduce bias. Staff will be adequately trained on interview techniques/ filling questionnaire survey. Staff will be observed for short periods, with observations being conducted before surveying.
During formative research, we tested the survey instrument for measuring latrine use.
4.2. Secondary data sources
Please describe the anticipated secondary sources of data, if any, which will be used for this study.
NA
5. Analysis
5.1. Outcome Variables
5.1.1. Your primary outcome is latrine use. Please describe the primary and secondary outcome variables of interest using the following table:

Outcome Description Hypothesis Level
Households with contractor-built toilets in intervention clusters report toilet use by all family members during the last time they defecated and in the last 24 hours
Proportion of households with contractor-built toilets in intervention clusters compared to proportion of households with contractor-built toilets in control clusters that report toilet use by all family members in a household
The proposed intervention (through 4 intervention components) aims to inspire the target audience to revalue their toilets by recognizing that they provide benefits associated with the motives of hoard, create, convenience (comfort) and affiliation, and provide a reward pathway for transitioning to a new toilet use routine.
Household level
Latrine use among men
(sub group analysis)
Proportion of households with contractor-built toilets in intervention clusters compared to proportion of households with contractor-built toilets in control clusters that report toilet use by men
Men are inspired to revalue their toilets by recognizing that they provide benefits associated with the motives of hoard, create, convenience (comfort) and affiliation, and provide a reward pathway for transitioning to a new toilet use routine.
Household level
5.1.2. If you plan on including covariates in your analysis, please provide a list of covariates that may be included.
Response: We do not intend to adjust primary outcomes for covariates.
5.1.3. If you plan to aggregate multiple variables into an index, which variables will you aggregate and how?
We do not plan to do so.
5.2. Qualitative Analysis What questions will be analysed using qualitative methods? Please also describe the qualitative methods that will be used (e.g. content analysis with criteria for codification).

An interview guide will be prepared to facilitate all interviews and discussions. These discussions and interviews will be voice recorded and transcribed verbatim, then analysed thematically following the six-step method of Braun and Clarke which includes familiarisation with data, generating initial codes, searching for themes, reviewing themes, defining and naming themes and writing the report. Objectives and research questions Objective 1: To understand how context and participant recruitment process affects change. Research questions:
1.1 What were the key contextual factors at time point of intervention (other programmes, events, socio-political, demographic, cultural factors) that might have influenced implementation and/or outcomes?
1.2 How were participants recruited?
Objective 2: To understand the implementation and delivery of Vaparshun. Research questions:
2.1. Was Vaparshun intervention delivered as intended (fidelity- quality and extent) 2.2. What was the quantity of intervention delivered (dose delivered and dose received)? 2.3. Did the target audience come into contact with the intervention and how (reach)?
Objective 3: To understand participant engagement, response and hypothesised pathways to change. Research questions:
3.1. Does exposure to the intervention components affect behavioural motives (i.e. enhance status, affiliation and convenience) among men in favour of toilet use (outcome of interest)? 3.2. Do these motives mediate any observed relation between intervention (toilet makeover, emo-demo- community events) and outcome (i.e. improved toilet use)? 3.3. What were the unexpected consequences?
Reference: Clarke, V. & Braun, V. (2013) Teaching thematic analysis: Overcoming challenges and developing strategies for effective learning. The Psychologist, 26(2), 120-123 5.3. Quantitative Analysis
5.3.1. Balance Checks 5.3.1.1. How will you check balance between treatment and control groups? Please specify the
statistical test used to check for balance, as this is the main point of a pre-analysis plan. Additionally, please clarify why the same households are not being sampled twice; attrition could also be in the form of seasonal migration at the village level.
We will compare main socio-economic and demographic variables across arms without using statistical tests, as this is part of a randomised procedure. We consider it unnecessary to conduct statistical tests to check for balance in randomised controlled trials (see for example the CONSORT statement: “significance testing of baseline differences in randomized controlled trials (RCTs) should not be performed, because it is superfluous and can mislead investigators and their readers” Moher D, Hopewell S, Schulz KF, Montori V, Gøtzsche PC, Devereaux PJ, et al. CONSORT 2010 Explanation and Elaboration: Updated guidelines for reporting parallel group randomised trials. J Clin Epidemiol. 2010;2010(63):e1–37.).
Households are surveyed twice: before the intervention in the form of a census. After the intervention to measure the outcomes. As discussed we do not measure the outcomes at baseline in the households surveyed after the intervention. Please see the flow diagram of the study attached with this submission. We avoid measuring the outcomes twice in the same households (e.g. at baseline and follow up) as this risks reactivity.
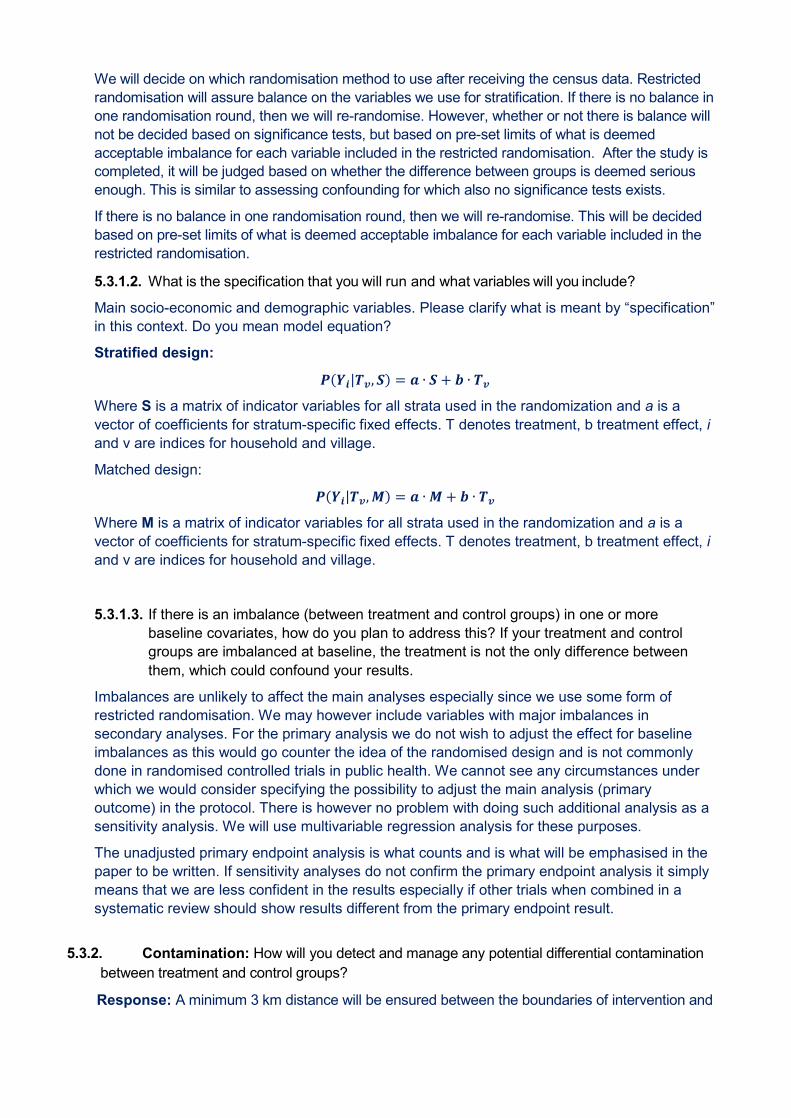
We will decide on which randomisation method to use after receiving the census data. Restricted randomisation will assure balance on the variables we use for stratification. If there is no balance in one randomisation round, then we will re-randomise. However, whether or not there is balance will not be decided based on significance tests, but based on pre-set limits of what is deemed acceptable imbalance for each variable included in the restricted randomisation. After the study is completed, it will be judged based on whether the difference between groups is deemed serious enough. This is similar to assessing confounding for which also no significance tests exists.
If there is no balance in one randomisation round, then we will re-randomise. This will be decided based on pre-set limits of what is deemed acceptable imbalance for each variable included in the restricted randomisation.
5.3.1.2. What is the specification that you will run and what variables will you include?
Main socio-economic and demographic variables. Please clarify what is meant by “specification” in this context. Do you mean model equation?
Stratified design:
𝑷𝑷(𝒀𝒀𝒊𝒊|𝑻𝑻𝒗𝒗,𝑺𝑺) = 𝒂𝒂 ∙ 𝑺𝑺 + 𝒃𝒃 ∙ 𝑻𝑻𝒗𝒗 Where S is a matrix of indicator variables for all strata used in the randomization and a is a vector of coefficients for stratum-specific fixed effects. T denotes treatment, b treatment effect, i and v are indices for household and village.
Matched design:
𝑷𝑷(𝒀𝒀𝒊𝒊|𝑻𝑻𝒗𝒗,𝑴𝑴) = 𝒂𝒂 ∙ 𝑴𝑴 + 𝒃𝒃 ∙ 𝑻𝑻𝒗𝒗
Where M is a matrix of indicator variables for all strata used in the randomization and a is a vector of coefficients for stratum-specific fixed effects. T denotes treatment, b treatment effect, i and v are indices for household and village.
5.3.1.3. If there is an imbalance (between treatment and control groups) in one or more baseline covariates, how do you plan to address this? If your treatment and control groups are imbalanced at baseline, the treatment is not the only difference between them, which could confound your results.
Imbalances are unlikely to affect the main analyses especially since we use some form of restricted randomisation. We may however include variables with major imbalances in secondary analyses. For the primary analysis we do not wish to adjust the effect for baseline imbalances as this would go counter the idea of the randomised design and is not commonly done in randomised controlled trials in public health. We cannot see any circumstances under which we would consider specifying the possibility to adjust the main analysis (primary outcome) in the protocol. There is however no problem with doing such additional analysis as a sensitivity analysis. We will use multivariable regression analysis for these purposes.
The unadjusted primary endpoint analysis is what counts and is what will be emphasised in the paper to be written. If sensitivity analyses do not confirm the primary endpoint analysis it simply means that we are less confident in the results especially if other trials when combined in a systematic review should show results different from the primary endpoint result.
5.3.2. Contamination: How will you detect and manage any potential differential contamination
between treatment and control groups?
Response: A minimum 3 km distance will be ensured between the boundaries of intervention and

control villages. This will be achieved in a first step by randomising whole panchayats, not villages within panchayats, whilst only choosing one village per panchayat for the study. In cases where an intervention village is still less than 3km away from a control village (even though in a different panchayat), we will randomly select a new panchayat.
5.3.3. Attrition 5.3.3.1. What is your anticipated attrition rate and what evidence is this prediction based on?
We do not expect attrition as we do not sample the same households twice. Households included at baseline will be excluded at follow up.
5.3.3.2. What can you do to prevent or remedy sample attrition?
NA
5.3.3.3. How does expected attrition change your power calculations?
NA
5.3.3.4. How will you check balance between attritors and non-attritors? What is the specification that you will run and what variables will you include in these balancing checks?
NA
5.3.4. Missing Data
How will you deal with incomplete or missing data?
We will explore missingness for imbalances across arms. We may resort to imputation methods if missingness turns out a major issue.
5.3.5. Treatment Effects
Note: Many studies may have awareness campaigns where one may not be able to know whether a household participated or heard the message or not. In these cases, it may not be possible to estimate a Treatment on the Treated (TOT) effect. We therefore do not expect that all studies will provide estimates of TOT.
5.3.5.1. Intent to Treat 5.3.5.1.1. How will you estimate the (causal) effect of the offer of the treatment?
Primarily as intention to treat. We will calculate prevalence differences using GLM with binomial distribution and identity link.
5.3.5.1.2. What is the specification that you will run and what controls will you include in your
specification? Stratified design:
𝑷𝑷(𝒀𝒀𝒊𝒊|𝑻𝑻𝒗𝒗,𝑺𝑺) = 𝒂𝒂 ∙ 𝑺𝑺 + 𝒃𝒃 ∙ 𝑻𝑻𝒗𝒗 Where S is a matrix of indicator variables for all strata used in the randomization and a is a vector of coefficients for stratum-specific fixed effects. T denotes treatment, b treatment effect, i and v are indices for household and village.
Matched design:

𝑷𝑷(𝒀𝒀𝒊𝒊|𝑻𝑻𝒗𝒗,𝑴𝑴) = 𝒂𝒂 ∙ 𝑴𝑴 + 𝒃𝒃 ∙ 𝑻𝑻𝒗𝒗
Where M is a matrix of indicator variables for all strata used in the randomization and a is a vector of coefficients for stratum-specific fixed effects. T denotes treatment, b treatment effect, i and v are indices for household and village.
5.3.5.2. Treatment on the Treated 5.3.5.2.1. How will you estimate the (causal) effect of the receipt of the treatment?
We will attempt IV regression wile accounting for the limitations of this method in cluster randomised trials where observations within a cluster are not necessarily independent. The intervention design and piloting is currently being finalised. Once we have finalised the design, we will decide which components are “essential” and for which exposure should be as high as possible. Most likely we will use exposure to cluster level activities to define whether a household was exposed or not. Household level activities that only target selected households will not be used for such purposes.
After discussion with Richard Hayes (LSHTM) we have decided to delete CACE analysis from this study on the basis of assumptions that are unmet in cluster randomised trials.
5.3.5.2.2. What is the specification that you will run and what controls will you include in your specification?
After discussion with Richard Hayes (LSHTM) we have decided to delete CACE analysis from this study on the basis of assumptions that are unmet in cluster randomised trials.
5.4. Heterogeneous Effects
Note: Since behaviour change interventions require village-level clustering to prevent spillovers, studies will likely not be adequately powered to conduct subgroup analysis, and subgroup analysis is not expected. Proposals to do subgroup analysis should be accompanied by an explanation of how studies will be able to detect differences between subgroups.
5.4.1. Which groups do you anticipate will display heterogeneous effects?
Men were found to be an important stakeholder group for the intervention based on our formative research and review of background literature. We may conduct subgroup analyses by gender.
5.4.2. What is the broad theory of action that leads you to anticipate these effects? Please provide a more detailed explanation here.
Men are primarily responsible for building toilets in homes and often ten to be the ones defecating in the open.
Vaparshun’s theory of change, outlines the steps and hypothesised mechanisms of change towards improving toilet use among all members in a household. The intervention aims to increase toilet use among all members in a household (especially men) by delivering a cascade of activities, at the cluster level, that will help people understand (functionality, benefits and features) and value their toilets. We hypothesise that exposure to our intervention will lead people to find it convenient and comfortable to use their government/contractor built toilets and will make them usable by carrying out suitable repair and/or modifications (i.e. toilet makeover) of the structure (such as painting walls, creating ventilation, installing tap/water station, handles, toilet chairs for differently abled/ old people). The intervention will deliver components (pit

emptying/ filling emotional-demonstration, transition nudges and community events) that we anticipate will make people feel less anxious about pit filling and emptying, which are likely to hamper their motivation to use a toilet, and will reduce the tendency to ‘hoard’ (i.e. save it for later) pit space (due to fear of pit filling up quickly and the anxiety of emptying it in absence of available services in the area). We hypothesise that this will make the experience of toilet use comfortable and desirable and will lead to changes in behaviours, such that toilet use becomes ‘normal’ for all members in a household. Vaparshun’s hypothetical ToC was developed and pre-tested in the formative phase of the study as described in previous section 2 of this document. Vaparshun’s process evaluation is aligned to its theory of change. The process evaluation approach is based on components suggested by Linan and Steckler, 2002 in their process evaluation framework and is adapted from similar studies (Greenland et al. 2017)(Roma et al. 2014)(Boisson et al. 2014)( Bonell et al. 2006) (Grant et al. 2013).
5.5. Standard Error Adjustments
5.5.1. How will you address clustering in your data?
GEE and robust standard errors.
5.5.2. How will you address false positives from multiple hypothesis testing?
We will not adjust for multiple testing.
5.5.2.1. If you plan to adjust your standard errors, what adjustment procedure will you use? (e.g., Family Wise Error Rate, False Discovery Rates, etc.)
NA
5.5.2.2. How will you deal with outcomes with limited variation? For instance, one option could be to decide in advance that outcomes that vary below a certain threshold will be omitted from the analysis.
We do not plan such procedures. List of optional attachments Script (Optional)
You may wish to upload an analysis script with clear comments. This optional step is helpful in order to create a process that is completely transparent and increase the likelihood that your analysis can be replicated. We recommend that you run the code on a simulated dataset in order to check that it will run without errors. Data Collection Tools (Optional)
You may wish to attach any qualitative or quantitative data collection tools, if available.
Census and Baseline data collection questionnaires submitted and approved.

ANNEX 7: SURVEY TOOLS
Note: Please circle the appropriate answer when choices are given
Socio Demographic profile 1. Date of Interview 2. Name of Data collector 3. Time Started 4. Block 5. Village Name 6. Census code of village 7. Name of respondent 8. Family roster
No Name
Age (Years)
Sex
1=Male, 2=Female
3= Other Education
Male head of HH
Female head of HH
1
2
3
4
5
6
7
8
9
10
Education (Select code from the table below)
1 = Illiterate 2 = Didn’t go to school but can read and write
3 = Primary - Standard 1st to 5th 4 = Secondary - Standard 6th to 10th 5 = Higher Secondary - Standard 11th to 12th 6 = Diploma/Certificate course 7 = Bachelors or higher 8= Diploma or Technical Certificate after 9th 9 = not applicable 9. Ask: Religion (If other, please record details in
the space provided here) 1. Hindu 2. Muslim 3. Others
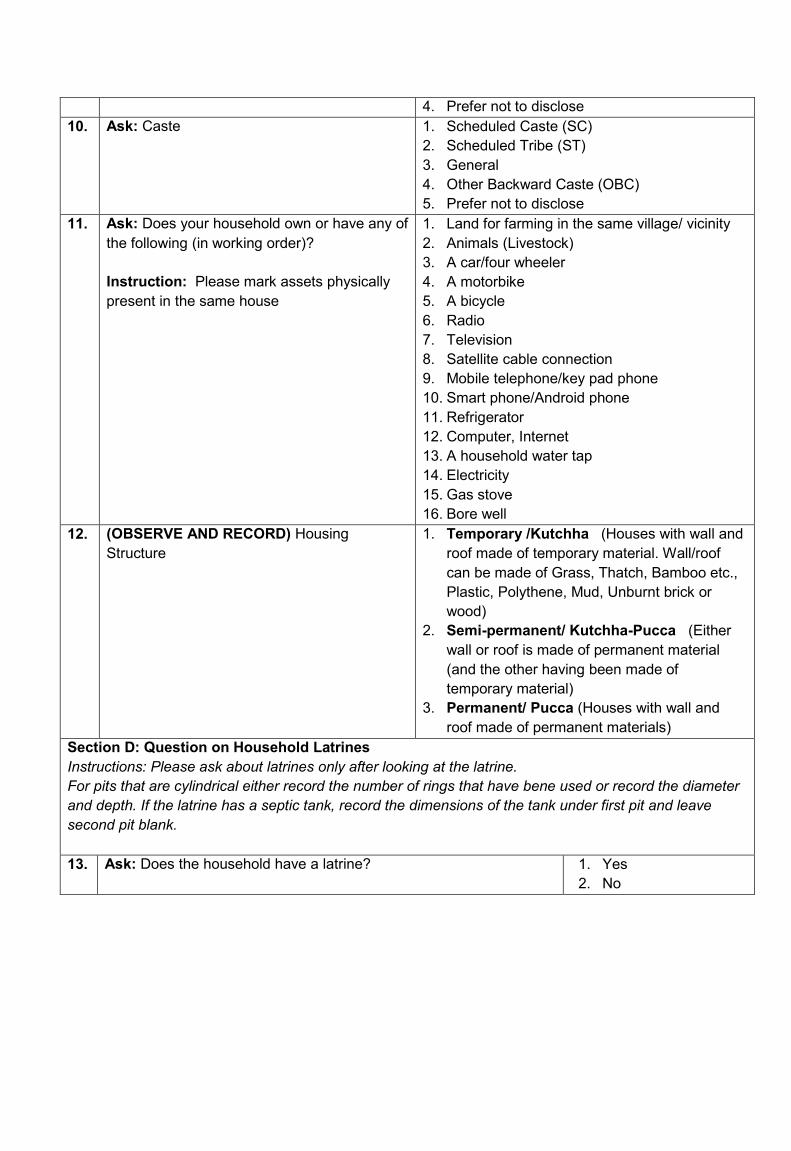
4. Prefer not to disclose 10. Ask: Caste 1. Scheduled Caste (SC)
2. Scheduled Tribe (ST) 3. General 4. Other Backward Caste (OBC) 5. Prefer not to disclose
11. Ask: Does your household own or have any of the following (in working order)? Instruction: Please mark assets physically present in the same house
1. Land for farming in the same village/ vicinity 2. Animals (Livestock) 3. A car/four wheeler 4. A motorbike 5. A bicycle 6. Radio 7. Television 8. Satellite cable connection 9. Mobile telephone/key pad phone 10. Smart phone/Android phone 11. Refrigerator 12. Computer, Internet 13. A household water tap 14. Electricity 15. Gas stove 16. Bore well
12. (OBSERVE AND RECORD) Housing Structure
1. Temporary /Kutchha (Houses with wall and roof made of temporary material. Wall/roof can be made of Grass, Thatch, Bamboo etc., Plastic, Polythene, Mud, Unburnt brick or wood)
2. Semi-permanent/ Kutchha-Pucca (Either wall or roof is made of permanent material (and the other having been made of temporary material)
3. Permanent/ Pucca (Houses with wall and roof made of permanent materials)
Section D: Question on Household Latrines Instructions: Please ask about latrines only after looking at the latrine. For pits that are cylindrical either record the number of rings that have bene used or record the diameter and depth. If the latrine has a septic tank, record the dimensions of the tank under first pit and leave second pit blank. 13. Ask: Does the household have a latrine? 1. Yes
2. No

14. (OBSERVE & RECORD)Type of Latrine 1. Flush / pour latrine connected to piped sewer system
2. Flush / pour flush latrine connected septic tank 3. Flush / pour flush latrine connected other system
(excreta and waste water gets flushed into the street, yard / plot, drainage ditch or any other location
4. Pit latrine with slab 5. Pit latrine with ventilated improved pit 6. Pit latrine without slab / open pit 7. Indian pit latrine / dry within 8. Indian pit latrine / flushed with water 9. Western Commode with Flush Tank 10. Western Commode with Hand Gun / Water jet 11. Night soil disposed into open drain: Where a
latrine facility may exist, but the excreta and waste water is disposed directly into an open drain
15. (OBSERVE & RECORD) Is the latrine being used for some other purpose? (other purpose indicates non-use)
1. Yes 2. No
16. (OBSERVE & RECORD) Is the squatting pan clogged with leaves/dirt/other materials? [Leaves/dirt/other materials indicate non-use.]
1. Yes 2. No
17. (OBSERVE & RECORD) Water container, like lota, mug, or coke bottle, (for washing after defecation) in the latrine? [Water container indicates use.]
1. Yes 2. No
18. (OBSERVE & RECORD) Slippers outside or inside the latrine? [Slippers indicate use.]
1. Yes 2. No
19. (OBSERVE & RECORD) According to your judgment, does the latrine look like it is being used?
1. Yes 2. No
20. (OBSERVE & RECORD) Are there supplies to clean the latrine pan (ie. toilet brush, cleaning fluid like Harpic)? [Cleaning supplies indicate use]”
1. Yes 2. No
21. (OBSERVE & RECORD) List whether household toilet exhibits each of the following characteristics
Choose all that apply
1. Painted walls 2. Clean 3. Light bulb 4. Natural light 5. Water inside the toilet 6. cross ventilation

7. Single vent 8. Any other ……..
22. (OBSERVE & RECORD) Is there a ‘5-star toilet’ sticker on the toilet?
1. Yes 2. No
23. (OBSERVE & RECORD) What type of slab/seat?
1. Squat-plate without footrests 2. Squat-plate with footrests 3. Seat on a pedestal 4. Other, Specify………………..
24. (OBSERVE & RECORD) Does the Latrine have one pit, two pits, or a septic tank?
1. One pit 2. Two pits 3. Septic tank 4. No pit or tank 5. Other …………………….
25. ASK: How big is the pit? [Instructions: For pits that are cylindrical, either record the number of rings if rings have been used, or record the diameter and depth. If the Latrine has a septic tank, record the dimensions of the tank under first pit and leave second pit blank]
First pit: 1.1 Length: _____ feet 1.2 Width/diameter: _____ feet 1.3 Depth: _____ feet 1.4 Number of rings: _____ rings
Second pit:
1.1 Length: _____ feet 1.2 Width/diameter: _____ feet 1.3 Depth: _____ feet 1.4 Number of rings: _____ rings
26. ASK: Has the pit of your Latrine ever filled up? If not, then go to Q 29
1. Yes No
27. ASK: If yes, what did you do with the pit after it filled up?
1. Emptied 2. Built a new pit 3. Switched to using second pit 4. Everyone stopped using the latrine altogether 5. Restricted use to a select few members
28. ASK: (If emptied) How was it emptied? 1. Hired someone to manually empty 2. Hired tanker to empty 3. Someone in family manually emptied
29. Ask: for households that have a latrine: How long ago was construction completed on the latrine?
1. _________Year __________Month 2. toilet constructed -------years before 3. Always existed ever since we moved in the
house in year -----------. 4. Don’t know
30. ASK: Have you received any money or materials from the government or an NGO to construct a latrine?
1. Money 2. Materials 3. Money and materials 4. Reimbursement pending 5. Reimbursement pending and materials 6. Nothing
31. (If materials in Q 30) Did the government or NGO give you materials, or did it construct the whole latrine for you?
1. Materials 2. Constructed the whole latrine

Toilet improvements 32. Ask: Did you make any changes to your
existing toilet in the past 6 months? If No, then go to Q 34
1, - Yes 2, - No
33. If yes, what changes did you make?
Unprompted 1. Painted walls 2. Tiles/Patterns on
the wall 3. One vent (Bari) 4. Cross ventilation 5. Light bulb installed 6. Water storage near
the toilet 7. Installed tap inside
the toilet 8. Bought cleaning
supplies 9. Clean the toilet
more regularly 10. Installed toilet chair 11. Handle bar 12. Any other
Prompted 1. Painted walls 2. Tiles/Patterns on
the wall 3. One vent (Bari) 4. Cross ventilation 5. Light bulb installed 6. Water storage
near the toilet 7. Installed tap inside
the toilet 8. Bought cleaning
supplies 9. Clean the toilet
more regularly 10. Installed
toilet chair 11. Handle bar 12. Any other
34. Do you plan to make changes to your toilet?
If no, then go to Q 37
1, - Yes 2, - No
35. What changes do you plan to make?
1. Paint walls 2. Place tiles 3. Ventilation 4. Improve roof 5. Install light bulb 6. Dig another pit 7. Install toilet chair 8. Install tap inside the toilet 9. Buy cleaning supplies 10. Any other ----------------------------
36. What benefits would those changes provide to you and your family?
1. Comfort 2. Safety 3. Convenience 4. Better status 5. Any other -------------------------
Section B: Questions on the Latrine Use ***Interviewer, say that you would now like to ask about the sanitation practices of each member of the household. Tell them that you know it is something that people do not normally talk about, but it is important to understand them and it is hard to do this if people do not talk about it. Remind them that the information they give will be anonymous. Remind them that the information they provide is only useful if they are able to

share what they actually do, this is not a test and you are not looking for a 'right' answer, just a description of what they usually do. They should feel free to talk openly, ensure this part of the interview takes place in a private place. Say that you will ask each family member aged 5 years and over the question in turn and then you will ask a female caregiver (or the head of household if no female caregiver is present) to answer for children younger than 5 and any other family member who are not at home. If the respondent does not know where an individual defecated, then please leave the option blank. 37. ASK: For every household member five
or older, as part of a household roster (where household is defined as living under this roof): “The last time [NAME] defecated, did [NAME] defecate in the open or se the latrine?”
S. No Name Response 1. Open 2. Latrine 3. Somewhere else (not open field, or latrine)
38. For children younger than five: The last time [NAME of child under 5] defecated, where did [NAME of child under 5] defecate?
1. On ground outside compound 2. On ground inside compound 3. On ground in latrine cubicle 4. In potty 5. In cloth nappy/diaper 6. In pants/clothing 7. On bed 8. In bedpan 9. In latrine 10. Other
39. (For children younger than 5 and if child went somewhere other than “9, In latrine”): What was done to dispose of the stools?
1. Put/rinsed into Latrine/latrine 2. Put/rinsed into drain/ditch/open field 3. Thrown into garbage 4. Buried 5. Put/rinsed into pond/other surface water 6. Washed (water ends up somewhere else) 7. Left in open 8. Other
Section C: Process Evaluation Questions : Ask respondents the question and provide options. 40. Ask: If a household in this community
does not have a toilet what would others think of them? Multiple options
1. Nothing 2. People may gossip about them 3. They may be ridiculed to their faces

4. They may be publicly identified as having a bad toilet practices
5. They may not be considered illiterate 6. They may be considered poor 7. Other
(record…………………………………………………….)
41. Ask: If a household in this community does have a toilet what would others think of them? Multiple options
1. Nothing 2. People will think of them as modern/smart 3. People may thing they have lived in cities 4. People may think they are rich 5. They may be publicly identified as having a good toilet 6. Other (…………………………………………………….)
For the following questions, please indicate whether the respondent agrees or disagrees with the statement that you read out to them
Agree Disagree
42. Using a toilet saves time and effort compared to open defecation. 43. Using a toilet builds your reputation in the community. 44. Many people around here are improving their toilets. 45. Most people around here use a toilet regularly. 46. Everyone in my household uses a toilet. 47. A smart person is one who uses a toilet. 48. It is possible to feel proud of one’s toilet. 49. Most people around here think it’s good to use a toilet. 50. Using a latrine gives me a ‘packed’ (claustrophobic) feeling. 51. Toilets are not just for women; men should use them too. 52. It is appropriate to have a toilet as good as your house. 53. It is ok for poor people to practice open defecation. 54. Toilet pits fill quickly if too many people in the household use them. 55. Most of the people I care about think I should use a toilet. 56. People around here think a household should have a good toilet. 57. Even if no one else around here had a good toilet, I would still make
sure I had one.
58. During farming season, most people around here defecate in the field/open
59. Defecating in the field is more convenient than using a toilet 60. Having a good toilet at home is a mark of better status in the village 61. Using a toilet makes me anxious about the pit filling up Exposure to the Smart Toilet Campaign 62. Have you in last 6 months heard about
toilets in any of these contexts? [tick all that apply] Probe
1. Conversation with others 2. Visits to neighbours 3. WhatsApp message 4. Village meeting 5. Event in community 6. Posters /stickers 7. Radio 8. TV 9. Any other

63. What did you hear this way? [Unprompted]
1. One should construct a toilet if a household doesn’t have one
2. One should improve one’s toilet if it is poor quality 3. One should use toilet for defecation instead of going out
in the open 4. Any other ----------
64. After hearing this did you make changes to your toilet or done anything as a consequence?
1. talked with someone 2. made changes to my toilet 3. saved money for a toilet 4. Any other ----------
65. Have you heard of any community event that talks about toilet in the past 6 months?
1, - Yes 2, - No
66. Have you attended such an event? [If NO, go to Q 78]
1, - Yes 2, - No
67. Did it promote toilet improvement? 1, - Yes 2, - No
68. If so, did you commit to improving your toilet at the event?
1, - Yes 2, - No 3, - already have a 5 star toilet
69. Have you heard the phrase ‘5 star toilet’? [If NO, then go to Q71]
1, - Yes 2, - No
70. If yes, where did you hear it?
1. TV 2. Village meeting 3. Community event 4. WhatsApp message 5. Posters/stickers 6. Virtual Reality film 7. Friend/relative 8. Other
71. Do you have a certificate for having a 5-star toilet [not the toilet sticker!]? Can you show it to me?
1, - Yes 2, - No
72. Have you had a picture of your family on the village ‘Toilet Board’ poster [may not know the name ‘Toilet Board’]?
1, - Yes 2, - No
73. Have you seen a skit about toilet convenience? [Day 1 community event attendance marker]
1, - Yes 2, - No
74. Have you seen the small-sized 5-star toilet model? [attended a street event]
1, - Yes 2, - No
75. Have you made a testimonial film about your toilet, or know anyone who has?
1, - Yes 2, - No
76. Have you seen a certificate give-away [or similar]? [Day 2 community event attendance marker]
1, - Yes 2, - No

77. Have you seen someone talking about or showing a movie about how fast a pit will fill up?
1, - Yes 2, - No
78. Have you seen a movie about using a chair in the toilet for disabled or elderly people?
1, - Yes 2, - No
79. Do you use any other the following?
1. Facebook 2. WhatsApp 3. Instagram 4. YouTube 5. None
80. Ever got or sent a message on WhatsApp about toilets?
1, - Yes 2, - No
81. If Yes, what did it say? --------------- 82. Have you heard about Swachh Sunder
Shauchalay campaign? 1, - Yes 2 - No
83. If yes, what did it say? 1. Paint your toilet walls 2. Decorate your toilets 3. Any other
84. Time completed
No
Variable name
Question Response What to do
1 villid Village identifier: ����� ��� ___ Write ID
2 hhid Household identifier : ���� ��� ___ Write ID
name What is your name? ������ ��� �����
______________________
Write name
3 sex Gender : ���� 0-M 0- ����� 1-F � – ������
Circle
age What is your age? ����� ���� ��� ��?
____ Write age
4 diab Are you taking tablets for diabetes? : ��� ��� ����������� ��� �� ��?
0-NO 0- �� 1-YES � – ��
Circle
5 bp Are you taking tablets for hypertension? ��� ��� ���� �������� ��� �� ��?
0-NO 1-YES
Circle
6 chd Are you taking tablets for heart disease? ��� ��� ������� ��� ��� �� ��?
0-NO 1-YES
Circle
7 heigh What is your height? ����� ����� ����� ��?
___ 999-don’t know
Write height in cm

8 weigh What is your approximate weight? ����� ��� ����� ��?
___ 999-don’t know
Write weight in kg
9 fruits In the last week how times did you eat fruit approximately? I will give you 4 options. READ ALL OPTIONS ������ �������� ��� ��� ����� ��� ��� ���� ��?
0. NEVER 1. One day only 2. Most days 3. ALL days
Write down number
10
nuts In the last week how times did you eat nuts approximately? I will give you 4 options. READ ALL OPTIONS ������ ����������� ��� ����� ��� �������� ���� ��� ���� ���� �� ?
0. NEVER 1. One day only 2. Most days 3. ALL days
Circle
11
fish In the last week how times did you eat non-vegetarian food approximately? I will give you 4 options. READ ALL OPTIONS ������ ����������� ��� �������� ���� ���� ����� ���� ��?
0. NEVER 1. One day only 2. Most days 3. ALL days
circle
12
buy Yesterday how many minutes did you walk to buy things you need? I will give you 4 options. �� ���� ��� ����� ������ ������ ���� ��� ����� ����� ������? READ ALL OPTIONS
1. Less than 10 minutes 2. Between 10 and 30
minutes 3. More than 30 min 4. Does NOT walk to buy
things
circle
13
rel Yesterday how many minutes did you walk to visit friends or relatives? I will give you 4 options. �� ���� ��� ������ ���� ��������� ���� ����� ����� ������? READ ALL OPTIONS
1. Less than 10 minutes 2. Between 10 and 30
minutes 3. More than 30 min 4. Does NOT walk to visit
friends or relatives
Circle
14
field Yesterday how many minutes did you work in the fields? I will give you 4 options. �� ���� ��� ������� ����� ����� ��� ������? READ ALL OPTIONS
1. Less than 30 minutes 2. Between 30 and 1 hour 3. More than 1 hour 4. Does NOT work in the
field
Circle
15
anim Yesterday how many minutes did you walk to take animals (cows or goats) to
1. Less than 10 minutes Circle

places where they feed? I will give you 4 options. �� ���� ��� ��������� (��� ���� ����) ������ ����� ����� ������? READ ALL OPTIONS
2. Between 10 and 30 minutes
3. More than 30 min 4. Does NOT walk to take
animals around
16
wat Yesterday how many minutes did you walk to fetch water? I will give you 4 options. �� ���� ��� ���� ����� ���� ����� ����� ������? READ ALL OPTIONS
1. Less than 10 minutes 2. Between 10 and 30
minutes 3. More than 30 min 4. Does NOT walk to fetch
water
Circle
17
def Last time you defecated how many minutes did you walk to go to the fields for defecation? I will give you 4 options. ������ ������ ��� ��������� ����� ��� ���� ��� ������ ��� ����� ����� ������? READ ALL OPTIONS
1. Less than 10 minutes 2. Between 10 and 30
minutes 3. More than 30 min 4. Uses toilet at home
Circle
18
work Yesterday how many minutes did you walk to place of work? I will give you 4 options. �� ���� ��� ����� ����� ��� ���� ����� ����� ������? READ ALL OPTIONS
1. Less than 10 minutes 2. Between 10 and 30
minutes 3. More than 30 min 4. Does not walk to work
Circle
19
leis Yesterday how many minutes did you walk for fun/relaxation? I will give you 4 options. �� ���� ��� ���� / ���� ���� ����� ����� ������? READ ALL OPTIONS
1. Less than 10 minutes 2. Between 10 and 30
minutes 3. More than 30 min 4. Does not walk for fun /
relaxation
Circle
20
other Yesterday how many minutes did you walk for other purposes? I will give you 4 options. �� ���� ���� ����� ���� ��� ����� ����� ������? READ ALL OPTIONS
1. Less than 10 minutes 2. Between 10 and 30
minutes 3. More than 30 min 4.Does not walk for other
purposes
Circle

ANNEX 8: BEHAVIOUR CENTRED DESIGN Source: A Guide to Behaviour Centred Design Authors: Robert Aunger and Valerie Curtis, London School of Hygiene and Tropical Medicine Link:https://blogs.lshtm.ac.uk/envhealthgroup/files/2015/04/Guide-to-Behaviour-Centred-Design.compressed-2.pdf
Behaviour Centred Design (BCD) is a new and radically different approach to the problem of changing behaviour. Using an evolutionary framework, it unites the latest findings about how brains learn with a practical set of steps and tools to design successful behaviour change programs. This approach mixes both science and creativity because behaviour will only change in response to something new and challenging. The approach has been employed successfully on a range of public health behaviours as well as in commercial product design and marketing. Why is BCD necessary? First, because we fail to solve the world’s most pressing health problems –not because we don’t have solutions, but often because they are not used enough. We know that not smoking, vaccination, using toilets, oral rehydration, appropriate eating, safe sex and exercise could solve the majority of the world’s health problems, but they are simply not taken up sufficiently. Similarly, marketers seek to make products more appealing to consumers, but often don’t know which insight would work best to get them to change their buying habits. Their frustration is expressed in the famous quote (attributed to Henry Ford): ‘I know half of our marketing efforts work; the problem is I don’t know which half’. People also form intentions to change their own behaviour (e.g., New Year’s resolutions, dieting plans), but often fail to follow through. We know the benefits of recycling and paying our taxes, and we know not to bite our nails, but we still fail to do these things. All of these situations require a better understanding of how to change human behaviour. While many approaches to behaviour change are being used today, most are based in trying to change cognition in one way or another: either through cognitive appraisals or modifying cognitive heuristics --techniques used by behavioural economists, OAM approaches (for opportunity, ability and motivation) are also popular, but are based on information processing models of persuasive communication (that is, attitudinal, rather than behaviour, change). None, as yet, is firmly based on the latest thinking about human behaviour itself, the purposes that it evolved to serve, or the way in which it changes in response to changing circumstances. With the recent revolutions in the understanding of situations, environments and brains, it is time to update our approach to behaviour change. People largely know what they should be doing to influence (their own) behaviour, but just don’t do it. So behaviour change programs need to focus on behaviour, not cognition or communication. Behaviour Centred Design is a new approach which, as the name implies, is centred on behaviour. It differs from existing approaches in that it is a complete process for behaviour change, aimed at both individuals and societies. It provides a coherent behavioural model derived from reinforcement learning theory, develops a fundamental taxonomy of needs based in evolutionary biology, shows how the disruption of ‘behaviour settings’ (a key concept derived from ecological psychology that we explain below) is key, and sets out the steps involved in programming for behaviour change. So as well as providing a means of identifying the levers that can change behaviour, it also provides a design process, with steps and tools to use in conceiving, creating, implementing and evaluating a behaviour change program.

Figure 1: The BCD Process Model
Across the middle of the diagram is the chain of events that has to occur for behaviour to change. In a nutshell, an intervention has to change something in the environment, which has to change something in the brain and/or body of the target individual, which then has to impact on behaviour. The aggregate of these individual behaviours then has some impact on the state-of-the-world. This causal chain represents the BCD approach to defining what is known as a ‘Theory of Change’. BCD THEORY Theory of Change is an emerging approach to guiding program development, execution and analysis. Having an explicit Theory of Change helps one to think clearly about the pathways by which change occurs, to design interventions that are more likely to affect those pathways, and to better evaluate how program inputs have led to the desired outcomes and impacts. It requires that program managers make explicit assumptions about the cause-effect relationships between program activities and behaviour change, about the operational/logistical expectations for delivery of those activities, and about the macro-environmental context within which the program is taking place. This allows program stakeholders to attribute results to program activities when both the program and the context within which it has been executed are complex (a useful ability in the era of ‘evidence-based’ policy). A Theory of Change can be used in several ways: as a process description that makes explicit the causal connections between program inputs and outputs, as a strategic planning tool to guide action, and as a conceptual or thinking tool from which to learn from experience. A particular view of how a Theory of Change should be organized forms part of the BCD approach. But the key question remains: how to design the intervention such that it has the desired behavioural outcomes and impact? And then, how to learn if it has worked? Along the top and bottom of the diagram are depicted the five steps of the BCD program development process. We have dubbed these the ABCDE steps, as follows: A: Assess–

here program designers start by gathering what is known about the target behaviours, the target audience, the context and the parameters of the intervention. A framing statement sets out what is known already about how change can be achieved and sets out hypotheses about change mechanisms for further exploration. B: Build–involves carrying out carefully targeted formative research with a sample of the target audience to find out the things that are unknown and explore hypotheses about the likely drivers of change. Unlike typical formative research, which typically involves key informant interviews and focus groups, BCD employs a variety of innovative methods such as motivational mapping, product attribute ranking, scripting and video ethnography in a rapid ‘deep dive’ with target audiences. The insights from this formative research are then ordered into a Theory of Change and distilled into a brief for the next phase. C: Create–involves a creative team iteratively designing the intervention package and testing it on a small scale. Creativity is hard to package into a simple process but it is vital if interventions are to be engaging and motivating enough to stand out in the crowded lives of those targeted by programs. The result of the creative process is a package of surprising and disrupting intervention materials designed to have maximum effect on the target behaviour. D:Deliver –the intervention package is then implemented via a set of planned activities which may involve direct and indirect contact via various channels such as community workers, events, mass and/or digital media that are appropriate to the audience and intended impact. This process is monitored to ensure that learning from this experience can take place. E:Evaluate–ideally in a field trial at a scale that allows some definitive assessment of whether the processes expected by the program’s Theory of Change have taken place. The learnings from evaluation should then provide the starting point for a new cycle of learning by engaging in the BCD process again to develop a new program. In the middle of the figure we’ve highlighted three key tenets of BCD: that interventions require surprise, revaluation and performance, and that what links these together are the ‘behaviour setting’ in which they occur –concepts we will explain further below. Whether you take just some elements from Behaviour Centred Design, or use it throughout to design a program, it should help you to find creative ways of changing behaviour that are surprising, that add value and that improve the performance of your program.

Annex 9: Campaign Photographs
A proud 5 Star Toilet owner Campaign facilitator recording testimonial of a 5 Star Toilet owner
Campaign facilitator talking about 'the world is getting smarter' and 5 Star Toilets
Participants experienceing virtual reality film of a 5 Star Toilet design

Skit performance during the evening event Toilet pit demonstration to talk about pit filling/emptying anxiety
Meeting with District Development Officer, Bhavnagar, Government of Gujarat to
discuss the campaing
5 Star Toilet board with photographs of people who improved their exisitng
government toilets

Presentation of certificate to 5 Star Toilet owner by the village sarpanch
A campaing facilitator during a street event promoting 5 Star Toilet

Annex 10: Study map
Name of Block
No. of Village Panchayat No. of Villages (Census)
No. of Villages (Swatch App Data)
Mahuva 131 131 114 Palitana 89 93 79 Talaja 115 111 115