Embed Size (px)
Citation preview
Grantee: Dr. Sarah Milton, Florida Atlantic University
Sea Turtle Grant Contract No. 10-007R
Quantifying the energetic cost of disorientation in loggerhead (Caretta caretta) and green (Chelonia mydas) hatchlings.
Final Report
PI: Dr. Sarah Milton
Summary: This project was to quantify the energetic cost of disorientation on post-emergent loggerhead and green turtle hatchlings. Emerging hatchlings must cross a variable span of surface sand in order to reach the surf; artificial lighting complicates this task, potentially drawing hatchlings away from their intended destination. Hatchlings face risks associated with this extension of the crawling period: lactate buildup from anaerobic metabolism, depletion of energy stores, and increased risks of dehydration and predation may all decrease the odds of hatchling survival. Despite the availability of glucose stores and the remnants of the yolk sac as an energy supply, the overall energetic cost of disorientation upon hatchlings has not been determined, nor whether a period of disorientation affects swim performance. This study examined measures of energetic in hatchling loggerhead and green turtles crawling for a simulated disorientation of either 200m or 500m, followed by a 30 min swim. The results suggest that there is indeed a risk for hatchlings due to mis- or disorientation events, and that this risk is different for different species. While the overall more active greens are able to crawl continuously even for long distances, this may result in lactate buildup, fatigue, and reduced swim capacity. Loggerhead hatchlings, on the other hand, rest frequently over long distances, which we hypothesize prevents excessive lactate buildup, but this results in greatly extended periods during which the hatchlings would be vulnerable to predation, overheating, and dehydration stress. More data on green hatchling energetics, however, needs to be collected.
Background
The southeast Florida seacoast is home to one of the largest nesting populations of loggerhead sea turtles in the world; more than 61,000 nesting females utilized Florida beaches in the 2008 season, with the majority of nesting occurring between Volusia and Broward Counties (Fish and Wildlife Research Report). Green turtles, while fewer in number, also utilize Florida beaches, with numbers increasing in recent years. Upon emergence from the nest, hatchlings are naturally guided seaward by light orientation and elevation of the horizon; reflected light from the ocean stimulates a phototaxic response and hatchlings will naturally crawl towards a lower, presumably oceanic-oriented horizon (Tuxbury and Salmon, 2005). Artificial lighting can interfere with the hatchlings’
phototaxic response, guiding them away from the surf in aimlessly circuitous paths (disorientation) or directly towards the landward light source (misorientation) (Tuxbury and Salmon, 2005).
The emergence of sea turtle hatchlings requires tremendous energetic cost, fueled by energy from yolk left unconsumed by embryonic development (Wallace and Jones, 2008). Approximately 50% of their yolk is utilized by sea turtles for hatching and emergence, where the hatchlings must extricate themselves from their eggshells and dig their way out of the burrow at great metabolic cost (Kraemer and Bennett, 1981). Significant increases in blood lactate levels during digging (Baldwin et al. 1989) indicate the hatchlings’ reliance upon anaerobic metabolism during this time. Lactate levels return to near basal in pre-emergent hatchlings following a period of rest (Baldwin et al. 1989), after which hatchlings will make their way to the surf across the beach. The rapid movement from nest to surf, referred to as “frenzy”, is also an anaerobically costly mechanism of locomotion and drives a 22-fold increase in lactate when compared with their prior resting period (Dial, 1987). Unlike hatching and digging, however, sea turtle hatchlings have no period of rest after crossing the beach to reduce lactate: once in the water an incessant, hyperactive period of swimming (frenzy swimming) takes place, again increasing the metabolic demand on sea turtle hatchlings. Continuous frenzy swimming occurs over the first 24 hours or so, after which the hatchlings swim primarily during the day and rest at night (Wyneken and Salmon, 1992; Wyneken, 1997). Swimming consists of `power stroking' bouts lasting 2–10 s, where the front flippers are moved up and down in a flying motion (Carr and Ogren, 1960; Davenport et al., 1984; Salmon and Wyneken, 1987; Wyneken, 1997; Burgess et al., 2006). These power stroking bouts are separated by brief 1–5 s periods in which the gait changes to one in which diagonally opposite flippers move together (dog paddling), and the hatchling lifts its head to breathe (Salmon and Wyneken, 1987; Wyneken, 1997; Burgess et al., 2006). As the time in the water lengthens, power stroke rates slow, dog paddling bouts become longer, and periods of `rest' (no flipper movement) may be observed (Burgess et al., 2006).
But these emerging hatchlings facing the energetically costly task of crossing a variable span of surface sand to reach the ocean and initiate frenzy swimming can be mislead by artificial photic stimuli, which may dramatically increase the energy expended to reach the ocean and thus also reduce energy stores for frenzy. Frenzy swimming and the initial survival of post-hatchlings in the neritic zone both possess a high energy cost, and while hatchlings have a limited amount of energy to expend in the form of yolk lipids and glycogen, the energetic cost of disorientation to hatchlings is unknown. Given the distance of principal currents from the shores of the western Atlantic and the metabolic requirements of emergence and frenzy swimming, any impediment to the yolk and glycogen reserves of hatchlings may affect their chances of safely reaching a point of passive drift.
An examination of the energetic cost of disorientation in loggerhead and green hatchlings would assist in determining if a hatchling’s probability of survival decreases as energy is expended upon disorientation due to photic or other misleading stimuli. This information is needed when making decisions regarding the management of sea turtle populations in Florida, as per the Florida Fish and Wildlife Conservation Commission's marine turtle recovery program.
This investigation thus centered around three hypotheses:
1. An increase in hatchling crawl distance due to misorientation/disorientation will result in an increase in lactate levels.
2. An increase in hatchling crawl distance will negatively impact hatchling frenzy swim performance.
3. Differences in lactate accumulation between C. mydas and C. caretta will exist due to a difference in activity levels, which may make them differentially vulnerable to risks.
Data collected included: • Blood glucose • Blood lactate • Hematocrit • Frenzy crawl/swim oxygen consumption over 200m or 500m total crawl distance • Powerstroke rate during frenzy swim (30 mins) • Breathing rate during frenzy swim (30 mins)
Hatchling Collection
All hatchlings were obtained from nests along the Boca Raton beach. The area of collection spanned the beach between the northernmost boundary of the Brighton condominium building and the southernmost boundary of the Presidential Place condominium development. Seventy-five loggerhead hatchlings have been utilized from fifteen nests and twenty green hatchlings have been used from four nests. Sixty-one percent of all turtles used thus far have served as either resting or swim controls, wherein blood is drawn and tested without simulated disorientation crawling, or blood is drawn following a 30-minute control swim. Following experimentation, all hatchlings used were either immediately transferred to Dr. Jeannette Wyneken’s lab at the Gumbo Limbo Nature Center or were released at night on Red Reef Beach.
Methods
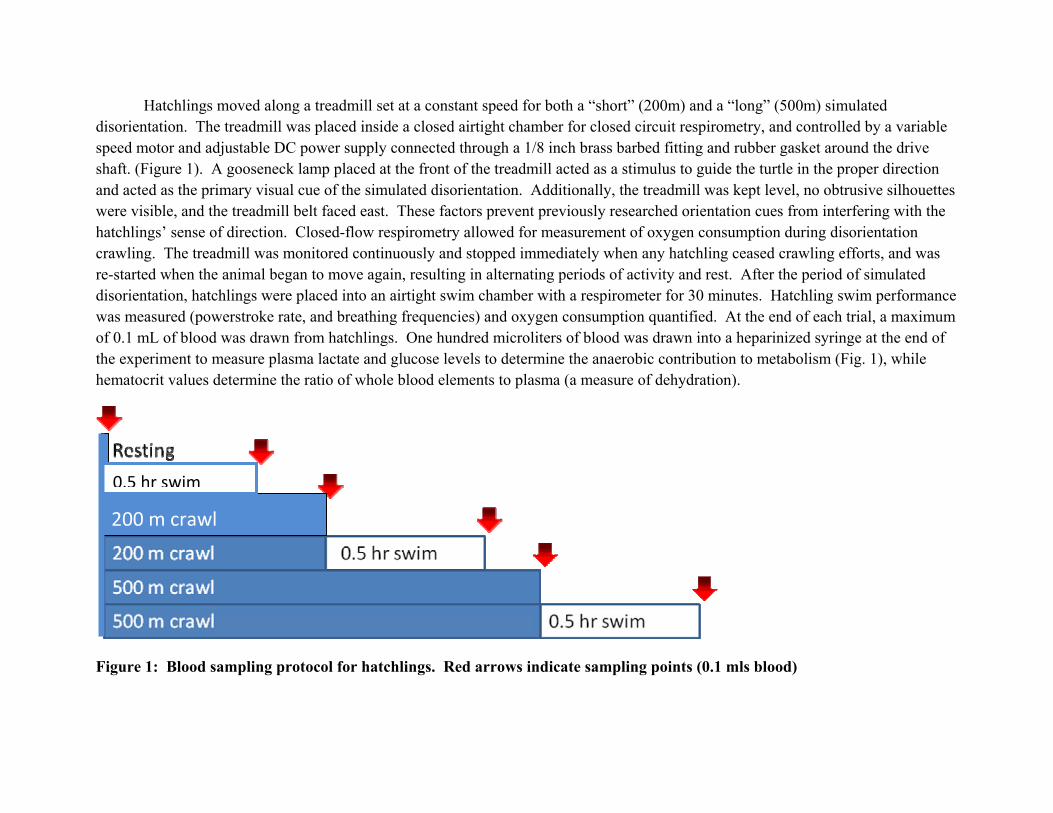
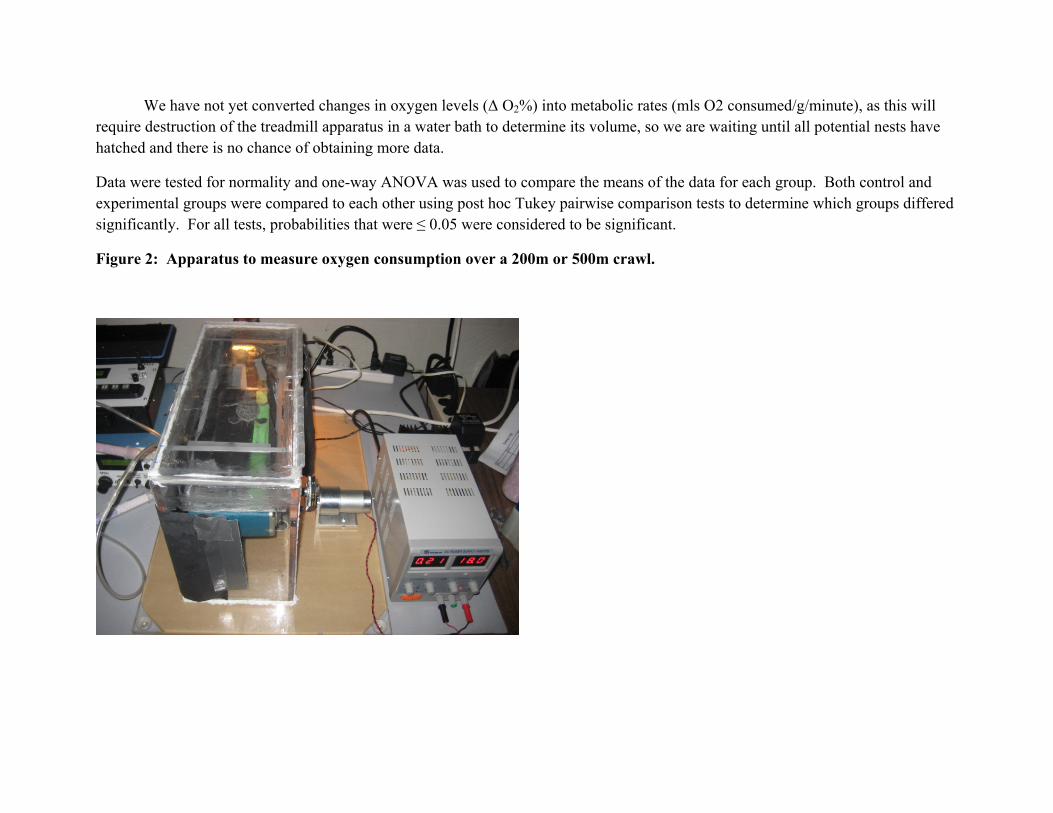
Hatchlings moved along a treadmill set at a constant speed for both a “short” (200m) and a “long” (500m) simulated disorientation. The treadmill was placed inside a closed airtight chamber for closed circuit respirometry, and controlled by a variable speed motor and adjustable DC power supply connected through a 1/8 inch brass barbed fitting and rubber gasket around the drive shaft. (Figure 1). A gooseneck lamp placed at the front of the treadmill acted as a stimulus to guide the turtle in the proper direction and acted as the primary visual cue of the simulated disorientation. Additionally, the treadmill was kept level, no obtrusive silhouettes were visible, and the treadmill belt faced east. These factors prevent previously researched orientation cues from interfering with the hatchlings’ sense of direction. Closed-flow respirometry allowed for measurement of oxygen consumption during disorientation crawling. The treadmill was monitored continuously and stopped immediately when any hatchling ceased crawling efforts, and was re-started when the animal began to move again, resulting in alternating periods of activity and rest. After the period of simulated disorientation, hatchlings were placed into an airtight swim chamber with a respirometer for 30 minutes. Hatchling swim performance was measured (powerstroke rate, and breathing frequencies) and oxygen consumption quantified. At the end of each trial, a maximum of 0.1 mL of blood was drawn from hatchlings. One hundred microliters of blood was drawn into a heparinized syringe at the end of the experiment to measure plasma lactate and glucose levels to determine the anaerobic contribution to metabolism (Fig. 1), while hematocrit values determine the ratio of whole blood elements to plasma (a measure of dehydration).
Figure 1: Blood sampling protocol for hatchlings. Red arrows indicate sampling points (0.1 mls blood)
200 m crawl
0.5 hr swim
We have not yet converted changes in oxygen levels (Δ O2%) into metabolic rates (mls O2 consumed/g/minute), as this will require destruction of the treadmill apparatus in a water bath to determine its volume, so we are waiting until all potential nests have hatched and there is no chance of obtaining more data.
Data were tested for normality and one-way ANOVA was used to compare the means of the data for each group. Both control and experimental groups were compared to each other using post hoc Tukey pairwise comparison tests to determine which groups differed significantly. For all tests, probabilities that were ≤ 0.05 were considered to be significant.
Figure 2: Apparatus to measure oxygen consumption over a 200m or 500m crawl.
Results:
Hypothesis 1: An increase in hatchling crawl distance due to misorientation/disorientation will result in an increase in lactate levels.
The frenzy crawl and the frenzy swim are both driven by a combination of aerobic and anaerobic (lactate) energy production. Thus we measured changes in oxygen levels in the closed box (to be converted to metabolic measurements of mls O2/g tissue/min eventually) as well as glucose and lactate levels in the hatchlings. Delta O2 did not differ significantly across the groups, except that O2 consumption by loggerhead hatchlings swimming after crawling 500m was significantly lower than the O2 consumption of those crawling 200m (Fig. 3, Table 3). There have been reports both that frenzy crawling takes considerably more energy than swimming for these highly adapted aquatic animals, and that frenzy swimming is more energetically costly. Dial (1987) reported a 22-fold increase in lacatet levels in frenzy crawlers, but little increase following 10 mins frenzy swimming, but Clusella et al. (2006) reported that the cost of swimming was 1.5 and 1.8 times the cost of the digging and crawling phases, respectively, in L. olivaciea hatchlings using the doubly-labelled water technique. In this study O2 consumption during swimming after 200m was also lower on average than energy consumed when crawling, but due to the variability of the data the difference was not statistically significant. The greatest difference was between oxygen consumed by green hatchlings crawling 500m vs swimming afterwards, but this was data from only one animal.
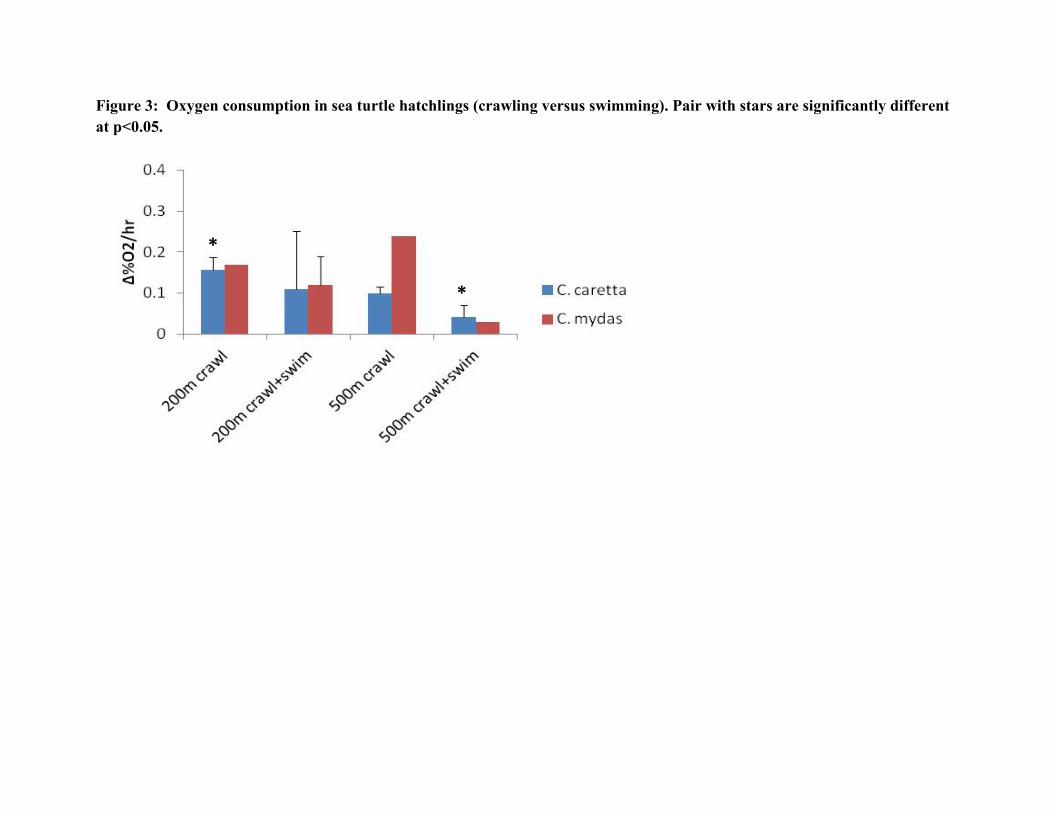
Figure 3: Oxygen consumption in sea turtle hatchlings (crawling versus swimming). Pair with stars are significantly different at p<0.05.
*
*
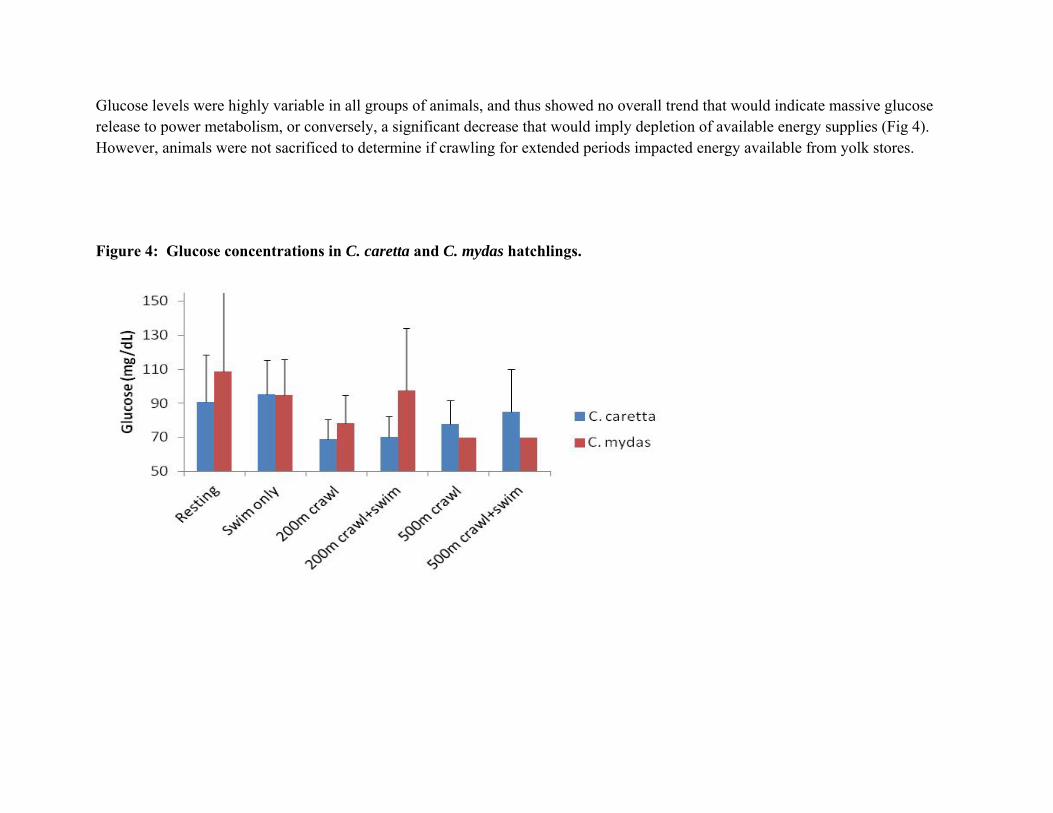
Glucose levels were highly variable in all groups of animals, and thus showed no overall trend that would indicate massive glucose release to power metabolism, or conversely, a significant decrease that would imply depletion of available energy supplies (Fig 4). However, animals were not sacrificed to determine if crawling for extended periods impacted energy available from yolk stores.
Figure 4: Glucose concentrations in C. caretta and C. mydas hatchlings.
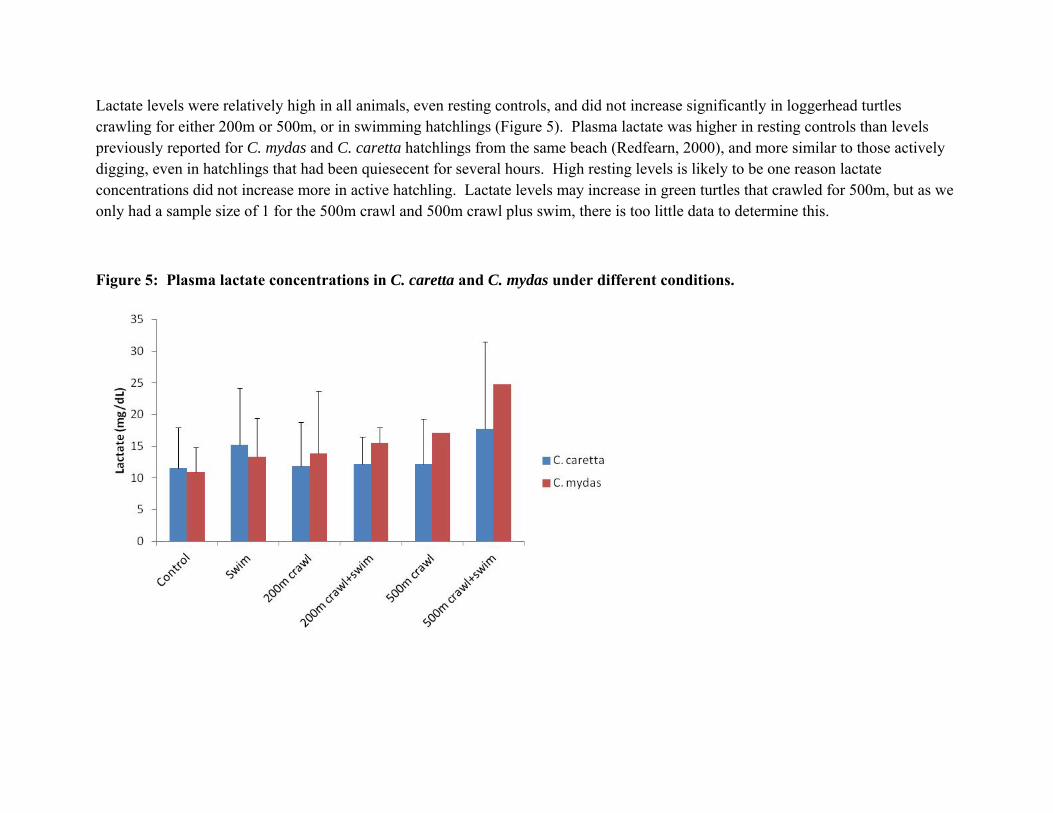
Lactate levels were relatively high in all animals, even resting controls, and did not increase significantly in loggerhead turtles crawling for either 200m or 500m, or in swimming hatchlings (Figure 5). Plasma lactate was higher in resting controls than levels previously reported for C. mydas and C. caretta hatchlings from the same beach (Redfearn, 2000), and more similar to those actively digging, even in hatchlings that had been quiesecent for several hours. High resting levels is likely to be one reason lactate concentrations did not increase more in active hatchling. Lactate levels may increase in green turtles that crawled for 500m, but as we only had a sample size of 1 for the 500m crawl and 500m crawl plus swim, there is too little data to determine this.
Figure 5: Plasma lactate concentrations in C. caretta and C. mydas under different conditions.
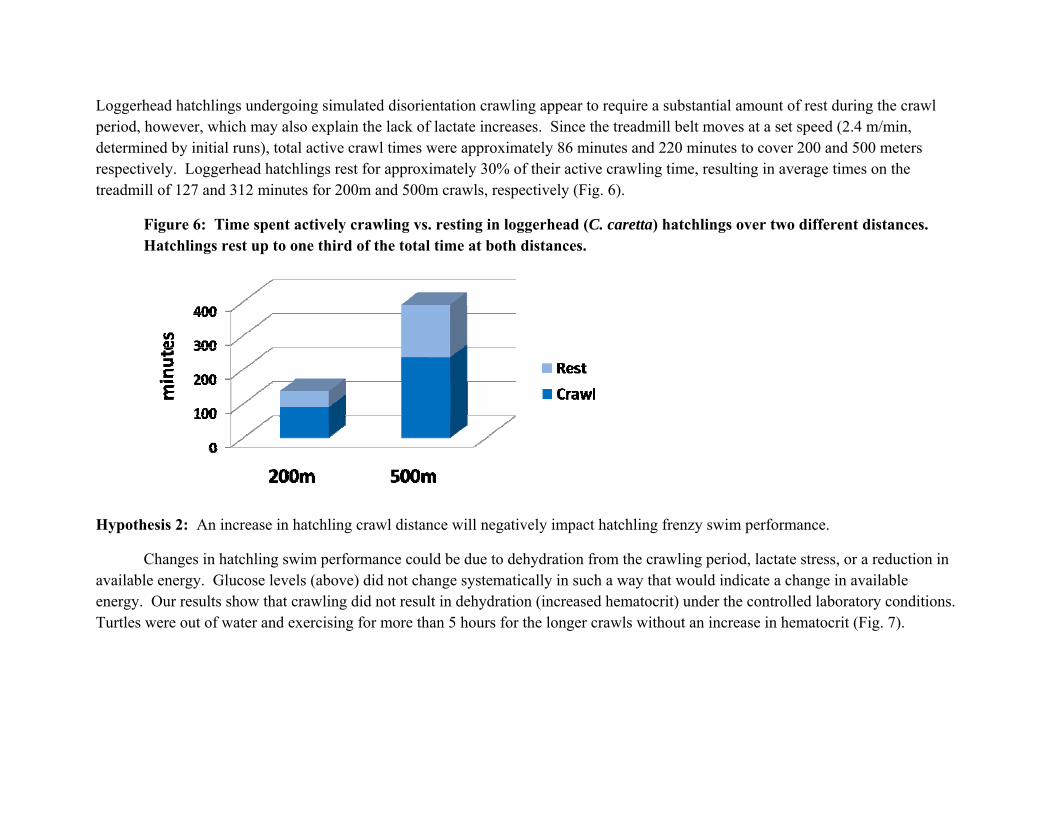
Loggerhead hatchlings undergoing simulated disorientation crawling appear to require a substantial amount of rest during the crawl period, however, which may also explain the lack of lactate increases. Since the treadmill belt moves at a set speed (2.4 m/min, determined by initial runs), total active crawl times were approximately 86 minutes and 220 minutes to cover 200 and 500 meters respectively. Loggerhead hatchlings rest for approximately 30% of their active crawling time, resulting in average times on the treadmill of 127 and 312 minutes for 200m and 500m crawls, respectively (Fig. 6).
Figure 6: Time spent actively crawling vs. resting in loggerhead (C. caretta) hatchlings over two different distances. Hatchlings rest up to one third of the total time at both distances.
Hypothesis 2: An increase in hatchling crawl distance will negatively impact hatchling frenzy swim performance.
Changes in hatchling swim performance could be due to dehydration from the crawling period, lactate stress, or a reduction in available energy. Glucose levels (above) did not change systematically in such a way that would indicate a change in available energy. Our results show that crawling did not result in dehydration (increased hematocrit) under the controlled laboratory conditions. Turtles were out of water and exercising for more than 5 hours for the longer crawls without an increase in hematocrit (Fig. 7).
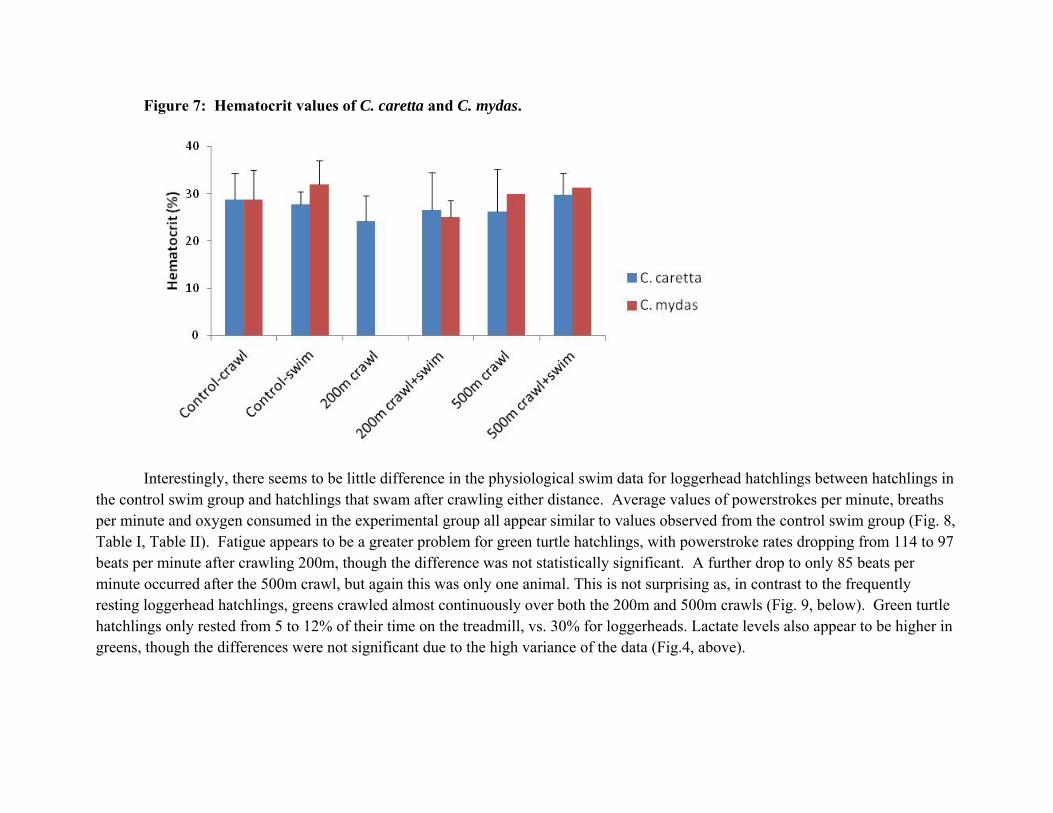
Figure 7: Hematocrit values of C. caretta and C. mydas.
Interestingly, there seems to be little difference in the physiological swim data for loggerhead hatchlings between hatchlings in the control swim group and hatchlings that swam after crawling either distance. Average values of powerstrokes per minute, breaths per minute and oxygen consumed in the experimental group all appear similar to values observed from the control swim group (Fig. 8, Table I, Table II). Fatigue appears to be a greater problem for green turtle hatchlings, with powerstroke rates dropping from 114 to 97 beats per minute after crawling 200m, though the difference was not statistically significant. A further drop to only 85 beats per minute occurred after the 500m crawl, but again this was only one animal. This is not surprising as, in contrast to the frequently resting loggerhead hatchlings, greens crawled almost continuously over both the 200m and 500m crawls (Fig. 9, below). Green turtle hatchlings only rested from 5 to 12% of their time on the treadmill, vs. 30% for loggerheads. Lactate levels also appear to be higher in greens, though the differences were not significant due to the high variance of the data (Fig.4, above).
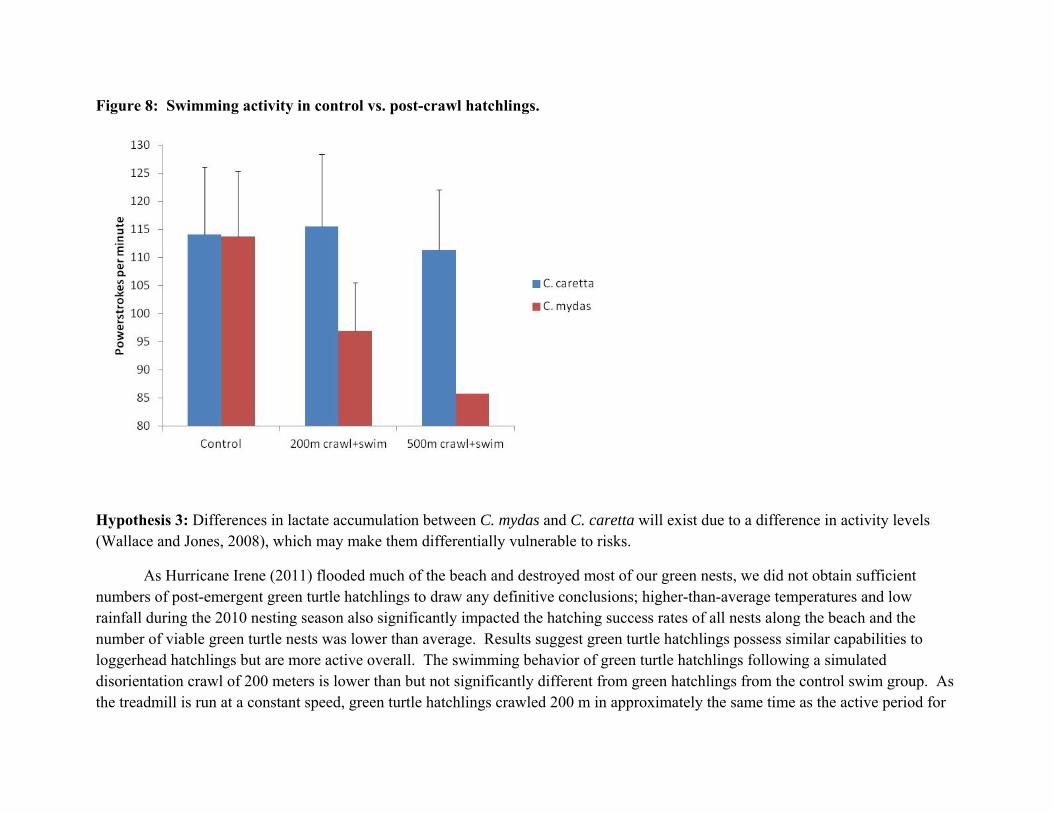
Figure 8: Swimming activity in control vs. post-crawl hatchlings.
Hypothesis 3: Differences in lactate accumulation between C. mydas and C. caretta will exist due to a difference in activity levels (Wallace and Jones, 2008), which may make them differentially vulnerable to risks.
As Hurricane Irene (2011) flooded much of the beach and destroyed most of our green nests, we did not obtain sufficient numbers of post-emergent green turtle hatchlings to draw any definitive conclusions; higher-than-average temperatures and low rainfall during the 2010 nesting season also significantly impacted the hatching success rates of all nests along the beach and the number of viable green turtle nests was lower than average. Results suggest green turtle hatchlings possess similar capabilities to loggerhead hatchlings but are more active overall. The swimming behavior of green turtle hatchlings following a simulated disorientation crawl of 200 meters is lower than but not significantly different from green hatchlings from the control swim group. As the treadmill is run at a constant speed, green turtle hatchlings crawled 200 m in approximately the same time as the active period for
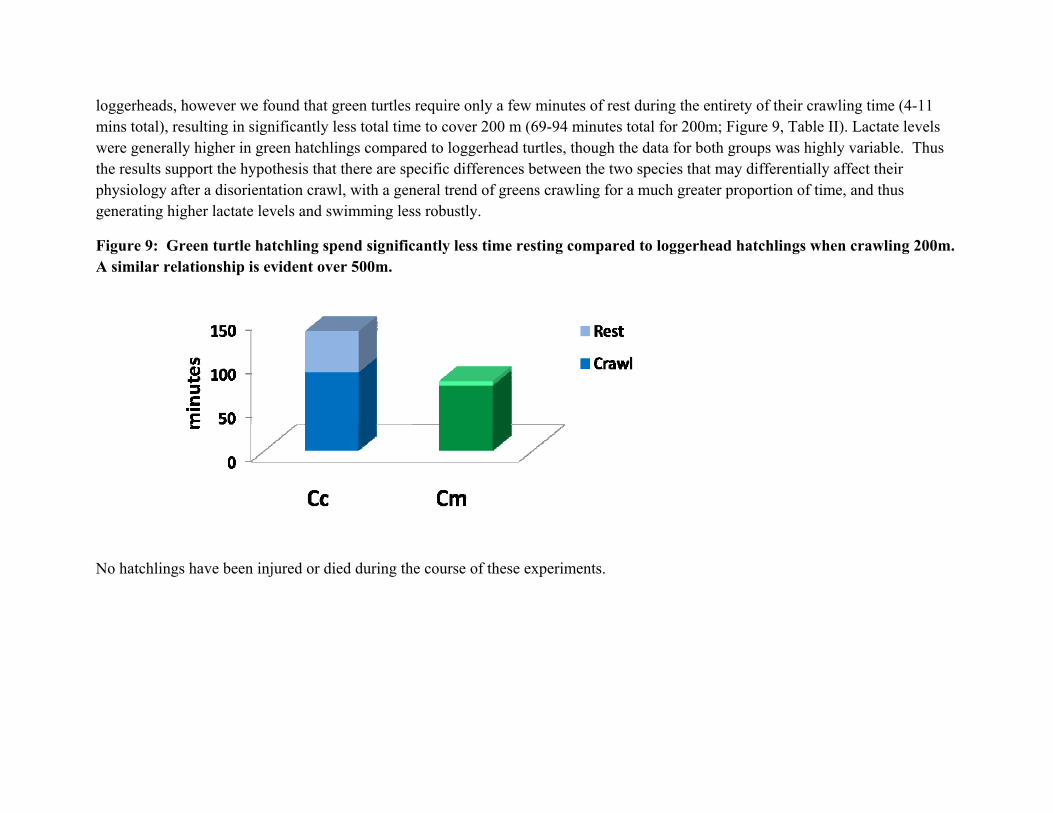
loggerheads, however we found that green turtles require only a few minutes of rest during the entirety of their crawling time (4-11 mins total), resulting in significantly less total time to cover 200 m (69-94 minutes total for 200m; Figure 9, Table II). Lactate levels were generally higher in green hatchlings compared to loggerhead turtles, though the data for both groups was highly variable. Thus the results support the hypothesis that there are specific differences between the two species that may differentially affect their physiology after a disorientation crawl, with a general trend of greens crawling for a much greater proportion of time, and thus generating higher lactate levels and swimming less robustly.
Figure 9: Green turtle hatchling spend significantly less time resting compared to loggerhead hatchlings when crawling 200m. A similar relationship is evident over 500m.
No hatchlings have been injured or died during the course of these experiments.
Discussion / Conclusions:
This investigation sought to determine the energetic cost of disorientation in loggerhead and green hatchlings to assist in determining if a hatchling’s probability of survival decreases as energy is expended upon disorientation due to photic or other misleading stimuli. The research centered around three hypotheses:
1. An increase in hatchling crawl distance due to misorientation/disorientation will result in an increase in lactate levels.
2. An increase in hatchling crawl distance will negatively impact hatchling frenzy swim performance.
3. Differences in lactate accumulation between C. mydas and C. caretta will exist due to a difference in activity levels, which may make them differentially vulnerable to risks.
As the frenzy crawl is known to involve a large component of anaerobic metabolism (lactate production), crawling for yet longer periods due to mis- or disorientation could result in excessive lactate levels, increased fatigue, and thus reduced swim performance. Measurements of blood lactate levels suggest that swimming is powered by both aerobic and anaerobic metabolism during the first 10–15 min of hatchlings entering the water (Baldwin et al., 1989), however, it is assumed that overall the swimming frenzy is primarily aerobic given the fact that swimming effort during the frenzy period declines considerably over time (Wyneken, 1997; Booth et al., 2004; Burgess et al., 2006). And indeed, Booth (2009) found that oxygen consumption was tightly correlated to swimming effort during the first 12 h of swimming in green hathlings, indicating that their swimming is predominantly aerobic. A decrease in swim performance then due to high lactate load when entering the water could be due both directly to lactate fatigue in the muscles and to a requirement for extra oxygen to repay the “oxygen debt” amd meatbolize the excess lactate.
As has been shown by previous investigators (Dial, 1987), we found that hatchlings use more energy during the crawling phase than during the swim phase. Oxygen consumption was higher in both species when crawling on the treadmill in the respirometer than when swimming for 30 minutes afterwards. However, species specific differences are apparent (though not statistically significant due to low sample numbers in the case of the greens) which could differentially affect their later risk due to a disorientation event, with a general trend of greens crawling for a much greater proportion of time, and thus generating higher lactate levels and swimming less robustly.
Green turtle hatchlings crawled for a significantly greater portion of time over both the 200m and 500m distances, though oxygen consumption (in terms of raw numbers) was similar between species. Lactate levels appear to be higher in greens, and this may be a
factor in their apparent reduction in frenzy swim activity, with longer crawls resulting in reduced rates of powerstroking. While the rates were not statistically significant due to the low numbers, a reduction of 25% (from 114 to 85 beats per minute for control swims vs. swimming after a 500m crawl) could have a significant affect biologically, increasing the time spent in nearshore waters and thus increasing the risk of predation. Powerstroke rates in control swims (not preceded by any crawling) were identical in both species, and are similar to previously published rates (about 2 beats/sec, Wyneken, 1997).
By contrast, loggerhead hatchlings showed little decrease in swim efficiency with crawling, with no difference in powerstroke rates after a 200m crawl vs. control rates, and only a 3% decrease (not significant) following a 500m crawl. The data suggest that this is because the hatchlings rest a great deal (about 30% of the time) when crawling both over 200m and 500m; they have no increase in lactate during these crawls either. That the hatchlings are metabolizing lactate during this period is suggested both by the fact that lactate levels do not increase during the crawl, and that the loggerheads have a similar mean O2 consumption to the continuously crawling greens, suggesting that rest periods are times in which the oxygen debt of lactate buildup is repaid. Thus unlike the much shorter period of a typical frenzy crawl that would get the hatchlings from nest to surf, where resting has not been noted (personal observation), loggerhead hatchlings will stop frequently over long distances. While this maintains low plasma lactate levels and prevents fatigue, the long rest periods will increase their exposure to the other potential impacts of disorientation: terrestrial predation and the potential for temperature and dehydration stress. While we found no evidence of dehydration stress in either species, the experiments were done under controlled conditions, at night, in a room maintained at 24°C. Thus while the time out of the water and the effort of crawling itself did not result in dehydration, a turtle crawling for 5 hours or more on the beach may still be there at daybreak, where the heat would rapidly take a toll.
Thus the results suggest that there is indeed a risk for hatchlings due to mis- or disorientation events, and that this risk is different for different species. While the overall more active greens are able to crawl continuously even for long distances, this may result in lactate buildup, fatigue, and reduced swim capacity. Loggerhead hatchlings, on the other hand, rest frequently over long distances, which we hypothesize prevents excessive lactate buildup, but this results in greatly extended periods during which the hatchlings would be vulnerable to predation, overheating, and dehydration stress.
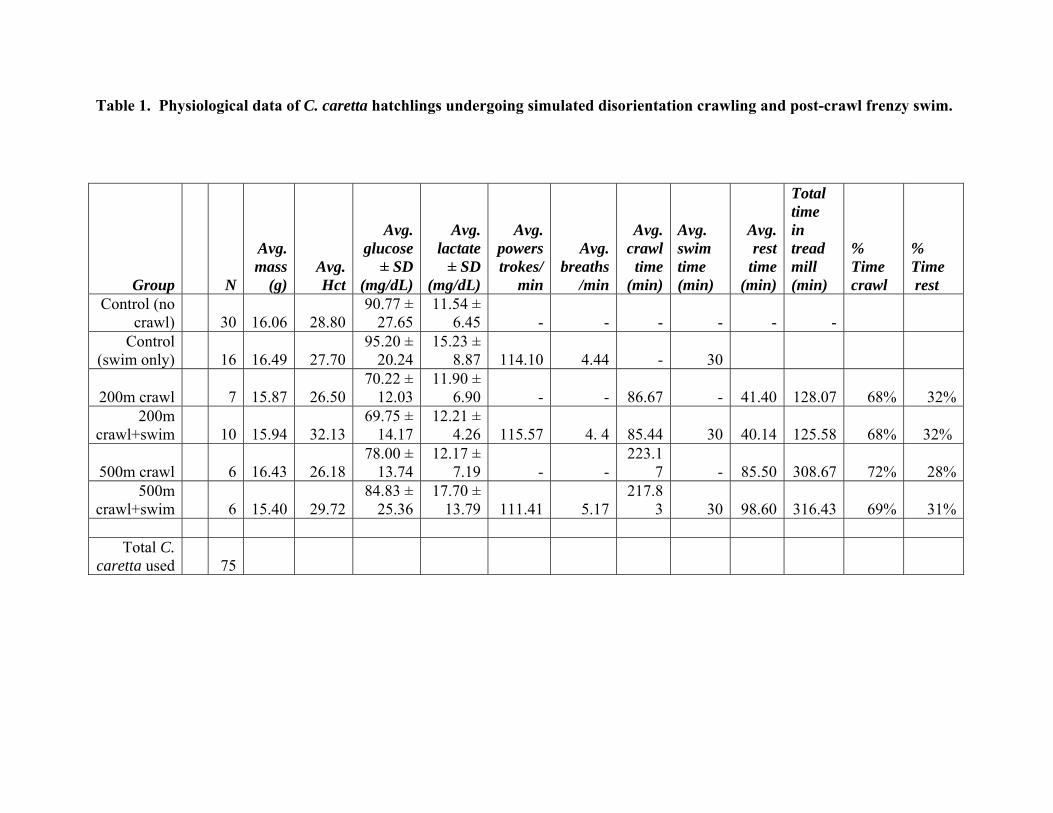
Table 1. Physiological data of C. caretta hatchlings undergoing simulated disorientation crawling and post-crawl frenzy swim.
Group N
Avg. mass
(g) Avg. Hct
Avg. glucose
± SD (mg/dL)
Avg. lactate
± SD (mg/dL)
Avg. powerstrokes/
min
Avg. breaths
/min
Avg. crawl time
(min)
Avg. swim time (min)
Avg. rest
time (min)
Total time in treadmill (min)
% Time crawl
% Time rest
Control (no crawl) 30 16.06 28.80
90.77 ± 27.65
11.54 ± 6.45 - - - - - -
Control (swim only) 16 16.49 27.70
95.20 ± 20.24
15.23 ± 8.87 114.10 4.44 - 30
200m crawl 7 15.87 26.5070.22 ±
12.0311.90 ±
6.90 - - 86.67 - 41.40 128.07 68% 32%200m
crawl+swim 10 15.94 32.1369.75 ±
14.1712.21 ±
4.26 115.57 4. 4 85.44 30 40.14
125.58 68%
32%
500m crawl 6 16.43 26.1878.00 ±
13.7412.17 ±
7.19 - - 223.1
7 - 85.50 308.67 72% 28%500m
crawl+swim 6 15.40 29.7284.83 ±
25.3617.70 ±
13.79 111.41 5.17 217.8
3 30 98.60
316.43 69% 31%
Total C. caretta used 75
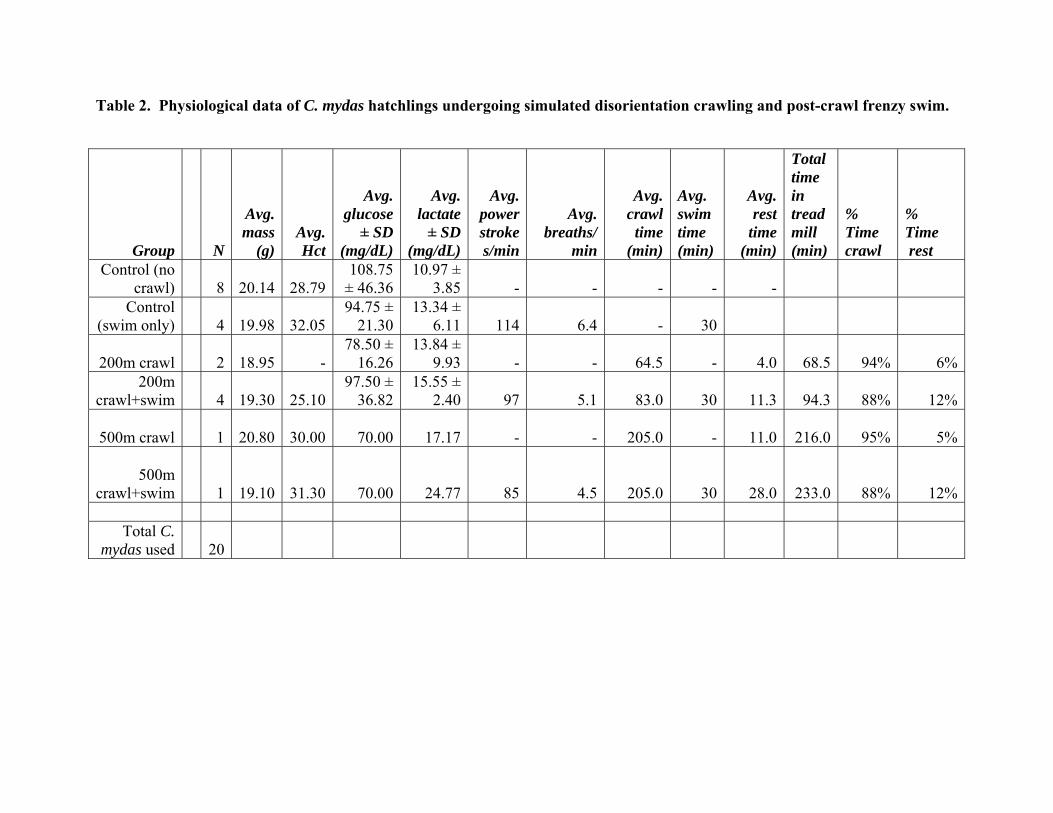
Table 2. Physiological data of C. mydas hatchlings undergoing simulated disorientation crawling and post-crawl frenzy swim.
Group N
Avg. mass
(g) Avg. Hct
Avg. glucose
± SD (mg/dL)
Avg. lactate
± SD (mg/dL)
Avg. powerstrokes/min
Avg. breaths/
min
Avg. crawl time
(min)
Avg. swim time (min)
Avg. rest
time (min)
Total time in treadmill (min)
% Time crawl
% Time rest
Control (no crawl) 8 20.14 28.79
108.75 ± 46.36
10.97 ± 3.85 - - - - -
Control (swim only) 4 19.98 32.05
94.75 ± 21.30
13.34 ± 6.11 114 6.4 - 30
200m crawl 2 18.95 - 78.50 ±
16.2613.84 ±
9.93 - - 64.5 - 4.0 68.5 94% 6%200m
crawl+swim 4 19.30 25.10 97.50 ±
36.8215.55 ±
2.40 97 5.1 83.0 30 11.3
94.3 88% 12%
500m crawl 1 20.80 30.00 70.00 17.17 - - 205.0 - 11.0 216.0 95% 5%
500m crawl+swim 1 19.10 31.30 70.00 24.77 85 4.5 205.0 30 28.0
233.0 88% 12%
Total C.
mydas used 20
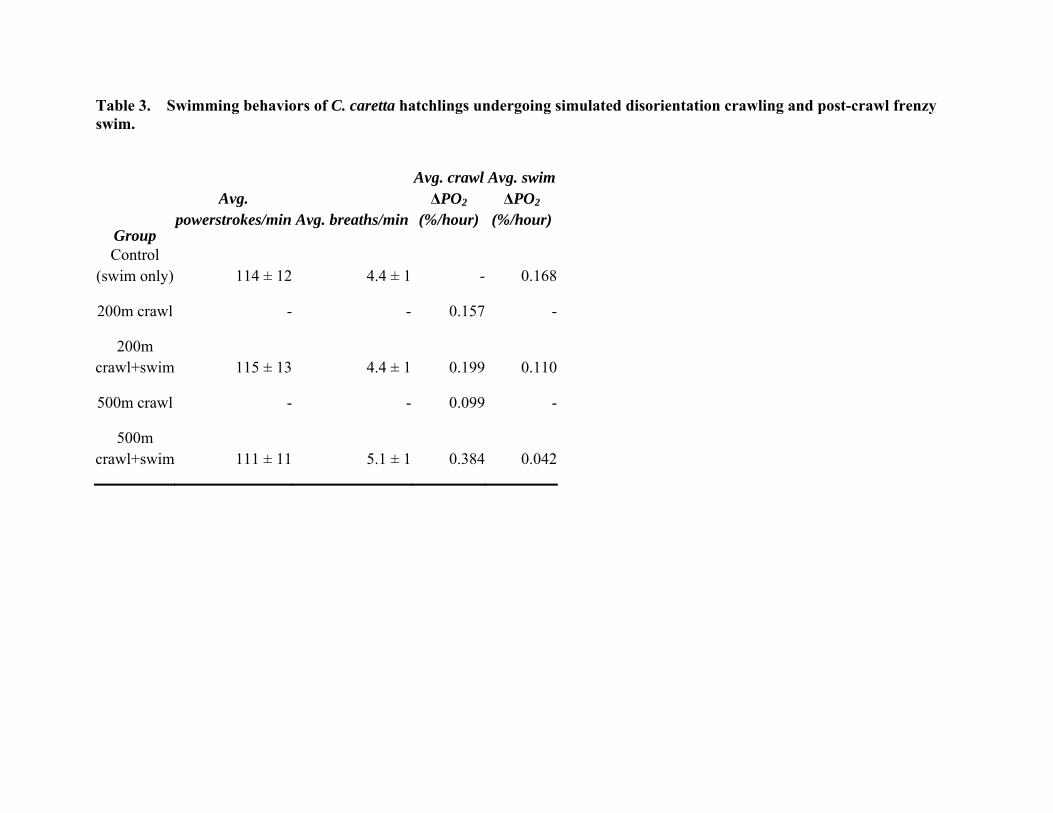
Table 3. Swimming behaviors of C. caretta hatchlings undergoing simulated disorientation crawling and post-crawl frenzy swim.
Group
Avg. powerstrokes/min Avg. breaths/min
Avg. crawl ΔPO2
(%/hour)
Avg. swim ΔPO2
(%/hour)
Control (swim only) 114 ± 12 4.4 ± 1 - 0.168
200m crawl - - 0.157 -
200m crawl+swim 115 ± 13 4.4 ± 1 0.199 0.110
500m crawl - - 0.099 -
500m crawl+swim 111 ± 11 5.1 ± 1 0.384 0.042
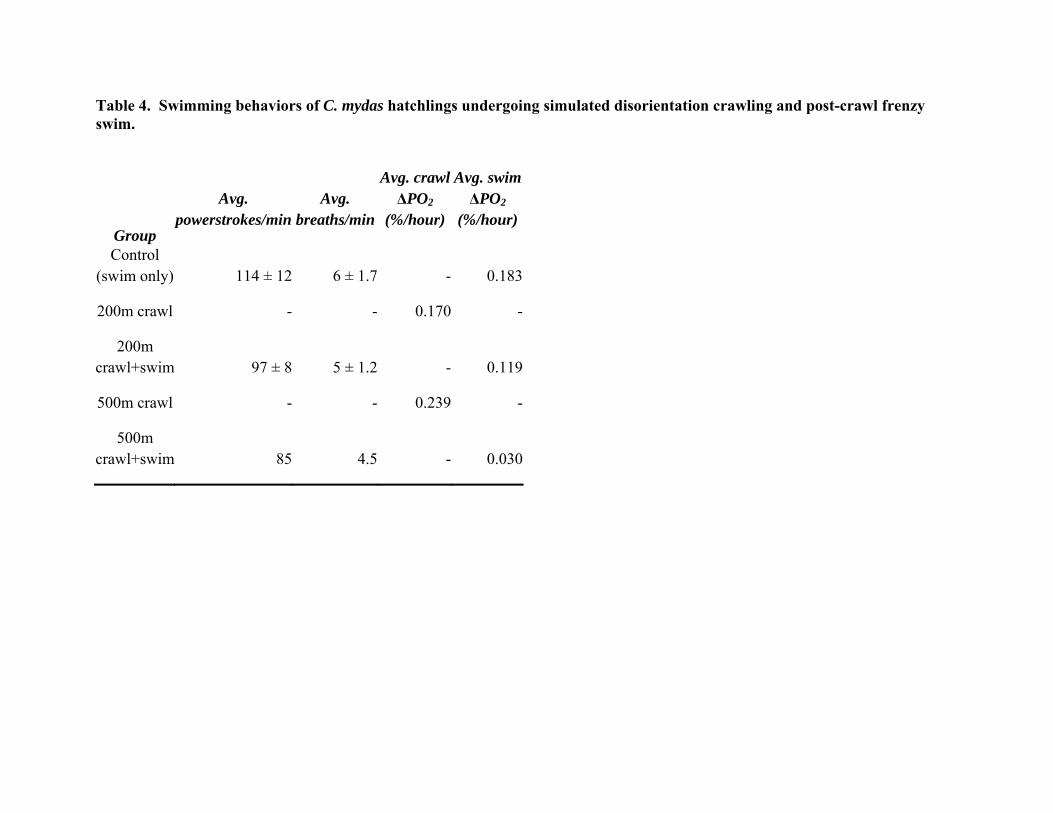
Table 4. Swimming behaviors of C. mydas hatchlings undergoing simulated disorientation crawling and post-crawl frenzy swim.
Group
Avg. powerstrokes/min
Avg. breaths/min
Avg. crawl ΔPO2
(%/hour)
Avg. swim ΔPO2
(%/hour)
Control (swim only) 114 ± 12 6 ± 1.7 - 0.183
200m crawl - - 0.170 -
200m crawl+swim 97 ± 8 5 ± 1.2 - 0.119
500m crawl - - 0.239 -
500m crawl+swim 85 4.5 - 0.030
Literature Cited
Ackerman, R. 1997. The Nest Environment and the Embryonic Development of Sea Turtles. In: Lutz, P. L. ,Musick, J. A. (Ed), The Biology of Sea Turtles. Volume I. CRC Marine Biology Series, CRC Press, Inc.: Boca Raton, London, New York, Tokyo 432 pp.; 1997, p. 83-106.
Baldwin J., E. Gyruis, K. Mortimer and A. Patak. 1989. Anaerobic metabolism during dispersal of green and loggerhead turtle hatchlings. Comp Bio and Phys Part A, Physiology 94:663-665.
Barton, B.T. and J.D. Roth. 2008. Implications of intraguild predation for sea turtle nest protection. Biological Conservation 141:2139-2145.
Blair, K. 2001. High Sub-Lethal Temperature Effects on the Movement of Loggerhead Sea Turtle (Caretta caretta) Hatchlings, honors thesis, University of Miami, FL.
Bolten, A. 2003. Variation in Sea Turtle Life History Patterns: Neritic vs. Oceanic Developmental Stages. In: Lutz, P. L. ,Musick, J. A. ,Wyneken, J. Editors, The Biology of Sea Turtles. Volume II. CRC Marine Biology Series, CRC Press, Inc.: Boca Raton, London, New York, Washington D.C. 455 pp.; 2003, p. 243-257.
Booth DT. 2009. Swimming for your life: locomotor effort and oxygen consumption during the green turtle (Chelonia mydas) hatchling frenzy. J Exp Biol. 212(Pt 1):50-5.
Booth, D. T., Burgess, E., McCosker, J. and Lanyon, J. M. (2004). The influence of incubation temperature on post-hatching fitness characteristics of turtles. Int. Congr. Ser. 1275,226 -233.
Bjorndal K., A.B. Bolten and H.R. Martins. 2000. Somatic growth model of juvenile loggerhead sea turtles Caretta caretta: duration of pelagic stage. Marine Ecology Progress Series 202:265-272.
Burgess, E., Booth, D. T. and Lanyon, J. M. (2006). Swimming performance of hatchling green turtles is affected by incubation temperature. Coral Reefs 25,341 -349.
Carr, A. 1986. Rips, FADS, and little loggerheads. Bioscience 36:92-100.

Dial, B.E. 1987. Energetics and performance during nest emergence and the hatchling frenzy in loggerhead sea turtles (Caretta caretta). Herpetologica 43:307-315.
Engeman, R.M., Martin, R.E., Constantin, B., Noel, R., Woolard, J. 2003. Monitoring predators to optimize their management for marine turtle nest protection. Biological Conservation 113:171-178.
Gelli, D., Ferrari, V., Zanella, A., Arena, P., Pozzi, L., Nannarelli, S. et al. 2009. Establishing physiological blood parameters in the loggerhead sea turtle (Caretta caretta). Eur J Wildl Res 55:59-63.
Giles, E.R., Wyneken, J. and S.L. Milton. Anaerobic metabolism and nest environment of loggerhead, green, and leatherback sea turtle hatchlings. In prep.
Gyuris, E. The rate of predation by fishes on hatchlings of the green turtle (Chelonia mydas). Coral Reefs; 1994(13), no. 3, p. 137-144.
Kraemer J.E. and S.H. Bennett. 1981. Utilization of posthatching yolk in loggerhead sea turtles, Caretta caretta. Copeia 1981(2):406-411.
Lohmann, K.J., Witherington, B.E., Lohmann, C.M., and M. Salmon. Orientation, Navigation, and Natal Beach Homing in Sea Turtles. 1997. In: Lutz, P. L. ,Musick, J. A. (Ed), The Biology of Sea Turtles. Volume I. CRC Marine Biology Series, CRC Press, Inc.: Boca Raton, London, New York, Tokyo 432 pp.; 1997, p. 387-409.
Milton, S. and P.L. Lutz. 2003. Physiological and Genetic Responses to Environmental Stress. In: Lutz, P. L. ,Musick, J. A. ,Wyneken, J. Editors, The Biology of Sea Turtles. Volume II. CRC Marine Biology Series, CRC Press, Inc.: Boca Raton, London, New York, Washington D.C. 455 pp.; 2003, p. 163-197.
Lutcavage, M.E., Plotkin, P., Witherington, B.E., and P.L. Lutz. Human Impacts on Sea Turtle Survival. 1997. In: Lutz, P. L. ,Musick, J. A. (Ed), The Biology of Sea Turtles. Volume I. CRC Marine Biology Series, CRC Press, Inc.: Boca Raton, London, New York, Tokyo 432 pp.; 1997, p. 107-135.
Miller, J.D. 1997. Reproduction In Sea Turtles. In: Lutz, P. L. ,Musick, J. A. (Ed), The Biology of Sea Turtles. Volume I. CRC Marine Biology Series, CRC Press, Inc.: Boca Raton, London, New York, Tokyo 432 pp.; 1997, p. 51-81.
Miller, N.A. 2008. PO2 in loggerhead sea turtle (Caretta caretta) nests measured using fiber-optic oxygen sensors. Copeia 2008(4):882-888.
Milton, S. and P.L. Lutz. 2003. Physiological and Genetic Responses to Environmental Stress. In: Lutz, P. L. ,Musick, J. A. ,Wyneken, J. Editors, The Biology of Sea Turtles. Volume II. CRC Marine Biology Series, CRC Press, Inc.: Boca Raton, London, New York, Washington D.C. 455 pp.; 2003, p. 163-197.
O’Hara, J. 1980. Thermal influences on swimming speed of loggerhead turtle hatchlings. Copeia 1980(4):773-780.
Redfearn, E. C. 2000. A comparative approach to understanding sea turtle hatchling metabolism during emergence (Caretta caretta, Chelonia mydas, Dermochelys coriacea).
M.S. thesis. Florida Atlantic . University, Boca Raton; 105 pp.
Salmon, M., Wyneken, J. 1987. Orientation and swimming behavior of hatchling loggerhead turtles Caretta caretta L. during their offshore migration. J Exp Biol and Ecol;109(2): 137-153
Tuxbury, S.M. and M. Salmon. 2005. Competitive interactions between artificial lighting and natural cues during seafinding by hatchling marine turtles. Biol. Cons. 121:311-316
Wallace, B.P. and T.T. Jones. 2008. What makes marine turtles go: A review of metabolic rates and their consequences. J Exp Marine Bio and Eco 356:8-24.
Whelan, C.L. and J. Wyneken. 2007. Estimating Predation Levels and Site-specific Survival of Hatchling Loggerhead Seaturtles (Caretta caretta) from South Florida Beaches. Copeia 2007(3):745-754.
Wyneken, J. 1997. Sea turtle locomotion: mechanisms, behavior, and energetics. In Biology of Sea Turtles (ed. P. Lutz), pp. 165-198. New York: CRC Press.
Wyneken J. and M. Salmon. 1992. Frenzy and post-frenzy swimming activity in loggerhead, green, and leatherback hatchling sea turtles. Copeia 1992(2):478-484.