Embed Size (px)
Citation preview

GRADUATE SIMFUND 2015-16December 4th 2015

INTRODUCTION
Charlize Zhou James Kohlbeck Mridul Reddy Donald Bricker
Venkata Ghanta Camden Forgia Rhett Dayton
2
AGENDA
• Objective
• Asset Allocation
• In depth analysis
– Equity
– REITS
– Fixed Income
• Next Steps
3
OBJECTIVE
• Apply range of course principles to SIMFUND
• Understand the practical challenges
• Utilize resources to maximize learning while managing scope of the fund activities
4
ASSET ALLOCATION
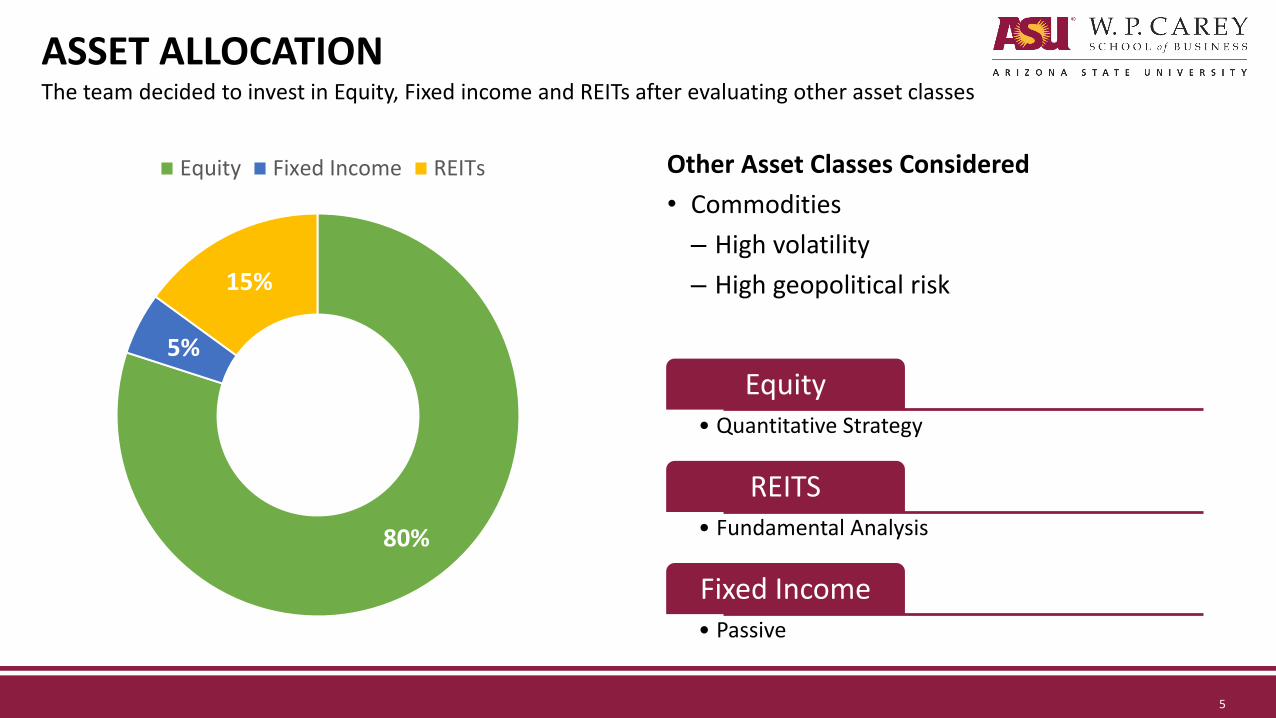
80%
5%
15%
Equity Fixed Income REITs
The team decided to invest in Equity, Fixed income and REITs after evaluating other asset classes
5
Equity• Quantitative Strategy
REITS• Fundamental Analysis
Fixed Income• Passive
Other Asset Classes Considered
• Commodities
– High volatility
– High geopolitical risk

EQUITY STRATEGY
6

MOTIVATION
Investment Strategy
Quantitative Analysis
Event based strategies
Earnings
Dividend Yield
Inside Information
Merger Arbitrage
Value
Profitability
MomentumFundamental Analysis
We evaluated several options before narrowing down on the quantitative strategy
7

MOTIVATION
Investment Strategy
Quantitative Analysis
Event based strategies
Earnings
Dividend Yield
Inside Information
Merger Arbitrage
Value
Profitability
MomentumFundamental Analysis
We evaluated several options before narrowing down on the quantitative strategy
8
PROFITABILITY AND MOMENTUM
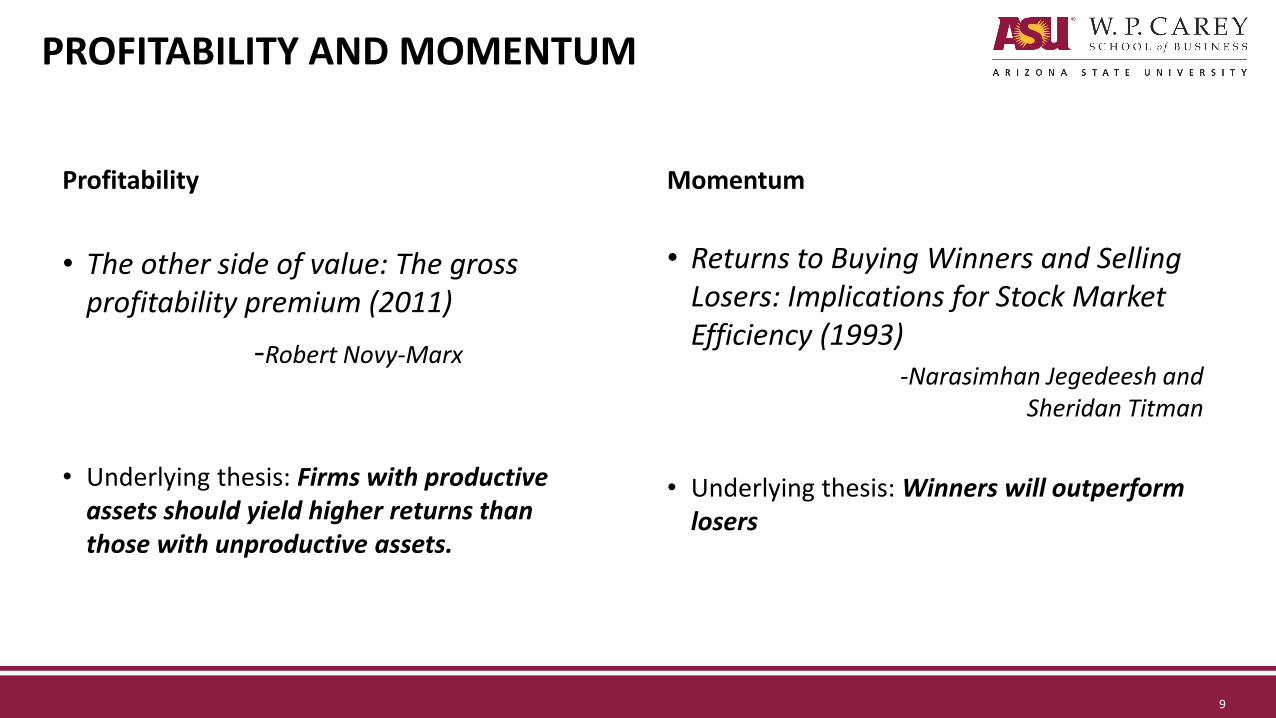
Profitability
• The other side of value: The gross profitability premium (2011)
-Robert Novy-Marx
• Underlying thesis: Firms with productive assets should yield higher returns than those with unproductive assets.
9
Momentum
• Returns to Buying Winners and Selling Losers: Implications for Stock Market Efficiency (1993)
-Narasimhan Jegedeesh and Sheridan Titman
• Underlying thesis: Winners will outperform losers

EQUITY STRATEGYA growth investment strategy focusing on profitability and momentum of stocks was selected
10
Profitability Momentum
• Profitability of stocks was measured for each of the past four quarters:
𝑷𝒓𝒐𝒇𝒊𝒕𝒂𝒃𝒊𝒍𝒊𝒕𝒚 =𝑹𝒆𝒗𝒆𝒏𝒖𝒆 − [𝑪𝑶𝑮𝑺]
𝑨𝒔𝒔𝒆𝒕𝒔
• Crude revenue and cost figures helped eliminate noise from stocks
• Momentum was calculated based on prior 6 months performance of stocks
• The intersection of the two defined the stock universe from which scripts were selected

EQUITY STRATEGY
• Market cap restriction
– Minimum of $3 Bn.
– Maximum of $40 Bn.
• Profitability ranking was calculated by assigning higher weights to the profitability figure of the latest quarter
Profitability ranking = 0.4xPt + 0.2x[Pt-1 + Pt-2 + Pt-3]
• Momentum ranking was calculated by measuring return over a six month period
• A composite rank of profitability and momentum was assigned to each script
𝑪𝒐𝒎𝒑𝒐𝒔𝒊𝒕𝒆 𝑹𝒂𝒏𝒌 =𝑷𝒓𝒐𝒇𝒊𝒕𝒂𝒃𝒊𝒍𝒊𝒕𝒚 𝑹𝒂𝒏𝒌 +[𝑴𝒐𝒎𝒆𝒏𝒕𝒖𝒎𝑹𝒂𝒏𝒌]
𝟐
• The stocks were ranked based on the composite rank
• The top 50 stocks were selected from the composite ranking index
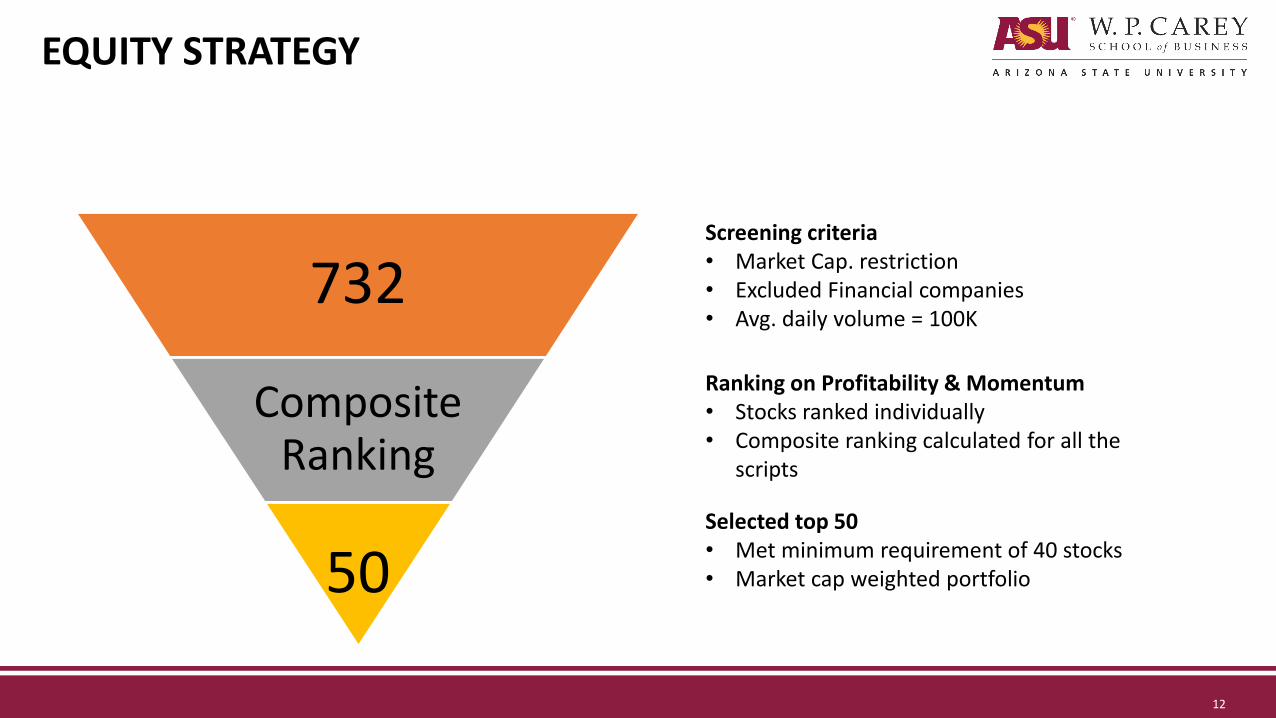
Stocks were screened based on the following screening criteria
11
EQUITY STRATEGY
732
Composite Ranking
50
12
Screening criteria• Market Cap. restriction• Excluded Financial companies• Avg. daily volume = 100K
Ranking on Profitability & Momentum• Stocks ranked individually• Composite ranking calculated for all the
scripts
Selected top 50• Met minimum requirement of 40 stocks• Market cap weighted portfolio
EQUITY PORTFOLIO SNAPSHOT
13
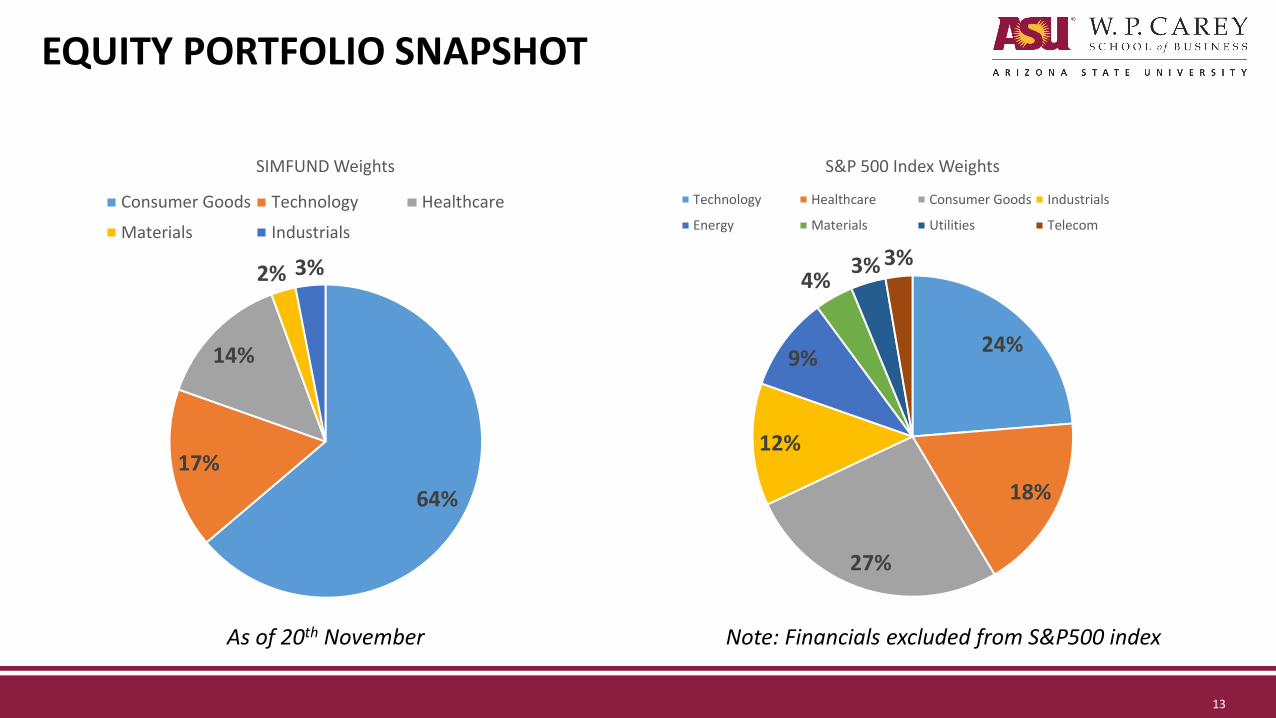
64%
17%
14%
2% 3%
SIMFUND Weights
Consumer Goods Technology Healthcare
Materials Industrials
24%
18%
27%
12%
9%
4%3% 3%
S&P 500 Index Weights
Technology Healthcare Consumer Goods Industrials
Energy Materials Utilities Telecom
Note: Financials excluded from S&P500 indexAs of 20th November
EQUITY PORTFOLIO SNAPSHOT
14
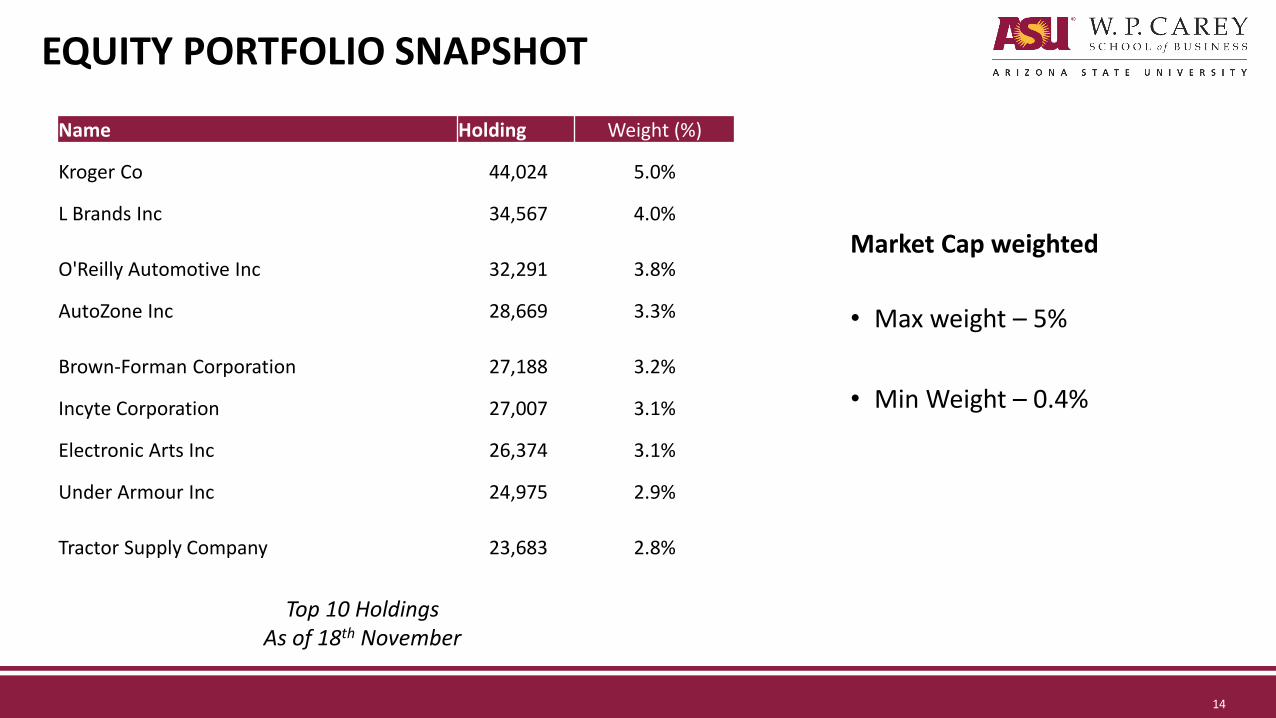
Top 10 Holdings As of 18th November
Name Holding Weight (%)
Kroger Co 44,024 5.0%
L Brands Inc 34,567 4.0%
O'Reilly Automotive Inc 32,291 3.8%
AutoZone Inc 28,669 3.3%
Brown-Forman Corporation 27,188 3.2%
Incyte Corporation 27,007 3.1%
Electronic Arts Inc 26,374 3.1%
Under Armour Inc 24,975 2.9%
Tractor Supply Company 23,683 2.8%
Market Cap weighted
• Max weight – 5%
• Min Weight – 0.4%

REBALANCING & IMPLEMENTATION
15
Rebalancing• Monthly• Hard stop on 50 stocks
Trading costs stem from price drifts during buying or selling
Market Cap weighting will reduce the effect of high turnover

PORTFOLIO BACKTEST
16

REITS
17
REIT STRATEGY
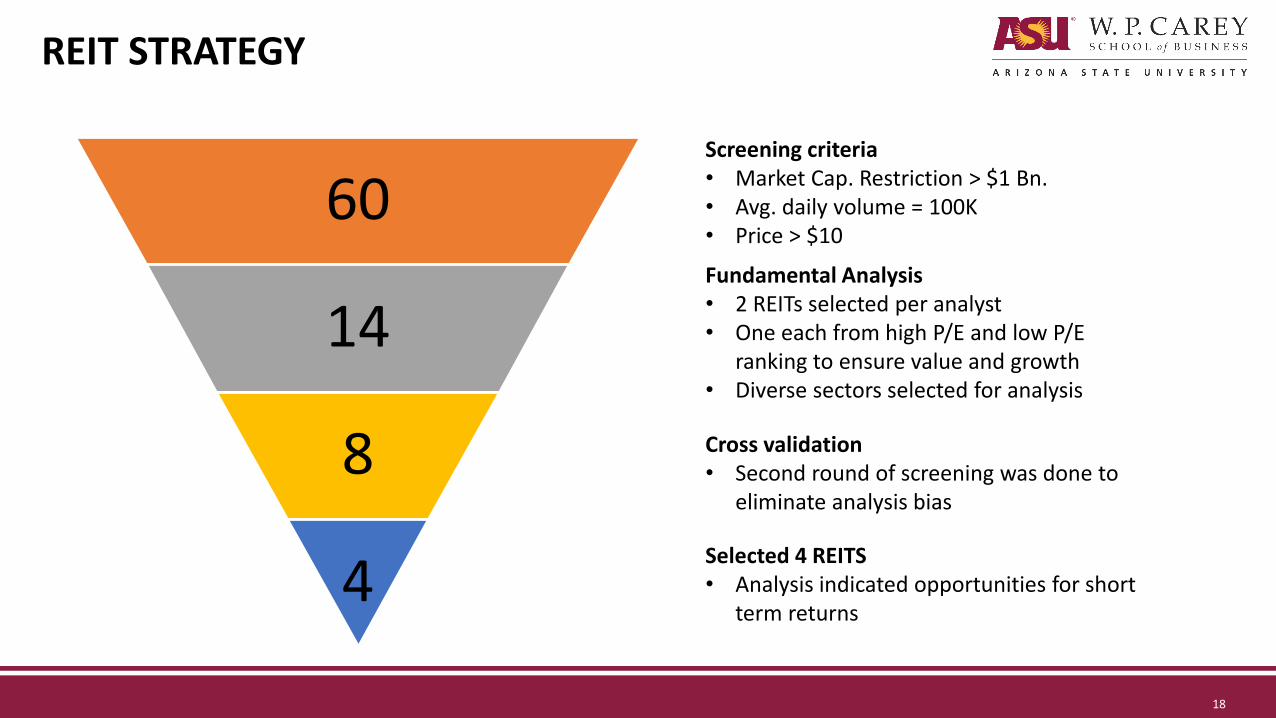
60
14
8
4
18
Screening criteria• Market Cap. Restriction > $1 Bn.• Avg. daily volume = 100K• Price > $10
Fundamental Analysis• 2 REITs selected per analyst• One each from high P/E and low P/E
ranking to ensure value and growth• Diverse sectors selected for analysis
Selected 4 REITS• Analysis indicated opportunities for short
term returns
Cross validation• Second round of screening was done to
eliminate analysis bias

EXTRA SPACE STORAGE (EXR)
Share Price 83.7
Shares Out. 123.5
Market Capitalization 10,337
Total Enterprise Value 13,830
Revenue (2014) 647
EBITDA (2014) 394
FFO/Share (2014) 2.52
Cost of Capital 8.5%
Revenue (2016) 871
EBITDA (2016) 501
FFO/Share (2016) 3.87
Terminal growth 3%
Div Yield 2.65%
COMPANY DESCRIPTION
• STORAGE REIT – Owns more than 828 facilities in 35 states, concentrated in west coast and metros
• Volatile Revenue Streams: 92% occupancy, SEASONAL DEMAND, Dividend yield of 2.65% (Increasing)
• Moderate Financial position: D/A = 55%, D/E = 34%
• LOT OF ROOM FOR CONSOLIDATION: EXR has a market share of ~4% with 85% of market being controlled by non-REITs (Small and local property owners)
CMP$83.93
Target Price$95.83
19

CUBE SMART (CUBE)
COMPANY DESCRIPTION
• STORAGE REIT – Owns more than 420 facilities in 22 states, Manages 174 facilities for third parties, focus in east coast
• Volatile Revenue Streams: 89% occupancy, SEASONAL DEMAND, Div yield of 2.5% (Increasing)
• Operating Expense margin 55% (‘10) – 41% (‘15)
• Moderate Financial position: D/A = 36% (<1% Secured), D/E = 25%, BBB
• LOT OF ROOM FOR CONSOLIDATION: CUBE has a market share of ~2% with 85% of market being controlled by non-REITs (Small and local property owners)
Share Price 29.2
Shares Out. 172.5
Market Capitalization 5,018
Total Enterprise Value 6,255
Revenue (2014) 377
EBITDA (2014) 220
FFO/Share (2014) 0.89
Cost of Capital 9%
Revenue (2016) 504
EBITDA (2016) 302
FFO/Share (2016) 1.41
Terminal growth 3%
Div Yield 2.5%
CMP$29.34
Target Price$33.95
20
SENIOR HOUSING TRUST (SNH)
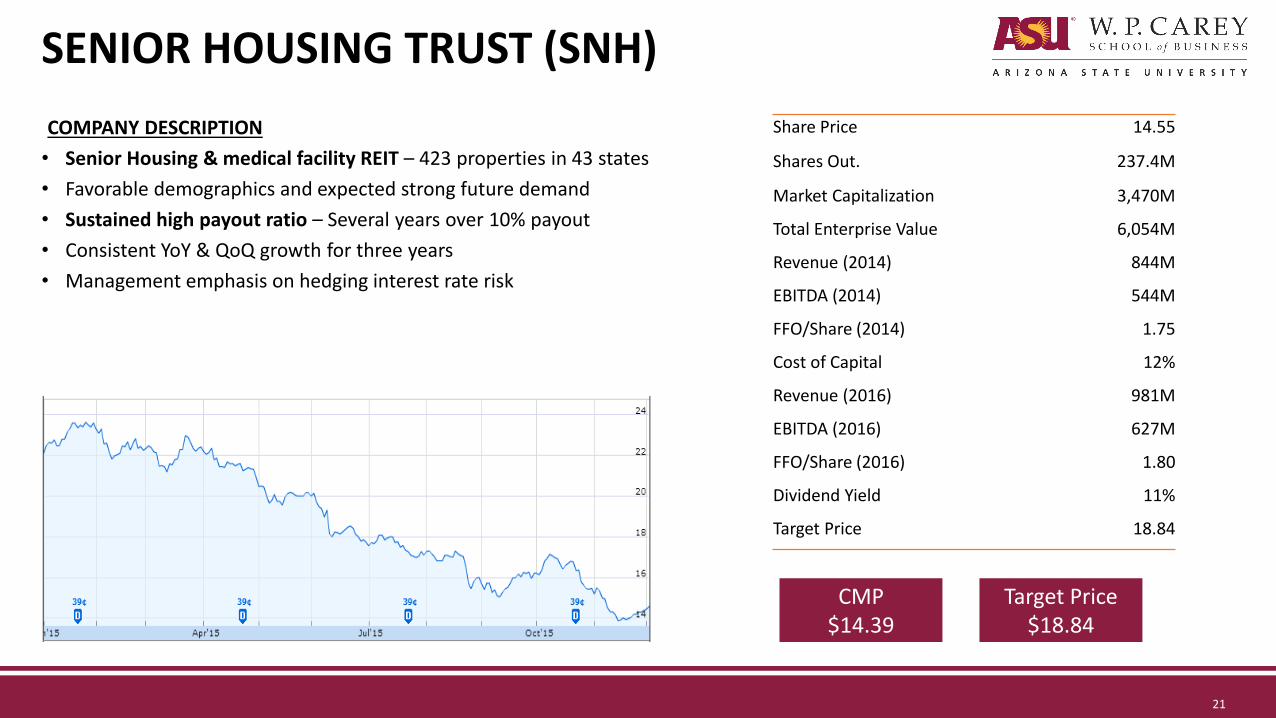
COMPANY DESCRIPTION
• Senior Housing & medical facility REIT – 423 properties in 43 states
• Favorable demographics and expected strong future demand
• Sustained high payout ratio – Several years over 10% payout
• Consistent YoY & QoQ growth for three years
• Management emphasis on hedging interest rate risk
CMP$14.39
Target Price$18.84
Share Price 14.55
Shares Out. 237.4M
Market Capitalization 3,470M
Total Enterprise Value 6,054M
Revenue (2014) 844M
EBITDA (2014) 544M
FFO/Share (2014) 1.75
Cost of Capital 12%
Revenue (2016) 981M
EBITDA (2016) 627M
FFO/Share (2016) 1.80
Dividend Yield 11%
Target Price 18.84
21

ESSEX PROPERTY TRUST (ESS)
COMPANY DESCRIPTION
• Apartment REIT – Owns apartments and commercial buildings in west metropolitan areas including Los Angeles, San Francisco and Seattle.
– Owns 239 communities, aggregating 57,455 units
• Demand growth
– Increase in youth wealth, strict lending, 1.25 M permits (400k avg. scrap rate) – below est. demand of 1-1.5 M
• If supply does not react, then ESS achieves pricing power
• High sector growth rates
22
Perpetuity Growth
$ 291.62 3.4% 3.8% 4.0% 4.2% 4.6%
DiscountRate
(WACC)
6.5% 349.29 406.74 442.36 484.17 594.21
7.0% 288.85 329.82 354.40 382.49 452.72
7.5% 243.20 273.74 291.62 311.67 360.08
8.0% 207.51 231.04 244.58 259.53 294.73
8.5% 178.84 197.47 208.02 219.55 246.17
Terminal EBITDA Multiple
$ 313.04 24.4x 25.9x 27.4x 28.9x 30.4x
DiscountRate
(WACC)
6.5% 291.44 311.03 330.63 350.23 369.83
7.0% 283.43 302.57 321.71 340.86 360.00
7.5% 275.63 294.33 313.04 331.74 350.44
8.0% 268.05 286.32 304.59 322.87 341.14
8.5% 260.67 278.52 296.38 314.24 332.09
CMP$233.86
Target Price$291.62
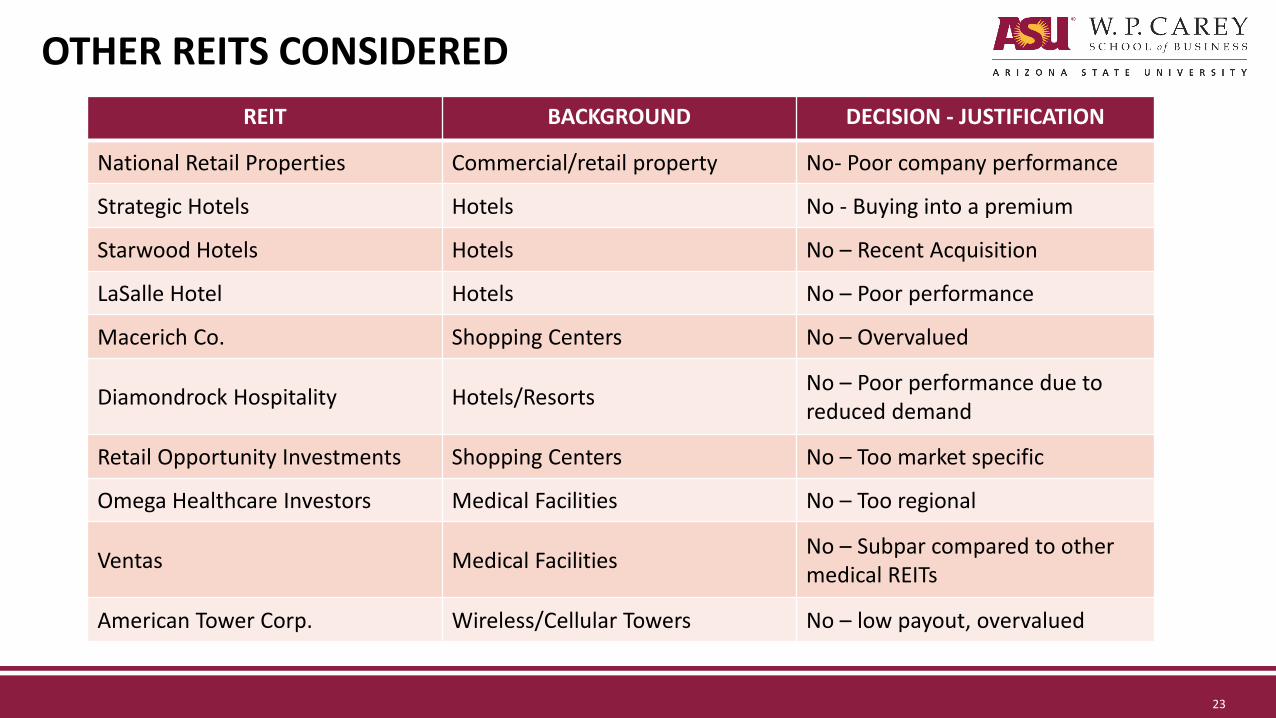
OTHER REITS CONSIDERED
REIT BACKGROUND DECISION - JUSTIFICATION
National Retail Properties Commercial/retail property No- Poor company performance
Strategic Hotels Hotels No - Buying into a premium
Starwood Hotels Hotels No – Recent Acquisition
LaSalle Hotel Hotels No – Poor performance
Macerich Co. Shopping Centers No – Overvalued
Diamondrock Hospitality Hotels/ResortsNo – Poor performance due to reduced demand
Retail Opportunity Investments Shopping Centers No – Too market specific
Omega Healthcare Investors Medical Facilities No – Too regional
Ventas Medical FacilitiesNo – Subpar compared to other medical REITs
American Tower Corp. Wireless/Cellular Towers No – low payout, overvalued
23

FIXED INCOME
24
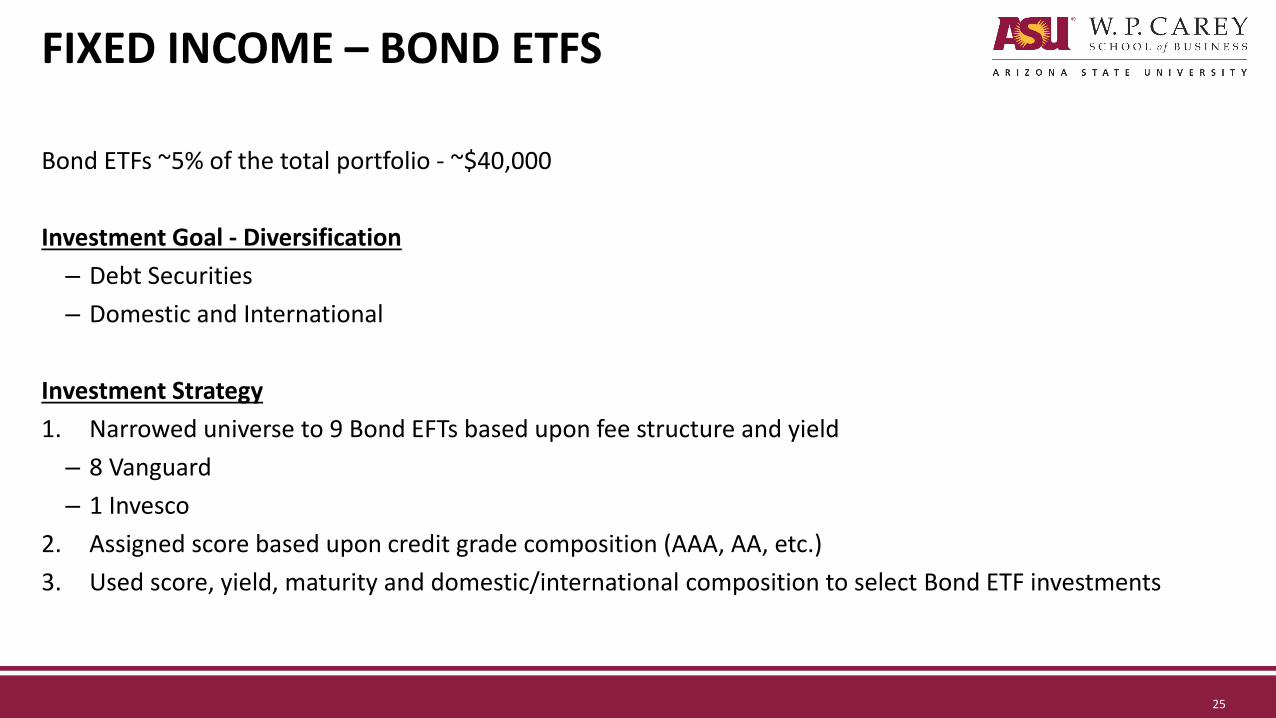
FIXED INCOME – BOND ETFS
Bond ETFs ~5% of the total portfolio - ~$40,000
Investment Goal - Diversification
– Debt Securities
– Domestic and International
Investment Strategy
1. Narrowed universe to 9 Bond EFTs based upon fee structure and yield
– 8 Vanguard
– 1 Invesco
2. Assigned score based upon credit grade composition (AAA, AA, etc.)
3. Used score, yield, maturity and domestic/international composition to select Bond ETF investments
25

FIXED INCOME – BOND ETFS
All ETFs except for PCY are from Vanguard, PCY offered by Invesco Similar Bond ETFs from Fidelity, Blackrock and Invesco had slightly higher fees
Investment Charter: Weighted Average greater than AA, Maturity less than 10 years
Security Maturity Yield Fees NAV ($ Bn) Weight
Int Term Bond (BIV) 7.2 3.85% 0.10% 21.6 49.9%
Int Term Govt Bond 5.6 2.50% 0.12% 1.0
MBS (VMBS) 6.2 2.97% 0.12% 2.0
Sht Term Bond 2.8 1.48% 0.10% 41.9
Sht Term Govt Bond 1.9 0.68% 0.12% 1.0
Sht Term TIPS 2.6 -0.70% 0.10% 12.3
Tot Bond 7.9 2.97% 0.07% 147.0
Tot Int Bond (BNDX) 8.9 3.08% 0.19% 48.3 50.1%
EM Sov Debt (PCY) 13.5 5.96% 0.50% 2.7
Portfolio 8.1 3.46% 0.15%
26
NEXT STEPS
• Equity: Rebalancing
–Momentum: Monthly
– Profitability: Quarterly
• REITs: Monitor closely on each REIT fundamentals
• Attribution
27

Thank You
28
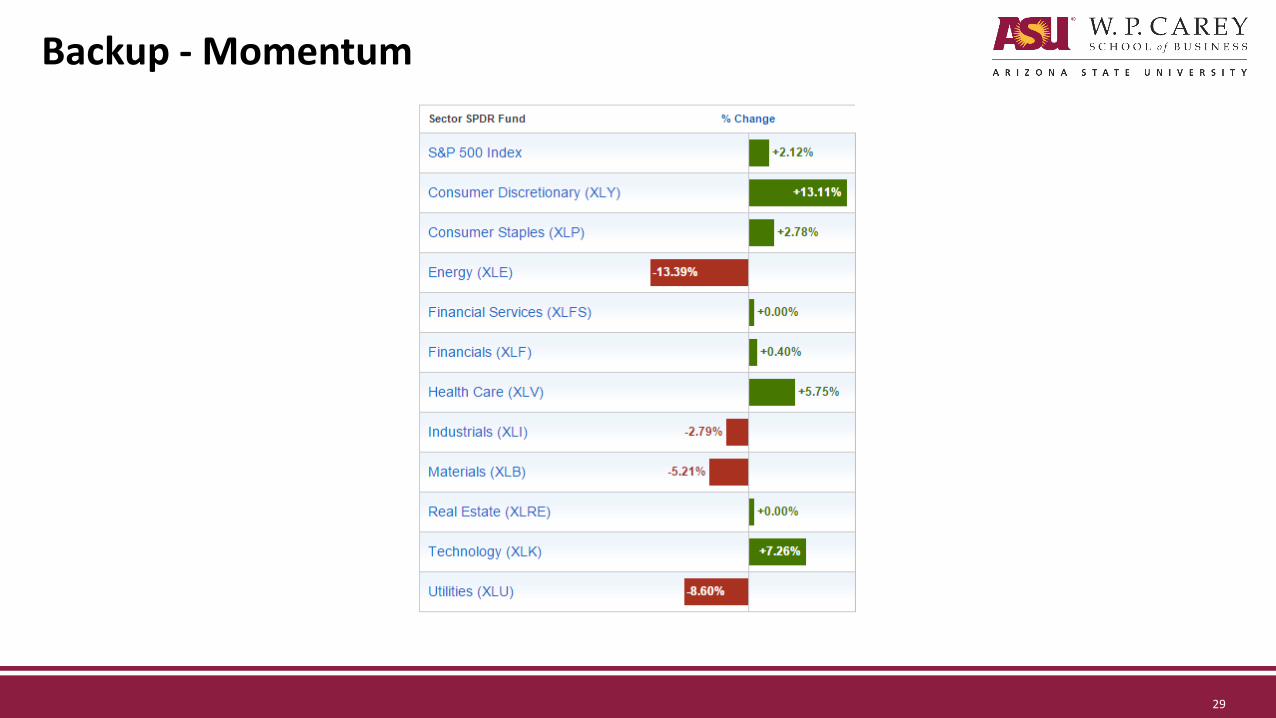
Backup - Momentum
29