Embed Size (px)
Citation preview
This is a repository copy of Gradual caldera collapse at Bárdarbunga volcano, Iceland, regulated by lateral magma outflow.
White Rose Research Online URL for this paper:http://eprints.whiterose.ac.uk/103058/
Version: Accepted Version
Article:
Gudmundsson, MT, Jónsdóttir, K, Hooper, A orcid.org/0000-0003-4244-6652 et al. (45 more authors) (2016) Gradual caldera collapse at Bárdarbunga volcano, Iceland, regulatedby lateral magma outflow. Science, 353 (6296). ISSN 0036-8075
https://doi.org/10.1126/science.aaf8988
[email protected]://eprints.whiterose.ac.uk/
Reuse
Items deposited in White Rose Research Online are protected by copyright, with all rights reserved unless indicated otherwise. They may be downloaded and/or printed for private study, or other acts as permitted by national copyright laws. The publisher or other rights holders may allow further reproduction and re-use of the full text version. This is indicated by the licence information on the White Rose Research Online record for the item.
Takedown
If you consider content in White Rose Research Online to be in breach of UK law, please notify us by emailing [email protected] including the URL of the record and the reason for the withdrawal request.
1
Gradual caldera collapse at Bárdarbunga volcano, Iceland, 1
regulated by lateral magma outflow 2
Magnús T. Gudmundsson1, Kristín Jónsdóttir2, Andrew Hooper3, Eoghan P. Holohan4,5, Saemundur 3
A. Halldórsson1, Benedikt G. Ófeigsson2, Simone Cesca4, Kristín S. Vogfjörd2, Freysteinn 4
Sigmundsson1, Thórdís Högnadóttir1, Páll Einarsson1, Olgeir Sigmarsson1,6, Alexander H. Jarosch1, 5
Kristján Jónasson7, Eyjólfur Magnússon1, Sigrún Hreinsdóttir8, Marco Bagnardi3, Michelle M. 6
Parks1, Vala Hjörleifsdóttir9, Finnur Pálsson1, Thomas R. Walter4, Martin P.J. Schöpfer10, Sebastian 7
Heimann4, Hannah I. Reynolds1, Stéphanie Dumont1, Eniko Bali1, Gudmundur H. Gudfinnsson1, 8
Torsten Dahm4, Matthew Roberts2, Martin Hensch2, Joaquín, M.C. Belart1, Karsten Spaans3, 9
Sigurdur Jakobsson1, Gunnar B. Gudmundsson2, Hildur M. Fridriksdóttir1,2, Vincent Drouin1, 10
Tobias Dürig1, Gudfinna Adalgeirsdóttir1, Morten S. Riishuus1, Gro B.M. Pedersen1, Tayo van 11
Boeckel1 , Björn Oddsson11, Melissa A. Pfeffer2, Sara Barsotti2, Baldur Bergsson2, Amy Donovan12, 12
Mike R. Burton13, Alessandro Aiuppa14 13
14
Revised manuscript for Science – 14 June 2016 15
16
1: Nordvulk, Institute of Earth Sciences, University of Iceland, Sturlugata 7, 101 Reykjavík 17
2: Icelandic Meteorological Office, IS-150 Reykjavík, Iceland 18
3: Centre for the Observation and Modelling of Earthquakes, Volcanoes and Tectonics (COMET), 19
School of Earth and Environment, University of Leeds, Leeds LS2 9JT, UK 20
4: GFZ German Research Centre for Geosciences, Telegrafenberg, 14473 Potsdam, Germany 21
5: UCD School of Earth Sciences, University College Dublin, Ireland 22
2
23
6: Laboratoire Magmas et Volcans, CNRS-Université Blaise Pascal-IRD, 63038 Clermont-24
Ferrand, France 25
7: Faculty of Industrial and Mechanical Engineering and Computer Science, University of 26
Iceland, Hjarðarhagi 2-6, 107 Reykjavík, Iceland 27
8: GNS Science, PO Box 30368, Lower Hutt 5040, New Zealand 28
9: Departamento de Sismología, Instituto de Geofísica, Universidad Nacional Autónoma de 29
Mexico, 04510 Ciudad de México, Mexico 30
10: Department for Geodynamics and Sedimentology, University of Vienna, Althanstrasse 14, A-31
1090 Vienna, Austria. 32
11: National Commissioner of the Icelandic Police, Department of Civil Protection and Emergency 33
Management, Skúlagata 21, 101 Reykjavík, Iceland 34
12: King’s College London, King's Building, Strand Campus, London WC2R 2LS, England, United 35
Kingdom 36
13: University of Manchester, Williamson Building, Oxford Road, Manchester, M13 9PL, UK 37
14: University of Palermo – Piazza Marina, 61 90133, Palermo, Italy 38
39
3
Abstract 40
Large volcanic eruptions on Earth commonly occur with collapse of the roof of a crustal magma 41
reservoir, forming a caldera. Only a few such collapses occur per century and lack of detailed 42
observations has obscured insight on mechanical interplay between collapse and eruption. We use 43
multi-parameter geophysical and geochemical data to show that the 110 km2 and 65 m deep 44
collapse of Bárdarbunga caldera in 2014-15 initiated through withdrawal of magma, and lateral 45
migration through a 47 km long dyke, from a 12 km deep reservoir. Interaction between the 46
pressure exerted by the subsiding reservoir roof and the physical properties of the subsurface flow 47
path explain the gradual, near exponential decline of both collapse rate and the intensity of the 181-48
day long eruption. 49
________________ 50
51
Calderas are 1 - 100 km diameter depressions found in volcanic regions of Earth and other planets. 52
They mainly form by collapse of overburden into a subterranean magma reservoir during large 53
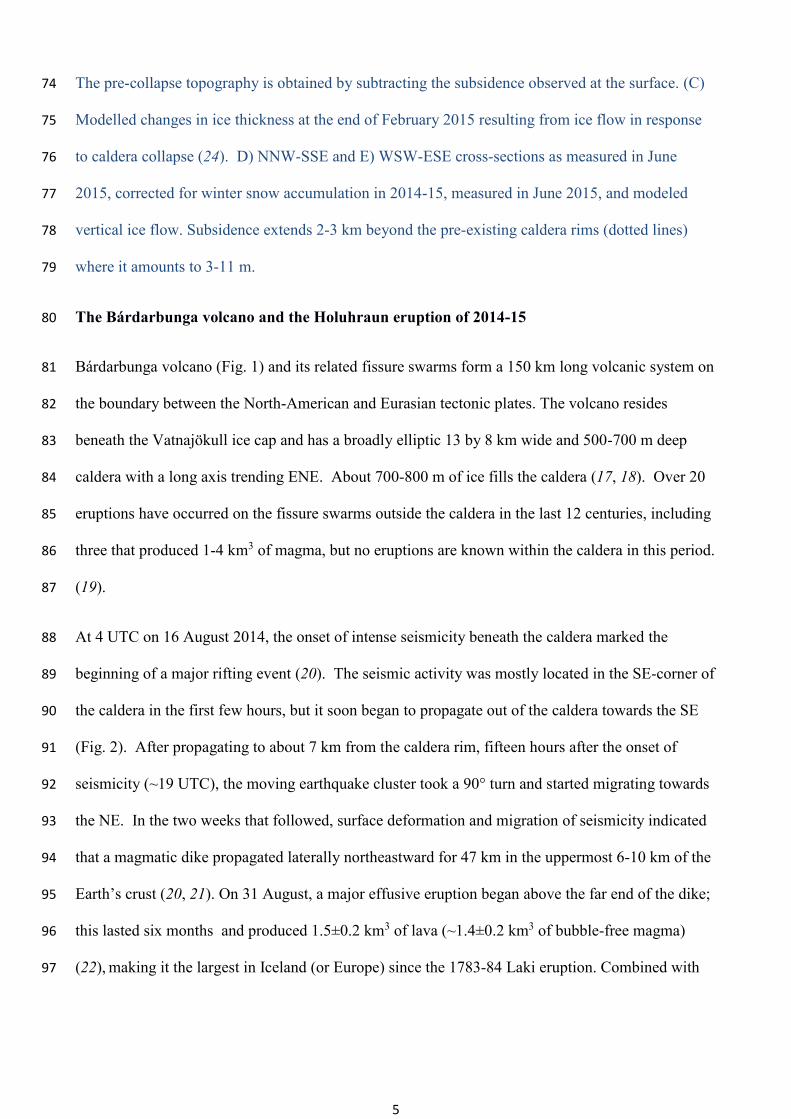
volcanic eruptions, including the largest known super-eruptions (1-8). From 1900 AD to 2014, only 54
six cases have been documented and with varying degrees of detail. The collapses of Katmai in 55
1912 and Pinatubo in 1991 occurred during explosive silicic (andesite-rhyolite) eruptions, the 56
largest of the 20th century. The collapses of Fernandina in 1968, Tolbachik in 1975-76, Miyakejima 57
in 2000 and Piton de la Fournaise in 2007 were associated with mainly effusive mafic (basalt – 58
basaltic andesite) intrusive activity and eruptions (2, 9-12). 59
The consensus from field and modelling studies is that caldera collapse progresses from initial 60
surface downsag to fault-controlled subsidence (1, 8, 13, 14). The limited number of modern 61
examples and the scarcity of geophysical data leaves open the question of whether collapse occurs 62
suddenly or gradually during the course of an eruption. The issue of whether collapse drives magma 63
movement and eruption or eruption drives collapse also remains unresolved. Previous geological, 64
4
geophysical, and modeling studies have produced a diverse and inconsistent set of answers to such 65
questions (2, 4, 15, 16). The caldera collapse at Bárdarbunga in central Iceland from August 2014 to 66
February 2015 offers a unique opportunity to address them directly. 67
68
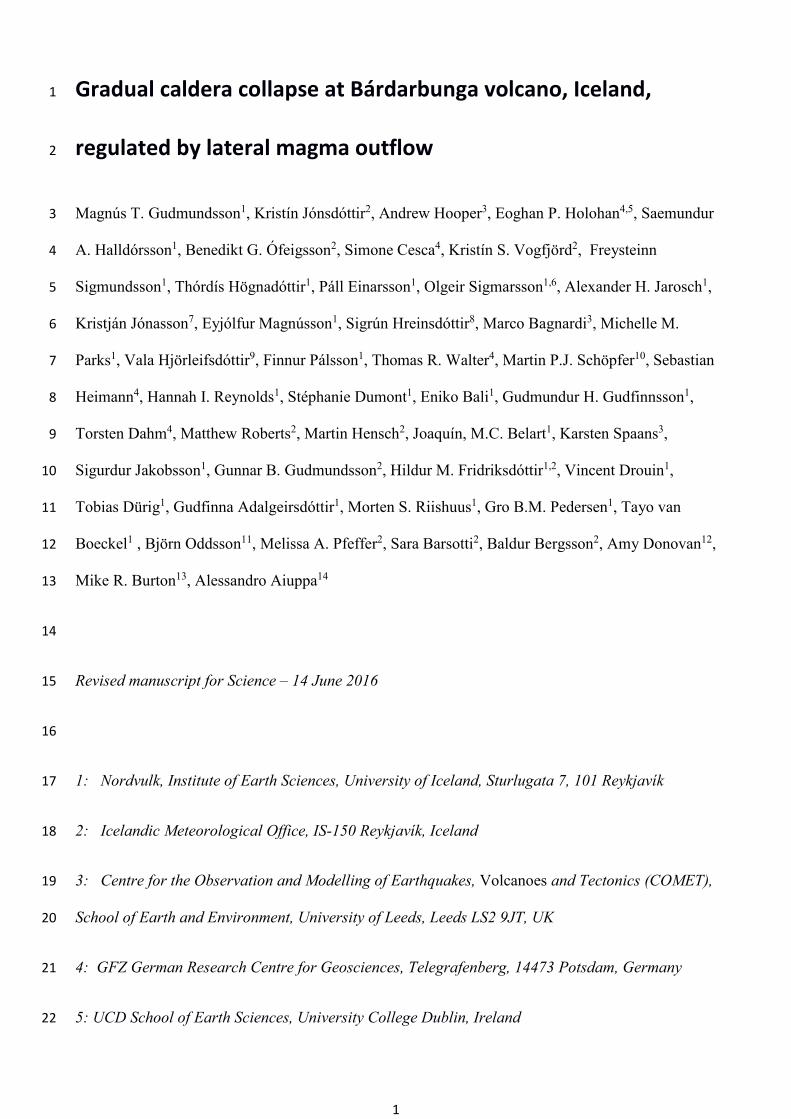
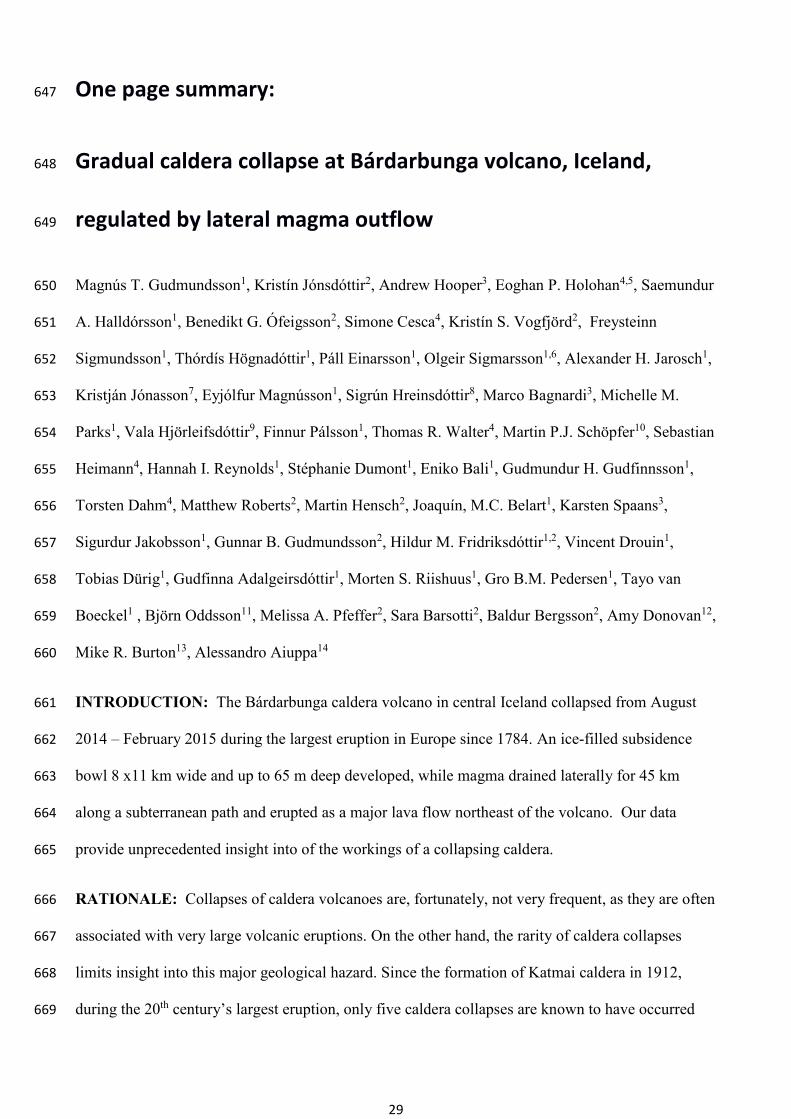
Figure 1. Bárdarbunga and geometry of collapse. A) Map showing the total caldera subsidence 69
(in meters) at the end of collapse in February 2015þ Minor sustained geothermal activity, monitored 70
from aircraft, increased during the collapse with pre-existing ice cauldrons deepening by up to 50 m 71
and new ones forming at the southern margin and to the southeast of the caldera (24). (B) Radio-72
echo sounding profile from 3 February, 2015, and a cross-section of the caldera with the collapse. 73
5
The pre-collapse topography is obtained by subtracting the subsidence observed at the surface. (C) 74
Modelled changes in ice thickness at the end of February 2015 resulting from ice flow in response 75
to caldera collapse (24). D) NNW-SSE and E) WSW-ESE cross-sections as measured in June 76
2015, corrected for winter snow accumulation in 2014-15, measured in June 2015, and modeled 77
vertical ice flow. Subsidence extends 2-3 km beyond the pre-existing caldera rims (dotted lines) 78
where it amounts to 3-11 m. 79
The Bárdarbunga volcano and the Holuhraun eruption of 2014-15 80
Bárdarbunga volcano (Fig. 1) and its related fissure swarms form a 150 km long volcanic system on 81
the boundary between the North-American and Eurasian tectonic plates. The volcano resides 82
beneath the Vatnajökull ice cap and has a broadly elliptic 13 by 8 km wide and 500-700 m deep 83
caldera with a long axis trending ENE. About 700-800 m of ice fills the caldera (17, 18). Over 20 84
eruptions have occurred on the fissure swarms outside the caldera in the last 12 centuries, including 85
three that produced 1-4 km3 of magma, but no eruptions are known within the caldera in this period. 86
(19). 87
At 4 UTC on 16 August 2014, the onset of intense seismicity beneath the caldera marked the 88
beginning of a major rifting event (20). The seismic activity was mostly located in the SE-corner of 89
the caldera in the first few hours, but it soon began to propagate out of the caldera towards the SE 90
(Fig. 2). After propagating to about 7 km from the caldera rim, fifteen hours after the onset of 91
seismicity (~19 UTC), the moving earthquake cluster took a 90° turn and started migrating towards 92
the NE. In the two weeks that followed, surface deformation and migration of seismicity indicated 93
that a magmatic dike propagated laterally northeastward for 47 km in the uppermost 6-10 km of the 94
Earth’s crust (20, 21). On 31 August, a major effusive eruption began above the far end of the dike; 95
this lasted six months and produced 1.5±0.2 km3 of lava (~1.4±0.2 km3 of bubble-free magma) 96
(22), making it the largest in Iceland (or Europe) since the 1783-84 Laki eruption. Combined with 97
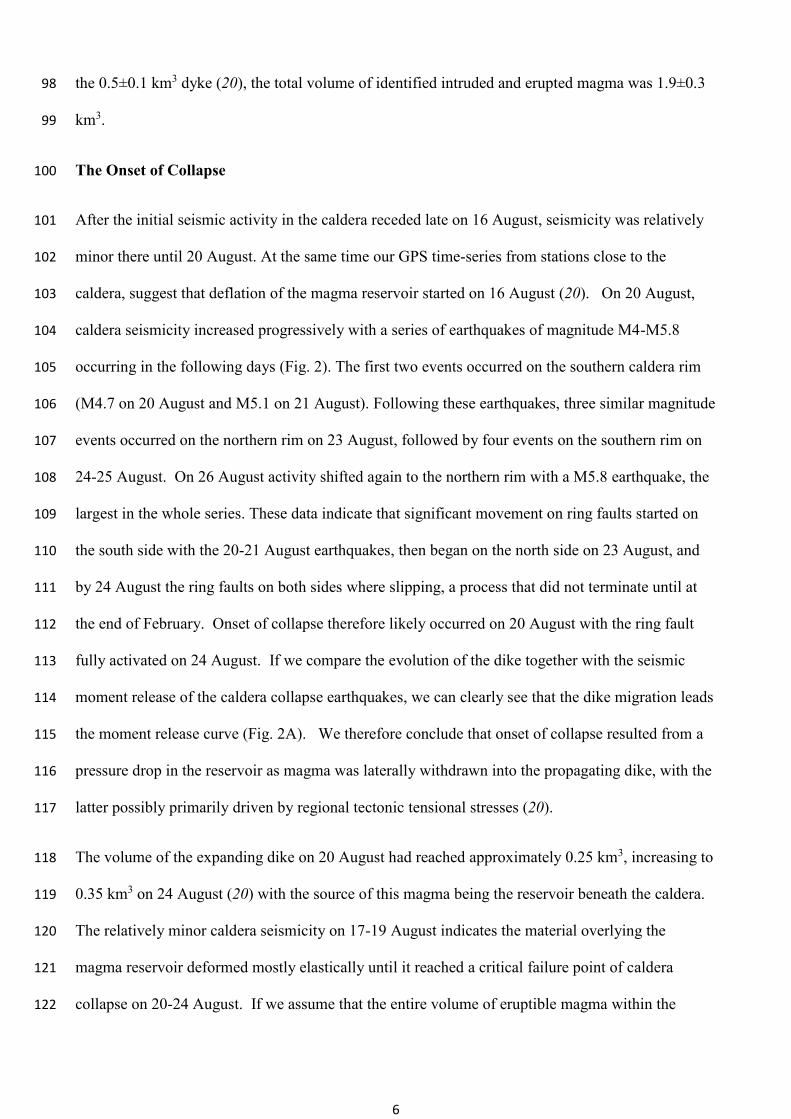
6
the 0.5±0.1 km3 dyke (20), the total volume of identified intruded and erupted magma was 1.9±0.3 98
km3. 99
The Onset of Collapse 100
After the initial seismic activity in the caldera receded late on 16 August, seismicity was relatively 101
minor there until 20 August. At the same time our GPS time-series from stations close to the 102
caldera, suggest that deflation of the magma reservoir started on 16 August (20). On 20 August, 103
caldera seismicity increased progressively with a series of earthquakes of magnitude M4-M5.8 104
occurring in the following days (Fig. 2). The first two events occurred on the southern caldera rim 105
(M4.7 on 20 August and M5.1 on 21 August). Following these earthquakes, three similar magnitude 106
events occurred on the northern rim on 23 August, followed by four events on the southern rim on 107
24-25 August. On 26 August activity shifted again to the northern rim with a M5.8 earthquake, the 108
largest in the whole series. These data indicate that significant movement on ring faults started on 109
the south side with the 20-21 August earthquakes, then began on the north side on 23 August, and 110
by 24 August the ring faults on both sides where slipping, a process that did not terminate until at 111
the end of February. Onset of collapse therefore likely occurred on 20 August with the ring fault 112
fully activated on 24 August. If we compare the evolution of the dike together with the seismic 113
moment release of the caldera collapse earthquakes, we can clearly see that the dike migration leads 114
the moment release curve (Fig. 2A). We therefore conclude that onset of collapse resulted from a 115
pressure drop in the reservoir as magma was laterally withdrawn into the propagating dike, with the 116
latter possibly primarily driven by regional tectonic tensional stresses (20). 117
The volume of the expanding dike on 20 August had reached approximately 0.25 km3, increasing to 118
0.35 km3 on 24 August (20) with the source of this magma being the reservoir beneath the caldera. 119
The relatively minor caldera seismicity on 17-19 August indicates the material overlying the 120
magma reservoir deformed mostly elastically until it reached a critical failure point of caldera 121
collapse on 20-24 August. If we assume that the entire volume of eruptible magma within the 122
7
reservoir was 1.9±0.2 km3, then the critical volume fraction required to reach the failure point and 123
trigger the collapse (23) was 0.12-0.21. 124
125
126
Figure 2. Onset of caldera collapse. A) Cumulative seismic moment release from caldera 127
earthquakes plotted together with distribution of seismicity along the dike length, using high quality 128
8
relative locations of earthquakes (20), for the time period when the dike progressed away from the 129
caldera. B) Significant caldera earthquakes with magnitudes above M4 plotted as impulses, where 130
the height represents magnitude and color represents location on southern or northern rim. C) Map 131
of NW Vatnajökull showing earthquake epicenters on 16 August, D) 17-19 August, E) 20-22 132
August and F) 23-15 August. 133
Ice Flow, Subsidence Magnitude and Volume 134
As we recorded the caldera subsidence mainly on the ice (Fig. 1, Fig. S1), we made corrections and 135
additional measurements to derive the underlying bedrock displacement. Our main data on ice 136
surface changes and ice movements are repeated C-band radar altimeter surveys from aircraft, maps 137
made from optical satellite images and the continuously recording GPS station BARC we set up in 138
the center of the caldera on 13 September. The observed velocities and displacements of the ice 139
surface are displayed on Figs. 3A and 3B. We use these observations to constrain three-140
dimensional Full-Stokes finite element modelling of ice-flow in response to the collapse (24). The 141
results show concentric flow, towards the point of maximum collapse within the caldera, with 142
maximum ice thickening at the center of ~3 m by February 2015 (Fig. 1C, Fig. S2). The maximum 143
ice surface lowering of 62±2 m, determined by aerial altimeter surveys, gives a maximum bedrock 144
subsidence of 65±3 m. Our data and models show that apart from the concentric flow towards the 145
deepest part of the subsidence (about 1 km east of BARC) horizontal flow was not much affected 146
(Fig. 3A). We therefore conclude that suggestions of a large increase in ice flow out of the caldera 147
during these events (25) cannot be fitted with our data. 148
Bedrock subsidence exceeding 1 m occurred within an area of 110 km2 that extended beyond the 149
pre-existing caldera (Fig. 1, Fig. S1). After termination of collapse the total subsidence at the pre-150
existing caldera rims amounted to 3 to 11 meters (Fig. 1D and 1E). Using subglacial radio-echo 151
soundings we observed a down-sagged bedrock surface without any clear signs of fault offset (Fig 152
1B) or indications of water bodies at the ice bedrock interface. The limited resolution resulting 153
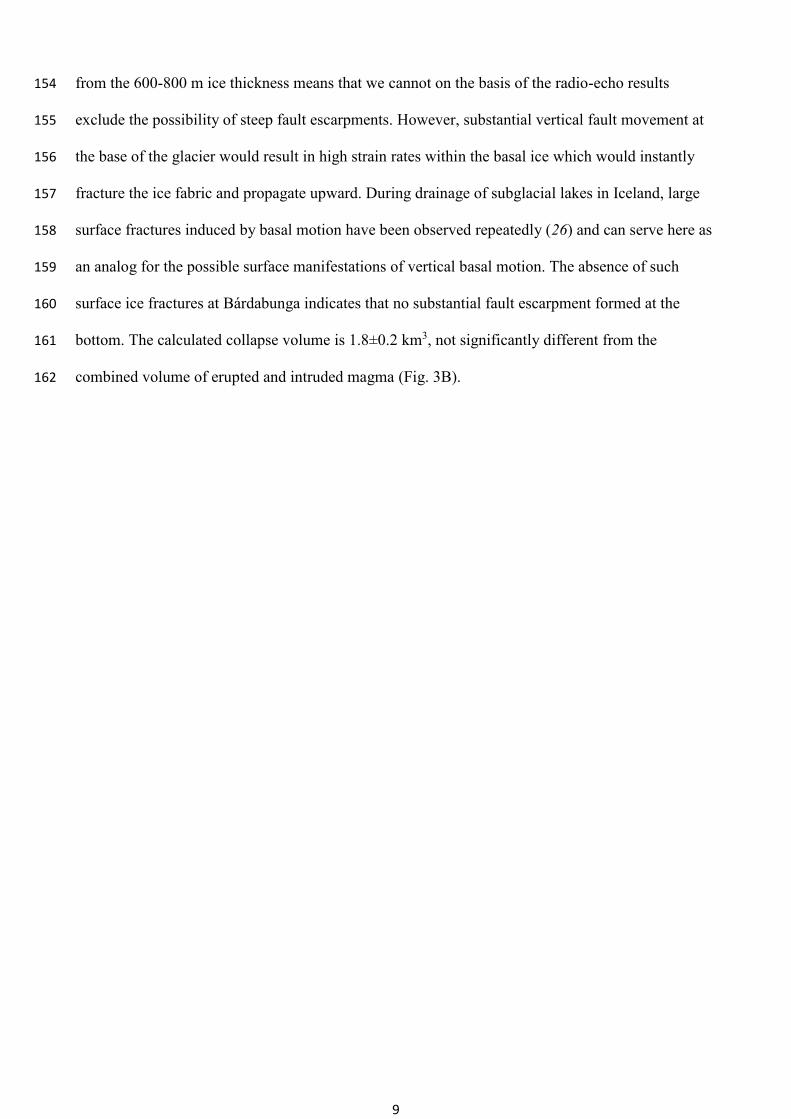
9
from the 600-800 m ice thickness means that we cannot on the basis of the radio-echo results 154
exclude the possibility of steep fault escarpments. However, substantial vertical fault movement at 155
the base of the glacier would result in high strain rates within the basal ice which would instantly 156
fracture the ice fabric and propagate upward. During drainage of subglacial lakes in Iceland, large 157
surface fractures induced by basal motion have been observed repeatedly (26) and can serve here as 158
an analog for the possible surface manifestations of vertical basal motion. The absence of such 159
surface ice fractures at Bárdabunga indicates that no substantial fault escarpment formed at the 160
bottom. The calculated collapse volume is 1.8±0.2 km3, not significantly different from the 161
combined volume of erupted and intruded magma (Fig. 3B). 162
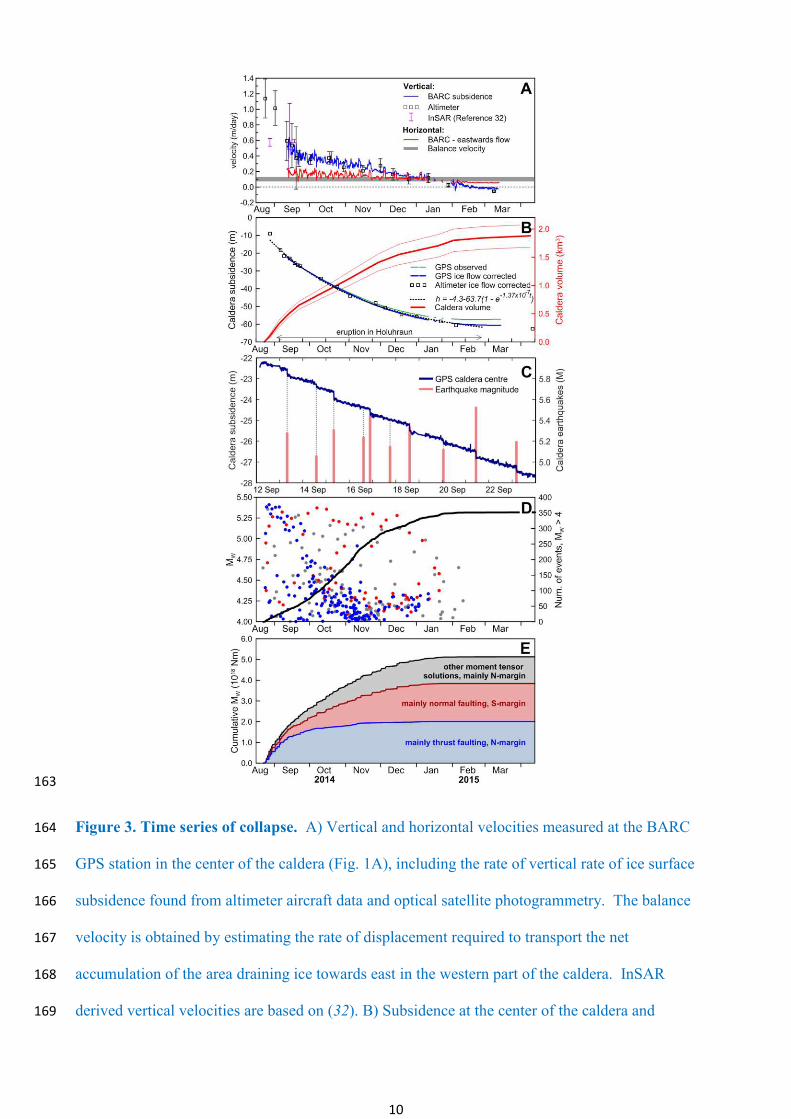
10
163
Figure 3. Time series of collapse. A) Vertical and horizontal velocities measured at the BARC 164
GPS station in the center of the caldera (Fig. 1A), including the rate of vertical rate of ice surface 165
subsidence found from altimeter aircraft data and optical satellite photogrammetry. The balance 166
velocity is obtained by estimating the rate of displacement required to transport the net 167
accumulation of the area draining ice towards east in the western part of the caldera. InSAR 168
derived vertical velocities are based on (32). B) Subsidence at the center of the caldera and 169
11
subsidence volume evolution. The volume of the subsidence is obtained by subtracting the mapped 170
surface from the pre-collapse surface. The caldera subsidence curve is fitted with an equation of the 171
same form as eq. (1). C) High resolution GPS for 12-23 September, showing M>5 earthquakes 172
coinciding with 20-40 cm rapid collapse, superimposed on gradual subsidence. Note that the size of 173
the steps depends on the location of BARC relative to the earthquake centroids, and cannot be used 174
directly to infer the proportion of ring fault slip that ruptured seismically or aseismically. D) 175
Cumulative number of M>4 caldera earthquakes, with magnitude evolution colored in red, blue and 176
grey representing clusters on the southern rim, the northern rim and smaller clusters, respectively 177
(see Fig. S5). E) Cumulative seismic moment for M>4 caldera earthquakes. 178
179
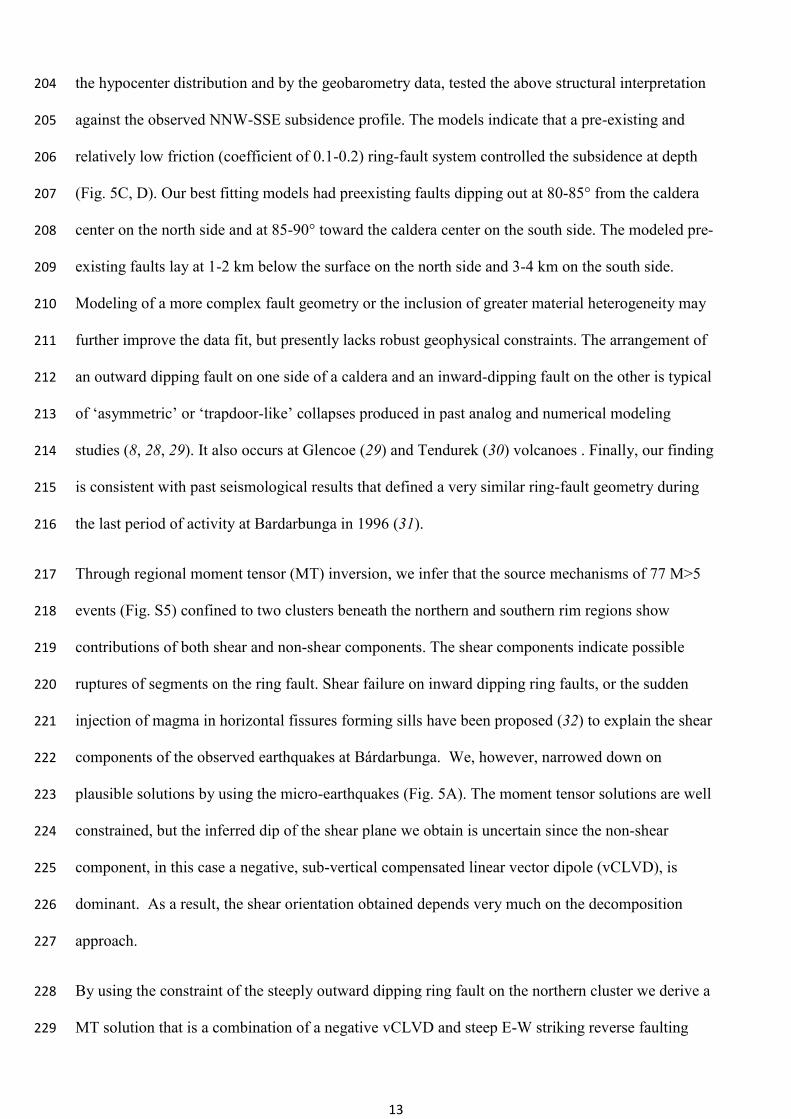
Magma source depth 180
Lava chemistry, surface gas composition and geodetic modelling indicate drainage of a magma 181
reservoir at a depth of ~12 km. The erupted lava is typical olivine tholeiite with a relatively uniform 182
chemical composition, consistent with efficient homogenization of melts before eruption. Several 183
independent geobarometers (Fig. 4) yield an equilibrium pressure of 350-550 MPa, indicating that 184
melt resided at depths of 11-16 km before the eruption. We obtained a similar result (14±3 km) 185
from analysis of subaerial gas measurements (Fig. 4). This depth concurs with our regional 186
geodetic observations, which are dominated by a deflating source at 8-12 km depth beneath 187
Bárdarbunga, after the cessation of dike-related deformation in mid-September (Figs. S3 and S4). 188
12
189
Figure 4. Magma source depth from geobarometric and subaerial gas analysis. The CO2-box 190
indicates the minimum pressure obtained (400 kbar) from density barometry of plagioclase hosted 191
CO2-bearing fluid inclusions. The results from the analysis of subaerial gas compositions are based 192
on FTIR and Multi-GAS measurements (24). 193
194
Seismicity and subsurface structure 195
We used seismic data and Distinct Element Method (DEM) numerical modelling (24), to 196
characterize the deeper collapse structure as the reactivation of a steeply-inclined ring fault (Fig. 5). 197
We mostly observed seismicity at depths of 0-9 km beneath the northern and southern caldera rims 198
(Fig. 5B), with earthquakes being more numerous on the northern rim. This spatial pattern of 199
seismicity is consistent with fracturing above a deflating magma reservoir that was elliptical in 200
plan-view (27). In cross-section, the hypocenters indicate a steeply (~80°) outwards-dipping fault in 201
the northern cluster, while the southern cluster they indicate a vertical or near-vertical fault dip. A 202
series of DEM forward simulations of a magma chamber and ring fault system, as constrained by 203
13
the hypocenter distribution and by the geobarometry data, tested the above structural interpretation 204
against the observed NNW-SSE subsidence profile. The models indicate that a pre-existing and 205
relatively low friction (coefficient of 0.1-0.2) ring-fault system controlled the subsidence at depth 206
(Fig. 5C, D). Our best fitting models had preexisting faults dipping out at 80-85° from the caldera 207
center on the north side and at 85-90° toward the caldera center on the south side. The modeled pre-208
existing faults lay at 1-2 km below the surface on the north side and 3-4 km on the south side. 209
Modeling of a more complex fault geometry or the inclusion of greater material heterogeneity may 210
further improve the data fit, but presently lacks robust geophysical constraints. The arrangement of 211
an outward dipping fault on one side of a caldera and an inward-dipping fault on the other is typical 212
of ‘asymmetric’ or ‘trapdoor-like’ collapses produced in past analog and numerical modeling 213
studies (8, 28, 29). It also occurs at Glencoe (29) and Tendurek (30) volcanoes . Finally, our finding 214
is consistent with past seismological results that defined a very similar ring-fault geometry during 215
the last period of activity at Bardarbunga in 1996 (31). 216
Through regional moment tensor (MT) inversion, we infer that the source mechanisms of 77 M>5 217
events (Fig. S5) confined to two clusters beneath the northern and southern rim regions show 218
contributions of both shear and non-shear components. The shear components indicate possible 219
ruptures of segments on the ring fault. Shear failure on inward dipping ring faults, or the sudden 220
injection of magma in horizontal fissures forming sills have been proposed (32) to explain the shear 221
components of the observed earthquakes at Bárdarbunga. We, however, narrowed down on 222
plausible solutions by using the micro-earthquakes (Fig. 5A). The moment tensor solutions are well 223
constrained, but the inferred dip of the shear plane we obtain is uncertain since the non-shear 224
component, in this case a negative, sub-vertical compensated linear vector dipole (vCLVD), is 225
dominant. As a result, the shear orientation obtained depends very much on the decomposition 226
approach. 227
By using the constraint of the steeply outward dipping ring fault on the northern cluster we derive a 228
MT solution that is a combination of a negative vCLVD and steep E-W striking reverse faulting 229
14
(Fig. 3D, 3E and Fig. S5). In contrast, standard decomposition of the northern cluster MTs provides 230
normal faulting along steep N-S striking planes, a result that is inconsistent with the observed main 231
fault orientation. The southern cluster MTs are consistent with being composed of families (33) of 232
steep normal faulting earthquakes. 233
The large, negative vCLVD indicates a combination of downward contraction and horizontal 234
expansion, as has been observed in mines as well as in volcanic calderas during collapses (e.g. 31, 235
34). This could imply failure of support structures directly above or even within the magmatic 236
reservoir, or the sudden response of the reservoir fluid to vertical compression. 237
Temporal development of subsidence and related seismicity 238
Subsidence occurred gradually during the eruption (Fig. 3B). From an initial rate in the caldera 239
center of ~1 m/day during the first 20 days (Fig. 3B), subsidence declined in a near exponential 240
manner with time (24). Subsidence terminated when the eruption ended in February 2015. We can 241
associate some of the M>5 caldera earthquakes, during the first couple of months of activity, with 242
drops of 10-40 cm, but subsidence was otherwise continuous (Fig. 3C). The gradual decline in the 243
rates of subsidence and caldera volume growth is mirrored by a decline in the cumulative seismic 244
moment, the latter reflecting a decrease in the number of larger earthquakes with time (Fig. 3D, 3E). 245
Nonetheless, in terms of the cumulative seismic moment of 5.07x10¹⁸ Nm for the M>4.0 events, 246
this collapse is the second largest recorded, after that of Katmai (1912) (35). The geodetic moment 247
depends on the shear modulus, the fault area and the amount of slip assumed. The shear modulus 248
could be very low in regions of intense faulting such as on a caldera ring fault. The possible range 249
of the geodetic moment is found by considering a ring fault reaching from the surface to 12 km 250
depth, 60 m of slip and a shear modulus over a wide range, 2-20 GPa. This results in a moment of 251
4x10¹⁹ - 4x10²⁰ Nm, or 10-100 times the cumulative seismic moment of the earthquakes. This 252
difference is consistent with the modeling of surface deformation observed during one of the events 253
(Fig S7). 254
15
255
Figure 5: Fault geometry and collapse modelling: A) Earthquakes 1 August – 17 October 2014, 256
B) seismicity along a 2-4 km wide strip on the NNW-SSE cross section, depth relative to bedrock 257
caldera floor. C-D) Two-dimensional DEM modeling of the collapse, constrained by subsidence 258
geometry, earthquake locations in (B), and the geobarometry (Fig. 4). The geometry illustrated in 259
(D) obtained the best agreement with the observations. The color scale shows the maximum finite 260
shear strain. Surface displacement profiles for different pre-existing fault frictions are provided in 261
(C). Three model realizations are shown for each friction value. 262
16
Caldera-flowpath interaction and piston collapse modeling 263
We see a short-term (multi-hourly) mechanical coupling of the collapsing caldera and the distal dike 264
(south of eruption site) in the timing of earthquakes in the dike and at the caldera (Fig. 6A). Within 265
a six-hour window before and after large caldera earthquakes the frequency of dike earthquakes was 266
increased relative to background rate (24). We observed this pattern in the data after the beginning 267
of October 2014, when the dyke had stopped propagating and a quasi-steady magma flow path had 268
developed, until February 2015 when seismic activity stopped. For the three hours after caldera 269
earthquakes with magnitude M > 4.6, as well as for the three hours before caldera earthquakes with 270
M > 4.0, the increase in seismicity was significant (24) (p = 0.05; Fig. 6, Fig. S8). 271
At Bárdarbunga communication therefore existed between caldera subsidence events and pressure 272
changes in a conduit up to 47 km away. Spatiotemporal patterns of tilt at Kilauea Volcano, Hawaii, 273
show a similar phenomenon that can be explained by the propagation of pressure transients within 274
an elastically deformable dyke (36). By analogy, we can make the interpretation that caldera 275
earthquakes may generate a pressure pulse that leads to increased seismicity at the end of the dike. 276
The communication could be two-way, although it is difficult to explain a pressure pulse from the 277
dike towards the caldera. One possibility is that readjustment of the dike (e.g. sudden unblocking) 278
can increase the dike volume slightly and subsequently lower the magma pressure which then 279
translates back to the caldera. The communication may also be entirely one-way, from the caldera 280
to the dike: smaller caldera earthquakes, and/or aseismic deformation at depth just above the 281
magma chamber may precede a large caldera earthquake, increasing dike pressure and dike 282
seismicity. 283
We explain the longer term (weeks to months scale) coupling in the form of the gradually declining 284
rates of caldera subsidence, caldera volume change and lava eruption (Figs. 3B, 6B) with a model 285
of a collapsing piston overlying a pressurized magma chamber. We assume that the chamber 286
pressure and fault friction each partially support the piston weight (24). Drainage of magma reduces 287
17
the chamber pressure and causes piston subsidence (Fig. S6). This in turn raises the chamber 288
pressure, leading to a feedback loop that maintains quasi-constant pressure at the magma chamber 289
top, and drives further magma drainage. The pressure feeding the eruption drops, however, due to 290
the reduction in hydraulic head of magma over time. Kumagai et al. (37) also used a piston model to 291
explain caldera collapse at Miyakejima in 2000, but in their model no change in hydraulic head was 292
assumed and outflow rate was held constant. 293
Assuming that the time-averaged resistive force due to friction on the ring faults remains constant, 294
and that magma flow is laminar through a cylindrical pipe with radius r, and conduit length L, with 295
L>>r, then 296
ッ鶏 蛤 ッ鶏待結貸肺輩虹認填添豚j薙 痛 (1) 297
Where FP is the driving overpressure, FP0 is the initial driving overpressure, t is the density of the 298
magma, g is gravitational acceleration, A is the cross-sectional area of the magma chamber, j is the 299
dynamic viscosity of the magma and t is time (24). We estimated FP0 and the constant in the 300
exponent, assuming that the measured subsidence within the caldera represents the decrease in 301
magma chamber height with time (Fig 3B). Note, this represents a minimum estimate for FP0, as 302
there may also have been dilation at depth. The model also fits the measured caldera volume 303
change (Fig. 3B) and eruption rate (Fig. 6B). This model predicts the same form of decay in flow 304
rate (exponential) as the standard ‘Wadge’ model of depressurisation of an overpressured magma 305
body (38), but by a different mechanism. The feedback mechanism of re-pressurisation from the 306
ongoing piston collapse enhanced the length and speed of dike propagation, and the duration of the 307
eruption. In this model, therefore, both the eruption drives the collapse and collapse drives the 308
eruption. 309
18
310
Figure 6. Caldera - magma flowpath interaction. A) Rate of dike earthquakes relative to 311
background levels before and after significant caldera earthquakes of magnitude >M4. The p-values 312
indicate the two sided significance and n is the number of earthquakes used. Error bars indicate 313
90% confidence intervals (24). B) Exponential model of magma flow rate constrained by caldera 314
GPS subsidence (24) compared with rate of volume change in caldera and eruption rate in 315
Holuhraun. The eruption stopped on Day 194 (27 February, 2015) before the driving pressure 316
reaches zero, as expected if the conduit becomes clogged by solidifying magma as the flow rate 317
drops. C) Schematic cross-section of caldera - magma chamber - pipe-like magma flow path and 318
eruption site after dike formation (20, 21). The inferred magma chamber is set at 12 km below 319
bedrock caldera floor. It is possible that magma ascended first along the ring fault before forming 320
the dyke above 6-10 km depth. We indicate the constraints on depth to magma chamber from 321
geobarometry with a blue arrow and from geodesy with a green arrow. 322
323
19
Overview and implications 324
Table 1 contextualizes the key features of the 2014-15 Bardarbunga collapse with respect to those 325
of the seven collapses instrumentally monitored to date. The areal extent of the Bardarbunga 326
collapse (110 km2) is the largest yet observed historically and is comparable to that associated with 327
major silicic eruptions in the geological record (6). The total subsidence (65 m) is one to two orders 328
of magnitude smaller than all past collapses listed here, but the large area means that it has the 329
fourth largest collapse volume (1.8 km3) overall. The erupted volume (1.4 km3) is the largest of the 330
observed mafic collapses so far, although considerable uncertainty surrounds the volumes 331
associated with the collapse of Fernandina. In volume terms, both the silicic eruptions and collapses 332
of Katmai and Pinatubo were twice to six times larger. The cumulative seismic energy release at 333
Bardarbunga (25 x 1013 J, see Table 1) is dwarfed by that of Katmai (1600 x 1013 J) and similar to 334
Miyakejima (22 x 1013 J), despite the much smaller area of the latter (1.9 km2). This is explained by 335
the much greater subsidence at Miyakejima (>1600 m). The gradual collapse of Bardarbunga had 336
the second longest duration (190 days) yet recorded. Only the duration of collapse at Tolbachik 337
(515 days) exceeds it. Finally, Bardarbunga has the longest confirmed length of an associated lateral 338
intrusion (48 km) and the longest distance to the main vent (40 km). 339
Volcano Year Magma Maximum
subsidence
(m)
Collapse
Duration
(days)
Collapse
Area
(km2)
Collapse
Volume
(km3)
Reservoir
Depth
(km)
Intrusion
Volume
(km3) (a)
Erupted
Volume
(km3) (b)
Total
Magma
Volume
(km3)
Distance
to Vent (c) (km)
Intrusion
Length (d) (km)
Seismic
Energy
(x 1013
J) (e)
Max.
EQ (f)
Bardarbunga 2015 Basalt ~ 61 150 110 1.8 11-16 0.5 1.5 2 46 48 25 5.4
La Reunion 2007 Basalt ~ 450 2 0.82 0.1 2-3 0.02 0.14 0.16 7 7 ? 3.2
Miyakejima 2000 Basalt ~ 1600 40 1.9 0.6 4-7 1.2 0.01 1.21 5.6 35 22 5.6
Tolbachik 1976 Basalt > 500 515 2.5 0.35 4-6? ? 1.2 > 1.2 28 ~ 45 ? 2.9
Fernandina 1969 Basalt ~ 350 12 7 2 ? ? 0.2 > 0.2 10.5? 10.5? 2 5.2
Katmai 1912 Rhyolite > 1300 3 8.8 5.5 2-5 ? 13.5 > 13.5 10 10 1600 7
Pinatubo* 1991 Dacite ~ 900 2 4 2 7-11 ? 4.5 4.5 1 4 2 5.7
340
Table 1: Instrumentally-monitored caldera collapses since 1900 AD. 341
* Note that all caldera collapses except Pinatubo formed in association with lateral withdrawal and intrusion of 342
magma. 343
20
References for data: Bardarbunga: (20); this study; La Reunion: (12,16,44-46); Miyakejima: (2, 11, 34, 47-344
49); Tolbachik: (50-53); Fernandina: (2, 9, 54); Katmai: (35, 41, 55); Pinatubo: (2, 15, 42, 43, 56) 345
(a) Intrusion volume values are typically constrained by inversions of data from geodetic networks, and so are available 346
only for the most recent events. 347
(b) Erupted volumes are given as Dense Rock Equivalent (DRE) に i.e. with porosity removed. 348
(c) Distance measured from center of caldera to most distant known vent active during collapse. 349
(d) Estimated horizontal length of the intrusion, from locations of seismicity and/or inversions of geodetic data in all 350
cases except Katmai. For Katmai and Fernandina, intrusion length is estimated as the distance from caldera to vent 351
and is hence a minimum value. 352
(e) Cumulative seismic energy release calculated by converting the cumulative scalar moments (M0) by using a factor of 353
5x10⁻⁵ (from energy-moment relationship determined by Kanamori et al. (57)) 354
(f) Maximum earthquake magnitude associated with caldera formation. Magnitude determined from surface waves, 355
Ms, is given for Tolbachik (53), Katmai (35) and Fernandina (54). For La Reunion, Md is used (12, 44). For Miyakejima 356
and Bardarbunga, the maximum moment magnitude (Mw) for collapse-related VLP events is given (34, 58, this study). 357
358
Our data and modelling show that withdrawal and eruption of magma triggered the collapse at 359
Bardarbunga. For the likely depth to diameter ratio of the magma reservoir, the critical volume 360
fraction required to trigger the onset of collapse (0.12-0.21) was much lower than that predicted by 361
past analytical and analogue modelling (23, 39). A similar inference of low critical volume fractions 362
at La Reunion and Miyakejima (16) was explained as a consequence of the reactivation of pre-363
existing ring faults, a proposition in line with our observations and analysis of the Bardarbunga 364
collapse. 365
Nonetheless, we also show that there is a tight mechanical interplay between collapse and eruption 366
throughout the process once collapse has started, with eruption driving collapse and vice versa on 367
both hourly and eruption-long time scales. For the longer time-scale coupling, the results also show 368
that the physical properties of both the magma chamber roof and the magma pathway regulate 369
caldera collapse and magma outflow rate. Consequently, collapse at Bárdarbunga occurred 370
gradually and at a steadily (exponentally) declining rate. This is a very similar pattern to that 371
inferred for the 1968 Fernandina collapse (2, 16). In contrast to some model predictions (40) and to 372
21
the 2007 collapse of Piton de la Fournaise (16), we found no evidence for rapid and sustained 373
pressure increase in the magma chamber as a result of collapse, possibly due to substantial ductile 374
behavior of the roof of the larger and deeper Bardarbunga magma chamber (13, 16). 375
The question of whether or to what extent our understanding of caldera collapse at mafic volcanoes 376
such as Bardarbunga is transferrable to large silicic systems remains an open one. On the one hand 377
the gradual nature of collapse at Bardarbunga and Fernandina contrasts with the highly punctuated 378
collapse style inferred during explosive silicic eruptions like Katmai and Pinatubo (2, 41). In 379
addition, collapse at silicic volcanoes is generally considered to be triggered by eruption through a 380
central vent rather than through the lateral withdrawal mechanism seen at Bardarbunga. On the 381
other hand, of the two instrumentally monitored silicic collapses, the most silicic, Katmai was also 382
clearly associated with a lateral withdrawal. This mechanism could therefore be more widespread at 383
silicic calderas than commonly considered. In addition, the locations and mechanisms of the large, 384
apparently collapse-related earthquakes interpreted to denote punctuated collapses of Katmai and 385
Pinatubo are poorly constrained, such that a regional tectonic origin for them cannot be precluded 386
(15, 35, 42, 43). Consequently, Bardarbunga 2014-15 provides our clearest picture yet of how 387
caldera collapse can be triggered during large eruptions, and how the dynamics of the subterranean 388
magma flow path and the interaction with magma reservoir pressure regulates eruption rates and the 389
rate of collapse. 390
Acknowledgements 391
A large part of the field effort was supported with crisis response funding from the Icelandic Government 392
through the Civil Protection Department of the National Commissioner of the Icelandic Police. A 393
considerable part of this work was made possible through the European Community‘s Seventh Framework 394
Programme Grant No. 308377 (Project FUTUREVOLC). Further support came from the EU Seventh 395
Framework Marie Curie project NEMOH No. 289976, and!the project CO2Volc ERC grant No. 279802, the 396
Research Fund of the University of Iceland, the Irish Research Council, the Helmholtz Alliance on Remote 397
Sensing and Earth System Dynamics (EDA) and UNAM/CIC Intercambio Académico. We thank the 398
22
following key persons for help with instrumentation and data: B.H. Bergsson, V.S. Kjartansson, S. 399
Steinthorsson, Th. Jónsson, P. Erlendsson, J. Soring, I. Jónsdóttir, G. Sverrisdóttir and G. Sigurdsson, the 400
SIL network monitoring team at the IMO, the field observation team of the IES in Holuhraun, and for 401
collaboration on seismic instruments and data we thank R.S. White and the Cambridge team and C. Bean and 402
the UCD team. The subsidence of Bárðarbunga was mapped by the surveying aircraft of Isavia (Icelandic 403
Aviation Operation Services) and from satellite images acquired by Pléiades (© CNES 2014, Distributed 404
Airbus DS, subsidized access provided by the French Space Agency CNES’s ISIS programme) and SPOT 6 405
(©Airbus DS 2014). Committee on Earth Observation Satellites (CEOS) and Geohazards Supersites and 406
Natural Laboratories (GSNL) also provided access to satellite data. CSK data were provided by the Italian 407
Space Agency (ASI) through the Iceland Volcanoes Supersite agreement. The Icelandic Coast Guard 408
provided valuable aeroplane and helicopter support for the field effort. Field operations at Bárdarbunga were 409
supported by the Landsvirkjun power company, the Iceland Glaciological Society and Vatnajökull National 410
Park. 411
412
References 413
ヱく Mく Bヴ;ミミW┞が Vく AIラIWノノ;が さC;ノSWヴ;ゲざ キミ The Encyclopedia of Volcanoes, H. Sigurdsson, B. Houghton, H. 414
Rymer, Eds. (Academic Press, Academic Press, Heidelberg, Amsterdam, Boston, ed. 2, 2015), pp. 229-315. 415
2. J. Stix, T. Kobayashi, Magma dynamics and collapse mechanisms during four historic caldera-forming 416
events. J. Geophys. Res. 113, JB005073 (2008). 417
3. A. R. McBirney, A historical note on the origin of calderas. J. Volcanol. Geotherm. Res. 42, 303-306 418
(1990). 419
4. R. S. J. Sparks, P.W. Francis, R. D. Hamer, R. J. Pankhurst, L. O. O'callaghan, R. S. Thorpe, R. Page, 420
Ignimbrites of the Cerro Galán caldera, NW Argentina. J. Volcanol. Geotherm. Res. 24, 205-248 (1985). 421
5. T. H. Druitt, R. S. J. Sparks, On the formation of calderas during ignimbrite eruptions. Nature 310, 679-422
681 (1984). 423
6. P. W. Lipman, Subsidence of ash-flow calderas: relation to caldera size and magma-chamber geometry. 424
Bull. Volc., 59, 198-218 (1997). 425
7. V. Acocella, Understanding caldera structure and develpoment: an overview of analogue models 426
compared to natural calderas. Earth Sci. Rev., 125, 125-160 (2007). 427
8. O. Roche, T. H. Druitt, O. Merle, Experimental study of caldera formation. J. Geophys. Res. 105, 395-416 428
(2001). 429
23
9. T. Simkin, K. A. Howard, Caldera collapse in the Galapagos Islands, 1968: The largest known collapse since 430
1912 followed a flank eruption and explosive volcanism within the caldera. Science 169, 429に437 (1970). 431
10. S. A. Fedotov, Y. K. Markhinin, The Great Tolbachik Fissure Eruption. Geological and Geophysical Data 432
1975-1976. (Cambridge University Press, Cambridge, 2011). 433
11. N. Geshi, T. Shimano, S. Chiba, Caldera collapse during the 2000 eruption of Miyakejima Volcano, Japan. 434
Bull. Volcanol. 64, 55-68 (2002). 435
12. T. Staudacher, V. Ferrazzini, A. Peltier, P. Kowalski, P. Boissier, P. Catherine, F. Lauret, F. Massin, The 436
April 2007 eruption and the Dolomieu crater collapse, two major events at Piton de la Fournaise (La 437
Réunion Island, Indian Ocean). J. Volcanol. Geotherm. Res. 184, 126-137 (2009). 438
13. E. P. Holohan, M. P. J. Schöpfer, J. J. Walsh, J. J. Stress evolution during caldera collapse. Earth Planet. 439
Sc. Lett. 421, 139-151 (2015). 440
14. K. V. Cashman, G. Giordano, Calderas and magma reservoirs. J. Volcanol. Geotherm. Res. 288, 28-45 441
(2014). 442
15. J. Battaglia, C. H. Thurber, J.-L. Got, C. A. Rowe, R A. White, Precise relocation of earthquakes following 443
the 15 June 1991 eruption of Mount Pinatubo (Philippines). J. Geophys. Res. 109, B7 (2004). 444
16. L. Michon, F. Massin, V. Famin, V. Ferrazzini, G. Roult, Basaltic calderas: Collapse dynamics, edifice 445
deformation, and variations of magma withdrawal. J. Geophys. Res. 116, B3 (2011). 446
17. H. Björnsson, P. Einarsson, Volcanoes beneath Vatnajökull, Iceland: evidence from radio-echo sounding, 447
earthquakes and jökulhlaups. Jokull 40, 147-148 (1990). 448
18. M. T. Gudmundsson, T. Högnadóttir, Volcanic systems and calderas in the Vatnajökull region, central 449
Iceland, constraints on crustal structure from gravity data. Journal of Geodynamics, 43, 153-169 (2007). 450
19. T. Thordarson, G. Larsen, Volcanism in Iceland in historical time: Volcano types, eruption styles and 451
eruption history. J. Geodyn. 43, 118-152 (2007). 452
20. F. Sigmundsson, A. Hooper, S. Hreinsdóttir, K. S. Vogfjörd, B. G. Ófeigsson, E. R. Heimisson, S. Dumont, 453
M. Parks, K. Spaans, G. B. Gudmundsson, V. Drouin, T. Árnadóttir, K. Jónsdóttir, M. T. Gudmundsson, T. 454
Högnadóttir, H. M. Fridriksdóttir, M. Hensch, P. Einarsson, E. Magnússon, S. Samsonov, B. Brandsdóttir, R. 455
S. White, T. Ágústsdóttir, T. Greenfield, R. G. Green, A. R. Hjartardóttir, R. Pedersen, R. A. Bennett, H. 456
Geirsson, P. C. La Femina, H. Björnsson, F. Pálsson, E. Sturkell, C. J. Bean, M. Möllhoff, A. K. Braiden, E. P. S. 457
Eibl, Segmented lateral dyke growth in a rifting event at Bárðarbunga volcanic system. Nature 517, 191-195 458
(2015). 459
21. T. Ágústsdóttir, J. Woods, T. Greenfield, R. G. Green, R. S. White, T. Winder, B. Brandsdóttir, S. 460
Steinthórsson, H. Soosalu, Strike-slip faulting during the 2014 Bárðarbunga-Holuhraun dike intrusion, 461
central Iceland. Geophys. Res. Lett. (accepted). DOI: 10.1002/2015GL067423 462
22. S. R. Gíslason, G. Stefánsdóttir, M. A. Pfeffer, S. Barsotti, Th. Jóhannsson, I. Galeczka, E. Bali, O. 463
Sigmarsson, A. Stefánsson, N. S. Keller, A. Sigurdsson, B. Bergsson, B. Galle, V. C. Jacobo, S. Arellano, A. 464
Aiuppa, E. S. Eiríksdóttir, S. Jakobsson, G. H. Gudfinnsson, S. A. Halldórsson, H. Gunnarsson, B. Haddadi, I. 465
Jónsdóttir, Th. Thordarson, M. Riishuus, Th. Högnadóttir, T. Dürig, G. B. M. Pedersen, A. Höskuldsson, M. T. 466
24
Gudmundsson, Environmental pressure from the 2014に15 eruption of Bárðarbunga volcano, Iceland. 467
Geochem. Perspect. Lett., 1, 84-93 (2015). 468
23. O. Roche, O., T. H. Druitt, Onset of caldera collapse during ignimbrite eruptions. Earth Planet. Sci. Lett., 469
191(3), 191-202 (2001). 470
24. Materials and methods are available as supplementary materials on Science Online. 471
25. J. Browning, A. Gudmundsson, Surface displacements resulting from magma-chamber roof subsidence, 472
with application to the 2014-2015 Bardarbunga-Holuhraun volcanotectonic episode in Iceland. J. Volcanol. 473
Geotherm. Res. 308, 82-98 (2015). 474
26. H. Björnsson, Hydrology of ice caps in volcanic regions. Soc. Sci. Isl. 45, 139pp (1988). 475
27. E. P. Holohan, V. R. Troll, B. Van Wyk de Vries, J. J. Walsh, T. R. Walter, Unzipping Long Valley: an 476
explanation for vent migration during an elliptical ring fracture eruption. Geology 36, 323-326 (2008). 477
28. Eく Pく Hラノラエ;ミが Tく ‘く W;ノデWヴが MくPく “IエワヮaWヴが Jく Jく W;ノゲエが Bく W┞ニ SW VヴキWゲが Vく ‘く Tヴラノノが Oヴキェキミゲ ラa ラHノキケ┌Wどゲノキヮ 478
faulting during caldera subsidence. J. Geophys. Res. 118(4), 1778-1794 (2013). 479
29. C. Clough, H. Maufe, E. Baley, The cauldron subsidence of Glen-Coe, and the associated igneous 480
phenomena. Q.J.Soc. Lond. 65, 611に678 (1909). 481
30. H. Bathke, M. Nikhoo, E.P. Holohan, T.R. Walter, Insights into the 3D architecture of an active caldera 482
ring-fault at Tendürek volcano through modeling of geodetic data. Earth. Planet. Sci. Lett. 422:157-168 483
(2015). 484
31. A. Fichtner, H. Tkalcic, Insights into the kinematics of a volcanic caldera drop: Probabilistic finite-source 485
inversion of the 1996 Bardarbunga, Iceland, earthquake. Earth Planet. Sc. Lett. 297, 607-615 (2010). 486
32. B. Riel, P. Milillo, M. Simons, P. Lundgren, H. Kanamori, H., S. Samsonov, The collapse of Bárðarbunga 487
Caldera, Iceland. Geophys. J. Int. 202, 446-453 (2015). 488
33. S. Cesca, A. T. Sen, T. Dahm, Seismicity monitoring by cluster analysis of moment tensors. Geophys. J. 489
Int. 196, 1813-1826 (2013). 490
34く Aく “エ┌ノWヴが Gく Eニゲデヴワマが Mく NWデデノWゲが Pエ┞ゲキI;ノ マWIエ;ミキゲマゲ aラヴ ┗WヴデキI;ノどCLVD W;ヴデエケ┌;ニWゲ ;デ ;Iデキ┗W 491
volcanoes. J. Geophys. Res. 118(4), 1569-1586 (2013). 492
35. K. Abe, Seismicity of the caldera-making eruption of Mount Katmai, Alaska in 1912. B. Seismol. Soc. Am. 493
82, 175-191 (1992). 494
36. C. P. Montagna, H. M. Gonnermann, Magma flow between summit and Pu`u `O`o at Kilauea Volcano, 495
Hawaii. Geochem. Geophy. Geosy. 14, 2232に2246 (2013). 496
37. H. Kumagai, T. Ohminato, M. Nakano, M. Ooi, A. Kubo, H. Inoue, J. Oikawa, Very-long-period seismic 497
signals and caldera formation at Miyake Island, Japan. Sci. 293, 687-690 (2001). 498
38. G. Wadge, Steady state volcanism: evidence from eruption histories of polygenetic volcanoes. 499
J. Geophys. Res. 87, B5: 4035-4049 (1982). 500
39. A. Geyer, A. Folch, J. Martí, Relationship between caldera collapse and magma chamber withdrawal: an 501
experimental approach. J Volcanol. Geotherm. Res. 157, 375-386 (2006). 502
25
40. A. Folch, J. Marti, Time-dependent chamber and vent conditions during explosive caldera-forming 503
eruptions. Earth Planet. Sc. Lett. 280, 246-253 (2009). 504
41. W. Hildreth, J. Fierstein, Katmai volcanic cluster and the great eruption of 1912. Geophys. J. Int. 112, 505
446-453 (2000). 506
42. B. C. Bautista, M. L. P. Bautista, R. S. Stein, E. S. Barcelona, R. S. Punongbayan, E. P. Laguerta, A. R. 507
Rasdas, G. Ambubuyog, E. Q. Amin, さ‘Wノ;デキラミゲエキヮ ラa ヴWェキラミ;ノ ;ミS ノラI;ノ ゲデヴ┌Iデ┌ヴWゲ デラ Mラ┌ミデ Pキミ;デ┌Hラ 508
;Iデキ┗キデ┞ざ キミ Fire and Mud: Eruptions and Lahars of Mount Pinatubo, Philippines. PHIVOLCS, C. G. Newhall, R. 509
S. Punongbayan, Eds. (University of Washington Press, Quezon City, 1996), pp. 351-370. 510
43. J. Mori, R. A. White, D. H. Harlow, P. Okubo, J. A. Power, R. P. Hoblitt, E. P. Laguerta, A. Lanuza, B. C. 511
Bautista, さVラノI;ミキI W;ヴデエ ケ┌;ニWゲ aラノノラ┘キミェ デエW ヱΓΓヱ Iノキマ;IデキI Wヴ┌ヮデキラミ ラa Mラ┌ミデ Pキミ;デ┌Hラぎ ゲデヴラミェ ゲWキゲマキIキデ┞ 512
S┌ヴキミェ ; ┘;ミキミェ Wヴ┌ヮデキラミざ キミ Fire and Mud: Eruptions and Lahars of Mount Pinatubo, Philippines. PHIVOLCS. 513
C. G. Newhall, R. S. Punongbayan, Eds. (University of Washington Press, Quezon City, 1996), pp. 339-350. 514
44. L. Michon, T. Staudacher, V. Ferrazzini, P. Bachèlery, J. Marti, April 2007 collapse of Piton de la 515
Fournaise: a new example of caldera formation. Geophys. Res. Lett., 34(21) (2007). 516
45. F. R. Fontaine, G. Roult, L. Michon, G. Barruol, A. Di Muro, The 2007 eruptions and caldera collapse of 517
the Piton de la Fournaise volcano (La Reunion Island) from tilt analysis at a single very broadband seismic 518
station. Geophys. Res. Lett. 41, 2803-2811 (2014); published online EpubApr 28 (10.1002/2014GL059691). 519
46. A. Di Muro, N. Metrich, D. Vergani, M. Rosi, P. Armienti, T. Fougeroux, E. Deloule, I. Arienzo, L. Civetta, 520
The Shallow Plumbing System of Piton de la Fournaise Volcano (La R,union Island, Indian Ocean) Revealed 521
by the Major 2007 Caldera-Forming Eruption. J. Petrol. 55, 1287-1315 (2014); published online EpubJul 522
(10.1093/petrology/egu025). 523
47. T. Kaneko, A. Yasuda, T. Shimano, S. Nakada, T. Fujii, T. Kanazawa, A. Nishizawa, Y. Matsumoto, 524
Submarine flank eruption preceding caldera subsidence during the 2000 eruption of Miyakejima Volcano, 525
Japan. Bull. Volcanol. 67, 243-253 (2005); published online EpubMar (10.1007/s00445-004-0407-1). 526
48. M. Amma-Miyasaka, M. Nakagawa, S. Nakada, Magma plumbing system of the 2000 eruption of 527
Miyakejima Volcano, Japan. Bull. Volcanol. 67, 254-267 (2005); published online EpubMar 528
(10.1007/s00445-004-0408-0). 529
49. T. Nishimura, S. Ozawa, M. Murakami, T. Sagiya, T. Tada, M. Kaidzu, M. Ukawa, Crustal Deformation 530
caused by magma migration in the northern Izu Islands, Japan. Geophys. Res. Lett. 28, 3745-3748 (2001); 531
published online EpubOct 1 (Doi 10.1029/2001gl013051). 532
50. S. A. Fedotov, L. B. Slavina, S. L. Senyukov, M. S. Kuchay, Seismic processes and migration of magma 533
during the Great Tolbachik Fissure Eruption of 1975-1976 and Tolbachik Fissure Eruption of 2012-2013, 534
Kamchatka Peninsula. Izv. Atmos. Ocean Phy. 51, 667-687 (2015); published online EpubDec 535
(10.1134/S000143381507004x). 536
51. S. A. Fedotov, I. S. Utkin, L. I. Utkina, The Peripheral Magma Chamber of Ploskii Tolbachik, a Kamchatka 537
Basaltic Volcano: Activity, Location and Depth, Dimensions, and their Changes Based on Magma Discharge 538
Observations. J. Volcanol. Seismol. 5, 369-385 (2011); published online EpubDec 539
(10.1134/S0742046311060042). 540
26
52. P. Doubik, B. E. Hill, Magmatic and hydromagmatic conduit development during the 1975 Tolbachik 541
Eruption, Kamchatka, with implications for hazards assessment at Yucca Mountain, NV. J. Volcanol. 542
Geotherm. Res. 91, 43-64 (1999); published online EpubJul (Doi 10.1016/S0377-0273(99)00052-9). 543
53. S.A. Fedotov, A. M. Chirkov, N.A. Gusev,G. N. Kovalev, Y. B. Slezin, The large fissure eruption in the 544
region of Plosky Tolbachik volcano in Kamchatka, 1975に1976. Bull. Volcanol. 43, 47-60 (1980). 545
54. J. Filson, T. Simkin, L. K. Leu, Seismicity of a caldera collapse: Galapagos Islands 1968. J. Geophys. Res., 546
78(35), 8591-8622 (1973). 547
55. J. E. Hammer, M. J. Rutherford, W. Hildreth, Magma storage prior to the 1912 eruption at Novarupta, 548
Alaska. Contrib. Mineral. Petr. 144, 144-162 (2002); published online EpubNov (10.1007/s00410-002-0393-549
2). 550
56. M. J. Rutherford, J. D. Devine, in Fire and Mud: Eruptions and Lahars of Mount Pinatubo, Philippines C. 551
G. Newhall, R. S. Punongbayan, Eds. (Philippine Institute of Volcanology and Seismology & University of 552
Washington Press, Quezon City, Seattle & London, 1996), pp. 751に766. 553
57. H. Kanamori, J. Mori, E. Hauksson, T. H. Heaton, L. K. Hutton, L. M. Jones, Determination of earthquake 554
energy release and ML using TERRAscope. Bull. . Seismol. Soc. Am., 83(2), 330-346 (1993). 555
58. M. Kikuchi, Y. Yamanaka, K. Koketsu, Source Process of the Long-period Seismic Pulses Associated with 556
the 2000 Eruption of Miyakejima Volcano and its Implications. J. Geograph. Tokyo 110(2), 204-216 (2001). 557
59. M. T. Gudmundsson, T. Hognadottir, A. B. Kristinsson, S. Gudbjornsson, Geothermal activity in the 558
subglacial Katla caldera, Iceland 1999-2005, studied with radar altimetry. Ann. Glacio. 45, 66-72 (2007). 559
60. C. Mätzler, Microwave permittivity of dry snow. IEEE Trans. Geosci. Remote Sens. 34, 573-581 (1996). 560
61. C. Rossi, C. Minet, T. Fritz, M. Eineder, R. Bamler, Temporal monitoring of subglacial volcanoes with 561
TanDEM-XねApplication to the 2014に2015 eruption within the Bárðarbunga volcanic system, Iceland. 562
Remote Sens. Environ. 181, 186-197 (2016) 563
62. T. Johannesson, H. Björnsson, E. Magnússon, S. Guðmundsson, F. Pálsson, O. Sigurðsson, T. 564
Thorsteinsson, E. Berthier, Ice-volume changes, bias estimation of mass-balance measurements and 565
changes in subglacial lakes derived by lidar mapping of the surface of Icelandic glaciers. Ann. Glacio. 54, 63-566
74 (2013). 567
63. E. Magnusson, F. Palsson, H. Bjornsson, S. Gudmundsson, Removing the ice cap of Oraefajokull central 568
volcano, SE-Iceland: Mapping and interpretation of bedrock topography, ice volumes, subglacial troughs 569
and implications for hazards assessments. Jokull 62, 131-150 (2012). 570
64. H. Bjornsson, F. Pálsson, M. T. Gudmundsson, Vatnajokull, Northwest Part, 1:100 000: Bedrock 571
topography, Landsvirkjun and Science Institute, University of Iceland, 1992. 572
65. A. H. Jarosch, Icetools: A full Stokes finite element model for glaciers. Comput. Geosci. 34, 1004-1014 573
(2008). 574
66. J. W. Glen, The Creep of Polycrystalline Ice. P. Roy. Soc. A-Math. Phy. 228, 519-538 (1955). 575
27
67. K. M. Cuffey, W. S. B. Paterson, The Physics of Glaciers. (Elsevier Butterworth-Heinemann, Burlington, 576
ed. 4, 2010). 577
6Βく Cく Eく LWゲエWヴが Fく Jく “ヮWヴ;が さTエWヴマラS┞ミ;マキI ;ミS Tヴ;ミゲヮラヴデ PヴラヮWヴデキWゲ ラa “キノキI;デW MWノデゲ ;ミS M;ェマ;さ キミ The 578
Encyclopedia of Volcanoes, H. Sigurdsson, B. Houghton, H. Rymer, Eds. (Academic Press, Academic Press, 579
Heidelberg, Amsterdam, Boston, ed. 2, 2015), pp. 113-141. 580
69. R. Bödvarsson, S. T. Rögnvaldsson, R. Slunga, E. Kjartansson, The SIL data acquisition systemねat present 581
and beyond year 2000. Phys. Earth Planet. Inter. 113, 89-101 (1999). 582
70. R. Slunga, S. T. Rögnvaldsson, R. Bödvarsson, Absolute and relative locations of similar events with 583
application to microearthquakes in southern Iceland. Geophys. J. Int. 123, 409に419 (1995). 584
71. S. Th. Rögnvaldsson, R. Slunga, Routine fault plane solutions for local networks: a test with synthetic 585
data. Bull. Seism. Soc. Am. 83.4, 1232-1247 (1993). 586
72く ‘く “デWa=ミゲゲラミが ‘く BワU┗;ヴゲゲラミが ‘く “ノ┌ミェ;が Pく Eキミ;ヴゲゲラミが “く J;ニラHゲSルデデキヴが Hく B┌ミェ┌マが “く GヴWェWヴゲWミが Jく 587
Havskov, J. Hjelme, H. Korhonen, Earthquake prediction research in the South Iceland seismic zone and the 588
SIL project. Bull. Seism. Soc. Am. 83, 696に716 (1993). 589
73. S., A., R. Cesca, T. Dahm, Discrimination of induced seismicity by full moment tensor inversion and 590
decomposition. J. Seimsol. 17, 147-163 (2013). 591
74. P. A. Rosen, S. Hensley, I. R. Joughin, F. K. Li, S. N. Madsen, E. Rodriguez, R. M. Goldstein, Synthetic 592
aperture radar interferometry, presented at Proceedings of the IEEE, 2000 (unpublished). 593
75. B. Kampes, Delft Object-ラヴキWミデWS ‘;S;ヴ IミデWヴaWヴラマWデヴキI “ラaデ┘;ヴWぎ UゲWヴげゲ M;ミ┌;ノ ;ミS TWIエミキI;ノ 594
Documentation v4.02, presented at Delft Technical University, 1999 (unpublished). 595
76. Y. Y. Kagan, 3-D rotation of double-couple earthquake sources. Geophys. J. Int. 106, 709に716 (1991). 596
77. R. M. Goldstein, C. L. Werner, Radar interferogram filtering for geophysical applications. Geophys. Res. 597
Lett. 25, 4035-4038 (1998). 598
78. C. W. Chen, H. A. Zebker, Two-dimensional phase unwrapping with use of statistical models for cost 599
functions in nonlinear optimization. J. Opt. Soc. Am. A Opt. Image. Sci. Vis. 18, 338-351 (2001). 600
79. Y. Okada, Internal deformation due to shear and tensile faults in a half-space. B. Seismol. Soc. Am. 82, 601
1018-1040 (1992). 602
80. A. Hooper, J. Pietrzak, W. Simons, H. Cui, R. Riva, M. Naeije, A. Terwisscha van Scheltinga, E. Schrama, G. 603
Stelling, A. Socquet, Importance of horizontal seafloor motion on tsunami height for the 2011 Mw=9.0 604
Tohoku-Oki earthquake. Earth Planet. Sc. Lett. 361, 469-479 (2013). 605
81. C. E. Ford, D. G. Russell, J. A. Craven, M. R. Fisk, Olivine-liquid equilibria: Temperature, pressure and 606
composition dependence of the crystal/liquid cation partition coefficients for Mg, Fe2+, Ca and Mn. J. 607
Petrol. 24, 256-266 (1983). 608
82. H. J. Yang, R. J. Kinzler, T. L. Grove, Experiments and models of anhydrous, basaltic olivine-plagioclase-609
augite saturated melts from 0.001 to 10 kbar. Contrib. Mineral. Petr. 124, 1-18 (1996). 610
28
83. G. H. Gudfinnsson, D. C. Presnall, A pressure-independent geothermometer for primitive mantle melts. 611
J. Geophys. Res. 106, B8 (2001). 612
84. K. D. Putirka, Thermometers and barometers for volcanic systems. Rev. Mineral. Geochem. 69, 61-120 613
(2008). 614
85. Y. Kawakami, J. Yamamoto, H. Kagi, Microraman densimeter for CO2 inclusions in mantle derived 615
minerals. Appl. Spectrosc. 57, 1333-1339 (2003). 616
86. M.R. Burton, P. Allard, F. Mure, A. La Spina, Magmatic gas composition reveals the 617
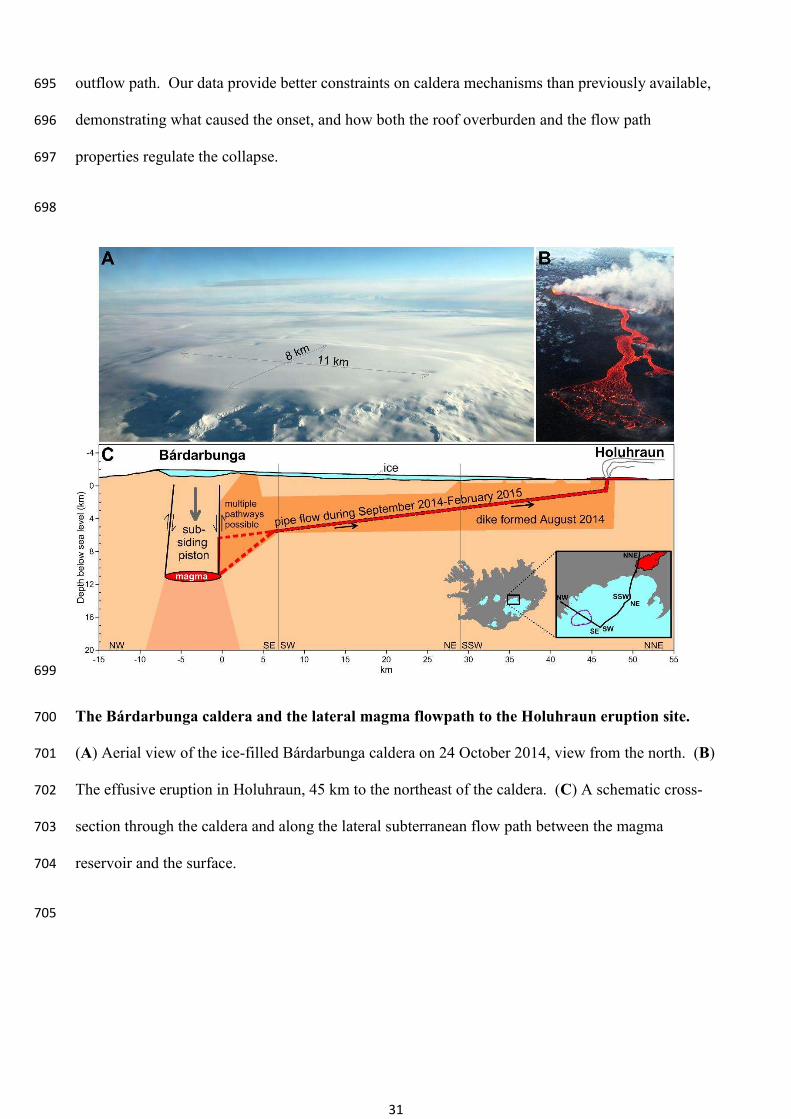
source depth of slug-driven Strombolian explosive activity, Science, 317, 5835, 227-230 (2007), 618
doi:10.1126/science.1141900. 619
620
87. A. Aiuppa, C. Federico, G. Giudice, S. Gurrieri, Chemical mapping of a fumarolic field: La Fossa Crater, 621
Vulcano Island (Aeolian Islands, Italy), Geophys. Res. Lett., 32 (13) (2005), p. L13309 622
http://dx.doi.org/10.1029/2005GL023207 623
88. P.-J. Gauthier, O. Sigmarsson, M. Gouhier, B. Haddadi, and S. Moune, Elevated gas flux and trace metal 624
degassing from the 2014に2015 fissure eruption at the Bárðarbunga volcanic system, Iceland, J. Geophys. 625
Res. Solid Earth, 121, (2016) doi:10.1002/2015JB012111. 626
89. E. Bali, O. Sigmarsson, S. Jakobsson, H. Gunnarsson, Volatile budget of the Nornahraun eruption in the 627
Bárðarbunga system, Iceland. Geophysical Research Abstracts Vol. 17, EGU2015-5757, 2015 EGU General 628
Assembly (2015). http://meetingorganizer.copernicus.org/EGU2015/EGU2015-5757.pdf 629
90. A. Burgisser, M. Alletti, B. Scaillet, Simulating the behavior of volatiles belonging to the CにOにHにS 630
system in silicate melts under magmatic conditions with the software D-Compress, Comput. Geosci., 79, 1に631
14. 632
91. D. O. Potyondy, P. A. Cundall, A bonded particle model for rock. Int. J. Rock Mech. Min. 41, 1329-1364 633
(2004). 634
92. D. Mas Ivars, M. E. Pierce, C. Darcel, J. Reyes-Montes, D. O. Potyondy, R. P. Young, P. A. Cundall, The 635
synthetic rock mass approach for jointed rock mass modelling. Int. J. Rock Mech. Min. 48, 219-244 (2011). 636
93. Itasca Consulting Group, Inc. PFC2D - Particle Flow Code in Two-Dimensions, Ver. 5.0. Minneapolis, 637
Itasca (2014). 638
94. K. Mogi, Relations between the eruptions of various volcanoes and the deformations of the ground 639
surfaces around them. B. Earthq. Res. Inst. Univ. Tokyo 36, 99に134 (1958). 640
95. M. Ripepe, D. Delle Donne, R. Genco, G. Maggio, M. Pistolesi, E. Marchetti, G. Lacanna, G. U. P. Poggi, 641
Volcano seismicity and ground deformation unveil the gravity-driven magma discharge dynamics of a 642
volcanic eruption. Nat. Commun. 6 (2015). 643
96. Y. Bottinga, D. Weill, The viscosity of magmatic silicate liquids: a model for calculation. Am. J. Sci. 272, 644
438に475 (1972). 645
646
29
One page summary: 647
Gradual caldera collapse at Bárdarbunga volcano, Iceland, 648
regulated by lateral magma outflow 649
Magnús T. Gudmundsson1, Kristín Jónsdóttir2, Andrew Hooper3, Eoghan P. Holohan4,5, Saemundur 650
A. Halldórsson1, Benedikt G. Ófeigsson2, Simone Cesca4, Kristín S. Vogfjörd2, Freysteinn 651
Sigmundsson1, Thórdís Högnadóttir1, Páll Einarsson1, Olgeir Sigmarsson1,6, Alexander H. Jarosch1, 652
Kristján Jónasson7, Eyjólfur Magnússon1, Sigrún Hreinsdóttir8, Marco Bagnardi3, Michelle M. 653
Parks1, Vala Hjörleifsdóttir9, Finnur Pálsson1, Thomas R. Walter4, Martin P.J. Schöpfer10, Sebastian 654
Heimann4, Hannah I. Reynolds1, Stéphanie Dumont1, Eniko Bali1, Gudmundur H. Gudfinnsson1, 655
Torsten Dahm4, Matthew Roberts2, Martin Hensch2, Joaquín, M.C. Belart1, Karsten Spaans3, 656
Sigurdur Jakobsson1, Gunnar B. Gudmundsson2, Hildur M. Fridriksdóttir1,2, Vincent Drouin1, 657
Tobias Dürig1, Gudfinna Adalgeirsdóttir1, Morten S. Riishuus1, Gro B.M. Pedersen1, Tayo van 658
Boeckel1 , Björn Oddsson11, Melissa A. Pfeffer2, Sara Barsotti2, Baldur Bergsson2, Amy Donovan12, 659
Mike R. Burton13, Alessandro Aiuppa14 660
INTRODUCTION: The Bárdarbunga caldera volcano in central Iceland collapsed from August 661
2014 – February 2015 during the largest eruption in Europe since 1784. An ice-filled subsidence 662
bowl 8 x11 km wide and up to 65 m deep developed, while magma drained laterally for 45 km 663
along a subterranean path and erupted as a major lava flow northeast of the volcano. Our data 664
provide unprecedented insight into of the workings of a collapsing caldera. 665
RATIONALE: Collapses of caldera volcanoes are, fortunately, not very frequent, as they are often 666
associated with very large volcanic eruptions. On the other hand, the rarity of caldera collapses 667
limits insight into this major geological hazard. Since the formation of Katmai caldera in 1912, 668
during the 20th century’s largest eruption, only five caldera collapses are known to have occurred 669
30
before that at Bárdarbunga. We used aircraft-based altimetry, satellite photogrammetry, radar 670
interferometry, ground-based GPS, evolution of seismicity, radio-echo soundings of ice thickness, 671
ice flow modeling and geobarometry to describe and analyze the evolving subsidence geometry, its 672
underlying cause, the amount of magma erupted, the geometry of the subsurface caldera ring faults 673
and the moment tensor solutions of the collapse-related earthquakes. 674
RESULTS: After initial lateral withdrawal of magma for some days though a magma-filled 675
fracture propagating through the Earth’s upper crust, pre-existing ring faults under the volcano were 676
reactivated over the period 20-24 August, marking the onset of collapse. On August 31, the eruption 677
started and it terminated when the collapse stopped, having produced 1.5 km3 of basaltic lava. The 678
subsidence of the caldera declined with time in a near exponential manner, in phase with the lava 679
flow rate. 680
The volume of the subsidence bowl was about 1.8 km3. Using radio-echo soundings, we find that 681
the subglacial bedrock surface after the collapse is down-sagged with no indications of steep fault 682
escarpments. Using geobarometry, we determined the source depth of the magma to be 683
approximately 12 km and modelling of geodetic observations gives a similar result. High precision 684
earthquake locations and moment tensor analysis of the remarkable magnitude M5 earthquake 685
series are consistent with steeply dipping ring faults. Statistical analysis of seismicity reveals 686
communication over tens of kilometers between the caldera and the dyke. 687
CONCLUSIONS: We conclude that interaction between the pressure exerted by the subsiding 688
reservoir roof and the physical properties of the subsurface flow path explain the gradual near 689
exponential decline of both collapse rate and the intensity of the 181-day long eruption. By 690
combining our various data sets, we show that the onset of collapse was caused by outflow of 691
magma from underneath the caldera when 12-20% of the total magma intruded and erupted had 692
flowed from the magma reservoir. However, the continued subsidence was driven by a feedback 693
between the pressure of the piston-like block overlying the reservoir, and the 47 km long magma 694
31
outflow path. Our data provide better constraints on caldera mechanisms than previously available, 695
demonstrating what caused the onset, and how both the roof overburden and the flow path 696
properties regulate the collapse. 697
698
699
The Bárdarbunga caldera and the lateral magma flowpath to the Holuhraun eruption site. 700
(A) Aerial view of the ice-filled Bárdarbunga caldera on 24 October 2014, view from the north. (B) 701
The effusive eruption in Holuhraun, 45 km to the northeast of the caldera. (C) A schematic cross-702
section through the caldera and along the lateral subterranean flow path between the magma 703
reservoir and the surface. 704
705
32
706
707
Supplementary Materials for 708
709
Gradual Caldera Collapse at Bárdarbunga Volcano, Iceland, Regulated by Lateral Magma Outflow 710
711
Magnús T. Gudmundsson,* Kristín Jónsdóttir, Andrew Hooper, Eoghan P. Holohan, Saemundur A. 712
Halldórsson, Benedikt G. Ófeigsson, Simone Cesca, Kristín S. Vogfjörd, Freysteinn Sigmundsson, Thórdís 713
Högnadóttir, Páll Einarsson, Olgeir Sigmarsson, Alexander H. Jarosch, Kristján Jónasson, Eyjólfur 714
Magnússon, Sigrún Hreinsdóttir, Marco Bagnardi, Michelle M. Parks, Vala Hjörleifsdóttir, Finnur Pálsson, 715
Thomas R. Walter, Martin P.J. Schöpfer, Sebastian Heimann, Hannah I. Reynolds, Stéphanie Dumont, Eniko 716
Bali, Gudmundur H. Gudfinnsson, Torsten Dahm, Matthew Roberts, Martin Hensch, Joaquín, M.C. Belart, 717
Karsten Spaans, Sigurdur Jakobsson, Gunnar B. Gudmundsson, Hildur M. Fridriksdóttir, Vincent Drouin, 718
Tobias Dürig, Gudfinna Adalgeirsdóttir, Morten S. Riishuus, Gro B.M. Pedersen, Tayo van Boeckel, Björn 719
Oddsson, Melissa A. Pfeffer, Sara Barsotti, Baldur Bergsson, Amy Donovan, Mike R. Burton, Alessandro 720
Aiuppa 721
. 722
723
* correspondence to: [email protected] 724
725
This PDF file includes: 726
727
Materials and Methods 728
SupplementaryText 729
Figs. S1 to S8 730
731
33
Materials and Methods 732
Mapping of collapse 733
Ice surface topography was mapped 18 times in the period September 5, 2014 to June 4, 2015 (Fig. S1). An 734
aircraft-based system (59) of sub-meter differential GPS and ground clearance altimeter (4.3 GHz wave, 735
vertical elevation accuracy ±2 m) on board the survey aircraft of Isavia, the Icelandic Civil Aviation Service 736
(59) provided 13 maps (Marked as FMS on Fig. S1). Survey lines were flown at 70-120 m ground clearance, 737
measuring 4 times/sec. (at ~15 m intervals), and included coverage of the growing geothermal ice 738
cauldrons. Comparison with kinematic GPS ground surveys in November, February and June (accuracy ±0.3 739
m), as well as snow temperature models and measurements show that the reflecting surface was 740
unaffected by accumulation of winter snow and remained at the September 2014 summer surface until 741
October, after which it gradually migrated downwards to ~1.5 m below it by February 2015. The reflecting 742
surface probably indicates the lower boundary of the dry snow layer where snow temperature was <0°C 743
(60). A subset of this data was used by Rossi et al. (61) to compare with Tandem-X derived maps of the 744
subsidence for specific dates in late 2014. Optical photogrammetry maps were made using satellite data 745
for August 28 (Spot 6 satellite), September 20 and October 10 (Pléiades satellite). Combined, the surface 746
data provide a record of collapse volume with time (Fig. 3B). The curve in Fig. 3B is drawn using the 747
difference of the running average of volume obtained in three adjacent surveys. The rate of volume change 748
obtained in this way is also used in Fig. 6B. A continuously recording GPS station (BARC) was installed on 749
the ice-surface on September 12, 2014. This station monitored the subsidence continuously for a large part 750
of the unrest, although snow covering the antenna lead to some data gaps. A detailed ground kinematic 751
GPS survey within and around the caldera on June 3-10, 2015 allowed the margins of collapse to be 752
determined. Measurements of winter accumulation in the Bárdarbunga caldera in June 2015 constrained 753
subsidence data while a glacier surface lidar map from 2011-2012 (62) was used as reference surface. 754
755
Radio-echo soundings (RES) 756
On February 3, 2015, when over 95% of the subsidence had occurred, 45 km of RES-profiles (1-5 MHz 757
receiver bandwidth) were measured in over-snow traverses, covering about 2/3 of the caldera floor, 758
including a large part of the subsided area. Bedrock echoes were detected for ~90% of the measurements. 759
Along-profile bedrock echoes in length-depth coordinates were migrated (63) to compensate for the width 760
of the radar beam (~200 m). Comparison of our data with previous mapping done in 1985 (64) indicates 761
that the over 60 m subsidence had not caused significant changes in ice thickness; the maximum thickness 762
observed is close to 800 meters on both occasions. 763
764
Ice flow modelling 765
Assuming no basal slip (vb = 0), ice deformation within the caldera has been computed using a Full-Stokes 766
finite element model solving the standard equations (65). On the lateral boundaries of the model domain, 767
no flow conditions (i.e. v = 0) have been defined and the model domain chosen to be sufficiently large so 768
that the lateral boundary conditions do not influence the ice flow within the caldera. The rate factor in 769
Glen's flow law (66) has been estimated by constraining the horizontal model surface velocities to fit the 770
measured ones at the BARC GPS station for the period September 12 to February 3. This yielded A=1.6 10-24 771
Pa-3s-1 assuming the nonlinearity parameter in Glen's flow law to be n=3. This is somewhat stiffer than 772
textbook values for temperate ice (A=2.4 10-24 Pa-3s-1, ref. 67) but is to be expected in a volcanic setting 773
34
where the ice body contains several tephra layers. Moreover, this low value for A supports our initial 774
assumption of no basal slip. At the basal boundary, the post-collapse bed topography from the RES survey 775
has been used and the surface of each model utilized the respective surface DTM implemented as a free 776
surface within the FEM model. The ice flow modelling (Fig. S2) indicates that the ice surface subsidence was 777
almost identical to bedrock subsidence everywhere in the caldera (error <1 m) in September-October. 778
However, by the end of February the inflow of ice towards the bottom of the subsidence structure had 779
resulted in uplift of about 3 m in the center and a subsidence of 1-3 m on a circle around the uplifted 780
central part. 781
782
Lava volume and flow rate 783
The surface elevation of the growing Holuhraun lava flow was measured using a Theodolite from the 784
ground in September 21 2014, and with the Isavia aircraft (see above on mapping of collapse) on November 785
4 and 26, December 4 and 30 and January 21, as well as later surveys in 2015. The aircraft surveys were 786
calibrated with kinematic GPS profiling of the surface. These data give lava volumes at the time of survey, 787
providing estimates of the average magma flow rate over periods of some weeks (Fig. 6B) and a final lava 788
volume of 1.5±0.2 km3. Nettleton gravity profiles obtained in September 2015 of the lava indicate average 789
bulk lava density of 2500±100 kg m-3. Using a basaltic magma density of 2750 kg m-3 for pressure of 300-400 790
MPa (68) the equivalent volume of magma at ~12 km depth in the crust is 1.4±0.2 km3. 791
792
Relative locations of microearthquakes 793
M гヲ W;ヴデエケ┌;ニWゲ ;デ デエW I;ノSWヴ; ヴWIラヴSWS ;デ Sキゲデ;ミIWゲ аヱヰヰ ニマ HWデ┘Wen August 1 and October 17 by the 794
Icelandic national seismic network, SIL (69) were relatively relocated using a standard 1D velocity model 795
(70). SIL magnitudes were calculated according to Rognvaldsson and Slunga (71). A double-difference 796
method was used, where absolute and relative arrival times of P and S waves determined through cross-797
correlation of waveforms, were inverted for best locations in multiple overlapping groups (72). Depth is set 798
to zero at bedrock caldera floor (1.2 km above sea level, see Figs. 5 and 6). The relocated events roughly 799
follow the north and south caldera rims; mostly being outside the northern rim and ~1 km inside the 800
southern rim (Fig. 5A-B). Stability tests of relocations with subsets of events and stations indicated 801
perturbations to event latitudes, particularly on the northern rim, probably due to slow velocities inside the 802
caldera. 803
The InSAR detected subsidence associated with a M5.3 event on 18 September places the surface fault at 804
~2.5 km inside the pre-existing topographic northern caldera rim (Fig. S7), while the seismic epicentre 805
location is just north of the northern caldera rim. Using the InSAR observation to locate the surface 806
expression for the steeply outwards dipping caldera fault, the microearthquakes were shifted southward 807
according to: New lat = old lat * 0.883 +7.552. The shifted locations are used in Figure 5. The shift is of the 808
same order as the absolute error in the hypocentre locations. However, besides fitting the hypocentres to 809
the InSAR-located fault it provides more consistency to S-P times from 82 events observed on an 810
accelerometer at location BARC (Fig1A) from November 2014 to February 2015. 811
812
Moment tensor inversion and classification 813
35
The steady subsidence of the caldera was accompanied by a sequence of episodic M>5 earthquakes, which 814
excited low frequency signals recorded at regional distances throughout Iceland. We performed a regional 815
moment tensor inversion for all events with M>5, adopting a full moment tensor (MT) point source 816
approximation, neglecting higher order moment tensor. The MT inversion (73) was performed by fitting full 817
waveforms 3-component displacements at regional distances (40-200 km), in the low frequency band 0.01-818
0.05 Hz. We obtain centroid location, centroid depth and full MT solutions for 77 earthquakes at the 819
caldera and with M > 5. MTs were decomposed into double couple (DC), compensated linear vector dipole 820
(CLVD) and isotropic (ISO) components. Since MTs mostly differ in their DC components, we classified upon 821
the similarity of the DC orientation using a clustering algorithm (73) and the normalized Kagan angle (74) as 822
norm. 823
824
Waveform similarity analysis and moment estimation 825
To extend the interpretation of source processes to smaller events, where MT inversion becomes less 826
stable, we apply a waveform similarity analysis. The scaling of the low frequency signals of weaker events 827
and larger ones with similar waveforms is used to infer the scalar moment of smaller events (M < 5) from 828
the known moment of the larger ones, resulting from the MT inversion procedure. In this way, we are able 829
to estimate scalar moments for more than 600 events (352 with Mw > 4.0), down to a magnitude of Mw 830
3.3. These results allow tracking of the details of the temporal evolution of the moment release. 831
832
Mechanism corrected relative location 833
Moment tensor inversion provides a first estimate of centroid location and depth. A more precise location 834
can be obtained by using relative location techniques, here also favored by the high waveform similarity. 835
However, waveform-based lag-times can be affected by the dissimilarity among waveforms for the two 836
families of events. To overcome this problem, we corrected cross-correlation lag times, by using corrections 837
based upon focal mechanisms. The adopted procedure includes the computation of synthetic seismograms 838
for different observed source mechanisms, the cross-correlation of synthetic waveforms to estimate 839
fictitious time lags due to different focal mechanisms, and the inference of a time lag correction for each 840
possible focal mechanism pair. As a result, we improved epicentral locations for 227 events. In order to 841
obtain absolute locations, we combine the relative centroid locations of the largest events with the new 842
absolute epicentral locations, imposing the condition that the mean centroid locations correspond to the 843
mean absolute locations for both the northern and the southern cluster. 844
845
Caldera-dike seismicity correlations 846
The histogram shown in Figure 6A is computed using a simple model using the number of dyke 847
earthquakes in 1.5 hour bins before and after (i) 4 < M < 4.6 and (ii) M > 4.6 caldera earthquakes (61). For 848
example, the height of the fourth bar is found by assuming that the rate of dyke earthquakes during the 1.5 849
hours immediately preceding an M ‡ 4.6 caldera earthquake is c times the reference rate, and estimating c 850
with maximum likelihood, giving c =1.96. The plot can be read as, for example, the expected rate of dyke 851
earthquakes is increased by 96% in the time interval 1.5 hours before an M ‡ 4.6 caldera earthquake. 852
36
P-values are computed with a likelihood ratio test, and the confidence intervals are likelihood based. The 853
reference rate (equal to 1 in Fig. 6A) is the rate of earthquake occurrence in periods more than three hours 854
before or after caldera earthquakes of size M > 4. All dyke earthquakes that fall in one of the bins of Figure 855
6A together with all the dyke earthquakes in the reference periods are considered. The null hypothesis is 856
that the portion of these earthquakes that fall in the bin is binomially distributed with parameter 857
corresponding to a constant reference rate. To minimize the effect of the varying reference rate between 858
months, the model assumes that this holds for each calendar month, and the final likelihood used in the 859
test is the product of the likelihoods of individual months. 860
861
862
GPS analysis 863
The high-resolution GPS time series at BARC in the center of the caldera (Fig. 3C) was obtained using RTKLIB 864
software, processing the receiver locations every 15 seconds as kinematic baselines from the HOFN 865
reference station in southeast Iceland. Other GPS data were analyzed using the GAMIT/GLOBK software, 866
version 10.6 using over 100 global reference stations to evaluate site positions in the ITRF08 reference 867
frame. For the regional network average daily station positions were estimated. For the caldera GPS station 868
(BARC) we furthermore divided the data into eight hour sessions using a 24 hour running window of 869
reference station and orbit data. In the processing we solve for station coordinates, satellite orbit and earth 870
rotation parameters, atmospheric zenith delay every two hours, and three atmospheric gradients per day. 871
The IGS08 azimuth and elevation dependent absolute phase center offsets were applied to all antennas and 872
ocean loading was corrected for using the FES2004 model. 873
874
InSAR analysis 875
We utilized X-band (wavelength 3.11 cm) radar images acquired by the COSMO-SkyMed constellation and 876
employed two-pass Interferometric Synthetic Aperture Radar (InSAR) analysis (75) to measure ground 877
deformation at Bárdarbunga caldera over 24-hr periods during which large caldera earthquakes occurred. 878
The interferograms were processed using DORIS software (76) and a merged LiDAR, intermediate TanDEM-879
X, ASTER and EMISAR DEM was used to remove topographic fringes (77). To account for the large changes 880
in topography over the caldera during the eruption, we interpolated the digital elevation model, using data 881
from the continuous GPS station located inside the caldera. The wrapped interferometric phase values 882
were filtered using an adaptive filter (78) and unwrapped with SNAPHU software (79). The one-day 883
interferogram spanning September 17-18, 2014 was used to infer the location of faults that slipped during 884
this period, which included a large caldera (M5.3) earthquake (Fig. S7). We modelled the fault system as a 885
series of 30 rectangular vertical faults (79) with varying strike, and estimated location, size, minimum depth 886
beneath the surface, and slip for each segment. Note, the data could be fitted equally well with steeply 887
dipping faults, in either direction, but we fixed them to be vertical for convenience. The southern margin 888
did not slip in this 24-hour interval and the model therefore does not constrain the actual location of the 889
southern caldera fault. The contracting body at the base of the fault system was also modelled as a closing 890
rectangular dislocation with uniform contraction (79). We used a Markov-chain Monte Carlo approach to 891
estimate the multivariate probability distribution for all model parameters (80). 892
893
37
Petrological analysis and thermobarometry 894
Major element compositions of minerals and glasses were analyzed using a JEOL JXA-8230 electron 895
microprobe at the Institute of Earth Sciences, University of Iceland. Fluid inclusions within phenocrysts 896
were analysed by optical microscopy and confocal Raman spectroscopy (Horiba Jobin Yvon LabRAM HR800) 897
at the Bayerisches Geoinstitut, Bayreuth, Germany. Eruption temperatures calculated with different 898
thermometers (81-83) for the erupted lava are consistently in the range 1165-1180°C, in good agreement 899
with on-site measurements by thermal imaging cameras. Three independent thermobarometers were used 900
to constrain the depth of magma accumulation before the onset of the eruption; (i) Glass thermobarometry 901
was carried out using the fractional crystallization model of Yang et al. (82), which was calibrated using 902
basaltic melt compositions, (ii) Clinopyroxene-Liquid Thermobarometry was carried out based on the 903
clinopyroxene-liquid barometers published by Putirka (84) that rely on the pressure and temperature 904
dependence of Fe, Mg, Al and Na partitioning between pyroxenes and coexisting melt, and (iii) CO2 Density 905
Barometry which is based on the principle that distance between the two Raman bands of CO2 (in the 906
wavenumber region between 1250 and 1450 cm-1) is a function of fluid density (85). In combination with 907
information on the temperature of the system, the entrapment pressure can be estimated based on the 908
equation of state of CO2. 909
910
Subaerial gas composition analysis 911
The composition of the subaerial eruptive gases was measured by open-path Fourier Transform Infrared 912
spectrometer (FTIR) (86) on September 3, 19, 20 and 21 using the erupting lava as an infrared radiation 913
source, and Multi-Component Gas Analyzer System (MultiGAS) (87) on September 1, 21, October 8, January 914
26 and Feburary 6. The MultiGAS measurements were taken downwind from vent when the plume was 915
grounded. Major element composition and wt% of volatiles of the melt were defined using the average of 916
four clinopyroxene-hosted melt inclusions (88, 89) and used as input to the D-COMPRESS magma/volatile 917
partition software (90). The model was run from atmospheric pressure to 600 MPa (18 km). The simulation 918
results indicate that the sulfur reaches 1600 ppm, the highest concentrations measured in melt inclusions 919
most representative of the pre-eruptive magma composition (88), at 470±100 MPa (14±3 km). This 920
estimate is partly dependent on the solubility constants provided for basalt. However, it convincingly 921
supports the petrological and geodetic estimates. 922
923
DEM modelling 924
We evaluated the role of pre-existing ring fault structures on the 2014-15 collapse by using the two-925
dimensional Distinct Element Method (DEM) software PFC 5.0 (90). The DEM models comprise a 40 × 25 km 926
gravitationally-loaded assemblage of rigid circular particles that interact according to frictional-elastic 927
contact laws (91). Particles have a uniform size distribution, with radii between 60 m and 100 m, and a 928
density of 2700 kgm-3く TエW マラSWノげゲ basal and the lateral boundaries are frictionless rigid walls. Inter-particle 929
and particle-┘;ノノ Iラミデ;Iデゲ エ;┗W ; Yラ┌ミェげゲ マラS┌ノ┌ゲ ラa Αヰ GP; ;ミS ; ミラヴマ;ノ デラ ゲエW;ヴ ゲデキaaミWゲゲ ヴ;デキラ ラa 2.5. 930
The model comprises three regions (Fig. 5D): (i) A laccolith-ノキニW けマ;ェマ; ヴWゲWヴ┗ラキヴげく ふキキぶ A a;┌ノデ-bound 931
ヴWゲWヴ┗ラキヴ けヴララaげく ふキキキぶ TエW けエラゲデ ヴラIニげ ;ヴラ┌ミS デエW ヴWゲWヴ┗ラキヴ ;ミS ヴララaく Wキデエキミ デエW ヴWゲWヴ┗ラキヴが デエW Iラミデ;Iデ aヴキIデキラミ 932
is 0.01 and particles are not bonded. Outside the reservoir, the contact friction coefficient is 0.5 and 933
particles are bonded with linear elastic beams. Bond tensile and shear strengths are 35 MPa in the roof and 934
Αヰ MP; キミ デエW ゲ┌ヴヴラ┌ミSキミェ エラゲデ ヴラIニく NラデW デエ;デ aヴ;Iデ┌ヴキミェ ラa デエW ┘W;ニWヴ けヴララaげ ┣ラミW ┘キノノ ヴWS┌IW デエW 935
38
assembly-scale strength and modulus here, locally by up to an order of magnitude (27), as suggested for 936
Bardabunga by Riel et al. (32). Pre-existing faults, extending from the lateral edges of the reservoir to a few 937
kilometres below the surface (Fig. 5Dぶが ;ヴW マラSWノノWS H┞ ┌ゲキミェ ; Iラミデ;Iデ ノ;┘ aラヴ けゲマララデエげ SキゲIラミデキミ┌キデキWゲ キミ 938
poly-disperse particle assemblages (92ぶく TエW ミラヴマ;ノ ;ミS ゲエW;ヴ ゲデキaaミWゲゲ ラa デエWゲW けa;┌ノデげ Iラミデ;Iデゲ キゲ ヶヰ 939
GPa/m. Withdrawal of magma is assumed to occur laterally out of the 2D model plane (Fig. 5D) and is 940
simulated by slowly reducing the areas of the reservoir particles. Displacements of surface particles were 941
smoothed by a standard moving mean method to minimize localized particle effects. Our modelling 942
comprised a series of forward simulations in which the dip of each fault was varied between 80-90 degrees, 943
initial fault depths varied from 1-3 km, and chamber width varied from 7.0-8.5 km. Chamber depth was 944
fixed at 12 km, based on the geobarometry data, to reduce the parameter space. The lateral position of the 945
chamber was allowed to vary depending on the fault geometry, so that the faults lay within the clouds of 946
エ┞ヮラIWミデヴWゲ ;ミS ヮヴラテWIデWS ┌ヮ┘;ヴS デラ ┘キデエキミ デエW I;ノSWヴ;く EaaWIデゲ ラa Yラ┌ミェげゲ マラS┌ノ┌ゲが ゲデヴWミェデエ ;ミS a;┌ノデ 947
friction were also systematically tested. Further details on DEM modelling of caldera collapse are given in 948
Holohan et al. (27, 93). 949
950
Geodetic depth model 951
To determine the approximate depth of the magma chamber, we modelled post-rifting InSAR and GPS data 952
(Fig. S3) using a point pressure source in an elastic halfspace (94). The depth range at 95% confidence is 8-953
12 km. 954
955
956
Coupled caldera subsidence and eruption model 957
We assume piston failure occurs approximately at a constant stress threshold, causing the pressure at the 958
top of magma chamber to remain constant on average. Therefore, we ignore compressibility and assume 959
that the density of the magma remains constant. The driving overpressure is then given by͒ 960
961 ッ鶏 噺 調貸庁凋 髪 貢訣月 伐 貢訣穴 (1), 962
963
where W is the weight of the piston, F is the resistive force (friction), A is the cross sectional area of the 964
magma chamber, ʌ is the density of the magma, g is gravitational acceleration, h is the height of magma 965
above the chamber exit point and d is the depth of the chamber exit point relative to the eruption site (Ext. 966
Data 7). Conservation of mass implies 967
968
畦 鳥朕鳥痛 噺 伐講堅態懸 (2), 969
970
39
where v is the mean magma flow speed and r is conduit radius. Assuming that the time-averaged resistive 971
force due to friction, F, and d remain constant, differentiating (1) and substituting (2) gives 972
973
鳥ッ牒鳥痛 噺 伐貢訣 訂追鉄凋 懸 (3). 974
975
Assuming pressure loss due to viscous drag from laminar flow in a cylindrical pipe (Hagen Poiseuille flow) 976
and dynamic pressure loss on exit 977
978
ッ鶏 噺 腿挺挑追鉄 懸 髪 諦態 懸態 (4) 979
980
戊 懸 噺 伐 腿挺挑諦追鉄 髪 謬岾腿挺挑諦追鉄峇態 髪 に ッ牒諦 (5). 981
982
We assume a cylindrical pipe, as models of thermal erosion predict that the cross section of a magma flow 983
channel will evolve to be circular in shape, but note that for a non-circular cross section, the first term will 984
still be proportional to the velocity, but with a different constant. 985
986
Expanding (5) gives 987
戊 懸 噺 伐 腿挺挑諦追鉄 髪 腿挺挑諦追鉄 髪 追鉄ッ牒腿挺挑 髪 頚 岾追鉄挺挑峇態 噺 追鉄ッ牒腿挺挑 髪 頚 岾追鉄挺挑峇態 (6). 988
989
Substituting (6) into (3) gives 990
991
鳥ッ牒鳥痛 噺 伐 訂諦直追鉄凋 釆追鉄ッ牒腿挺挑 髪 頚 岾追鉄挺挑峇態挽 (7). 992
993
When L >> r2, this reduces to 994
995
鳥ッ牒鳥痛 噺 伐 訂諦直追填腿凋挺挑 ッ鶏 (8) 996
戊 ッ鶏 噺 ッ鶏待結貸肺輩虹認填添豚俳薙 痛 (9) 997
998
40
and 999
月 伐 月著 噺 岫月待 伐 月著岻結貸肺輩虹認填添豚俳薙 痛 (10). 1000
1001
A similar relationship has been derived to explain gravity-driven eruptions at Stromboli (95). Assuming that 1002
h0 Ъ hз is equal to the subsidence measured at the BARC GPS station, a best fit solution is h0 Ъ hз = 67.5 m 1003
and 訂諦直追填腿凋挺挑 = 1.5 × 10Ъ7 (Fig. 3B). A similar fit is obtained for magma flow rate and caldera volume change in 1004
Fig. 6B. Substituting ʌ = 2700 kgm-3 (ref. 64), g = 9.8 ms-2, L Э ヴΑ ニマ ;ミS `Эヲヲ P; ゲ ┌ゲキミェ デエW ;┗Wヴ;ェW ェノ;ゲゲ 1005
compositions of the Holuhraun lava (96)が ェキ┗Wゲ лP0 = 1.7 MPa and 追填凋 = 1.5 × 10Ъ5 m2. Constraining the 1006
eruption rate to be 250 m3/s on 31 August, gives A= 32 km2 and r = 4.7 m. This can be considered the 1007
effective radius of the flow path assuming circular cross sectional area. A similar relation would hold for 1008
other possible geometrical forms of the flow path cross sectional area. Theoretically, the eruption would 1009
approach equilibrium (ッ鶏=0 in (1)) asymptotically, but choking of the conduit due to cooling, slow-moving 1010
magma is expected before that. 1011
1012
41
1013
Fig. S1. 1014
Maps of collapse に margins as in Fig. 1C. The maps are corrected for ice flow (Fig. S2) and migration of 1015
reflector into the autumn 2014 surface due to propagation of cold wave into the firn in October-April (24). 1016
The number underneath the date gives the maximum subsidence. Three maps are obtained through 1017
satellite photogrammetry (28.08 に Spot 6, 20.09 and 10.10 from Pléiades) while the remaining 13 maps 1018
(marked as FMS) are obtained using an aircraft-combining radar altimetry and a submeter Differential GPS; 1019
the maps are made by interpolation between the profiles (shown as black lines)(24). 1020
1021
42
1022
Fig. S2 1023
Results of 3-D Full-Stokes ice flow models (see Materials and Methods) of the response of the glacier 1024
within the caldera to the subsidence for five dates spanning the period of collapse. The upper row shows 1025
vertical ice flow velocity while the lower row shows the accumulated surface elevation change due to the 1026
ice flow for the same dates. The model flow rates are constrained to fit the horizontal displacement of the 1027
GPS station BARC in the caldera center from September to February (see Materials and Methods). The 1028
maximum vertical ice flow velocity is modelled as having been about 3 cm per day on April 10, 2015. The 1029
accumulated uplift for end of eruption on February 27 (Fig. 1C) is obtained by interpolation between 1030
January 21 and April 10. 1031
1032
43
1033
Fig. S3 1034
GPS co-eruptive displacements, spanning September 21, 2014 until February 27, 2015, after the period of 1035
dyke opening had ended. The displacement field during the eruption shows consistent movements toward 1036
Bárdarbunga caldera suggesting deflation below the caldera. No other major deformation source can be 1037
observed during the eruption that can account for significant volume changes. Dots show relatively located 1038
earthquakes (20, 24). 1039
1040
44
1041
Fig. S4 1042
Geodetic model of regional deformation using a contracting point pressure source. The upper panel from 1043
left to right displays the input data (a) and model (b). GPS data in both panels and the CSK ascending 1044
interferogram in (a) span the period September 16 to November 7, 2014. The red circle in (b) shows the 1045
location of the point pressure source. The black dots represent the seismicity in the vicinity of the dike. The 1046
black lines are the inferred dike location. The lower figure (C) displays the probability distribution for depth 1047
of the point source from 1 million iterations, using a Markov chain Monte Carlo approach. 1048
1049
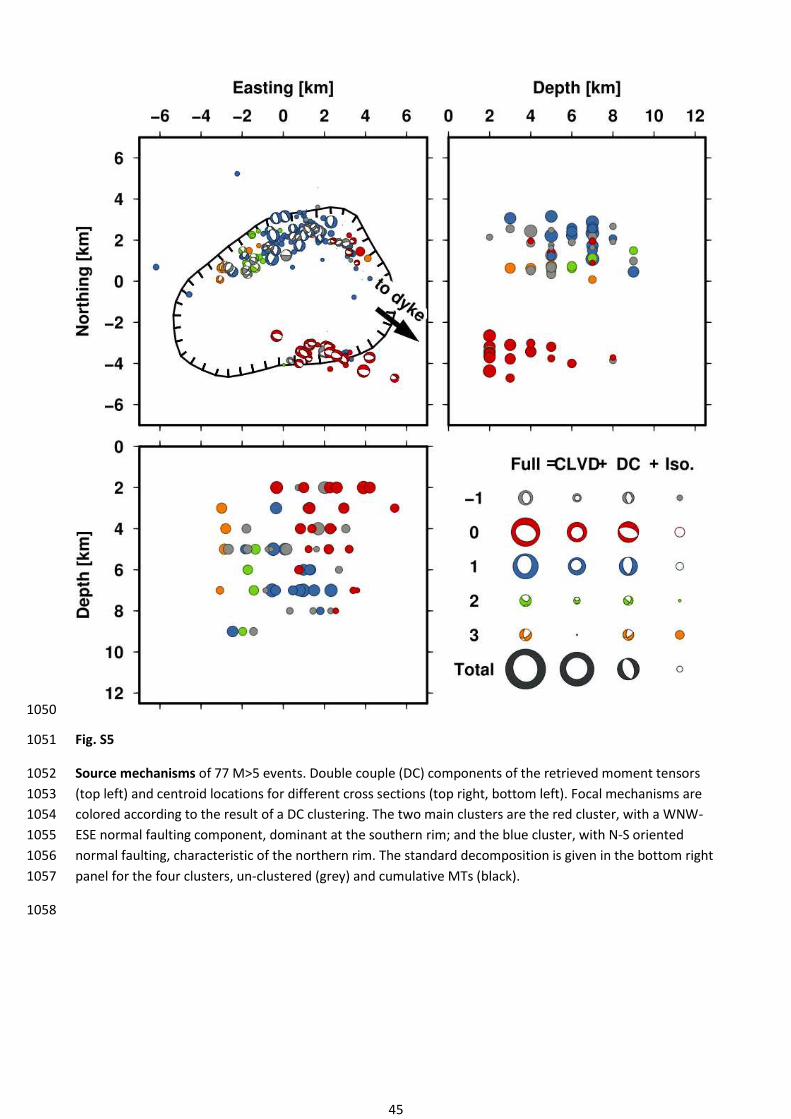
45
1050
Fig. S5 1051
Source mechanisms of 77 M>5 events. Double couple (DC) components of the retrieved moment tensors 1052
(top left) and centroid locations for different cross sections (top right, bottom left). Focal mechanisms are 1053
colored according to the result of a DC clustering. The two main clusters are the red cluster, with a WNW-1054
ESE normal faulting component, dominant at the southern rim; and the blue cluster, with N-S oriented 1055
normal faulting, characteristic of the northern rim. The standard decomposition is given in the bottom right 1056
panel for the four clusters, un-clustered (grey) and cumulative MTs (black). 1057
1058
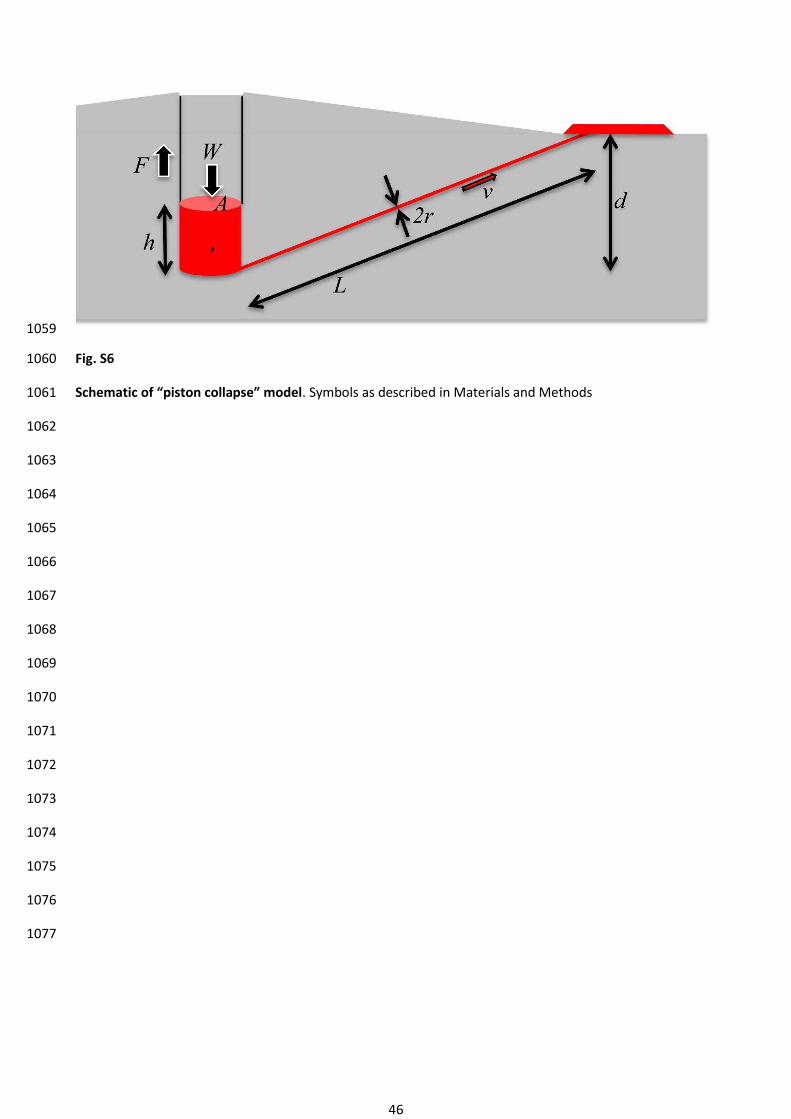
46
1059
Fig. S6 1060
Schematic of さヮキゲデラミ Iラノノ;ヮゲWざ マラSWノ. Symbols as described in Materials and Methods 1061
1062
1063
1064
1065
1066
1067
1068
1069
1070
1071
1072
1073
1074
1075
1076
1077
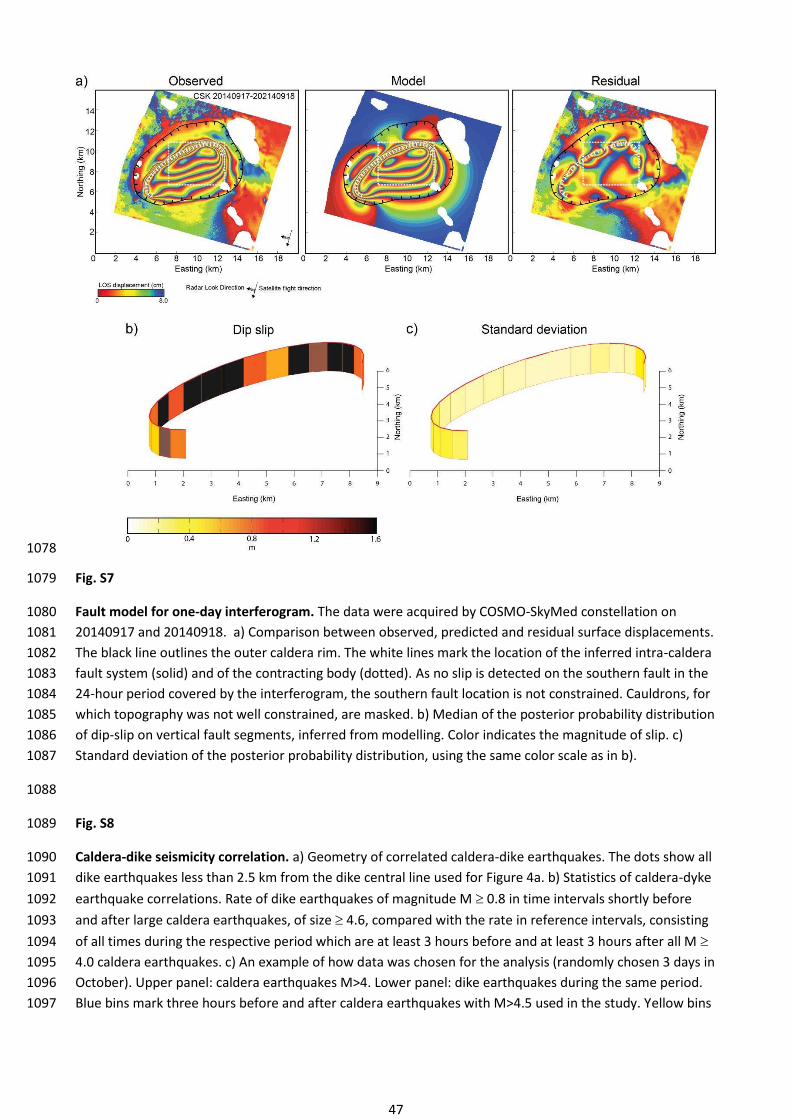
47
1078
Fig. S7 1079
Fault model for one-day interferogram. The data were acquired by COSMO-SkyMed constellation on 1080
20140917 and 20140918. a) Comparison between observed, predicted and residual surface displacements. 1081
The black line outlines the outer caldera rim. The white lines mark the location of the inferred intra-caldera 1082
fault system (solid) and of the contracting body (dotted). As no slip is detected on the southern fault in the 1083
24-hour period covered by the interferogram, the southern fault location is not constrained. Cauldrons, for 1084
which topography was not well constrained, are masked. b) Median of the posterior probability distribution 1085
of dip-slip on vertical fault segments, inferred from modelling. Color indicates the magnitude of slip. c) 1086
Standard deviation of the posterior probability distribution, using the same color scale as in b). 1087
1088
Fig. S8 1089
Caldera-dike seismicity correlation. a) Geometry of correlated caldera-dike earthquakes. The dots show all 1090
dike earthquakes less than 2.5 km from the dike central line used for Figure 4a. b) Statistics of caldera-dyke 1091
earthquake correlations. Rate of dike earthquakes of magnitude M ‡ 0.8 in time intervals shortly before 1092
and after large caldera earthquakes, of size ‡ 4.6, compared with the rate in reference intervals, consisting 1093
of all times during the respective period which are at least 3 hours before and at least 3 hours after all M ‡ 1094
4.0 caldera earthquakes. c) An example of how data was chosen for the analysis (randomly chosen 3 days in 1095
October). Upper panel: caldera earthquakes M>4. Lower panel: dike earthquakes during the same period. 1096
Blue bins mark three hours before and after caldera earthquakes with M>4.5 used in the study. Yellow bins 1097

48
show data between significant (M>4) caldera earthquakes, used to estimate background seismicity in the 1098
dike. Pink shaded bins show data that were not used in the analysis (due to possible overlapping effects). 1099
1100
1101
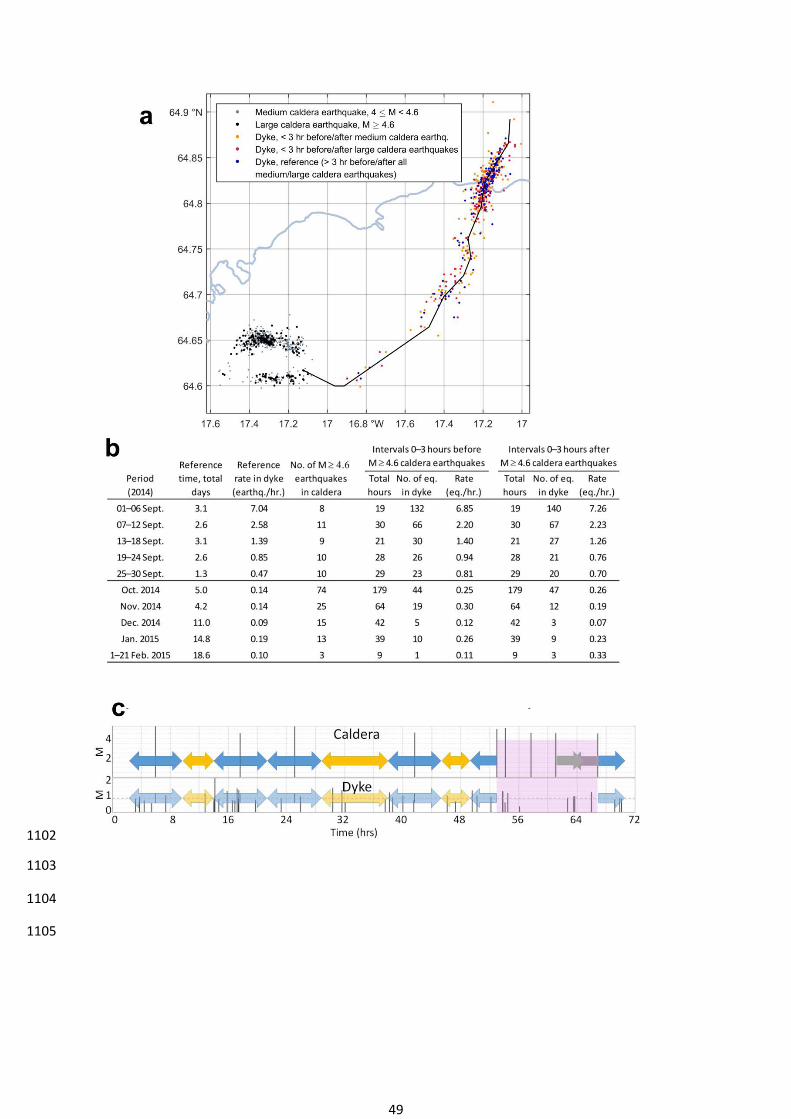
49
1102
1103
1104
1105