Embed Size (px)
Citation preview
Rock Physical-Property Measurements for the Nechako Basin Oil and Gas Region,Central British Columbia (Parts of NTS 093B, C, E, F, G, K, L)
A. Kushnir, Centre for Experimental Studies of the Lithosphere, Department of Earth and Ocean Sciences,
University of British Columbia, Vancouver, BC V6T 1Z4
G. Andrews, Earth Research Institute, University of California Santa Barbara, Santa Barbara, CA 93106
J.K. Russell, Volcanology and Petrology Laboratory, Department of Earth and Ocean Sciences, University of
British Columbia, Vancouver, BC V6T 1Z4
R.J. Enkin, Natural Resources Canada, Geological Survey of Canada–Pacific, 9860 West Saanich Road, Sidney,
BC V8L 4B2
L.A. Kennedy, Centre for Experimental Studies of the Lithosphere, Department of Earth and Ocean Sciences,
University of British Columbia, Vancouver, BC V6T 1Z4
M.J. Heap, Laboratoire de géophysique expérimentale, Institut de physique du globe de Strasbourg (UMR 7516
CNRS, Université de Strasbourg/EOST), 5 rue René Descartes, 67084 Strasbourg CEDEX, France
S. Quane, Quest University Canada, 3200 University Boulevard, Squamish, BC V8B O8N
Kushnir, A., Andrews, G., Russell, J.K., Enkin, R.J., Kennedy, L.A., Heap, M.J. and Quane, S. (2012): Rock physical-property measure-ments for the Nechako Basin oil and gas region, central British Columbia (parts of NTS 093B, C, E, F, G, K, L); in Geoscience BC Sum-mary of Activities 2011, Geoscience BC, Report 2012-1, p. 125–150.
Abstract
The Mesozoic hydrocarbon-prospective Nechako (sedi-
mentary) Basin in central British Columbia is buried by a
variably thick and variably extensive, lithologically di-
verse assemblage of Cenozoic volcanic and sedimentary
rocks. To assist in the interpretation of geophysical sur-
veys, physical and geophysical properties (density, poros-
ity, magnetic susceptibility and remanence, electrical resis-
tivity and chargeability, and seismic velocity) have been
measured on a sample suite covering the eleven strati-
graphic units within, and stratigraphically above, the
Nechako Basin. The eleven basic stratigraphic units are
grouped into six major lithostratigraphic packages (com-
bined on the basis of age, geography and lithology) for the
purposes of comparing physical and geophysical proper-
ties. Each lithostratigraphic package is distinguishable on
the basis of one or more physical or geophysical properties;
for example, potential Cretaceous reservoir rocks (e.g.,
Jackass Mountain Group) have relatively high porosities
(=17%), low resistivities and low seismic velocities. Gen-
erally, volcanic rocks are easily distinguished from sedi-
mentary rocks , and the crys ta l l ine basement is
distinguished from both. This dataset is available for incor-
poration into ongoing and future geophysical surveys of the
Nechako Basin, and can be used retrospectively to assess
previous interpretations. Such integrated datasets are nec-
essary to provide a comprehensive geological and geo-
physical interpretation.
Introduction
The Mesozoic Nechako Basin in south-central British Co-
lumbia (BC; Figure 1) has underexplored potential for oil
and gas deposits hosted in Cretaceous strata (Hannigan et
al., 1994; Hayes, 2002). First-order geological interpreta-
tions of the subsurface are hampered by the basin’s struc-
tural complexity, which results from extensive polyphase
deformation and partial burial beneath significant extents
and variable thicknesses of Cenozoic volcanic, volcani-
clastic and sedimentary rocks (Riddell, 2006, 2011).
The lack of continuity in outcrop and stratigraphy has hin-
dered reconstructions of the basin and efforts to identify po-
tential hydrocarbon traps. In an effort to address this, geo-
physical surveys were conducted in the mid-2000s across
portions of the Interior Plateau (e.g., Kim, 2010; Hayward
and Calvert, 2011; Idowu et al., 2011; Spratt and Craven,
2011). Interpretation of these new data, coupled with a re-
assessment of existing geophysical datasets (e.g., Hayward
and Calvert, 2009), is made difficult by a lack of rock phys-
ical-property data for the corresponding rocks within the Ne-
chako Basin and a fragmentary understanding of even the
near-surface geology (e.g., Dohaney et al., 2010; Andrews
et al., 2011). Establishing the extent of buried Cenozoic
Geoscience BC Report 2012-1 125
Keywords: Nechako Basin, rock properties, physical properties,geophysical properties
This publication is also available, free of charge, as colour digitalfiles in Adobe Acrobat® PDF format from the Geoscience BCwebsite: http://www.geosciencebc.com/s/DataReleases.asp.
126 Geoscience BC Summary of Activities 2011
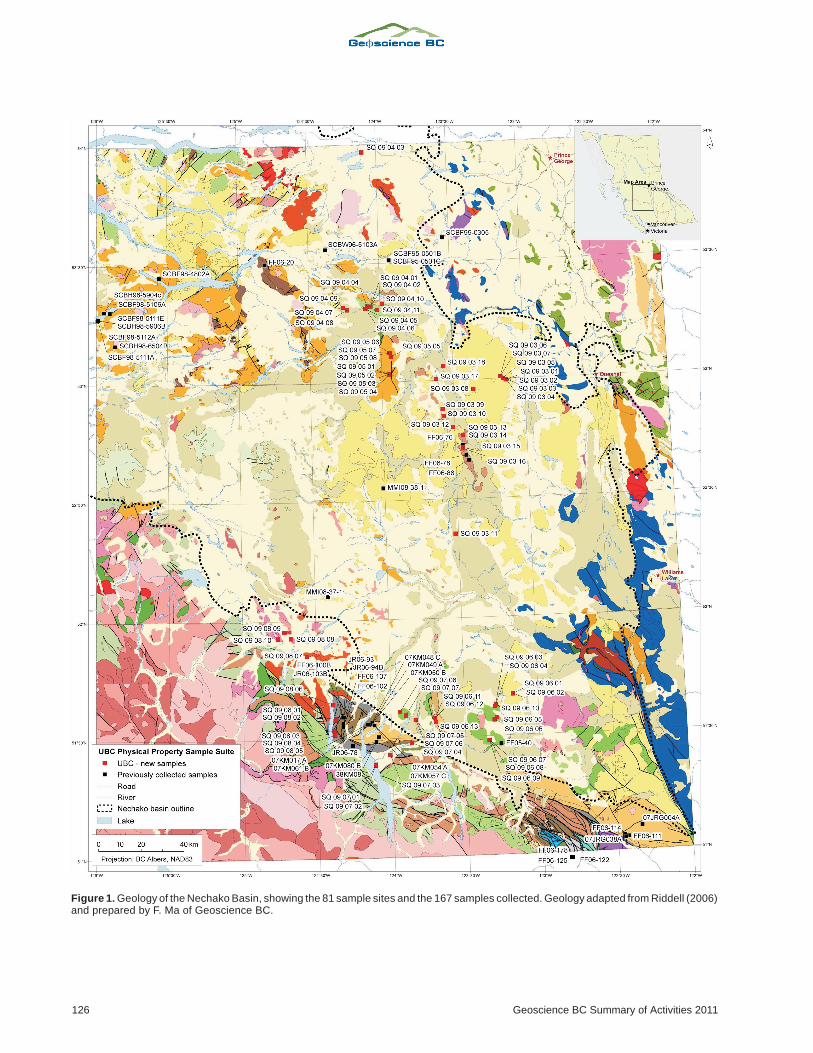
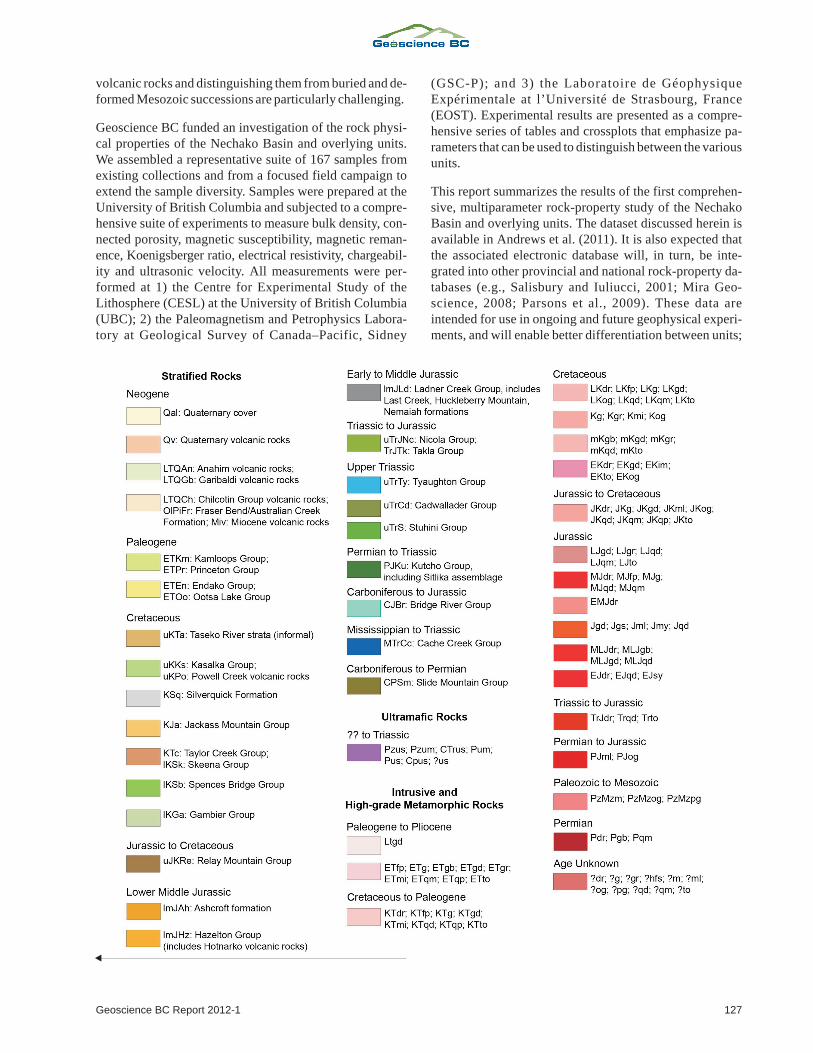
Figure 1. Geology of the Nechako Basin, showing the 81 sample sites and the 167 samples collected. Geology adapted from Riddell (2006)and prepared by F. Ma of Geoscience BC.
volcanic rocks and distinguishing them from buried and de-
formed Mesozoic successions are particularly challenging.
Geoscience BC funded an investigation of the rock physi-
cal properties of the Nechako Basin and overlying units.
We assembled a representative suite of 167 samples from
existing collections and from a focused field campaign to
extend the sample diversity. Samples were prepared at the
University of British Columbia and subjected to a compre-
hensive suite of experiments to measure bulk density, con-
nected porosity, magnetic susceptibility, magnetic reman-
ence, Koenigsberger ratio, electrical resistivity, chargeabil-
ity and ultrasonic velocity. All measurements were per-
formed at 1) the Centre for Experimental Study of the
Lithosphere (CESL) at the University of British Columbia
(UBC); 2) the Paleomagnetism and Petrophysics Labora-
tory at Geological Survey of Canada–Pacific, Sidney
(GSC-P); and 3) the Laboratoire de Géophysique
Expérimentale at l’Université de Strasbourg, France
(EOST). Experimental results are presented as a compre-
hensive series of tables and crossplots that emphasize pa-
rameters that can be used to distinguish between the various
units.
This report summarizes the results of the first comprehen-
sive, multiparameter rock-property study of the Nechako
Basin and overlying units. The dataset discussed herein is
available in Andrews et al. (2011). It is also expected that
the associated electronic database will, in turn, be inte-
grated into other provincial and national rock-property da-
tabases (e.g., Salisbury and Iuliucci, 2001; Mira Geo-
science, 2008; Parsons et al., 2009). These data are
intended for use in ongoing and future geophysical experi-
ments, and will enable better differentiation between units;
Geoscience BC Report 2012-1 127
this will, in turn, allow better understanding of the struc-
ture, tectonic evolution and hydrocarbon potential of the
Nechako Basin.
Geology of the Nechako Basin
The Nechako Basin is an area of approximately 75 000 km2
bounded to the south and west by the Coast Mountains, to
the north by the Skeena Arch, and to the east by the Bona-
parte Plateau and Cariboo Mountains (Figure 1; Hayes,
2002; Riddell, 2006). It underlies much of the present-day
Fraser River Basin, including important tributaries such as
the Chilcotin, Chilko and Taseko rivers. The Nechako Ba-
sin is interpreted to have developed as a foreland basin dur-
ing the Late Jurassic to mid-Cretaceous on basement com-
prising integral parts of the Intermontane Superterrane,
namely the Cache Creek and Stikine terranes. Stikine ter-
rane basement is present at the surface in the west and north
of the basin (Riddell, 2006), where it is represented by the
Early–Middle Jurassic Hazelton volcanic arc (Hazelton
Group). Oceanic rocks of the Cache Creek terrane rocks
outcrop in the east and northeast. There is no inferred
hydrocarbon resource in the basement.
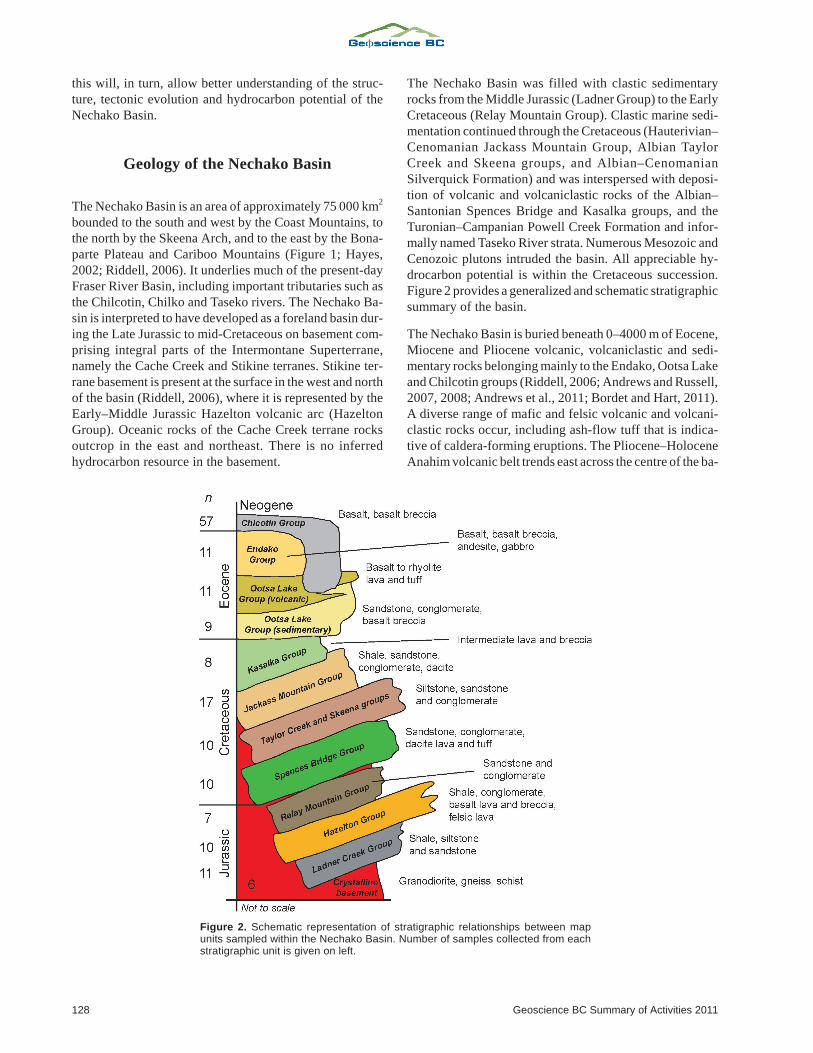
The Nechako Basin was filled with clastic sedimentary
rocks from the Middle Jurassic (Ladner Group) to the Early
Cretaceous (Relay Mountain Group). Clastic marine sedi-
mentation continued through the Cretaceous (Hauterivian–
Cenomanian Jackass Mountain Group, Albian Taylor
Creek and Skeena groups, and Albian–Cenomanian
Silverquick Formation) and was interspersed with deposi-
tion of volcanic and volcaniclastic rocks of the Albian–
Santonian Spences Bridge and Kasalka groups, and the
Turonian–Campanian Powell Creek Formation and infor-
mally named Taseko River strata. Numerous Mesozoic and
Cenozoic plutons intruded the basin. All appreciable hy-
drocarbon potential is within the Cretaceous succession.
Figure 2 provides a generalized and schematic stratigraphic
summary of the basin.
The Nechako Basin is buried beneath 0–4000 m of Eocene,
Miocene and Pliocene volcanic, volcaniclastic and sedi-
mentary rocks belonging mainly to the Endako, Ootsa Lake
and Chilcotin groups (Riddell, 2006; Andrews and Russell,
2007, 2008; Andrews et al., 2011; Bordet and Hart, 2011).
A diverse range of mafic and felsic volcanic and volcani-
clastic rocks occur, including ash-flow tuff that is indica-
tive of caldera-forming eruptions. The Pliocene–Holocene
Anahim volcanic belt trends east across the centre of the ba-
128 Geoscience BC Summary of Activities 2011
Figure 2. Schematic representation of stratigraphic relationships between mapunits sampled within the Nechako Basin. Number of samples collected from eachstratigraphic unit is given on left.
sin. The basin and overlying Cenozoic rocks are buried be-
neath a 1–100 m thick veneer of glacial sediments, includ-
ing till and glaciolacustrine and glaciofluvial successions
(e.g., Andrews et al., 2011). There is no inferred hydrocar-
bon resource in the Cenozoic succession.
The structural geology of the Nechako Basin is poorly un-
derstood, so the architecture of potential hydrocarbon traps
has not been established. Preliminary geological and geo-
physical surveys have identified sub-basins (e.g., Hayward
and Calvert, 2009), high- and low-angle faults, folds and
unconformities (e.g., Mihalynuk et al., 2009); however, a
lack of stratigraphic control due to the paucity of boreholes
in the basin makes lateral correlation and section-balancing
impossible. A dedicated rock-property suite from the
known Nechako Basin stratigraphy will allow for im-
proved geophysical imaging of the subsurface geology.
Sample Suite
During the 1980s, seismic-reflection and gravity surveys
were completed in the Nechako Basin and additional explo-
ration wells were drilled; new vibroseis seismic-reflection
and magnetotelluric datasets were collected in 2008
(Calvert et al., 2009; Craven and Spratt, 2011). There is a
pressing need for better constraints on a range of physical
and geophysical rock properties from the diverse suite of
volcanic and sedimentary rocks in the basin. For example,
magnetotelluric studies have highlighted the need for good
resolution in electrical-resistivity data to differentiate the
widespread Cretaceous and Eocene sequences (e.g., Cra-
ven and Spratt, 2011). Similarly, seismic inversions (e.g.,
Hayward and Calvert, 2009) suggest nonintuitive varia-
tions in compressional-wave velocities for individual for-
mations, specifically overlap in inferred seismic velocities
between the Eocene and Jurassic–Cretaceous successions.
Quantitative, experimental physical-properties data from
this sample suite will aid the interpretations of these sur-
veys and help to distinguish the prospective, non-hydrocar-
bon Eocene basinal sequence from the Jurassic–Cretaceous
basinal sequence.
The UBC experimental program identified and sampled
stratigraphic groups that are most important to the interpre-
tation of seismic datasets and the delineation of exploration
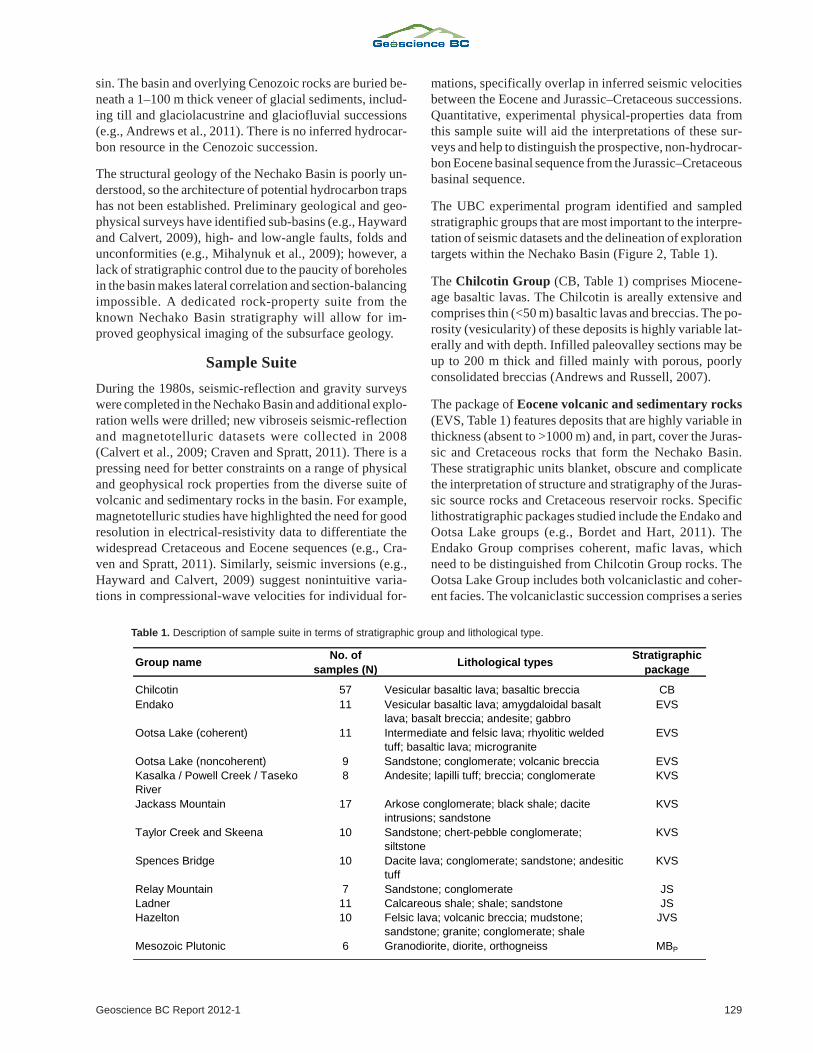
targets within the Nechako Basin (Figure 2, Table 1).
The Chilcotin Group (CB, Table 1) comprises Miocene-
age basaltic lavas. The Chilcotin is areally extensive and
comprises thin (<50 m) basaltic lavas and breccias. The po-
rosity (vesicularity) of these deposits is highly variable lat-
erally and with depth. Infilled paleovalley sections may be
up to 200 m thick and filled mainly with porous, poorly
consolidated breccias (Andrews and Russell, 2007).
The package of Eocene volcanic and sedimentary rocks
(EVS, Table 1) features deposits that are highly variable in
thickness (absent to >1000 m) and, in part, cover the Juras-
sic and Cretaceous rocks that form the Nechako Basin.
These stratigraphic units blanket, obscure and complicate
the interpretation of structure and stratigraphy of the Juras-
sic source rocks and Cretaceous reservoir rocks. Specific
lithostratigraphic packages studied include the Endako and
Ootsa Lake groups (e.g., Bordet and Hart, 2011). The
Endako Group comprises coherent, mafic lavas, which
need to be distinguished from Chilcotin Group rocks. The
Ootsa Lake Group includes both volcaniclastic and coher-
ent facies. The volcaniclastic succession comprises a series
Geoscience BC Report 2012-1 129
Group nameNo. of
samples (N)Lithological types
Stratigraphic
package
Chilcotin 57 Vesicular basaltic lava; basaltic breccia CB
Endako 11 Vesicular basaltic lava; amygdaloidal basalt
lava; basalt breccia; andesite; gabbro
EVS
Ootsa Lake (coherent) 11 Intermediate and felsic lava; rhyolitic welded
tuff; basaltic lava; microgranite
EVS
Ootsa Lake (noncoherent) 9 Sandstone; conglomerate; volcanic breccia EVS
Kasalka / Powell Creek / Taseko
River
8 Andesite; lapilli tuff; breccia; conglomerate KVS
Jackass Mountain 17 Arkose conglomerate; black shale; dacite
intrusions; sandstone
KVS
Taylor Creek and Skeena 10 Sandstone; chert-pebble conglomerate;
siltstone
KVS
Spences Bridge 10 Dacite lava; conglomerate; sandstone; andesitic
tuff
KVS
Relay Mountain 7 Sandstone; conglomerate JS
Ladner 11 Calcareous shale; shale; sandstone JS
Hazelton 10 Felsic lava; volcanic breccia; mudstone;
sandstone; granite; conglomerate; shale
JVS
Mesozoic Plutonic 6 Granodiorite, diorite, orthogneiss MBP
Table 1. Description of sample suite in terms of stratigraphic group and lithological type.
of felsic volcaniclastic rocks and associated bedded sedi-
mentary rocks, and are difficult to discriminate geophys-
ically from older Cretaceous volcaniclastic and sedimen-
tary successions. Coherent facies are defined by
intermediate to felsic lavas and lava domes, which need to
be discriminated from Endako Group lavas.
The Cretaceous volcaniclastic and sedimentary rocks
(KVS, Table 1) are the potential hydrocarbon reservoir
rocks within the Nechako Basin. They are strongly bedded,
weakly deformed and of exceptionally variable thickness.
The lateral continuity of stratigraphy has not yet been fully
resolved (Ferri and Riddell, 2006), so it was necessary to
sample several units in multiple locations. Despite this pro-
cedure, we acknowledge that there may be facies variations
of these units that remain unsampled. We have character-
ized the geophysical properties of the following lithostrati-
graphic packages within this broad time grouping:
� Jackass Mountain Group: coarse-grained clastic sedi-
mentary rocks inferred to be the most likely surface cor-
relative of the subsurface Skeena assemblage, which
has been identified as the most significant potential res-
ervoir in the Nechako Basin (MacLaurin et al., 2011);
best exposed and studied along the southern margin of
the Nechako Basin near Taseko Lake
� Taylor Creek Group and Skeena Group: clastic sedi-
mentary rocks and minor volcanic rocks exposed along,
and encountered in the subsurface of, the Nazko River
area
� Spences Bridge Group: intermediate lavas and tuffs,
and minor sedimentary rocks exposed in the southern
Nechako Basin
� Kasalka Group, Powell Creek Group and ‘Taseko River
strata’: intermediate lavas and tuffs, and associated
clastic sedimentary rocks (including conglomerate and
sandstone in the ‘Taseko River strata’) found in many
areas throughout the basin; likely a very extensive
sequence
The Middle–Late Jurassic sedimentary rocks (JS, Ta-
ble 1) are the most probable source rocks for hydrocarbon
reserves hosted by the Nechako Basin. This lithostrati-
graphic package is expected to form the lowermost parts of
the basinal sequence. Our sampling includes 1) the Ladner
Group, comprising fine- to coarse-grained calcareous
clastic rocks and carbonates exposed around Chilko Lake
in the southern part of the basin; and 2) the Relay Mountain
Group, best exposed in the Nemaiah Valley and Chilko
Lake areas in the southern part of the basin and comprising
fine- to coarse-grained clastic and carbonaceous rocks that
underlie the Jackass Mountain Group.
The Lower–Middle Jurassic volcanic and sedimentary
rocks (JVS, Table 1) are a package of intermediate to felsic
lavas and tuffs, and minor clastic and carbonate sedimen-
tary rocks (e.g., Puntzi Lake and west of Nechako).
The last package of samples is the Mesozoic basement
rocks (MBp, Table 1). The Nechako Basin is underlain by
Permian, Triassic and Jurassic rocks of the Cache Creek
and Stikine terranes, and intrusions of Jurassic–Eocene
age. These rocks tend to be more homogeneous in character
and more easily differentiated from the overlying Creta-
ceous and Eocene stratigraphy. The more abundant of these
stratigraphic units include 1) Jurassic–Cretaceous intrusive
rocks (e.g., Taseko River); and 2) the mid-Triassic Cache
Creek Group, comprising limestone, chert, clastic sedi-
ments, metamorphic rocks and basalt (e.g., Blackwater
River, Hanceville).
Methodology
Alarge suite of rock samples was collected from formations
representing the key Mesozoic and Tertiary rock types/
stratigraphic units within the Nechako Basin. From this
collection, 167 samples were chosen for experimental work
to be performed at CESL (UBC), GSC-P and EOST. The
Nechako sample suite comprises rocks of various types,
sampled from 12 distinct stratigraphic units distributed
across the Nechako Basin. Each of the 167 samples was
drilled to obtain a cylindrical rock core measuring 25 mm in
diameter by ~50 mm in length. The ends of each core were
ground and polished at right angles to the cylinder side to
create a smooth (~0.02 mm precision) end surface. The pol-
ished ends are critical for the experimental measurement of
seismic velocity because they provide perfect sample ge-
ometry and ensure that there is good contact between the
end caps of the seismic-velocity transducer and the sample.
All sample preparation (e.g., cleaning, trimming, coring,
drying) was carried out at CESL, with some modification at
EOST. Different sets of geophysical properties were mea-
sured on the same sample cores by JKR’s team at CESL and
EOST, and by RJE’s team at GSC-P. The following proper-
ties were measured for each sample core: bulk density
(EOST), porosity (EOST), magnetic susceptibility (CESL
and GSC-P), remanent magnetization (GSC-P), electrical
resistivity (GSC-P), induced-polarization chargeability
(GSC-P), and seismic-wave velocities (EOST and CESL).
These data are given in Tables 2 and 3.
Density and Porosity
Dry bulk density (�d), wet bulk density (�w) and framework
density (�f) were measured for all samples. Bulk density is
the density of the entire sample (i.e., rock plus pore space).
The pore space includes connected and isolated pores. Bulk
densities are calculated from the geometry and mass (dry or
wet) of the sample core. The framework density is the den-
130 Geoscience BC Summary of Activities 2011
sity of the rock itself (i.e., excluding pore space) and is mea-
sured using the hydrostatic weighing method, as derived
from Archimedes’ Buoyancy Law. Using this method, the
framework density actually measures the density of the
rock and its isolated porosity, if there is any present. In the
Nechako Basin sample suite, isolated porosity is assumed
to be negligible.
All sample cores were dried at 40°C under a vacuum for
24 hours. After the dry mass (md) of each core was mea-
sured, all samples were vacuum saturated with agitated,
deionized, distilled water for a minimum of 15 hours to al-
low the water to fill all connected pore space within the
sample. The mass of the water-saturated sample was then
weighed in air (mw) and while it was fully submerged in wa-
ter (mb). Wet bulk density (�w) was calculated for each wa-
ter-saturated sample to estimate the density of the rock plus
its water-saturated pore space and any residual isolated
pore space. These values are required for determination of
wet seismic velocity.
The density of the rock framework (plus any remaining iso-
lated pores) was then computed using the relationship
, (1)
where (�H2O) is the density of the water under ambient lab
conditions. Values of �d and �f are sufficient to estimate po-
rosity (%) using
. (2)
Magnetic Susceptibility
Magnetic susceptibility (k) is primarily a result of the pres-
ence of magnetic minerals in rocks, magnetite being the
most ubiquitous of these minerals (Telford et al., 1976).
There is substantial variability in k within and between rock
types (Telford et al., 1976). For instance, igneous rocks
have the highest average k values (0–200 � 103 SI), whereas
metamorphic rocks range between 0 and 70 � 103 SI, and sedi-
mentary rocks between 0 and 20 � 103 SI (Telford et al., 1976).
Magnetic susceptibility was measured on hand samples in
the lab using a GF Instruments model SM-20 pocket mag-
netic-susceptibility meter, with a sensitivity of 10–6 SI vol-
ume units. The measurement coil has a 5 cm diameter, and
~90% of the measured response comes from the top 2 cm of
the sample. We investigated the effect of small sample size
on the measurements and found that samples more than
3 cm thick allow accurate magnetic-susceptibility determi-
nations. Generally, three measurements were taken on dif-
ferent surfaces of the sample and the average is reported.
The standard deviation of the three measurements is typi-
cally 10% due to spatial variations in magnetite concentra-
tion. Susceptibility measurements on cores were measured
with a Sapphire Instruments model SI2B susceptibility me-
ter, accurate to 10–7 SI. These measurements were used in
preference to the SM-20 measurements.
Magnetic Remanence and Koenigsberger Ratio
Natural remanent magnetization (NRM), if present, is a sig-
nificant contributor to the overall magnetization of rocks
(Telford et al., 1976). Magnetization is strongly dependent
on the existing magnetic field and the mineralogical con-
tent of rocks, as well as the impact of emplacement condi-
tions (Telford et al., 1976). Most relevant to the Nechako
Basin is thermoremanent NRM due to the emplacement of
hot volcanic rocks.
Magnetic remanence was measured using an Agico Inc.
model JR5-Aspinner magnetometer (sensitivity 10–5 A/m).
The full vector was measured, but only the total vector
magnitude of the remanence is reported in the database.
The Koenigsberger ratio (KN) compares the relative
strength of the natural remanent magnetization (NRM) to
the induced magnetism in the geomagnetic field and is
calculated as
KN = NRM / (H0 �0), (3)
where �0 is the magnetic susceptibility and the geomag-
netic field strength (H0) is approximated as a constant
40 A/m (or �0H0 = 50 �T = 50000 �). For KN >1, magnetic-
anomaly interpretation will be incorrect if magnetic
remanence is not taken into consideration.
Electrical Resistivity and Chargeability
Complex electrical-impedance frequency spectra were
measured using a Solartron Analytical model 1260 imped-
ance spectrum analyzer, based on the method of Katsube
(2001). Sample cylinders were vacuum impregnated in dis-
tilled water and allowed to soak for at least 24 hours, to al-
low original groundwater solutes precipitated in the sample
porosity to dissolve and approximate original groundwater
conductivity. The impedance was measured with five fre-
quencies per decade from 1 MHz to 0.03 Hz. The scalar re-
sistance was picked as the real impedance at the frequency
that displays minimum imaginary impedance, typically
around 1000 Hz. Resistivity (in ohm·m, or �·m) is the sca-
lar resistance multiplied by the sample geometric factor
(i.e., the cross-sectional area divided by the length). Con-
ductivity (Mho/m) is the reciprocal of the resistivity.
Induced-polarization chargeability was calculated after
converting the frequency-domain impedance spectrum to
the time-domain response to a step function, V(t). Using the
Newmont Standard (Sumner, 1976), the chargeability (mT)
is
. (4)
Geoscience BC Report 2012-1 131
132 Geoscience BC Summary of Activities 2011
Chilcotin1,2 Endako
Ootsa Lake
(coherent)
Ootsa Lake
(noncoherent)
Kasalka /
Powell Creek /
Taseko River
Jackass
Mountain
Max. 5.99 5.82 5.72 5.19 5.66 6.17
Min. 4.24 3.31 3.25 2.25 4.23 3.25
Avg. 5.25 4.93 4.40 3.44 4.73 5.24
Max. n/a 6.63 5.81 5.52 5.91 6.49
Min. n/a 3.88 4.16 3.62 4.78 4.82
Avg. n/a 5.53 4.98 4.40 5.36 5.82
Max. n/a 3.44 3.25 2.43 2.96 3.33
Min. n/a 1.59 2.08 1.04 1.97 1.99
Avg. n/a 2.64 2.60 1.49 2.56 2.79
Max. n/a 4.10 3.40 2.67 3.07 3.65
Min. n/a 1.77 1.77 1.50 2.15 1.67
Avg. n/a 2.81 2.54 1.98 2.67 2.83
Max. 2.99 2.89 2.68 2.65 2.87 2.80
Min. 2.49 1.98 2.23 1.87 2.41 2.54
Avg. 2.72 2.53 2.43 2.13 2.64 2.70
Max. n/a 2.90 2.69 2.67 2.89 2.80
Min. n/a 2.25 2.35 2.16 2.49 2.60
Avg. n/a 2.61 2.49 2.31 2.69 2.72
Max. 3.02 3.02 2.75 2.75 2.91 2.82
Min. 2.56 2.47 2.45 2.47 2.64 2.67
Avg. 2.87 2.78 2.59 2.66 2.78 2.75
Max. n/a 0.36 0.29 0.41 0.40 0.38
Min. n/a 0.22 0.08 0.36 0.12 0.20
Avg. n/a 0.30 0.22 0.38 0.27 0.29
Max. n/a 0.45 0.39 0.45 0.38 0.45
Min. n/a 0.04 0.23 0.18 0.26 0.23
Avg. n/a 0.30 0.32 0.35 0.33 0.33
Max. n/a 84.36 64.82 42.45 52.01 78.45
Min. n/a 13.44 22.67 5.49 28.62 24.18
Avg. n/a 48.54 41.53 15.29 43.94 56.62
Max. n/a 94.08 69.94 51.17 71.57 93.62
Min. n/a 19.31 20.83 13.87 31.63 21.23
Avg. n/a 55.45 43.68 25.82 52.12 59.94
Max. n/a 2.13 1.83 2.53 2.43 2.24
Min. n/a 1.67 1.48 2.14 1.52 1.63
Avg. n/a 1.89 1.69 2.32 1.88 1.89
Max. n/a 3.20 2.40 3.30 2.27 3.28
Min. n/a 1.44 1.68 1.60 1.75 1.68
Avg. n/a 2.07 2.00 2.31 2.03 2.15
Max. 16.55 26.74 14.06 29.44 8.42 6.06
Min. 0.15 0.75 0.32 1.60 1.18 0.27
Avg. 5.57 8.25 5.68 18.76 4.63 1.72
Max. 0.11 0.05 0.04 0.03 0.04 0.01
Min. b.d. b.d. 0.01 b.d. b.d. b.d.
Avg. 0.01 0.01 0.01 0.01 0.01 b.d.
Max. 95646 17560 23035 9941 20796 29011
Min. 127 49 82 37 139 116
Avg. 4541 6135 5098 1518 4886 5101
Max. 80.90 34.90 6.95 23.35 25.28 30.38
Min. 0.09 0.01 0.09 0.04 0.06 0.08
Avg. 13.03 10.24 2.28 8.23 5.37 3.77
Max. 48.00 24.80 2.66 27.70 11.70 15.10
Min. b.d. b.d. 0.04 b.d. b.d. b.d.
Avg. 3.17 3.47 0.78 5.37 3.06 1.04
Max. n/a 18.70 15.10 11.90 45.20 19.10
Min. n/a 0.01 0.03 0.02 0.36 0.28
Avg. n/a 5.76 3.36 3.85 7.89 4.48
Natural remanent
magnetization (NRM; A/m)1
Chargeability (ms)3
Dry bulk density (g/cc)3
Wet bulk density (g/cc)3
Koenigsberger ratio (KN)1
Wet framework density
(g/cc)3
Dry Poisson's ratio
Wet Poisson's ratio
Dry Young's modulus (GPa)
Wet Young's modulus (GPa)
Group name:
Wet V P /V S
Resistivity (ohm-m)1
Porosity (%)3
Magnetic susceptibility (SI)1,2
Dry average V P (km/s)3
Wet average V P (km/s)3
Dry average V S (km/s)3
Wet average V S (km/s)3
Dry V P /V S
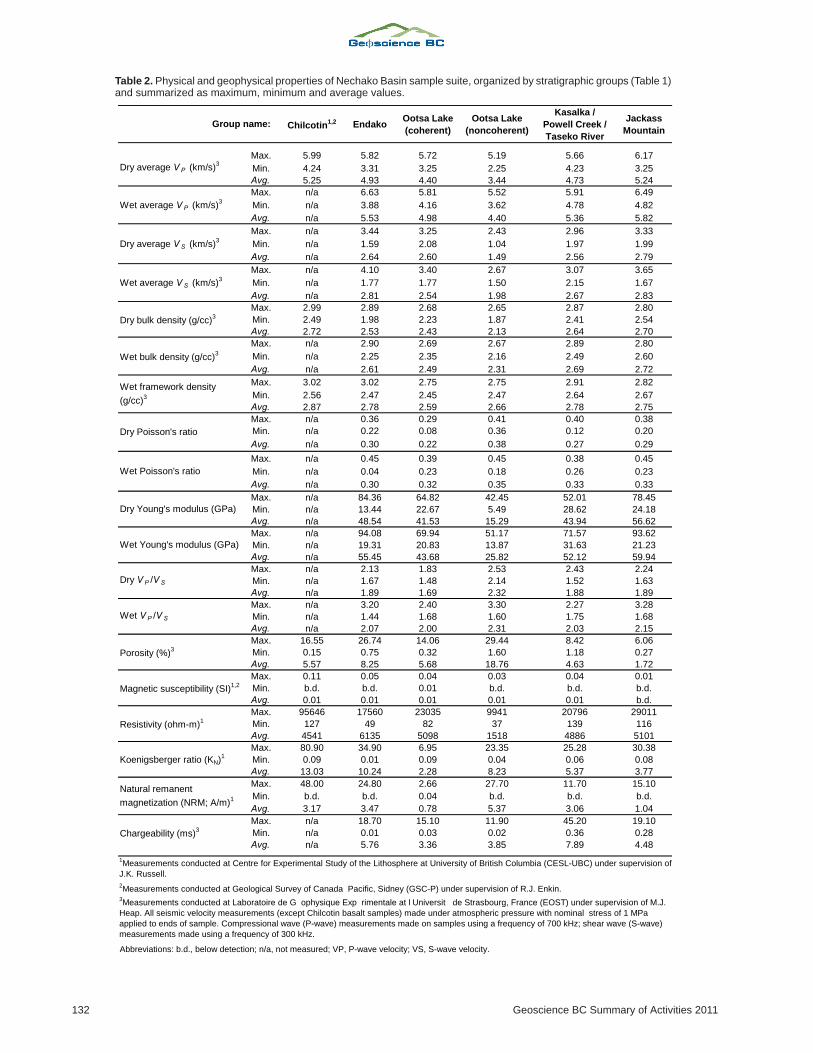
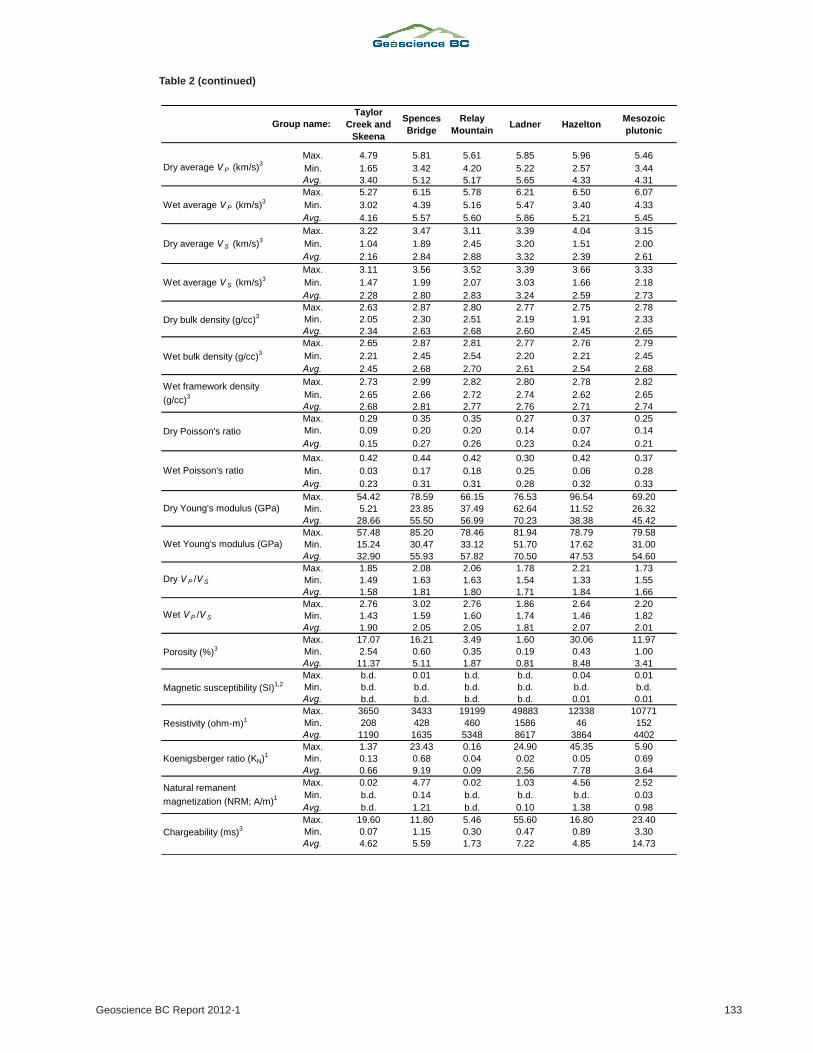
1Measurements conducted at Centre for Experimental Study of the Lithosphere at University of British Columbia (CESL-UBC) under supervision of
J.K. Russell.
2Measurements conducted at Geological Survey of Canada Pacific, Sidney (GSC-P) under supervision of R.J. Enkin.
Abbreviations: b.d., below detection; n/a, not measured; VP, P-wave velocity; VS, S-wave velocity.
3Measurements conducted at Laboratoire de G ophysique Exp rimentale at l Universit de Strasbourg, France (EOST) under supervision of M.J.
Heap. All seismic velocity measurements (except Chilcotin basalt samples) made under atmospheric pressure with nominal stress of 1 MPa
applied to ends of sample. Compressional wave (P-wave) measurements made on samples using a frequency of 700 kHz; shear wave (S-wave)
measurements made using a frequency of 300 kHz.
Table 2. Physical and geophysical properties of Nechako Basin sample suite, organized by stratigraphic groups (Table 1)and summarized as maximum, minimum and average values.
Geoscience BC Report 2012-1 133
Taylor
Creek and
Skeena
Spences
Bridge
Relay
MountainLadner Hazelton
Mesozoic
plutonic
Max. 4.79 5.81 5.61 5.85 5.96 5.46
Min. 1.65 3.42 4.20 5.22 2.57 3.44
Avg. 3.40 5.12 5.17 5.65 4.33 4.31
Max. 5.27 6.15 5.78 6.21 6.50 6.07
Min. 3.02 4.39 5.16 5.47 3.40 4.33
Avg. 4.16 5.57 5.60 5.86 5.21 5.45
Max. 3.22 3.47 3.11 3.39 4.04 3.15
Min. 1.04 1.89 2.45 3.20 1.51 2.00
Avg. 2.16 2.84 2.88 3.32 2.39 2.61
Max. 3.11 3.56 3.52 3.39 3.66 3.33
Min. 1.47 1.99 2.07 3.03 1.66 2.18
Avg. 2.28 2.80 2.83 3.24 2.59 2.73
Max. 2.63 2.87 2.80 2.77 2.75 2.78
Min. 2.05 2.30 2.51 2.19 1.91 2.33
Avg. 2.34 2.63 2.68 2.60 2.45 2.65
Max. 2.65 2.87 2.81 2.77 2.76 2.79
Min. 2.21 2.45 2.54 2.20 2.21 2.45
Avg. 2.45 2.68 2.70 2.61 2.54 2.68
Max. 2.73 2.99 2.82 2.80 2.78 2.82
Min. 2.65 2.66 2.72 2.74 2.62 2.65
Avg. 2.68 2.81 2.77 2.76 2.71 2.74
Max. 0.29 0.35 0.35 0.27 0.37 0.25
Min. 0.09 0.20 0.20 0.14 0.07 0.14
Avg. 0.15 0.27 0.26 0.23 0.24 0.21
Max. 0.42 0.44 0.42 0.30 0.42 0.37
Min. 0.03 0.17 0.18 0.25 0.06 0.28
Avg. 0.23 0.31 0.31 0.28 0.32 0.33
Max. 54.42 78.59 66.15 76.53 96.54 69.20
Min. 5.21 23.85 37.49 62.64 11.52 26.32
Avg. 28.66 55.50 56.99 70.23 38.38 45.42
Max. 57.48 85.20 78.46 81.94 78.79 79.58
Min. 15.24 30.47 33.12 51.70 17.62 31.00
Avg. 32.90 55.93 57.82 70.50 47.53 54.60
Max. 1.85 2.08 2.06 1.78 2.21 1.73
Min. 1.49 1.63 1.63 1.54 1.33 1.55
Avg. 1.58 1.81 1.80 1.71 1.84 1.66
Max. 2.76 3.02 2.76 1.86 2.64 2.20
Min. 1.43 1.59 1.60 1.74 1.46 1.82
Avg. 1.90 2.05 2.05 1.81 2.07 2.01
Max. 17.07 16.21 3.49 1.60 30.06 11.97
Min. 2.54 0.60 0.35 0.19 0.43 1.00
Avg. 11.37 5.11 1.87 0.81 8.48 3.41
Max. b.d. 0.01 b.d. b.d. 0.04 0.01
Min. b.d. b.d. b.d. b.d. b.d. b.d.
Avg. b.d. b.d. b.d. b.d. 0.01 0.01
Max. 3650 3433 19199 49883 12338 10771
Min. 208 428 460 1586 46 152
Avg. 1190 1635 5348 8617 3864 4402
Max. 1.37 23.43 0.16 24.90 45.35 5.90
Min. 0.13 0.68 0.04 0.02 0.05 0.69
Avg. 0.66 9.19 0.09 2.56 7.78 3.64
Max. 0.02 4.77 0.02 1.03 4.56 2.52
Min. b.d. 0.14 b.d. b.d. b.d. 0.03
Avg. b.d. 1.21 b.d. 0.10 1.38 0.98
Max. 19.60 11.80 5.46 55.60 16.80 23.40
Min. 0.07 1.15 0.30 0.47 0.89 3.30
Avg. 4.62 5.59 1.73 7.22 4.85 14.73
Resistivity (ohm-m)1
Koenigsberger ratio (KN)1
Natural remanent
magnetization (NRM; A/m)1
Chargeability (ms)3
Dry V P /V S
Wet V P /V S
Porosity (%)3
Magnetic susceptibility (SI)1,2
Dry Poisson's ratio
Wet Poisson's ratio
Dry Young's modulus (GPa)
Wet Young's modulus (GPa)
Wet average V S (km/s)3
Dry bulk density (g/cc)3
Wet bulk density (g/cc)3
Wet framework density
(g/cc)3
Group name:
Dry average V P (km/s)3
Wet average V P (km/s)3
Dry average V S (km/s)3
Table 2 (continued)
134 Geoscience BC Summary of Activities 2011
Miocene
Chilcotin
(CB)
Eocene Volcanic and
Sedimentary
(EVS)
Cretaceous Volcanic and
Sedimentary
(KVS)
Endako, Ootsa Lake
Kasalka / Powell Creek /
Taseko River, Jackass
Mountain, Taylor Creek
and Skeena, Spences
Bridge
57 31 45
Max. 5.99 5.82 6.17
Min. 4.24 2.25 1.65
Avg. 5.25 4.40 4.67
Max. n/a 6.63 6.49
Min. n/a 3.62 3.02
Avg. n/a 5.08 5.27
Max. n/a 3.44 3.47
Min. n/a 1.04 1.04
Avg. n/a 2.37 2.61
Max. n/a 4.10 3.65
Min. n/a 1.50 1.47
Avg. n/a 2.52 2.66
Max. 2.99 2.89 2.87
Min. 2.49 1.87 2.05
Avg. 2.72 2.41 2.59
Max. n/a 2.90 2.89
Min. n/a 2.16 2.21
Avg. n/a 2.50 2.64
Max. 3.02 3.02 2.99
Min. 2.56 2.45 2.64
Avg. 2.87 2.69 2.76
Max. n/a 0.41 0.40
Min. n/a 0.08 0.09
Avg. n/a 0.29 0.25
Max. n/a 0.45 0.45
Min. n/a 0.04 0.03
Avg. n/a 0.32 0.30
Max. n/a 84.36 78.59
Min. n/a 5.49 5.21
Avg. n/a 38.56 47.22
Max. n/a 94.08 93.62
Min. n/a 13.87 15.24
Avg. n/a 44.51 50.86
Max. n/a 2.53 2.43
Min. n/a 1.48 1.49
Avg. n/a 1.91 1.79
Max. n/a 3.30 3.28
Min. n/a 1.44 1.43
Avg. n/a 2.10 2.04
Max. 16.55 29.44 17.07
Min. 0.15 0.32 0.27
Avg. 5.57 9.64 5.57
Max. 0.11 0.05 0.04
Min. b.d. b.d. b.d.
Avg. 0.01 0.01 b.d.
Max. 95646 23035 29011
Min. 127 37 116
Avg. 4541 4445 3521
Max. 80.9 34.9 30.4
Min. 0.1 b.d. 0.1
Avg. 13.0 6.8 4.1
Max. 48.0 27.7 15.1
Min. b.d. b.d. b.d.
Avg. 3.17 3.05 1.22
Max. n/a 18.7 45.2
Min. n/a 0.0 0.1
Avg. n/a 4.4 5.4
Package name:
No of samples:
Dry bulk density (g/cc)
Wet bulk density (g/cc)
Group name:
Dry average V P (km/s)
Wet average V P (km/s)
Porosity (%)
Magnetic susceptibility (SI)
Dry V P /V S
Abbreviations: b.d., below detection; n/a, not measured
Koenigsberger ratio (KN)
Natural remanent
magnetization (NRM; A/m)
Resistivity (ohm-m)
Chargeability (ms)
Wet V P /V S
Dry average V S (km/s)
Wet average V S (km/s)
Dry Young's modulus (GPa)
Wet Young's modulus (GPa)
Wet framework density
(g/cc)
Dry Poisson's ratio
Wet Poisson's ratio
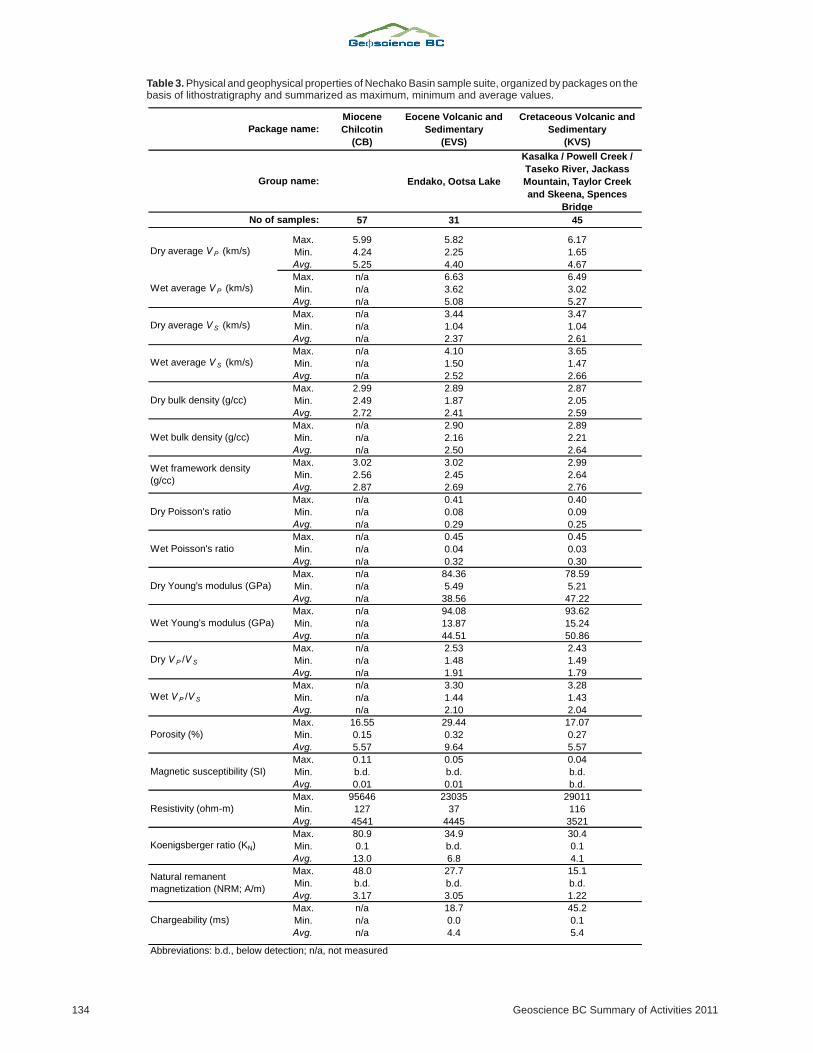
Table 3. Physical and geophysical properties of Nechako Basin sample suite, organized by packages on thebasis of lithostratigraphy and summarized as maximum, minimum and average values.
Geoscience BC Report 2012-1 135
Middle Late Jurassic
Sedimentary
(JS)
Lower Middle Jurassic
Volcanic and
Sedimentary (JVS)
Mesozoic Basement
(MBp)
Relay Mountain, Ladner Hazelton
18 10 6
Max. 5.85 5.96 5.46
Min. 4.20 2.57 3.44
Avg. 5.38 4.33 4.31
Max. 6.21 6.50 6.07
Min. 5.16 3.40 4.33
Avg. 5.72 5.21 5.45
Max. 3.39 4.04 3.15
Min. 2.45 1.51 2.00
Avg. 3.08 2.39 2.61
Max. 3.52 3.66 3.33
Min. 2.07 1.66 2.18
Avg. 3.01 2.59 2.73
Max. 2.80 2.75 2.78
Min. 2.19 1.91 2.33
Avg. 2.65 2.45 2.65
Max. 2.81 2.76 2.79
Min. 2.20 2.21 2.45
Avg. 2.66 2.54 2.68
Max. 2.82 2.78 2.82
Min. 2.72 2.62 2.65
Avg. 2.76 2.71 2.74
Max. 0.35 0.37 0.25
Min. 0.14 0.07 0.14
Avg. 0.25 0.24 0.21
Max. 0.42 0.42 0.37
Min. 0.18 0.06 0.28
Avg. 0.30 0.32 0.33
Max. 76.53 96.54 69.20
Min. 37.49 11.52 26.32
Avg. 62.88 38.38 45.42
Max. 81.94 78.79 79.58
Min. 33.12 17.62 31.00
Avg. 63.46 47.53 54.60
Max. 2.06 2.21 1.73
Min. 1.54 1.33 1.55
Avg. 1.76 1.84 1.66
Max. 2.76 2.64 2.20
Min. 1.60 1.46 1.82
Avg. 1.94 2.07 2.01
Max. 3.49 30.06 11.97
Min. 0.19 0.43 1.00
Avg. 1.40 8.48 3.41
Max. b.d. 0.04 0.01
Min. b.d. b.d. b.d.
Avg. b.d. 0.01 0.01
Max. 49883 12338 10771
Min. 460 46 152
Avg. 7271 3864 4402
Max. 24.9 45.4 5.9
Min. b.d. 0.1 0.7
Avg. 1.5 7.8 3.6
Max. 1.0 4.6 2.5
Min. b.d. b.d. b.d.
Avg. 0.06 1.38 0.98
Max. 55.6 16.8 23.4
Min. 0.3 0.9 3.3
Avg. 5.0 4.9 14.7
Dry bulk density (g/cc)
Wet bulk density (g/cc)
Wet framework density
(g/cc)
Dry Poisson's ratio
Wet V P /V S
Porosity (%)
Magnetic susceptibility (SI)
Resistivity (ohm-m)
Wet Poisson's ratio
Dry Young's modulus (GPa)
Wet Young's modulus (GPa)
Dry V P /V S
Koenigsberger ratio (KN)
Natural remanent
magnetization (NRM; A/m)
Chargeability (ms)
Package name:
Group name:
No of samples:
Dry average V P (km/s)
Wet average V P (km/s)
Dry average V S (km/s)
Wet average V S (km/s)
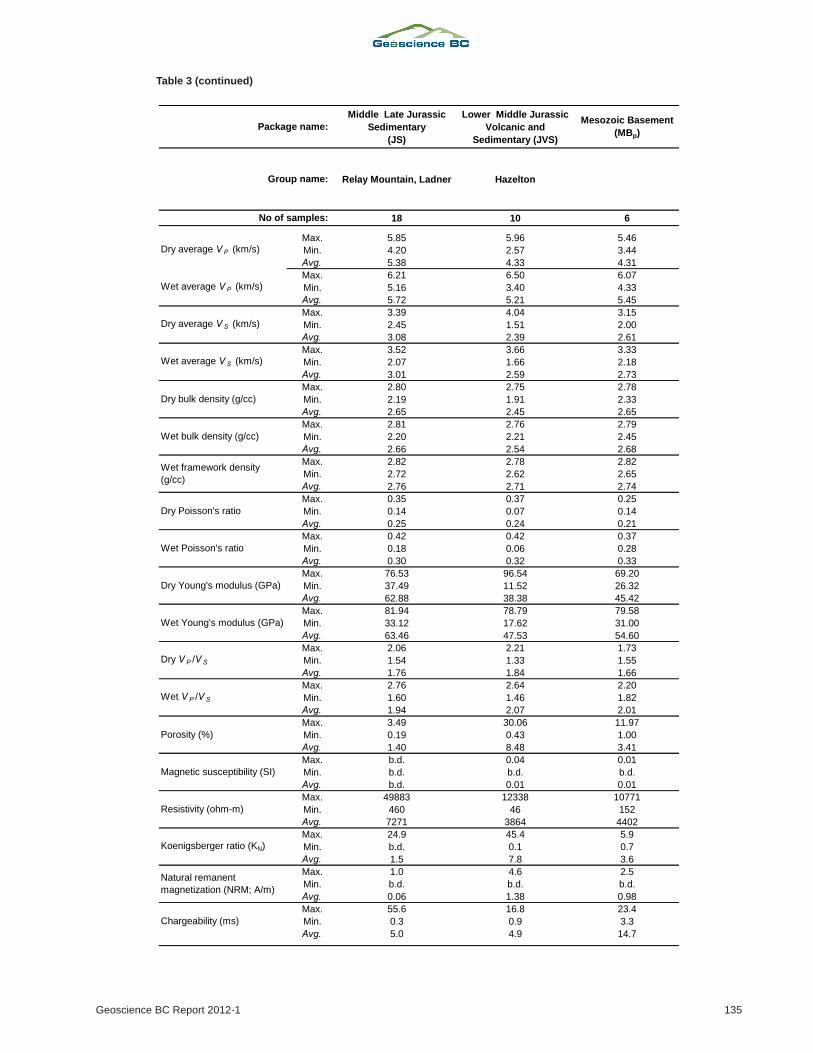
Table 3 (continued)
The main parameters affecting chargeability in laboratory
experiments are mineralogy, grain size and the presence of
pore-filling ionic fluids (Telford et al., 1976). Chargeability
is increased by large surface-to-volume ratios between
grains (Telford et al., 1976). Values of chargeability for
common rock types vary over 3–4 orders of magnitude: 10–
20 ms for carbonate rocks versus 2000–3000 ms for sul-
phide minerals (Telford et al., 1976). Of particular interest
to the Nechako Basin dataset are the average ranges of
chargeability cited for volcanic tuff (300–800 ms), dense
volcanic rocks (100–500 ms), sedimentary rocks (100–
500 ms) and igneous rocks (10–50 ms; Telford et al., 1976).
Seismic Wave Velocities
Two fundamental body-wave types travel through material:
compressional (P) waves and shear (S) waves. For P waves,
material moves parallel to the direction of propagation; for
S waves, material moves in a plane perpendicular to the di-
rection of wave propagation. For energy to travel through a
given elastic material, there must be a resulting restoring
force that resists deformation (Telford et al., 1976). For in-
stance, when a material experiences strain, that strain must
be accommodated by a change in shape of the material. Be-
cause fluids cannot sustain a shear force, S waves do not
propagate through fluids. The P-wave arrivals are always
precursory to S-wave arrivals and are therefore easiest to
identify. Knowledge of the velocities of P and S waves (i.e.,
VP and VS, respectively) passing through geological materi-
als can be used to identify subsurface rock types. Thus, our
measurements of values of VP and VS for this diverse suite
of samples, under dry and wet conditions, will facilitate in-
terpretation of seismic sections for which subsurface
velocity structures have been derived via inversion.
The values of ultrasonic P-wave velocities (VP) are most
important to the ongoing seismic surveys, since inversions
of the seismic-survey data are based mainly on VP. Values of
S-wave velocities (VS) are more difficult to carry out inver-
sions for, but they are useful for refining interpretations of
seismic profiles. The distribution of pore fluids and pore-
fluid pressures in the subsurface of the Nechako Basin are
unknown but are unlikely to be negligible. Furthermore,
pore-fluid pressure exerts a significant influence on seis-
mic reflection. On this basis, we elected to make both ‘Dry’
and ‘Wet’ (i.e., water-saturated) ultrasonic measurements
of VP and VS for each sample core.
The P- and S-wave arrival times for sample cores were
measured using a bench-top apparatus at EOST. Measure-
ments were made using an Agilent Technologies model
DSO5012A digital-storage oscilloscope, an Agilent Tech-
nologies model 33210A 10 MHz function/waveform gen-
erator, and two broadband PZT piezoelectric transducer
crystals (100 kHz to 1 MHz frequency), one located at each
end of the sample. Measurements were made under a stress
of approximately 1 MPa to ensure good contact between
the instrument’s end caps and the polished ends of the sam-
ple core. The P-wave measurements were based on a trans-
mitted frequency of 700 kHz; S-wave measurements used a
frequency of 300 kHz. The P-wave arrivals were chosen as
the first clearly identified signal following the triggering
pulse from the function generator. The S-arrival is charac-
terized by a distinct change in the ultrasonic response of the
sample with time. The onsets of the S-wave arrivals were
determined by identifying the first significant change in
signal amplitude or the first distinct inflection point in the
slope of the signal following the P-wave arrival.
Derivative (Computed) Properties
The measured values of VP and VS for cores of rock samples
allow the calculation of derivative properties, namely sev-
eral elastic (dynamic) properties (Table 2). In this section,
we review the calculation of Poisson’s ratio and Young’s
modulus (Tables 2 and 3).
Elastic compression and extension are described by
Hooke’s Law,
� = E • , (5)
where � is the normal stress and is the elongation or nor-
mal strain. Young’s modulus (E) is the measure of stiffness
and is traditionally taken as the ratio between the tensile
stress and tensile strain. Here, we define E as the ratio of
uniaxial stress to uniaxial strain. Young’s modulus calcu-
lated from ultrasonic velocities is an indirect and nonde-
structive way of determining the stiffness of rock samples.
For most rocks, E has values between 10 and 200 GPa
(Telford et al., 1976).
Poisson’s ratio is the ratio between the shortening and ex-
pansion of a material under uniaxial compression. Most
rocks have Poisson’s ratios between 0.05 (for very hard,
rigid rock) to 0.45 (for soft, poorly consolidated material;
Telford et al., 1976).
Using ultrasonic measurements of P- and S-wave veloci-
ties, the dynamic elastic moduli can be computed for Pois-
son’s ratio (d) as
(6)
and for Young modulus (Ed) as
, (7)
where � is the bulk density of the sample (g/cc).
Results
We describe in this section the experimental results ob-
tained for each of the six lithostratigraphic packages (Ta-
136 Geoscience BC Summary of Activities 2011
bles 1 and 3). The range of values measured for the various
properties across all lithostratigraphic packages is extreme
(Table 3):
� porosity: 0.15–30.06%
� density: 2.45–3.02 g/cc
� chargeability: 0.0–55.6 ms
� NRM: 1.0–48.0
� resistivity: 46–95646 ��m
� magnetic susceptibility: 0.01–0.11 SI
� dry VP: 1.65–6.17 km/s
� dry VS: 1.04–4.04 km/s
� wet VP: 3.02–6.63 km/s
� wet VS: 1.47–4.10 km/s
Variation within lithostratigraphic packages is substan-
tially less and reflects the physical and lithological varia-
tions within each package. Some packages comprise a nar-
row range of rock types (e.g., Miocene Chilcotin basalts
[CB]) and can show a correspondingly narrow range of
physical and geophysical properties (Table 3). Other
lithostratigraphic packages comprise a diverse range of
rock types (e.g., Eocene volcanic and sedimentary rocks
[EVS]) and show a correspondingly wide range of proper-
ties. Ultimately, this extensive and high-quality dataset is
intended for Geoscience BC’s digital database and prom-
ises to facilitate geophysical interpretations of the geology
in the Nechako Basin region of central BC. Data from each
of the six lithostratigraphic packages have been plotted on
Geoscience BC Report 2012-1 137
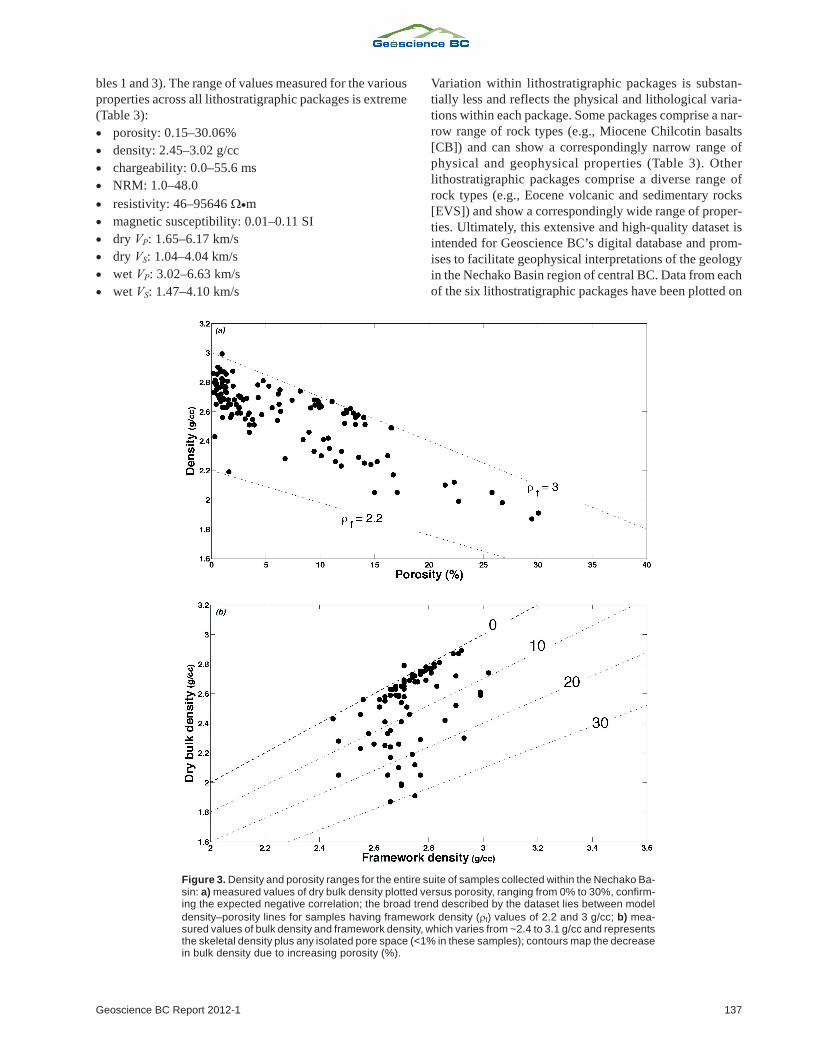
Figure 3. Density and porosity ranges for the entire suite of samples collected within the Nechako Ba-sin: a) measured values of dry bulk density plotted versus porosity, ranging from 0% to 30%, confirm-ing the expected negative correlation; the broad trend described by the dataset lies between model
density–porosity lines for samples having framework density (�f) values of 2.2 and 3 g/cc; b) mea-sured values of bulk density and framework density, which varies from ~2.4 to 3.1 g/cc and representsthe skeletal density plus any isolated pore space (<1% in these samples); contours map the decreasein bulk density due to increasing porosity (%).
multiparameter diagrams (Table 3) to characterize the
within-package variations in physical properties.
As part of our physical-property characterization of the
samples, we measured bulk and framework densities and
porosity. Many geophysical properties are, themselves, de-
pendent on or sensitive to these physical properties. The
suite of 167 samples has a porosity range of 0–30 vol. %
(Figure 3a); the porosity is assumed to be fully connected.
On the basis of the different methods used to measure den-
sity, we saw no evidence for a substantial fraction of iso-
lated porosity. Bulk density (rock plus pore space) ranges
from ~1.8 to 3.0 g/cc, whereas the corresponding frame-
work density varies between ~2.4 and 3.0 g/cc. The rela-
tionship between bulk and framework density and porosity
is illustrated in Figure 3b. At zero porosity, bulk and frame-
work density are equivalent. The contours in Figure 3b il-
lustrate the effect of porosity in reducing the bulk density of
samples relative to their framework density.
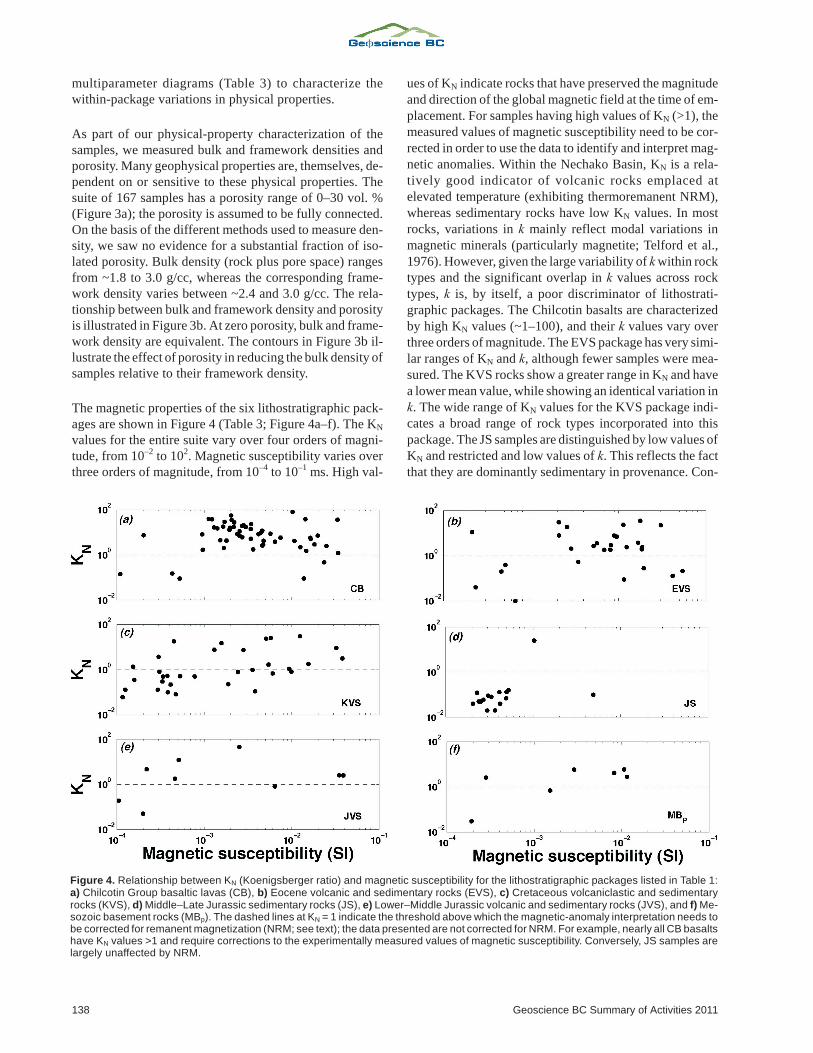
The magnetic properties of the six lithostratigraphic pack-
ages are shown in Figure 4 (Table 3; Figure 4a–f). The KN
values for the entire suite vary over four orders of magni-
tude, from 10–2 to 102. Magnetic susceptibility varies over
three orders of magnitude, from 10–4 to 10–1 ms. High val-
ues of KN indicate rocks that have preserved the magnitude
and direction of the global magnetic field at the time of em-
placement. For samples having high values of KN (>1), the
measured values of magnetic susceptibility need to be cor-
rected in order to use the data to identify and interpret mag-
netic anomalies. Within the Nechako Basin, KN is a rela-
tively good indicator of volcanic rocks emplaced at
elevated temperature (exhibiting thermoremanent NRM),
whereas sedimentary rocks have low KN values. In most
rocks, variations in k mainly reflect modal variations in
magnetic minerals (particularly magnetite; Telford et al.,
1976). However, given the large variability of k within rock
types and the significant overlap in k values across rock
types, k is, by itself, a poor discriminator of lithostrati-
graphic packages. The Chilcotin basalts are characterized
by high KN values (~1–100), and their k values vary over
three orders of magnitude. The EVS package has very simi-
lar ranges of KN and k, although fewer samples were mea-
sured. The KVS rocks show a greater range in KN and have
a lower mean value, while showing an identical variation in
k. The wide range of KN values for the KVS package indi-
cates a broad range of rock types incorporated into this
package. The JS samples are distinguished by low values of
KN and restricted and low values of k. This reflects the fact
that they are dominantly sedimentary in provenance. Con-
138 Geoscience BC Summary of Activities 2011
Figure 4. Relationship between KN (Koenigsberger ratio) and magnetic susceptibility for the lithostratigraphic packages listed in Table 1:a) Chilcotin Group basaltic lavas (CB), b) Eocene volcanic and sedimentary rocks (EVS), c) Cretaceous volcaniclastic and sedimentaryrocks (KVS), d) Middle–Late Jurassic sedimentary rocks (JS), e) Lower–Middle Jurassic volcanic and sedimentary rocks (JVS), and f) Me-sozoic basement rocks (MBp). The dashed lines at KN = 1 indicate the threshold above which the magnetic-anomaly interpretation needs tobe corrected for remanent magnetization (NRM; see text); the data presented are not corrected for NRM. For example, nearly all CB basaltshave KN values >1 and require corrections to the experimentally measured values of magnetic susceptibility. Conversely, JS samples arelargely unaffected by NRM.
versely the small numbers of samples within the JVS pack-
age suggest wide-ranging KN and k properties similar to
those observed in the EVS and KVS packages. The base-
ment rocks (MBp) have intermediate to low KN and a range
of k values. These properties are largely a reflection of the
variable modal mineralogy of the plutonic rocks collected
to represent the basement to the Nechako Basin.
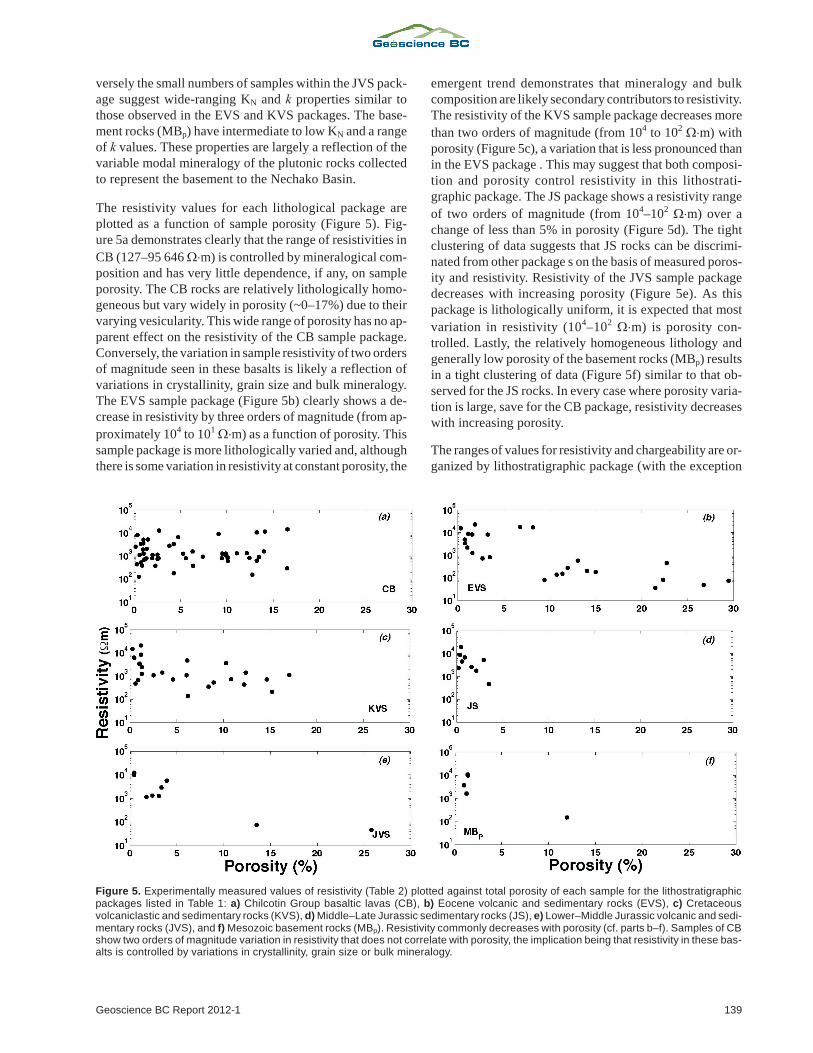
The resistivity values for each lithological package are
plotted as a function of sample porosity (Figure 5). Fig-
ure 5a demonstrates clearly that the range of resistivities in
CB (127–95 646 ��m) is controlled by mineralogical com-
position and has very little dependence, if any, on sample
porosity. The CB rocks are relatively lithologically homo-
geneous but vary widely in porosity (~0–17%) due to their
varying vesicularity. This wide range of porosity has no ap-
parent effect on the resistivity of the CB sample package.
Conversely, the variation in sample resistivity of two orders
of magnitude seen in these basalts is likely a reflection of
variations in crystallinity, grain size and bulk mineralogy.
The EVS sample package (Figure 5b) clearly shows a de-
crease in resistivity by three orders of magnitude (from ap-
proximately 104 to 101 ��m) as a function of porosity. This
sample package is more lithologically varied and, although
there is some variation in resistivity at constant porosity, the
emergent trend demonstrates that mineralogy and bulk
composition are likely secondary contributors to resistivity.
The resistivity of the KVS sample package decreases more
than two orders of magnitude (from 104 to 102 ��m) with
porosity (Figure 5c), a variation that is less pronounced than
in the EVS package . This may suggest that both composi-
tion and porosity control resistivity in this lithostrati-
graphic package. The JS package shows a resistivity range
of two orders of magnitude (from 104–102 ��m) over a
change of less than 5% in porosity (Figure 5d). The tight
clustering of data suggests that JS rocks can be discrimi-
nated from other package s on the basis of measured poros-
ity and resistivity. Resistivity of the JVS sample package
decreases with increasing porosity (Figure 5e). As this
package is lithologically uniform, it is expected that most
variation in resistivity (104–102 ��m) is porosity con-
trolled. Lastly, the relatively homogeneous lithology and
generally low porosity of the basement rocks (MBp) results
in a tight clustering of data (Figure 5f) similar to that ob-
served for the JS rocks. In every case where porosity varia-
tion is large, save for the CB package, resistivity decreases
with increasing porosity.
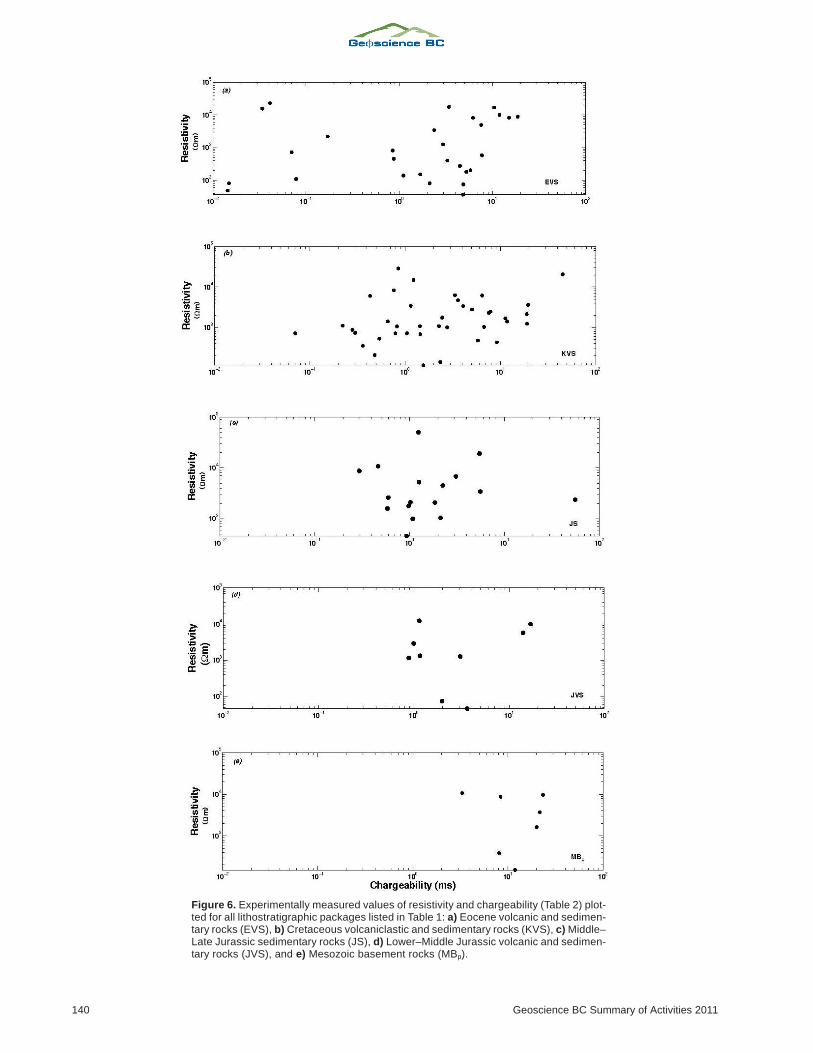
The ranges of values for resistivity and chargeability are or-
ganized by lithostratigraphic package (with the exception
Geoscience BC Report 2012-1 139
Figure 5. Experimentally measured values of resistivity (Table 2) plotted against total porosity of each sample for the lithostratigraphicpackages listed in Table 1: a) Chilcotin Group basaltic lavas (CB), b) Eocene volcanic and sedimentary rocks (EVS), c) Cretaceousvolcaniclastic and sedimentary rocks (KVS), d) Middle–Late Jurassic sedimentary rocks (JS), e) Lower–Middle Jurassic volcanic and sedi-mentary rocks (JVS), and f) Mesozoic basement rocks (MBp). Resistivity commonly decreases with porosity (cf. parts b–f). Samples of CBshow two orders of magnitude variation in resistivity that does not correlate with porosity, the implication being that resistivity in these bas-alts is controlled by variations in crystallinity, grain size or bulk mineralogy.
140 Geoscience BC Summary of Activities 2011
Figure 6. Experimentally measured values of resistivity and chargeability (Table 2) plot-ted for all lithostratigraphic packages listed in Table 1: a) Eocene volcanic and sedimen-tary rocks (EVS), b) Cretaceous volcaniclastic and sedimentary rocks (KVS), c) Middle–Late Jurassic sedimentary rocks (JS), d) Lower–Middle Jurassic volcanic and sedimen-tary rocks (JVS), and e) Mesozoic basement rocks (MBp).
of CB) in Figure 6a–e. The resistivity range of EVS (Fig-
ure 6a) is less than three orders of magnitude, and charge-
ability varies by as much as four orders of magnitude. This
broad range of values is largely controlled by lithology, al-
though enhanced by the wide range of porosity in the EVS
sample package. Resistivity measurements were conducted
under distilled water–saturated conditions. Such condi-
tions are expected to dissolve any late-stage groundwater-
derived mineral precipitates lining the pore spaces, thereby
creating ionic pore fluids and a more conductive sample.
However, as shown in Figure 5, resistivity decreases with
increasing preserved porosity, suggesting a paucity of such
mineral precipitates in these pore spaces. Likewise, KVS
(Figure 6b) also demonstrates a broad range of resistivities
and chargeabilities, testament to the broad range in lithol-
ogy and variation in porosity of the sample package. The JS
sample package (Figure 6c) ranges in resistivity and
chargeability across two and a half orders of magnitude.
The resistivity range of JVS (Figure 6d) is approximately
2.5 orders of magnitude, whereas the chargeability range of
this package is slightly greater than one order of magnitude.
The tighter range of chargeability values for both JS and
JVS is controlled predominantly by lithology. Lithological
variation within each package is limited, suggesting that
any scatter in resistivity is due to porosity. The porosity of
the JS package rocks is negligible compared to that of the
JVS package, suggesting that the narrower range of
resistivities within the JS package is lithologically con-
trolled. Figure 6e shows the ranges in resistivity (approxi-
mately two orders of magnitude) and chargeability (ap-
proximately one order of magnitude) for the MBp rocks.
This package contains lithologically similar rocks
(plutonic rocks) of relatively low porosity, ensuring that the
range in measured electrical properties is small.
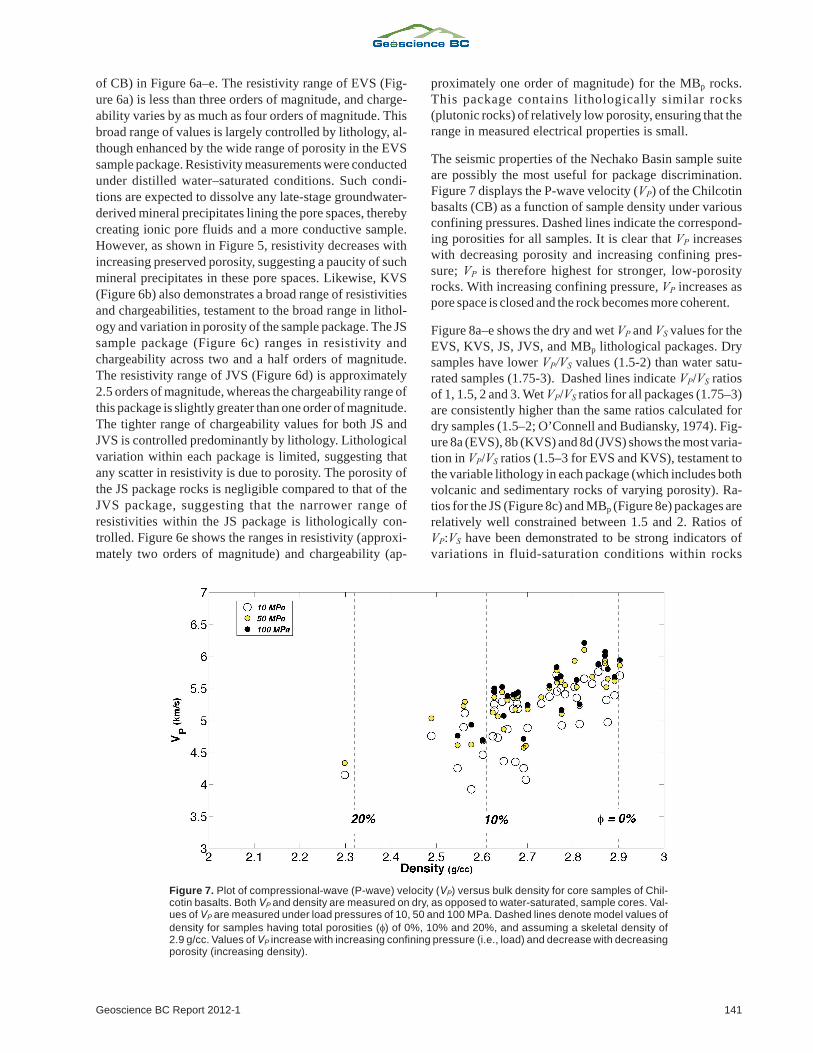
The seismic properties of the Nechako Basin sample suite
are possibly the most useful for package discrimination.
Figure 7 displays the P-wave velocity (VP) of the Chilcotin
basalts (CB) as a function of sample density under various
confining pressures. Dashed lines indicate the correspond-
ing porosities for all samples. It is clear that VP increases
with decreasing porosity and increasing confining pres-
sure; VP is therefore highest for stronger, low-porosity
rocks. With increasing confining pressure, VP increases as
pore space is closed and the rock becomes more coherent.
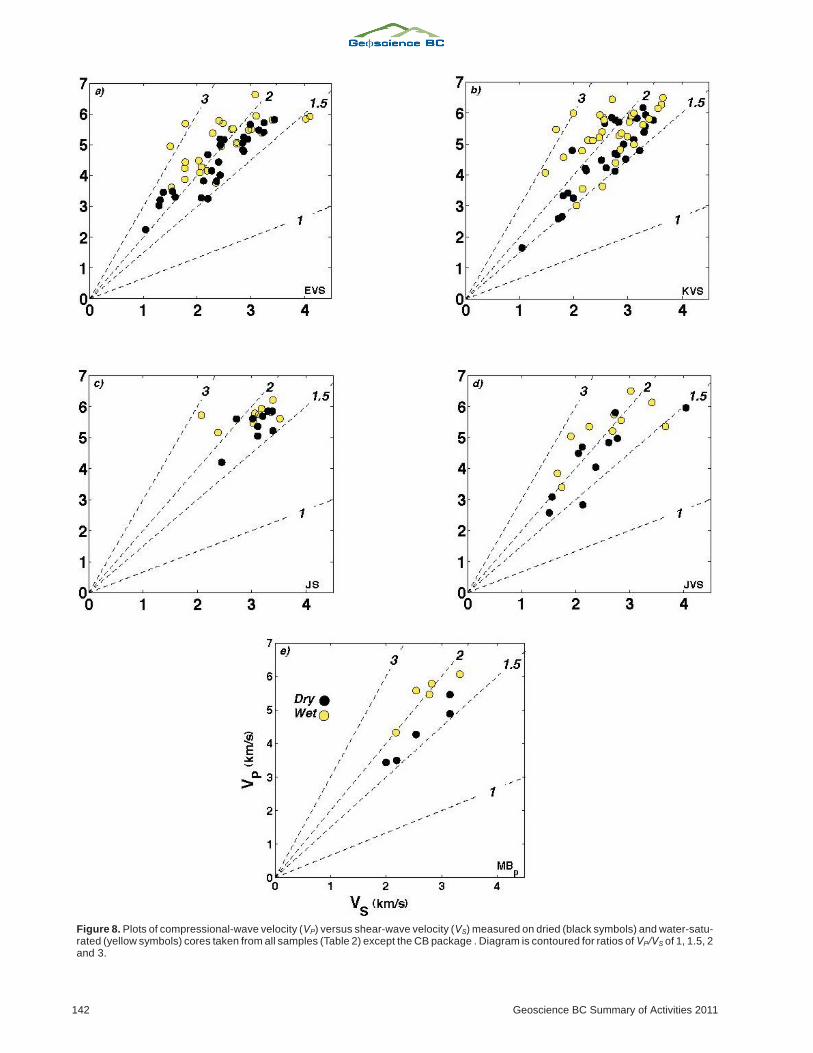
Figure 8a–e shows the dry and wet VP and VS values for the
EVS, KVS, JS, JVS, and MBp lithological packages. Dry
samples have lower VP/VS values (1.5-2) than water satu-
rated samples (1.75-3). Dashed lines indicate VP/VS ratios
of 1, 1.5, 2 and 3. Wet VP/VS ratios for all packages (1.75–3)
are consistently higher than the same ratios calculated for
dry samples (1.5–2; O’Connell and Budiansky, 1974). Fig-
ure 8a (EVS), 8b (KVS) and 8d (JVS) shows the most varia-
tion in VP/VS ratios (1.5–3 for EVS and KVS), testament to
the variable lithology in each package (which includes both
volcanic and sedimentary rocks of varying porosity). Ra-
tios for the JS (Figure 8c) and MBp (Figure 8e) packages are
relatively well constrained between 1.5 and 2. Ratios of
VP:VS have been demonstrated to be strong indicators of
variations in fluid-saturation conditions within rocks
Geoscience BC Report 2012-1 141
Figure 7. Plot of compressional-wave (P-wave) velocity (VP) versus bulk density for core samples of Chil-cotin basalts. Both VP and density are measured on dry, as opposed to water-saturated, sample cores. Val-ues of VP are measured under load pressures of 10, 50 and 100 MPa. Dashed lines denote model values of
density for samples having total porosities (�) of 0%, 10% and 20%, and assuming a skeletal density of2.9 g/cc. Values of VP increase with increasing confining pressure (i.e., load) and decrease with decreasingporosity (increasing density).
142 Geoscience BC Summary of Activities 2011
Figure 8. Plots of compressional-wave velocity (VP) versus shear-wave velocity (VS) measured on dried (black symbols) and water-satu-rated (yellow symbols) cores taken from all samples (Table 2) except the CB package . Diagram is contoured for ratios of VP/VS of 1, 1.5, 2and 3.
(O’Connell and Budiansky, 1974). On this basis, further in-
vestigation of seismic velocities within the Nechako Basin
could elucidate both density of crack distributions within
the underlying stratigraphy and, more importantly, the de-
gree of fluid saturation of these cracks. The latter (e.g., fluid
distribution) relates directly to our capacity to assess the
hydrocarbon potential of the basin.
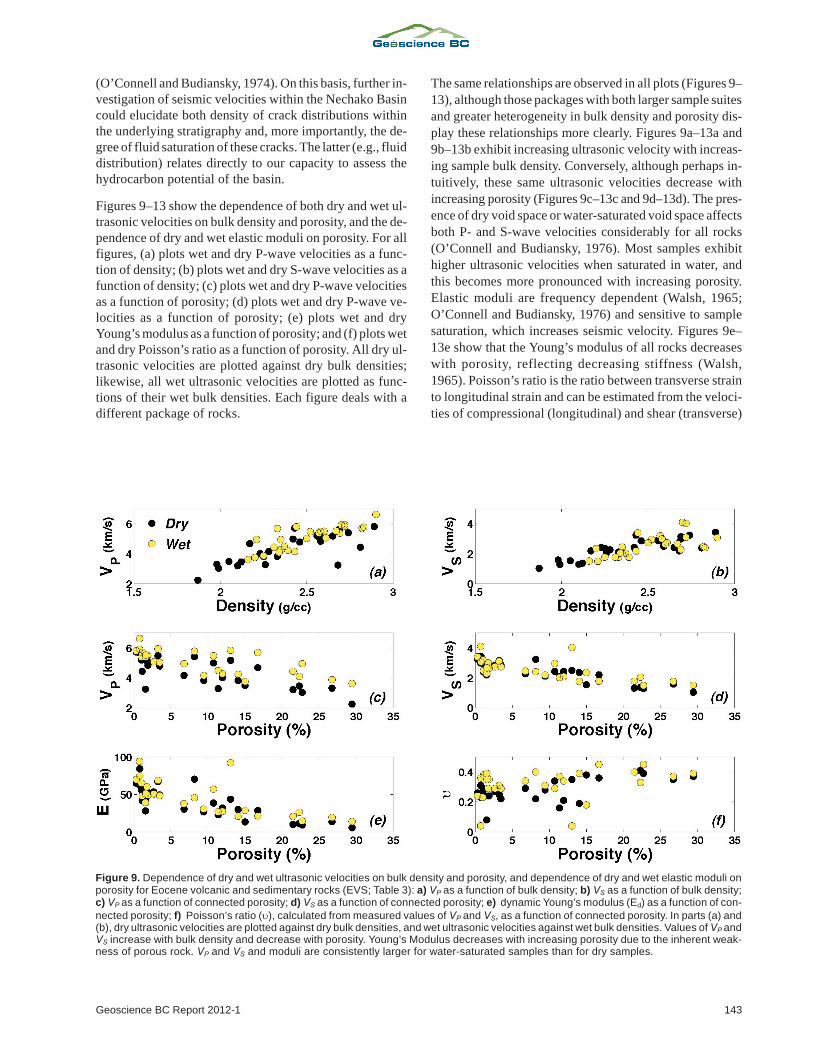
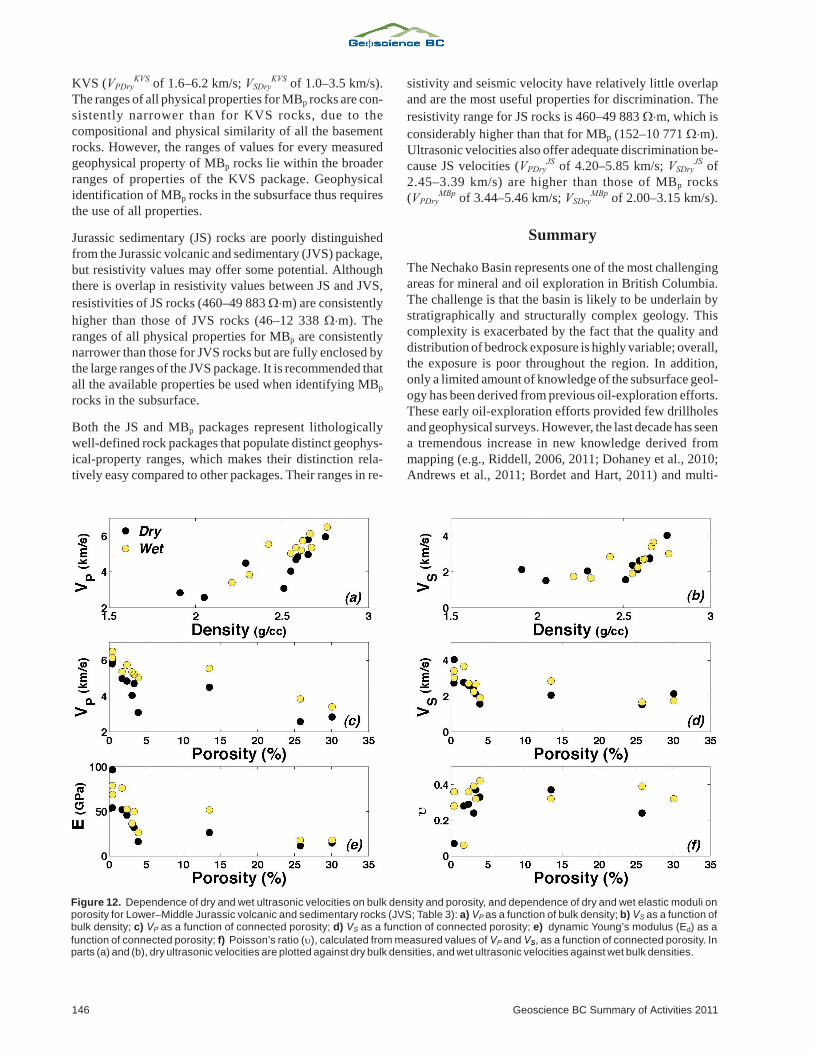
Figures 9–13 show the dependence of both dry and wet ul-
trasonic velocities on bulk density and porosity, and the de-
pendence of dry and wet elastic moduli on porosity. For all
figures, (a) plots wet and dry P-wave velocities as a func-
tion of density; (b) plots wet and dry S-wave velocities as a
function of density; (c) plots wet and dry P-wave velocities
as a function of porosity; (d) plots wet and dry P-wave ve-
locities as a function of porosity; (e) plots wet and dry
Young’s modulus as a function of porosity; and (f) plots wet
and dry Poisson’s ratio as a function of porosity. All dry ul-
trasonic velocities are plotted against dry bulk densities;
likewise, all wet ultrasonic velocities are plotted as func-
tions of their wet bulk densities. Each figure deals with a
different package of rocks.
The same relationships are observed in all plots (Figures 9–
13), although those packages with both larger sample suites
and greater heterogeneity in bulk density and porosity dis-
play these relationships more clearly. Figures 9a–13a and
9b–13b exhibit increasing ultrasonic velocity with increas-
ing sample bulk density. Conversely, although perhaps in-
tuitively, these same ultrasonic velocities decrease with
increasing porosity (Figures 9c–13c and 9d–13d). The pres-
ence of dry void space or water-saturated void space affects
both P- and S-wave velocities considerably for all rocks
(O’Connell and Budiansky, 1976). Most samples exhibit
higher ultrasonic velocities when saturated in water, and
this becomes more pronounced with increasing porosity.
Elastic moduli are frequency dependent (Walsh, 1965;
O’Connell and Budiansky, 1976) and sensitive to sample
saturation, which increases seismic velocity. Figures 9e–
13e show that the Young’s modulus of all rocks decreases
with porosity, reflecting decreasing stiffness (Walsh,
1965). Poisson’s ratio is the ratio between transverse strain
to longitudinal strain and can be estimated from the veloci-
ties of compressional (longitudinal) and shear (transverse)
Geoscience BC Report 2012-1 143
Figure 9. Dependence of dry and wet ultrasonic velocities on bulk density and porosity, and dependence of dry and wet elastic moduli onporosity for Eocene volcanic and sedimentary rocks (EVS; Table 3): a) VP as a function of bulk density; b) VS as a function of bulk density;c) VP as a function of connected porosity; d) VS as a function of connected porosity; e) dynamic Young’s modulus (Ed) as a function of con-
nected porosity; f) Poisson’s ratio (), calculated from measured values of VP and VS, as a function of connected porosity. In parts (a) and(b), dry ultrasonic velocities are plotted against dry bulk densities, and wet ultrasonic velocities against wet bulk densities. Values of VP andVS increase with bulk density and decrease with porosity. Young’s Modulus decreases with increasing porosity due to the inherent weak-ness of porous rock. VP and VS and moduli are consistently larger for water-saturated samples than for dry samples.
waves. Figures 9f–13f show that there appears to be little
relationship between the calculated Poisson’s ratios and
porosities of the six Nechako Basin packages.
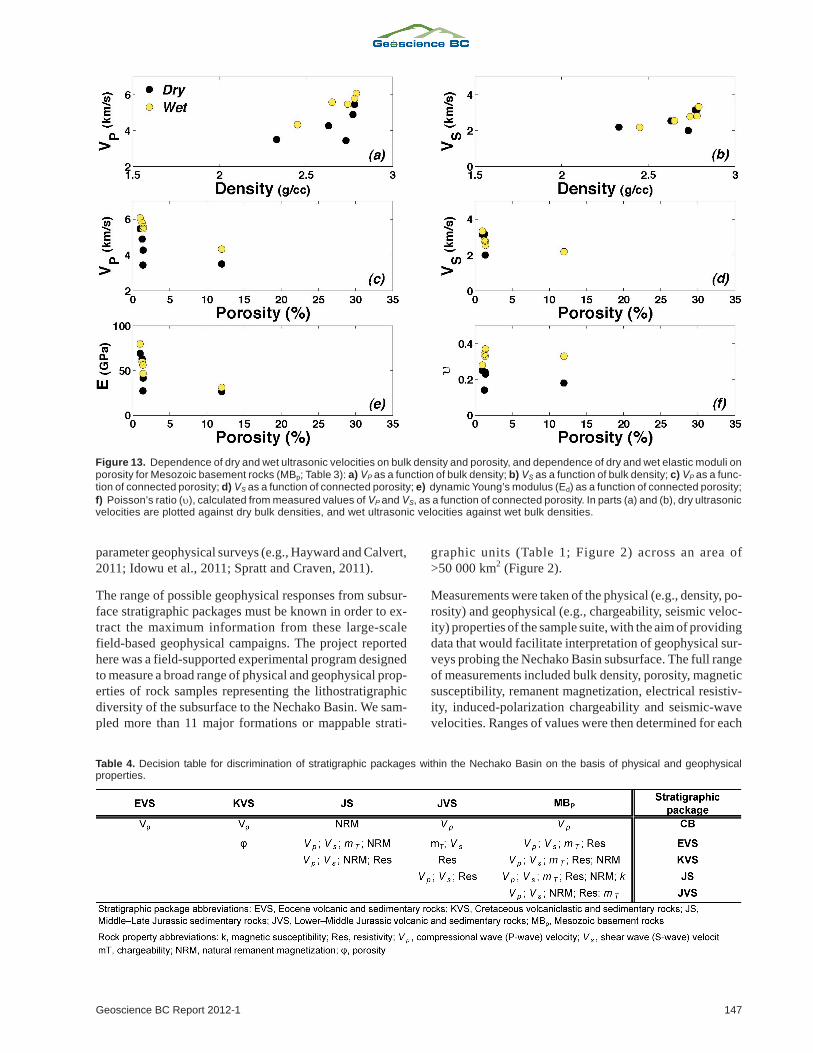
Geophysical Discrimination within theNechako Basin
In this section, we develop a decision table (Table 4) to fa-
cilitate geophysical discrimination of lithostratigraphic
units in the subsurface to the Nechako Basin. We highlight
the most reliable indices for discrimination between the six
major lithostratigraphic packages described in Table 1.
Each cell in Table 4 contains physical properties appropri-
ate for distinguishing between the units of the intersecting
column and row. This is not an exhaustive set of discrimin-
ators. In part, the decision table reflects, and is limited by,
the fact that we have packaged the rocks on the basis of age,
geography and lithology.
The Miocene Chilcotin basalts (CB) are one of the most dis-
tinctive lithostratigraphic packages underlying the Ne-
chako Basin. These rocks have higher dry Vp values (4.2–
6.0 km/s) than the range of values observed for the Eocene
volcanic and sedimentary (EVS) package (2.2–5.8 km/s).
The Vp values for CB rocks (4.2–6.0 km/s) overlap those
measured for Cretaceous volcaniclastic and sedimentary
(KVS) rocks (1.6–6.2 km/s) but are generally higher; the
overlap is a reflection of the diverse range of Vp values
within the KVS package. The CB package is easily distin-
guished from rock types within the Middle–Late Jurassic
sedimentary (JS) package on the basis of NRM. The CB
package shows a large range of values from below detec-
tion (b.d.) to 48 A/m; in contrast, the JS rocks have a limited
range (b.d. to 1.0 A/m), and most samples have NRM val-
ues of <0.1 A/m. Distinguishing CB rocks from rocks of the
Lower–Middle Jurassic volcanic and sedimentary (JVS)
package is more uncertain. The dry Vp offers partial dis-
crimination of CB (4.2–6.0 km/s) from JVS (2.5–5.9 km/s),
in that CB rocks have Vp values restricted to the upper range
of JVS values. The difficulty in discriminating between
these two lithostratigraphic packages reflects the
lithological diversity of the JVS package and the fact that it
contains many similar volcanic rocks. Similarly, CB rocks
are poorly distinguished from the Mesozoic basement
rocks (MBp), although they have a higher mean Vp (4.2–
6.0 km/s) than the MBp package (3.4–5.5 km/s).
The EVS package is indistinguishable from the KVS pack-
age in terms of all the measured geophysical properties: this
is not surprising, given that the lithological make-up of
both packages is very similar. The sole distinguishing prop-
144 Geoscience BC Summary of Activities 2011
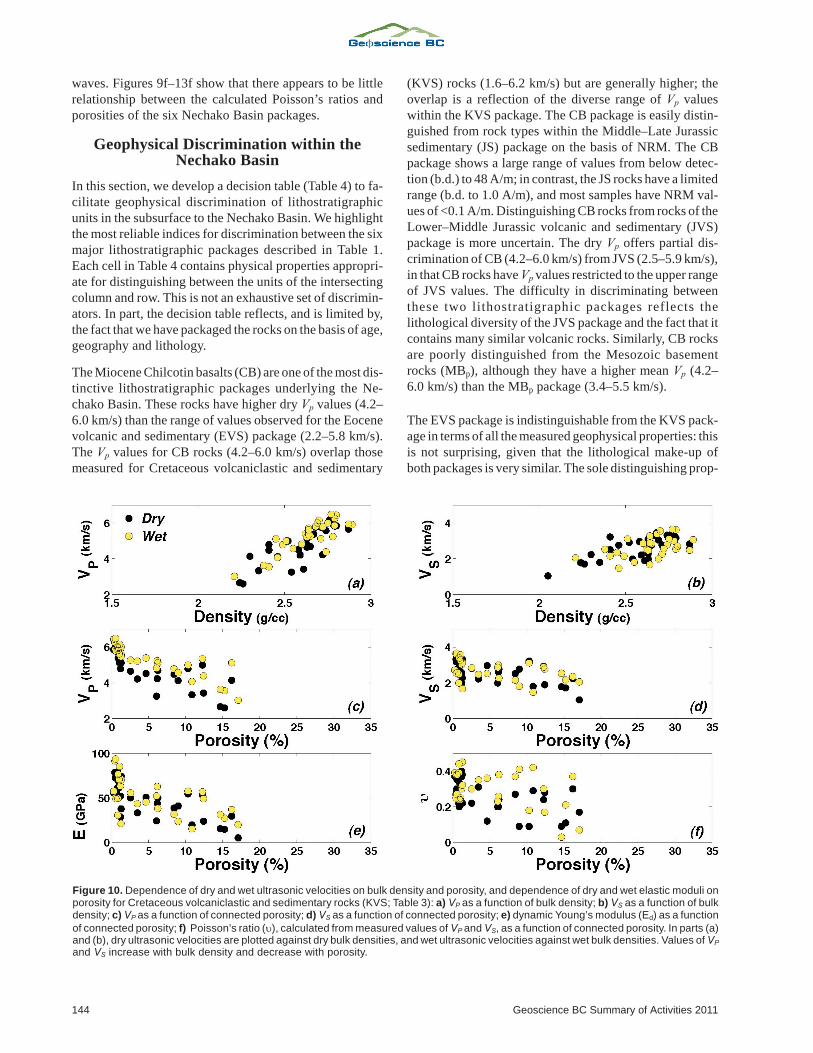
Figure 10. Dependence of dry and wet ultrasonic velocities on bulk density and porosity, and dependence of dry and wet elastic moduli onporosity for Cretaceous volcaniclastic and sedimentary rocks (KVS; Table 3): a) VP as a function of bulk density; b) VS as a function of bulkdensity; c) VP as a function of connected porosity; d) VS as a function of connected porosity; e) dynamic Young’s modulus (Ed) as a function
of connected porosity; f) Poisson’s ratio (), calculated from measured values of VP and VS, as a function of connected porosity. In parts (a)and (b), dry ultrasonic velocities are plotted against dry bulk densities, and wet ultrasonic velocities against wet bulk densities. Values of VP
and VS increase with bulk density and decrease with porosity.
erty is porosity: the EVS package has higher porosity
(~30%) than the KVS package, which is consistently less
than 17%. Although not ideal, this is the only viable way of
distinguishing between the EVS and KVS packages. Rocks
of the EVS package are easily distinguished from those of
the JS package in the following ways: 1) NRM values for
EVS rocks (b.d. to 28 A/m) are substantially higher than
those of JS rocks (most are <0.004 A/m); 2) values of
chargeability (mT) can also help distinguish EVS (b.d. to
19 ms) from JS (0.3–56 ms); 3) values of dry and water-sat-
urated Vp values overlap, but EVS rocks (2.35–5.8 and 3.6–
6.6 km/s) show a greater range than JS rocks (4.2–5.8 and
5.2–6.2 km/s); 4) on average, EVS rocks are less resistive
(37–23 035 ��m) than JS rocks (460–49 883 ��m), but
there is complete overlap between the ranges. As with KVS
rocks, JVS rocks cannot be reliably distinguished from
EVS rocks by any geophysical property reported; this is
due to the similar lithological components in each package.
The EVS rocks are also poorly distinguished from MBp
rocks, although all MBp geophysical-property ranges are
narrower and lie completely within EVS ranges. This is due
to the variety of rock types within the EVS package, which
also includes some igneous samples.
As with the EVS package, it is difficult to distinguish the
various lithological packages from the Cretaceous volcanic
and sedimentary (KVS) package. Discrimination is hin-
dered by the variety of rock types grouped under the KVS
label, which has resulted in a large scatter of geophysical-
property data. There is poor distinction between KVS and
JVS, since both packages encompass similar rock types,
although resistivity has potential as a geophysical discrimin-
ator. The resistivity ranges of both packages overlap con-
siderably, although KVS resistivities (116–29 011 ��m) are
consistently higher than those characterizing the JVS pack-
age (46–12 338 ��m). There is significant overlap between
KVS and JVS ultrasonic velocities, rendering these two
packages seismically indistinguishable. As with the EVS
package, NRM values for KVS (b.d. to 15.1 A/m) are sub-
stantially higher than those of JS rock units (most are
<0.004 A/m). Ultrasonic velocities of KVS rocks vary
greatly due to lithological diversity in this package. How-
ever, JS rocks are both lithologically and physically similar
(porosities are <3.5%), resulting in narrow ranges for their
seismic velocities (VPDryJS of 4.2–5.8 km/s; VSDry
JS of 2.4–
3.4 km/s), which are consistently much higher than those of
Geoscience BC Report 2012-1 145
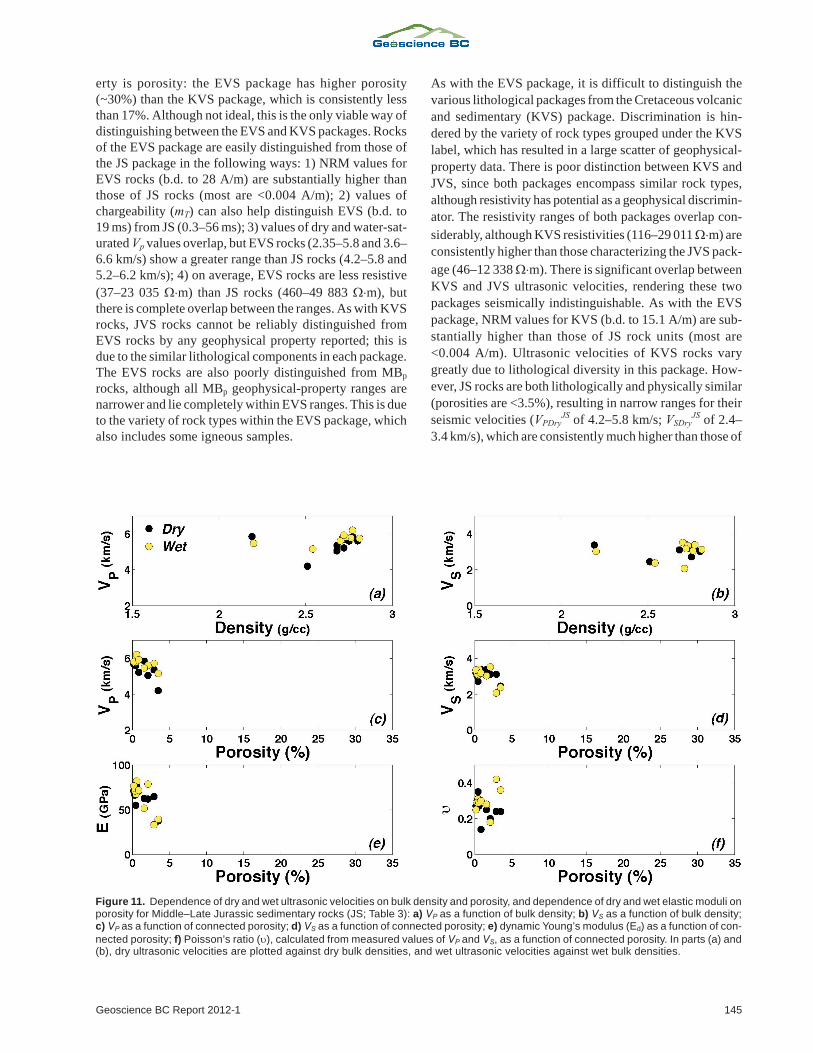
Figure 11. Dependence of dry and wet ultrasonic velocities on bulk density and porosity, and dependence of dry and wet elastic moduli onporosity for Middle–Late Jurassic sedimentary rocks (JS; Table 3): a) VP as a function of bulk density; b) VS as a function of bulk density;c) VP as a function of connected porosity; d) VS as a function of connected porosity; e) dynamic Young’s modulus (Ed) as a function of con-
nected porosity; f) Poisson’s ratio (), calculated from measured values of VP and VS, as a function of connected porosity. In parts (a) and(b), dry ultrasonic velocities are plotted against dry bulk densities, and wet ultrasonic velocities against wet bulk densities.
KVS (VPDryKVS of 1.6–6.2 km/s; VSDry
KVS of 1.0–3.5 km/s).
The ranges of all physical properties for MBp rocks are con-
sistently narrower than for KVS rocks, due to the
compositional and physical similarity of all the basement
rocks. However, the ranges of values for every measured
geophysical property of MBp rocks lie within the broader
ranges of properties of the KVS package. Geophysical
identification of MBp rocks in the subsurface thus requires
the use of all properties.
Jurassic sedimentary (JS) rocks are poorly distinguished
from the Jurassic volcanic and sedimentary (JVS) package,
but resistivity values may offer some potential. Although
there is overlap in resistivity values between JS and JVS,
resistivities of JS rocks (460–49 883 ��m) are consistently
higher than those of JVS rocks (46–12 338 ��m). The
ranges of all physical properties for MBp are consistently
narrower than those for JVS rocks but are fully enclosed by
the large ranges of the JVS package. It is recommended that
all the available properties be used when identifying MBp
rocks in the subsurface.
Both the JS and MBp packages represent lithologically
well-defined rock packages that populate distinct geophys-
ical-property ranges, which makes their distinction rela-
tively easy compared to other packages. Their ranges in re-
sistivity and seismic velocity have relatively little overlap
and are the most useful properties for discrimination. The
resistivity range for JS rocks is 460–49 883 ��m, which is
considerably higher than that for MBp (152–10 771 ��m).
Ultrasonic velocities also offer adequate discrimination be-
cause JS velocities (VPDryJS of 4.20–5.85 km/s; VSDry
JS of
2.45–3.39 km/s) are higher than those of MBp rocks
(VPDryMBp of 3.44–5.46 km/s; VSDry
MBp of 2.00–3.15 km/s).
Summary
The Nechako Basin represents one of the most challenging
areas for mineral and oil exploration in British Columbia.
The challenge is that the basin is likely to be underlain by
stratigraphically and structurally complex geology. This
complexity is exacerbated by the fact that the quality and
distribution of bedrock exposure is highly variable; overall,
the exposure is poor throughout the region. In addition,
only a limited amount of knowledge of the subsurface geol-
ogy has been derived from previous oil-exploration efforts.
These early oil-exploration efforts provided few drillholes
and geophysical surveys. However, the last decade has seen
a tremendous increase in new knowledge derived from
mapping (e.g., Riddell, 2006, 2011; Dohaney et al., 2010;
Andrews et al., 2011; Bordet and Hart, 2011) and multi-
146 Geoscience BC Summary of Activities 2011
Figure 12. Dependence of dry and wet ultrasonic velocities on bulk density and porosity, and dependence of dry and wet elastic moduli onporosity for Lower–Middle Jurassic volcanic and sedimentary rocks (JVS; Table 3): a) VP as a function of bulk density; b) VS as a function ofbulk density; c) VP as a function of connected porosity; d) VS as a function of connected porosity; e) dynamic Young’s modulus (Ed) as a
function of connected porosity; f) Poisson’s ratio (), calculated from measured values of VP and VS, as a function of connected porosity. Inparts (a) and (b), dry ultrasonic velocities are plotted against dry bulk densities, and wet ultrasonic velocities against wet bulk densities.
parameter geophysical surveys (e.g., Hayward and Calvert,
2011; Idowu et al., 2011; Spratt and Craven, 2011).
The range of possible geophysical responses from subsur-
face stratigraphic packages must be known in order to ex-
tract the maximum information from these large-scale
field-based geophysical campaigns. The project reported
here was a field-supported experimental program designed
to measure a broad range of physical and geophysical prop-
erties of rock samples representing the lithostratigraphic
diversity of the subsurface to the Nechako Basin. We sam-
pled more than 11 major formations or mappable strati-
graphic units (Table 1; Figure 2) across an area of
>50 000 km2 (Figure 2).
Measurements were taken of the physical (e.g., density, po-
rosity) and geophysical (e.g., chargeability, seismic veloc-
ity) properties of the sample suite, with the aim of providing
data that would facilitate interpretation of geophysical sur-
veys probing the Nechako Basin subsurface. The full range
of measurements included bulk density, porosity, magnetic
susceptibility, remanent magnetization, electrical resistiv-
ity, induced-polarization chargeability and seismic-wave
velocities. Ranges of values were then determined for each
Geoscience BC Report 2012-1 147
Figure 13. Dependence of dry and wet ultrasonic velocities on bulk density and porosity, and dependence of dry and wet elastic moduli onporosity for Mesozoic basement rocks (MBp; Table 3): a) VP as a function of bulk density; b) VS as a function of bulk density; c) VP as a func-tion of connected porosity; d) VS as a function of connected porosity; e) dynamic Young’s modulus (Ed) as a function of connected porosity;
f) Poisson’s ratio (), calculated from measured values of VP and VS, as a function of connected porosity. In parts (a) and (b), dry ultrasonicvelocities are plotted against dry bulk densities, and wet ultrasonic velocities against wet bulk densities.
Table 4. Decision table for discrimination of stratigraphic packages within the Nechako Basin on the basis of physical and geophysicalproperties.
of six lithostratigraphic packages created by combining
stratigraphic units on the basis of age, lithology and geogra-
phy. Our compilation culminated in a decision table that
summarizes the best opportunities for discriminating strati-
graphic packages within the subsurface. Some units are not
easily distinguished (e.g., Eocene and Cretaceous sedimen-
tary and volcanic rocks), but there is good potential for dis-
criminating between several important stratigraphic pack-
ages (Chilcotin basalts and Cretaceous sedimentary and
volcanic rocks). Henceforth, these data should be used in
the interpretation and reinterpretation of Nechako Basin
geophysical surveys, and correlated with new and existing
boreholes.
Acknowledgments
This study was supported by Geoscience BC project grant
2008-028 and Geological Survey of Canada contract
23254-096844-001-VAN, awarded to JKR. We thank
J. Riddell, B. Struik, M. Mihalynuk, K. MacLaurin and
P. Mustard for providing their archived samples. Sample
preparation at UBC was conducted by P. Van de Reep and
H. Dhillon. H. Linton and A. Tkachyk performed the lab
work at the Geological Survey of Canada. Figure 1 was cre-
ated by F. Ma of Geoscience BC. The authors thank
L. Porritt and S. Kolzenburg for peer review comments that
helped clarify the paper.
References
Andrews, G., Quane, S., Enkin, R.J., Russell, K., Kushnir, A., Ken-nedy, L., Hayward, N., and Heap, M. (2011): Rock physicalproperty measurements to aid geophysical surveys in theNechako Basin oil and gas region, central British Columbia;Geoscience BC, Report 2011-6, 40 p. and Excel
®database,
URL <http://www.geosciencebc.com/s/2011-06.asp>[November 2011].
Andrews, G.D.M., Plouffe, A., Ferbey, T., Russell, J.K., Brown,S.R. and Anderson, R.G. (2011): The thickness of Neogeneand Quaternary cover across the central Interior Plateau,British Columbia: analysis of water-well drill records andimplications for mineral exploration potential; CanadianJournal of Earth Sciences, v. 48, p. 973–986.
Andrews, G.D.M. and Russell, J.K. (2007): Mineral explorationpotential beneath the Chilcotin Group (NTS 092O, P, 093A,B, C, F, G, I, J, K), south-central British Columbia: prelimi-nary insights from volcanic facies analysis; in GeologicalFieldwork 2006, BC Ministry of Energy and Mines, Paper2007-1 and Geoscience BC, Report 2007-1, p. 229–238,URL <http://www.empr.gov.bc.ca/Mining/Geoscience/PublicationsCatalogue/Fieldwork/Documents/22-Andrews.pdf> [November 2011].
Andrews, G.D.M. and Russell, J.K. (2008): Cover thickness acrossthe southern Interior Plateau, British Columbia (NTS 092O,P; 093A, B, C, F): constraints from water-well records; inGeoscience BC Summary of Activities 2007, GeoscienceBC, Report 2008-1, p. 11–20, URL <http://www.geosciencebc.com/i/pdf/SummaryofActivities2007/SoA2007-Andrews_original.pdf> [November 2011].
Bordet, E. and Hart, C.J.R. (2011): Characterization and structuralframework of Eocene volcanic sequences in the Nechako re-gion, central British Columbia (NTS 092N, O, 093B, C, G);in Geoscience BC Summary of Activities 2010, GeoscienceBC, Report 2011-1, p. 239–254, URL <http://www.geosciencebc.com/i/pdf/SummaryofActivities2010/SoA2010_Bordet&Hart.pdf> [November 2011].
Calvert, A.J., Hayward, N., Smithyman, B.R. and TakhamTakougang E.M. (2009): Vibroseis survey acquisition in thecentral Nechako Basin, south-central British Columbia; inGeoscience BC Summary of Activities 2008, GeoscienceBC, Report 2009-1, p. 145–150, URL <http://www.geosciencebc.com/i/pdf/SummaryofActivities2008/SoA2008-Calvert_original.pdf> [November 2011].
Dohaney, J., Andrews, G.D.M., Russell, J.K. and Anderson, R.G.(2010): Distribution of the Chilcotin Group, Taseko Lakesand Bonaparte Lake map areas, British Columbia; Geologi-cal Survey of Canada, Open File 6344, URL <http://geopub.nrcan.gc.ca/moreinfo_e.php?id=261655> [Novem-ber 2011].
Ferri, F. and Riddell, J. (2006): The Nechako Basin project: newinsights from the southern Nechako Basin; in Summary ofActivities 2006, BC Ministry of Energy and Mines, pages89–124, URL <http://www.em.gov.bc.ca/subwebs/oilandgas/pub/reports.htm> [November 2011].
Hannigan, P., Lee, P.J., Osadetz, K.G., Dietrich, J.R. and Olsen-Heise, K. (1994): Oil and gas resource potential of theNechako-Chilcotin area of British Columbia; BC Ministryof Energy and Mines, Geofile 2001-6, 38 p. plus appendicesand maps, URL http://www.empr.gov.bc.ca/Mining/Geoscience/PublicationsCatalogue/GeoFiles/Pages/2001-6.aspx [November 2011].
Hayes, B.J. (2002): Petroleum exploration potential of theNechako Basin, British Columbia; BC Ministry of Energyand Mines, Petroleum Geology Special Paper 2002-3.
Hayward, N. and Calvert, A.J. (2009): Eocene and Neogene volca-nic rocks in the southeastern Nechako Basin, British Colum-bia: interpretation of the Canadian Hunter seismic reflectionsurveys using first-arrival tomography; Canadian Journal ofEarth Sciences, v. 46, p. 707–720.
Hayward, N. and Calvert, A.J. (2011): Interpretation of structuresin the southeastern Nechako Basin, British Columbia, fromseismic reflection, well log, and potential field data; Cana-dian Journal of Earth Sciences, v. 48, p. 1000–1020.
Idowu, O.A., Frederiksen, A.W. and Cassidy, J.F. (2011): Imagingthe Nechako Basin, British Columbia, using ambient seis-mic noise; Canadian Journal of Earth Sciences, v. 48, p.1038–1049.
Katsube, T.J. (2001): An analytical procedure for determiningspectral induced polarization characteristics of anisotropicrocks, Yellowknife mining district, Northwest Territories;Geological Survey of Canada, Current Research 2001-E3,2 9 p . , U R L < h t t p : / / g e o p u b . n r c a n . g c . c a / m o r einfo_e.php?id=212683> [November 2011].
Kim, H-S. (2010): Mapping crustal structure of the Nechako Basinusing teleseismic receiver functions; M.Sc. thesis, Univer-sity of Victoria, Victoria, BC, 112 p.
MacLaurin, C.I., Mahoney, J.B., James W. Haggart, J.W., Goodin,J.R. and Mustard, P.S. (2011): The Jackass Mountain Groupof south-central British Columbia: depositional setting andevolution of an Early Cretaceous deltaic complex; CanadianJ o u r n a l o f E a r t h S c i e n c e s , v. 4 8 , p . 9 3 0 – 9 5 1 ,doi:10.1139/e11-035
148 Geoscience BC Summary of Activities 2011
Mihalynuk, M.G., Orovan, E.A., Larocque, J.P., Friedman, R.M.and Bachiu, T. (2009): Geology, geochronology and miner-alization of the Chilanko Forks to southern Clusko Riverarea, west-central British Columbia (NTS 093C/01, 08,09S); in Geological Fieldwork 2008, BC Ministry of Energyand Mines, Paper 2009-1, p. 81–100, URL <http://www.empr.gov.bc.ca/Mining/Geoscience/PublicationsCatalogue/Fieldwork/Documents/08_Mihalynuk_2008.pdf>[November 2011].
Mira Geoscience (2008): Development and application of a rockproperty database for British Columbia; Geoscience BC,Report 2008-9, 66 p., URL <http://www.geosciencebc.com/s/2008-09.asp> [November 2011].
O’Connell, R.J. and Budiansky, B. (1974): Seismic velocities indry and saturated cracked solids; Journal of GeophysicalResearch, v. 79, p. 5412–5426.
Parsons, S., McGaughey, J., Mitchinson, D., Phillips, N. and Lane,T.E. (2009): Development and application of a rock propertydatabase for British Columbia; in Geoscience BC Summaryof Activities 2008, Geoscience BC, Report 2009-1, p. 137–144, URL <http://www.geosciencebc.com/i/pdf/SummaryofActivities2008/SoA2008-Parsons_original.pdf> [No-vember 2011].
Riddell, J.M. (2006): Geology of the southern Nechako Basin; BCMinistry of Energy and Mines, Oil and Gas Division, Petro-leum Geology Map 2006-1, scale 1:400 000.
Riddell, J.M. (2011): Lithostratigraphic and tectonic framework ofJurassic and Cretaceous Intermontane sedimentary basins ofsouth-central British Columbia; Canadian Journal of EarthSciences, v. 48, no. 6, p. 870–896, doi:10.1139/e11-034
Salisbury, M. and Iuliucci, R. (2011): Physical rock properties da-tabase; Geological Survey of Canada–Atlantic, URL<http://gdr.nrcan.gc.ca/rockprop/rock_e.php> [November2011].
Spratt, J. and Craven, J. (2011): Near-surface and crustal-scale im-ages of the Nechako basin, British Columbia, Canada, frommagnetotelluric investigations; Canadian Journal of EarthSciences, v. 48, p. 987–999.
Sumner, J.S. (1976): Principles of Induced Polarization for Geo-physical Exploration; Elsevier Scientific Publishing Com-pany, Amsterdam., The Netherlands, 277 p.
Telford, W.M., Geldart, L.P., Sheriff, R.E. and Keys, D.A. (1976):Applied Geophysics; Cambridge University Press, London,United Kingdom, 860 p.
Walsh, J.B. (1965): The effect of cracks on the compressibility ofrock; Journal of Geophysical Research, v. 70, p. 381–389.
Geoscience BC Report 2012-1 149
150 Geoscience BC Summary of Activities 2011


![Compaction, dilatancy, and failure in porous carbonate rockseost.unistra.fr/fileadmin/upload/EOST/Mike_Heap/... · tion [Sua´rez-Rivera et al., 1990], uniaxial strain [Brace and](https://img.pdfslide.us/doc/110x75/5fd9f3abec14dd3d7c54bb23/compaction-dilatancy-and-failure-in-porous-carbonate-tion-suarez-rivera-et.jpg)