Embed Size (px)
Citation preview

University of Northern Iowa University of Northern Iowa
UNI ScholarWorks UNI ScholarWorks
Dissertations and Theses @ UNI Student Work
7-2020
Grading and equity: Inflation/deflation based on race, gender, Grading and equity: Inflation/deflation based on race, gender,
socio-economic and disability statuses when homework and socio-economic and disability statuses when homework and
employability scores are included employability scores are included
Robert Thomas Griffin University of Northern Iowa
Let us know how access to this document benefits you
Copyright ©2020 Robert Thomas Griffin
Follow this and additional works at: https://scholarworks.uni.edu/etd
Part of the Disability and Equity in Education Commons
Recommended Citation Recommended Citation Griffin, Robert Thomas, "Grading and equity: Inflation/deflation based on race, gender, socio-economic and disability statuses when homework and employability scores are included" (2020). Dissertations and Theses @ UNI. 1045. https://scholarworks.uni.edu/etd/1045
This Open Access Dissertation is brought to you for free and open access by the Student Work at UNI ScholarWorks. It has been accepted for inclusion in Dissertations and Theses @ UNI by an authorized administrator of UNI ScholarWorks. For more information, please contact [email protected].

Copyright by
ROBERT GRIFFIN
2020
All Rights Reserved

GRADING AND EQUITY: INFLATION/DEFLATION BASED ON RACE, GENDER,
SOCIO-ECONOMIC AND DISABILITY STATUSES WHEN HOMEWORK
AND EMPLOYABILITY SCORES ARE INCLUDED
An Abstract of a Dissertation
Submitted
in Partial Fulfillment
of the Requirements for the Degree
Doctor of Education
Approved:
Dr. Timothy Gilson, Co-Chair
Dr. Matt Townsley, Co-Chair
Dr. Jennifer Waldron, Dean of Grad College
Robert Thomas Griffin
University of Northern Iowa
July 2020

ABSTRACT
Purpose of Study
The purpose of this research was to gain an understanding if traditional high
school grading practices provide equitable outcomes for students particularly when
homework and employability points based on participation, behavior, and attendance are
included in the grading structures. With a strong movement of schools starting to use
standards-based grading practices one of the purposes of this study is to learn how
traditional grading practices potentially contribute to our equity concerns in society.
Furthermore, this study illustrates how standardized grading practices, focusing strictly
on student achievement may or may not provide more equitable grading outcomes for
students of differing race, disability status, and socio-economic status (SES) when
compared to the traditional grading system.
Methodology
During the 15-16 school year, “Diversity High” School’s math teachers uniformly
separated their grade books into the following categories: “Assessments,” “Homework,”
and “Employability.” To conduct this study, 795-semester grades for math classes during
the 15-16 school year were charted documenting each student’s final grade percentages,
employability percent, and homework percent. Test/Quiz grades were compared to the
final grade in the course to see if, and by how much, student’s grades were inflated or
deflated due to including homework and employability scores (participation, attendance,
behavior) in the grade. Each participant’s race, gender, SES (free and reduced lunch) and
disability statuses (IEP/504) were also be documented to allow for subgroup equity

comparisons to see if some subgroups are more likely than others to benefit from
traditional grading structures that include homework and employability points.
Findings
The most extreme cases in this study had their grades deflated by 18.26% and inflated
by 18.95% respectfully. 479 students (61.5%) had inflated grades when homework and
employability points were included in the grade. 299 students (38.4%) had deflated
grades and only 1 student’s grade remained unchanged. 336 (43.2 percent) students in this
study had their grades inflated or deflated by 5% or more and 97 (12.6%) students in this
study had their grades inflated or deflated by 10% or more which is equivalent to moving
up or down a full letter grade. This study also found there were significant differences
between subgroups mean scores in the areas of homework and employability.
GRADING AND EQUITY: INFLATION/DEFLATION BASED ON RACE, GENDER,
SOCIO-ECONOMIC AND DISABILITY STATUSES WHEN HOMEWORK
AND EMPLOYABILITY SCORES ARE INCLUDED
A Dissertation
Submitted
in Partial Fulfillment
of the Requirements for the Degree
Doctor of Education
Approved:
Dr. Timothy Gilson, Co-Chair
Dr. Matt Townsley, Co-Chair
Dr. Robert Boody, Committee Member
Dr. Todd Evans, Committee Member
Robert Thomas Griffin
University of Northern Iowa
July 2020

ii
Acknowledgements
I cannot express enough thanks to my committee for their continued support and
encouragement through this project. Thank you to the best co-committee chairs, Dr.
Timothy Gilson and Dr. Matthew Townsley as well as my other committee members Dr.
Robert Boody and Dr. Todd Evans. I offer my sincere appreciation for the learning
opportunities provided by my committee.
My completion of this degree could not have been accomplished without the
support of my encouraging and supportive wife, Marina, to who I give my deepest
gratitude. Your encouragement and listening ear were appreciated when things got
stressful. It was a great comfort to know that you were in the same boat working on your
own Doctors degree. I give my heartfelt thanks for encouraging me to pursue this degree
and your patience and support throughout this process.

iii
TABLE OF CONTENTS
PAGE
LIST OF TABLES ............................................................................................................. vi
LIST OF FIGURES .......................................................................................................... vii
CHAPTER 1 INTRODUCTION ........................................................................................ 1
Overview ....................................................................................................................... 1
Statement of the Problem .............................................................................................. 4
Purpose of the Study ..................................................................................................... 7
Research Questions ....................................................................................................... 7
Significance of the Study .............................................................................................. 8
Preview of the Study ..................................................................................................... 9
Delimitations ............................................................................................................... 10
Limitations .................................................................................................................. 11
Assumptions ................................................................................................................ 11
Definitions................................................................................................................... 12
Organization of the Study ........................................................................................... 14
CHAPTER 2 LITERATURE REVIEW ........................................................................... 16
Overview ..................................................................................................................... 16
History of Grades and Traditional Grading Practices ................................................. 17
Purpose of Grades ....................................................................................................... 19
Traditional Grading and Subjectivity .......................................................................... 20
Standards-Based Grading............................................................................................ 21
Theoretical Foundation ............................................................................................... 23

iv
Cultural Reproduction Theory .............................................................................. 23
Cultural Capital and Grading Practices................................................................. 25
Educational Inequalities .............................................................................................. 30
Gender Inequalities ............................................................................................... 30
Inequities in Student Discipline ............................................................................ 31
Inequities in Student Attendance .......................................................................... 35
Teacher Effects on Student Outcomes ........................................................................ 39
Parent/Family Effects on Student Outcomes .............................................................. 40
Summary ..................................................................................................................... 41
CHAPTER 3 METHODOLOGY ..................................................................................... 44
Purpose of the Study ................................................................................................... 44
Research Questions: .................................................................................................... 44
Research Design.......................................................................................................... 46
Setting and Participants............................................................................................... 47
Data Collection ........................................................................................................... 48
Data Analysis .............................................................................................................. 49
Summary ..................................................................................................................... 52
CHAPTER 4 FINDINGS ................................................................................................. 53
Research Design.......................................................................................................... 53
Participants .................................................................................................................. 54
Data Collection Review .............................................................................................. 55
Research Questions and Findings ............................................................................... 56
Inflation and Deflation of Grades ......................................................................... 56
Equity Impact on Grades ...................................................................................... 62

v
Summary ..................................................................................................................... 71
CHAPTER 5 SUMMARY, DISCUSSION, AND CONCLUSIONS .............................. 72
Summary of Findings .................................................................................................. 72
Research Question #1: Grading Inflation/Deflation ............................................. 72
Research Question #2: Equity Impact on Grades ................................................. 75
Discussion ................................................................................................................... 77
Research Question #1: Grading Inflation/Deflation ............................................. 77
Research Question #2: Equity Impact on Grades ................................................. 82
Conclusions ................................................................................................................. 88
Limitations of this Study ....................................................................................... 88
Future Research .................................................................................................... 89
Summary ............................................................................................................... 90
REFERENCES ................................................................................................................. 92
APPENDIX A CHARTED GRADES .............................................................................. 98
APPENDIX B TUKEY POST HOC RACE COMPARISONS ..................................... 114
APPENDIX C CORRELATION BETWEEN ASSESSMENTS, HOMEWORK, AND
EMPLOYABILITY SCORES ........................................................................................ 117

vi
LIST OF TABLES
PAGE
Table 1. Percent of U.S 10th Graders Experiencing School Discipline by Race, Ethnicity,
and Gender (2001-2005 data combined). ......................................................................... 33
Table 2. Percent of Students with 15 or More Days Absent During the 13-14 School Year
by Race .............................................................................................................................. 37
Table 3. Percent of K-12 Students with 15 or More Days Absent During the 13-14 School
Year by Disability Status ................................................................................................... 37
Table 4. Percent of K-12 Students with 15 or More Days Absent During the 13-14 School
Year by Gender ................................................................................................................. 38
Table 5. Participants by SES, Disability Status and Gender ............................................ 54
Table 6. Participants by Race ........................................................................................... 55
Table 7. Paired Samples T-Test Results Comparing Assessment and Overall Percent ... 57
Table 8. Independent T-Test Results Comparing Students with and without Disabilities 64
Table 9. Independent T-Test Results Comparing Students Based on SES ........................ 65
Table 10. Independent T-Test Results Comparing Students Based on Gender ................ 66
Table 11. Test Between Subjects Effects for Race ............................................................ 68
Table 12. Tukey Post-Hoc Test Comparisons for Race .................................................... 69
Table 13. Results Comparing Students Based on Race .................................................... 70
Table 14. Results Comparing Students Based on Disability, SES & Gender ................... 75

vii
LIST OF FIGURES
PAGE
Figure 1. High School and Post-Secondary Outcomes by Number of 9th Grade
Suspensions ....................................................................................................................... 34
Figure 2. Example of Grades Charted .............................................................................. 47
Figure 3. 2015-2016 Diversity High School Student Demographics ............................... 48
Figure 4. Student 697 with the Most Deflated Grade ....................................................... 58
Figure 5. Inflation/Deflation of Grade .............................................................................. 59
Figure 6. Students with Failing Overall Grades and Passing Assessment Grade ............ 60
Figure 7. Students with Failed Assessment Percentage and Passing Overall Grade........ 61
Figure 8. Grading Comparison. ........................................................................................ 74

1
CHAPTER 1
INTRODUCTION
Overview
Gaining a quality education is an extremely powerful tool as education creates
opportunities. Education affects everyone around us. It is called the “neighborhood
effect” in which more opportunities are created for the whole community because
educated individuals tend to have better-paying jobs and therefore more money to spend
which will get pumped back into the community (Cooper, Fusarelli, & Randall, 2004).
When individuals fail to graduate from high school, they cost society more
money. Uneducated individuals frequently need more government assistance because
they are not able to obtain high paying jobs sufficient to support their families.
Students do not graduate high school when they fail to earn passing grades in their
classes and earn credits. Grades are of critical importance for students because they hold
so much power. Grades define student achievement and drive educators ’decisions such
as when to provide supports, academic awards, graduation diplomas, and advanced
course placements (Feldman, 2018). Grades also help determine athletic or
extracurricular eligibility, employment/work permits/insurance rates, college acceptance,
scholarships, and financial aid assistance.
With a grade holding so much power one would think that it is clearly objective,
meaning it directly aligns with a student’s skill and or knowledge level within an
academic subject. However, in many instances within the traditional grading model, this
is not the case. Brookhart (2004) and Reeves (2008) found grading practices between

2
teachers to be very different. Even the same courses taught within one school with
different teachers result in differing criteria used for providing student grades (McMillan,
2001). In some cases, grading variances are large enough to be the difference between
failing a course and making the honor roll depending on the teacher’s personal grading
policies (Reeves, 2008).
Starch and Elliott (1912, 1913) studied the reliability of grades using a series of
studies looking closer at the subjects of English and Math. In one study, Starch and
Elliott asked English teachers from about 200 different high schools to grade the same
papers using a 100 point scale. After the papers were graded the authors found an
extreme range of scores for the same writings. For example, one English paper differed
by about 40 points between the evaluator's scores. In a follow-up study conducted by
Starch and Elliott (1913) they found Geometry scores ranging from 28-95 percent when
assignments were graded by different teachers. These researchers had repeated their
previous study because some thought writing was subjective by nature and therefore math
would result in fewer differences between teachers.
With grades holding such powerful significance one might ask what is the
purpose of grades? Most would agree that grading is used as a way of communication
(Brookhart, 2004). Grades communicate with parents, students, families, and other
stakeholders how the student is doing in school. A number of experts agree grades should
reflect the student’s learning of the content (Guskey & Jung, 2009; Marzano &
Heflebower, 2011; O’Connor, 2009; Wormeli, 2011). Marzano (2000) and O’Connor
(2009) state that the most effective grading practices provide feedback to help student's

3
academic performance. This feedback must be accurate and specific for students to learn
and improve their knowledge and academic skills.
Ultimately, a teacher’s grading system directly impacts whether or not students
pass classes and earn credits to graduate. Grading varies from teacher to teacher because
these educators ultimately decide what is included in their class grades based on their
own philosophies of grading. Teachers decide what to include in a grade such as
assessments, homework, effort, behavior, extra credit, and how much to weigh each of
these categories. Teachers get the final say about how many points to attach to each
assignment and even the criteria in which assignments are graded.
Students should earn the grades they get in these courses based on their
demonstration of mastery in specific academic content; however, grades do not always
accurately reflect the student's academic skills which showcase what they know or are
able to do as a result of the learning from the course. Many teachers give points/grades
for homework and employability skills (participation, attendance, behavior) that impact a
student's grades both positively and negatively (Guskey, 2009; McMillan, 2001). Reeves
(2008) found a common reason students fail within traditional grading systems include
getting zeros for missing homework or poor performance on a major assignment such as
a project or large term papers. As a result of these additional components included in the
grade, the grade may not be a true representation of the student's academic content
knowledge and is a common cause for students not passing classes and thus failing to
earn credits towards graduation.

4
Grades can be misleading for parents, post-secondary institutions, and even fellow
teachers. Parents may think their student is doing well academically when indeed they are
not. On the other hand, the student may have a low grade in spite of demonstrating a high
level of course content knowledge. Often post-secondary institutions use grades to make
decisions on college acceptance, and if the grade is not a good indication of a student’s
actual skill or knowledge of content, grades may be misleading. Many schools use
structures such as Multi-Tiered Systems of Supports (MTSS) to provide interventions for
students that need more support in learning core content. If students struggle to
understand the content during their core instruction (tier 1) they may be referred to a tier
2 teacher to assist the student with re-teaching concepts so they can better understand the
content. Unfortunately, many times grades are used as an indicator of needing such
support. For example, if a student is failing a class it may be seen that they need help
learning the content, whereas they may just have a lower grade because of their failure to
complete the homework, attend class regularly or show acceptable behavior during
instruction because all these components may be included in the overall grade.
Statement of the Problem
A student’s grade should be a direct reflection of the student’s skill and academic
knowledge in the subject matter (Linn & Miller, 2005; Marzano & Heflebower, 2011).
For example, students should get an “A” for “A” quality work. However, this is not
always the case due to inflation or deflation of the overall grade based on traditional
grading practices in which teachers include points for a student’s employability skills,
homework, engagement, attendance, positive behavior, and even extra credit.

5
Traditional grades are shared as a single percent and letter which become part of a
student’s identity in which they are judged within society (Schneider & Hutt, 2014). For
example, a student might be referred to as “A student” or a “C student.” This creates
concern as single letter grades have significant impacts on the student's future (Burke,
1968). The worst part is very few teachers receive formal training within their teacher
preparation course work on how to grade or report such grades (Guskey, 2009). As a
result, traditional grading practices vary greatly between teachers and have been proven
to be highly subjective (Brookhart, 2004; Guskey, 1994; Reeves, 2008; Starch & Elliott,
1912, 1913). Many other experts suggest grading practices include subjective grading
categories such as "Employability;" which gives students points based on teachers
perceptions of effort, behavior, and participation that impact a student's grade both
positively and negatively (DiMaggio, 1982; Jussim, 1991; Keith et al., 1998; Roscigno &
Ainsworth-Darnell, 1999). This leads one to question how accurately the final course
grade showcases the student’s mastery of academic content in the subject.
Based on history, some subgroups have more obstacles or barriers to navigate to
become successful. Some individuals have a clearer path to success based on factors such
as social networks, race, gender and socio-economic (SES) reasons to name a few. These
factors influence students and give them more or fewer opportunities to move ahead.
Students from all backgrounds should have equal opportunities for educational success;
unfortunately, this is not the case as individuals come from many backgrounds and it is
clear that education tends to favor those in social networks with higher levels of
economic capital (Bourdieu & Passeron, 1977).

6
Stebbins and Comen (2018) wrote a USA Today article describing the worst cities
for racial disparities when comparing black and white Americans. Inequities among
whites and blacks such as household income, unemployment rates, and homeownership
rates were compared in their study. The USA Today’s list for worst metro areas for black
Americans includes the city of “Diversity High School” (pseudonym), which is where
this research for “Grading and Equity” will be conducted! Stebbins and Comen’s
findings showed black American median incomes ($25,897) were 46.8 percent less than
whites in the most discrepant metro areas. In addition, 73.2 percent of whites owned
homes compared to only 32.8 percent of blacks within these cities. Finally, blacks were
unemployed at a much higher rate (23.9%) compared to whites (4.4%). All these
discrepancies show that racial inequities are still prominent in today’s culture, and
schools are suggested within the article as one of the possible foundations for these
continued inequities.
Data collected by the U.S Department of Education (1994) based on a national
sample of 8th grade students found the “B” student in the schools with the highest poverty
concentrations received about the same test scores as the students who received D’s or
less in more affluent schools. This study also found the “C” students in the poorest
schools received similar test scores as students getting failing grades from the more
advantaged schools. In a similar study, Cross (1997) gave students from high and low
poverty schools a standardized exam. He found “A” students from the poor schools
scored at about the same range as C- or D+ level students from the schools with low
poverty levels. Both of these studies show how grading is highly subjective and how

7
schools with lower SES have grades that are more inflated when compared to schools of
higher SES.
Purpose of the Study
Educational scholars must be open-minded and seek to understand the systems
and histories of society which may favor some groups while others may have more
obstacles or barriers to navigate. Some individuals have a clearer path to success based
on numerous factors such as social networks, race, gender and economic reasons to name
a few. The purpose of this research is to learn if traditional high school grading practices
provide equitable outcomes for students, particularly when homework and employability
points based on participation, behavior, and attendance are included in the grading
structures. With a strong movement of schools starting to use standards-based grading
practices one of the purposes of this study is to learn how traditional grading practices
potentially contribute to our equity concerns in society. Furthermore, this study will
illustrate how grading practices, such as standards-based grading, focusing strictly on
student achievement, may or may not provide more equitable grading outcomes for
students of color, disability, and low SES as compared to the traditional grading system.
Research Questions
The following research questions will be used to guide this study.
1. How does including employability and homework scores within the traditional
grading model inflate or deflate grades?
2. Does including these traditional grading components produce equitable grading
outcomes for students based on race, gender, SES, and disability status?

8
Significance of the Study
Grading is a well-accepted part of the schooling process as it is used in hundreds
of thousands of schools all across the United States (Schneider & Hutt, 2014). There are
still many teachers including grading factors beyond the mastery of the standards such as
effort, participation, behavior, attendance, and homework (Guskey, 2009; Marzano &
Heflebower, 2011; McMillan, 2001; Reeves, 2008). This study could potentially add
another piece of evidence to help teachers make grading decisions that may produce more
equitable outcomes for students. This study is significant due to the strong movement
towards standards-based grading across the country (Iamarino, 2014). As a result of this
study, teachers and administrators may see how current traditional grading methods
including factors such as homework, participation, and attendance inflate or deflate
grades compared to just reporting student’s knowledge of the content taught in the
course. In addition, this study is unique due to the fact that it looks at the impact these
traditional grading practices have based on a student’s race, gender, SES, and disability
statuses. The data from this research will help teachers and administration reflect on
grading methods and perhaps identify parts of the grading practices that support all
students and what practices might need to be adjusted to provide more equitable
outcomes. Finally, as a result of this study, schools across the country may want to do
similar studies to see if their current grading practices of including homework,
participation and attendance points are inflating/deflating grades and if they are providing
students equal opportunities to succeed.

9
Preview of the Study
Many see education as a way to obtain good jobs and move up in society;
however, Bourdieu and Passeron (1977) argued that schools do not always achieve the
ultimate goal of providing equal opportunities for individuals to be successful. Through
this study, the researcher will explore barriers such as grading inequalities that may
prevent individuals from having equal opportunities for success. This research project
will focus on race and disability at the high school level within a diverse urban school
district and will explore how removing homework and employability points might create
a more equitable approach to grading. Through this project, the researcher will explore
how these grading practices impact those of different races, genders, SES, and
individuals with disabilities. As a result of this study, one will have a better
understanding whether or not grading practices including non-academic factors
(attendance, behavior, participation, effort) are inflating or deflating student's final grades
and if current overall grades are a direct reflection of the student's knowledge of the
subject matter.
To conduct this study, about 800 semester grades for math classes will be
evaluated. During the 2015-2016 school year, as a way of forming consistency for
grading, Diversity High School’s math teachers uniformly separated their traditional
grade books into the following categories: “Assessments,” “Homework,” and
“Employability.” This consistency in the grading setup allows the researcher to analyze
all student grades (about 800) in the area of math. The grades will be charted by writing
down each student’s final grade percentages, employability percent, and homework

10
percent. Each participant’s race, gender, SES and disability statuses will also be
documented to allow for subgroup comparisons. SES will be recorded using student’s
free and reduced lunch eligibility which is based on family income, and disability statuses
will be documented based on if the individual has an Individualized Educational Plan
(IEP) or a 504 plan. Assessment grades will be compared to the final grade in the course
to see if, and by how much, student’s grades were inflated or deflated due to including
homework and employability scores (participation, attendance, homework) in the grade.
Furthermore, the inflation and/or deflation of each student's grades will be compared
based on race, gender, and SES and disability statuses to see if some subgroups are more
likely than others to benefit from traditional grading structures that include homework
and employability points.
Delimitations
The findings from this study may not be generalizable to other schools or even
departments (ie. Science, Social Studies, English, etc.) beyond the high school in which
the data were collected. However, Diversity High School’s math department may be able
to use this data to examine their grading practices and its impact on equitable outcomes
for these math teachers. This school may even repeat this study within other departments
to reflect on grading and equity. Additionally, the data sample from this study will not
include students from rural settings as it only includes students attending one urban high
school which may make it harder to generalize the results.

11
Limitations
Limitations of this study include the subjectivity of the grading practices of
teachers. Each teacher may use their own discretion of how they award points even
though the grading categories within this math department are the same (Homework,
Employability, Assessments). Another limitation of this study would be the quiz score
accuracy. A student can get a zero for an assessment because they were absent and didn’t
make it up. This skews the overall assessment percent and would not be a good reflection
of the student’s skill level. While this study allows for hypotheses to be made on how
students might fare using a standards-based grading system that focuses on summative
content knowledge, it is not that simple. There are many components to the standards-
based grading system beyond taking out grades for effort, homework, attendance, and
behavior. For example, there are unknown standards-based grading components such as
allowing students to reassess, which therefore makes comparisons between traditional
and standards-based grading challenging.
Assumptions
One assumption the researcher is making within this study is that the recorded
assessment (test/quiz) scores are summative assessments which are strong reflections of
the student’s knowledge of the academic content. The assessments such as tests/quizzes
are assumed to cover academic standards covering the course content. The researcher
also assumes these assessment scores are the purest indicators available to know the
student’s knowledge of the content given the traditional grading model being used by the
teachers involved in this study.

12
Definitions
Traditional Grading Practices according to Marzano and Heflebower (2011) are
“when students acquire points for various activities, assignments, and behaviors, which
accrue throughout a grading period. The teacher adds up the points and assigns a letter
grade” (p. 34). In the traditional grading system, these points are then often put into
categories such as homework, tests/quizzes, projects, and participation (Feldman, 2018).
In a traditional grade book, the total of all the points is either 100 points or calculated into
a percentage based on the total points earned divided by the points possible which allows
teachers to give A-F letter grades based on points earned. There are many varieties of
how a teacher sets up a grade book in traditional grading systems as teachers choose
values each assignment is worth and how much to weight each category.
Standards-based Grading Practices are performed when the teacher reports
students’ progress based on their performance on individual content standards
(Brookhart, 2004). The final score for each standard is determined once students have
been given multiple opportunities to demonstrate their learning over time (O’Connor,
2002). According to Benson (2008), “In standards-based schools, grades are replaced
with, or augmented by, achievement reports that indicate levels of performance on
essential benchmarks” (p. 35). Failure to complete work in a standards-based system
does not result in a “zero” like the traditional grading, but rather the student is expected
to complete missing work (Reeves, 2008; Wormeli, 2011) because assigning zeros in the
grade book doesn’t accurately showcase what was learned (Guskey, 1994). Teachers
following standards-based grading practices allow students to retake tests/quizzes or re-

13
do assignments until they show they are proficient in the content knowledge (Marzano &
Heflebower, 2011; O’Connor, 2009; Wormeli, 2011). Using the standards-based grading
system teachers may assess other learning variables other than mastery of the content;
however, factors such as participation, homework, attitude, and effort are not included in
the overall grade (Brookhart, 2004; Marzano & Heflebower, 2011).
Academic Content Knowledge is a common phrase used by the researcher when
referring to a student’s understanding of content standards. For example, a student may
have a high level of understanding of right triangle trigonometry. Academic content
knowledge is communicated purely when academic skills are separate from non-
academic skills such as homework, effort, participation, attendance, and behavior.
Employability points within this study are defined as points given to students as
part of their grades that reflect 21st-century skills demonstrated within the classroom
environment. This includes participation in classwork such as doing the warm-ups or
participating in other class activities. Employability points are also awarded to students
for showing up to class and being on time. Teachers also give employability points for
being socially responsible such as not being disrespectful to classroom teachers or peers.
Teachers within this study gave students 3-10 employability points each day based on
their participation level in the class activities (Example: warm-up), attendance/tardies,
and their level of social responsibility (not disruptive or disrespectful to staff or peers)
during class time.
Grade Inflation, according to Zlomek and Svec (1997), is defined as an increase
in grades without a simultaneous increase in achievement. Simply put the grade is higher

14
than the students actual level of learning. An example of this from this study would be a
student that would get a grade of a C based only on academic content knowledge
indicated by assessment scores; however, he/she gets an overall grade of a C+ or higher
because of the homework and employability points inflated the grade.
Grade Deflation as defined for this research is just the opposite of “Grade
Inflation.” Grade Deflation is when a student’s overall grade is lowered based on the
inclusion of homework and employability points. For example, a student that would get a
grade of an A based on academic content knowledge indicated by assessment scores only
gets an overall grade of an A- or lower because the homework and employability points
did not reach A quality, therefore, deflating the final course grade.
Organization of the Study
This dissertation is organized into five chapters. Chapter One, the introduction
includes the overview, statement of the problem, purpose of the study, significance of the
study, preview of the study, delimitations, limitations, assumptions, and definitions.
Chapter Two, the literature review includes an overview, history of grades and traditional
grading practices, purpose of grades, traditional grading and subjectivity, standards-based
grading, theoretical foundation, cultural capital and grading practices, educational
inequities, teacher effects on student outcomes, parent/family effects on student
outcomes, and a summary of literature review findings. Next, Chapter Three, the
Methodology section will include the purpose of the study, research questions, research
design, setting and participants, data collection methods, data analysis, and a proposed
time frame for the research. Then, in Chapter 4, the researcher will review the research

15
design, participants and data collection followed by findings of organized by research
questions and a summary of the findings. Finally, Chapter 5 includes a summary of the
findings, discussion of results, future research, as well as conclusions and implications
based on this research.

16
CHAPTER 2
LITERATURE REVIEW
Overview
The purpose of this research literature review is to detail findings as they relate to
potential inequalities within educational grading practices for individuals based on their
race, gender, SES and those with disabilities. The following sections will explore
previous research findings on grading and equity. First, the literature review will outline
a brief history of grading practices as they are known today. Next, the review will
synthesize studies conducted on traditional grading practices and subjectivity as well as
the purpose of grades. This review will explore the theoretical framework of this study.
The researcher will then review inequalities between race, genders, SES and those with
disabilities in terms of employability skills, specifically related to school attendance and
behavior. At this point, the review will take an in-depth look at research on these topics
as they relate to education and grading practices. In the final section, a summary of the
review with key findings will be shared with hypotheses on how these findings may
impact this research on traditional grading practices.
One might be surprised by the amount of research that has been written on
grading. A quick literature review search on “grading” using Google Scholar found nearly
3 million related articles. Warren Middleton (1933) described his work on revising his
school's grading and reporting system in the 1930s as a daunting task.
The Committee on Grading was called upon to study grading procedures. At first,
the task of investigating the literature seemed to be a rather hopeless one. What a
mass and a mess it all was! Could order be brought to such chaos? Could points of

17
agreement among American educators concerning the perplexing grading problem
actually be discovered? (p. 5)
This sounds familiar to teachers, researchers, and educational leaders doing this same
work over 100 years later! Society is still debating the best ways to grade and report
student achievement.
History of Grades and Traditional Grading Practices
To fully understand and appreciate the complexity of grades it is helpful to
explore the evolution of the grading practices over the past few centuries. Before 1850, in
the United States, few students went to school past the elementary school, and learning
was shared by the teacher orally with little need for formal report cards or complex
grading systems (Schneider & Hutt, 2014). Schools consisted of students of all ages
grouped together in a one-room schoolhouse taught by one teacher (Guskey & Bailey,
2001).
Later in the 19th and 20th centuries grading systems were created to be an
efficient way to sort students. K-12 student enrollments tripled in size between 1870 and
1910 as a result of child labor laws and compulsory education laws (students must attend
school until age 16) which meant changes to grading were needed (Schneider & Hutt,
2014). Historians hypothesize the growth of grading systems in the early 1900s was due
to a “social efficiency movement” in American schools. Teachers needed a more efficient
system to share grading progress with parents, students and even other teachers within the
schools. Furthermore, there was a need for a systematic way of tracking student’s
academic progress as they moved from grammar schools to high schools and on to
colleges.

18
A few universities such as Harvard were the first to use a 100 point scale in their
grading structure (Smallwood, 1935). Harvard used this scale to divide grades into
divisions such as division one (90-100 points), division two (75-89 points) and so on.
These categories later evolved into summa cum laude and magna cum laude. Eventually,
these divisions were broken down into letter grades such as the A-F scheme commonly
seen today.
The A-F grading system was not a standard practice in the 1940s; however, it was
a dominant grading structure (Schneider & Hutt, 2014). Shortly thereafter the A-F system
was fused with other common grading practices such as the 4.0 scale and the 100 percent
system. Feldman (2018) described the letter grading system (A-F) as a structure for
sorting students quickly. It was believed that individuals were born with a fixed academic
capacity and each person fit somewhere on a continuum of expertise and therefore the
bell curve was widely used. By the 1960s, the A-F system was being called a
“traditional” practice (Burke, 1968). According to a National Education Association
Survey (1971) letter grades were in use in over 80% of schools. As of 1998 traditional
grading practices such as A-F or percent systems were being used in 92.2 percent of
secondary schools (Camara, 1998). Finally, most recently there has been grading reform
movement steering educators away from traditional grading components such as the
inclusion of non-academic factors and moving towards a standards-based approach to
grading (Iamarino, 2014).

19
Purpose of Grades
With so much riding on grades such as scholarship money and college
admittance, one might ask what is the purpose of grades? Most would agree that grading
is used as a way of communication (Brookhart, (2004). Grades communicate with
parents, students, families, and other stakeholders how the student is doing in school.
Experts agree grades should reflect the student’s learning of the content (Guskey & Jung,
2009; Marzano & Heflebower, 2011; O’Connor, 2009; Wormeli, 2011). Marzano (2000)
and O’Connor (2009) state that the most effective grading practices provide feedback to
help student's academic performance. This feedback must be accurate and specific for
students to learn and improve their knowledge and academic skills.
Guskey (2009) conducted a study with 600 K-12 teachers and found elementary
teachers focused mostly on using grades as a means to communicate with parents.
Furthermore, he found elementary teachers separated academic achievement and
behaviors for the most part when assigning student grades. Guskey found secondary
teachers were more focused on giving grades that helped individuals prepare for college
or real-life experiences. As a result, secondary teachers were more likely to include
behavior and effort within the grade. Grades should be fair, equitable and useful to
students, parents, and teachers as they are key in communicating student learning. To do
so, grades should be based on achievement of learning goals (Bailey & McTighe, 1996;
Brookhart, 2004; Guskey, 1994) and primarily determined by summative assessments
with behaviors reported separately from the final grades (O’Connor, 2009).

20
Traditional Grading and Subjectivity
Researchers have found grading practices between teachers vary significantly
(Brookhart, 2004; Guskey & Link, 2019; Reeves (2008). Even courses that are taught
within the same school by different teachers can produce very different grades based on
the criteria used for grading (McMillan, 2001). In some cases, the difference between
failing a class and making the honor roll simply depended on the teacher’s grading
policies (Reeves, 2008).
Several researchers suggest teachers include subjective grading categories such as
"Employability Points,” which gives students points based on teacher’s perceptions of
effort, behavior, and participation that impact a student's grade both positively and
negatively (DiMaggio, 1982; Jussim, 1991; Keith et al., 1998; Roscigno & Ainsworth-
Darnell, 1999). Stiggins et al. (1989) stated, “Most teachers would agree that grades
should be based on achievement; however not all would agree that grades should be
based on achievement alone” (as cited by Brookhart, 2004, p. 115).
Starch and Elliott (1912) explored the reliability of grades using a series of studies
in 1912 and 1913 looking closer at the subjects of English and Math. In one study, Starch
and Elliott asked English teachers from about 200 different high schools to grade the
same papers. Teachers graded the papers using a 100 point scale. After the writings were
graded the authors found an extreme range of scores for the same paper. For example,
one English paper differed by about 40 points between scores. In a follow-up study
conducted by Starch and Elliott (1913) they found Geometry scores ranging from 28-95
percent when assignments were graded by different educators. These researchers had

21
repeated their previous study because some thought writing was subjective by nature and
therefore math would result in fewer differences between teachers.
Standards-Based Grading
There has been a recent reform movement for many schools moving away from
traditional grading towards standards-based grading practices. According to Benson
(2008), “In standards-based schools, grades are replaced with, or augmented by,
achievement reports that indicate levels of performance on essential benchmarks” (p.
35). Failure to complete work in a standards-based system does not result in a “zero” like
the traditional grading, but rather the student is expected to complete missing work
(Reeves, 2008; Wormeli, 2011) because assigning zeros in the grade book doesn’t
accurately showcase what was learned (Guskey, 1994). Teachers following standards-
based grading practices allow students to retake assessments or re-do assignments until
they show they are proficient in the content knowledge (Marzano & Heflebower, 2011;
O’Connor, 2009; Wormeli, 2011).
When students work through the standards-based grading system, letter grades
reflect the extent to which students have achieved the learning outcomes (Linn & Miller,
2005; Marzano & Heflebower, 2011). When this process is done with fidelity grades are
assigned to reflect student’s content knowledge which allows teachers to compare the
knowledge and skills obtained by the students (Randall & Engelhard, 2010). Teachers
following the standards-based grading practices are focused on the students' mastery of
the content. A teacher may assess other learning variables other than mastery of the

22
content; however, factors such as participation, attitude, and effort are not included in the
overall grade (Brookhart, 2004; Marzano & Heflebower, 2011).
One reason schools are switching to standards-based grading is to address
potential inequities created by grading practices. Data collected by the U.S Department of
Education (1994) based on a national sample of 8th grades students found the “B” student
in the schools with the highest poverty concentrations received about the same test scores
as the students who received D’s or less in more affluent schools. This study also found
the “C” students in the poorest schools received similar test scores as students getting
failing grades from the more advantaged schools. In a similar study, conducted by Cross
(1997) students from high and low poverty schools were given a standardized exam. He
found “A” students from the poor schools scored at about the same range as C- or D+
level students from the schools with low poverty levels. Both of these studies show how
grading is highly subjective and how schools with lower SES have grades that are more
inflated when compared to schools of higher SES.
Subjectivity in grading is difficult to overcome and allows teachers to use biased
judgments with regards to grades. Feldman (2018) states, “When teachers include in
grades a participation or effort category that is populated entirely by subjective judgments
of student behavior, they invite bias into their grading, particularly when teachers come
from the dominate culture their students don’t” (p. 54). Since standards-based grading
does not include non-academic factors in the grading system the subjective grading
practices found in traditional grading practices such as rewarding points for behavior or
effort are eliminated. Furthermore, with standards-based practices students of all

23
backgrounds will have equal opportunities for success with the elimination of potential
bias favoring those of the dominant culture.
Theoretical Foundation
There are many sociological theories that may help to explain patterns of success
among individuals. The purpose of this particular theoretical foundation is to detail a
social theory and its relevance to this research as it relates to potential inequalities within
educational grading practices for individuals based on their race, gender, SES and those
with disabilities. In the following sections, the researcher will define Cultural
Reproduction Theory and research studies related to inequalities in education.
Cultural Reproduction Theory
Pierre Bourdieu (1974) was the first to establish the theory of Cultural
Reproduction. Bourdieu researched many ideas in relation to how individuals in society
are equipped differently and therefore have easier or harder paths to success (Bourdieu &
Passeron, 1977). Cultural Capital is viewed as the symbolic make-up an individual
acquires based on their social class (Jaeger, 2011). This symbolic makeup may include
skills, knowledge, clothing individuals wear, mannerisms, and any other learned
behaviors one acquires through their life experiences.
Cultural capital can be broken down into two subgroups, social capital and
economic capital (Bourdieu & Passeron, 1977). Social capital is explained as the
networks and connections one possesses within society (Jaeger, 2011). Everyone has
different connections based on who they know and these networks help individuals
achieve success. These networks start with an individual's family, but also include

24
neighborhoods, church and other social groups that provide an individual power. Based
on an individual’s social networks one learns social norms such as the way individuals
talk, dress and act within society. These norms are symbolic to individuals and signify
they are a part of these social groups.
Economic capital is described as the resources one owns such as money or
material goods. Both economic and social capitals are used to help individuals achieve
higher levels of success (Jaeger, 2011). These forms of capital are then transferred from
parents to their children who in turn reproduce similar results of achievement for each
generation to follow. Economic capital allows students to attend better schools and have
access to extracurricular activities, the ability to travel and even buy educational
resources such as books (De Graaf, De Graaf, & Kraaykamp, 2000). Cultural capital
gives students an advantage due to their ability to more easily follow social norms which
gives these individuals more resources to be successful. For example, Roscigno and
Ainsworth-Darnell (1999) found African American students to have fewer educational
resources at their homes compared to their white peers. As a result, the lack of resources
at home results in parents less likely to be able to read to their children and therefore
students do not possess adequate reading skills as they enter school. When students were
fortunate enough to have parents that can read they reap the benefits from these cultural
experiences. Simply put the knowledge they gain from being read to as a child became
useful in learning new material as they now had prior experiences to connect and deepen
their understanding of new educational material.

25
Bourdieu and Passeron (1977) spent a great amount of time researching cultural
capital and how it contributes to an individual’s success within educational settings.
Cultural Reproduction Theory suggests that those with more cultural capital are rewarded
within school settings because their preferences, attitudes, and behaviors are more
aligned to school settings (De Graaf et al., 2000).
Bourdieu (1974) states:
The education system reproduces all the more perfectly the structure of the
distribution of cultural capital among classes (and sections of a class) in that the
culture which it transmits is closer to the dominant culture and the mode of
inculcation to which it has recourse is less removed from the mode of inculcation
practiced by the family. (p. 181)
In other words, those with cultural capital have money and social networks which created
the power to run school systems and create an educational curriculum. Bourdieu’s theory
of Cultural Reproduction allows youngsters to achieve at higher rates of success when
they come to school with values and norms more closely aligned with the school culture
which has been created by those with higher levels of cultural capital.
Cultural Capital and Grading Practices
From an early age, students begin to see the benefits of having cultural capital
particularly with regard to following social and behavioral expectations. Parenting styles
that closely align with those of the teachers help to create a smooth transition for students
into schools. Hatt (2012) found that kindergarten students associated smartness in school
with following the rules and following teacher expectations. Parents with rules and
expectations that align with the teachers were more likely to be perceived as “smart.”
This is due to the fact that students catch on more quickly to the socially acceptable

26
expectations (Hatt, 2012). In this sense, social reproduction starts at a young age in
helping students to start to perceive individuals as smart if they have higher levels of
cultural capital through their knowledge of behavior and social norms.
For several years studies have confirmed the connection between cultural capital
and education success and therefore support Bourdieu’s Cultural Reproduction Theory
(Anderson, 2012; De Graaf et al., 2000; DiMaggio, 1982; Farkas, Grobe, Sheehan &
Shuan, 1990; Gaddis, 2013; Jæger, 2011; Roscigno & Ainsworth-Darnell, 1999). Jaeger
(2011) and De Graaf et al. (2000) both used empirical studies to summarize results and
the impact cultural capital has on academic outcomes. These studies all measured the
connections between cultural capital and academic achievement. All the studies
summarized show higher academic achievement for individuals with more cultural
capital. While all studies compared cultural capital and academic outcomes, they differed
in how they measured cultural capital. The studies ranged from measuring the economic
wealth of the families, the student's cultural experiences such as traveling, going to
concerts and/or museums, student access to educational resources and the parent's ability
to read. Studies also differed in the measurements of academic achievements. In this
regard, researchers mostly turned to measure success by examining grade point averages,
individual class grades, and standardized test score results from the Scholastic Aptitude
Test (SAT) or Iowa Test of Basic Skills (ITBS).
DiMaggio (1982) was one of the first to study the effects of cultural capital and its
educational impacts on student achievement. His study measured academic achievement
by looking at individual class grades. DiMaggio used quantitative research methods to

27
determine that cultural capital had a significant impact on grading outcomes for high
school students. For example, students with a father who possessed a college education
consistently outperformed others whose parents did not attend a university in terms of
grades. This suggests cultural capital, measured by a parent with a college education,
creates higher probabilities of success for their families (DiMaggio, 1982). This supports
the theory of Cultural Reproduction that those with power pass it down within their
families from generation to generation.
Further evidence of the power of cultural capital within the field of education was
found as Wentzel (1989) researched the effects of social responsibility and effort on
overall grade point averages (GPA). These findings suggest high achievers needed to pay
attention to both social and intellectual requirements within the school setting. Students
with similar SAT scores and academic outcomes (test scores) varied significantly in
terms of their overall GPA’s which suggests students did not receive high marks for
academic achievements alone. As a result, Wentzel advocated for academic interventions
to be paired with interventions to help with non-academic social competencies because
teachers tend to reward students with socially desirable behaviors as grades are assigned.
In other words, social interventions might be beneficial in helping to improve grades and
overall GPA’s when teachers include non-academic skills in their grades.
Jussim (1991) summarized Wentzel’s (1989) results by stating “Students who
conform less to the normative standards of the classroom receive lower grades” (p.153).
Jussim (1991) further argued Wentzel’s findings were due to teacher’s judgments within
the grading process that resulted in the students receiving lower grades. If teacher’s

28
grading systems were purely focused on academic achievement one could hypothesize
grades would be a better predictor of SAT scores. Jussim concluded by agreeing with
Wentzel that “teachers may be altering grades based on students ’behavior rather than
solely on the basis of their performance” (p.154).
Wentzel (1989), concluded student’s grade point averages were not a good
predictor of SAT scores. One could argue this may be due to the overemphasis on
employability scores for participation and following classroom expectations rather than
the overall grades focusing strictly on the knowledge of the content as the SAT would
measure. This emphasis on employability scores may impact those with differing
backgrounds. Roscigno and Ainsworth-Darnell (1999) reported higher GPA’s were tied
to higher social-economic status and lower GPA’s were tied to lower SES, however, it
was not a high correlation. These researchers hypothesized GPA and SES correlations
were not as high perhaps due to grades being assigned by teachers that may include
biased evaluations of students and tracking.
Farkas et al. (1990) were interested in exploring possible grading bias and that
teachers may be essential “Gatekeepers” for students within society by testing how
teachers affect student academic outcomes as suggested by Roscigno and Ainsworth-
Darnell (1999). What impact do teachers have in the grading system? Farkas et al. (1990)
conducted a study in an urban Wisconsin school district to measure such effects. 486 7th
and 8th-grade students ’social studies course grades were compared to ITBS scores and
other variables to see how teachers reward students. Variables such as grades (Social
Studies), coursework mastery (test scores), attendance, student and teacher backgrounds,

29
behaviors, and appearance were taken into consideration during this study. Farkas et al.
found overall course grades were not statistically different based on basic skills,
attendance or teacher's perceptions of work habits. This study suggested there was no
evidence of bias on grading in these categories. There was some bias in how teachers
graded, however, as grades were deflated for boys with disruptive behaviors whereas
girls that were disruptive did not have similar grade deflation. Farkas et al. (1990)
concluded, “Any individual or group possessing strong basic skill performance as well as
a reputation for good citizenship can achieve unusually high course grades” (p. 140). In
summary, an individual’s good citizenship is important in achieving higher grade marks
as judged by the teacher.
Other key findings from this research showed low-income students have lower
skills based on ITBS scores and lower course mastery than their peers of higher-income
students. Furthermore, African American students were reported to have lower academic
skills and were more disruptive compared to white peers (Farkas et al., 1990). These
findings support Bourdieu's (1974) theory that cultural capital affects academic outcomes
and those lacking cultural capital are not rewarded in educational settings with which
reproduces low cultural capital for future generations. Farkas et al., 1990 stated:
Most striking is the powerful effect of student work habits upon course grades.
This confirms the notion, as alleged by both functionalists and revisionist, teacher
judgment of student non-cognitive characteristics are powerful determinants of
course grades, even when student cognitive performance is controlled. (p. 140)
This statement confirms that teacher’s perceptions of a student’s grading basic work
habits (teacher judgments on homework, class participation, effort, and organization) all

30
play a role in assigning course grades. This provides further evidence that student’s final
grades represent much more than just mastery of course content.
Educational Inequalities
In our educational systems passing grades are used to reward and promote
students on to the next grade level or to earn credits towards graduation. When teachers
include non-academic components into the grading process they ultimately improve or
lower the overall grade. Examples of non-academic components attached to grades
include points for behavior and attendance points. This portion of the literature review
will focus on student inequalities in terms of these non-academic components. What are
the subgroup tendencies in education relating to behavior and attendance? Results from
this review will help to predict if including these non-academic grading components will
inflate or deflate overall grading based on one's race, gender, SES and disability statuses.
In other words, which subgroups are being rewarded and which are penalized through
grading practices that include non-academic factors?
Gender Inequalities
Dating back to the 1950’s girls have tended to get better grades in all core subject
areas K-12, even in subjects such as Math and Science that have traditionally been
viewed as subjects boys have been stronger (Perkins, Kleiner, Roey, & Brown, 2004).
This may be explained by teachers rewarding girls with more points for non-academic
factors such as being less disruptive in class and perceived effort, which are both areas
that teachers have consistently rated boys lower (Downey & Vogt Yuan, 2005).
Furthermore, teachers perceive girls to take more detailed notes and they are more likely

31
to complete homework as well (McDaniel, 2007). While girls have been known to get
better grades at all grade levels they have not outperformed males on SAT scores in
which boys have higher scores by an average of 45 points each year dating back to 1972
(College Board, 2018).
Inequities in Student Discipline
Students with good behavior that follows the social norm (high social capital) are
rewarded on multiple levels. For example, when students follow classroom expectations
they are rewarded with high course mastery (test scores) and they are also given higher
course grades as teachers reward students with more employability points for their
positive behavior choices. On the other hand, students are punished twice for behavior
that does not meet classroom expectations. When students misbehave they receive an
initial consequence from the adult. If the behavior is severe enough the student may miss
class time based on an office discipline referral (ODR) or even be suspended from
school. As a result, this student then suffers the results of lower course mastery (test
scores) from missing class time and is punished even more with the final grades because
teachers dock students within the employability portion of the grade for poor behavior
and attendance.
Lewis and Diamond (2015) found black students were more likely to be
disciplined for insubordination disrespect, and excessive noise compared to their white
peers. In addition to being reprimanded more black students were more likely to receive
office referrals and suspensions compared to white peers that displayed similar negative
behaviors (LLeras, 2008). To find trends within subgroups for discipline with our schools
32
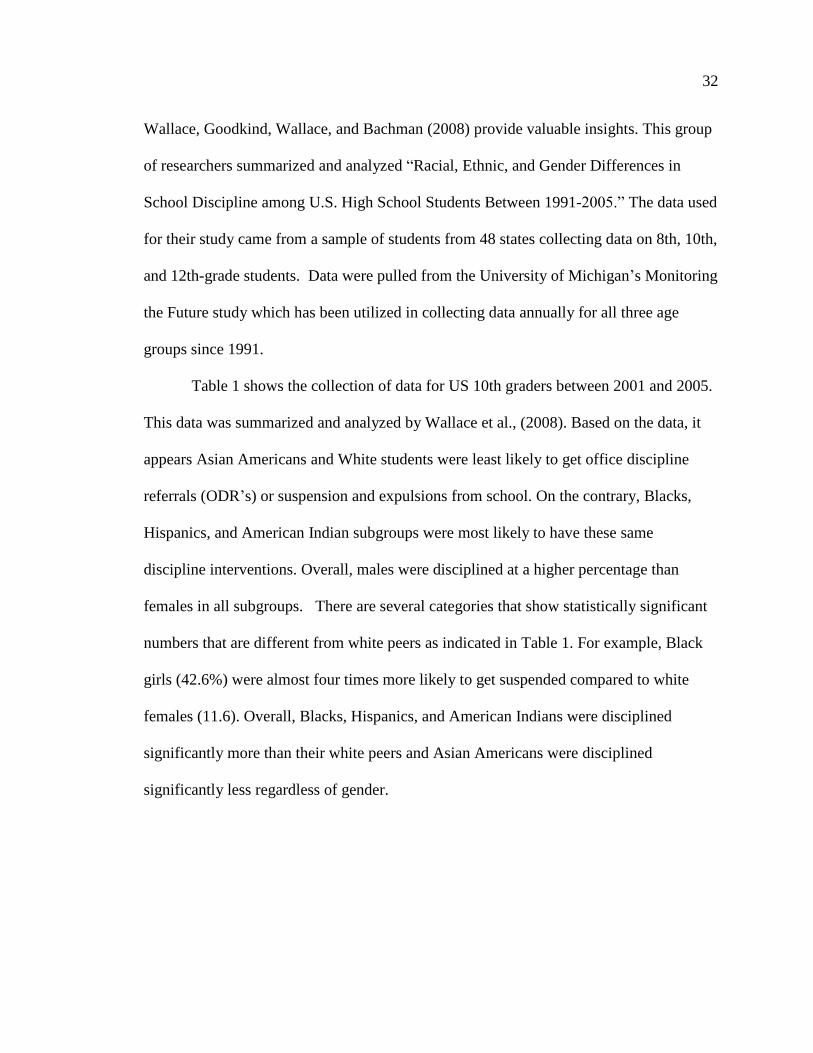
Wallace, Goodkind, Wallace, and Bachman (2008) provide valuable insights. This group
of researchers summarized and analyzed “Racial, Ethnic, and Gender Differences in
School Discipline among U.S. High School Students Between 1991-2005.” The data used
for their study came from a sample of students from 48 states collecting data on 8th, 10th,
and 12th-grade students. Data were pulled from the University of Michigan’s Monitoring
the Future study which has been utilized in collecting data annually for all three age
groups since 1991.
Table 1 shows the collection of data for US 10th graders between 2001 and 2005.
This data was summarized and analyzed by Wallace et al., (2008). Based on the data, it
appears Asian Americans and White students were least likely to get office discipline
referrals (ODR’s) or suspension and expulsions from school. On the contrary, Blacks,
Hispanics, and American Indian subgroups were most likely to have these same
discipline interventions. Overall, males were disciplined at a higher percentage than
females in all subgroups. There are several categories that show statistically significant
numbers that are different from white peers as indicated in Table 1. For example, Black
girls (42.6%) were almost four times more likely to get suspended compared to white
females (11.6). Overall, Blacks, Hispanics, and American Indians were disciplined
significantly more than their white peers and Asian Americans were disciplined
significantly less regardless of gender.

33
Table 1. Percent of U.S 10th Graders Experiencing School Discipline by Race, Ethnicity,
and Gender (2001-2005 data combined).
Office Discipline Referral Suspension/Expulsion
Category Boys Girls Boys Girls
White 41.1 20.9 26.8 11.6
Black 48.2* 33.8* 55.7* 42.6*
Hispanic 46.5* 29.9* 39.1* 23.6*
Asian American 28.8* 13.1* 19.0* 6.9*
American Indian 54.8* 34.5* 43.2* 25.9*
35,896
37,643 35,896 37,64
3
*Value is significantly different from White youth (p < .01)
Note. Data from Percent of U.S 10th graders experiencing school discipline by race,
ethnicity, and gender (2001-2005 data combined) from Wallace et al., 2008.
In addition to the data from Wallace et al. (2008) the United States Department of
Education press release from a Civil Rights Survey from Ed.gov (2018) seems to share
similar findings on discipline disparities between subgroups. Data shows kindergarten
through 12th-grade Black students are four times more likely to get suspended compared
to white peers (U.S Department of Education, 2018). Suspension data for students with
disabilities also appears to be significantly different from their non-disabled peers.
Students with disabilities are twice as likely to get suspended from school as a result of a
discipline issue.
This suspension data is alarming due to the effects of student suspensions and
graduation outcomes. Balfanz, Byrnes, and Fox (2014) studied student post-secondary

34
outcomes, dropout rates, and graduation rates for students based on the number of days
they were suspended due to discipline incidents during their 9th-grade year. The study
was conducted in the state of Florida and student’s suspension data were recorded for
181,897 students during the 2000-2001 school year. Figure 1 shows the negative effects
of student suspension on academic outcomes.
Figure 1. High School and Post-Secondary Outcomes by Number of 9th Grade
Suspensions
Note. Reprinted from Balfanz et al., (2014). Sent Home and Put Off-track: The
Antecedents, Disproportionalities, and Consequences of Being Suspended in the Ninth
Grade. Journal of Applied Research on Children: Informing Policy for Children at Risk,
5(2), Article 13, p. 9
Figure 1 suggests that each time a student gets suspended their chances of
graduating and attending post-secondary schooling declines. On the contrary, students
with lower amounts of days suspended have the lowest chance of dropping out of school.

35
If this study is representative of Wallace et al. (2008) and the Civil Rights Survey from
Ed.gov (2018) this news is bitter. Since Blacks and Hispanics and those with disabilities
have the highest rates of suspensions this is troubling news for these individuals. Put
bluntly, if the correlations within this study (Wallace et al., 2008) between suspensions,
graduation rates, and post-secondary schooling hold true for other states as well this
would explain lower graduation rates and postsecondary outcomes for individuals with
disabilities and minority groups.
Inequities in Student Attendance
Attendance is critical to a student’s success at school. When students fail to
attend classes they miss essential engagement in learning activities and ultimately have
lower content mastery. Similar to students that struggle to follow discipline procedures
students with poor attendance are also punished twice for their failure to make it to
classes. Students with attendance issues will have lower academic content mastery and
lower assessment scores and then on top of that their grade drops even more because they
lose participation and attendance points as part of the employability grade when they fail
to show up to class.
On the other hand, students that do attend reap the benefits of the double reward.
For example, a student that attends school will reap the benefits of higher chances of
content mastery and then on top of that teachers provide the employability points for
attendance and/or participation that reward this student with an even higher overall grade.
From this research review, one can get a better sense of trends of subgroups (race,

36
gender, disability) of students that might reap the benefits of the “double reward” and
which students will have lower chances of overall grades based on their attendance.
To get a sense of which students reap benefits of the double reward, the US
Department of Education Civil Rights Office provides strong data supporting this
concept. Each year since 1968 the Office of Civil Rights has used a survey called the
“Civil Rights Data Collection” (CRDC) for all states to complete in order to collect data
that will shine a light on the educational trends across the country. The following and
most current data sets came from the 2013-2014 school year and have at least 95% of all
public schools across the nation. Overall, about 6 million or 14 percent of students within
the nation miss 15 or more days of school which is defined as chronic absenteeism (Civil
Rights Data Collection, 2018). This number grew as students got to high school as
between 1 in every 5, or 20 percent of students missed three or more weeks of school.
Table 2 shows the racial differences for students missing school. There are clear
differences between the subgroups. It appears Asian (7.1%) and White (12.7%)
populations have the best attendance. There is almost a five percent difference between
white (12.7%) and Black (17.3%) subgroups and that number grows even more for
subgroups such as American Indian and Pacific Islander students. As suggested earlier,
Table 2 also shows how attendance at the high school level has a higher percentage of
absenteeism compared to grades K-8 students within all subgroups.

37
Table 2. Percent of Students with 15 or More Days Absent During the 13-14 School
Year by Race
Category All Students High School Students
White
Black
Hispanic
Asian
American Indian
Pacific Islander
Two or More Races
12.7%
17.3%
14.1%
7.1%
22.5%
21.4%
16.4%
17.3%
23.4%
21.2%
9.3%
27.6%
25.7%
21.4%
Note. Data for Percent of K-12 students with 15 or more days absent during the 13-14
school year from the U.S. Department of Education Civil Rights Data Collection, 2018
Table 3 outlines the attendance comparison for individuals with disabilities and
those without. It is clear from these data students with disabilities miss school more
frequently than peers without disabilities.
Table 3. Percent of K-12 Students with 15 or More Days Absent During the 13-
14 School Year by Disability Status
Category Frequency
With Disabilities 18.9%
Without
Disabilities 12.9%
Note. Data for Percent of K-12 students with 15 or more days absent during the 13-14
school year from the U.S. Department of Education Civil Rights Data Collection, 2018

38
Finally, Table 4 shows the comparison of chronic attendance by gender. From
this table, it is suggested that there are no significant differences between males and
females in terms of attendance.
Table 4. Percent of K-12 Students with 15 or More Days Absent During the 13-14 School
Year by Gender
Note. Data for Percent of K-12 students with 15 or more days absent during the 13-14
school year from the U.S. Department of Education Civil Rights Data Collection, 2018
Based on this review of subgroups inequalities in discipline and absenteeism the
literature suggested Black students will have the largest deflation of their grades
compared to the actual skill/knowledge of the content (test scores) when other factors
such as class participation are included in the grades. Black students had the most
discipline occurrences and notably high absenteeism. In terms of gender, attendance is
not a factor as both genders are similar in this category; however, boys have more
discipline occurrences resulting in office referrals and suspensions. Boys grades will be
deflated more if employability points are used because of these higher rates of discipline
occurrences. These students will receive fewer employability points due to their failure to
follow classroom expectations. Finally, based on the review of literature students will
Category Frequency
Females 13.8%
Male 13.6%

39
disabilities will also have a higher rate of grade deflation compared to their non-disabled
peers. Students with disabilities are absent more and are twice as likely to get suspended
for discipline occurrences and therefore will lose more employability points than their
peers if this component is included in the teachers grading categories.
Teacher Effects on Student Outcomes
The goal of education is to help all individuals learn and be successful and
educators want all students to have equal rights to success. Unfortunately, this is not the
case as individuals all come from many backgrounds and it is clear as Bourdieu and
Passeron (1977) suggest education tends to favor those in the dominant subculture. There
may be many reasons behind these lower grades and some factors may be beyond the
student’s control such as the teacher he/she gets paired with. It is not surprising students
achieved higher course mastery (test scores) when they were paired with a teacher with
more teaching experience (Farkas et al., 1990). Non-white subgroups tend to get the
inexperienced teachers and therefore lower performance outcomes as Black and Hispanic
students had twice as many first-year teachers in schools with minorities compared to
their white counterparts (Black, Giuliano, & Narayan, 2018). These differences in
teachers continue to widen the inequity gaps found in education.
Teachers naturally have biases based on their experiences and these biases are
noticed when grading includes practices that allow for subjective judgments. Black
students were found to be typically rated as “poorer classroom citizens” compared to
white peers by white teachers (Downey & Pribesh, 2004). One research analysis found
white students were 12% more likely to have higher grades than their black classmates

40
(Roscigno & Ainsworth-Darnell, 1999). Each of these studies provides evidence of
inequities based on race that hinders Black students when assigning traditional grades.
Parent/Family Effects on Student Outcomes
There is no doubt that parents and families play a critical role in teaming up with
teachers in helping children achieve high academic outcomes. From an early age,
children are molded and influenced by their families in learning to read, write, talk,
follow social expectations, and any other learning experiences. Even, parents being able
to read is connected to the student's overall educational achievement (De Graaf et al.,
2000). Keith et al. (1998) focused on 10th-grade students and their grade point averages
in comparison to parent involvement and there was a large positive correlation between
these variables. Furthermore, they also found that parent involvement is equally
important for both genders and all races. These results should come as no surprise as
parents are indeed the student's first teachers and critical in helping individuals grow and
develop.
Since parent involvement is critical to a child’s success which groups of students
have the most family support? There are significant differences between the various
races in terms of single-parent families. In fact, 74.3 percent of all white children live in
two-parent homes compared to only 38.7 percent of African Americans under the age of
18 years (Prince, 2016). We can then infer that 61.3% of African American students are
living in single-parent family homes. This stark difference between these racial groups
helps to explain cultural reproduction and the need for extra educational support for
African American students.

41
Traditional grading practices may seem harmless on the surface; however deep
down they tend to reinforce disparities based on resources. When teachers grade
homework there is a significant advantage to those with resources to complete the given
assignments and those with fewer resources are punished when homework points are
included in the overall grade. For example, one-fifth of students reported they were
unable to complete homework assignments due to a lack of internet at home (Project
Tomorrow, 2017). Furthermore, students are more likely to finish homework
assignments when they have a quiet space with college-educated parents or access to
tutors. Simply put when teachers include homework in the final grade they are denying
points for students due to their lack of resources.
Summary
Researchers suggest many grading practices include subjective grading categories
such as "Employability;" which gives students points based on teachers perceptions of
effort, behavior, and participation that impact a student's grade both positively and
negatively (DiMaggio, 1982; Jussim, 1991; Keith et al., 1998; Roscigno & Ainsworth-
Darnell, 1999). Through this research project, the researcher will explore how these
grading practices impact those of different races, genders, individuals with disabilities
and differing SES. Are these grading practices inflating or deflating student's final grades
or is the overall grade a direct reflection of the student's academic knowledge of the
content from the subject matter?
As a result of these literature review findings, one can hypothesize the potential
results of this study. When teachers grade using subcategories such as “employability,”

42
the overall grades will not represent the student’s true skill and/or knowledge of the
subject matter. Students with discipline and attendance issues will be docked
employability points which will deflate their overall grades. These are the same students
that would most likely have lower performance outcomes on assessments due to the lack
of participation and engagement in-class activities. On the other hand, students that can
follow teacher expectations and attend class regularly will reap the rewards of higher
employability scores to help inflate the final grade.
Throughout this literature review, there were many mentions of the need for
studies such as this dissertation project being proposed. Roscigno and Ainsworth-Darnell
(1999) suggested that more quantitative studies should explore possible racial-class bias
of academic performance within the classroom. They were concerned with the idea that
“race-based micropolitical processes occurring in the school and classroom maybe, as
findings suggest, important in the evaluation and rewarding of background attributes” (p.
171). DiMaggio (1982), also proposed a need for better grading policies to prove the
advantages for more privileged subgroups. DiMaggio called for “objective measures of
grades, standardized by the school” (p. 199). This would be an opportunity for schools to
offer fair grading practices for all subgroups and not favor some students through grade
inflation while deflating other students' grades based on attendance and discipline
concerns.
A number of studies have suggested racial bias in the classroom (Lewis &
Diamond, 2015; LLeras, 2008). These bias ’may have negative effects for Blacks when
behavior is included as a grading factor. In the case of other subgroups such as males

43
traditional grades often put them at a disadvantage with factors such as behavior, effort,
and homework are included in the grades (Downey & Vogt Yuan, 2005; McDaniel, 2007;
Perkins, et al., 2004; Wallace et al., 2008). Furthermore, the literature suggests that
different grading practices may be a solution (Feldman, 2018). Grades should be based
on achievement of learning goals (Bailey & McTighe, 1996; Brookhart, 2004; Guskey,
1994) and primarily determined by summative assessments with behaviors reported
separately from the final grades (O’Connor, 2009).
As we seek to even the playing field, it is important for schools to look at their
own grading practices and equity implications. Thus, the purpose of this study will help
the academic community learn more about how subgroups are affected by traditional
grading practices and how grade inflation or deflation impacts students based on race,
gender, SES, and disability status. In a perfect world, grading practices would be fair for
all individuals to have equal chances at success. Through this study, it can be inferred
that there will be new light on this issue and help to create an equitable society.

44
CHAPTER 3
METHODOLOGY
Purpose of the Study
The purpose of this intrinsic case study (a specific group or department is the
primary interest of the exploration) is to detail how overall student grades are impacted
when teachers include homework and employability categories. In the following sections
of Chapter 3, details of the methods and procedures used to conduct this research will be
shared. First, the researcher will review the research questions that will be answered as a
result of this study. Next, readers will learn more about the research design, site
demographics, and participant information. Then, in the final section, the researcher will
detail the data collection and analysis procedures to be used to answer the research
questions. Overall, this study will give insight into grading current practices and if they
provide equitable outcomes for students based on race, gender, socio-economic and
disability status.
Research Questions:
The following research questions and sub-questions will be used to guide this
study.
1. How does including employability and homework scores within the traditional
grading model inflate or deflate grades?
a. Are there statistically significant differences (p<.05) between “Final
Grade percents” and “Assessments only” percents?

45
b. What percent of student’s grades were inflated due to the use of
homework and employability categories?
c. What percent of students' grades were negatively deflated due to the
use of homework and employability categories?
d. Were there any students that failed the class based on the overall grade
including homework and employability categories who would have
passed the class if they were graded based only on their assessment
scores?
e. Were there any students that passed the class based on the overall
grading including homework and employability categories who would
have failed the class if they were graded based only on their
assessment scores?
2. Does including these traditional grading components produce equitable
grading outcomes for students based on race, gender, SES, and disability
status?
a. Are students with IEPs/504 plans statistically significantly different
(p<.05) from General Education peers in the grading categories of
employability, homework, and assessments?
b. Are students receiving free and reduced lunch statistically significantly
different (p<.05) from peers in the employability, homework, and
assessment categories of the grade?

46
c. Are students based on gender statistically significantly different
(p<.05) from each other in the employability, homework, and
assessment categories of the grade?
d. Are students of color statistically significantly different (p<.05)
different from White students in the grading categories of
employability, homework, and assessments?
Research Design
To conduct this study, all student semester grades for all math classes will be
analyzed. During the 2015-2016 school year, as a way of forming consistency for
grading, Diversity High School’s math teachers uniformly separated their traditional
grade books into the following categories: “Assessments,” “Homework,” and
“Employability.” This consistency in the grading setup allows the researcher to analyze
all student grades (about 800) in the area of math. The grades will be charted by writing
down each student’s final grade percentages, assessment percent, employability percent,
and homework percent. Each participant’s race, gender, SES and disability statuses will
also be documented to allow for subgroup comparisons as seen in Figure 2. SES will be
recorded using student’s free and reduced lunch eligibility which is based on family
income and disability statuses will be documented based on if the individual has an IEP
or a 504 plan.

47
Figure 2. Example of Grades Charted
Each student’s value in the semester “Final %” column will be compared to the
value of “Assessment %” (see Figure 2) column to see if and how much of the final grade
is inflated or deflated or deflated through the inclusion of “Homework” and
“Employability” categories. After charting these scores, the results will be graphed by
percentage to answer the outlined questions below.
Setting and Participants
This study will be conducted at Diversity High School in the state of Iowa.
Diversity High School serves about 900 students each year. As a state, Iowa does not
have much racial/ethnic diversity with only 22.5% of the K-12 student population being
non-white (Iowa Department of Education, 2015); however, Diversity High is located in
an urban area with more racial diversity. Figure 3 shows the diversity of students within
the school. It is important to note the relatively low number of white students
49.3%. Thus, 50.7 percent of the students at Diversity High School are non-white, which
is 28.2% above the state average. Of the students at Diversity High School, 31.2 percent
are Black. Other races that make up the school are Hispanic, American Indian, and Asian
populations.

48
_______________________________________________________________________
Figure 3. 2015-2016 Diversity High School Student Demographics
Diversity High School Tableau. This system is used within the district to collect data and
make charts the represented by the data.
Data Collection
The following procedures were used in the data collection process. First, the
researcher contacted gained IRB and district approval before contacting the District’s IT
Director to gain access to the 2015 – 2016 school year records for Diversity High School
on the district’s student information management system (ie. Infinite Campus and
Tableau). The 2015-2016 school year was unique because the math teachers set their
grade books up similarly by including homework, employability, and assessment
categories. Gaining access to the student information management systems allowed the

49
researcher to access math course grades to retrieve the needed data. Then, once
permission was granted, the researcher accessed the math classes and retrieved these nine
variables for each student in those math classes:
1) Final grade
2) Final grade percentage earned
3) Assessment percentage earned
4) Homework percentage earned
5) Employability skills percentage earned (e.g. arrive on time, attend class,
participation, etc.)
6) Race/ethnicity (e.g. African American, White, Hispanic/Latino, Asian,
etc.)
7) Gender
8) Disability status (IEP or 504)
9) SES (Free/reduced lunch eligibility)
Although the researcher was able to see each student’s name in the systems, the
researcher did not include names in the data collection. Each student’s data was entered
into a row with a generic participant number to ensure participations remain anonymous.
Some students appeared in more than one math class, but their data was just entered as an
additional participant.
Data Analysis
This research study addressed the following research questions:
1. How does including employability and homework scores within a traditional
grading model inflate or deflate grades?
a. Are there statistically significant differences (p<.05) between “Final
Grade” percents and “Assessment” percents?
To answer this research question, the researcher compared the means of each
category (Final grade percent and Assessments percent). The researcher then used a

50
paired t-test (2 tailed) to compare each group’s equality of means and see if there was a
statistically significant result (p< .05).
b. What percent of student’s grades were inflated due to the use of
homework and employability categories?
Question B was answered by tallying up the number of students with positive
numbers in the “Inflation/Deflation” category and dividing by the number of participants.
Then multiply by 100 to get a percent of students that had grades inflated.
c. What percent of student’s grades were deflated due to the use of
homework and employability categories?
Question C was answered by tallying up the number of students with negative
numbers in the “Inflation/Deflation” category, dividing by the number of participants, and
then multiplying by 100 to get a percent of students that had grades deflated.
d. Were there any students that failed the class based on the overall grade
including homework and employability categories who would have passed
the class if they were graded based only on their assessment scores?
To answer question number four the researcher looked at the charted grades to
identify any student’s final grades (less than 59.5 %). The researcher then counted the
number of these students that had an assessment grade of passing (above 59.5 %).
e. Were there any students that passed the class based on the overall grading
including homework and employability categories who would have failed
the class if they were graded based only on their assessment scores?

51
To answer question E the researcher looked at the charted grades to find any students
with final grades above 59.5%. Using these students, the researcher then counted the
number of students with assessment only scores below 59.5% which would be a failing
grade.
2. Does including such components produce equitable grading outcomes for students
based on race, gender, socio-economic and disability status?
a. Are students with IEPs/504 plans statistically significantly different (p<.05)
from general education peers in the grading categories of employability,
homework, and assessment?
b. Are students receiving free and reduced lunch statistically significantly
different (p<.05) from peers in the employability, homework, and assessment
categories of the grade?
c. Are students based on gender comparing boys and girls statistically
significantly different (p<.05) from each other in the employability,
homework, and assessment categories of the grade?
d. Are students of color statistically significantly different (p<.05) from White
students in the overall, employability, homework, and assessment grading
categories?
To answer these four questions, the researcher compared the means of each
grading category (employability, homework, and assessment percentages). The
researcher then used a one-way multivariate analysis of variance, also known as a one –
way MANOVA to determine whether there are any statistically significant differences
52
between independent groups and dependent variables. The one-way MANOVA is an
omnibus test statistic and cannot reveal which specific groups were significantly different
from each other; rather it tells the researcher if at least two groups are statistically
different. A one-way MONOVA was conducted to test the hypothesis that there will be
one or more mean differences between grading categories (assessment, homework,
employability, and inflation percentages) and racial subgroups.
Summary
The purpose of this intrinsic case study is to detail how overall student grades are
impacted when teachers include homework and employability categories. The previous
sections reviewed the research questions and detailed the methods and procedures
planned to conduct this study. Site demographics and participant information were also
shared to gain an understanding of how this research will be conducted. Overall, this
study gives insight into grading current practices and if they provide equitable outcomes
for students based on race, socio-economic and disability status.

53
CHAPTER 4
FINDINGS
The purpose of this study was to detail how overall student grades are impacted
when teachers include homework and employability categories. The following sections of
Chapter 4 will detail the findings of this research. First, the researcher will review the
research design and research questions that were answered as a result of this study. Next,
readers will learn more about specific site demographics and participant information.
Then, the researcher will detail findings based on the research questions. Finally, in the
last section, the research will summarize the highlights of this study. Overall, this study
provides insight into current grading practices and whether or not they provide equitable
outcomes for students based on race, gender, socio-economic and disability statuses.
Research Design
To conduct this study, student semester grades for all math classes from Diversity
High School were analyzed. During the 2015-2016 school year, as a way of forming
consistency for grading, Diversity High School’s math teachers uniformly separated their
traditional grade books into the following categories: “Assessments,” “Homework,” and
“Employability.” This consistency in the grading setup allowed the researcher to analyze
all 789 student grades in the area of math. 10 students were removed from the study as
they were “non-attenders” and didn’t have recorded assessment scores to allow the
researcher to compare assessment grades to overall grades. This left a total of 779 grades
to be analyzed. The grades were charted by writing down each student’s final grade

54
percentages, assessment percent, employability percent, and homework percent. Each
participant’s race, gender, SES, and disability statuses were also documented to allow for
subgroup comparisons.
Participants
Table 5 shows the complete breakdown of the participants in the study. This table
shows the number and percent of the total participants in the study broken down by SES,
disability status, and gender. As seen in the table the total participants in the study were
779. 558 participants were eligible for free and reduced lunches which equated to 71.6
percent of the total participants. 106 participants had a disability documented through
either IEP or 504 plans. These participants represented 13.6 percent of the participants in
this study. Finally, the gender breakdown was split between 45.4 percent males and 54.6
percent female participants.
Table 5. Participants by SES, Disability Status and Gender
SES Disability Gender
Frequency % Frequency % Frequency %
Not Free Reduced Lunch
221 28.4 Yes 106 13.6 Male 354 45.4
Free Reduced Lunch
558 71.6 No 673 86.4 Female 425 54.6
Total 779 100 Total 779 100 Total 779 100

55
Table 6 shows the breakdown of the participants in this study based on their identified
race. These numbers directly mirror the total population by the race of Diversity High
School. 51.7 percent of the students in this study were non-white making up 403 of the
total 779 participants.
Table 6. Participants by Race
Race Frequency Percent
White 376 48.3
Black 251 32.2
Hispanic 90 11.6
Asian 12 1.5
Other 50 6.4
Total 779 100
Data Collection Review
The following procedures were used in the data collection process. After gaining
IRB and district approval the researcher accessed the 2015 – 2016 school year records for
Diversity High School on the district’s student information management system (ie.
Infinite Campus) and record grades and demographic data based on these nine variables
for each student in math classes:
1) Final grade
2) Final grade percentage earned
3) Assessment percentage earned
4) Homework percentage earned
5) Employability skills percentage earned (e.g. arrive on time, attend class,
participation, etc.)

56
6) Race/ethnicity (e.g. African American, White, Hispanic/Latino, Asian,
etc.)
7) Gender
8) Disability status (IEP or 504)
9) SES (Free/reduced lunch eligibility)
This data was charted (See Appendix A) and used to answer the following research
questions.
Research Questions and Findings
Inflation and Deflation of Grades
1. How does including employability and homework scores within a traditional
grading model inflate or deflate grades?
a. Are there statistically significant differences (p<.05) between “Final
Grade” percents and “Assessment” percents?
To answer this research question, the researcher compared the means of each
category (Final grade percent and Assessments percent). The researcher then used a
paired t-test (2 tailed) to compare each group’s equality of means and see if there was a
statistically significant result (p< .05).
As seen in Table 7 there were statistically significant differences when comparing the
means between student’s assessment percent (M=67.35, SD=18.08) and their overall
percent (M=68.84, SD=17.19) for their math class grades; t778=6.84, p<.001. While these
results were statistically significant it is important to note the mean difference between
the assessment percent and overall percent were only 1.49 percent. In other words, the
average inflation of grades by including homework and employability points was 1.49
percent.

57
Table 7. Paired Samples T-Test Results Comparing Assessment and Overall Percent
Assessment
Percent Overall
Percent 95% CI for
Mean Difference
Outcome M SD M SD N t df Sig. (2 tailed)
67.35 18.08 68.84 17.19 779 -1.92, -1.06 6.84 778 .000*
*p<.001
While the average inflation/deflation of the grade was relatively small (1.49%) it is
important to note this was the average. The students with deflated grades appear to
almost balance out the students with inflated grades; however, it is important to note 336
(43.2 percent) students in this study had their grade inflated or deflated by 5% or more
which equates to moving up or down at least half a letter grade. For example, this might
mean a student moves from 70% C- to 75% C or from a 90% A- to an 85% B.
Furthermore, 97 (12.6%) students in this study had their grades inflated or deflated by
10% or more which is the equivalent to moving a full letter grade. In this instance, a
student might go from a 60% D- to a 70% C- or jump from an 80% B- to a 90% A-.
The most extreme cases in this study had their grades deflated by 18.26% and inflated
by 18.95% respectfully. The most extreme deflation of grades was Student 697 as seen in
Figure 4. This student scored 78.8% on their assessments which would be a C+ grade;
however, they received a final grade of D- (60.54%) due to the deflation of their grade
based on lower homework and employability scores.

58
Figure 4. Student 697 with the Most Deflated Grade
b. What percent of student’s grades were inflated due to the use of
homework and employability categories?
Question B was answered by tallying up the number of students with positive
numbers in the “Inflation/Deflation” category. Then the researcher divided by the number
of participants and multiplied by 100 to get the percent of students that had grades
inflated.
Figure 5 shows a visual representation of the inflation and deflation of grades for all
778 students in this study. Each line within this chart shows how much grades were
inflated or deflated through the inclusion of employability and homework scores in the
grade book. The longer the line for each student indicated a larger degree of inflation or
deflation. Looking at this chart for inflated grades one looks at all the lines that are above
zero. As a result, 479 students (61.5%) had inflated grades. In other words, homework
and employability points improved their overall grades when compared to their
assessment grade. More students (61.5%) overall grades were positivity impacted when
homework and employability points were included in the grade compared to if teachers
only graded students based on their performance on assessments.
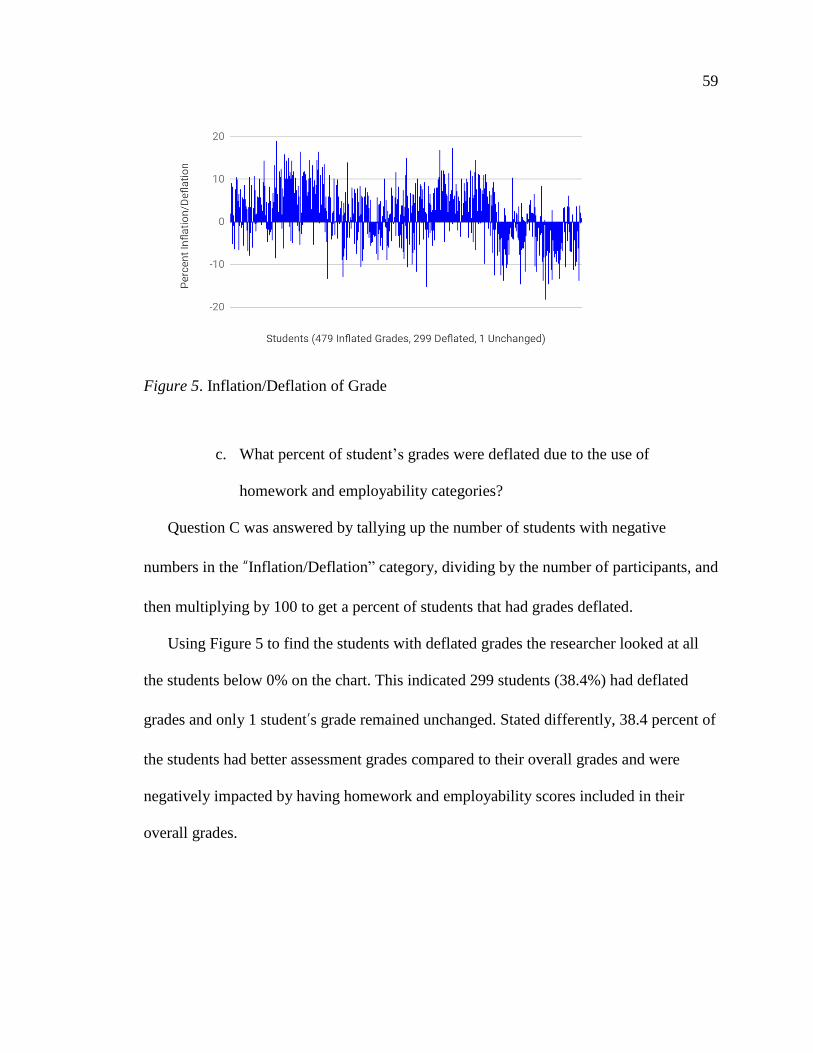
59
Figure 5. Inflation/Deflation of Grade
c. What percent of student’s grades were deflated due to the use of
homework and employability categories?
Question C was answered by tallying up the number of students with negative
numbers in the “Inflation/Deflation” category, dividing by the number of participants, and
then multiplying by 100 to get a percent of students that had grades deflated.
Using Figure 5 to find the students with deflated grades the researcher looked at all
the students below 0% on the chart. This indicated 299 students (38.4%) had deflated
grades and only 1 student’s grade remained unchanged. Stated differently, 38.4 percent of
the students had better assessment grades compared to their overall grades and were
negatively impacted by having homework and employability scores included in their
overall grades.

60
d. Were there any students that failed the class based on the overall grade
including homework and employability categories who would have passed
the class if they were graded based only on their assessment scores?
To answer this question the researcher looked at the charted grades to identify any
student’s final grades (less than 59.5%). The researcher then counted the number of these
students that had an assessment percent of passing (above 59.5%).
Figure 6 shows there were 10 students with passing (above 59.5%) assessment grades
and a failing final grade (below 59.5%). On the most extreme end Student 712 scored
70.8% on their assessments and failed the class with 56.08% due to lower employability
and homework scores. These 10 students make up about 1% of the total students in the
study; therefore, there were only a very small percentage of students that fell in this
category. However, it would be unfortunate to be one of these students who had passed
the class based on assessment performance but end up failing the class based on
homework completion and employability skill performance in the class.
Figure 6. Students with Failing Overall Grades and Passing Assessment Grade

61
e. Were there any students that passed the class based on the overall grading
including homework and employability categories who would have failed
the class if they were graded based only on their assessment scores?
To answer question E the researcher looked at the charted grades to find any students
with final grades above 59.5%. Using these students, the researcher counted the number
of students with assessment scores below 59.5% which would be a failing grade.
Figure 7 shows there were 74 students with passing (above 59.5%) final grades, even
though they had a failing assessment grade (below 59.5%). These 74 students make up
about 10% of the total students in the study. This compares to only 10 students who
failed the class but passed based on assessment scores. Therefore, many more students
benefited from inflated grades by passing the class with the inclusion of homework and
employability points even though the students had not mastered the material based on
assessment results.
Figure 7. Students with Failed Assessment Percentage and Passing Overall Grade

62
On the most extreme end Student 128 scored 59.74% (D-) on the final grade
despite a failing assessment average of 44.73%. This student’s grade was inflated 15.01%
with the inclusion of homework and employability scores. Another example to point out
is Student 204. This student received a final grade of a C (71.87%) despite a failing
assessment grade (59%) which equates to 12.87% inflation. These are just a couple of
examples of students who benefited from having employability and homework scores
included in the teacher's grading system.
Equity Impact on Grades
2. Does including such components produce equitable grading outcomes for students
based on race, gender, socio-economic, and disability status?
To answer the following four sub-questions, the researcher compared the means of
each grading category (employability, homework, and assessment scores). The
researcher used an independent t-test (2-tailed) to compare each group’s equality of
means to see if there was a statistically significant result in each area. For example, when
the means are compared for students with and without IEPs/504 plans in the area of
assessment scores are there statistically significant differences (p<.05)?
Impact of disability status. a. Are students with IEPs/504 plans statistically
significantly different (p<.05) from general education peers in the grading categories of
employability, homework, and assessment?
In regards to question “A,” Table 8 indicates there were statistically significant
differences (p<.001) when comparing the means between students with and without
disabilities in each grading category. The assumption of homogeneity of variances was

63
tested and not satisfied via Levene’s F test, F(128) = 7.4, p=.007. Findings indicate mean
differences between those with disabilities (M=59.29, SD=20.94) and those without
disabilities (M=68.62, SD=17.26) in the area of assessment; t128=-4.4, p<.001. The mean
difference between the assessment scores for these two groups was 9.33 percent. In the
area of homework, there were also significant differences in means between those with
disabilities (M=52.66, SD=25.64) and those without disabilities (M=70.01, SD=24.63),
t777=-6.7, p<.001. In this case, the assumption of homogeneity of variances was tested
and satisfied via Levene’s F test, F(777) = .12, p=.727. There was a 17.35 percent
difference in mean homework scores for these two groups with individuals with
disabilities scoring significantly lower than their non-disabled peers.
Finally, employability scores were also significantly different from those with
disabilities (M=64.72, SD=31.63) compared to those without disabilities (M=85.52,
SD=20.67), t120=-6.5, p<.001. Again, the assumption of homogeneity of variances was
tested and not satisfied via Levene’s F test, F(120) = 65.9, p<.001. The difference in
means for those with and without disabilities was a staggering 20.8 percent for this
grading category which means individuals with disabilities are put at a disadvantage
when employability categories are included in the overall grade.

64
Table 8. Independent T-Test Results Comparing Students with and without Disabilities
With Disability Without Disability
95% CI for Mean
Difference
N=106 N=673
Grading Category
M SD M SD t df
Sig. (2 tailed)
Overall % 58.42 20.28 70.48 16.06 -16.1, -8.0 -5.8 127 .000*
Assessment % 59.29 20.94 68.62 17.26 -13.6, -5.1 -4.4 128 .000*
Homework % 52.66 25.64 70.01 24.63 -22.4, -12.3 -6.7 777 .000*
Employ. % 64.72 31.63 85.52 20.67 -27.1, -14.5 -6.5 120 .000*
Inflate/Deflate -.87 6.0 1.86 6.0
-4.0, -1.5 -4.3 777 .000*
*p<.001
Impact of SES status. b. Are students receiving free and reduced lunch
statistically significantly different (p<.05) from peers in the employability, homework,
and assessment categories of the grade?
In comparing grading results based on students' SES, Table 9 indicates there were
statistically significant differences (p<.001) when comparing the means between students
with and without FRL in every grading category except overall grade inflation/deflation.
Findings indicate mean differences between those with FRL (M=65.64, SD=19.06) and
those without FRL (M=71.65, SD=14.49) in the area of assessment; t527=-4.8, p<.001.
The mean difference between the assessment scores for these two groups was 6.01
percent. In the area of homework there were also significant differences in means

65
between those with FRL (M=65.31, SD=25.4) and those without FRL (M=73.55,
SD=24.7), t777=-4.1, p<.001.
Table 9. Independent T-Test Results Comparing Students Based on SES
No FRL FRL
95% CI for Mean
Difference
N=221 N=558
Grading Category
M SD M SD t df
Sig. (2 tailed)
Overall % 73.71 13.92 66.90 17.97 4.4, 9.2 5.6 517 .000*
Assessment % 71.65 14.49 65.64 19.06 3.5, 8.5 4.8 527 .000*
Homework % 73.55 24.7 65.31 25.4 4.3, 12.2 4.1 777 .000*
Employ. % 89.32 17.88 80.07 25.0 6.1, 12.4 5.8 560 .000*
Inflate/Deflate 2.06 5.65 1.26 6.23
-.2, 1.7 1.7 777 .1
*p<.001
There was an 8.24 percent difference in mean homework scores for these two
groups with individuals with FRL students scoring lower than their peers who did not
receive FRL. Finally, employability scores were also significantly different from those
receiving FRL (M=80.07, SD=25.0) compared to those who did not receive FRL
(M=89.32, SD=17.88), t560=-5.8, p<.001. The difference in means for those with and
without FRL was 9.35 percent for this grading category which means individuals
receiving FRL are put at a disadvantage when employability categories are included in
the overall grade.

66
Impact ofgender. c. Are students based on gender statistically significantly
different (p<.05) from each other in the employability, homework, and assessment
categories of the grade?
Table 10. Independent T-Test Results Comparing Students Based on Gender
Boys Girls
95% CI for
Mean
Difference
N=354 N=425
Grading
Category M SD
M SD t df Sig. (2
tailed)
Overall % 68.02 17.52 69.51 16.9 -3.9, .94 -1.2 777 .229
Assessment % 68.0 18.4 66.9 17.81 -1.4, 3.7 .91 777 .363
Homework % 62.62 25.35 71.9 24.8 -12.8, -5.7 -5.1 777 .000*
Employ. % 80.21 26.5 84.77 20.6 -8.0, -1.2 -2.6 659 .008*
Inflate/Deflate .03 6.24 2.7 5.67 -3.5, -1.8 -6.3 777 .000*
*p<.01
Grading results comparing students based on gender, answering question “C,” can
be found in Table 10. There were statistically significant differences (p<.001) when
comparing the means between boys and girls in the homework and employability grading
category as well as overall grade inflation/deflation. Findings indicate no significant
mean differences between boys (M=68.0, SD=18.4) and girls (M=66.9, SD=17.81) in the
area of assessment (t777=.91, p=.363).

67
In the area of homework, there were significant differences in mean scores
between boys (M=62.62, SD=25.35) and girls (M=71.9, SD=24.8), t777=-5.7, p<.001.
There was a 9.28 percent difference in mean homework scores for these two groups with
boys scoring lower than girls. Finally, employability scores were also significantly
different for boys (M=80.21, SD=26.5) compared to girls (M=84.77, SD=20.6), t659=-2.6,
p=.008. The difference in means for boys and girls was 4.56 percent for this grading
category in favor of the girls meaning boys are put at a disadvantage when employability
and homework categories are included in the overall grade. For example, these findings
show boys had lower overall grades (68.02 %) compared to girls (69.51%) despite having
higher assessment scores.
a. Impact on race. d. Are students of color statistically significantly different
(p<.05) from White students in the employability, homework, and assessment
grading categories?
A one-way multivariate analysis of variance, also known as a one–way
MANOVA was used to determine whether there were any statistically significant
differences between independent groups and more than one dependent variable. The one-
way MANOVA is an omnibus test statistic and cannot reveal which specific groups were
significantly different from each other; rather it tells the researcher that at least two
groups were different. A one-way MONOVA was conducted to test the hypothesis that
there would be one or more mean differences between grading categories (assessment,
homework, and employability, percentages) and racial subgroups.

68
A statistically significant MANOVA effect was obtained between race subgroups
when considering jointly the grading category variables, Pillais Trace = .07, F (16, 3096)
=3.436, p<.001. This indicated that at least two of the group’s means were significantly
different from each other. A series of one-way Analysis of Variances (ANOVA( were
then conducted on each of the 5 dependent variables as a follow up to the MANOVA test
with each ANOVA evaluated at an alpha level of .01. This compared the variances of
means between each of the variables. As seen in Table 11 all ANOVAs for each of the
dependent variables were significantly different.
Table 11. Test Between Subjects Effects for Race
Type III Sum of Squares df Mean Square F Sig.
Assessment Percent 10681.71 4 2670.43 8.487 0.000*
Homework Percent 14826.78 4 3706.70 5.863 0.000*
Employability Percent 11438.20 4 2859.55 5.265 0.000*
* Significant at the .01 level.
To find out which racial groups means were significantly different from each
other a series of Tukey post-hoc tests were performed. The Tukey post-hoc analyses were
performed to examine the individual mean difference comparisons across each grading
category and all 5 racial subgroups (White, Black, Hispanic, Asian, and Other). The
results (Appendix B) revealed statistically significant differences in means between racial
groups (p <.05) for the following comparisons as seen in Table 12.

69
Table 12. Tukey Post-Hoc Test Comparisons for Race
Dependent Variable
Mean
Difference
Std.
Error Sig.
95% Confidence
Interval
Lower
Bound Upper Bound
Assessment
Percent
White Black 8.14* 1.45 0.00 4.19 12.09
Hispanic 5.83* 2.08 0.04 0.14 11.52
Homework
Percent
White Black 6.90* 2.05 0.01 1.29 12.50
Hispanic 11.67* 2.95 0.00 3.61 19.74
Employability
Percent
White Black 7.99* 1.90 0.00 2.79 13.18
Hispanic 7.46* 2.73 0.05 -0.01 14.94
*. The mean difference is significant at the .05 level.
Table 12 results show statistically significant difference in means comparing
White students to Black and Hispanic students in assessment, homework, and
employability grading categories at the p<.05 level. These results show there are
significant mean differences in percentages when comparing these subgroups indicating
that there is an equity difference in regards to grades for these white and non-white sub
groups.
In terms of race, as seen in Table 13, all groups had inflated grades homework
and employability points included in the grade. The Asian population had the most
overall inflation with 4.6 percent while the Hispanic population’s grade was only inflated
by .26 percent. Assessment scores ranged from 70.68 percent from White students to a

70
low mean score of 62.68 for Black students. The average assessment score across all
groups was 67.35.
Table 13. Results Comparing Students Based on Race
White Black Hispanic Asian Other Total
N=376 N=251 N=90 N=12 N=50 N=779
Grading Category
Mean Mean Mean Mean Mean Mean
Overall % 72.41 64.4 65.25 70.77 70.18 68.84
Assessment % 70.82 62.68 64.99 66.18 69.16 67.35
Homework % 71.36 64.46 59.68 78.42 67.62 67.65
Employ. % 86.25 78.26 78.78 87.61 84.05 82.70
Inflate/Deflate 1.59 1.72 .26 4.60 1.02 1.49
There were large differences in mean scores in the area of homework. Asian
students had the highest mean scores of 78.42 percent while Hispanic and Black students
scored the lowest scoring 59.68 and 64.46 percent. For Hispanic students, this is an 18.74
percent difference in homework scores compared to Asian students and an 11.68 percent
difference in scores when compared to White students.
In the area of employment scores, students scored more similar as there was a
smaller range of scores. Scores ranged from 78.26 percent for Black students to 87.61 for
Asian students. This was a difference of 9.35 percent between these two groups. Similar
to homework scores Black and Hispanic students scored the lowest in this category while
White and Asian students scored the highest.
71
Summary
Overall, the findings from this study show differences in grades when homework
and employability scores are included in the overall grade compared to if teachers only
included assessment scores. In the following chapter, the researcher will summarize and
analyze the results as they relate to the research questions in this study. Chapter five will
discuss an overview of this research; summarize and interpret the findings, draw
conclusions, and suggest implications for future research in this area.
72
CHAPTER 5
SUMMARY, DISCUSSION, AND CONCLUSIONS
The purpose of this study was to detail how overall student grades are impacted
when teachers include homework and employability categories. The following sections of
Chapter 5 will summarize key findings, discuss the outcomes, and draw conclusions from
this research. First, the researcher will highlight the findings of this study including the
overall results for grading inflation and deflation as well as key findings based on equity
and the impacts on individuals with disabilities, SES, gender, and race. Next, the readers
will also learn about the researcher’s analysis of the findings. Finally, in the last section,
the researcher will draw conclusions and future implications of this study. Overall, this
study provides insight into current grading practices and if these practices provide
equitable outcomes for students based on race, gender, socio-economic and disability
statuses.
Summary of Findings
Overall, the findings from this study show differences in grades when homework
and employability scores are included in the overall grade compared to if teachers only
included assessment scores. In the following section, the researcher will summarize the
results as they relate to the research questions in this study.
Research Question #1: Grading Inflation/Deflation
How does including employability and homework scores within the
traditional grading model inflate or deflate grades?

73
The average inflation of student’s final grades by including homework and
employability points was 1.49 percent. In other words, the mean difference between the
assessment percent and overall percent was 1.49 percent. 479 students (61.5%) had
inflated grades when homework and employability points were included in the grade. 299
students (38.4%) had deflated grades and only 1 student’s grade remained unchanged.
Simply put, 38.4 percent of the students had better assessment grades compared to their
overall grades and were negatively impacted by having homework and employability
scores included in their overall grades.
The most extreme cases in this study had their grades deflated by 18.26% and inflated
by 18.95% respectfully. 336 (43.2 percent) students in this study had their grade inflated
or deflated by 5% or more which equates to moving up or down at least half a letter
grade. Furthermore, 97 (12.6%) students in this study had their grades inflated or deflated
by 10% or more which is equivalent to moving a full letter grade.
In terms of grades, Figure 8 shows a visual representation for student’s grades with
assessments only, and when employability and homework scores are included.

74
Figure 8. Grading Comparison.
Note. This figure shows a grading comparison for student's grades with Assessments only
and the overall grade when homework and employability points were included.
As mentioned earlier 61.5 percent of the overall grades were inflated when
employability and homework were included. As a result, most of the grades in Figure 8
show improvement when comparing assessment grades and final grades. This is most
significant for the students that would have received “F” grades if using assessment only
grades. With the current grading system including employability and homework scores,
as seen in Figure 8, 147 students failed the course compared to the 213 students that
would have failed the class if the class only used assessment scores. Stated differently,
66 students' grades were inflated up to the passing mark with the inclusion of homework
and employability points even though they did not demonstrate overall proficiency in
course content.

75
Research Question #2: Equity Impact on Grades
Does including these traditional grading components produce equitable
grading outcomes for students based on race, gender, SES, and disability status?
Table 14 provides a summary of much of the equity data conducted in this study
and provides a visual of the impact based on many subgroups. The highlights from this
table are summarized in the following sections.
Table 14. Results Comparing Students Based on Disability, SES & Gender
With
Disability Without
Disability FRL No FRL Boys Girls
N=376 N=251 N=90 N=12 N=50 N=779
Grading
Category Mean
Mean Mean Mean Mean
Mean
Overall % 58.42 70.48 66.90 73.71 68.02 69.51
Assessment % 59.29 68.62 65.64 71.65 68.0 66.9
Homework % 52.66 70.01 65.31 73.55 62.62 71.9
Employ. % 64.72 85.52 80.07 89.32 80.21 84.77
Inflate/Deflate -.87 1.86 1.26 2.06 .03 2.7
Disabilities. There was a 17.35 percent difference in mean homework scores for
students with and without disabilities with individuals with disabilities scoring
significantly lower than their non-disabled peers. Employability scores were also
significantly different from those with disabilities (M=64.72) compared to those without
disabilities (M=85.52). The difference in means for those with and without disabilities
was a staggering 20.8 percent for this grading category which means individuals with

76
disabilities are put at a disadvantage when employability categories are included in the
overall grade.
Socio-Economic Status (SES). There was an 8.24 percent difference in mean
homework scores for students receiving Free and Reduced Lunch (FRL). FRL students
scored lower than their peers who did not receive FRL. Employability scores were also
significantly different from those receiving FRL (M=80.07) compared to those who did
not receive FRL (M=89.32). The difference in means for those with and without FRL was
9.35 percent for this grading category which means individuals receiving FRL are put at a
disadvantage when employability categories are included in the overall grade.
Gender. There was a 9.28 percent difference in mean homework scores when
comparing gender with boys scoring lower than girls. Employability scores were also
significantly different for boys (M=80.21, SD=26.5) compared to girls (M=84.77). The
difference in means for boys and girls was 4.56 percent for this grading category in favor
of the girls meaning boys are put at a disadvantage when employability and homework
categories are included in the overall grade.
Race. In terms of race, all groups had inflated grades with homework and
employability points included in the grade. The Asian students had the most overall
inflation with 4.6 percent while the Hispanic population’s grade was only inflated by .26
percent. There were the largest differences in mean scores in the area of homework.
Asian students had the highest mean scores of 78.42 percent while Hispanic and Black
students scored the lowest scoring 59.68 and 64.46 percent. For Hispanic students, this

77
was an 18.74 percent difference in homework scores compared to Asian students and an
11.68 percent difference in scores when compared to White students.
In the area of employment scores, students scored more similar as there was a
smaller range of scores. Scores ranged from 78.26 percent for Black students to 87.61 for
Asian students. Similar to homework scores Black and Hispanic students scored the
lowest in this category while White and Asian students scored the highest. This puts the
Black and Hispanic students at a disadvantage when homework and employability points
are included in the overall grade.
Discussion
In the following sections, the researcher will analyze the findings of this study as
they relate to the research questions.
Research Question #1: Grading Inflation/Deflation
How does including employability and homework scores within the
traditional grading model inflate or deflate grades?
Researchers suggest many grading practices include subjective grading categories
such as "Employability;" which gives students points based on teachers perceptions of
effort, behavior, and participation that impact a student's grade both positively and
negatively (DiMaggio, 1982; Jussim, 1991; Keith et al., 1998; Roscigno & Ainsworth-
Darnell, 1999). The average inflation of grades by including homework and
employability points in this study was 1.49 percent. 479 students (61.5%) had inflated
grades when homework and employability points were included in the grade. 299
students (38.4%) had deflated grades and only 1 student’s grade remained unchanged.

78
The teachers within this study weighted their grades so 70 percent of the overall
grade was based on assessments and 30 percent of the grade was based on employability
and homework. This means that the maximum amount of inflation or deflation of the
overall grade based on employability and homework points would be 30 percent.
Weighting grades is one strategy teachers use within the traditional grading model to help
limit this impact and help keep a focus on the learning outcomes based on assessment
measures. Even with these measures in place, there was a significant impact on grades
with 43.2 percent of the grades inflated or deflated by at least half a letter grade with 12.6
percent inaccurate by a full letter grade assuming stakeholders want to know the extent in
which students have mastered course content.
One might ask, why do teachers continue to keep employability and homework
points in the grade if it inflates and deflates the grade, therefore, making the final grade
an unfair representation of the student’s understanding of the content. First, teachers may
feel the pressures of passing students to raise graduation rates. This is especially true in
diverse urban areas working hard to keep up with graduation rates seen in other less
diverse communities (Anagnostopoulos, 2003). As a result, teachers may keep
employability points and homework as part of the grade to help push students that
normally would have failed the class up to the passing mark.
For example, in this study the majority of the grades (61.5 percent) were inflated
and 66 students (8 percent) passed the class when they did not achieve a passing level of
understanding of the course content based on assessment scores. This may be possible
evidence of grade inflation due to the mounting pressures of the community and

79
administration. These pressures may be impacting teachers grading choices and as a
result they use non-academic factors such as homework and employability categories to
help inflate the grades to create a better image for the district and community.
Another reason teachers keep employability and homework points in the
gradebook is to prepare students for future employment (Merchant, Klinger, & Love,
(2018). The ongoing question educators ask is, “What is the purpose of education?” Are
teachers not only responsible for teaching content but also preparing students for future
employment? Those in favor of Career and Technical Education (CTE) would argue both
are equally important and therefore teachers are responsible for teaching employment
skills in conjunction to academic material (Lichty & Retallick, 2017). Currently, one
might argue teachers in this study are trying to hold students accountable for student
participation in class, attendance, and social behaviors by including these factors in their
overall grade.
Teachers may claim they are helping students learn the importance of these skills
and how they will impact their future employmentnt; however, is that how students learn
these skills? Some students come to school without these skills so what is the role of
teachers to help students fill these gaps and should this be a priority? If this is a priority,
skills must be taught as part of the content to assure no students are disadvantaged on
their final grades for skills they weren’t taught. Cultural Reproduction Theory suggests
that those with more cultural capital are rewarded within school settings because their
preferences, attitudes, and behaviors are more aligned to school settings (De Graaf et al.,
2000). If these employability skills are not taught it gives an advantage to the students

80
that come from homes with the cultural capital based on social norms when these skills
are included in the overall grade.
Another reason teachers might keep homework points in the grade book could be
holding students accountable for doing the practice needed to master the content (Cooper,
1994). Teachers may argue that there is a strong relationship between homework and
assessment scores, however, in this study; the researcher found the correlation between
homework and assessment scores to be a moderate positive correlation of .479 (as seen in
Appendix C). This evidence does not support that doing homework will result in high
assessment performance. Therefore, teachers may want to evaluate the homework to
make sure it is strongly aligned with assessment skills in which teachers want to students
to master or students may be doing homework incorrectly and need more feedback and
practice to improve their skills prior to the assessment.
Teachers are emphasizing the importance for students to practice skills to master
them through the assigning of homework, but what if students do not have a home
environment or support that is conducive to completing homework? It might be possible
these students do not understand the concepts well enough to do the homework without
support. If employability points are part of the grade educators must then do what they
can to fill these skill gaps. Teachers must then find ways to teach these employment skills
similarly to teaching math skills so students needing employability learning can get it and
in the end lacking these skills does not end up impacting their grade (Wentzel, 1989).
One suggestion for teachers would be to report employability and homework
performance as a separate grade as they do in most elementary schools (Guskey, 2009).

81
For example, students get report cards based on standards with a simple scale: Met
Standard, Approaching Standard, and Standard Not Met. Then in a separate section of
the report card is where the student’s employability or 21st-century skills are reported. In
the end, Employability skills are important and practicing skills such as homework is as
well as their high correlations of these skills and assessment scores; however, if these
factors were reported in a separate category weighted as zero not factoring into the
overall grade this would allow for a better representation of the students knowledge and
skills concerning the content the student is learning.
Some may argue that including employability and homework scores helps
students that just don’t do well on tests. Since they’re not a good test taker their final
grades will be lower if grades are only based on assessment scores. What if the student
was given multiple opportunities to take the test until they met mastery of the content?
Several authors suggest students should be given multiple chances to show their mastery
of the content even it means retaking assessments (Marzano & Heflebower, 2011;
O’Connor, 2009; Wormeli, 2011). Everyone learns to walk at different rates and we fall
down frequently before we master this skill. It is part of the learning process. Does
society expect everyone to learn to walk in the same time frame or even at the same rate?
Imagine losing points every time you fall down. Would this be fair and is this the type of
high pressure testing we want in schools?
Schools working within the traditional school structures are teaching content units
and then expecting all students to take a test at the end of the unit to show their learning
without opportunities for re-takes. Would individuals have less anxiety taking

82
assessments if they knew this wasn’t their one and only chance, but rather know they may
miss some problems but that gives them an opportunity for feedback and is part of the
learning process? In other words, they may fall down this time but they will be given
another chance and eventually, they will learn to walk.
Envision a grading system where the overall grade had zero inflation or deflation
for every student. The overall grade on the report card shows the student’s demonstrated
skill and knowledge of the content based on assessments. Standards-based grading
appears to do just this. It reports homework and employability grades separate from the
overall grade allowing the overall grade to not be inflated or deflated (O’Connor, 2009).
In this method of grading, a student with “A” level skills based on the content gets an
overall letter grade of an “A.” This seems to be a more accurate system in terms of
communicating how well a student understands the content. If one were a parent, teacher,
student, or colleges looking at class grades they would know the level of mastery within
that subject. Furthermore, if they looked at the details of the grade they would be a
glimpse at the standards the student met and which ones they were approaching and
finally the standards that were not met. This allows everyone to see the true learning and
pinpoint skills that a student can continue to work on.
Research Question #2: Equity Impact on Grades
Does including these traditional grading components produce equitable
grading outcomes for students based on race, gender, SES, and disability status?

83
Disabilities. There was a 17.35 percent difference in mean homework scores for
students with and without disabilities with individuals with disabilities scoring
significantly lower than their non-disabled peers. In the area of Employability there was
an even bigger gap between those with and without disabilities at a staggering 20.8
percent for this grading category which means individuals with disabilities are put at a
disadvantage when employability categories are included in the overall grade.
How do educators, parents, and society as a whole work to close these gaps?
Table 3 from the literature review showed a 6% difference in attendance from students
with and without disabilities. While this might be one factor contributing to these gaps
there are most likely other deeper factors playing into this situation that might even affect
why these students are not coming to school. It is the role of educators to dive deep into
the reasoning behind these gaps to help support students with disabilities so they feel
confident coming to school and know they will be supported.
In terms of homework, teachers must evaluate what they are assigning as
homework and know students are leaving the classroom with a strong understanding of
the concepts (Cooper, 1994). If students do not know how to do the work, are frustrated,
or just confused they will be less likely to do this work. It might also be that students with
disabilities need support in organizing their homework or keeping track of what needs to
be done. These are skills educators and parents can teach students to support these
students to make sure homework gets completed and they put in the time practicing skills
and concepts needed for mastery.

84
As educators it will also be important to help students learn necessary
employability skills. Students with disabilities are twice as likely to get suspended from
school as a result of a discipline issue (Civil Rights Data Collection, 2018). Since this is
the case it was not expected but still alarming to see such a gap in the employability
points between disabled and non-disabled peers in this study. If individuals with
disabilities truly lack in these employability skills they need interventions in place that
help support these students in learning these skills rather than just being suspended for
misbehaviors. Sending students home for these misbehaviors only ends up in students
missing classes which make it even harder to catch up and learn the skills and concepts
being covered in class.
Socio-Economic Status (SES). There was an 8.24 percent difference in mean
homework scores for students receiving Free and Reduced Lunch (FRL). FRL students
scored lower than their peers who did not receive FRL. Employability scores were also
significantly lower for students receiving FRL with a 9.35 percent difference meaning
individuals receiving FRL are put at a disadvantage when employability categories are
included in the overall grade.
Those with cultural capital have money and social networks that help them
succeed academically. Bourdieu’s (1974) theory of Cultural Reproduction states
youngsters achieve at higher rates of success when they come to school with values and
norms more closely aligned with the school culture which has been created by those with
higher levels of cultural capital. For example, when teachers grade homework there is a
significant advantage to those with resources to complete the given assignments, and

85
those with fewer resources are punished when homework points are included in the
overall grade. Another example of advantages for those with higher SES is the fact that
one-fifth of students report they are unable to complete homework assignments due to a
lack of internet at home (Project Tomorrow, 2017). Students of higher SES are more
likely to have these simple resources such as internet to get homework completed.
Additionally, students are more likely to finish homework assignments when they have a
quiet space with college-educated parents or access to tutors. Simply put when teachers
include homework in the final grade they are denying points for students due to their lack
of resources.
Gender. There was a 9.28 percent difference in mean homework scores when
comparing gender with boys scoring lower than girls. Employability scores were also
4.56 percent lower for boys with a difference of for this grading category. This means
boys are put at a disadvantage when employability and homework categories are included
in the overall grade.
Males are at a disadvantage when factors such as behavior, effort, and homework
are included in the grades (Downey & Vogt Yuan, 2005; McDaniel, 2007; Perkins, et al.,
2004; Wallace et al., 2008). This may be explained by teachers rewarding girls with
more points for non-academic factors such as being less disruptive in class and perceived
effort, which are both areas that teachers have consistently rated boys lower (Downey &
Vogt Yuan, 2005). This study found similar findings to these other researchers males
shown to have a disadvantage when homework and employability points were included in
the final grade. Therefore it would be more equitable to take employability and

86
homework completion out of the final grade so the grade reflects the knowledge and
understanding of the course content.
Race. In terms of race, all groups had inflated grades with homework and
employability points included in the grade and there were significant differences between
subgroups. The Asian students had the most overall inflation with 4.6 percent while the
Hispanic population’s grade was only inflated by .26 percent. Hispanic students scored
18.74 percent lower than Asian students in the area of homework and 11.68 percent lower
when compared to White students. Furthermore, employability scores ranged from 78.26
percent for Black students to 87.61 for Asian students. Similar to homework scores Black
and Hispanic students scored the lowest in this category while White and Asian students
scored the highest. This puts the Black and Hispanic students at a disadvantage when
homework and employability points are included in the overall grade.
Why are there such large differences in subgroups in homework and
employability categories? Do cultural backgrounds, attitudes, and beliefs these students
have based on their family history play a factor? For example, do Asians have stronger
values on education and therefore make homework a priority whereas Hispanics may
not? Or maybe it was nothing to do with values but rather these differences might be
contributed to family or work structures that make it easier to do homework in Asian and
White homes compared to Hispanic and Black families. For example, if the family has
many kids and the parents are working 2nd or 3rd shift jobs with the students taking care
of younger siblings this would create a structure that would make it more difficult for
homework completion.

87
In the area of employability there may be similar reasons for differences in the
score. Cultural Reproduction Theory suggests that those with more cultural capital are
rewarded within school settings because their preferences, attitudes, and behaviors are
more aligned to school settings (De Graaf et al., 2000). In other words, having cultural
backgrounds that are more closely aligned to teachers or administrators within the
educational setting gives students an advantage due to their ability to more easily follow
social norms which gives individuals more resources to be successful. In the case of this
study it appears it is easier for Asian and White students are more closely aligned with
the social expectations found in the employability category of the grade such as
attendance, participation, and behavior.
While some of the differences in subgroups for the employability grading
category might be based on cultural capital other differences others might also be based
on the subjectivity of the employability grading category. Subjectivity in grading is
difficult to overcome and allows teachers to use biased judgments with regards to grades.
Feldman (2018) states, “When teachers include in grades a participation or effort
category that is populated entirely by subjective judgments of student behavior, they
invite bias into their grading, particularly when teachers come from the dominate culture
their students don’t” (p. 54).
Teachers naturally have biases based on their experiences and these biases are
noticed when grading includes practices that allow for subjective judgments. For
example, black students were found to be typically rated as “poorer classroom citizens”
compared to white peers by white teachers (Downey & Pribesh, 2004). These types of

88
judgments may result in inequities based on race that hinder students when assigning
traditional grades that include non-academic factors such as employability skills.
Conclusions
Limitations of this Study
Limitations of this study included the subjectivity of the grading practices
teachers may use. For example, each teacher used their discretion of how they award
points based on Homework, Employability skills, and Assessments. While this study
allows for hypotheses to be made on how students might fare using a standards-based
grading system that focuses on summative content knowledge, it is not that simple. There
are many pieces to the standards-based grading system beyond removing grades for
effort, homework, attendance, and behavior. For example, there are other unknown
standards-based grading components such as allowing students to reassess therefore
making comparisons between traditional and standards-based grading challenging.
The findings from this study may not be generalizable to other schools or even
departments (ie. Science, Social Studies, English, etc.) beyond Diversity High School, in
which the data were collected. However, Diversity High School’s math department will
be able to use this data to examine their current grading practices. Through this
examination teachers will notice how their current grading structures inflate and deflate
grades as well as if they provide equitable outcomes for students. In the end, this study
will help inform teachers as they choose future grading policies.

89
Future Research
Diversity High School may choose to repeat this study within other departments
to reflect on grading and equity. It would be helpful to also repeat this study in a variety
of other schools and levels to see if the data creates a similar result. For example, the data
sample from this study did not include students from rural settings as it only includes
students attending one urban high school; therefore, more similar studies will make it
easier to generalize the results and see common trends.
This study focused on quantitative measures to find inflation and deflation of
grading as well as the impact on equitable outcomes for subgroups. Future studies could
follow up with qualitative studies around standards-based grading for schools that
switched from traditional grading practices. These studies would highlight how teachers,
students, and parents feel about each grading method.
Finally, this study exposed differences in subgroups based on employability,
homework, and assessment scores. For example, the difference in means for those with
and without disabilities in the area of employability was a staggering 20.8 percent and in
the area of homework the gap between Asian and Hispanic was a difference of 18.74
percent. Future studies could focus on these gaps found for each subgroup to find out
more why do students either struggle or thrive from these subgroups. Or these studies
may indicate that teacher’s unconscious bias has an effect creating gaps for subgroups in
these non-academic factors of grading.

90
Summary
Non-academic factors included in student’s grades can have strong impacts on the
overall letter grade. For example, when non-academic factors (behavior, participation,
attendance, homework completion) counts for as much as 30 percent of the final grade
and students are given maximum points for these factors this may increase grades from a
B to an A. On the other hand, students not earning points for these factors may drop full
letter grades or more.
By taking out these non-academic factors from the grade the grades are more
accurate with deflation and inflation of grades being eliminated. The grades being
communicated to the student, parent, prospective colleges and others are then more
accurate and meaningful. Furthermore, when the grades remove these non-academic
factors they also become more equitable for individuals based on their race, gender, SES,
and disability statuses. Students with less cultural capital will no longer be disadvantaged
based on a grading system working against them. Taking these factors out simply creates
a fair grading system and overall makes a more equitable educational system.
In conclusion, grades should be fair, equitable, and useful to students, parents, and
teachers as they are important in communicating student learning. To do so, grades
should be based on achievement of learning goals (Bailey & McTighe, 1996; Brookhart,
2004; Guskey, 1994) and primarily determined by summative assessments with behaviors
reported separately from the final grades (O’Connor, 2009). As we seek to even the
playing field, schools need to look at their grading practices and equity implications.
Thus the purpose of this study has been to help the academic community learn more

91
about how subgroups are affected by traditional grading practices and how grade inflation
or deflation impacts students based on race, gender, SES, and disability status. In a
perfect world grading practices would be fair for all individuals to have equal chances at
success regardless of their backgrounds or resources. Through this study and future,
similar studies research can help shed new light on this issue and help to create an
equitable society.

92
REFERENCES
Anagnostopoulos, D. (2003). The new accountability, student failure, and teachers' work
in urban high schools. Educational Policy, 17(3), 291-316.
Anderson, E. (2012). Race, culture, and educational opportunity. Theory and Research in
Education, 10(2), 105–129.
Bailey, J., & McTighe, J. (1996). Reporting achievement at the secondary level: What
and how. Association for supervision and curriculum development-yearbook, 119-
140.
Balfanz, R., Byrnes, V., & Fox, J. (2014). Sent home and put off-track: The antecedents,
disproportionalities, and consequences of being suspended in the ninth grade.
Journal of Applied Research on Children: Informing Policy for Children at Risk,
5(2), Article 13. Retrieved from http://digitalcommons.library.tmc.edu/
childrenatrisk/vol5/iss2/13
Benson, D. J. (2008). The standards-based teaching/learning cycle: A guide for Colorado
educators on how to put standards-based education into practice at the district,
school and classroom level. Colorado Coalition for Standards-Based Education.
Black, S., Giuliano, L., & Narayan, A. (2018). Civil rights data show more work is
needed to reduce inequities in K-12 Schools. The White House. Accessed 21 April
2018, https://obamawhitehouse.archives.gov/blog/2016/12/08/civil-rights-data-
show-more-work-needed-reduce-inequities-k-12-schools
Bourdieu, P. (1974). Cultural reproduction and social reproduction. In R. Brown,
Knowledge, education, and social change (71-84). London: Taylor & Francis.
Bourdieu, P., & Passeron, J. (1977). Reproduction in education, society, and culture.
London: Sage.
Brookhart, S. M. (2004). Grading. Upper Saddle River, NJ: Merrill.
Burke, R. J. (1968). Student reactions to course grades. Journal of Experimental
Education, 36(4), 11-13.
Camara, W. J. (1998). High school grading policies. Research notes. RN-04. College
Entrance Examination Board.
Civil Rights Data Collection. (2018). Retrieved 27 November 2019, from
https://ocrdata.ed.gov/

93
College Board. (2018). Annual AP report to the nation, years 2015-2018. Accessed 8
May, 2020, https://research.collegeboard.org/programs/ap/data/nation
Cooper, B. S., Fusarelli, L. D., & Randall, E. V. (2004). Better policies, better schools;
Theories and applications. Boston, MA: Pearson.
Cooper, H. (1994). Homework research and policy: A review of the literature.
Research/Practice, 2(2), 1-10.
Cross, C. T. (1997). Hard questions, standard answers. Basic Education, 42(3), 1-3.
De Graaf, N. D., De Graaf, P. M., & Kraaykamp, G. (2000). Parental cultural capital and
educational attainment in the Netherlands: A refinement of the cultural capital
perspective. Sociology of Education, 92-111.
DiMaggio, P. (1982). Cultural capital and school success: The impact of status culture
participation on the grades of U. S. high school students. American Sociological
Review, 47(2), 189–201.
Downey, D. B., & Pribesh, S. (2004). When race matters: Teachers' evaluations of
students' classroom behavior. Sociology of Education, 77(4), 267-282.
Downey, D. B., & Vogt Yuan, A. S. (2005). Sex differences in school performance
during high school: Puzzling patterns and possible explanations. The Sociological
Quarterly, 46(2), 299-321.
Farkas, G., Grobe, R. P., Sheehan, D., & Shuan, Y. (1990). Cultural resources and school
success: Gender, ethnicity, and poverty groups within an urban school district.
American Sociological Review, 55(1), 127–142.
Feldman, J. (2018). Grading for equity: What it is, why it matters, and how it can
transform schools and classrooms. Corwin Press.
Gaddis, S. M. (2013). The influence of habitus in the relationship between cultural capital
and academic achievement. Social Science Research, 42(1), 1–13.
Guskey, T. R. (1994). Making the grade: What benefits students. Educational
Leadership, 52(2), 14-20.
Guskey, T. R. (2009). Bound by tradition: Teachers’ views on crucial grading and
reporting issues. Online submission.
Guskey, T. R., & Bailey, J. M. (2001). Developing grading and reporting systems for
student learning. Thousand Oaks, CA: Corwin Press.

94
Guskey, T. R., & Jung, L. A. (2009). Grading and reporting in a standards-based
environment: Implications for students with special needs. Theory into Practice,
48(1), 53-62.
Guskey, T. R., & Link, L. J. (2019). Exploring the factors teachers consider in
determining students’ grades. Assessment in Education: Principles, Policy &
Practice, 26(3), 303-320.
Hatt, B. (2012). Smartness as a cultural practice in schools. American Educational
Research Journal, 49(3), 438–460. https://doi.org/10.3102/0002831211415661
Iamarino, D. L. (2014). The benefits of standards-based grading: A critical evaluation of
modern grading practices. Current Issues in Education, 17(2).
Iowa Department of Education. (2015). 2015-2016 Iowa public school district PreK-12
enrollments by district, grade, race and gender. Accessed 8 February 2020,
https://educateiowa.gov/documents/public-district/2018/07/2015-2016-iowa-public-
school-district-prek-12-enrollements-district
Jæger, M. M. (2011). Does cultural capital really affect academic achievement? New
evidence from combined sibling and panel data. Sociology of Education, 84(4), 281–
298. https://doi.org/10.1177/0038040711417010
Jussim, L. (1991). Grades may reflect more than performance: Comment on Wentzel
(1989). Journal of Educational Psychology, 83(1), 153–155.
https://doi.org/10.1037/0022-0663.83.1.153
Keith, T. Z., Keith, P. B., Quirk, K. J., Sperduto, J., Santillo, S., & Killings, S. (1998).
Longitudinal effects of parent involvement on high school grades: Similarities and
differences across gender and ethnic groups. Journal of School Psychology, 36(3),
335–363. https://doi.org/10.1016/S0022-4405(98)00008-9
Lewis, A. E., & Diamond, J. B. (2015). Despite the best intentions: How racial inequality
thrives in good schools. Oxford University Press.
Lichty, J. A., & Retallick, M. S. (2017). Iowa agricultural educators’ current and
perceived grading practices. Journal of Research in Technical Careers, 1(1), 11.
Linn, R., & Miller, M. (2005). Measurement and assessment in teaching. Upper Saddle
River, NJ: Pearson Prentice Hall.

95
Lleras, C. (2008). Race, racial concentration, and the dynamics of educational inequality
across urban and suburban schools. American Educational Research Journal, 45(4),
886-912.
Merchant, S., Klinger, D., & Love, A. (2018). Assessing and reporting non-cognitive
skills: A cross-Canada survey. Canadian Journal of Educational Administration and
Policy, 187.
Marzano, R. (2000). Transforming classroom grading. Alexandria: Association for
Supervision and Curriculum Development.
Marzano, R., & Heflebower, T. (2011). Grades that show what students
know. Educational Leadership, 69(3), 34-39.
McDaniel, A. E. (2007). Gender gaps in educational and occupational expectations
across thirty industrialized countries: a study of similarities and differences
(Doctoral dissertation). The Ohio State University, Columbus, OH.
McMillan, J. H. (2001). Secondary teachers’ classroom assessment and grading practices.
Educational Measurement: Issues and Practice, 20(1), 20-32.
Middleton, W. (1933). Some general trends in grading procedure. Education, 54(1), 5-
10.
National Education Association. (1971). Reporting pupil progress to parents. National
Association Research Bulletin, 49(1), 81-82.
O'Connor, K. (2002). How to grade for learning: Linking grades to standards (2nd ed.).
Thousand Oaks, CA: Corwin.
O’Connor, K. (2009). Reforming grading practices in secondary schools. Principal’s
Research Review, 4(1), 1-7.
Perkins, R., Kleiner, B., Roey, S., & Brown, J. (2004). The high school transcript study:
A decade of change in curricula and achievement, 1990-2000. NCES 2004-455.
National Center for Education Statistics.
Prince, Z. (2016). Census bureau: Higher percentage of black children live with single
mothers. The Black Media Authority. Accessed 27 November, 2019,
http://www.afro.com/census-bureau-higher-percentage-black-children-live-single-
mothers/#
Project Tomorrow. (2017). How America’s schools are addressing the homework gap:
Speak up 2016 findings. Irvine, CA: Author

96
Randall, J., & Engelhard, G. (2010). Examining the grading practices of teachers.
Teaching and Teacher Education, 26(7), 1372-1380.
Reeves, D. B. (2008). Leading to change/effective grading practices. Educational
Leadership, 65(5), 85.
Roscigno, V. J., & Ainsworth-Darnell, J. W. (1999). Race, cultural capital, and
educational resources: Persistent inequalities and achievement returns. Sociology of
Education, 158-178.
Schneider, J., & Hutt, E. (2014). Marking the grade: a history of A-F marking scheme.
Journal of Curriculum Studies, 46(2), 201-224.
Smallwood, M. L. (1935). An historical study of examinations and grading systems in
early American universities: A critical study of the original records of Harvard,
William and Mary, Yale, Mount Holyoke, and Michigan from their founding to 1900
(Vol. 24). Cambridge, MA: Harvard University Press.
Starch, D., & Elliott, E. (1912). Reliability of the grading of high-school work in English.
The School Review, 20(7), 442-457.
Starch, D., & Elliott, E. C. (1913). Reliability of grading work in mathematics. The
School Review, 21(4), 254-259.
Stebbins, S., & Comen, E. (2018). These are the 15 worst cities for black
Americans. USA Today. Accessed 21 April 2018, https://www.usatoday.com/story/
money/2018/11/16/racial-disparity-cities-worst-metro-areas-black-
americans/38460961/
U.S Department of Education, Office of Educational Research and Improvement. (1994).
What do student grades mean? Differences across schools. (Office of Research
Report 94-3401). Washington, DC: Office of Educational Research and
Improvement.
U.S Department of Education, Office for Civil Rights. (2018). 2015–16 Civil rights data
collection for school climate and safety. Retrieved 27 November 2019, from
https://www2.ed.gov/about/offices/list/ocr/docs/school-climate-and-safety.pdf
Wallace, J. M., Jr, Goodkind, S., Wallace, C. M., & Bachman, J. G. (2008). Racial,
ethnic, and gender differences in school discipline among US high school students:
1991-2005. The Negro Educational Review, 59(1-2), 47.

97
Wentzel, K. R. (1989). Adolescent classroom goals, standards for performance, and
academic achievement: An interactionist perspective. Journal of Educational
Psychology, 81(2), 131–142. https://doi.org/10.1037/0022-0663.81.2.131
Wormeli, R. (2011). Redos and retakes done right. Educational Leadership, 69(3), 22-26.
Zlomek, R. L., & Svec, J. C (1997). High school grades and achievement: Evidence of
grade inflation. NASSP Bulletin, 81(587), 105-113.

98
APPENDIX A
CHARTED GRADES

99

100

101

102

103

104
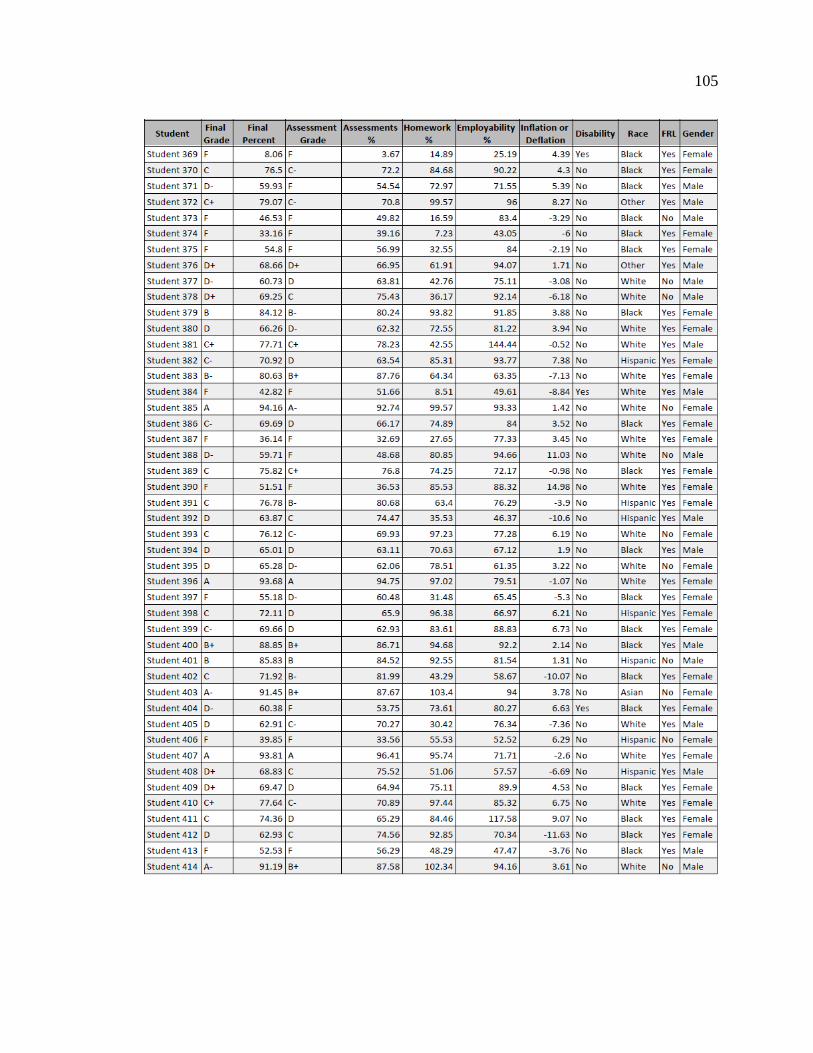
105

106

107

108

109

110

111

112

113

114
APPENDIX B
TUKEY POST HOC RACE COMPARISONS
Multiple Comparisons
Tukey HSD
Dependent Variable
Mean Difference (I-
J) Std. Error Sig.
95% Confidence Interval
Lower Bound
Upper Bound
AssessmentPercent White Black 8.1392* 1.44582 0.000 4.1860 12.0924
Hispanic 5.8335* 2.08155 0.041 0.1421 11.5250
Asian 4.6478 5.20165 0.899 -9.5747 18.8702
Other 1.6660 2.67015 0.971 -5.6348 8.9667
Black White -8.1392* 1.44582 0.000 -12.0924 -4.1860
Hispanic -2.3057 2.17936 0.828 -8.2645 3.6532
Asian -3.4915 5.24156 0.964 -17.8230 10.8401
Other -6.4733 2.74708 0.129 -13.9844 1.0379
Hispanic White -5.8335* 2.08155 0.041 -11.5250 -0.1421
Black 2.3057 2.17936 0.828 -3.6532 8.2645
Asian -1.1858 5.45128 1.000 -16.0908 13.7192
Other -4.1676 3.12873 0.671 -12.7222 4.3870
Asian White -4.6478 5.20165 0.899 -18.8702 9.5747
Black 3.4915 5.24156 0.964 -10.8401 17.8230
Hispanic 1.1858 5.45128 1.000 -13.7192 16.0908
Other -2.9818 5.70204 0.985 -18.5724 12.6088
Other White -1.6660 2.67015 0.971 -8.9667 5.6348
Black 6.4733 2.74708 0.129 -1.0379 13.9844
Hispanic 4.1676 3.12873 0.671 -4.3870 12.7222
Asian 2.9818 5.70204 0.985 -12.6088 18.5724
HomeworkPercent White Black 6.8966* 2.04952 0.007 1.2928 12.5004
Hispanic 11.6745* 2.95071 0.001 3.6066 19.7424
Asian -7.0670 7.37360 0.874 -27.2281 13.0940
Other 3.7381 3.78507 0.861 -6.6111 14.0873

115
Black White -6.8966* 2.04952 0.007 -12.5004 -1.2928
Hispanic 4.7779 3.08935 0.532 -3.6690 13.2249
Asian -13.9636 7.43017 0.329 -34.2793 6.3521
Other -3.1585 3.89412 0.927 -13.8059 7.4889
Hispanic White -11.6745* 2.95071 0.001 -19.7424 -3.6066
Black -4.7779 3.08935 0.532 -13.2249 3.6690
Asian -18.7416 7.72745 0.110 -39.8701 2.3870
Other -7.9364 4.43513 0.380 -20.0630 4.1902
Asian White 7.0670 7.37360 0.874 -13.0940 27.2281
Black 13.9636 7.43017 0.329 -6.3521 34.2793
Hispanic 18.7416 7.72745 0.110 -2.3870 39.8701
Other 10.8051 8.08292 0.668 -11.2953 32.9056
Other White -3.7381 3.78507 0.861 -14.0873 6.6111
Black 3.1585 3.89412 0.927 -7.4889 13.8059
Hispanic 7.9364 4.43513 0.380 -4.1902 20.0630
Asian -10.8051 8.08292 0.668 -32.9056 11.2953
EmployabilityPercent White Black 7.9862* 1.89947 0.000 2.7927 13.1798
Hispanic 7.4646 2.73469 0.051 -0.0126 14.9419
Asian -1.3615 6.83379 1.000 -20.0466 17.3236
Other 2.1989 3.50797 0.971 -7.3927 11.7905
Black White -7.9862* 1.89947 0.000 -13.1798 -2.7927
Hispanic -0.5216 2.86318 1.000 -8.3502 7.3070
Asian -9.3478 6.88622 0.655 -28.1762 9.4807
Other -5.7873 3.60904 0.496 -15.6552 4.0806
Hispanic White -7.4646 2.73469 0.051 -14.9419 0.0126
Black 0.5216 2.86318 1.000 -7.3070 8.3502
Asian -8.8262 7.16174 0.732 -28.4079 10.7556
Other -5.2657 4.11044 0.703 -16.5046 5.9731
Asian White 1.3615 6.83379 1.000 -17.3236 20.0466
Black 9.3478 6.88622 0.655 -9.4807 28.1762
Hispanic 8.8262 7.16174 0.732 -10.7556 28.4079
Other 3.5604 7.49119 0.990 -16.9221 24.0430

116
Other White -2.1989 3.50797 0.971 -11.7905 7.3927
Black 5.7873 3.60904 0.496 -4.0806 15.6552
Hispanic 5.2657 4.11044 0.703 -5.9731 16.5046
Asian -3.5604 7.49119 0.990 -24.0430 16.9221
InflationDeflation White Black -0.1272 0.49423 0.999 -1.4786 1.2241
Hispanic 1.3349 0.71155 0.331 -0.6106 3.2805
Asian -2.9997 1.77811 0.443 -7.8615 1.8620
Other 0.5695 0.91275 0.971 -1.9261 3.0652
Black White 0.1272 0.49423 0.999 -1.2241 1.4786
Hispanic 1.4622 0.74498 0.285 -0.5748 3.4991
Asian -2.8725 1.79175 0.496 -7.7715 2.0265
Other 0.6968 0.93905 0.947 -1.8708 3.2643
Hispanic White -1.3349 0.71155 0.331 -3.2805 0.6106
Black -1.4622 0.74498 0.285 -3.4991 0.5748
Asian -4.3347 1.86344 0.138 -9.4297 0.7604
Other -0.7654 1.06951 0.953 -3.6897 2.1589
Asian White 2.9997 1.77811 0.443 -1.8620 7.8615
Black 2.8725 1.79175 0.496 -2.0265 7.7715
Hispanic 4.3347 1.86344 0.138 -0.7604 9.4297
Other 3.5693 1.94916 0.356 -1.7601 8.8987
Other White -0.5695 0.91275 0.971 -3.0652 1.9261
Black -0.6968 0.93905 0.947 -3.2643 1.8708
Hispanic 0.7654 1.06951 0.953 -2.1589 3.6897
Asian -3.5693 1.94916 0.356 -8.8987 1.7601
Based on observed means. The error term is Mean Square(Error) = 36.767.
*. The mean difference is significant at the .05 level.

117
APPENDIX C
CORRELATION BETWEEN ASSESSMENTS,
HOMEWORK, AND EMPLOYABILITY SCORES
Overall
Percent
Assessment
Percent
Homework
Percent
Employability
Percent
Assessment
Percent
Pearson
Correlation .942** 1 .479** .456**
Sig. (2-tailed) 0.000
0.000 0.000
N 779 779 779 779
**. Correlation is significant at the 0.01 level (2-tailed).