Embed Size (px)
DESCRIPTION
Monetary Tectonics Inflation vs Deflation Chartbook by Incrementum
Citation preview

Incrementum Chartbook # 2:
Monetary Tectonics 50 Slides Illustrating The Tug Of War Between
Inflation And Deflation
Ronald-Peter Stoeferle & Mark J. Valek
January 2014

2
I. Recent Developments
II. Monetary Tectonics
I. Deflationary Forces
II. Inflationary Forces
III. Outlook & Conclusion
IV. Appendix
Please Note: In our publications we distinguish the terms ‘monetary inflation/deflation’ and ‘price inflation/deflation’.
For more information on that topic please visit: http://www.incrementum.li/austrian-school-of-economics/monetary-inflation-versus-price-inflation/

3
Due to structural over-indebtedness and the resulting addiction to low/negative real interest
rates, we are certain that the traditional way of thinking about financial markets and asset
management is no longer beneficial for investors.
Therefore, at Incrementum we evaluate all our investments not only from the perspective of
the global economy but also in the context of the current state of the global monetary
regime. This analysis produces what we consider a truly holistic view of the state of
financial markets.
We sincerely believe that the Austrian School of Economics provides us with the
appropriate intellectual foundation, especially in this demanding financial and economic
environment.
Ronald-Peter Stoeferle, Mark J. Valek
Financial markets have become highly dependent on central bank policies. Grasping the
consequences of the interplay between monetary inflation and deflation is crucial for prudent
investors.
Our Conviction

4
I. Recent Developments

The History Of UnderQEstimation
Is This Time Really Different?
5
Sources: Federal Reserve St. Louis, Incrementum AG
0
500
1.000
1.500
2.000
2.500
3.000
3.500
4.000
4.500
5.000
01.2
007
05.2
007
09.2
007
01.2
008
05.2
008
09.2
008
01.2
009
05.2
009
09.2
009
01.2
010
05.2
010
09.2
010
01.2
011
05.2
011
09.2
011
01.2
012
05.2
012
09.2
012
01.2
013
05.2
013
09.2
013
01.2
014
05.2
014
09.2
014
01.2
015
05.2
015
09.2
015
01.2
016
All Federal Reserve Banks - Actual Path Projection 2010 Projection 2011
Projection 2012 Projection Mid 2013 Projection 2014
QE 1: 100%
Tapering
QE 2: 100%
Tapering
QE3: 12%
Tapering, Jan 2014
QE 1 QE 2 OT QE 3
Current
Projection:
100% QE3
Tapering in
Dec 2014; no
Exit Strategy
formulated
Failed
Projection:
Post QE 1
Exit Strategy
Failed
Projection:
Post QE 2
Exit Strategy
Failed
Projection:
Post OT
Exit Strategy
Failed
Projection:
Autumn
2013
Tapering
FE
D B
ala
nc
e S
he
et
in B
n.
US
D

6
Back To Normal Again? …Putting Tapering Into Perspective
► Cutting Interest Rates (2007-2008)
► Zero Interest Rate Policy (since 2008)
► Forward Guidance (since 2008)
► QE I (2008-2010)
Successful Tapering (100%)
Talking about Exit Strategy
► QE II (2010-2011)
Successful Tapering (100%)
Talking about Exit Strategy
► Operation Twist (2011-2012)
► QE III (since 2012)
Starting Small Tapering Jan 2014 (11.7%)
► Complete Tapering (current projection: Nov 2014)
► Reduce Forward Guidance (best 2016)
► Communicate Exit Strategy
► Sell bonds worth approx. 3,000 bn into the market!
► Reverse Zero Interest Rate Policy
Failed Projection:
Post QE 1
Exit Strategy
Failed Projection:
Post QE 2
Exit Strategy
IF this is the first step to policy
normalization, we are light-
years away from normal policy! To do:

7
The ‘Monetary Atlas’ Shrugs…
So Much Easing, And Still No Price Inflation?
Sources: Nowandfutures.com, UBS Research, Federal Reserve St. Louis, Incrementum AG
Monetary Deflation:
Credit deleveraging e.g. due to
regulatory changes and
sluggish credit growth means
currency supply is being
reduced.
Monetary Inflation:
Central bank (directly) only
controls a tiny part of the
total effective liquidity!
Monetary Inflation of the FED
intends to offset deflationary
forces.
To
tal
Liq
uid
ity i
s 1
3x larg
er
than
Mo
neta
ry B
ase
Total Effective Liquidity (including Repo)
USD 47,500 Bn
M3
USD 16,555 Bn
M2
USD 10,934 Bn
M0
USD 4,010 Bn

Preventing Price Deflation, Creating Asset Price Inflation?
8
► Deleveraging* leads to consumer price deflation and
asset price deflation. Tax revenue declines significantly.
Asset price inflation is taxed, asset price deflation
cannot be.
► Falling prices result in real appreciation of nominal
denominated debt. Increasing amounts of debt can
therefore no longer be serviced.
► Debt liquidation and price deflation have fatal
consequences for large parts of the banking system, in
an over-indebted world.
► Central banks also have the mandate to guarantee
‘financial market stability’ and to make sure “It” doesn’t
happen here…
► In a highly leveraged world, price deflation is – from a
political viewpoint – a horror scenario that has to be
averted whatever it takes, due to the following reasons:
Translation: “Make sure to keep currency and credit
supply growing exponentially”
*Note: Deleveraging may have taken place in some parts of the economy but in aggregate the total debt/credit has kept on growing
Please refer to: http://www.federalreserve.gov/boarddocs/speeches/2002/20021121/
► There is no inflation? False!
► ‘Successful’ prevention of price deflation via monetary
inflation has led to massive asset price inflation!

Where Did All The Money Go? Financial Assets And Luxury Goods Profit From Monetary Inflation
9
Sources: Federal Reserve St. Louis, Incrementum AG
*Latest data available, Nov, 2013
0% 50% 100% 150% 200% 250% 300% 350% 400% 450% 500%
Consumer Price Index - U all items*
M2 US Money Supply*
BofA US Corporate Bond Index
S&P 500 Index
LVMH Louis Vuitton Shareprice
Sotheby's Shareprice
Cumulative Price Changes 12/2008 – 12/2013
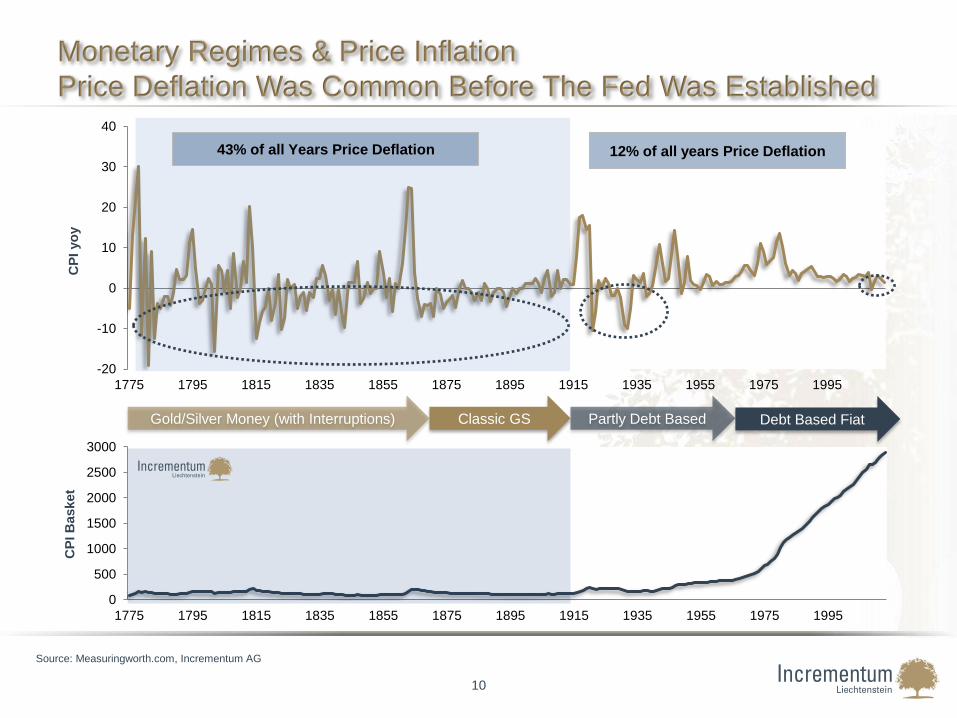
Monetary Regimes & Price Inflation
Price Deflation Was Common Before The Fed Was Established
10
Source: Measuringworth.com, Incrementum AG
CP
I B
asket
-20
-10
0
10
20
30
40
1775 1795 1815 1835 1855 1875 1895 1915 1935 1955 1975 1995
CP
I yo
y
43% of all Years Price Deflation 12% of all years Price Deflation
0
500
1000
1500
2000
2500
3000
1775 1795 1815 1835 1855 1875 1895 1915 1935 1955 1975 1995
Classic GS Partly Debt Based Gold/Silver Money (with Interruptions) Debt Based Fiat

11
II. Monetary Tectonics
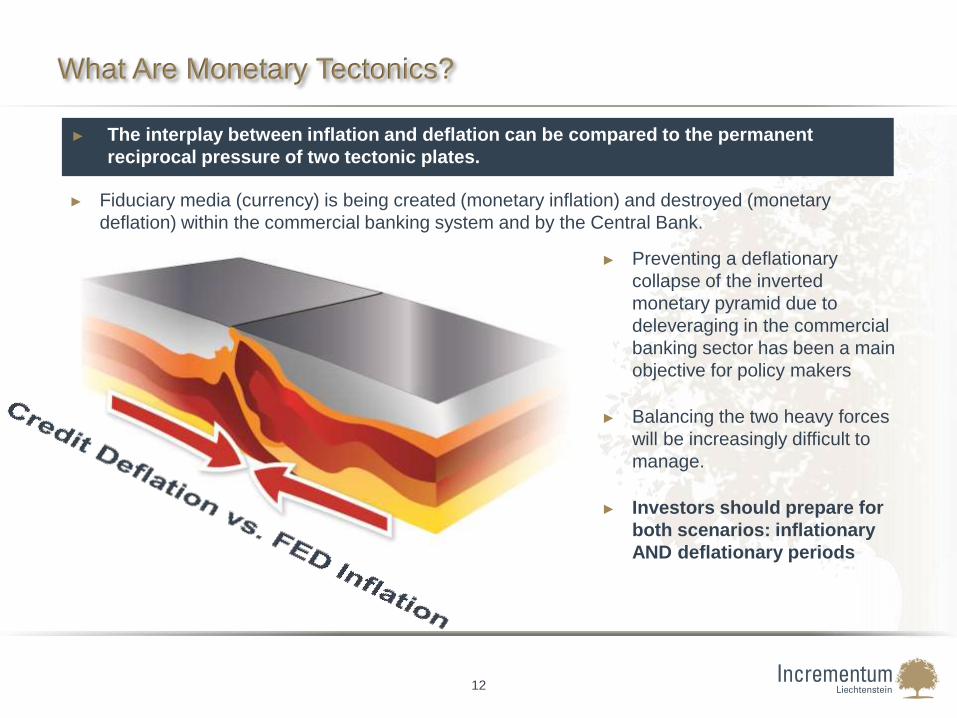
What Are Monetary Tectonics?
12
► The interplay between inflation and deflation can be compared to the permanent
reciprocal pressure of two tectonic plates.
► Preventing a deflationary
collapse of the inverted
monetary pyramid due to
deleveraging in the commercial
banking sector has been a main
objective for policy makers
► Balancing the two heavy forces
will be increasingly difficult to
manage.
► Investors should prepare for
both scenarios: inflationary
AND deflationary periods
► Fiduciary media (currency) is being created (monetary inflation) and destroyed (monetary
deflation) within the commercial banking system and by the Central Bank.

13
Comprehending The Currency Composition*
Sources: Nowandfutures.com, UBS Research, Federal Reserve St. Louis, Incrementum AG
M0 or ‘base money’ is
directly created by the
FED
The Central bank (directly) only controls a small part of total effective liquidity!
It is important to remember that, due to the fractional reserve banking system, most of the currency is
lent into existence through the commercial banking system.
M0
USD 4,010 Bn
Fiduciary media lent into
existence by commercial
banks, through fractional
reserve system.
The broader currency supply can be
calculated according to different
methodologies (e.g. M2, M3,
TMS…)
M2
USD 10,934 Bn
M3
USD 16,555 Bn
Total liquidity, including
liquidity created trough
financial markets (repo
markets)
Total Effective Liquidity (including Repo)
USD 47,500 Bn
*Note: We encourage the interested reader to look up what F.A.Hayek wrote about the concept of the inverted pyramid: http://mises.org/books/pricesproduction.pdf

Deflating Credit vs. Inflating Monetary Base
14
Sources: Federal Reserve St. Louis, Incrementum AG
500
1.000
1.500
2.000
2.500
3.000
3.500
4.000
4.000
4.500
5.000
5.500
6.000
6.500
7.000
7.500
8.000
20
00
20
01
20
02
20
03
20
04
20
05
20
06
20
07
20
08
20
09
20
10
20
11
20
12
20
13
Mo
net
ary
Bas
e (b
n U
SD)
M2 m
inus M
oneta
ry B
ase (
bn U
SD
)
M2 minus Monetary Base Monetary Base

The Tug Of War*
15
Team Blue: Deflationary Forces Team Red: Inflationary Forces
► Balance Sheet Deleveraging: Undercapitalized banks –
still recovering from the crisis – are reluctant to lend
► Sluggish Credit Growth: Over-indebted consumers are
reluctant to borrow
► Regulation: Basel III
► High Demand to hold Money (low inflation exp.)**
► Productivity gains
► Defaults and Bail-ins (Europe: Greece, Cyprus)
► Demographics
► Zero interest rate policy
► Communications Policy (forward guidance)
► Operation Twist
► Quantitative Easing
► Currency Wars
► Eligibility Criteria for Collateral (ECB)
* Please also refer to another outstanding speech of James Rickards here: http://www.youtube.com/watch?v=9fXHV6MnP0E
** Low velocity according to the Monetarist Paradigm

16
II. Monetary Tectonics
I. Deflationary Forces

17
“Falling prices or price deflation are
not the cause of economic and financial
crises, but their consequences - and at
the same time their cure.”
Roland Baader

Total Credit Market Debt In Percent Of US GDP:
Ratio Reduced Slightly Since 2007 – Still Close To Record Highs
18
Sources: Federal Reserve St. Louis, Incrementum AG
120%
170%
220%
270%
320%
370%
19
71
19
73
19
75
19
77
19
79
19
81
19
83
19
85
19
87
19
89
19
91
19
93
19
95
19
97
19
99
20
01
20
03
20
05
20
07
20
09
20
11
20
13
Total Credit Market Debt as a % of US GDP

US Bank Credit Of All Commercial Banks (bn USD):
Sluggish Growth, Deceleration Reminds Us Of 2007/2008
19
Sources: Federal Reserve St. Louis, Incrementum AG
0
1.000
2.000
3.000
4.000
5.000
6.000
7.000
8.000
9.000
10.000
11.000
19
71
19
73
19
75
19
77
19
79
19
81
19
83
19
85
19
87
19
89
19
91
19
93
19
95
19
97
19
99
20
01
20
03
20
05
20
07
20
09
20
11
20
13
US Commercial Bank Assets Bank Credit
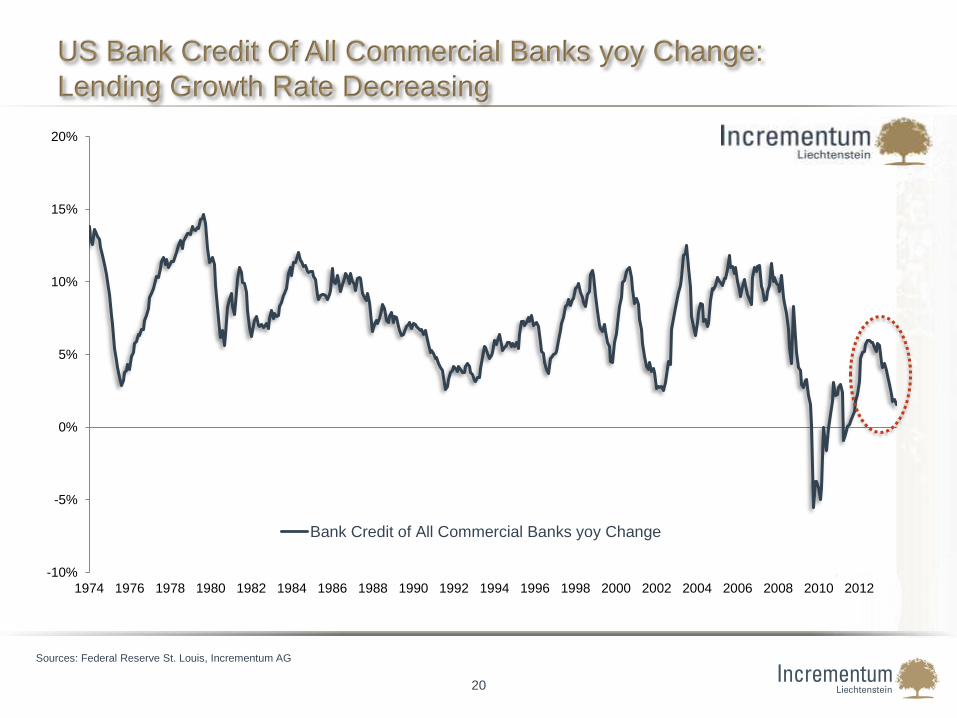
US Bank Credit Of All Commercial Banks yoy Change:
Lending Growth Rate Decreasing
20
Sources: Federal Reserve St. Louis, Incrementum AG
-10%
-5%
0%
5%
10%
15%
20%
1974 1976 1978 1980 1982 1984 1986 1988 1990 1992 1994 1996 1998 2000 2002 2004 2006 2008 2010 2012
Bank Credit of All Commercial Banks yoy Change

Money Supply Growth In US & Eurozone Trending Lower:
Central Banks Will Take Aggressive Countermeasures
21
Sources: European Central Bank, Federal Reserve St. Louis, Incrementum AG
-4
-2
0
2
4
6
8
10
12
14
1991 1993 1995 1997 1999 2001 2003 2005 2007 2009 2011 2013
M2 USA yoy Change M3 Eurozone yoy Change

US Price Inflation:
Personal Consumption Expenditures Exhibiting Disinflation
22
Sources: Federal Reserve St. Louis, Incrementum AG
-2
-1
1
2
3
4
5
19
97
19
98
19
99
20
00
20
01
20
02
20
03
20
04
20
05
20
06
20
07
20
08
20
09
20
10
20
11
20
12
20
13
US Inflation (PCE Price Index) yoy

Gold/Silver-Ratio:
Gold Outperforms Silver During Disinflationary/Deflationary Periods
23
Sources: Federal Reserve St. Louis, Incrementum AG
10
20
30
40
50
60
70
80
90
100
19
71
19
73
19
75
19
77
19
79
19
81
19
83
19
85
19
87
19
89
19
91
19
93
19
95
19
97
19
99
20
01
20
03
20
05
20
07
20
09
20
11
20
13

Gold / TLT*-Ratio
Gold To Bond Ratio Confirming Deflationary Pressure
24
*TLT: iShares 20+ year Treasury bond ETF
Sources: Paul Mylchreest – Thunder Road Report, Federal Reserve St. Louis, Incrementum AG
2
4
6
8
10
12
14
16
18
20
02
20
03
20
04
20
05
20
06
20
07
20
08
20
09
20
10
20
11
20
12
20
13
Gold / TLT-Ratio
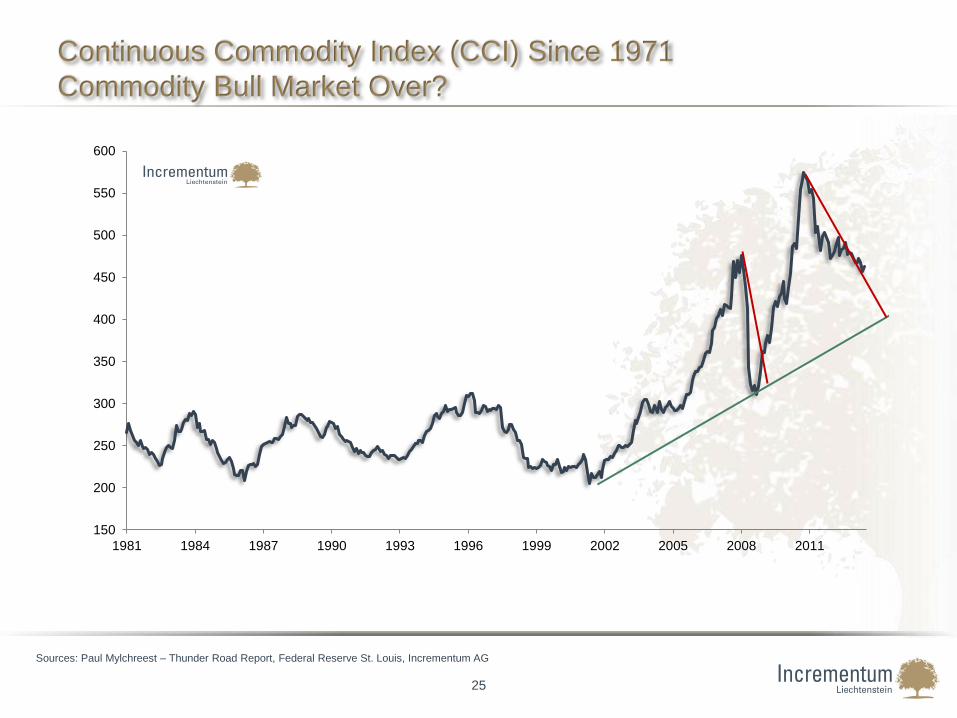
Continuous Commodity Index (CCI) Since 1971
Commodity Bull Market Over?
25
Sources: Paul Mylchreest – Thunder Road Report, Federal Reserve St. Louis, Incrementum AG
150
200
250
300
350
400
450
500
550
600
1981 1984 1987 1990 1993 1996 1999 2002 2005 2008 2011
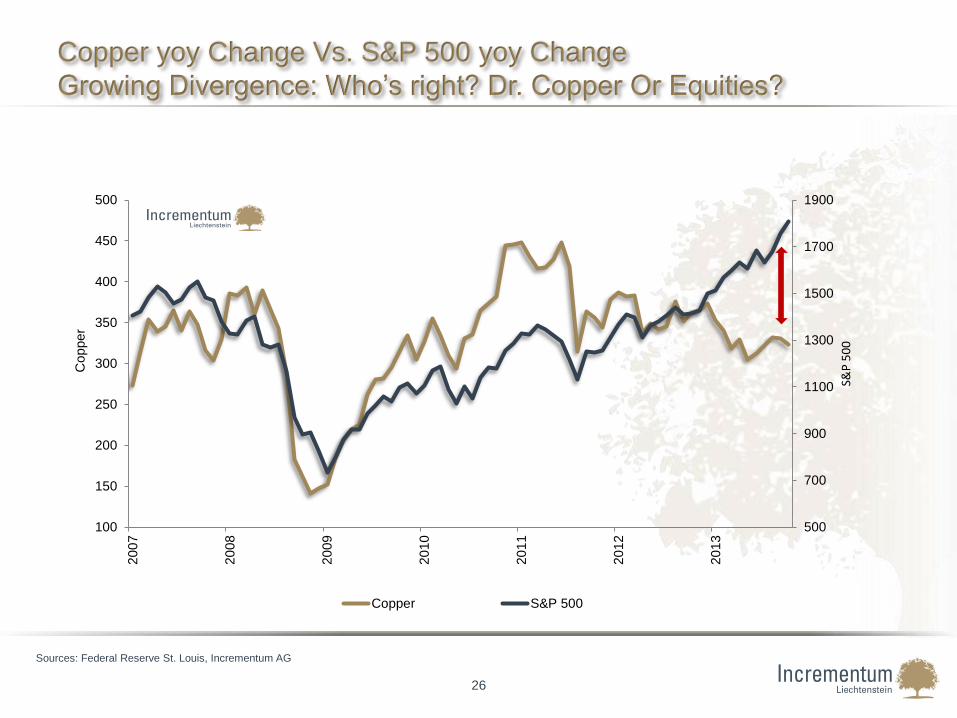
Copper yoy Change Vs. S&P 500 yoy Change
Growing Divergence: Who’s right? Dr. Copper Or Equities?
26
Sources: Federal Reserve St. Louis, Incrementum AG
500
700
900
1100
1300
1500
1700
1900
100
150
200
250
300
350
400
450
500
20
07
20
08
20
09
20
10
20
11
20
12
20
13
S&P
50
0
Copper
Copper S&P 500

27
The Consensus View: No Inflation!

Inflation Fears?
Not Even The Germans Are Afraid Anymore!
28
Source: http://www.bloomberg.com/news/2013-12-29/germany-abandons-inflation-angst-with-merkel-offering-new-agenda.html

Inflation Expectations:
Stable, Or Grinding Lower For EUR & USD
29
Sources: Bloomberg, Incrementum AG
-1
0
1
2
3
4
20
02
20
03
20
04
20
05
20
06
20
07
20
08
20
09
20
10
20
11
20
12
20
13
5Y Break Even Rates US 5Y Break Even Rates Germany

30
Deflation Fears Inch Up Again?
Note: The numbers on the graph reflect how many searches have been done for a particular term, relative to the total number of searches done on Google over time.
They don't represent absolute search volume numbers, because the data is normalized.
Google Search Terms for Financial News: „Inflation“ vs. „Deflation“
Source: Google Trends, Incrementum AG
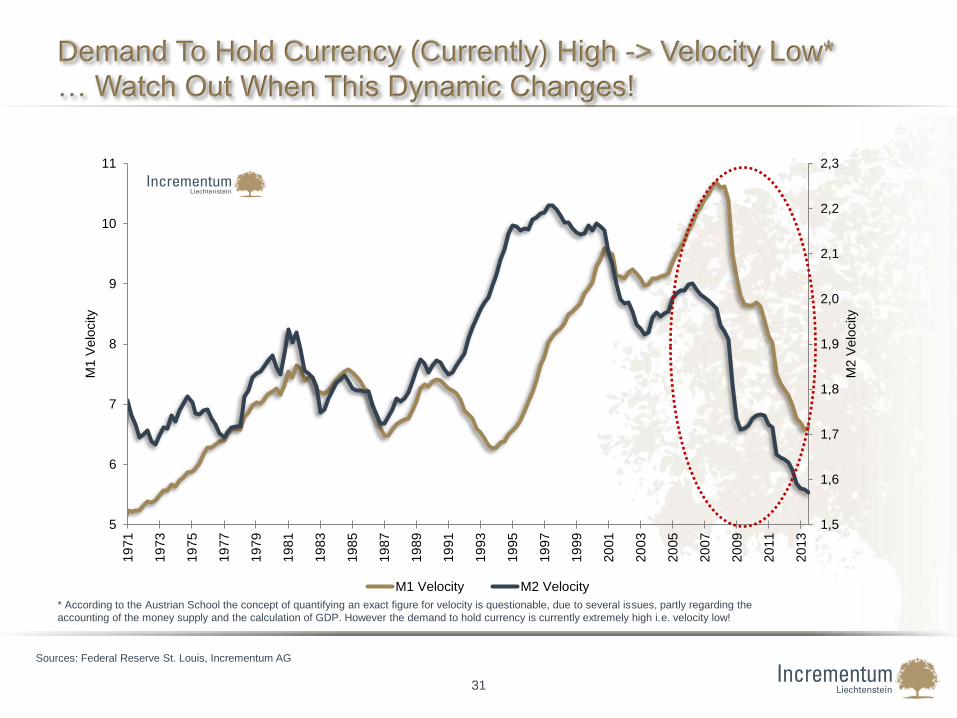
Demand To Hold Currency (Currently) High -> Velocity Low*
… Watch Out When This Dynamic Changes!
31
Sources: Federal Reserve St. Louis, Incrementum AG
* According to the Austrian School the concept of quantifying an exact figure for velocity is questionable, due to several issues, partly regarding the
accounting of the money supply and the calculation of GDP. However the demand to hold currency is currently extremely high i.e. velocity low!
1,5
1,6
1,7
1,8
1,9
2,0
2,1
2,2
2,3
5
6
7
8
9
10
11
19
71
19
73
19
75
19
77
19
79
19
81
19
83
19
85
19
87
19
89
19
91
19
93
19
95
19
97
19
99
20
01
20
03
20
05
20
07
20
09
20
11
20
13
M2 V
elo
city
M1 V
elo
city
M1 Velocity M2 Velocity

Deflation…In One Picture
32
Note: Perhaps we just should have bought more Christmas presents for ourselves? Have a look at this:
http://www.youtube.com/watch?v=TM8L7bdwVaA

33
II. Monetary Tectonics
II. Inflationary Forces
34
“The most important thing to remember is that inflation is not an act
of God, that inflation is not a catastrophe of the elements or a
disease that comes like the plague.
Inflation is a policy.”
Ludwig von Mises, Economic Policy

Monetary Base Since 1918
35
Sources: Federal Reserve St. Louis, Incrementum AG
0
500
1000
1500
2000
2500
3000
3500
4000
19
18
19
23
19
28
19
33
19
38
19
43
19
48
19
53
19
58
19
63
19
68
19
73
19
78
19
83
19
88
19
93
19
98
20
03
20
08
20
13
Moneta
ry B
ase (
Bn U
SD
)
St. Louis Adjusted Monetary Base
QE1
QE2
QE3

36
Sources: Federal Reserve St. Louis, Incrementum AG
U.S. Households Stop Deleveraging Households And Nonprofit Organizations: Credit Market Instruments yoy Change
-4
-2
0
2
4
6
8
10
12
14
16
18
19
71
19
73
19
75
19
77
19
79
19
81
19
83
19
85
19
87
19
89
19
91
19
93
19
95
19
97
19
99
20
01
20
03
20
05
20
07
20
09
20
11
20
13
US Household Sector Debt Change YoY

37
Sources: Federal Reserve St. Louis, Incrementum AG
QE And S&P 500
The Wealth Effect Is Working… At Least For The Wealthy
600
800
1000
1200
1400
1600
1800
1800
2200
2600
3000
3400
3800
4200
2009 2010 2011 2012 2013
S&
P 5
00 I
ndex
Fed T
ota
l A
ssets
(bn U
SD
)
FED Total Assets S&P 500
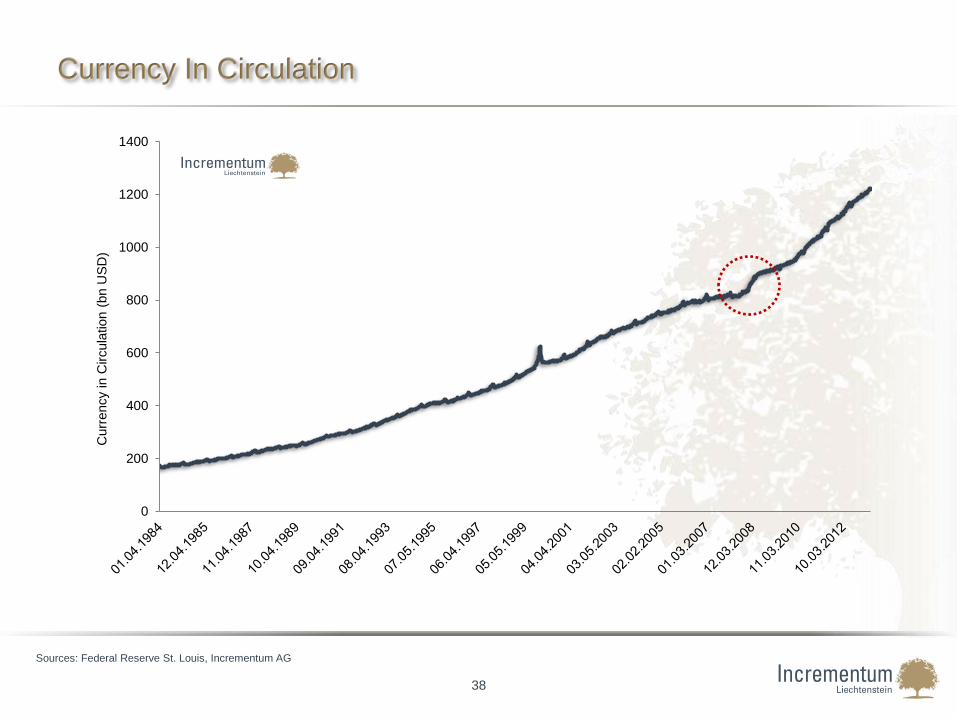
Currency In Circulation
38
Sources: Federal Reserve St. Louis, Incrementum AG
0
200
400
600
800
1000
1200
1400
Curr
ency
in C
ircula
tion (
bn U
SD
)

A Flood Of Reserves Has Been Dammed Up….
Watch Out For Rates Reduction On Reserves
39
Sources: Federal Reserve St. Louis, Incrementum AG
0
500
1000
1500
2000
2500
3000E
xcess R
eserv
es (
bn U
SD
)
Excess Reserves of Depository Institutions

40
III. Outlook and Conclusions

41
Conclusion:
Inflation Or Deflation?
► The natural market adjustment process of the
current crisis would be highly deflationary.
► The reason for this lies within the fractional
reserve banking system, as the largest part of
money in circulation is created by credit within the
commercial banking sector. The much smaller
portion is created by central banks.
► As the financial sector in most parts of the world
reversed its preceding credit expansion, overall
credit supply is reduced significantly.
► This (credit) deflation, respectively deleveraging,
is compensated by very expansionary central
bank policies.
Monetary Tectonics - Pressure building up
► The unintended consequences of these
monetary interventions will result in increasing
volatility, potentially further disinflationary
/deflationary phases and eventually (highly)
inflationary phases!

42
Monetary Seismograph
Our Approach:
Being Prepared For Inflation And Deflation!
► Price inflation is a monetary phenomenon. Due to the
fractional reserve banking system and the dynamics
of ‘monetary tectonics’, inflationary and deflationary
phases may alternate.
► To measure how much monetary inflation is spilling into
the markets, we utilize a number of market-based
indicators, which are combined in a proprietary signal.
This method of measurement can be compared to a
monetary seismograph.
► The measurement results in the “Incrementum-Inflation
Signal”, indicating the current momentum of inflation.
► From our point of view, it is not the absolute level of
inflation but rather the change of inflation that matters.
According to the respective signal we position
ourselves for rising, neutral or falling inflation trends.

Disinflation
late 1990ies
Deflation
Scare 2001
43
Commodity Boom 1999 - 2008
Monetary Seismograph:
Currently Still Signaling Falling Inflation
Ris
ing
In
flati
on
Mo
men
tum
Deflation
late 2008,
2009
2009 -2011
Reflation
Disinflation
Late 2011 -
current
Fallin
g In
flati
on
Mo
m.
No green
light yet, for
inflation
protecting
asset
classes.
The last days
though have
brought us
closer to a
neutral
signal!
Sources: Bloomberg, Incrementum AG
0,75-1,5
-1
-0,5
0
0,5
1
1,5
2
2,5
1995
1996
1997
1998
1999
2000
2001
2002
2003
2004
2005
2006
2007
2008
2009
2010
2011
2012
2013
Incrementum Inflation Signal DJ UBS Commodity Index Spot

44
Outlook: Policy Strategy Nr. 1: Prayer
Dear Lord, please let Monetary Stimuli Work This Time

45
Outlook: Policy Strategy Nr. 2: Unconventional Measures
How To Achieve Higher Price Inflation?
Cutting Interest Rates (2007-2008)
Zero Interest Rate Policy (since 2008)
Communications Policy (since 2008)
QE I (2008-2010)
QE II (2010-2011)
Operation Twist (2011-2012)
QE III (since 2012)
► ‘Strengthening guidance’
► Change of the definition/threshold of unemployment
► Change of the inflation threshold
► More direct Measures (e.g. Funding for Lending Program; Helicopter Money)
► More QE (if ‘required’)
► Changing Interest Rates on Reserves
What More Is To Come?
We encourage interested readers to watch the Dec. 2013 FED Press Conference, especially relevant starting from min. 20:00
Click here: http://www.youtube.com/watch?v=J0Ma3twcFkY
46
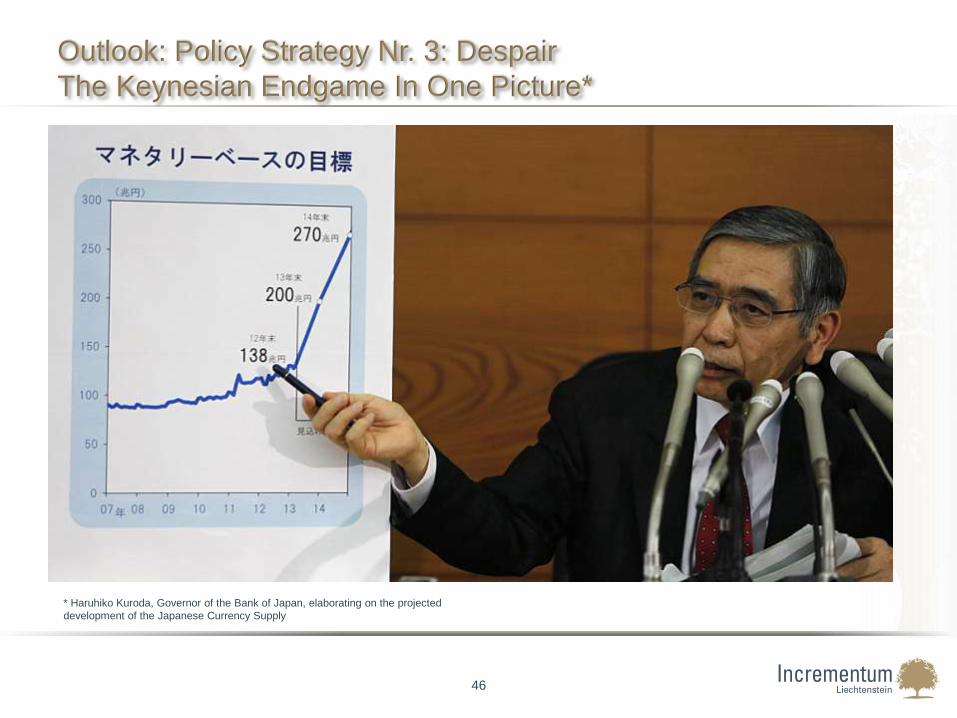
Outlook: Policy Strategy Nr. 3: Despair
The Keynesian Endgame In One Picture*
* Haruhiko Kuroda, Governor of the Bank of Japan, elaborating on the projected
development of the Japanese Currency Supply

47
“… but it is not that certain that in the long run deflation is more harmful than inflation. [...]
Because moderate inflation is always pleasant as and when it is happening, whereas deflation
is direct and painful. There is no need to take precaution against a situation whose unpleasant
effects can be felt immediately and sharply; however, precaution is necessary for a measure
that is immediately pleasant or helps alleviate problems but that entails a much more
substantial damage which can only be felt later.
The difference is that in case of inflation, the pleasant surprise
comes first and is followed by the reaction later, whereas in case
of deflation the first effect on business activity is depressive.”
Friedrich August von Hayek, The Constitution of Liberty

48
IV. APPENDIX

49
About Us
► Incrementum AG is an owner-managed asset management boutique based in the Principality of Liechtenstein.
► Our Investment Principles are based on the Austrian School of Economics. We sincerely believe that the
Austrian School of Economics provides us with the appropriate intellectual foundation especially in this highly
demanding financial and economic environment.
► Independence is a main Pillar of our Philosophy
► Our Core Competences are :
► Austrian Investing
► Precious Metals
► Absolute Return
► Bottom Up Fundamental Research
► Incrementum AG’s partners are highly qualified and have over 140 years of combined banking experience. Prior
to joining the company, the partners held positions at UBS, Dresdner Bank, Lombard Odier, Darier Hentsch &
Cie., Cantrade Private Bank, PBS Private Bank, Bank Leu, Pictet & Cie., Bank Sal. Oppenheim, Merrill Lynch,
Raiffeisen Capital Management, Erste Group and Société Générale.
► For further information please visit: www.incrementum.li

50
Our Philosophy At Incrementum:
The Austrian School Of Economics
► The Austrian School of Economics originated in Vienna in the late
19th century and provides an alternative assessment of economic
affairs. Contrary to mainstream economics, this analysis produces a
truly holistic view of financial markets, because it integrates the
current state of the monetary regime.
► Followers of the Austrian School have been extremely successful at
anticipating major economic events like the Great Depression, the
stagflationary environment of the 1970s, the Dotcom Bubble and the
Housing Bubble.
► The insights of this school of thought offer exceptional understanding
and superior interpretation of the interdependencies between
money supply and price inflation.
► This knowledge is valuable especially nowadays, as central bank
policies massively distort and influence financial markets. Grasping
the consequences of the interplay between monetary inflation
and deflation will be crucial for prudent investors.
► Scholars of the Austrian School are convinced, that today's radical
monetary and fiscal policy interventions will not lead to a self-
sustained recovery of the economy, but to further turmoil in
financial markets.
For further information about the Austrian School please visit our webpage:
http://www.incrementum.li/austrian-school-of-economics/an-introduction-to-the-austrian-school-of-economics

Disclaimer
CAUTIONARY NOTE REGARDING FORWARD-LOOKING STATEMENTS
THE INFORMATION CONTAINED IN THIS DOCUMENT HAS NOT BEEN INDEPENDENTLY VERIFIED AND NO
REPRESENTATION OR WARRANTY EXPRESSED OR IMPLIED IS MADE AS TO, AND NO RELIANCE SHOULD BE
PLACED ON, THE FAIRNESS, ACCURACY,COMPLETENESS OR CORRECTNESS OF THIS INFORMATION OR
OPINIONS CONTAINED HEREIN.
CERTAIN STATEMENTS CONTAINED IN THIS DOCUMENT MAY BE STATEMENTS OF FUTURE EXPECTATIONS AND
OTHER FORWARD-LOOKING STATEMENTS THAT ARE BASED ON MANAGEMENT’S CURRENT VIEWS AND
ASSUMPTIONS AND INVOLVE KNOWN AND UNKNOWN RISKS AND UNCERTAINTIES THAT COULD CAUSE ACTUAL
RESULTS, PERFORMANCE OR EVENTS TO DIFFER MATERIALLY FROM THOSE EXPRESSED OR IMPLIED IN SUCH
STATEMENTS.
NONE OF INCREMENTUM AG OR ANY OF ITS AFFILIATES, ADVISORS OR REPRESENTATIVES SHALL HAVE ANY
LIABILITY WHATSOEVER (IN NEGLIGENCE OR OTHERWISE) FOR ANY LOSS HOWSOEVER ARISING FROM ANY
USE OF THIS DOCUMENT OR ITS CONTENT OR OTHERWISE ARISING IN CONNECTION WITH THIS DOCUMENT.
THIS DOCUMENT DOES NOT CONSTITUTE AN OFFER OR INVITATION TO PURCHASE OR SUBSCRIBE FOR ANY
SHARES AND NEITHER IT NOR ANY PART OF IT SHALLFORM THE BASIS OF OR BE RELIED UPON IN
CONNECTION WITH ANY CONTRACT OR COMMITMENT WHATSOEVER.