Embed Size (px)
Citation preview
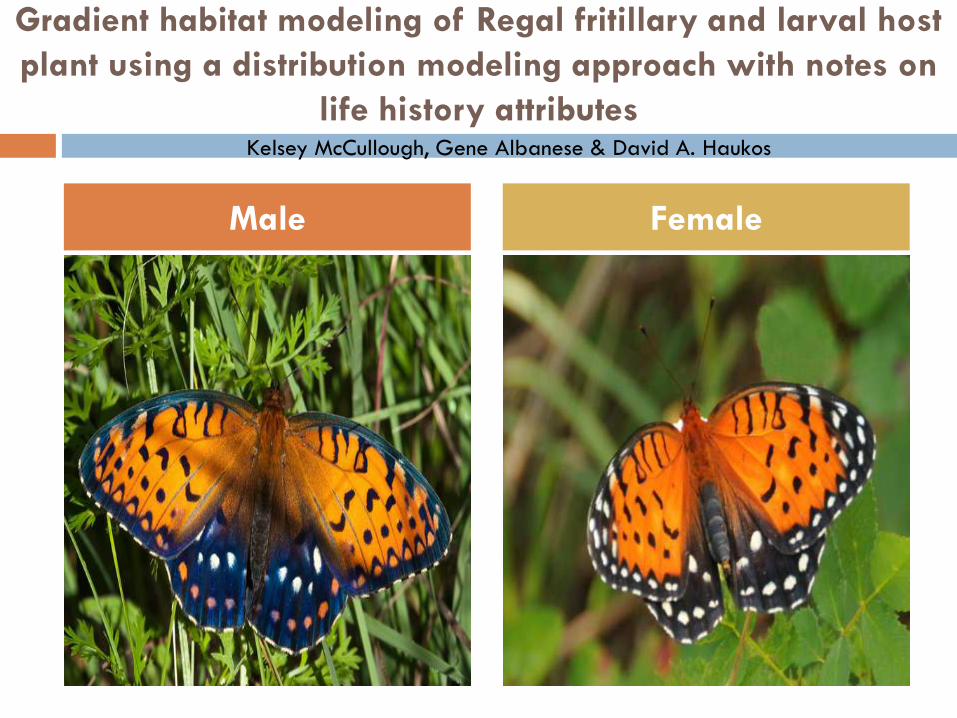
Gradient habitat modeling of Regal fritillary and larval host
plant using a distribution modeling approach with notes on
life history attributes
Male Female
Kelsey McCullough, Gene Albanese & David A. Haukos
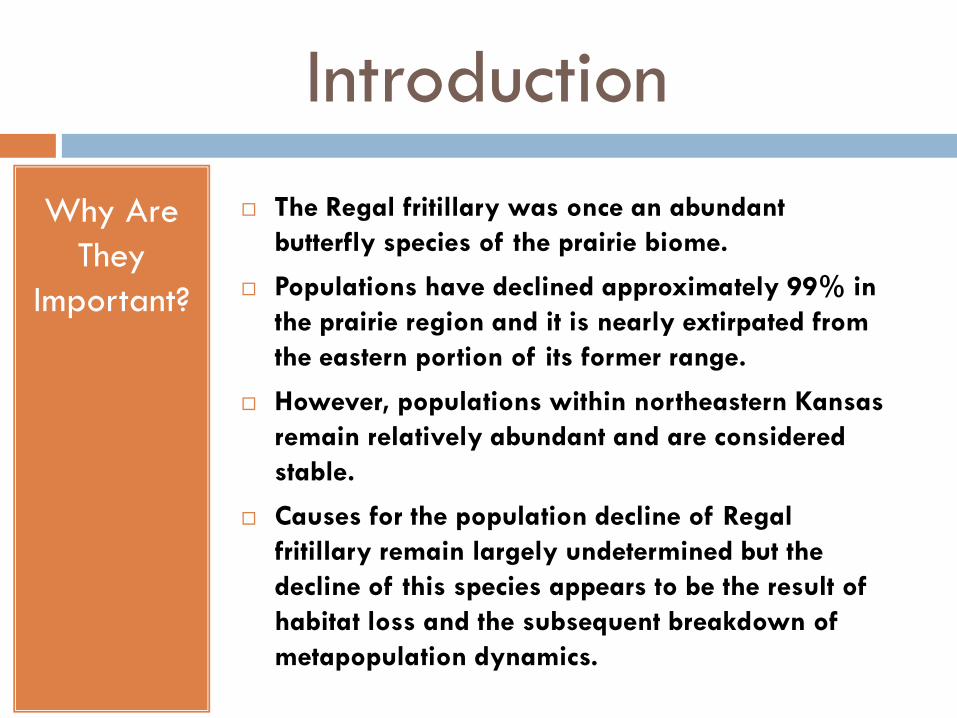
Introduction
Why Are
They
Important?
The Regal fritillary was once an abundant
butterfly species of the prairie biome.
Populations have declined approximately 99% in
the prairie region and it is nearly extirpated from
the eastern portion of its former range.
However, populations within northeastern Kansas
remain relatively abundant and are considered
stable.
Causes for the population decline of Regal
fritillary remain largely undetermined but the
decline of this species appears to be the result of
habitat loss and the subsequent breakdown of
metapopulation dynamics.
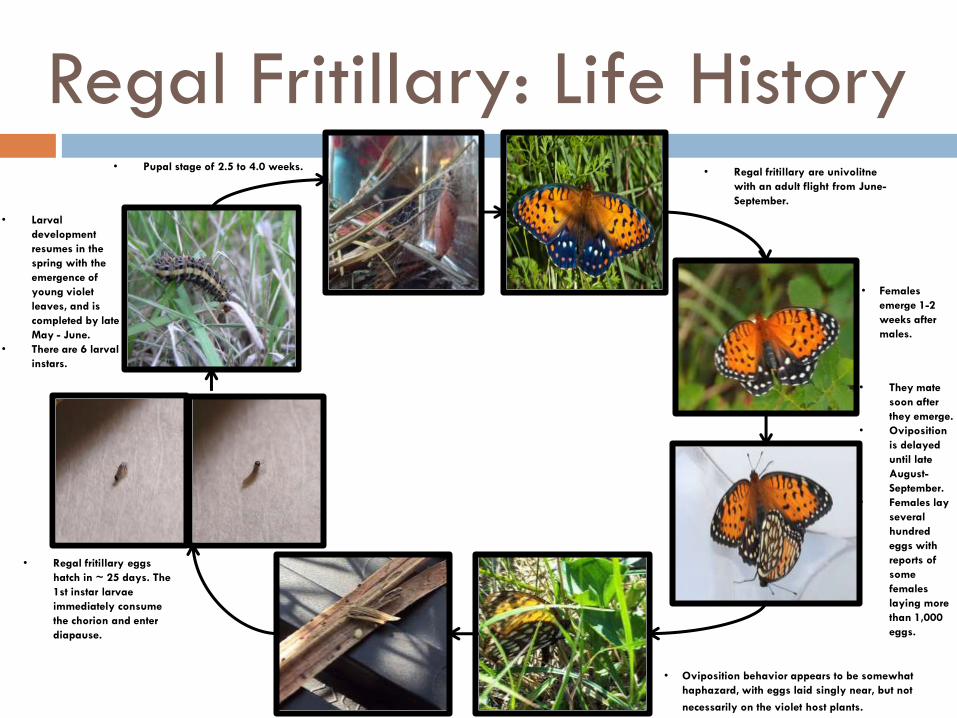
Regal Fritillary: Life History• Regal fritillary are univolitne
with an adult flight from June-
September.
• They mate
soon after
they emerge.
• Oviposition
is delayed
until late
August-
September.
• Females lay
several
hundred
eggs with
reports of
some
females
laying more
than 1,000
eggs.
• Females
emerge 1-2
weeks after
males.
• Oviposition behavior appears to be somewhat
haphazard, with eggs laid singly near, but not
necessarily on the violet host plants.
• Regal fritillary eggs
hatch in ~ 25 days. The
1st instar larvae
immediately consume
the chorion and enter
diapause.
• Larval
development
resumes in the
spring with the
emergence of
young violet
leaves, and is
completed by late
May - June.
• There are 6 larval
instars.
• Pupal stage of 2.5 to 4.0 weeks.

Larval Host Plant
Violets (Viola sp.) are the larval food plants for members of the genus Speyeria. While they are able to use a variety of species, Regal fritillary are associated with specific violet species in different parts of their range.
Birdfoot and Prairie violet (V. pedata, pedatifida) are thought to be the preferred larval food plants throughout the Midwestand Great Plains.
Prairie violet is a small perennial plant characteristic of native tallgrass communities within Kansas.
• Background Prairie Violet
Objectives
Provide spatially explicit estimates of the current distribution and relative abundance
patterns of Prairie violet and identify habitat features and management practices that
influence the occurrence and density of Prairie violet at the Fort Riley Military Reserve
(FRMR) and Konza Prairie Biological Station (KPBS).
Provide spatially explicit estimates of the current distribution and relative abundance
patterns of adult Regal fritillary and identify habitat features and management practices
that influence the occurrence and density of adult Regal fritillary within the FRMR and
KPBS.
Provide spatially explicit estimates of the current distribution and relative abundance
patterns of post diapause female Regal fritillary and identify habitat features and
management practices that influence the occurrence and density of post diapause female
Regal fritillary within the FRMR and KPBS.
Provide spatially explicit estimates of the current distribution and relative abundance
patterns of Regal fritillary larvae and identify habitat features and management practices
that influence the occurrence and density of late instar larvae among discrete clusters of
Prairie violet within the FRMR and KPBS.
Predicting Prairie Violet Occurrence
Methods We used Prairie violet occurrence data
collected during the 2012 REU program
at KPBS as the response variable in a
maximum entropy model.
Using GIS technologies we calculated a
suite of surface metrics.
From these surface metrics, we selected
a parsimonious set of variables for the
final distribution model.

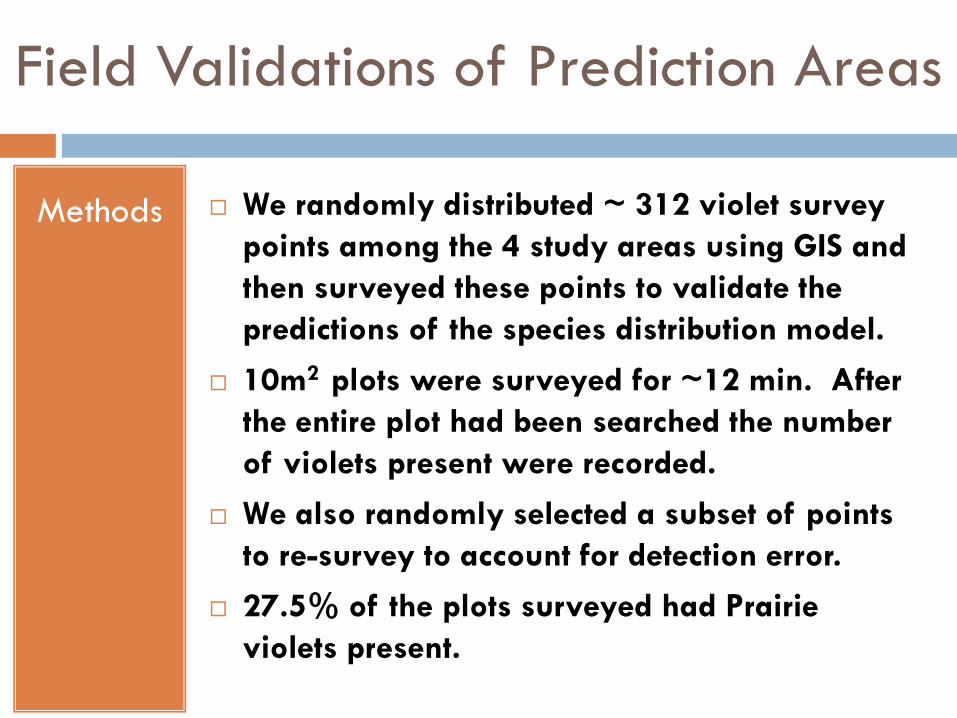
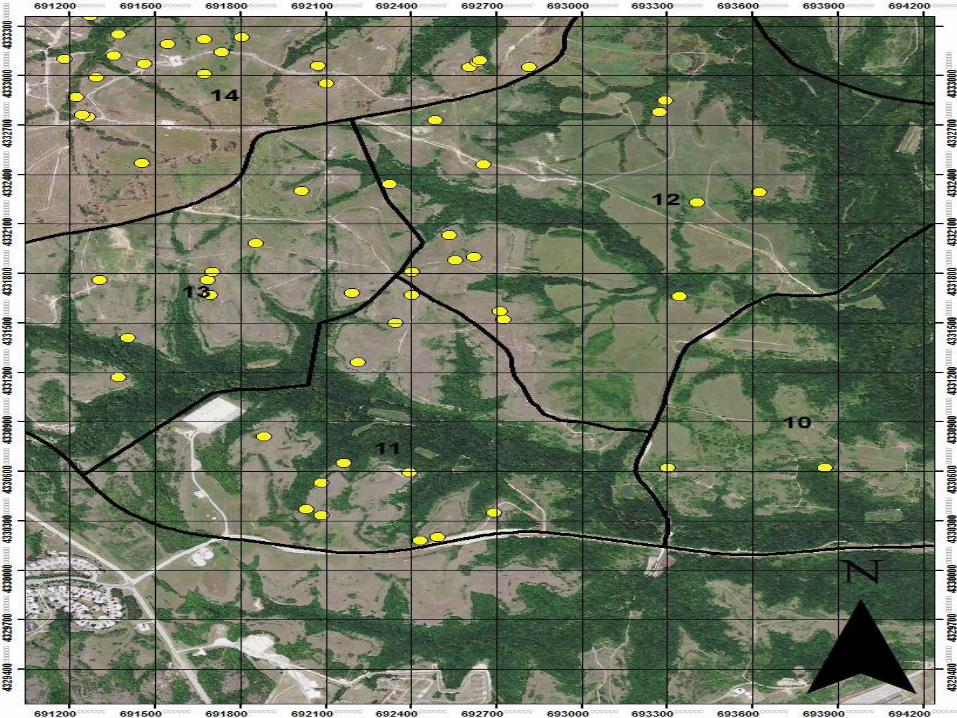
Field Validations of Prediction Areas
Methods We randomly distributed ~ 312 violet survey
points among the 4 study areas using GIS and
then surveyed these points to validate the
predictions of the species distribution model.
10m2 plots were surveyed for ~12 min. After
the entire plot had been searched the number
of violets present were recorded.
We also randomly selected a subset of points
to re-survey to account for detection error.
27.5% of the plots surveyed had Prairie
violets present.
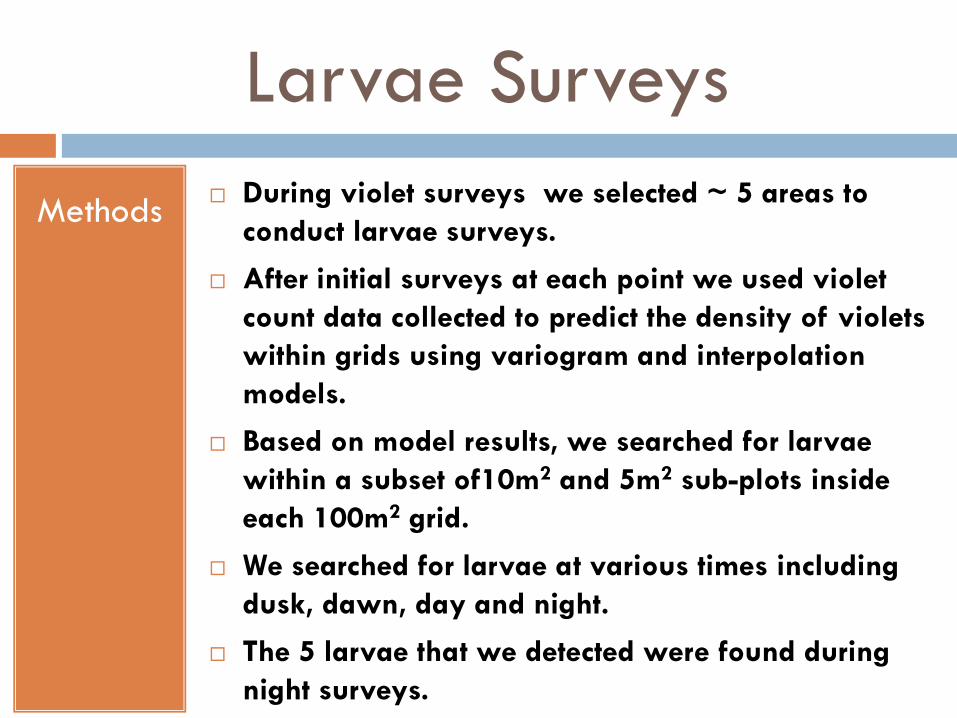
Larvae Surveys
Methods During violet surveys we selected ~ 5 areas to
conduct larvae surveys.
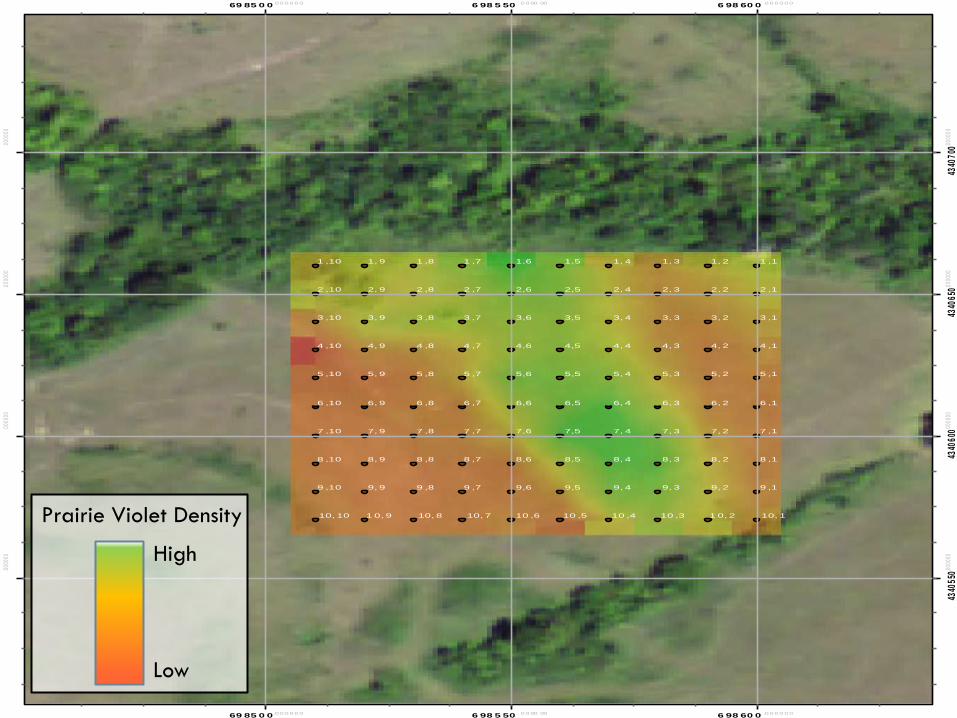
After initial surveys at each point we used violet
count data collected to predict the density of violets
within grids using variogram and interpolation
models.
Based on model results, we searched for larvae
within a subset of10m2 and 5m2 sub-plots inside
each 100m2 grid.
We searched for larvae at various times including
dusk, dawn, day and night.
The 5 larvae that we detected were found during
night surveys.
9, 9 9 ,8 9 ,7 9,6 9,5 9, 4 9, 3 9, 2 9 ,1
8, 9 8 ,8 8 ,7 8,6 8,5 8, 4 8, 3 8, 2 8 ,1
7, 9 7 ,8 7 ,7 7,6 7,5 7, 4 7, 3 7, 2 7 ,1
6, 9 6 ,8 6 ,7 6,6 6,5 6, 4 6, 3 6, 2 6 ,1
5, 9 5 ,8 5 ,7 5,6 5,5 5, 4 5, 3 5, 2 5 ,1
4, 9 4 ,8 4 ,7 4,6 4,5 4, 4 4, 3 4, 2 4 ,1
3, 9 3 ,8 3 ,7 3,6 3,5 3, 4 3, 3 3, 2 3 ,1
2, 9 2 ,8 2 ,7 2,6 2,5 2, 4 2, 3 2, 2 2 ,1
1, 9 1 ,8 1 ,7 1,6 1,5 1, 4 1, 3 1, 2 1 ,1
1 0, 9 10, 8 10, 7 10 ,6 10 ,5 10 ,4 10 ,3 1 0, 2 10, 1
9 ,10
8 ,10
7 ,10
6 ,10
5 ,10
4 ,10
3 ,10
2 ,10
1 ,10
10, 10
69 85 0 0.0 0 0 0 0 0
69 85 0 0.0 0 0 0 0 0
6 98 5 50 . 0 0 00 00
6 98 5 50 . 0 0 00 00
6 98 60 0 .0 0 0 0 0 0
6 98 60 0 .0 0 0 0 0 0
4340
550 .0
0000
0
4340
550.0
0000
0
4340
600 .0
0000
0
4340
600.0
0000
0
4340
650 .0
0000
0
4340
650.0
0000
0
4340
700 .0
0000
0
4340
700.0
0000
0
High
Low
Prairie Violet Density
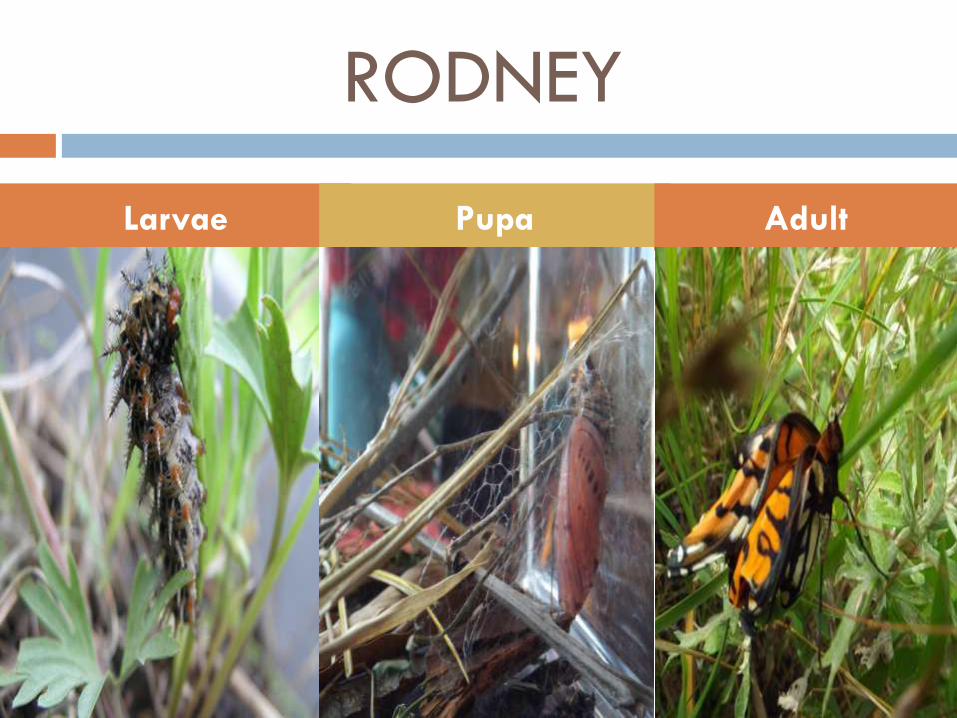
RODNEY
Larvae Pupa Adult
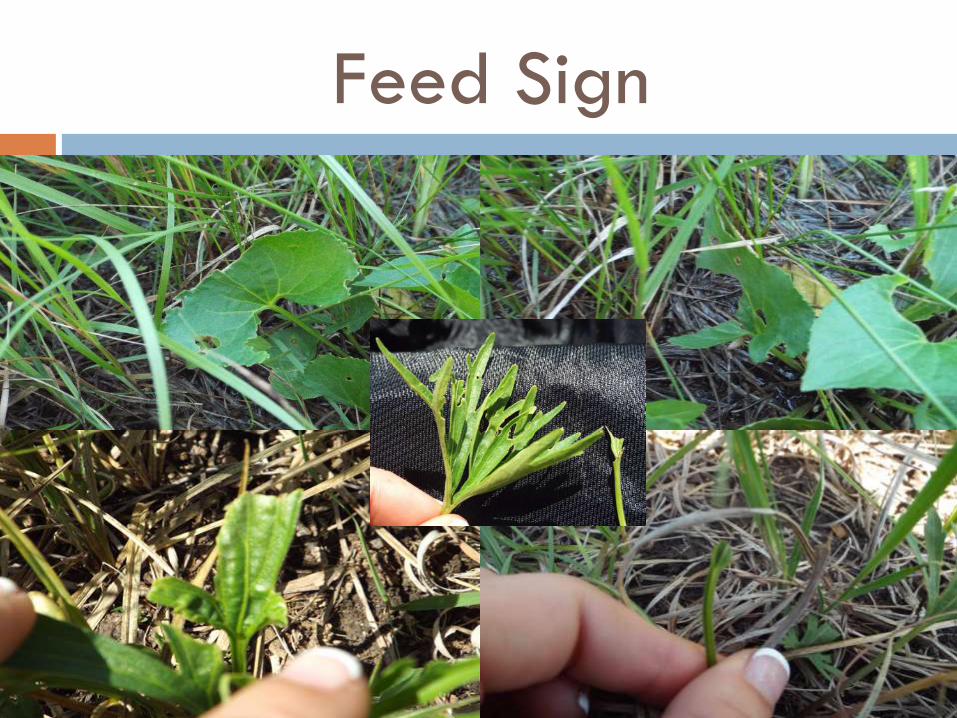
Feed Sign

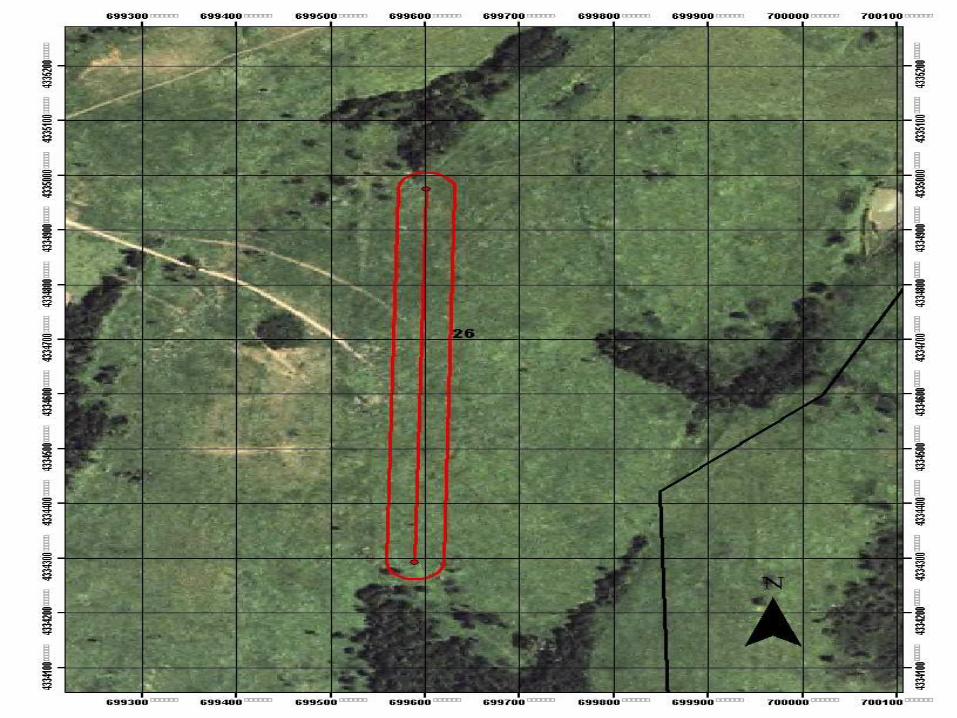
Adult Surveys
Methods Adult surveys started in early June.
Standardized transects were surveyed using
a repeated, modified pollard walk method.
Twenty six transects surveyed in 2014.
Location of transects stratified by violet
density and management regime i.e.
grazing, fire return interval, haying etc.
The coordinates and number of Regal
fritillary detected within 4 distance classes
to 30 meters from the transect and the initial
coordinates of were recorded.
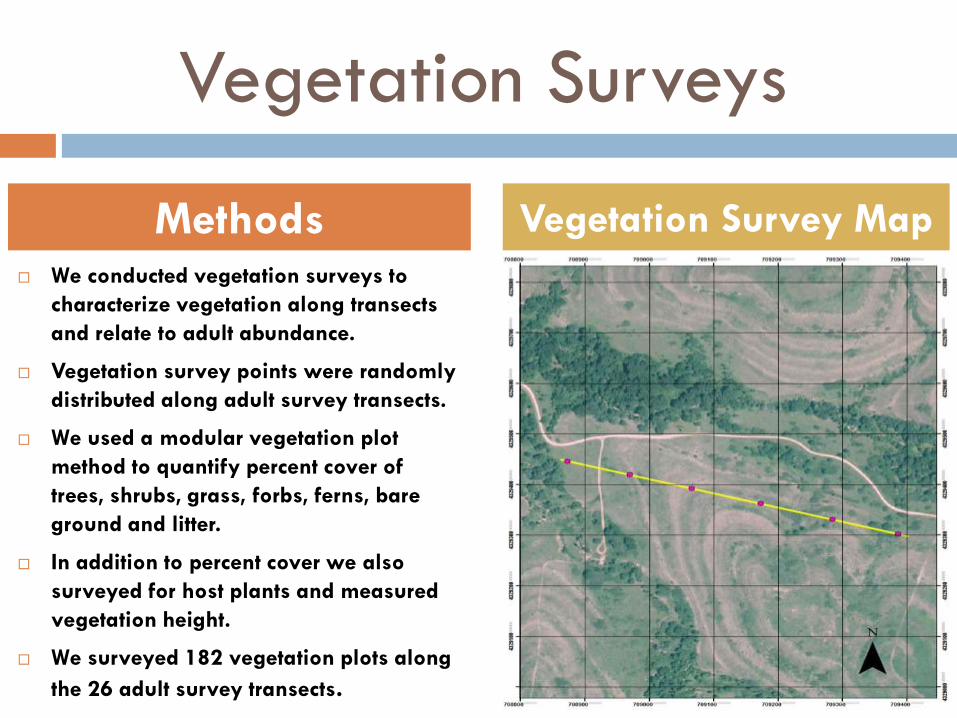
Vegetation Surveys
We conducted vegetation surveys to
characterize vegetation along transects
and relate to adult abundance.
Vegetation survey points were randomly
distributed along adult survey transects.
We used a modular vegetation plot
method to quantify percent cover of
trees, shrubs, grass, forbs, ferns, bare
ground and litter.
In addition to percent cover we also
surveyed for host plants and measured
vegetation height.
We surveyed 182 vegetation plots along
the 26 adult survey transects.
Methods Vegetation Survey Map
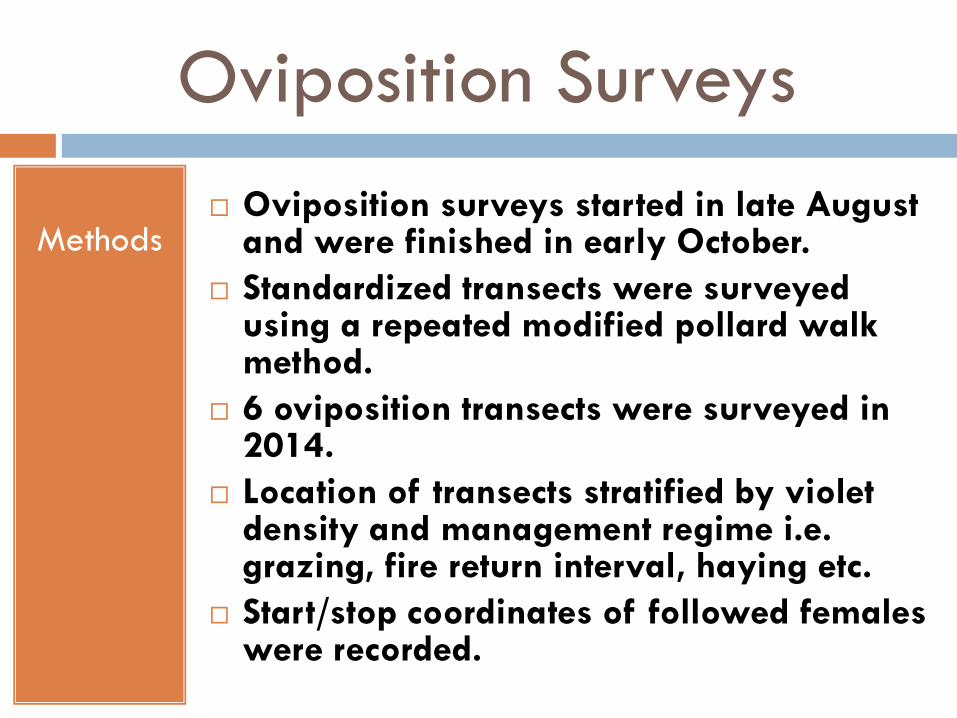
Oviposition Surveys
Methods Oviposition surveys started in late August
and were finished in early October.
Standardized transects were surveyed using a repeated modified pollard walk method.
6 oviposition transects were surveyed in 2014.
Location of transects stratified by violet density and management regime i.e. grazing, fire return interval, haying etc.
Start/stop coordinates of followed females were recorded.
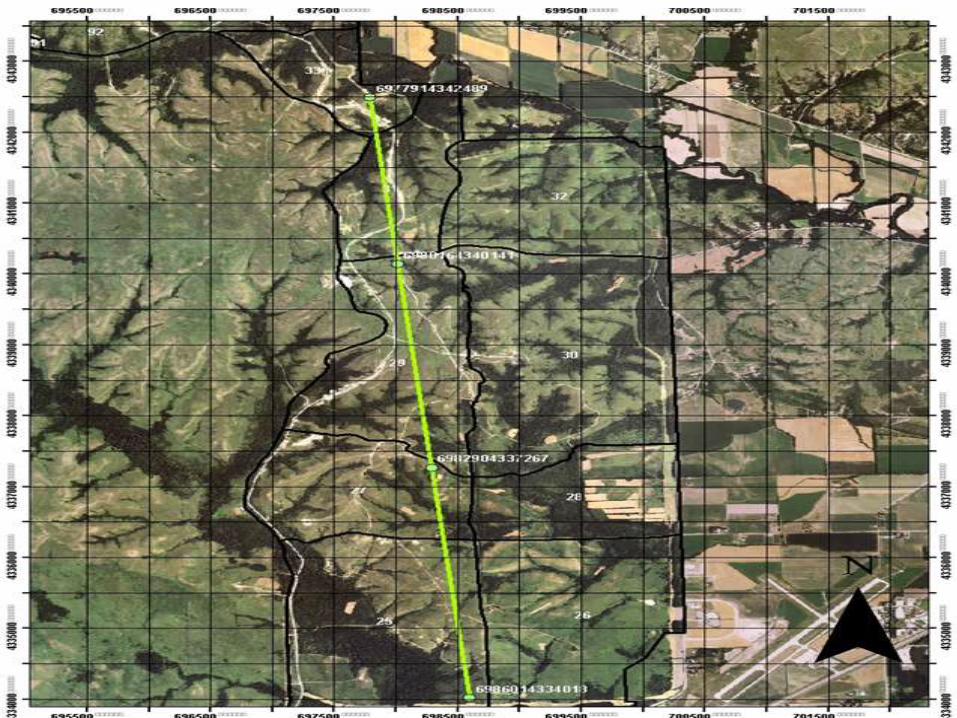

Oviposition Surveys
We followed gravid females to
record oviposition locations.
Females were recorded
depositing eggs at 27 locations.
Each location was marked with
a flag and habitat
measurements were collected.
5 eggs were collected for
further observations.
Blue violet (Violoa sororia) was
detected at 14 of the 27
locations.
Results Oviposition Map

Female Laying Eggs
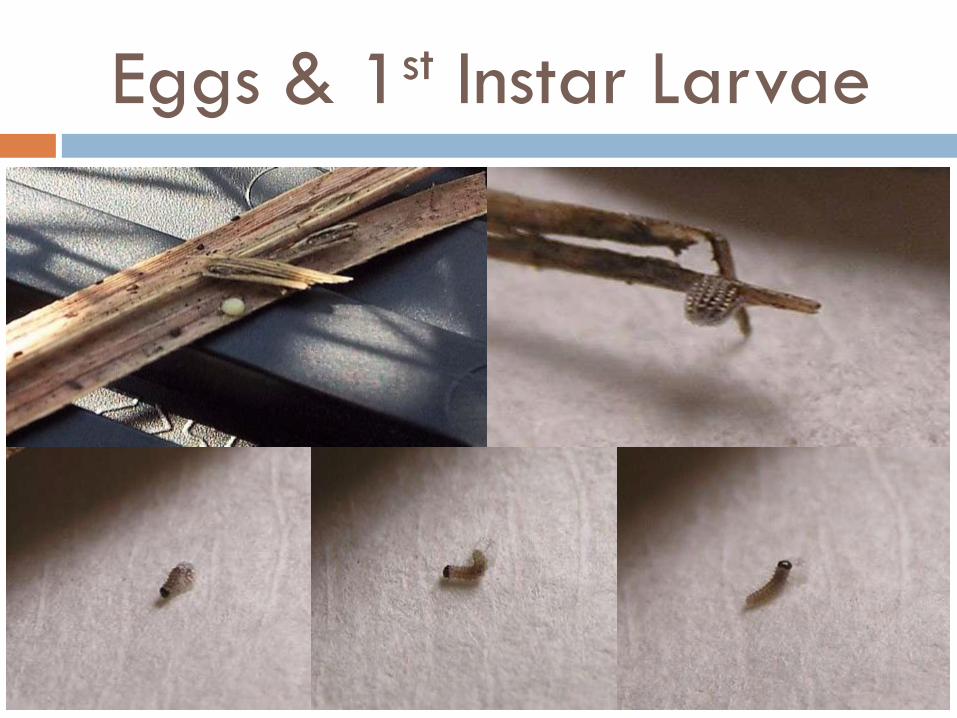
Eggs & 1st Instar Larvae
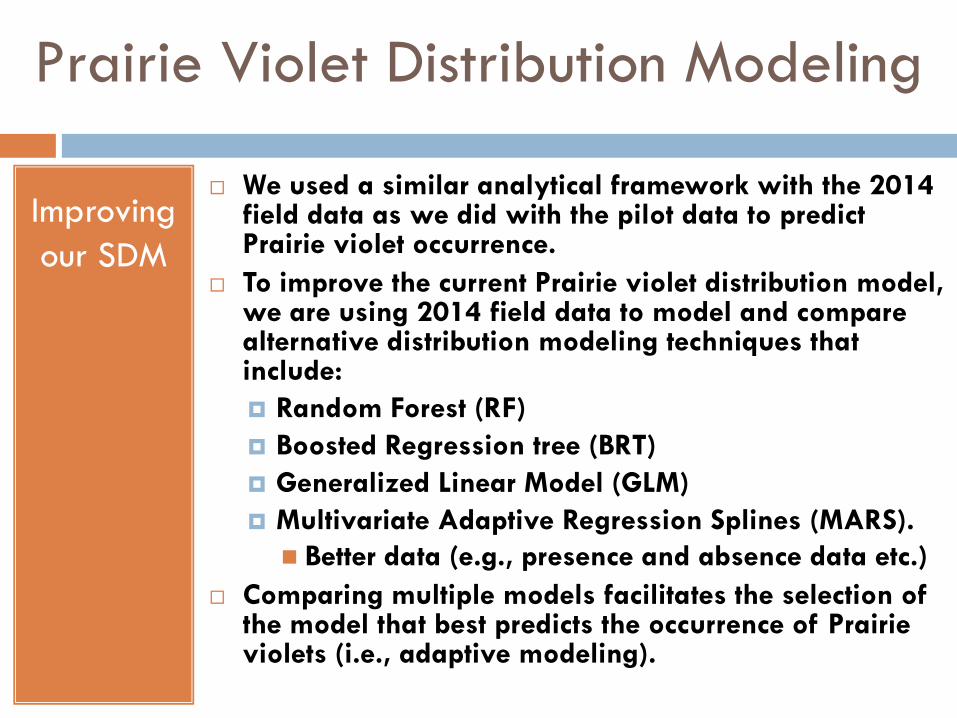
Prairie Violet Distribution Modeling
Improving
our SDM
We used a similar analytical framework with the 2014 field data as we did with the pilot data to predict Prairie violet occurrence.
To improve the current Prairie violet distribution model, we are using 2014 field data to model and compare alternative distribution modeling techniques that include:
Random Forest (RF)
Boosted Regression tree (BRT)
Generalized Linear Model (GLM)
Multivariate Adaptive Regression Splines (MARS).
Better data (e.g., presence and absence data etc.)
Comparing multiple models facilitates the selection of the model that best predicts the occurrence of Prairie violets (i.e., adaptive modeling).

Maps of Predicted Prairie Violet Occurrence
within Study Areas in North Central Kansas

Preliminary Results
BRT correct classification rate
78.7%
MARS correct classification rate
73.5%
RF correct classification rate
68.4%
GLM correct classification rate
60%
Vegetation Index
Roughness
Annual Variation in
Vegetation Index
Heat Load Index
Model Performance Top Covariates
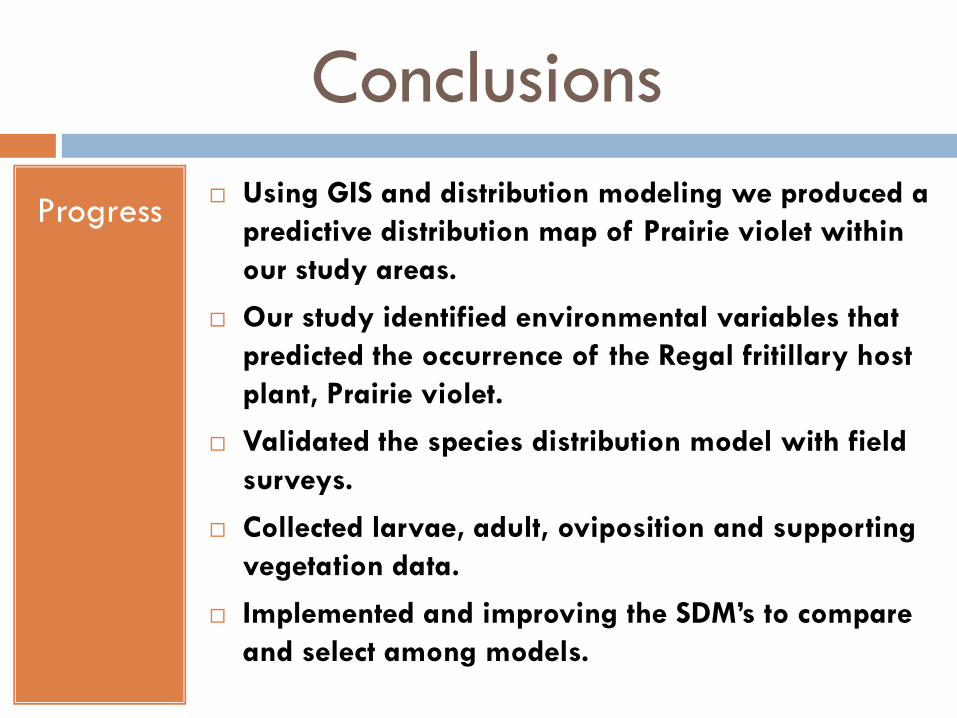
Conclusions
Progress Using GIS and distribution modeling we produced a
predictive distribution map of Prairie violet within
our study areas.
Our study identified environmental variables that
predicted the occurrence of the Regal fritillary host
plant, Prairie violet.
Validated the species distribution model with field
surveys.
Collected larvae, adult, oviposition and supporting
vegetation data.
Implemented and improving the SDM’s to compare
and select among models.
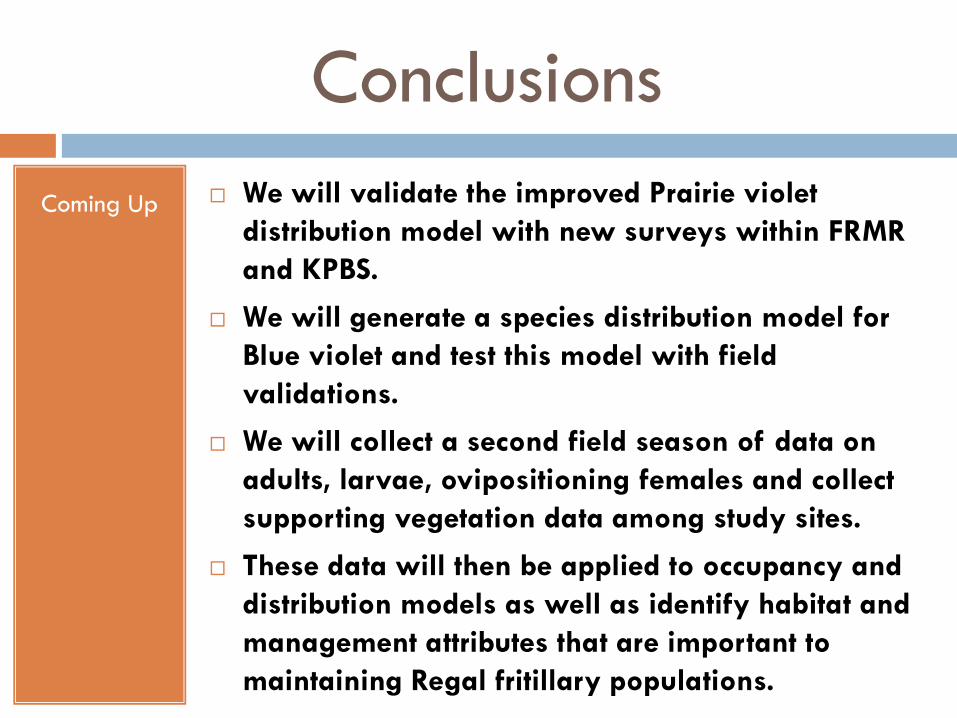
Conclusions
Coming Up We will validate the improved Prairie violet
distribution model with new surveys within FRMR
and KPBS.
We will generate a species distribution model for
Blue violet and test this model with field
validations.
We will collect a second field season of data on
adults, larvae, ovipositioning females and collect
supporting vegetation data among study sites.
These data will then be applied to occupancy and
distribution models as well as identify habitat and
management attributes that are important to
maintaining Regal fritillary populations.

ACKNOWLEDGMENTS: We gratefully acknowledge funding and
support from the Department of Defense, Konza Prairie Biological
Station, KSU Division of Biology, and the Kansas Cooperative Fish and
Wildlife Research Unit.
QUESTIONS?


![Regal Fritillary Petition - Wisconsin Public Radio · According to NatureServe (2012 at 14), “no butterfly anywhere in the world resembles this [the regal fritillary].” The species’](https://img.pdfslide.us/doc/110x75/607d062716bcd12054651245/regal-fritillary-petition-wisconsin-public-radio-according-to-natureserve-2012.jpg)