Embed Size (px)
Citation preview

Grade 8
������������� �
• The Compound Microscope (BLM 8-A)• Waves (BLM 8-B)• The Titanic (BLM 8-C)• A Tiring Story (BLM 8-D)• How We Worked Together (BLM 8-E)• World Map: Ocean Currents (BLM 8-F)• Facts about Ocean Currents (BLM 8-G)• How Big Lakes and Oceans Affect Climate:
Weather by the Water (BLM 8-H)• The Incredible Journey (BLM 8-I)• North America: Watersheds (BLM 8-J)• The Effects of Tides (BLM 8-K)• Word List: Tides (BLM 8-L)• How I Worked in My Group (BLM 8-M)• Constructing a Prototype: Observation Checklist (BLM 8-N)• Design Project Report (BLM 8-O)• Design Project Report: Assessment (BLM 8-P)• Conducting a Fair Test: Observation Checklist (BLM 8-Q)• Experiment Report (BLM 8-R)• Experiment Report: Assessment (BLM 8-S)


The Compound Microscope
Purposes:
• Identify and describe the function of the parts of a compound microscope.
• Demonstrate proper care and use of the microscope (i.e., carrying the microscope, cleaning lenses,focusing carefully).
• Demonstrate the ability to prepare wet mounts, focus, calculate magnification, estimate specimen size,and sketch specimens as they appear under magnification using a compound microscope.
Procedure:
A. Handling the Microscope
1. Clean lenses as needed using lens paper only. Normal tissue is too coarse and may scratch lenses.
2. Microscopes are fragile and must be handled with care. Carry the microscope with one hand underthe base and one hand grasping the arm. Make sure the electrical cord is secured to preventaccidents.
3. Put the lowest power objective lens in place and cover the microscope with the dust cover whenfinished.
4. Never use direct sunlight as a light source.
B. Adjusting Light
The diaphragm regulates the amount of light passing through a specimen. Too much light results inflare, causing a lack of contrast or lost detail when viewing the specimen.
C. Preparing a Wet Mount
1. Place a drop of water on the slide.
2. Place a very thinly sliced specimen in the water.
3. Hold the cover slip against the water at a 45-degree angle, and then release. This will reduce thenumber of air bubbles, which may obscure portions of the specimen or the entire specimen. Gentlypressing on the coverslip with a pencil eraser can eliminate some air bubbles.
D. Focusing
1. Always begin with the lowest power objective lens in position. This gives the largest field ofvision and the greatest depth of field. It also reduces the chance of the lens striking the slide.
2. To avoid breaking the slide during focusing, move the lowest power objective lens as close aspossible to the slide while watching from the side of the microscope. Centre the specimen andfocus by moving the objective lens away from the slide.
3. Turn the adjustment dials to sharpen the image.
4. Adjust the diaphragm for optimum contrast.
5. When going from a lower power objective lens to a higher power objective lens:
• centre the specimen in the field of view
• change to the next power objective lens
• use the adjustment dials to sharpen the image and adjust the diaphragm for optimum contrast
BLM 8-A
(continued)

E. Determining Total Magnification
Total magnification = ocular lens power x objective lens power (e.g., 5X x 4X = 20X)
Note: the units are times (X).
1. Determine the total magnification for each combination of ocular and objective lenses found onyour microscope. Complete the table below:
2. Prepare a wet mount slide of the following letter: e (lower case). Use an “e” from a newspaper ormagazine or draw your own.
a. In the space below, draw the letter as it appears with the unaided eye on the stage of themicroscope. To the right of this diagram, draw the letter as it appears in the field of view underlow power.
b. Compare the two drawings and describe what you see. (In your description, answer thefollowing questions: What is the consistency of the ink or pencil lead? Describe the texture ofthe paper. Is the position or orientation of the letter in the two drawings the same or different?)
c. Describe the movement of the specimen in the field of view when you move the slide to theleft. Describe the movement of the specimen in the field of view when you move the slideaway from you.
Ocular Lens Power (X) Objective Lens Power (X) Total Magnification (X)
LowPower
MediumPower
HighPower
(continued)
(continued)
BLM 8-A

d. Make a general statement about the orientation and movement of objects viewed through amicroscope.
e. What would you say to help a friend who is having trouble locating a specimen in the field ofview?
f. The image below is drawn as viewed through the microscope. Draw what you would expect tosee on the stage.
3. Prepare a wet mount slide of two overlapping hairs or thin threads.
a. Locate the hairs under low power. Is it possible to have both hairs in focus?
b. Locate the hairs under medium power. Is it possible to have both hairs in focus? Draw whatyou see. Indicate the total magnification.
c. Locate the hairs under high power. Is it possible to have both hairs in focus?
d. What happens to the depth of field (i.e., the ability to focus on more than one object when theobjects are at different depths on the slide) as magnification increases?
(continued)
(continued)
BLM 8-A

The Microscope
ocular lens (eye piece)
body tube
medium powerobjective lens
high powerobjective lens
stage
clips
mirror/light source
coarse adjustment knob
fine adjustment knob
revolving nose piece
low power objective lens
arm
diaphragm
base
(continued)
BLM 8-A

Waves
Electromagnetic radiation describes a stream of massless particles, each travelling in a wave-like patternat the speed of light, and containing a certain amount of energy. The electromagnetic spectrum is the termused to describe the whole range of different types of electromagnetic radiation, each with its ownwavelength, frequency, and amount of energy. Types of electromagnetic radiation include: radio waves,microwaves, infrared radiation, visible light, ultraviolet radiation, X-rays, and gamma rays.
1. Observe a still surface of water that is touched by a vibrating rod. Describe the movement of the waterwhen the rod touched the surface of the water and draw an overhead view and a side view of the watermovement.
2. Electromagnetic radiation also moves in waves. To find the wavelengths of the representative diagrambelow, use a ruler to measure the distance from one crest to another.
3. The number of waves within a specified distance is the frequency of a wave of electromagneticradiation. Using a ruler, determine which of the following has the highest (most waves per cm)frequency.
4. What is the relationship between the wavelength and the frequency of a wave of electromagneticradiation?
Look for:
1. Waves rippled out in circles from the point of contact. Higher waves emanated from the centre,eventually becoming lower waves and then disappearing.
2. 2 cm
3. (a) has the highest frequency.
4. The higher the frequency, the shorter the wavelength.
Number of waves per cm
a.
b.
c.
�����
����� �����
��� ����
����������
BLM 8-B


The Titanic
The Titanic, a passenger liner launched April 10, 1912, was considered unsinkable. Because it was believedthat lifeboats would never be needed, the ship was equipped with fewer lifeboats than were necessary tohold all of the passengers on board. Designers had built in some safeguards, however. Besides having awell-built hull, the bottom portion of the ship was hollow with walled-off compartments of air so that incase the hull was damaged and water seeped in, the water would fill up only one compartment and the shipcould still float.
On the night of April 14, off the coast of Newfoundland, the Titanic ran into an iceberg that ripped open theside of its hull. The compartments worked; water filled the once air-filled compartments and then did notinvade the rest of the ship . . . initially, that is.
Based on your findings regarding density and buoyancy, create a newspaper article informing the public ofthe scientific flaws of the Titanic’s specially made compartments and their inability to keep the Titanicafloat. Suggest design modifications to improve the effectiveness of the compartments.
Look for:
The compartments were initially filled with air, which made the ship’s average density less than that of seawater. As sea water filled the compartments, the ship began to lose its ability to float. As the Titanic beganto tip, more of the compartments filled with water, creating an average density that became greater than thebuoyant force of the sea water. If the compartments had been closed off at the top, water might not haveoverflowed into the neighbouring compartments.
Titanic
Compartments(Open at the top)
BLM 8-C

A Tiring Story
One fine spring day, Sam took his car to a local garage, had the oil in his car changed and, as part of thecar maintenance program, had the air pressure in his tires checked. The mechanic said that the air pressurewas good.
One chilly morning a few days later, Sam went out to his car and noticed that his back left tire looked alittle flatter. On his way to work he stopped at a local self-serve gas station to put some air in his tire butrealized he didn’t have his tire air pressure gauge with him. Not having time to go back home to get it,Sam put a small amount of air in his tire.
Weeks passed and Sam went for a summer trip across the prairies. One day after he had been drivingseveral hundred kilometres during a scorching heat wave, Sam experienced a blowout. Luckily it was arear tire, no other cars were around, and he was able to keep control of his car and come to a safe stop.
Sam purchased a new tire at a nearby town. He had it installed and had all his tires checked for wear andtear and air pressure. The mechanic assured Sam that everything was up to specifications.
Months passed and Sam had no problems with his tires until one cold night in January. In fact, it was socold that the thermometer outside his window read –40°C. Sam was called into work for an emergencyand when he got to his car he noticed all four tires were low. Sam decided to call a taxi cab to avoid thechance of getting stuck with a flat tire on the road late at night.
Explain what happened to Sam’s tires.
Look for:
The tires are being affected by the temperature of the air. (Cold temperatures caused the pressure in thetires to drop and subsequently reduce the volume, which gave the tire the appearance of being flat.) Hightemperatures and increased heat energy due to the friction of the road caused the pressure and the volumeto increase until the tire burst.
BLM 8-D


How We Worked Together
Name: ____________________________________
Date: _____________________________________
Task: _____________________________________
BLM 8-E
Group Members:
___________________________________
___________________________________
___________________________________
Yes Sometimes No
Everyone participated.
We listened to each other.
We encouraged each other.
We took turns sharing ideas.
The group stayed together.
We accomplished our task.
How We Worked Together: Reproduced from Grades 5 to 8 Mathematics: A Foundation for Implementation. Winnipeg, MB:Manitoba Education and Training, 1997. Appendix.

Nor
thP
acifi
c
Sou
thP
acifi
c
Nor
thP
acifi
c Sou
thP
acifi
c
Nor
thA
tlant
ic
Sou
thA
tlant
ic
Sou
thIn
dian
Ant
arct
ic C
ircum
pola
r
Gul
f Stre
am
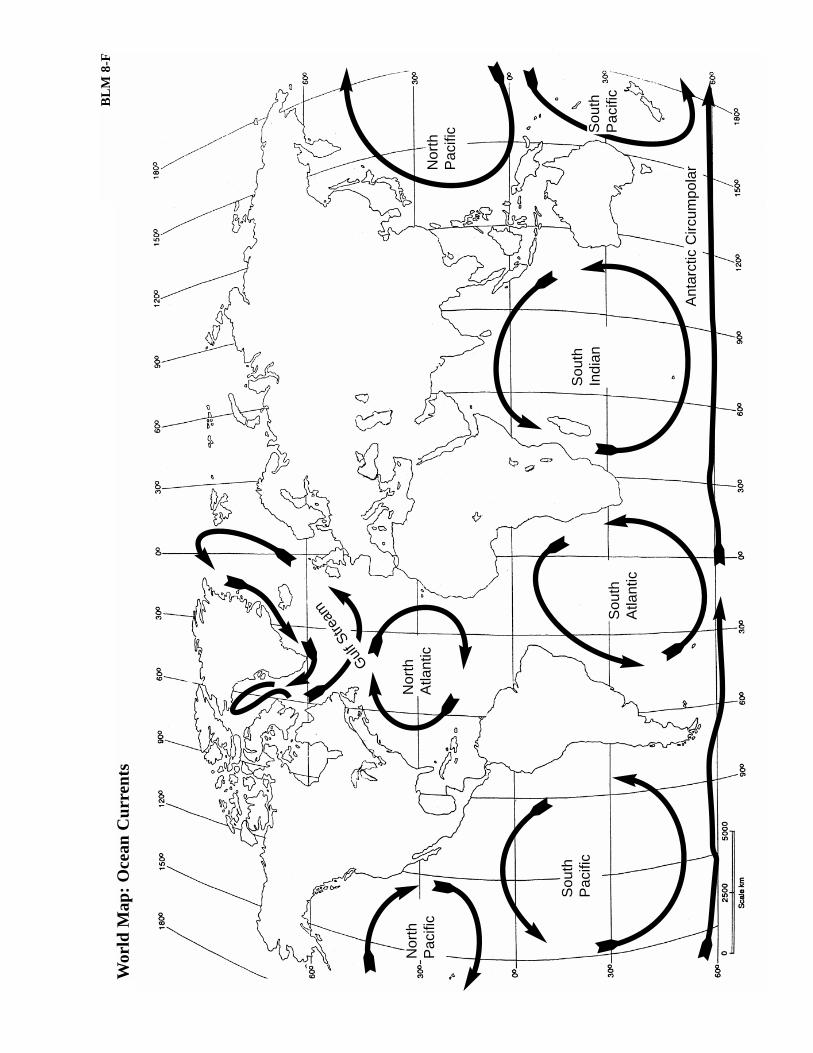
Wor
ld M
ap:
Oce
an C
urre
nts
BL
M 8
-F


Facts about Ocean Currents
• Ocean waters are constantly on the move. How they move influences climate and living conditions forplants and animals, even on land.
• Currents flow in complex patterns affected by wind, the water’s salinity and heat content (density),bottom topography, the position of continents, and the Earth’s rotation (Coriolis effect).
• The ocean is layered. It is cold at the bottom and warmer on top.
• Warm surface currents invariably flow from the tropics to the higher latitudes, driven mainly byatmospheric winds and the Earth’s rotation.
• Cold surface currents come from polar and temperate latitudes, and they tend to flow toward the equator,driven mainly by atmospheric forces.
• Our planet’s rotation produces a force on all bodies of water moving relative to the Earth. That force isgreatest at the poles and least at the equator. It is called the Coriolis effect, and it causes the direction ofwinds and ocean currents to be deflected. Water is deflected clockwise, or to the right, in the northernhemisphere, and counterclockwise, or to the left, in the southern hemisphere.
• Ocean water at the surface is warmed at the tropics and moves toward the poles where it loses heat,becomes saltier and denser, and sinks.
• The cold bottom layer of ocean water circulates through the oceans, taking up to 1,000 years to circulatecompletely throughout the oceans of the Earth.
• The Gulf Stream surface current is one of the strongest currents. It is warm, deep, fast, and relativelysalty.
• Organisms move from one layer of the ocean to another, and plant and animal remains containingnutrients “rain” down. Upwelling stirs the oceans and brings nutrients that have settled in deep waterback to the surface, providing a rich source of nutrients for marine organisms, particularly fish. Coastalupwelling occurs against the western sides of continents in the Atlantic, Indian, and Pacific Oceans.There, colder water rises to replace warm surface water blown out to sea by strong winds. Upwellingsupports about half of the world’s fisheries.
The Antarctic Circumpolar Current
• The Southern Ocean is the only ocean that circles the globe without being blocked by land. It containsthe Antarctic Circumpolar current and is the world’s largest ocean current.
• The Antarctic bottom water (cold, salty, and dense) sinks into the deep sea, spills off the continentalshelf, and travels northward hugging the ocean floor beneath other water masses. This is a huge amountof water that pushes the warmer water out of the way, usually by flowing underneath it, causing newflows and currents in other directions. It travels as far as the North Atlantic and North Pacific Oceans.The bottom water flowing away from Antarctica has to be replaced by other water, so the warmer watersin the north tend to flow southward to fill the gap. Then they cool down and the cycle keeps going.
• The Antarctic Circumpolar current has a powerful influence on much of the word’s climate as itredistributes heat, influencing patterns of temperature and rainfall.
BLM 8-G
(continued)

(continued)
Ocean Currents: Questions
1. List the factors that affect the movement of ocean currents.
2. Indicate which of these factors predominantly affect the surface (horizontal) movement of currents.Indicate which factors affect the ocean’s lower layer and result in convection currents (verticalmovement) as well as horizontal movement.
3. What impact does the Coriolis effect have on the direction of wind and ocean currents?
4. Why is density important to understanding the movement of ocean currents?
5. What affects the density of ocean water?
6. Draw two labelled diagrams to contrast what takes place in coastal upwelling with what takes placewith the Antarctic bottom water. The diagrams should clearly show the movement of warm and coldwater.
7. Why is ocean water upwelling important to the economy?
8. Why is the movement of the Antarctic bottom water important?
Look for:
1. Wind, water’s salinity and heat content (density), bottom topography, position of continents, and theCoriolis effect influence the movement of ocean currents.
2. Surface: wind, position of continents, Coriolis effect Lower layer: water’s salinity and heat content (density), bottom topography, Coriolis effect
3. The Coriolis effect deflects wind and ocean currents to the right in the Northern hemisphere, and to theleft in the southern Hemisphere.
4. Denser water sinks.
5. The temperature and salinity of the water affect the density of ocean water.
6. In coastal upwelling, cold water rises to replace the warm surface water blown out to sea by strongwinds. The dense Antarctic bottom water sinks into the deep sea, spills off the continental shelf, andtravels north. As a result, warm water is drawn south to replace it.
7. Upwelling brings nutrients to the surface for fish, resulting in good fishing areas.
8. The movement of the Antarctic bottom water circulates water around the world and redistributes heat,influencing temperature and rainfall.
BLM 8-G
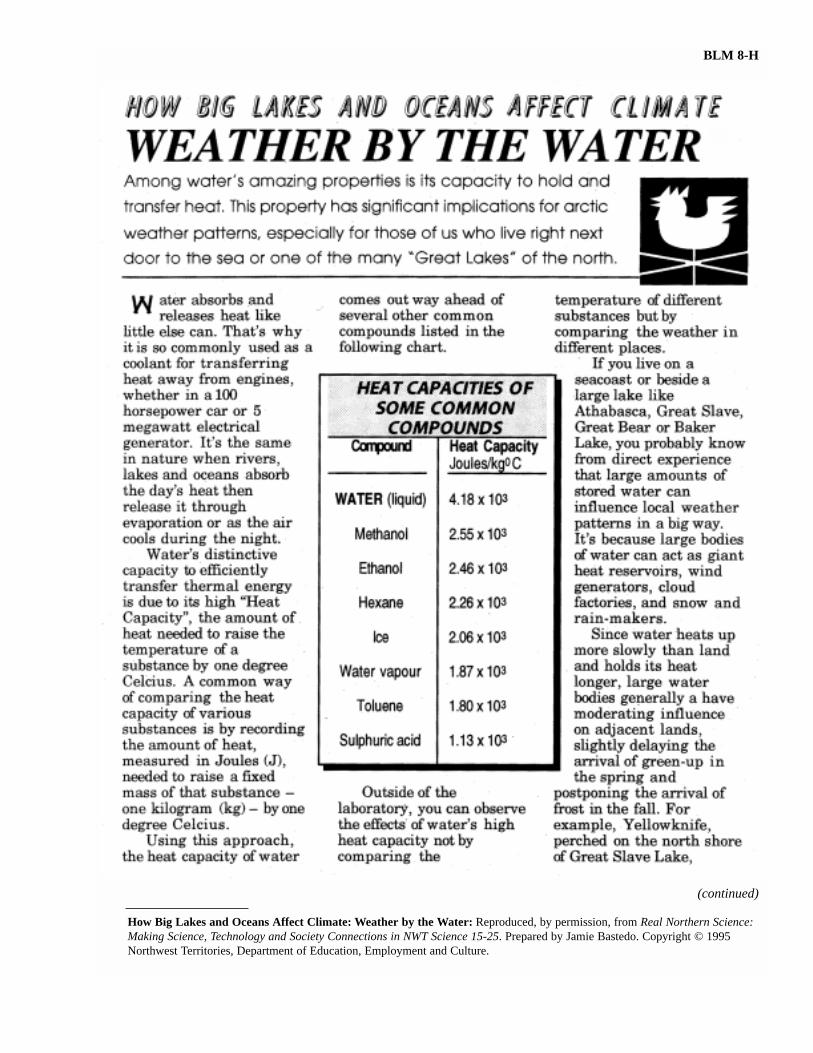
How Big Lakes and Oceans Affect Climate: Weather by the Water: Reproduced, by permission, from Real Northern Science:Making Science, Technology and Society Connections in NWT Science 15-25. Prepared by Jamie Bastedo. Copyright © 1995Northwest Territories, Department of Education, Employment and Culture.
BLM 8-H
(continued)

BLM 8-H
(continued)
(continued)
(continued)
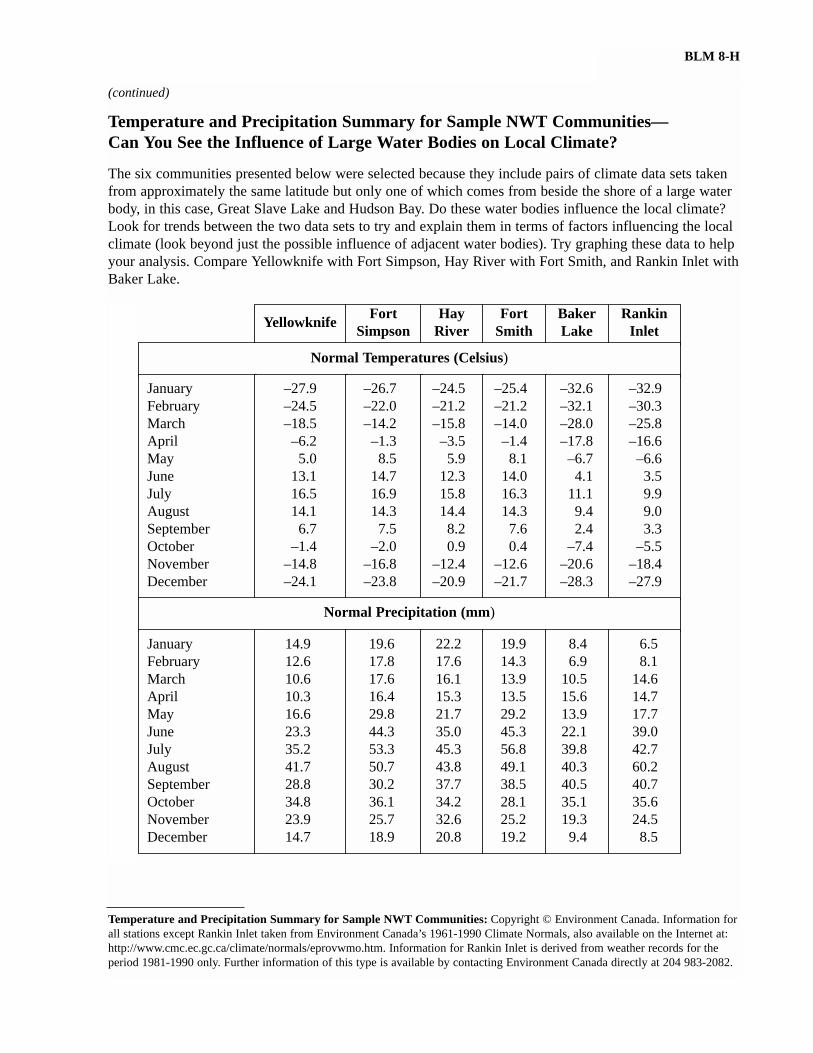
Temperature and Precipitation Summary for Sample NWT Communities—Can You See the Influence of Large Water Bodies on Local Climate?
The six communities presented below were selected because they include pairs of climate data sets takenfrom approximately the same latitude but only one of which comes from beside the shore of a large waterbody, in this case, Great Slave Lake and Hudson Bay. Do these water bodies influence the local climate?Look for trends between the two data sets to try and explain them in terms of factors influencing the localclimate (look beyond just the possible influence of adjacent water bodies). Try graphing these data to helpyour analysis. Compare Yellowknife with Fort Simpson, Hay River with Fort Smith, and Rankin Inlet withBaker Lake.
YellowknifeFort
SimpsonHay
RiverFort
SmithBakerLake
RankinInlet
Normal Temperatures (Celsius)
JanuaryFebruaryMarchAprilMayJuneJulyAugustSeptemberOctoberNovemberDecember
–27.9–24.5–18.5–6.25.0
13.116.514.16.7
–1.4–14.8–24.1
–26.7–22.0–14.2–1.38.5
14.716.914.37.5
–2.0–16.8–23.8
–24.5–21.2–15.8–3.55.9
12.315.814.48.20.9
–12.4–20.9
–25.4–21.2–14.0–1.48.1
14.016.314.37.60.4
–12.6–21.7
–32.6–32.1–28.0–17.8–6.74.1
11.19.42.4
–7.4–20.6–28.3
–32.9–30.3–25.8–16.6–6.63.59.99.03.3
–5.5–18.4–27.9
Normal Precipitation (mm)
JanuaryFebruaryMarchAprilMayJuneJulyAugustSeptemberOctoberNovemberDecember
14.912.610.610.316.623.335.241.728.834.823.914.7
19.617.817.616.429.844.353.350.730.236.125.718.9
22.217.616.115.321.735.045.343.837.734.232.620.8
19.914.313.913.529.245.356.849.138.528.125.219.2
8.46.9
10.515.613.922.139.840.340.535.119.39.4
6.58.1
14.614.717.739.042.760.240.735.624.58.5
BLM 8-H
Temperature and Precipitation Summary for Sample NWT Communities: Copyright © Environment Canada. Information forall stations except Rankin Inlet taken from Environment Canada’s 1961-1990 Climate Normals, also available on the Internet at:http://www.cmc.ec.gc.ca/climate/normals/eprovwmo.htm. Information for Rankin Inlet is derived from weather records for theperiod 1981-1990 only. Further information of this type is available by contacting Environment Canada directly at 204 983-2082.


The Incredible Journey
Background
While water does circulate from one point or state to another in the water cycle, the paths it can take arevariable.
Heat energy directly influences the rate of motion of water molecules. When the motion of the moleculeincreases because of an increase in heat energy, water will change from solid to liquid to gas. With eachchange in state, physical movement from one location to another usually follows. Glaciers melt to poolswhich overflow to streams, where water may evaporate into the atmosphere.
Gravity further influences the ability of water to travel over, under, and above Earth’s surface. Water as asolid, liquid, or gas has mass and is subject to gravitational force. Snow on mountaintops melts anddescends through watersheds to the oceans of the world.
One of the most visible states in which water moves is the liquid form. Water is seen flowing in streamsand rivers and tumbling in ocean waves. Water travels slowly underground, seeping and filtering throughparticles of soil and pores within rocks.
Although unseen, water’s most dramatic movements take place during its gaseous phase. Water isconstantly evaporating, changing from a liquid to a gas. As a vapor, it can travel through the atmosphereover the Earth’s surface. In fact, water vapor surrounds us all the time. Where it condenses and returns toEarth depends upon loss of heat energy, gravity, and the structure of Earth’s surface.
Water condensation can be seen as dew on plants or water droplets on the outside of a glass of cold water.In clouds, water molecules collect on tiny dust particles. Eventually, the water droplets become too heavyand gravity pulls the water to Earth.
Living organisms also help move water. Humans and other animals carry water within their bodies,transporting it from one location to another. Water is either directly consumed by animals or is removedfrom foods during digestion. Water is excreted as a liquid or leaves as a gas, usually through respiration.When water is present on the skin of an animal (for example, as perspiration), evaporation may occur.
The greatest movers of water among living organisms are plants. The roots of plants absorb water. Someof this water is used within the body of the plant, but most of it travels up through the plant to the leafsurface.
When water reaches the leaves, it is exposed to the air and the sun’s energy and is easily evaporated. Thisprocess is called transpiration.
All these processes work together to move water around, through, and over Earth.
_______________The Incredible Journey: Reproduced by permission, from Project WET Curriculum and Activity Guide, pp. 161-162. Copyright© 1995 The Watercourse and Council for Environmental Education.
BLM 8-I

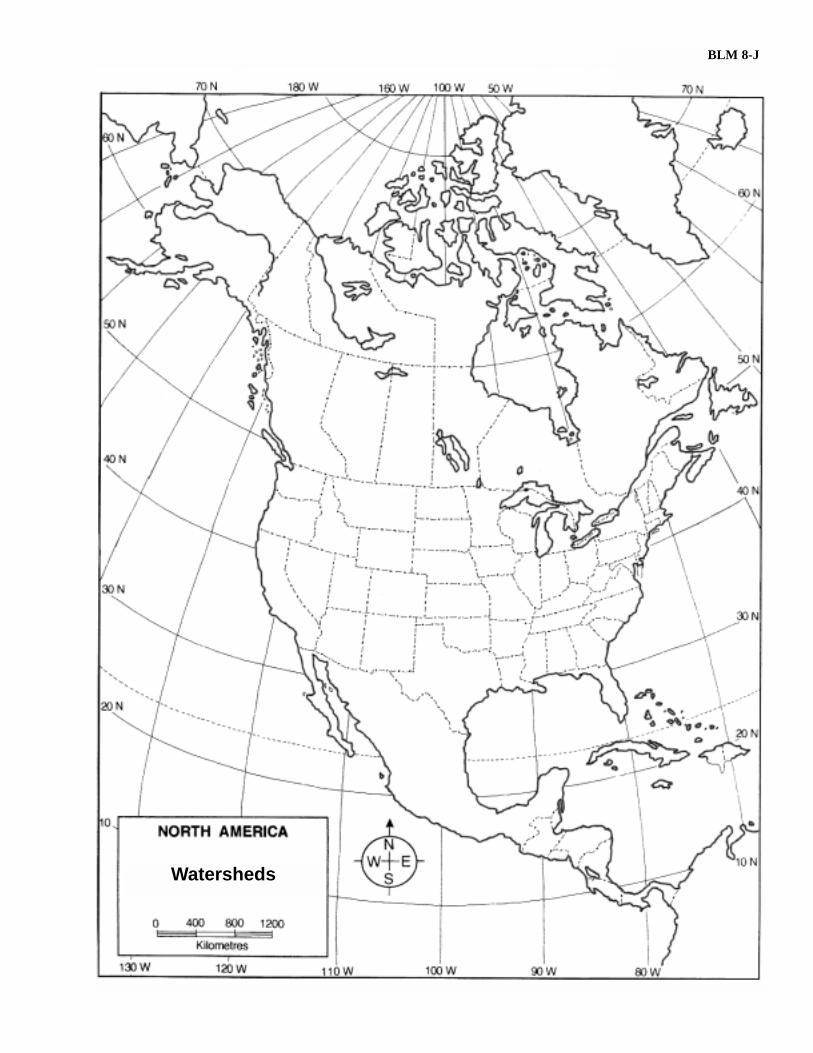
Watersheds
BLM 8-J

The Effects of Tides
Living organisms near large bodies of water have felt the effects of the rise and fall of tidal waters forthousands of years. Saltwater organisms, such as snails and starfish, move to small tidal pools that are leftbehind as the water recedes from the shoreline. They hide in dark, wet places under rocks which protectthem from predators and the drying Sun. Sea anemones close up to conserve water and, like othersaltwater organisms, camouflage themselves from predatory birds. While low tide is a dangerous time forexposed creatures, it is also an opportunity for birds and humans to feast on mussels, crabs, and other seacreatures left stranded by the receding waters.
While organisms have long dealt with the changes that tides have caused, the shorelines themselves havebeen greatly affected. The ebb and flow of large masses of water have eroded rocky cliffs into pebbles,created beaches, and changed the shapes of shorelines. The rise and fall of the water in Hudson Bay mayonly vary approximately 6 metres, but the Bay of Fundy in Nova Scotia sees a change of approximately16 metres. That is a large amount of water with energy to move things.
Humans also have a long history of adapting to tides. For example, they have had to time their entrancesinto, and departures from, harbours. In some cases, harbours are mainly sand at low tide. Knowing when atide would be high or low was essential for safety and prosperity in the fishing industry, so people beganto make observations about the relationships between tides and other phenomena.
Early seafarers noticed that the phases of the moon coincide somewhat with tidal changes. Today we knowthat the gravity of the moon has the greatest impact on tides. The spinning of the Earth on its axis causesthe waters on the Earth to bulge out at the equator. This bulge is further affected by the gravity of themoon in that the waters on the side of the Earth closest to the moon bulge further, raising water levels andcausing high tides. Subsequently the waters on the opposite side of the Earth recede from shorelines,causing low tides.
Yet another contributing factor to the production of tides is the Sun’s gravity. Due to its great distanceaway from the Earth, the Sun does not exert as much pull on the Earth as the moon; however, when theSun and moon are aligned and act together, they cause especially large tides. When the Sun is in a positionthat counteracts the pull of the moon, especially low tides result.
BLM 8-K


low
tide
timin
g dryi
ng s
un
grav
ity
Earth’s spin
tidal pools
rocky cliffs
recede
water
ebb and flow
eroded
Word List: Tides
shorelines
beaches
predator
starfish
enter aharbour
Sun
high tide
BLM 8-L


How I Worked in My Group
Name: ____________________________________ Date: ___________________________________
Task: _________________________________________________________________________________
BLM 8-M
I took turns. Comments
I participated.
I encouraged others.
I shared materials.
I stayed with my group.
I listened.
I accomplished the task.
How I Worked in My Group: Reproduced from Grades 5 to 8 Mathematics: A Foundation for Implementation. Winnipeg, MB:Manitoba Education and Training, 1997. Appendix.


Constructing a Prototype: Observation Checklist
Date: ________________________________ Problem/Challenge: _______________________________
A group of students can be selected as a focus for observation on a given day, and/or one or more of theobservational areas can be selected as a focus. The emphasis should be on gathering cumulativeinformation over a period of time.
BLM 8-N
Names
Has SafeWork Habits
(ensurespersonal safetyand safety of
others)
Works withGroup
Members toCarry Out
Plan
Participatesin Analysis
andModificationof Prototype
ShowsEvidence ofPerseverance
and/orConfidence
Comments
1.
2.
3.
4.
5.
6.
7.
8.
9.
10.
11.
12.
13.
14.
15.
16.
(continued)

Constructing a Prototype: Observation Checklist (continued)
BLM 8-N
Names
Has SafeWork Habits
(ensurespersonal safetyand safety of
others)
Works withGroup
Members toCarry Out
Plan
Participatesin Analysis
andModificationof Prototype
ShowsEvidence ofPerseverance
and/orConfidence
Comments
17.
18.
19.
20.
21.
22.
23.
24.
25.
26.
27.
28.
29.
30.
31.
32.
33.
Notes:

Design Project Report
Name: ____________________________________ Date: ___________________________________
BLM 8-O
Problem/Design Challenge:
Criteria:
Brainstorming (What are all the different ways . . .):
Planning:
Steps to Follow: Materials:
Safety Considerations:
(continued)
Design Project Report (continued)
Testing:
Criteria Test Used
Test Results: Attach Data Summary
Evaluating and Improving:
• Justification of changes to original design:
• Strengths and weaknesses of final design:
• Comment/Reflection (Next time . . . , A New Problem . . . .):
BLM 8-O
(continued)

Design Project Report (continued)
BLM 8-O
Prototype Sketch 1 (Plan):
Prototype Sketch 2 (Final):

Design Project Report: Assessment
Prototype: ___________________________________ Date: ___________________________________
Team Members: ________________________________________________________________________
BLM 8-P
CriteriaPossiblePoints*
Self-Assessment
TeacherAssessment
Identifying the Practical Problem and Criteria for Success• the problem is clearly stated• class and/or group criteria are identified• criteria address all or some of the following: function,
aesthetics, environmental considerations, cost, efficiency
Planning• all steps are included and clearly described in a logical
sequence• all required materials/tools are identified• safety considerations are addressed• a three-dimensional sketch of the prototype is included
(Sketch 1)
Testing the Prototype• tests are described and align with criteria (e.g., each criterion
has been tested)• test results are presented in an appropriate format (data sheet
is attached)
Evaluating and Improving the Design• a final sketch of the prototype is included (Sketch 2)• changes to the original plan are justified• strengths and weaknesses of the final prototype are presented• suggestions for “next time” are included and/or “new
problems” are identified
Total Points
Comments:
*Note: The teacher and/or the class assigns possible points to reflect the particular emphasis/es of theproject.
Conducting a Fair Test: Observation Checklist
Date: ___________________________________ Experiment: _________________________________
A group of students can be selected as a focus for observation on a given day, and/or one or more of theobservational areas can be selected as a focus. The emphasis should be on gathering cumulativeinformation over a period of time.
BLM 8-Q
Names
Has SafeWork Habits(workspace,
handlingequipment,
goggles,disposal)
EnsuresAccuracy/Reliability
(e.g., repeatsmeasurements/experiments)
Works withGroup
Members toCarry Out
Plan
ShowsEvidence ofPerseverance
and/orConfidence
Comments
1.
2.
3.
4.
5.
6.
7.
8.
9.
10.
11.
12.
13.
14.
15.
16.
(continued)

Conducting a Fair Test: Observation Checklist (continued)
BLM 8-Q
Names
Has SafeWork Habits(workspace,
handlingequipment,
goggles,disposal)
EnsuresAccuracy/Reliability
(e.g., repeatsmeasurements/experiments)
Works withGroup
Members toCarry Out
Plan
ShowsEvidence ofPerseverance
and/orConfidence
Comments
17.
18.
19.
20.
21.
22.
23.
24.
25.
26.
27.
28.
29.
30.
31.
32.
33.
Notes:

Experiment Report
Name: ____________________________________ Date: ___________________________________
Experiment: ___________________________________________________________________________
BLM 8-R
Testable Question:
Independent Variable:
Dependent Variable:
Prediction/Hypothesis: (Identify a cause and effect relationship between independent and dependentvariables.)
Planning for a Fair Test
• Apparatus/Materials:
• Variables to Control:
• Method: (Include steps to follow, safety considerations, and plan for disposal of wastes.)
(continued)

Experiment Report (continued)
Observation: (Include data tables/charts on a separate sheet, if required.)
Analysis of Data: (Identify patterns and discrepancies.)
Note: Attach graph on a separate page, if required.
BLM 8-R
(continued)

Experiment Report (continued)
Strengths and Weaknesses of Approach/Potential Sources of Error:
Conclusion: (Support or reject prediction/hypothesis; pose new question(s).)
Applications/Implications: (Link to daily life or area of study.)
BLM 8-R

Experiment Report: Assessment
Experiment Title: _________________________________ Date: ______________________________
Team Members: ________________________________________________________________________
BLM 8-S
CriteriaPossiblePoints*
Self-Assessment
TeacherAssessment
Creating a Testable Question• the question is testable and focused (includes a cause and
effect relationship)
Making a Prediction/Hypothesis• independent and dependent variables are identified• the prediction/hypothesis clearly identifies a cause and effect
relationship between independent and dependent variables
Planning for a Fair Test• required apparatus/materials are identified• major variables to be controlled are identified• steps to be followed are included and clearly described• safety considerations are addressed• a plan for disposing of wastes is included
Conducting a Fair Test/Making and RecordingObservations• evidence of repeated trials is provided• detailed data are recorded, appropriate units are used• data are recorded in a clear/well-structured/appropriate
format
Analyzing and Interpreting • graphs are included (where appropriate)• patterns/trends/discrepancies are identified• strengths and weaknesses of approach and potential sources
of error are identified• changes to the original plan are identified and justified
Drawing a Conclusion• cause and effect relationship between dependent and
independent variables are explained• alternative explanations are identified• prediction/hypothesis is supported or rejected
Making Connections• potential applications to or implications for daily life are
identified and/or links to area of study are made
Total Points
*Note: The teacher and/or the class assigns possible points to reflect the particular emphasis/es of theproject.