Embed Size (px)
Citation preview

GPS Manual Group-based Prediction System
Version 3.0
20/12/2014
Author: Yongbo Wang, Han Cheng, Zhicheng Pan, Zexian Liu* and Yu Xue
*
Contact: Yongbo Wang, [email protected], Yu Xue, [email protected]
The software is only free for academic research.
The latest version of GPS software is available from http://gps.biocuckoo.org/down.php
Copyright (c) 2004-2014. The CUCKOO Workgroup. All right reserved.
GPS Manual
1
Index
INDEX ..................................................................................................................................................... 1
STATEMENT.......................................................................................................................................... 2
INTRODUCTION .................................................................................................................................. 3
DOWNLOAD & INSTALLATION ...................................................................................................... 4
PREDICTION OF KINASE-SPECIFIC PHOSPHORYLATION SITES ........................................ 6
DIRECT PREDICTION .............................................................................................................................. 6
BATCH PREDICTION ............................................................................................................................... 8
PREDICTION OF SPECIES-SPECIFIC KINASE-SPECIFIC PHOSPHORYLATION SITES . 12
DIRECT PREDICTION ............................................................................................................................ 12
BATCH PREDICTION ............................................................................................................................. 16
PREDICTION OF DUL-SPECIFIC KINASE-SPECIFIC PHOSPHORYLATION SITES ......... 19
DIRECT PREDICTION ............................................................................................................................ 19
BATCH PREDICTION ............................................................................................................................. 22
ALGORITHMS AND PREDICTION PERFORMANCE ................................................................ 25
ALGORITHM DESIGN ........................................................................................................................... 25
EVALUATION OF PREDICTION PERFORMANCES ................................................................................... 28
ESTIMATION OF FALSE POSITIVE PREDICTIONS AND CUT-OFF SETTING .................... 31
EXISTED RESOURCES AND ONLINE SERVICES FOR PHOSPHORYLATION .................... 33
REFERENCES ..................................................................................................................................... 34
RELEASE NOTE ................................................................................................................................. 35

GPS Manual
2
Statement
1. Implementation. The softwares of the CUCKOO Workgroup are implemented in
JAVA (J2SE). Usually, both of online service and local stand-alone packages will be
provided.
2. Availability. Our softwares are freely available for academic researches. For
non-profit users, you can copy, distribute and use the softwares for your scientific
studies. Our softwares are not free for commercial usage.
3. GPS. Previously, we used the GPS to denote our Group-based Phosphorylation
Scoring algorithm. Currently, we are developing an integrated computational platform
for post-translational modifications (PTMs) of proteins. We re-denote the GPS as
Group-based Prediction Systems. This software is an indispensable part of GPS.
4. Usage. Our softwares are designed in an easy-to-use manner. Also, we invite you
to read the manual before using the softwares.
5. Updation. Our softwares will be updated routinely based on users’ suggestions and
advices. Thus, your feedback is greatly important for our future updation. Please do
not hesitate to contact with us if you have any concerns.
6. Citation. Usually, the latest published articles will be shown on the software
websites. We wish you could cite the article if the software has been helpful for your
work.
7. Acknowledgements. The work of CUCKOO Workgroup is supported by grants
from National Basic Research Program (973 project) [2012CB910101,
2013CB933903, and 2012FY112900], Natural Science Foundation of China
[31171263 and 81272578]; International Science & Technology Cooperation Program
of China [0S2013ZR0003] and China Postdoctoral Science Foundation
[2014M550392].
GPS Manual
3
Introduction
Identification of phosphorylation sites with their cognate protein kinases (PKs) is the
foundation for understanding the functional dynamics and plasticity of various
cellular processes. Although nearly 10 kinase-specific predictors were developed,
numerous PKs were casually classified into sub-groups without a standard rule. And
for large-scale predictions, the false positive rate (FPR) was also never addressed.
Here we adopted a well-established rule to classify PKs with their verified sites into a
hierarchical structure with four levels, including group, family, subfamily and single
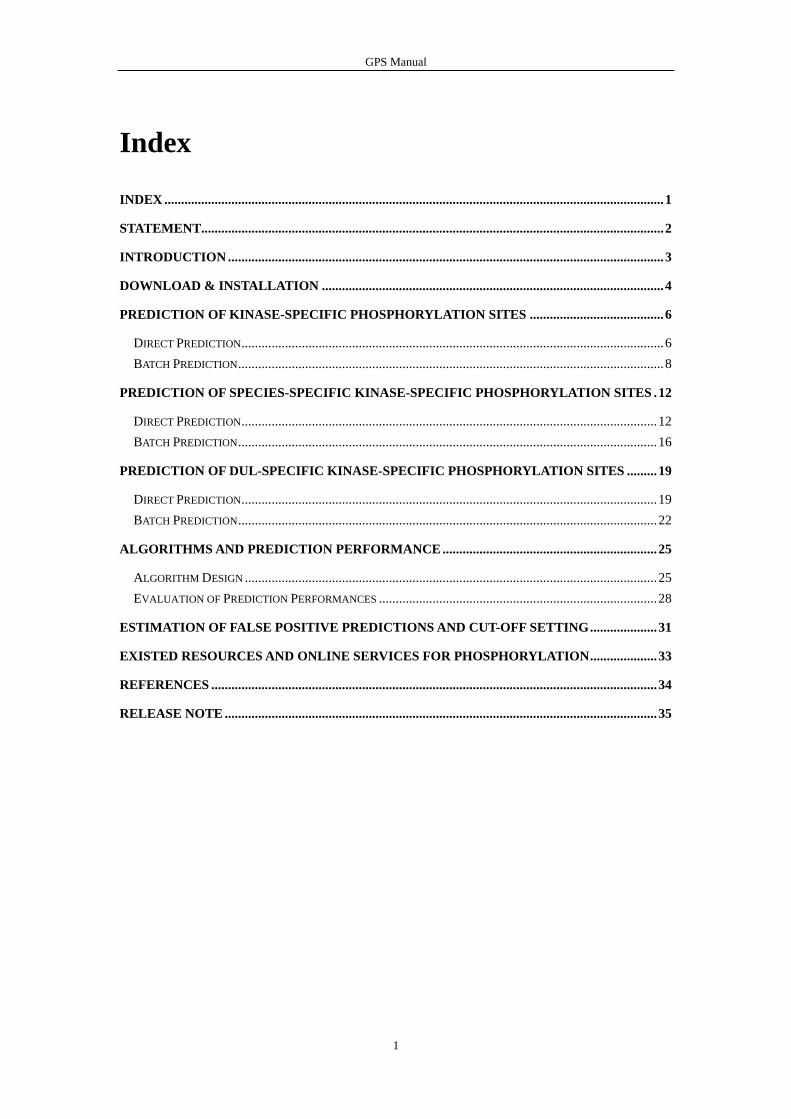
PK 1. Then we constructed the GPS (Group-based Prediction System, ver 2.0)
software, with a modified version of GPS (Group-based Phosphorylation Scoring)
algorithm 2,3
. As the first stand-alone software for computational phosphorylation,
GPS 2.0 was implemented in JAVA and could predict kinase-specific phosphorylation
sites for 408 human PKs in hierarchy.
Currently, as more and more phosphorylation sites have been experimentally validated,
a more accurate and reliable kinases-specific phosphorylation sites prediction tool is
in urgent need. At the same time, several advanced GPS algorithm have been
developed and achieved higher performance, including GPS 2.1 and GPS 2.2. To
improve the performance of phosphorylation sites prediction, we applied the GPS 2.2
algorithm and enlarged the training set. In addition, we included the phosphorylation
sites prediction in 84 species. For dul-specific kinases, we also provided the
prediction for these kinases. Finally, we constructed the GPS (Group-based
Prediction System, ver 3.0) software.
Group-based Prediction System v3.0 User Interface

GPS Manual
4
Download & Installation
The software of GPS 3.0 was implemented in JAVA, and could be installed on
Windows systems. GPS 3.0 distributions for Windows can be found at
http://gps.biocuckoo.org/down.php. We recommend that users could download the
latest release.
After downloading, please double-click on the file GPS_3.0_windows.exe to begin
installation. Follow the user prompts through the installation. And snapshots of the
setup program are shown below:

GPS Manual
5
Click on the Finish button to complete the setup program.

GPS Manual
6
Prediction of Kinase-specific Phosphorylation
Sites
Direct Prediction
For convenience, the GPS 3.0 allows users to input their protein sequences into the
“TEXT form” for prediction. One or more protein sequences should be prepared in
FATSA format as below:
>protein1
XXXXXXXXXXXXX
XXXXXXXX
>protein2
XXXXXXXXXXXXXXXX…
>protein3
XXXXXXXXXXXX
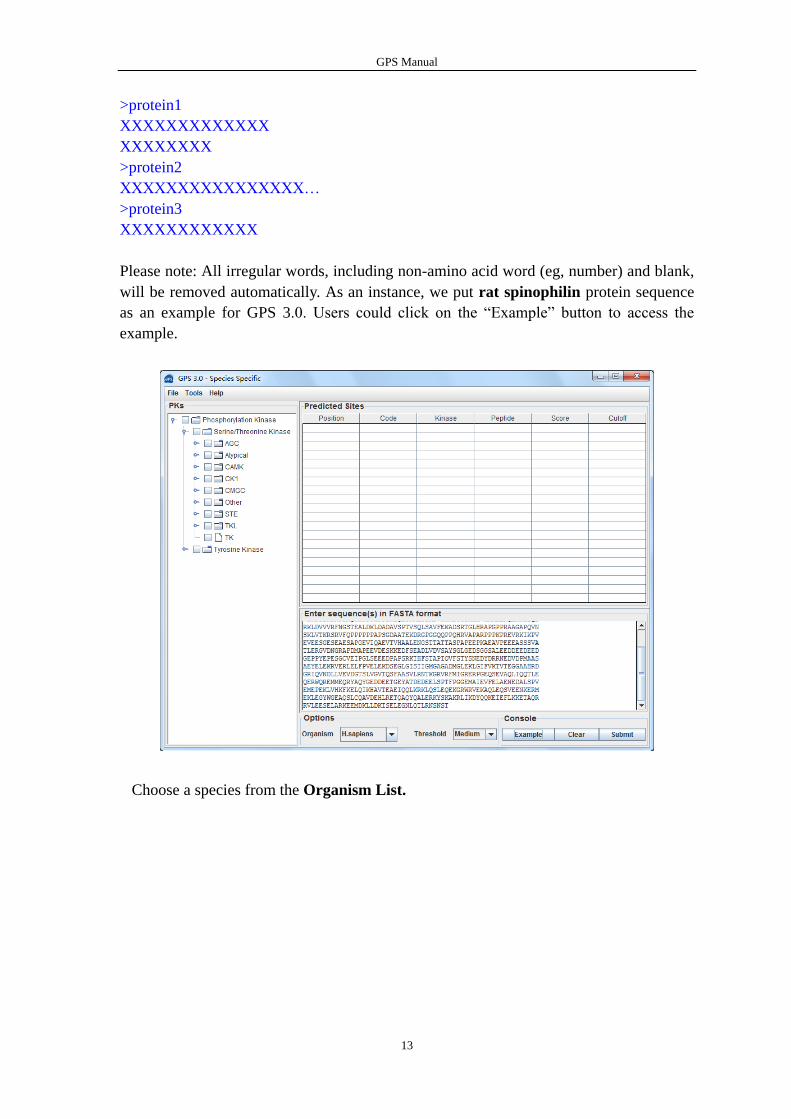
Please note: All irregular words, including non-amino acid word (eg, number) and blank,
will be removed automatically. As an instance, we put rat spinophilin protein sequence
as an example for GPS 3.0. Users could click on the “Example” button to access the
example.

GPS Manual
7
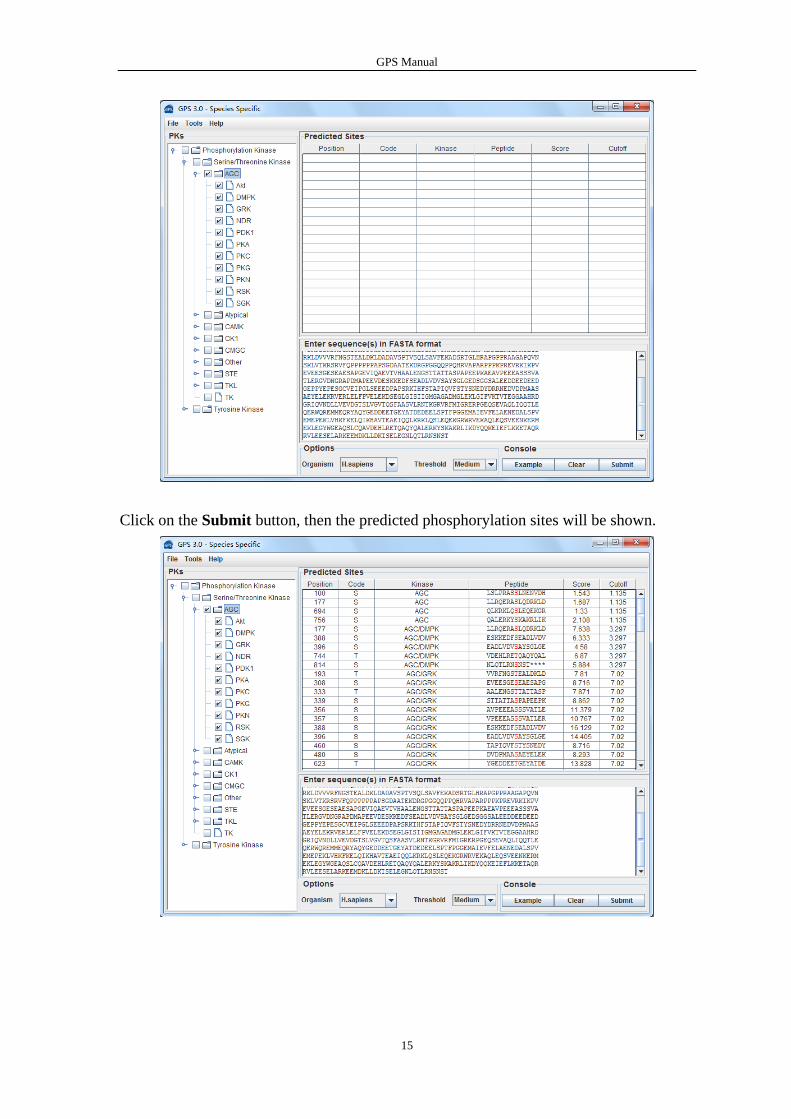
Choose one or more kinases from the Kinase Hierarchy Tree
Choose a Threshold what you need, default is Medium.
Click on the Submit button, then the predicted phosphorylation sites will be shown.

GPS Manual
8
Batch Prediction
We also provide an alternative approach for processing multiple protein sequences. If the
file is large, the Batch Predictor will be convenient for users.
The following steps show you how to use it:
Put protein sequences into a file with FATSA format as below:
>protein1
XXXXXXXXXXXXX
XXXXXXXX
>protein2
XXXXXXXXXXXXXXXX…
>protein3
XXXXXXXXXXXX
The names of proteins are necessary (the line with “>” and a protein name/accession
number).
To run the Batch Predictor just select the Batch Predictor option in the Tools menu.

GPS Manual
9
Click on the Add File button and add one or more protein sequence files in your hard
disk.
The name of added files will be shown in the Sequence File List

GPS Manual
10
The output directory of prediction results should also be defined. Please click on the
“>>” button to specify the export file fold.
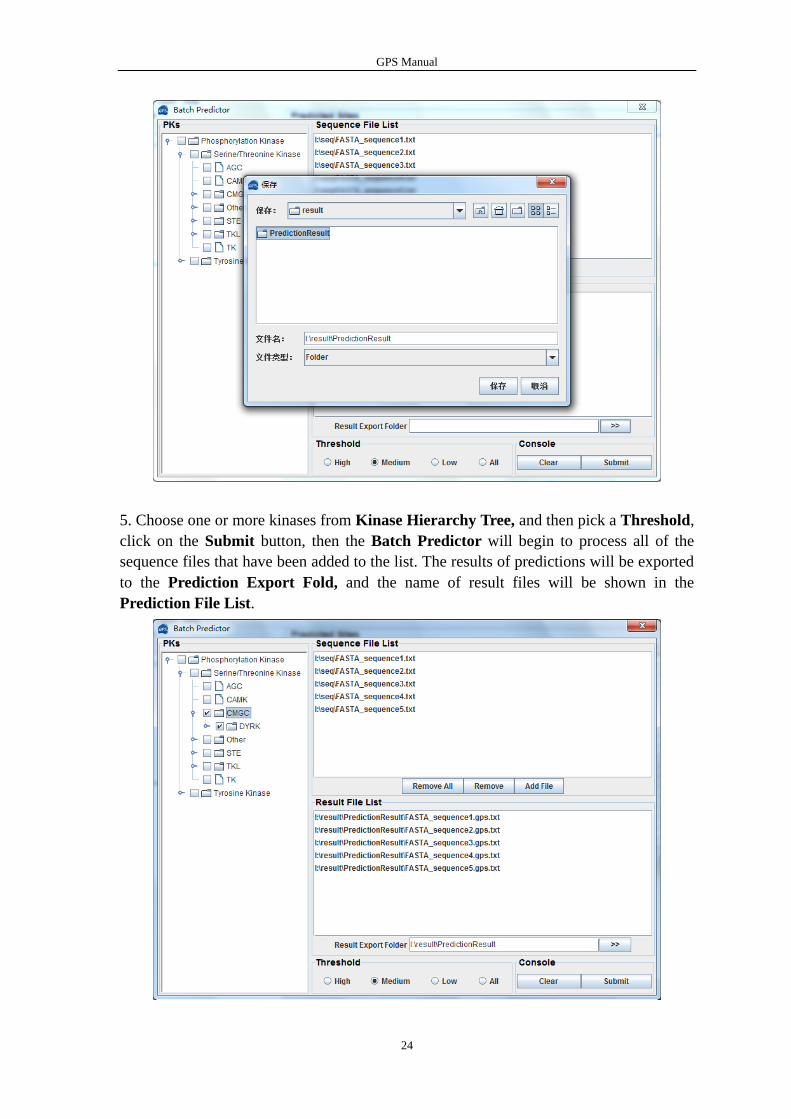
5. Choose one or more kinases from Kinase Hierarchy Tree, and then pick a Threshold,
click on the Submit button, then the Batch Predictor will begin to process all of the

GPS Manual
11
sequence files that have been added to the list. The results of predictions will be exported
to the Prediction Export Fold, and the name of result files will be shown in the
Prediction File List.

GPS Manual
12
Prediction of Species-specific Kinase-specific
Phosphorylation Sites
Direct Prediction
An advance feature of GPS 3.0 is Prediction of Species-specific Kinase-specific
Phosphorylation Sites. Users can predict phosphorylation sites in different species. Since
there isn’t a standard principle classification for all animals and plants, we applied the
kinases classification for eukaryotes from a new published database – EKPD, which is a
eukaryotic protein kinases and protein phosphatases database. Kinases and phosphatases
in 84 species are classified in a hierarchy structure, including group, family and single
protein.
To predict phosphorylation sites in 84 species, users could open the species-specific
prediction interface by clicking the item “GPS 3.0 – Species Specific” item in “Tool”
menu.
Similar with the classical version, this prediction interface also allows users to input their
protein sequences into the “TEXT form” for prediction. One or more protein sequences
should be prepared in FATSA format as below:
GPS Manual
13
>protein1
XXXXXXXXXXXXX
XXXXXXXX
>protein2
XXXXXXXXXXXXXXXX…
>protein3
XXXXXXXXXXXX
Please note: All irregular words, including non-amino acid word (eg, number) and blank,
will be removed automatically. As an instance, we put rat spinophilin protein sequence
as an example for GPS 3.0. Users could click on the “Example” button to access the
example.
Choose a species from the Organism List.

GPS Manual
14
Choose one or more kinases from the Kinase Hierarchy Tree
Choose a Threshold what you need, default is Medium
GPS Manual
15
Click on the Submit button, then the predicted phosphorylation sites will be shown.

GPS Manual
16
Batch Prediction
In GPS 3.0 – Species Specific prediction interface, we also provide an alternative
approach for processing multiple protein sequences. If the file is large, the Batch
Predictor will be convenient for users.
The following steps show you how to use it:
Put protein sequences into a file with FATSA format as below:
>protein1
XXXXXXXXXXXXX
XXXXXXXX
>protein2
XXXXXXXXXXXXXXXX…
>protein3
XXXXXXXXXXXX
The names of proteins are necessary (the line with “>” and a protein name/accession
number).
To run the Batch Predictor just select the Batch Predictor option in the Tools menu.
Click on the Add File button and add one or more protein sequence files in your hard

GPS Manual
17
disk.
The name of added files will be shown in the Sequence File List
The output directory of prediction results should also be defined. Please click on the “>>”
button to specify the export file fold.

GPS Manual
18
5. Choose one or more kinases from Kinase Hierarchy Tree, and then pick a Threshold,
click on the Submit button, then the Batch Predictor will begin to process all of the
sequence files that have been added to the list. The results of predictions will be exported
to the Prediction Export Fold, and the name of result files will be shown in the
Prediction File List.

GPS Manual
19
Prediction of Dul-Specific kinase-specific
phosphorylation sites
Direct Prediction
A lot of kinases have been found that are responsible for more than one phosphorylated
residues. In GPS 3.0, we also collected several kinases which can both catalyze Ser/Thr
and Tyr sites. We picked out these special phosphorylation sites and kinases, and
provided a standalone prediction interface.
To predict phosphorylation sites in dul-specific kinases, users could open the
species-specific prediction interface by clicking the item “GPS 3.0 – Dul Specific” item
in “Tool” menu.
Similar with the classical version, this prediction interface also allows users to input their
protein sequences into the “TEXT form” for prediction. One or more protein sequences
should be prepared in FATSA format as below:
>protein1
XXXXXXXXXXXXX
XXXXXXXX
>protein2
XXXXXXXXXXXXXXXX…
>protein3
XXXXXXXXXXXX

GPS Manual
20
Please note: All irregular words, including non-amino acid word (eg, number) and blank,
will be removed automatically. As an instance, we put rat spinophilin protein sequence
as an example for GPS 3.0. Users could click on the “Example” button to access the
example.
Choose one or more kinases from the Kinase Hierarchy Tree

GPS Manual
21
Choose a Threshold what you need, default is Medium.
Click on the Submit button, then the predicted phosphorylation sites will be shown

GPS Manual
22
Batch Prediction
We also provide an alternative approach for processing multiple protein sequences. If the
file is large, the Batch Predictor will be convenient for users.
The following steps show you how to use it:
Put protein sequences into a file with FATSA format as below:
>protein1
XXXXXXXXXXXXX
XXXXXXXX
>protein2
XXXXXXXXXXXXXXXX…
>protein3
XXXXXXXXXXXX
The names of proteins are necessary (the line with “>” and a protein name/accession
number).
To run the Batch Predictor just select the Batch Predictor option in the Tools menu.
Click on the Add File button and add one or more protein sequence files in your hard
disk.

GPS Manual
23
The name of added files will be shown in the Sequence File List
The output directory of prediction results should also be defined. Please click on the “>>”
button to specify the export file fold.
GPS Manual
24
5. Choose one or more kinases from Kinase Hierarchy Tree, and then pick a Threshold,
click on the Submit button, then the Batch Predictor will begin to process all of the
sequence files that have been added to the list. The results of predictions will be exported
to the Prediction Export Fold, and the name of result files will be shown in the
Prediction File List.
GPS Manual
25
Algorithms and Prediction Performance
Algorithm Design
To predict kinase-specific phosphorylation sites, we employed our previous GPS
(Group-based Phosphorylation Scoring) method with improvement 2,3
. The basic
hypothesis of GPS algorithm is that if two short peptides are highly similar, they might
also bear similar 3D structures and biochemical properties. Then we used the amino acid
substitution matrix BLOSUM62 to calculate the similarity between two PSP (7, 7)
peptides.
As previously described 2,3
, for two amino acids a and b, let the substitution score
between them in BLOSUM62 be Score(a, b). The similarity between two PSP (7, 7)
peptides (15aa) A and B is defined as:
151
])[],[(),(i
iBiAScoreBAS
If S(A, B)<0, we simply redefine it as S(A, B)=0.
Given a putative PSP (7, 7) peptide, it will be compared with all known sites pairwisely
to calculate the substitution scores, separately. The average value of the substitution
scores is computed as the final prediction score of the given site. Given a putative PSP
(7,7) peptide, we can calculate its GPS score. Then we can judge whether the given site is
a potentially real phosphorylation site, under different thresholds.
In previous versions (GPS 1.0 and 1.10), we hypothesized that the bona fide pattern for
PK recognition and modification might be compromised by heterogeneity of multiple
structural determinants with different features. Then all known phosphorylation sites are
automatically partitioned into several clusters with the Markov Cluster Algorithm (MCL
for short) to improve the prediction performance 2,3
. However, only ~11% of the PK
groups (8 out of 71) could be divided into more than one cluster with enhanced
performances. Thus, the clustering method was not used in GPS 2.0.

GPS Manual
26
To improve the robustness of the prediction system globally without influencing the
prediction performance significantly, we employed an alternative approach of matrix
mutation.
Firstly, the BLOSUM62 was chosen as the initial matrix. The performance (Sn and Sp) of
leave-one-out validation for each PK groups was calculated. Then we fixed Sp as 90% to
improve Sn by matrix mutation. Although matrix mutation in other types was also valid,
the method we used in this article could improve the robustness significantly.
In GPS 3.0, we adopted a GPS 2.2 algorithm to try to improve the performance. The
peptide selection and weight training were introduced in our training procedure before
Matrix mutation (MaM).
1) Motif length selection (MLS). In this step, the optimized combination of NSP(m, n)
was determined for better performance. The combinations of NSP(m, n) (m = 1,. . .,
30; n = 1,. . ., 30) were extensively tested, while the optimal NSP(m, n) for each
cluster with the highest leave-one-out performance was respectively selected. We
fixed the Sp at 95% to compare Sn values.
2) Weight training (WT). We updated the substitution score between two NSP(m, n)
peptides A and B as:
nimi iBiAScorewBAS ])[],[(),('
The wi is the weight of position i. Again, if S0(A, B) o 0, we simply redefined it as
S0(A, B)=0. Initially, the w was defined as 1 for each position. We randomly picked
out the weight of any position for +1 or -1, and adopted the manipulation if the Sn
value of the re-computed leave-one-out result with the Sp fixed at 95% was increased.
The following pseudocode show you how to get a mutation matrix:
Initialize matrix with BLOSUM62
Set the default mutation times to 0
While mutation times less than 10000
Pick an element of matrix at random to mutate
Increase or decrease the value of the element
Calculate score of Leave-one-out with the mutated matrix
If the score increase
Keep the forward mutation
Else
Give up the mutation
Endif
Score the number of mutation times
Endwhile
Return the mutated matrix

GPS Manual
27
The process was repeated until convergence was reached. The following training
procedure is Matrix mutation, which is same with that in GPS 2.0.

GPS Manual
28
Evaluation of Prediction Performances
Performance measurements
To evaluate the prediction performances, four standard measurements were used,
including accuracy (Ac), sensitivity (Sn), specificity (Sp) and Mathew correlation
coefficient (MCC). Accuracy (Ac) represents the correct ratio between both positive (+)
and negative (-) data sets, while sensitivity (Sn) and specificity (Sp) illustrate the correct
prediction ratios of positive (+) and negative data (-) sets respectively. Since the number
of positive data and negative data differed too much from each other, the Mathew
correlation coefficient (MCC) was also included. The value of MCC ranges from -1 to 1,
and a larger MCC value stands for better prediction performance.
Among the data with positive hits by GPS 3.0, the real positives were defined as true
positives (TP), while the others were defined as false positives (FP). Among the data with
negative predictions, the real positives were defined as false negatives (FN), while the
others were defined as true negatives (TN). The four measurements of sensitivity (Sn),
specificity (Sp), accuracy (Ac), and Mathew correlation coefficient (MCC) were defined
as below:
FNTP
TPSn
,
FPTN
TNSp
,
FNTNFPTP
TNTPAc
, and
)()()()(
)()(
FNTNFPTPFPTNFNTP
FPFNTNTPMCC
.
The self-consistency, leave-one-out validation and n-fold cross-validation
The self-consistency used the training positive data and negative data directly to evaluate
the prediction performance, and represented the computational power of the prediction
system. However, the robustness and stability of the software should also be evaluated by
leave-one-out validation and n-fold cross-validation. In the leave-one-out validation,
which is also called as Jack-Knife validation, each sites in the dataset was picked out in
turn as an independent test sample, and all the remaining sites were regarded as training
data. This process was repeated until each site was used as test data one time. In n-fold
cross-validation all the (+) sites and (-) sites were combined and then divided equally
into n parts, keeping the same distribution of (+) and (-) sites in each part. Then n-1 parts
were merged into a training data set while the remanent part was taken as a testing data
set. This process was repeated twenty times and the average performance of n-fold cross-
validation was used to estimate the performance. In this work, the performances of
self-consistency and leave-one-out validation were calculated for all PK groups. And the
GPS Manual
29
4-, 6-, 8-, 10-fold cross-validations were performed for 70 PK groups without less than
30 sites. All self-consistency performances of GPS 3.0 have been included in
Performance option in the Tools menu.
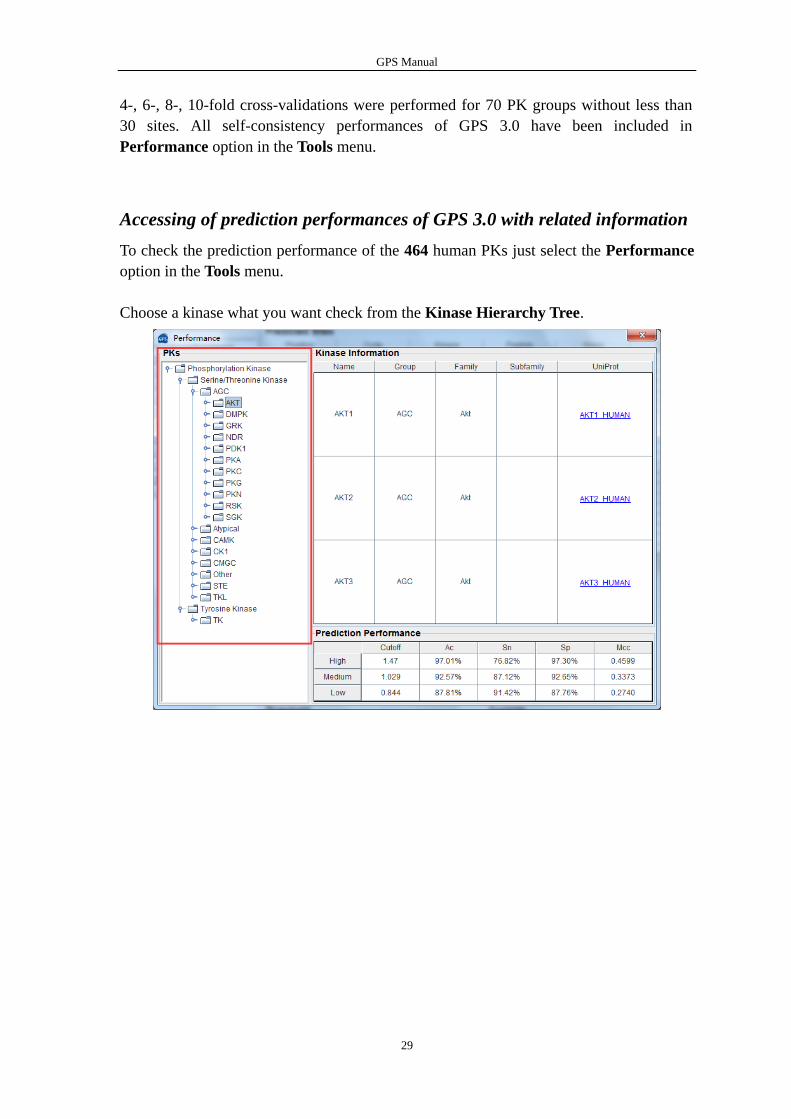
Accessing of prediction performances of GPS 3.0 with related information
To check the prediction performance of the 464 human PKs just select the Performance
option in the Tools menu.
Choose a kinase what you want check from the Kinase Hierarchy Tree.

GPS Manual
30
Then Kinase Information and Prediction Performance of the kinase are shown in the
tables.
If you want get more kinase information, you can click on the hyperlinks in the table.
The hyperlinks will access the UniProt database and show you the detailed information
of the kinases.

GPS Manual
31
Estimation of False Positive Predictions and
Cut-off setting
Estimation and control of false positive prediction is the key point in large-scale
predictions of kinase-specific phosphorylation sites. The false positive rate (FPR) is the
proportion of negative sites that are erroneously predicted as positive hits. From our
analysis, the real phosphorylation sites were only a very small part of all S/T residues in
proteins. For 144 serine/threonine PK groups, the positive sites vs. the negative sites was
from 1:13.2 (Other/PEK, 16 positive sites and 211 negative sites) to 1:141.2
(CAMK/CAMK1/CAMK4, 9 positive sites with 1271 negative sites), with the average
number of 49.0. And for 69 tyrosine PK groups, the positive sites vs. the negative sites
was from 1:1.6 (TK/Trk/TRKA, 5 positive sites with 8 negative sites) to 1:28.2 (TK/Csk,
5 positive sites and 141 negative sites), with the average number of 9.7. Thus, even a very
small FPR will generate too many false positive hits.
Given a data set containing all of non-phosphorylation sites, the real FPR could be easily
computed. However, precise calculation of FPR is unavailable due to lack of a
“gold-standard” negative data set. In order to estimate the false positive rate (FPR), we
tried to construct a near-negative data set by several approaches. The first method was to
generate PSP(30,30) peptides randomly. However, the frequencies of the twenty amino
acids are not equal in eukaryotes. Thus, the method was not used since it could not reflect
the real distributions of PSP(30,30) peptides in proteomes. Also, the negative sites could
also be randomly retrieved from eukaryotic proteomes. However, this method need a
large sequence file to retrieve PSP(30,30) peptides with slow speed. In this article, we
chose a simple and fast method to construct the near-negative data set. Firstly, we
calculated the distributions of amino acids composition in six organisms, including S.
cerevisiae, S. pombe, C. elegans, D. melanogaster, M. musculus, and H. sapiens. Then
we randomly generated PSP(30,30) peptides based on the real frequencies of twenty
amino acids. And FPR values based on the latter two methods were very similar. By this
method, we randomly generated 10,000 PSP(30,30) peptides and used GPS 3.0 to
estimate the theoretically maximal FPR. The process was repeated twenty times and the
average value was calculated as the final FPR. Then for large-scale predictions, we
defined the precision (Pr) as below:
.Pr
*.PrPr
e
FPRNe
Here, N is the number of sites (S/T or Y) for prediction; Pre. is the number of predicted
sites by GPS 3.0. Since the FPR is the theoretically maximal false positive hits, the
precision (Pr) is the minimal proportion of correct predictions.

GPS Manual
32
Threshold setting was also a difficult problem. By experiences, we and others chose
different thresholds for every PK groups2-12
. Here we proposed that a uniform rule to
choose cut-off values based on calculated FPRs. For serine/threonine kinases, the high,
medium and low thresholds were established with FPRs of 2%, 6% and 10%. And for
tyrosine kinases, the high, medium and low thresholds were selected with FPRs of 4%,
9% and 15%. The high threshold was validated by a large-scale prediction of mammalian
phosphorylation sites, with satisfying performance. And the medium threshold relaxed
the stringency to be useful in small-scale experiments. Also, the low threshold reduced
the Sp to improve Sn considerably to be useful in exhaustively experimental identifying
all potential phosphorylation sites in substrates.
GPS Manual
33
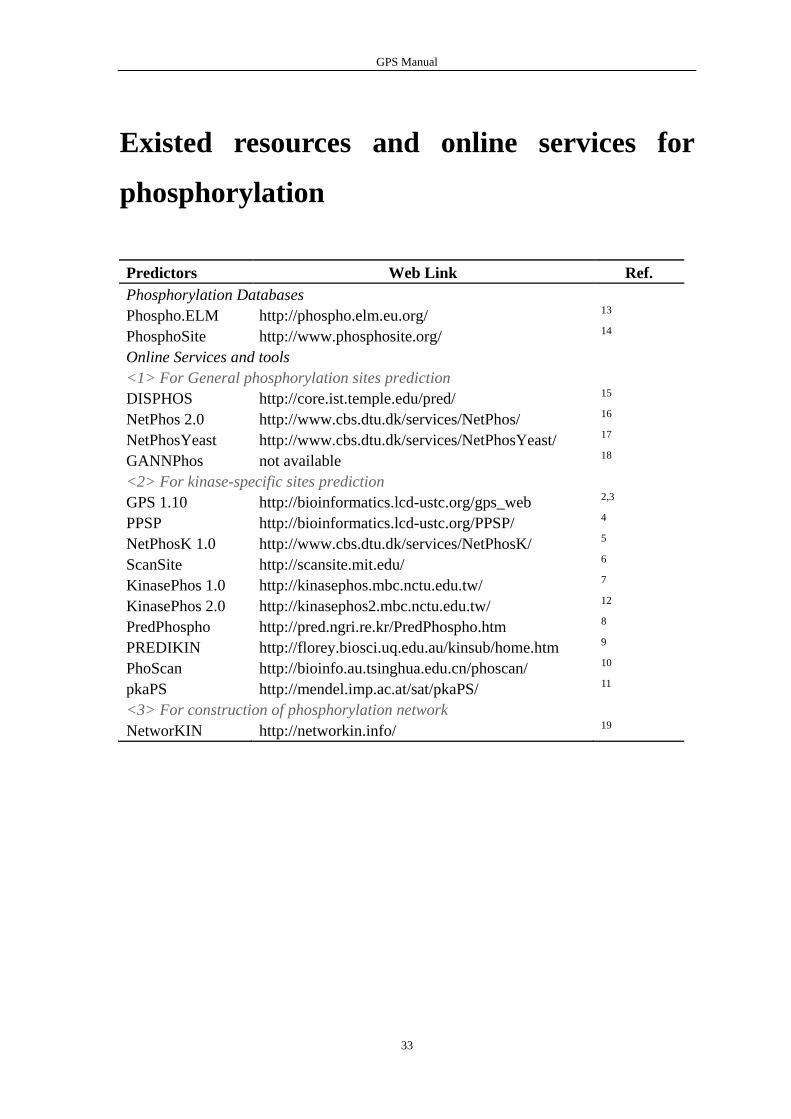
Existed resources and online services for
phosphorylation
Predictors Web Link Ref.
Phosphorylation Databases
Phospho.ELM http://phospho.elm.eu.org/ 13
PhosphoSite http://www.phosphosite.org/ 14
Online Services and tools
<1> For General phosphorylation sites prediction
DISPHOS http://core.ist.temple.edu/pred/ 15
NetPhos 2.0 http://www.cbs.dtu.dk/services/NetPhos/ 16
NetPhosYeast http://www.cbs.dtu.dk/services/NetPhosYeast/ 17
GANNPhos not available 18
<2> For kinase-specific sites prediction
GPS 1.10 http://bioinformatics.lcd-ustc.org/gps_web 2,3
PPSP http://bioinformatics.lcd-ustc.org/PPSP/ 4
NetPhosK 1.0 http://www.cbs.dtu.dk/services/NetPhosK/ 5
ScanSite http://scansite.mit.edu/ 6
KinasePhos 1.0 http://kinasephos.mbc.nctu.edu.tw/ 7
KinasePhos 2.0 http://kinasephos2.mbc.nctu.edu.tw/ 12
PredPhospho http://pred.ngri.re.kr/PredPhospho.htm 8
PREDIKIN http://florey.biosci.uq.edu.au/kinsub/home.htm 9
PhoScan http://bioinfo.au.tsinghua.edu.cn/phoscan/ 10
pkaPS http://mendel.imp.ac.at/sat/pkaPS/ 11
<3> For construction of phosphorylation network
NetworKIN http://networkin.info/ 19
GPS Manual
34
References
1. G. Manning, D. B. Whyte, R. Martinez et al., Science 298 (5600), 1912 (2002).
2. Y. Xue, F. Zhou, M. Zhu et al., Nucleic Acids Res 33 (Web Server issue), W184 (2005).
3. F. F. Zhou, Y. Xue, G. L. Chen et al., Biochem Biophys Res Commun 325 (4), 1443 (2004).
4. Y. Xue, A. Li, L. Wang et al., BMC Bioinformatics 7, 163 (2006).
5. N. Blom, T. Sicheritz-Ponten, R. Gupta et al., Proteomics 4 (6), 1633 (2004).
6. J. C. Obenauer, L. C. Cantley, and M. B. Yaffe, Nucleic Acids Res 31 (13), 3635 (2003).
7. H. D. Huang, T. Y. Lee, S. W. Tzeng et al., Nucleic Acids Res 33 (Web Server issue), W226
(2005).
8. J. H. Kim, J. Lee, B. Oh et al., Bioinformatics 20 (17), 3179 (2004).
9. R. I. Brinkworth, R. A. Breinl, and B. Kobe, Proc Natl Acad Sci U S A 100 (1), 74 (2003).
10. T. Li, F. Li, and X. Zhang, Proteins (2007).
11. G. Neuberger, G. Schneider, and F. Eisenhaber, Biology direct 2, 1 (2007).
12. Y. H. Wong, T. Y. Lee, H. K. Liang et al., Nucleic Acids Res 35 (Web Server issue), W588 (2007).
13. F. Diella, S. Cameron, C. Gemund et al., BMC Bioinformatics 5 (1), 79 (2004).
14. P. V. Hornbeck, I. Chabra, J. M. Kornhauser et al., Proteomics 4 (6), 1551 (2004).
15. L. M. Iakoucheva, P. Radivojac, C. J. Brown et al., Nucleic Acids Res 32 (3), 1037 (2004).
16. N. Blom, S. Gammeltoft, and S. Brunak, J Mol Biol 294 (5), 1351 (1999).
17. C. R. Ingrell, M. L. Miller, O. N. Jensen et al., Bioinformatics 23 (7), 895 (2007).
18. Y. R. Tang, Y. Z. Chen, C. A. Canchaya et al., Protein Eng Des Sel 20 (8), 405 (2007).
19. R. Linding, L. J. Jensen, G. J. Ostheimer et al., Cell 129 (7), 1415 (2007).

GPS Manual
35
Release Note
1. Jan. 1st, 2008, the online service and the local stand-alone packages of GPS 2.0 were
released. The stand-alone software of GPS 2.0 could support Windows Operating
Systems.
2. Jan. 29th, 2008, a bug was found that the version 2.0 couldn’t be used under
non-English Operating Systems. We fixed the bug and released the version 2.0.1 beta
version. We thank Dr. Miguel Angel Sanchez (Malaga, Spain) and Dr. Gilles Vachon
(Universite J. Fourier, France) to send us feedbacks.
3. Apr. 13th, 2008, The GPS 2.0.1 was released, with online service and local packages,
to support three major Operating Systems, including Windows, Linux/Unix and Mac.
Also, the GPS 2.0.1 manual was updated and included in the packages.