Embed Size (px)
Citation preview

i
Government of Karnataka
Report:
FISCAL INDICATORS OF ‘BRICS’ NATIONS: A
COMPARATIVE ANALYSIS
Center for Financial Accountability and Decentralization
Fiscal Policy Institute
Kengeri, Bengaluru-60
October, 2017

ii

iii
TABLE OF CONTENTS
Abstract iii
Executive Summary iv
List of Chapters vi
List of Tables vi
List of Illustrations vi
List of Abbreviations vii
iv
Abstract
This report analyses and compares the fiscal policies/indicators of BRICS economies for last two
decades and in particular, post crisis period comprehensively. With the emergence financial crisis
in 2008, favourable fiscal balances of BRICS economies turned into deficits. Consequently the
debt level started peaking up. India has highest fiscal deficits and debt and also lowest revenues
and expenditure as proportion to GDP amongst the BRICS economies. China has the least deficits
and debt when compared to other BRICS nations. In 2014-15, due to global economic slowdown
there was a crisis again in the fiscal balance of Brazil and Russia. The Russian economy is highly
dependent on oil exports for revenue. The oil price fluctuations determine Russia’s fiscal balances.
It was also found that vertical fiscal imbalance is a major problem for China and South Africa, as
the Center has more revenue raising powers whereas lower level of governments have higher
spending responsibilities.
Fiscal rules have played very important role in keeping fiscal variables under control. Amongst
the BRICS, Brazil is the first country to enact a Fiscal Responsibility Legislation in the year 2000.
Brazil’s Fiscal Responsibility Law (FRL) is very strict and it even specifies penalties and
sometimes imprisonment for mismanagement of government funds. Both India and Russia follow
numerical fiscal rules. South Africa and China do not follow any legislated budget constraints.
However, Medium Term Fiscal Plan was adopted by both the nations. In recent episodes, Chinese
Government is stressing on the fiscal transparency aspect.
Fiscal indicators of BRICS economies were under control before the onset of 2008 global financial
crisis. However, after the crisis, it started deteriorating for all BRICS economies with exception of
China. A well-controlled fiscal situation was observed for China even in the crisis period. To an
extent, numerical fiscal rules has worked for Brazil and India. In the recent years all the BRICS
economies are giving greater prominence to procedural rules and fiscal transparency.

v
Executive Summary
Brazil, Russia, India, China and South Africa (BRICS) are grouped as emerging economies and
these countries are fastest growing in the world. There was tremendous improvements in output
growth and per capita income growth for these nations over the last two decades. The recent 2008
financial crisis adversely affected many economies in the world and the BRICS countries are not
an exception.
This report analyses and compares the developments in fiscal policies/indicators for last two
decades and in particular, post crisis period comprehensively. It was found that favourable fiscal
balances (surpluses and smaller deficits) has turned out to be huge deficits after the 2008 crisis.
Consequently the debt level started peaking up. India has highest fiscal deficits and debt and also
lowest revenues and expenditure as proportion to GDP amongst the BRICS economies. China has
the least deficits and debt when compared to other BRICS nations. In 2014-15, due to global
economic slowdown there was a crisis again in the fiscal balance of Brazil and Russia. The Russian
economy is highly dependent on oil exports for revenue. The oil price fluctuations determine
Russia’s fiscal balances. It was also found that vertical fiscal imbalance is a major problem for
China and South Africa, as the Center has more revenue raising powers whereas lower level of
governments have higher spending responsibilities.
Fiscal rules have played very important role in keeping fiscal variables under control. Amongst
the BRICS, Brazil is the first country to enact a Fiscal Responsibility Legislation in the year 2000.
This rule applies to all levels of government. Brazil’s Fiscal Responsibility Law (FRL) is very
strict and it even specifies penalties and sometimes imprisonment for mismanagement of
government funds.
India enacted FRBM Act in 2003 and at subnational level, State Governments have enacted their
own FRLs. Framing of FRLs at subnational level was incentivized and promoted by the Central
Government through several schemes like Debt Swap Scheme, Fiscal Reform Facility and Debt
Consolidation & Relief Facility. With the help of FRLs and favourable economic condition both
Centre and State Governments in India could reduce their deficits below threshold of 3% of GDP.
The State Governments efforts in reducing fiscal deficits are remarkable. 14th Finance Commission
has incentivized the states’ fiscal efforts by providing a flexibility in fiscal deficit target by 0.5%

vi
of GSDP if state’s debt to GSDP ratio is below 25% and interest payments to revenue receipts
ratio is below 10% in the preceding year.
Russian Government has framed Balanced Budget Rule (BBR) in 2007-08. Government has
adopted non-oil fiscal balance as target fiscal indicator. However BBR was removed in 2012 owing
to 2008 financial crisis. Since 2013 Russian Government is following ‘Expenditure Rule’. South
Africa and China do not follow any legislated budget constraints. However, Medium Term Fiscal
Plan was adopted by both the nations. In recent episodes, Chinese Government is stressing on the
fiscal transparency aspect.
Overall, this study finds that fiscal position of BRICS nation was in good shape before 2008 crisis.
Aftermath the crisis, these indicators turned out to be negative. China’s fiscal performance even
in crisis period was remarkable. Numerical fiscal rules has worked to an extent for Brazil and
India. All the BRICS nations presently emphasizes on procedural rules and fiscal transparency
implying their path towards sustainable fiscal balance.

vii
List of Chapters
Chapter-1:
Economic Profile of BRICS Nations 1 - 5
Chapter-2:
Fiscal Indicators of BRICS Economies 6 - 12
Chapter-3:
Fiscal Rules in BRICS Economies 13 - 28
Chapter-4:
Conclusion 29 - 30
Bibliography 31 – 32
List of Tables
1.1 Per-Capita GDP (in current US$) 04
1.2 Sector-wise Distribution of GDP 04
2.1 General Government Revenue & Expenditure 06
2.2 Cyclical Component of GENERAL Government Balance (% of GDP) 10
List of Illustrations
1.1 Real GDP growth of BRICS Nations 02
2.1 General Government Balance (% of GDP) 07
2.2 General Government Cyclically adjusted Balance (% of GDP) 09
2.3 General Government Primary Balance (% of GDP) 10
2.4 General Government Debt (% of GDP) 11

viii
List of Abbreviations
BBR: Balanced Budget Rule
BRICS: Brazil, Russia, India, China & South Africa
DSS: Debt Swap Scheme
FRBM: Fiscal Responsibility and Budget Management
FRF: Fiscal Reforms Facility
FRL: Fiscal Responsibility Law
GDP: Gross Domestic Product
GEAR: Growth, Employment and Redistribution
IMF: International Monetary Fund
MTBPS: Medium Term Budget Policy Statement
MTFP: Medium Term Fiscal Plan
MTFRP: Medium Term Fiscal Reforms Program
NDB: New Development Bank
OECD: Organization for Economic Cooperation and Development
PCI: Per Capita Income
RDP: Reconstruction and Development Program
SARS: South African Revenue Service

1
Fiscal Indicators of ‘BRICS’ Nations: A Comparative Analysis
The acronym ‘BRIC’ was first coined by Jim O’ Neill in Goldman Sachs’ research paper ‘Building
Better Global Economic BRICs” in the year 2001 (Neill, 2001). BRIC represents emerging nations
namely Brazil. Russia, India & China. Formal grouping of BRIC was happened in the year 2006.
It was agreed to expand BRIC into BRICS (Brazil, Russia, India, China & South Africa) with the
inclusion of South Africa at the BRIC foreign ministers meeting in New York in 2010. These five
emerging economies comprises 43% of world’s population, 30% of world Gross Domestic Product
(GDP) and 17% share in global trade (GoI, 2017).
Eight BRICS summit were held till now. The agenda of BRICS meetings has considerably widened
over the years. BRICS cooperation has two pillars namely consultations on issues of mutual
interest through meeting of leaders as well as minsters of different ministries and practical
cooperation in number of areas through meetings of working group and senior officials.
In the 6th BRICS summit held at Fortaleza, Brazil in 2014 an agreement was signed among BRICS
nations to establish a multilateral development bank and it was named as New Development Bank
(NDB). The purpose of NDB is to mobilize resources for infrastructure and sustainable
development projects in BRICS and other emerging and developing economies while
complementing efforts of other multilateral and regional financial institutions (NDB, 2017).
This report basically examines the fiscal situation of BRICS nations in terms of its revenue,
expenditure and debt. The 2008 financial crisis severely affected many countries in the world,
especially the advanced ones. Its adverse effect was also observed on emerging nations in terms
of slow growth. This report concentrates mainly on fiscal indicators behavior aftermath the crisis
and also examines the fiscal developments (fiscal rules in particular) took place in BRICS Nations
in the last two decades.
This report comprises of four chapters. First chapter provides brief economic profile of all the
BRICS Nations in terms of economic growth, per capita income etc. Second chapter comparatively
analyzes the trend and patterns of fiscal indicators of BRICS economies. Third chapter provides a
discussion on fiscal developments took place in BRICS Nations, particularly in terms of fiscal
rules in the last two decades. Last chapter concludes the report.

2
Chapter-1
Economic Profile of BRICS Nations
Higher GDP growth implies increase in country’s productive capacity. Simon Kuznets in his Noble
Prize lecture defines economic growth as a long term rise in capacity to supply increasingly diverse
economic goods to its population, this growing capacity is based on advanced technology and the
institutional and ideological adjustments that it demands (Nobleprize.org, 2017). Figure-1.1
depicts real GDP growth of BRICS Nations since 1991 to 2015.
Figure-1.1
Real GDP Growth of BRICS Nations
Source: World Development Indicators, The World Bank (2017)
Note: growth figures are in annual % growth rate of GDP at Market Price based on constant local
currency
In 1991, GDP growth of India and Brazil was as low as 2%, whereas it was negative for South
Africa and Russia. Political turmoil, collapse of Soviet Union, plummeting foreign trade, drastic
fall in state revenues, decline in oil prices etc resulted in negative growth in early 90s for Russia
(Aslund, 1999). The macroeconomics of fiscal policy in Russia is mainly dominated by oil
revenues. It is the main export earner and largest source of government revenue. The financial
indiscipline with massive implicit subsidies amounting to about 10% of GDP has resulted in
-20
-15
-10
-5
0
5
10
15
20
GR
OW
TH (
IN %
)
YEAR
Brazil Russia India China South Africa

3
declining tax collections, rising government debt, higher interest rates and poor growth
performance in 1998. These factors reinforced each other, contributing to the general financial and
currency crisis in 1998 (Bogetic, 2010). Sharp reduction in Russia’s GDP growth can be observed
from Figure-1.1. South Africa’s growth rate has picked up after the end of apartheid era in 1994.
India’s growth was very low in 1991. In the same year India has faced severe Balance of Payments
crisis, high inflation and higher budget deficits. However, liberalization reforms of 1991-92 by
opening up of economy for private investments has resulted in higher growth rate in subsequent
years. More importantly, massive growth in service sector through revolution in information
technology sector and other service sectors is the prime reason for better growth rates. The upward
trend in growth rate continued for all the countries until 2007 and the growth rate was 8% for India
and Russia, around 5% for Brazil and South Africa. After a recovery from 2008 financial crisis,
Brazilian economy once again entered into recession in 2014. The situation further worsened in
2015. The factors which lead to Brazilian recession in 2014 are structural weakness of Brazilian
economy, negative terms of trade, strong capital inflows which fueled currency appreciation,
higher fiscal and current account deficits, decline in commodity prices and consequent decline in
export earnings etc (ECB, 2016). China since 1991 has maintained comparatively higher growth
rate among the BRICS nations. This trend was mainly owing to China’s large investments in
infrastructure, which boosted the growth. Productivity gains in terms of increased economic
efficiency is another reason for higher growth (Morrison, 2015). India is a strong service provider
with a rising manufacturing base, while China is seen as the manufacturing work shop of the world
with a highly skilled workforce and relatively low wage costs (GoI, 2012).
Availability of natural resources also contributes for the growth and also revenue to the
Government. Russia, China and South Africa are resource rich states. For instance, South Africa
generates 45% of Africa’s electricity and the South Africa power supplier provides the 4th cheapest
electricity in the world (GoI, 2012). Russia accounts 20% of world oil reserves, while China has
about 12% of world’s mineral resources. Among the BRICS India and Brazil are relatively more
domestic demand driven economies whereas China and Russia has significant outward linkage
(GoI, 2012).
With 2008 economic recession, there was a drastic decline in the growth rates for all the five
countries. However this decline is minimal for India and China. Immediate recovery of these two
4
countries and consistent growth performance is impressive. The decline is highest for Russia
followed by South Africa and Brazil in 2009.
Sustained economic reforms and improved macroeconomic fundamentals along with a buoyant
macroeconomic environment contributed to the improved growth performance of BRICS in the
present and last decade.
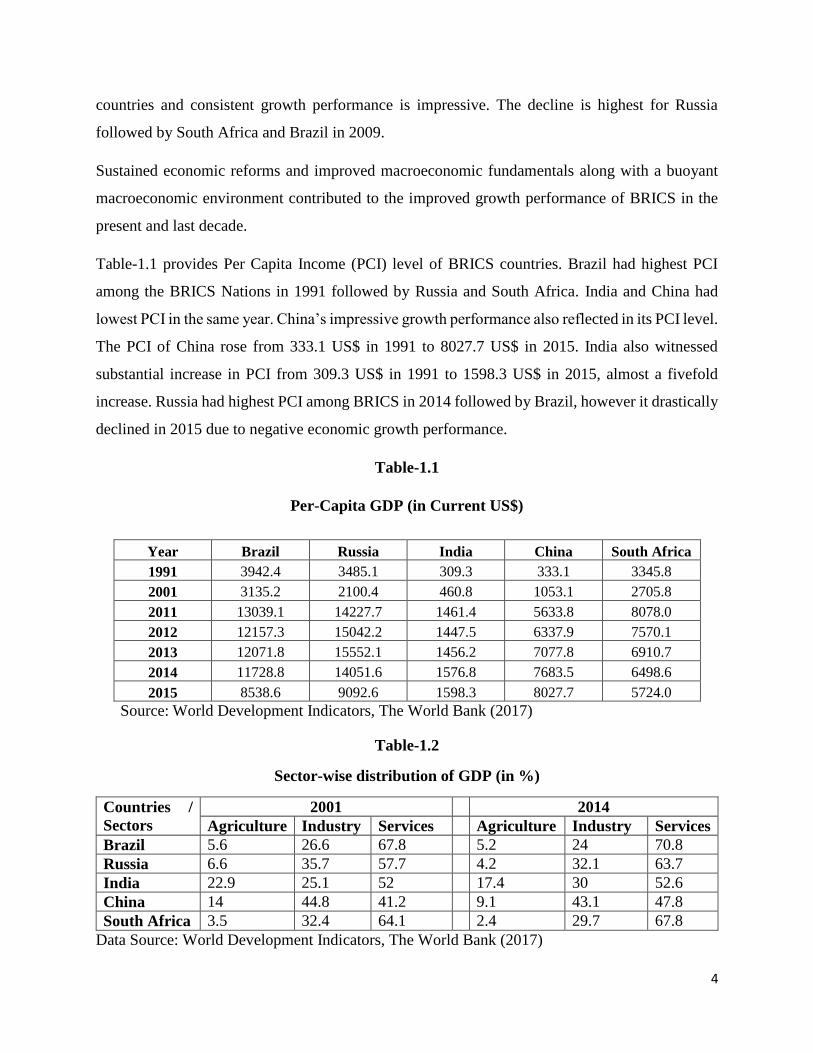
Table-1.1 provides Per Capita Income (PCI) level of BRICS countries. Brazil had highest PCI
among the BRICS Nations in 1991 followed by Russia and South Africa. India and China had
lowest PCI in the same year. China’s impressive growth performance also reflected in its PCI level.
The PCI of China rose from 333.1 US$ in 1991 to 8027.7 US$ in 2015. India also witnessed
substantial increase in PCI from 309.3 US$ in 1991 to 1598.3 US$ in 2015, almost a fivefold
increase. Russia had highest PCI among BRICS in 2014 followed by Brazil, however it drastically
declined in 2015 due to negative economic growth performance.
Table-1.1
Per-Capita GDP (in Current US$)
Year Brazil Russia India China South Africa
1991 3942.4 3485.1 309.3 333.1 3345.8
2001 3135.2 2100.4 460.8 1053.1 2705.8
2011 13039.1 14227.7 1461.4 5633.8 8078.0
2012 12157.3 15042.2 1447.5 6337.9 7570.1
2013 12071.8 15552.1 1456.2 7077.8 6910.7
2014 11728.8 14051.6 1576.8 7683.5 6498.6
2015 8538.6 9092.6 1598.3 8027.7 5724.0
Source: World Development Indicators, The World Bank (2017)
Table-1.2
Sector-wise distribution of GDP (in %)
Countries /
Sectors
2001 2014
Agriculture Industry Services Agriculture Industry Services
Brazil 5.6 26.6 67.8 5.2 24 70.8
Russia 6.6 35.7 57.7 4.2 32.1 63.7
India 22.9 25.1 52 17.4 30 52.6
China 14 44.8 41.2 9.1 43.1 47.8
South Africa 3.5 32.4 64.1 2.4 29.7 67.8
Data Source: World Development Indicators, The World Bank (2017)

5
Table-1.2 provides sector wise distribution of GDP in BRICS countries. Value added from
agricultural sector is highest for India followed by China. For all the BRICS countries value added
from agriculture has declined over the years. Industrial contribution to GDP is highest for China
accounting nearly 45% followed by Russia and South Africa. China maintains top position even
in 2014 in terms of gross value added from industrial sector. Service sector is the major contributor
towards national output in all the BRICS countries in 2014.
Higher economic growth, substantial increase in PCI, high value added from services etc implies
BRICS countries are growing as emerging global players. These factors also have fiscal
implications in terms of higher revenue collection and spending by the Governments. Next chapter
reviews the fiscal position of BRICS nations and further elaborates the trends and patterns of fiscal
indicators.
6
Chapter-2
Fiscal Indicators of BRICS Economies
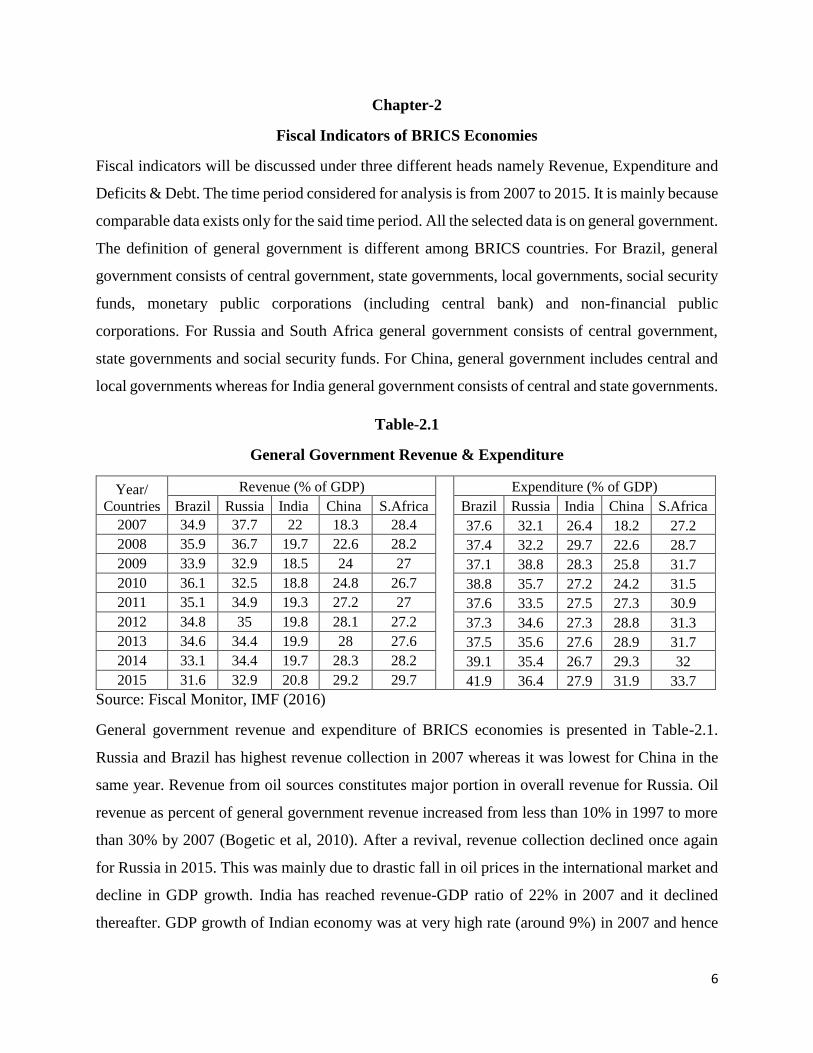
Fiscal indicators will be discussed under three different heads namely Revenue, Expenditure and
Deficits & Debt. The time period considered for analysis is from 2007 to 2015. It is mainly because
comparable data exists only for the said time period. All the selected data is on general government.
The definition of general government is different among BRICS countries. For Brazil, general
government consists of central government, state governments, local governments, social security
funds, monetary public corporations (including central bank) and non-financial public
corporations. For Russia and South Africa general government consists of central government,
state governments and social security funds. For China, general government includes central and
local governments whereas for India general government consists of central and state governments.
Table-2.1
General Government Revenue & Expenditure
Year/
Countries
Revenue (% of GDP)
Expenditure (% of GDP)
Brazil Russia India China S.Africa Brazil Russia India China S.Africa
2007 34.9 37.7 22 18.3 28.4 37.6 32.1 26.4 18.2 27.2
2008 35.9 36.7 19.7 22.6 28.2 37.4 32.2 29.7 22.6 28.7
2009 33.9 32.9 18.5 24 27 37.1 38.8 28.3 25.8 31.7
2010 36.1 32.5 18.8 24.8 26.7 38.8 35.7 27.2 24.2 31.5
2011 35.1 34.9 19.3 27.2 27 37.6 33.5 27.5 27.3 30.9
2012 34.8 35 19.8 28.1 27.2 37.3 34.6 27.3 28.8 31.3
2013 34.6 34.4 19.9 28 27.6 37.5 35.6 27.6 28.9 31.7
2014 33.1 34.4 19.7 28.3 28.2 39.1 35.4 26.7 29.3 32
2015 31.6 32.9 20.8 29.2 29.7 41.9 36.4 27.9 31.9 33.7
Source: Fiscal Monitor, IMF (2016)
General government revenue and expenditure of BRICS economies is presented in Table-2.1.
Russia and Brazil has highest revenue collection in 2007 whereas it was lowest for China in the
same year. Revenue from oil sources constitutes major portion in overall revenue for Russia. Oil
revenue as percent of general government revenue increased from less than 10% in 1997 to more
than 30% by 2007 (Bogetic et al, 2010). After a revival, revenue collection declined once again
for Russia in 2015. This was mainly due to drastic fall in oil prices in the international market and
decline in GDP growth. India has reached revenue-GDP ratio of 22% in 2007 and it declined
thereafter. GDP growth of Indian economy was at very high rate (around 9%) in 2007 and hence

7
the revenue collection was also highest in that year. Revenue collection declined until the year
2010 and it started raising thereon.
2008 financial crisis turned around the positive trend. Revenue collection as percent to GDP
declined for all the countries except China. Interestingly China’s revenue collection improved over
the years from 18.3% in 2007 to 29.2% in 2015. Even in the crisis period China has maintained
better economic growth rate. However its export was severely affected. In order to offset the
negative impacts of export decline on GDP growth and employment, China increased fixed assets
investment (Zhang, 2012). Among the BRICS countries, India has the lowest revenue-GDP ratio
as on 2015.
Expenditure as percent to GDP has increased for all BRICS economies between 2007 and 2015.
Increase was almost 4% of GDP for Brazil and Russia and 6% of GDP for South Africa. There
was a drastic rise in government expenditure for China from 18.2% in 2007 to 31.9% in 2015. The
2008 recession adversely affected the Chinese economy. Its foreign trade and GDP growth
declined. Millions of Chinese workers reportedly lost their job. The Chinese Government
responded by implementing a $586 billion economic package (Morrison, 2015). Indian
Government also provided a stimulus package to revive the economy from recession. The fiscal
stimulus provided by Government of India in the 2009-10 union budget was around 3.5% of GDP
amounting INR 1,86,000 crore (GoI, 2009).
Figure-2.1
General Government Balance (% of GDP)
Source: Fiscal Monitor, IMF (2016)
-12
-10
-8
-6
-4
-2
0
2
4
6
8
2 0 0 7 2 0 0 8 2 0 0 9 2 0 1 0 2 0 1 1 2 0 1 2 2 0 1 3 2 0 1 4 2 0 1 5
% O
F G
DP
YEARBrazil Russia India China S.Africa

8
Higher expenditure and decline in revenue aftermath the crisis resulted in higher deficits. Figure-
2.1 depicts general government balance of BRICS economies starting from 2007 to 2015. In the
year 2007, only Brazil and India had deficit in the Government account where as other two
countries namely Russia and South Africa were well positioned with a fiscal surplus. China’s
Government account was balanced in 2007. However, by the year 2009, fiscal surplus of Russia,
South Africa and China has turned into deficits. The fiscal situation in countries like India and
Brazil, which were already in deficits even before the 2008 financial crisis has worsened further.
India’s fiscal deficit was as high as 9.8% of GDP in 2009. There was a sharp reduction (almost
10% of GDP) in fiscal balance for Russia from a fiscal surplus of 4.6% of GDP in 2008 to a deficit
of 5.9% of GDP in 2009. Russia’s budget, exports and the structure of its economy is highly
dependent on the oil and gas sector. Large shocks and volatility will continue to define Russia’s
economic environment (Bogetic et al, 2010). With the emergence of 2008 financial crisis, on the
one hand oil revenue base has shrunk dramatically and even non-oil revenue declined with
economic activity and on the other hand social spending pressure has increased resulting in a huge
fiscal deficit for the Government.
China has comparatively better fiscal position then other BRICS economies. China has achieved
fiscal surplus in 2010 and there was a small reduction in fiscal balance by 0.7% of GDP in the
subsequent year. South Africa is facing fiscal deficit since 2009, which was about 4.9% of GDP
and it got reduced to 4% of GDP in 2015.
Brazil’s fiscal position was better than India and South Africa until 2013. However there was a
drastic fall in fiscal balance. Fiscal deficit which was at 3% of GDP in 2013 moved up drastically
to 10.3% of GDP. Brazilian economy has faced severe recession in 2014. Subsidized public sector
lending coupled with a rise in tax exemptions to revive business confidence, sharply increased
fiscal deficits (ECB, 2016). Weaker economic activities and fall in revenues has resulted in higher
deficits.

9
Figure-2.2
General Government Cyclically Adjusted Balance (% of GDP)
Source: Fiscal Monitor, IMF (2016)
International Monetary Fund (IMF) also publishes cyclically adjusted balance every year along
with general government balance data. Cyclically adjusted balance mean structural balance. It
provide a measure of the fiscal position that is net of the impact of macroeconomic developments
on the budget. It involves an estimation of what revenues and cyclically adjusted expenditure
would be if the economy were at its potential. Figure-2.2 depicts general government cyclically
adjusted balance. Cyclically adjusted balance almost follow similar trend of overall fiscal balance
as depicted in Figure-2.1. The difference between the overall fiscal balance and cyclically adjusted
(structural) balance indicate the deficits/surplus aroused due to cyclical factors. Table-2.2 provides
the deficit/surplus aroused due to cyclical factors.
Table-2.2 clearly shows that cyclical component was the major factor which resulted in higher
deficits in 2009. Global economic slowdown in 2014 and 2015 can also be observed from Table-
2.2. It also clearly indicate that fiscal imbalance in India and China is more of structural in nature
than the cyclical one. Rao (2009) argue that deficit problem in India is structural in nature and not
attributable to cyclical factors. He further mentions that stimulus package provided by Indian
Government in 2009 through increased subsidies, rural development outlay, pay revisions etc were
mainly because of 2009 general election. Cyclical component was highest for Brazil followed by
Russia and South Africa. Some of the developed countries like Australia and Germany follow
-12
-10
-8
-6
-4
-2
0
2
4
6
2 0 0 7 2 0 0 8 2 0 0 9 2 0 1 0 2 0 1 1 2 0 1 2 2 0 1 3 2 0 1 4 2 0 1 5
% O
F G
DP
YEARBrazil Russia India China S.Africa
10
cyclically adjusted fiscal balance as an indicator in their fiscal rules. South African Government
mandates to publish Cyclically Adjusted Balance in Medium Term Budget Policy statement every
year since 2007.
Table-2.2
Cyclical component of General Government Balance (% of GDP)
Year/
Countries Brazil Russia India China South Africa
2007 0.6 1.1 0.5 0.2 0.2
2008 1.1 0.5 -0.4 0.3 0.2
2009 -0.2 0 -0.3 0 -1.7
2010 1.3 0.1 0.4 0 -1.3
2011 1.6 0.2 0.3 0 -0.3
2012 1.4 0.5 -0.1 -0.2 -0.2
2013 1.7 0.4 0.1 -0.3 -0.1
2014 1.6 -0.9 -0.1 -0.4 -0.3
2015 -1 -1.1 -0.1 -0.3 -0.3
Data Source: Fiscal Monitor, IMF (2016)
Note: Cyclical component of general government balance was calculated by subtracting the
structural (cyclically adjusted) component from the overall fiscal balance.
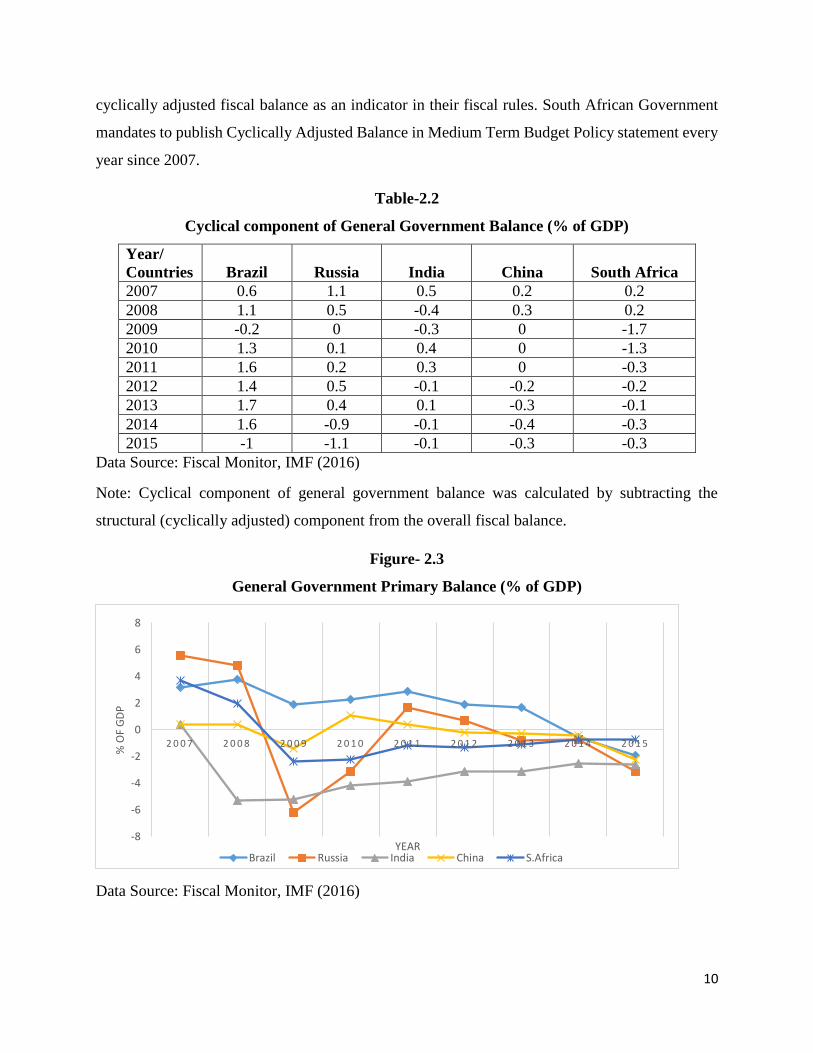
Figure- 2.3
General Government Primary Balance (% of GDP)
Data Source: Fiscal Monitor, IMF (2016)
-8
-6
-4
-2
0
2
4
6
8
2 0 0 7 2 0 0 8 2 0 0 9 2 0 1 0 2 0 1 1 2 0 1 2 2 0 1 3 2 0 1 4 2 0 1 5
% O
F G
DP
YEARBrazil Russia India China S.Africa

11
General Government primary balance of BRICS Nations is depicted in Figure-2.3. In the year 2007
all the BRICS economies have achieved primary surplus in the account. For all the BRICS
economies except Brazil primary surplus turned into deficits in 2009, following financial crisis.
Even though in deficit, there is an improvement in reducing primary deficit for India and South
Africa. The primary deficit of Russia and China has turned into surplus by 2011. However, in 2015
once again, primary balance has turned out as deficits for all the BRICS economies.
Figure-2.4
General Government Debt (% of GDP)
Data Source: Fiscal Monitor, IMF (2016)
Figure-2.4 depicts the general government debt level of BRICS economies from 2000 to 2015.
India has highest debt-GDP ratio among the BRICS economies. Debt level for India crossed 80%
of GDP in 2003. With the enactment of Fiscal Responsibility and Budget Management Act by
Central Government in 2003 and also by the State Governments in subsequent years enabled the
Indian government to reduce the debt level to an extent. Brazilian debt level closely follows India
in its trend and in the year 2015, Brazilian debt level surpassed India and reached almost 74% of
GDP. China and South Africa’s debt was below 30% and 40% of GDP respectively until 2008.
After the 2008 financial crisis, debt situation of both China and South Africa started worsening
and it reached almost 43% of GDP for China and 50% of GDP for South Africa. Russia has
witnessed considerable improvement in debt situation. Debt-GDP ratio which was at 55% of GDP
in 2000 has declined to around 16% of GDP for Russia in 2015.
0
10
20
30
40
50
60
70
80
90
2 0 0 0 2 0 0 1 2 0 0 2 2 0 0 3 2 0 0 4 2 0 0 5 2 0 0 6 2 0 0 7 2 0 0 8 2 0 0 9 2 0 1 0 2 0 1 1 2 0 1 2 2 0 1 3 2 0 1 4 2 0 1 5
% O
F G
DP
YEARBrazil Russia India China S.Africa

12
When the debt situation of BRICS economies are compared with some of the advanced economies
like USA and Japan, BRICS nations have much better fiscal situation (in terms of debt). For
instance, the debt level of USA was 105.8% of GDP and for Japan debt level was as high as 248%
of GDP in 2015. However, one interesting difference between Japan and other emerging nations
are, Japanese Government holds large assets as well as debt and the debt is denominated in home
currency and the interest rates are very minimal. Wakatabe (2015) argue that the key to understand
Japan’s fiscal situation is the net debt as opposed to gross debt. The Japanese Government holds
large amount of assets, therefore the net debt relative to GDP ratio goes down to 132% as on June
2014 and the gross debt in that year was 245% of GDP. Bank of Japan holds large amount of
Japanese Government bonds. He further adds that, since the Central Bank could, in principle
forever hold its current stock of Japan Government bonds, the government need not to worry about
how it is going to repay these bonds. In this case net debt relative to GDP ratio goes even further
down to 80% of GDP.
Few BRICS economies have enacted and following rule based fiscal correction mechanism. Others
have initiated ‘fiscal rules’ to bring back fiscal situation under control after the 2008 crisis. Next
chapter discusses fiscal rules followed by the BRICS economies in detail and also compares the
existing rules amongst the BRICS nations.

13
Chapter-3
Fiscal Rules in BRICS Economies
Governments appear to be interested in FRLs for two related reasons: for an individual government
to control its impulses to run excessive deficits and for a group of governments in the same country
to make and enforce a mutual agreement that each of them would avoid running excessive deficits
(Webb, 2004). Liu & Webb (2011) lists out possible reasons for Governments to be interested in
drawing fiscal responsibility legislations. They are:
Short time-horizons of policymakers. A government may wish to institutionalize its commitment
to control its impulses to run excessive deficits, in order to resist temptation in more pressing times
that may come in the future.
Free riders: A group of governments in the same country may wish to make and enforce a mutual
agreement that each of them would avoid running excessive deficits. Individual governments’
interests would diverge from the common interest, however, in that factors such as electoral
pressures would motivate them to follow fiscal behavior that is risky or unsustainable.
Principal-agent and moral hazard problems: When citizens or a higher level of government (the
principal) entrusts a subnational government (agent) with resources and the responsibility to carry
out a task, then there is the principal-agent problem in assuring that the agent government will
maintain the requisite fiscal stability to carry out the task, without default or bailout. Sub-national
borrowers as agents have an incentive not to repay their lenders as principals because they perceive
that they will be bailed-out by the central government in case of default, resulting in moral hazard.
Demonstrating commitment to be creditworthy: Borrowers, including sub national governments,
have an incentive not to reveal negative characteristics about themselves to lenders, which results
in adverse selection. Lenders will therefore charge a risk premium above what is directly justified
by the revealed information, even for a borrower who is not risky. So the asymmetrical information
can lead to mispricing of risks. To improve its terms of borrowing, a government needs to show
creditors that it is fiscally responsible. It can demonstrate this commitment by constraining itself
with a FRL, its own or from the national level.
Rule based fiscal correction mechanism saw a momentum in 1990s. European Union counties
signed Maastricht Treaty in 1992 and agreed up on to maintain the fiscal deficit below 3% of GDP.
Since the 1990s many governments have intensified the search for mechanisms to escape from

14
fiscal populism that had been used as a strategy for winning elections and retaining public office.
National governments have tried various ways to avert these problems. One way has been to pass
a fiscal responsibility laws that prescribes proper fiscal behavior for sub national governments,
provides guidelines for parameters of sub national governments fiscal legislation, or sets incentives
and rewards for success or sanctions for failure in following the rules (Liu & Webb, 2011). A
‘Fiscal Rule’ imposes a long lasting constraint on fiscal policy through numerical limits on
budgetary aggregates. Fiscal rules typically aims at correcting distorted incentives and containing
pressures to overspend, particularly in good time, so as to ensure fiscal responsibility and debt
sustainability (Schaechter et al, 2012). As per Organization for Economic Cooperation and
Development (OECD) fiscal consolidation is a policy aimed at reducing government deficits and
debt accumulation.
This chapter briefly discusses the fiscal rules which exists in BRICS economies.
Brazil:
Brazil is a federal presidential constitution consisting of Federal Government, 26 States, one
Federal District and Municipalities. The municipalities are relatively autonomous. Municipalities
can enact their own constitution and is allowed to collect taxes and fees and also to maintain a
municipal police force. Goldfanj & Guardia (2003) observe that debt agreement signed by Federal
Government with State and local governments and introduction of Fiscal Responsibility Law in
2000 were the two most important changes in the Brazilian fiscal regime.
Debt agreement:
25 out of 27 States have signed debt restructuring agreements. As per the agreement, States have
refinanced their debts for 30 years with a fixed real interest rate of 6%. The Federal Government
has issued federal securities to redeem the existing State debts and became creditor to the States.
This bailout was followed by an explicit obligation for the States to commit themselves to an
agreed upon fiscal adjustment program, including an accorded path for the State debt. To receive
the benefits of the debt restructuring agreement, the States has to offer their own revenue and legal
revenue transfers from the Federal Government as a guarantee (Goldfanj & Guardia, 2003). In
case of a default, the contracts authorize the Federal Government to retain legal transfers or to
withdraw the amount due from the State’s own bank account. Furthermore, States failing to

15
comply will be denied of Federal Guarantee on new state borrowing and can incur interest penalties
on the rescheduled debt.
As per the agreement, minimum debt payment to Federal Government is equivalent to 13% of
states’ net revenue. Federal Government also restructured local government debt incurred before
May 2000. Federal Government took municipalities own revenue as a guarantee and required a
monthly payment equivalent to 13% of municipality’s net current revenue.
Fiscal Responsibility Law, 2000
Fiscal Responsibility Law (FRL), 2000 has set a general framework for budgetary planning,
execution and reporting for the three levels of Government. The law calls for sustaining the
structural adjustment of public finances and constraining public indebtedness. It comprises 3 types
of fiscal rules: general targets & limits for selected fiscal indicators; corrective institutional
mechanisms in case of non-compliance and institutional sanctions for non-compliance (Goldfanj
& Guardia, 2003).
Budget Guideline Law, as prescribed under FRL, 2000 is applicable to all three levels of
government and sets the rules and guidelines for budget preparation. According to FRL, the Budget
Guideline Law should fix a target for the primary surplus for the upcoming year and a reference
for the next two years. Primary surplus must be consistent with the debt caps fixed by a senate
resolution.
Brazil follows debt rule and expenditure rule. It covers general government and is statutory in
nature. In general Brazil’s FRL includes three types of fiscal rules (IMF, 2001). They are:
1. General targets and limits for selected fiscal indicators
2. Corrective institutional mechanisms in the case on non-compliance
3. Institutional sanctions for non-compliance
The FRL requires the preparation and dissemination of transparent fiscal reports. Presentation of
a fiscal policy annexure to the Government’s multi-year plan with multi-year fiscal targets.
Presentation of a fiscal targets annex to the Annual Budget Guidelines law with targets for primary
balance and projections for revenue, expenditure, nominal balance and the public debt for the
following three years. It should also require to include an annexure describing fiscal risks with an
assessment of contingent fiscal liabilities (IMF, 2001).

16
On the Revenues, the FRA mandates the withholding of discretionary federal transfers to States
and municipalities that do not collect effectively their own taxes.
On Expenditure, it requires that permanent spending mandates not to be created without
corresponding increases in permanent revenues or cuts in other permanent spending items and
bans new spending commitments that cannot be extended before the end of the incumbent’s terms
in office, as well as the recording of these as unspent commitments in the two quarters prior to end
incumbents’ terms in office, unless there are sufficient cash balances to cover them at end of fiscal
year. It also prohibits credit or rescheduling operations among the various levels of Government
to avoid the risk of intragovernmental bailouts (IMF, 2001).
Goldfanj & Guardia, 2000 notes that FRL, 2000 is based on two fundamental issues. The design
of a new fiscal federalism, aiming at maintaining fiscal discipline at subnational level and
prohibiting future bailouts. The maintenance of public sector solvency through the definition of a
legal target for the primary surplus consistent with debt sustainability.
Major rules prescribed under FRL are as follows (Bova et al, 2015 & Goldfanj & Guardia, 2000):
1. Personnel expenditure is limited to 50% of net current revenue for the federal Government
and 60% for States & municipalities.
2. Permanent spending mandates cannot be created without permanent revenue increase or
spending cuts.
3. Senate sets debt limits for all levels of Government. However, there was never an
agreement reached on the limit for Central Government; thus the only limits currently in
place are for States & municipalities.
4. The Government sets numerical multiyear targets for the budget balance (for the current
year & indicative targets for next two years), expenditure & debt.
5. The case on non-compliance, corrective measures need to be taken and can result in
sanctions (the fiscal crimes law details penalties for mismanagement ranging from fines to
loss of job)
6. Escape clauses exist for exceptional economic conditions and natural disaster but can only
be invoked with congressional approval.
7. There is also the ‘golden rule’ principle set in the Constitution (new borrowings should be
at must equal to public investment).
17
8. Public finance institutions at all levels of government are not allowed to lend to their main
shareholders.
9. Spending commitments that exceed one budgetary period during the last year of a political
term of office are prohibited.
10. Tax benefits should be included in the annual budget together with the instruments to offset
their impact on the budget for two consecutive years.
11. Changes in monetary or exchange rate policy affecting fiscal performance will trigger an
extension in time limit for debt adjustment.
12. Sanctions for misbehavior range from withholding federal voluntary transfers to denial of
credit guarantees or banning of new debt.
13. Personal responsibility applies to all public officials. A fiscal crime law details penalties
for mismanagement, ranging from fines to loss of job and ineligibility for public office for
a maximum of 5 years, to imprisonment.
FRL also enshrines fiscal transparency as a key component of new framework. Proposals, laws
and accounts are to be widely distributed. FRL also requires all levels of Governments to publish
a quarterly fiscal management report that contains the major fiscal variables and indicates
compliance with fiscal targets.
One of the distinguished and unusual feature of Brazil’s FRL is ‘Fiscal Crime Law’. It is a
companion law to FRL which specifies criminal penalties like fines and even jail for officials who
violate the rules. The fiscal crime law applies to public officials of all branches of government at
all levels. Among other provisions, the fiscal crime law provides for detention of up to four years
for a public official who engages in credit operations without prior legislative authorization, incurs
unauthorized expenditure commitments (including any in the last two quarters in office that cannot
be repaid during the present term of office), extends loan guarantees without collateral of equal or
higher value, increases personnel expenditures during the final 180 days of the term of office, or
issues unregistered public debt (Liu & Webb, 2011). An example of this nature in recent past is
impeachment of Dilma Rousseff, former President, Brazil. Leahy (2016) claims that contrary to
popular perception, Ms. Rousseff was on trial not for a vast corruption scandal at Petrobras, the
state-run oil company she once led, or for the country’s terrible economy, which shrunk by 3.8 per
cent in 2015. Instead, she was under scrutiny over arcane fiscal maneuvers her government

18
allegedly used to pump up the economy and disguise a deficit in the public accounts. This creative
accounting, known as “pedaladas” Portuguese for pedalling has allegedly helped her to win the
2014 elections by disguising the true state of the economy.
With the FRL in place, Brazil could achieve better economic growth, reduced fiscal deficits and
debt. However, year 2009, 2014 and 2015 are the exceptions to the trend of healthy fiscal behavior.
India:
Indian economy was under severe economic imbalance in terms of low economic growth, high
inflation, worsening balance of payments and escalating fiscal deficits. Government of India
initiated economic reforms in 1991 by opening up of the economy for private investments and
significant structural changes in the economy has been taken place. Despite many reforms, fiscal
deficits were at very high level. Political inconsistency, pay revision, military spending due to
Kargila War in 2000 etc lead to higher fiscal deficits both for Central and State Governments in
late 90s and also in early 2000.
A high level committee to frame ‘Fiscal Responsibility Legislation’ was set up by the then Finance
Minister, GoI, under the chairmanship of Dr. E A S Sarma, then Secretary, Economic Affairs
Department. The Committee submitted its report to the Finance Minister on 4th July 2000. The
Committee observed that the wide spread deterioration in the fiscal position with its associated
impact on fiscal sustainability, macroeconomic vulnerability and economic growth has led to an
emerging consensus about the urgent need for imposing statutory ceiling on Central Government’s
borrowings, debt and deficits. Thus, after several years of deliberations, the Government of India
introduced rule based fiscal mechanism called the Fiscal Responsibility and Budget Management
Bill in December 2000. After series of discussions FRBM Act was passed in the year 2003 and
implemented from the year 2004.
FRBM Act, 2003 prescribes the following:
1. Central Government shall lay in each financial year before both the Houses of Parliament
the following statements of fiscal policy:
a. The Medium Term Fiscal Policy Statement
b. The Fiscal Policy Strategy Statement
c. The Macroeconomic framework Statement

19
2. Medium term fiscal policy statement shall set forth three-year rolling targets for prescribed
fiscal indicators namely fiscal deficit, revenue deficit and liabilities. The statement shall
include assessment of sustainability relating to balance between revenue receipts and
revenue expenditure and the use of capital receipts including market borrowings for
generating productive assets.
3. Fiscal Policy strategy statement shall include policies of Central Government for ensuing
financial year relating to taxation, expenditure, market borrowings and other liabilities,
lending and investments, pricing of administered goods and services etc. Strategic priorities
for ensuing year, rationale for any major deviation from key fiscal measures pertaining to
taxation, subsidies, administered pricing and subsidies.
4. Macroeconomic policy statement shall contain an assessment of GDP growth, fiscal
balance of Union Government as reflected in revenue balance and gross fiscal balance and
external sector balance as reflected in current account balance of the balance of payments.
5. Reduce fiscal deficit to be 3% of GDP and revenue deficit to be nil by 31st March 2008 and
build revenue surplus thereafter. The target date was postponed later to 31st March 2009.
6. Central Government should specify annual targets for assuming contingent liabilities in the
form of guarantees and the total liabilities as % of GDP.
7. Central Government shall not borrow from Reserve Bank of India except by way of
advances to temporarily meet cash imbalances.
8. Central Government should take measure to ensure greater transparency in fiscal
operations and minimize secrecy.
9. Deficit target may exceed in exceptional cases like on the grounds of natural calamity,
national security and other cases as may specified by the Central Government.
Following the Central Government, many state governments enacted fiscal responsibility laws.
Karnataka was the first state to enact fiscal responsibility act, even before the Central Government.
There are few schemes which incentivized and also obliged the state governments to enact fiscal
responsibility legislations. They are:
1. Fiscal Reforms Facility: Pursuant to the recommendations of the Eleventh Finance
Commission, Government of India created a Fiscal Reforms Facility (FRF) for
incentivizing the states to undertake Medium Term Fiscal Reforms Program (MTFRP) for

20
fiscal consolidation. The state governments were asked to draw up MTFRP incorporating
time-bound action points on fiscal objectives and reforms, power sector reforms, public
sector restructuring and budgetary reforms. FRF envisaged that if the state on an average
achieves a five percentage point reduction in revenue deficit as percentage of revenue
receipts consistently each year, by the year 2005-06 the sector as whole would come into
revenue balance. An incentive fund was created and release of it was based on single
monitorable fiscal objective as mentioned above.
2. Debt Swap Scheme: Government of India formulated a Debt Swap Scheme (DSS) realizing
the mounting burden of interest payments on the states and supplement their effort towards
fiscal management. The scheme was in operation from 2003-03 to 2004-05. The scheme
capitalized on the current low interest regime, to enable states to prepay expensive loans
contracted from Government of India, with low coupon bearing small savings and open
market loans. This scheme covered outstanding high cost loans with interest rate of 13%
and above.
3. Debt Consolidation and Relief Facility: The general debt relief with reschedule and lower
interest rate shall be available to States with effect from the year they enact FRBM
legislation which shall contain some core elements as recommended by Twelfth Finance
Commission. The Twelfth Finance Commission has also framed a scheme of debt waiver
based on fiscal performance linked to the reduction of revenue deficit and control of fiscal
deficit of the states. The quantum of debt write-off of the repayment was linked to absolute
amount by which the revenue deficit has reduced in each successive years during the award
period. If the revenue deficit brought down to zero, the entire repayment during the award
period of Twelfth Finance Commission will be written off.
All these measures by the Central Government incentivized the state governments to enact the
fiscal responsibility laws. Combined fiscal deficit of center and state government (general
government fiscal balance) got reduced from as high as 9% of GDP in early 2000s to around 4%
of GDP in 2007-08. There was a pause to FRBM roadmap after the 2008 financial crisis and it
resumed after few years. Presently, Central Government has a target to bring back fiscal deficit to
less than or equal to 3% of GDP by end of March 2018. 14th Finance Commission has incentivized
the states’ fiscal efforts by providing a flexibility in fiscal deficit target by 0.5% of GSDP if state’s

21
debt to GSDP ratio is below 25% and interest payments to revenue receipts ratio is below 10% in
the preceding year.
China:
China is one of the fastest growing nations in the world. As elaborated in Chapter-1, China’s
economic growth and per-capita income has grown tremendously in last two and half decade.
China is also forefront in balancing fiscal indicators. It has very low fiscal deficits and debt when
compared to many developed nations and also amongst the BRICS economies. China has not
formally enacted any Fiscal Rule. However, there are several developments which contributed to
better fiscal situation of China and in recent years Chinese Government have taken a step towards
fiscal responsibility.
Constitution of China mentions three levels of administrative structure namely provincial, county
and townships. However broad classification specifies five levels of administrative structure and
they are as follows:
1. Provincial level: It includes provinces, autonomous regions, municipalities and special
administrative regions.
2. Prefectural level: It consist prefectural level cities, autonomous prefectures and leagues.
3. County level: It includes counties, districts and autonomous counties.
4. Township level: it includes towns, townships, sub districts etc.
5. Village level
Hou (2016) explains China’s fiscal reforms under three stages. First stage is from 1979 to 1993.
Second stage is from 1994 to 2008 and third stage starts after 2008. In the first stage there were
structural readjustments taken place to promote growth and development. The reform was to
decentralize revenue and outlays from center to provinces. Another important reform was to
relieve individuals from grip of the state so that laborers could make their own living and can work
hard with their skills. In urban areas, the reforms gave rise to family businesses and in rural areas

22
farmers grew crops they wanted. But these reforms resulted in serious problems. Revenues for the
government started shrinking and reform also caused income disparities and regional disparities.
Second stage was innovation towards new fiscal system. In the second stage, policy innovations
were introduced to build a new fiscal system in accord with the generic principles of public finance,
thereby solving the problems that occurred in the first stage. The goal of the new fiscal structure
was to finance the opportunity for equal access to basic public services for every citizen regardless
of their location of residence or type of household registration (Hou, 2016). A separate central
versus local tax system was introduced. Centre collected a larger share of taxes including value
added tax and personal income tax. Remaining taxes were distributed among the provinces and
local governments. New fiscal transfers system particularly for basic services has been introduced.
In the initial stage, this system has demonstrated substantial impact on transfers related to
education, public health, social security etc.
However, this system created serious problem more than what has been faced in the first stage.
Tax revenue was heavy at center but responsibilities are more for the local governments. Revenue
and responsibilities did not match between different levels of government. Hou (2016) further adds
that local officials are incentivized to fulfil all tasks set by their superior levels, because they are
appointed by their bosses – thus “career considerations have driven most top local officials to
resort to informal, even illegal means of financing for infrastructure and development, including
selling the use right of state land for cash and borrowing huge sums via local financing vehicles”.
The hidden borrowing, has piled up long-term liabilities that in some cases are multiple times over
annual local revenue.
There are two additional reforms took place in the second stage and they are: framing of Budget
Law of China in 1995 and 1999 Budget Reforms. Budget Law of 1995 forbids sub-national
governments from borrowing in financial markets without approval of State Council. However
this measure, as mentioned earlier lead to more off-budget borrowings. Liu (2010) argue that the
off-budget borrowings has supported large-scale urban infrastructure in China. He further adds
that the off-budget financing has not only expanded the financial resources, but also facilitated the
development of competitive land and housing markets.
The 1999 Budget Reform consists of three components. They are:
a. Departmental Budget Reform: As per this reform, budget will be compiled on a
departmental basis. The government budget was previously divided along functional lines,

23
such as education and agricultural sectors etc. A number of government departments
performing similar functions formed an appropriation cohort; budget compilation was
based on the needs of this cohort rather than individual departments. Under the new
arrangement, the budget is organized on a departmental basis whereby individual
government departments submit their budget requests in the form of a simple table to the
budget agency (Wu, 2014). The budget agency will decide upon the request. It was
expected that budgeting on a departmental basis can improve the “accountability within
the bureaucracy” and enhance allocative and operational efficiency in public finance. Zero
based budgeting was incorporated in place of incremental budgeting. This reform was also
aimed at reducing non-budgetary financing.
b. Treasury Management Reform: only a single treasury account system is allowed to operate
at each level of governments. Individual department cannot hide their revenues and
expenditures from the budget agency.
c. Government Procurement Reform: Aiming at corruption control and increasing operational
efficiency, a centralized procurement system was introduced.
Third stage of China’s reforms is towards achieving efficiency and accountability. New Budget
Law of China was passed in 2014 and became effective on 2015. The 2015 Budget Law of China
revised old law in five major areas and they are:
1. Transparency: 2015 Budget Law stipulates the government that all revenues and outlays
must be included in the government budget. The official report and account schedules on
all the budgeted items, adjustments, final approved amounts and details on implementation
of budget, arrangements for transfers and debt use should be made public by Finance
Ministry within 20 days of approval of People’s Congress (Hou, 2016).
2. Budget Stabilization Fund: In boom years when current revenue exceeds the budget, extra
amount should be placed in the stabilization fund. It is applicable to all levels of
government.
3. Local Government Debt: Old law require local governments to achieve annual balance and
does not allow localities to incur any deficits. The new law allows the local governments
to borrow by imposing following restrictions:
a. Only provincial governments, with prior approval by the State Council, can incur debt.

24
b. Government debt can be used only for capital outlay that produces public
goods/services.
c. The amount of debt for each province should be submitted by the State Council to the
National People’s Congress or its Standing Committee for approval. Each province can
only borrow within the approved limit with the approval of the standing committee of
the provincial people’s congress.
d. The method of borrowing can be only via issuing local government bonds, not any
other means or venues.
e. To control risk related to and rising from local government borrowing, any issue of
provincial government bonds should have a matching debt service plan and stable
source of revenue for debt retirement. The State Council shall set up a risk evaluation
and warning mechanism of local government debt, an emergency management
mechanism, and accountability system.
4. Central-Local Fiscal Transfers: Law intends to promote equalization between regions.
Transfers will consist of equalization grants and special purpose transfers. Higher level of
Governments should notify the lower levels their estimates of transfers ahead of local
governments’ budget preparation. All the local governments should include these estimates
in their budget.
5. Hard Budget Constraint: Governments should not seek any revenue reduction policies or
measures in middle of the fiscal year.
Chinese Government has announced adoption of Medium Term Fiscal Plan (MTFP). The MTFP
should consists of:
a. Forecasts of major economic indicators and socio-economic status in the next three years
considering domestic and international economic scenario. Based on economic forecasts,
estimates of the mid-term revenues and outlays in accord with current macroeconomic
policies should be presented in the document.
b. Analyze the issues with existing policies on revenue sources and outlay priorities
c. Compose reform plans on revenue and outlay: (1) Regarding revenues, the Ministry of
Finance shall consult with the Tax, Customs, and Development Ministries to propose
routes and timelines for tax reform, major revenue adjustments, regulation of fees/charges,
25
with clear policy goals and implementation schedule. These ministries should also evaluate
the impact of the proposed policies on the economy, related industries, and tax burden of
individuals. (2) Regarding outlays, the Ministry of Finance shall consult relevant agencies
to outline major reforms within the MTFP period, policies and projects of outlays, specify
policy goals, list annual tasks and deadlines, with clarifications on performance measures.
(3) Regarding governmental debt, the Ministry of Finance shall, based on revenue and
outlay and debt risk forecasts, determine appropriate scope of deficits and debt limits as
risk control target. Classify debts and place them into the budget. Establish debt risk
warning and emergency management mechanisms.
d. Estimate revenues and outlays in the next three years after implementing the proposed
reforms, and conduct overall balance.
China has lowest fiscal deficits among the BRICS economies as on 2015. Even the debt level is
less, amounting 40% of GDP in 2015.
South Africa:
Fiscal reforms in independent South Africa has been articulated through two most important
macroeconomic programs namely the Reconstruction and Development Program (RDP) in 1994
and the Growth, Employment And Redistribution (GEAR) strategy in 1996. The fiscal reform was
consistent over time covering three broad areas that are: budget and financial management reform,
creation of the intergovernmental fiscal system and tax policy and administration reforms (Ajam
& Aron, 2007). These initiatives was supported by Public Finance Management Act of 1999. This
Act formally established the ‘National Treasury’ by amalgamating the former Departments of
Finance and State Expenditure. This Act emphasized regular financial reporting, sound internal
expenditure controls, independent audit and supervision of control systems, improved accounting
standards and training of financial managers and greater emphasis on outputs and performance
monitoring.
Budget and Financial Management Reforms: Fiscal data need to be regularly published in the
Budget Review and Intergovernmental Fiscal Reviews. The Medium Term Budget Policy
Statement (MTBPS) was introduced in 1997 and is being regularly published every year. The
MTBPS is a government policy document that communicates the Parliament and the country the

26
economic context in which the forthcoming budget will be presented along with fiscal policy
objectives and spending priorities over the three year expenditure period. It need to be tabled at
least three months before the national budget is presented (SAG, 2016). MTBPS should include
the following:
1. A revised fiscal framework for the current financial year and the proposed fiscal framework
for the next three years.
2. An explanation of the macroeconomic and fiscal policy position and macroeconomic
projections and assumptions underpinning the fiscal framework.
3. Spending priorities of the government for next three years.
4. Proposed division of revenue between national, provincial and local governments.
5. A review of spending by each national department and each provincial government
between 1st April and 30th September of the current financial year.
A new budget and reporting formats was introduced in 2004, aligned with international Public
Sector Accounting Standards.
Intergovernmental Fiscal Relations: Creation of the Budget Council in 1996 is a landmark step to
strengthen intergovernmental fiscal relations. Other important steps were establishing formula
based revenue sharing based on recommendations of Financial and Fiscal Commission and
promulgation of Intergovernmental Fiscal Relations Act, 1997 which introduced predictability and
transparency into the intergovernmental budget process (Ajam & Arom, 2007).
Tax Policy and Administration Reforms: It has greatly contributed to broadening the tax base and
enhancing the revenue collection efficiency. An autonomous revenue service known as South
African Revenue Service (SARS), combining Inland Revenue and Customs and Excise
Department was created (Ajam & Arom, 2007). It raised audit capacity through introduction of
computerized systems, enhanced capacity to investigate and prosecute tax evaders and improved
debt recovery procedures.
The South African Government has not formally enacted legislative constraints on fiscal variables.
In mid and late 90s, authorities have maintained tight fiscal position, despite political pressure.
However, in 1994 South African Government announced a targeted reduction in budget deficit to
2.5% of GDP over five years, cuts in non-interest expenditure and constant revenue of 25% as a

27
share of GDP. Introduction of GEAR, SARS and framing of Public Finance Management Act in
1999 have together contributed to reduction in fiscal deficit to as low as 1.1% of GDP in 2002-03
(Ajam & Arom, 2007). Expenditure cuts continued to focus on the wage bill, with cuts in civil
service employment.
These reforms also had several negative impact on fiscal sharing. Revenue rising power in South
Africa is highly centralized in nature, whereas provincial governments have higher spending
responsibilities. This resulted in vertical imbalance. The provincial governments face significant
expenditure mandates and have restricted own financial resources. After deducting interest
obligations and statutory payments from total revenue collected, the balance will be equitably split
up among the three spheres of government (Ajam & Arom, 2007).
South Africa’s fiscal balance is at favorable position. Its primary deficit is lowest among the
BRICS economies. Its debt was less than 40% of GDP between 2000 and 2008. There is an
increase in the debt and fiscal imbalance after the 2008 financial crisis. Despite not having any
legislated numerical fiscal rule South Africa’s fiscal situation is well under control.
Russia:
Russia is an oil rich nation. Its budget, exports and structure of the economy is highly dependent
on the oil and gas sector. Since late 90s to 2007, Russia enjoyed prudent fiscal balance with
surpluses, declining debt and rising reserves accumulated in the Stabilization Fund. Russia in the
same period, introduced many fiscal management innovations like treasury management of the
budget, a Medium Term Fiscal Framework (three year targets), oil revenue management fund etc.
the oil stabilization fund was split into the Reserve Fund and a National Welfare Fund which will
accumulate oil revenues beyond the Reserve Fund maximum of 10% of GDP (Bogetic et al, 2010).
Oil revenue as percent to general government revenue has increased from less than 10% in 1997
to more than 30% in 2007.
The Balance Budget Rule was framed in 2007-08. Russia’s legal fiscal framework relies mainly
on non-oil balance as a key fiscal indicator. The budget included non-oil fiscal deficit target of
4.7% of GDP. This was suspended in April 2009 as a result of 2008 financial crisis and formally
abolished in 2011 (Bova et al, 2015).
28
Since 2013, Russian Government is following the Expenditure Rule. Russian Parliament adopted
a new-oil price based fiscal rule in December 2012. The rule sets a ceiling on expenditures. Oil
revenues above the ‘base’ oil price need to be saved in the Reserve Fund until it reaches 7% of
GDP. Once the Reserve Fund reaches the threshold, at least half of the oil revenues should go to
National Wealth Fund and remaining revenues would be channeled to the budget to finance
infrastructure and other priority projects. This rule uses a five year backward looking average of
oil prices as a base, which will be gradually increased to 10 years by 2018 in order to avoid abruptly
moving to a very low base oil price (Bova et al, 2015).
The multiyear framework was suspended in 2015. The Government aims to resume it in 2017
budget. To adjust to the new reality of lower oil prices, Russian Government is considering a broad
range of fiscal consolidation measures including pension reform, improving capital budgeting,
cutting subsidies and improving tax collections (IMF, 2016). The IMF country report-16/229 says
that Government is considering to reintroduce the fiscal rule once the fiscal adjustment is
completed based on fixed oil price of US$40 or US$50 per barrel depending on the authorities
assessment of long-term average oil prices to smooth the impact of oil price cycles on public
finances, domestic demand and real exchange rate. The IMF country report also noted that a more
flexible oil price rule, which sets an oil benchmark that incorporates future oil prices in its
calculation. This would help to avoid suspending the fiscal rule when faced with pressures of
drastic oil price fluctuations (IMF, 2016).
Fiscal Rules in BRICS Economies: A comparison
India, Brazil and Russia follow legislated numerical fiscal rules. In India, targets are fixed on fiscal
and revenue deficits and liabilities. In Brazil, ceilings have been imposed on the expenditures,
particularly the personnel expenditure. Non-oil fiscal balance is the target fiscal variable in Russia.
Brazilian Fiscal Responsibility Law applies to the general government. Brazil’s FRL is peculiar in
several aspects like fiscal crimes law. In India, Center and State Governments have separate FRLs.
The FRLs in Brazil and India has significantly contributed in reducing deficits and debt. The fiscal
rules in India and Brazil are based on ‘Golden Rule’ which suggests to use the borrowings only
for capital formation.
China and South Africa do not follow any numerical fiscal rules and instead they follow procedural
rules. In recent years Chinese Government is stressing the transparency aspect of fiscal rule (which

29
already exists among other BRICS economies). The Budget and Financial Management reforms
have helped to strengthen the South Africa’s fiscal condition. All the BRICS nations presents and
also follows Medium Term Fiscal Plans.
Chapter-4
Conclusion
Brazil, Russia, India, China and South Africa (BRICS) are grouped as emerging economies and
these countries are fastest growing in the world. There was tremendous improvements in output
growth and per capita income growth for these nations over the last two decades. The recent 2008
financial crisis adversely affected many economies in the world and the BRICS countries are not
an exception.
This study has analyzed and compared the developments in fiscal policies/indicators for last two
decades and in particular, post crisis period comprehensively. It was found that favourable fiscal
balances (surpluses and smaller deficits) has turned out to be huge deficits after the 2008 crisis.
Consequently the debt level started peaking up. India has highest fiscal deficits and debt and also
lowest revenues and expenditure as proportion to GDP amongst the BRICS economies. There
should be efforts by Indian Government to rise the revenue-GDP ratio. The expected rollout of
Goods and Service Tax in July 2016 may help in raising the revenue ratio in the coming years.
China has the least deficits and debt when compared to other BRICS nations. In 2014-15, due to
global economic slowdown there was a crisis again in the fiscal balance of Brazil and Russia. The
Russian economy is highly dependent on oil for revenue as well as exports. The oil price
fluctuations determine Russia’s fiscal balances. It was also found that vertical fiscal imbalance is
a major problem for China and South Africa, as the Center has more revenue raising powers
whereas lower level of governments have higher spending responsibilities.
Fiscal rules have played very important role in keeping fiscal variables under control. Amongst
the BRICS, Brazil is the first country to enact a Fiscal Responsibility Legislation in the year 2000.
This rule applies to all levels of government. Brazil’s Fiscal Responsibility Law (FRL) is very
strict and it even specifies penalties and sometimes imprisonment for mismanagement of
government funds.
30
India enacted FRBM Act in 2003 and at subnational level, State Governments have enacted their
own FRLs. Framing of FRLs at subnational level was incentivized and promoted by the Central
Government through several schemes like Debt Swap Scheme, Fiscal Reform Facility and Debt
Consolidation & Relief Facility. With the help of FRLs and favourable economic condition both
Centre and State Governments in India could reduce their deficits below threshold of 3% of GDP.
The State Governments efforts in reducing fiscal deficits are remarkable.
Russian Government has framed Balanced Budget Rule (BBR) in 2007-08. Government has
adopted non-oil fiscal balance as target fiscal indicator. However BBR was removed in 2012 owing
to 2008 financial crisis. Since 2013 Russian Government is following ‘Expenditure Rule’. South
Africa and China do not follow any legislated budget constraints. However, Medium Term Fiscal
Plan was adopted by both the nations. In recent episodes, Chinese Government is stressing on the
fiscal transparency aspect.
Overall, this study finds that fiscal position of BRICS nation was in good shape before 2008 crisis.
Aftermath the crisis, these indicators turned out to be negative. China’s fiscal performance even
in crisis period was remarkable. Numerical fiscal rules has worked to an extent for Brazil and
India. All the BRICS nations presently emphasizes on procedural rules and fiscal transparency
implying their path towards sustainable fiscal balance.

31
Bibliography:
Ajam, T., & Janine, A. (2007). Fiscal Renaissance in a Democratic South Africa. Journal of
African Economies, 16(5), 745-781.
Aslund, A. (1999). Why has Russia's Economic Transformation been so Arduous. Annual World
Bank Conference on Development Economics, Washington D C. Washington D C: The
World Bank. Retrieved March 30, 2017, from
http://siteresources.worldbank.org/DEC/Resources/84797-1251813753820/6415739-
1251814010799/aslund.pdf
Bogetic, Z., Smits, K., Bubina, N., & Wijnbergen, S. V. (2010). Long Term Fiscal Risks and
Sustainability in an Oil-rich Country- The Case of Russia. World Bank Policy Research
Working Paper-5240.
Bova, E., Kinda, T., Muthoora, P., & Toscani, F. (2015). Fiscal Rules at a Glance. Washington D
C: International Monetary Fund.
ECB. (2016). Economic Bulletin- Issue 1. Franfurt: European Central Bank.
GoI. (2009). Union Budget 2009-10 Budget Speech. New Delhi: Ministry of Finance, Government
of India.
GoI. (2012). The BRICS Report. New Delhi: Oxford University Press.
GoI. (2017, March 28). BRICS India 2016. Retrieved from brics2016.gov.in:
http://brics2016.gov.in/content/innerpage/about-usphp.php
Hou, Y. (2016, April 27). Interpreting China's Fiscal Reforms and the 13th Five year Plan Targets.
Retrieved from US-China Economic and Security Review Division:
https://www.uscc.gov/sites/default/files/Yilin%20Hou_Written%20Testimony%2004271
6.pdf
IMF. (2001). Brazil: Report on Observance of Standards and Codes (ROSC)- Fiscal Transparency
Module. Washington D C: International Monetary Fund.
IMF. (2016). Fiscal Monitor: Acting Now, Acting Together. Washington D C: International
Monetary Fund.
IMF. (2016). Russian Federation- IMF Country Report- 16/229. Washington D C: International
Monetary Fund.
Liu, L. (2010). Strengthening Subnational Debt Financing and Managing Risks. Beijing: Review
of Economic Research, Ministry of Finance, Government of China.

32
Liu, L., & Webb, S. B. (2011). Laws for Fiscal Responsibility for Subnational Discipline-
International Experience. World Bank Policy Research Working Paper-5587.
MGI. (2015). Debt and (not much) Deleveraging. McKinsey Global Institute.
Morrison, W. M. (2015). China's Economic Rise: History, Trends, Challenges and Implications
for UNited States. Washington D C: Congressional Research Service. Retrieved March 31,
2017, from https://fas.org/sgp/crs/row/RL33534.pdf
NDB. (2017, March 28). New Development Bank. Retrieved from ndb.int: http://ndb.int/
Neill, J. O. (2001). Building Better Global Economic BRICs. Global Economics Paper- 66.
Nobleprize.org. (2017, March 28). Nobleprize.org. Retrieved from http://www.nobelprize.org/:
http://www.nobelprize.org/nobel_prizes/economic-sciences/laureates/1971/kuznets-
lecture.html
Pandey, S. C. (2003). Fiscal Responsibility and Budget Management Act 2003: An Overview.
Retrieved from www.ipaiindia.org/files/08-cs%20pandey.pdf
Rao, M. G. (2009). The Fiscal Situation and a Reform Agenda for the New Government. Economic
& Political Weekly, 44(25), 77-85.
SAG. (2016). Medium Term Budget Policy Statement 2016. National Treasury, Republic of South
Africa.
Schaechter, A., Kinda, T., Nina, B., & Weba, A. (2012). Fiscal Rules in Response to the Crisis-
Toward the "Next Generation" Rules. A New Dataset. IMF Working Paper- 187.
Wakatabe, M. (2015, January 18). Japan's Fiscal Situation is not as bad as many assume. Forbes
Asia.
Webb, S. B. (2004). Fiscal Responsibility Law for Subnational Discipline: the Latin American
Experience. Worl Bank Policy Research Working Paper-3309.
WorldBank. (2017). World Developmwnt Indicators. Washington D C: The World Bank.
Wu, A. M. (2014). Searching for Fiscal Responsibility: A Critical Review of the Budget Reform
in China. China: An International Journal, 12(1), 87-107.
Zhang, W. (2012). China's anti-crisis macro economic management. In J. H. Chung, China's Crisis
Management (pp. 1-24). New York: Routledge.