Embed Size (px)
Citation preview


Reassessment of Trial Court Capital-Outlay Projects
APPROVED BY JUDICIAL COUNCIL ON:
NOVEMBER 14, 2019
IN RESPONSE TO SENATE BILL 847
(COMMITTEE ON BUDGET AND FISCAL REVIEW; STATS. 2018, CH. 45, § 8):
GOVERNMENT CODE SECTION 70371.9

1
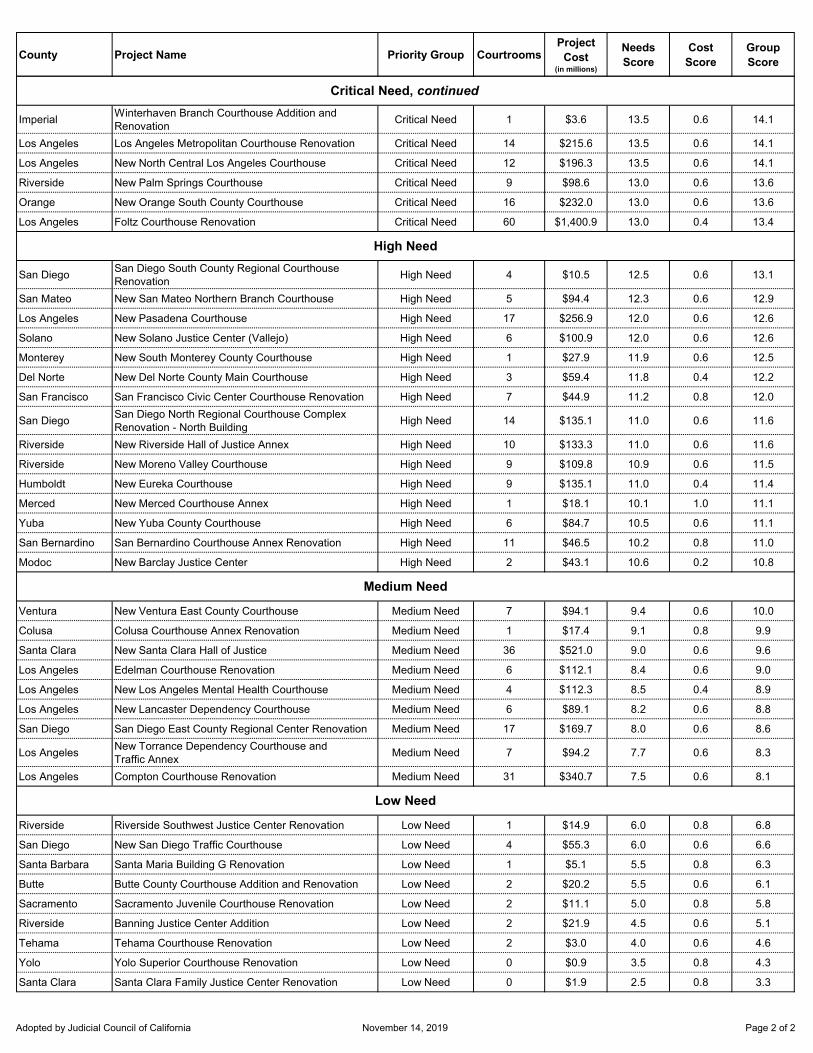
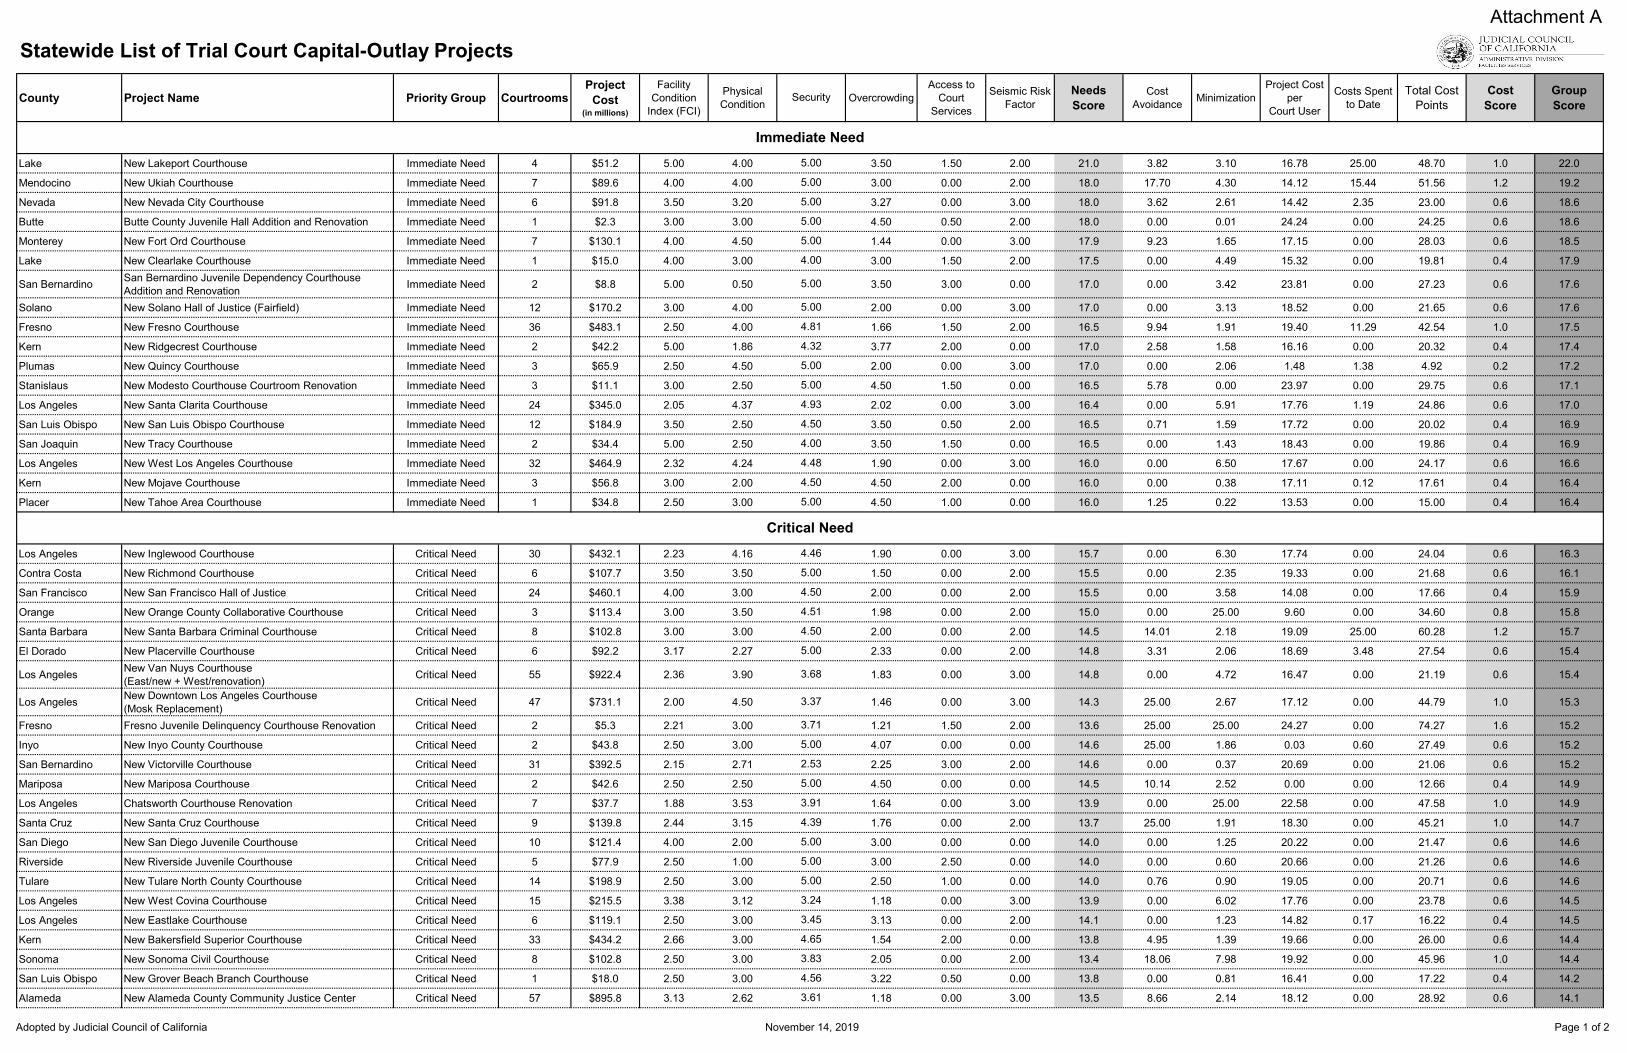
Executive Summary Government Code section 70371.9 (see Appendix A of Attachment B) requires the Judicial Council to conduct a reassessment of all trial court capital-outlay projects that had not been fully funded up to and through the 2018 Budget Act (FY 2018–19) and to submit the report by December 31, 2019, to two legislative committees: the Senate Committee on Budget and Fiscal Review and the Assembly Committee on Budget. This Reassessment of Trial Court Capital-Outlay Projects, including the Statewide List of Trial Court Capital Projects (see Attachment A) prioritized on needs-based/cost-based scores from the application of the Judicial Council’s Revision of Prioritization Methodology for Trial Court Capital-Outlay Projects (see Attachment B), satisfies the requirements of this mandate.
Process The reassessment of the Judicial Council’s trial court capital-outlay projects can be summarized by five main endeavors:
1. Revision of the prioritization methodology consistent with Government Code section 70371.9;
2. Assessment of facilities occupied by trial courts, including physical condition assessments, as well as assessments related to security, access to court services, and overcrowding;
3. Development of court facility plans1 and court needs-based projects;
4. Application of the prioritization methodology to all projects; and
5. Development of a statewide list of prioritized projects.
Revision of Prioritization Methodology The revised methodology involved a two-step process:2
• Step 1 identified (1) the general physical condition of the buildings; (2) needed improvement to the physical condition of buildings to alleviate the totality of risks associated with seismic conditions, fire and life safety conditions, Americans with Disabilities Act requirements, and environmental hazards; (3) court security features within buildings; (4) access to court services; (5) overcrowding; and (6) capital-outlay projects that replace or renovate courtrooms in court buildings where there is a risk to court users due to potential catastrophic events.
• Step 2 involved applying the needs-based criteria and cost-based criteria to rank projects within the priority groups.
In the most essential terms, the revised methodology can be described as:
• Needs-based criteria = Priority Group • Needs-based and cost-based criteria = Rank within Priority Group
1 The planning process began with the development of court facility plans—one for each of the 58 trial courts. Each plan was developed through a collaborative process between the court and the Judicial Council planning team, involving 35 planners working statewide and managed by the council’s Facilities Services staff. The development of these plans involved the assessment of how each court intends to operate its facilities for providing service to the public as well as the identification of any additional facility needs or deficiencies, in addition to an asset management evaluation. Each plan articulates the optimum use of each court’s facilities and identifies how operational needs were translated into the appropriate type of facility project, including but not limited to capital-outlay projects. 2 For more detailed information, see the report titled, Court Facilities: Reassessment of Trial Court Capital-Outlay Projects (Nov. 5, 2019), item 19-129 of Nov. 14, 2019 Judicial Council meeting, available at https://jcc.legistar.com/View.ashx?M=F&ID=7862663&GUID=C63B6E8E-6A8D-476C-BF8F-634132CB381F.

2
New criteria Government Code section 70371.9(b) required the use of existing criteria along with the new criteria for reassessing and ranking capital-outlay projects, which necessitated the revision of the Judicial Council’s current prioritization methodology, dated October 24, 2008. In addition to applying the current methodology’s needs-based criteria of Security, Overcrowding, and Access to Court Services, new criteria applied include the following:
• New subcategories, Seismic Rating and Environmental Hazards, which were added to the current subcategories of Fire and Life Safety and Americans with Disabilities Act under the Physical Condition criterion;
• A Facility Condition Index as part of needs-based scoring;
• A Seismic Risk Factor, to receive additional consideration as part of needs-based scoring. Specifically, additional points would be assigned to projects proposed to replace or renovate courtrooms in existing High Risk or Very High Risk buildings;
• Cost-based criteria as follows: cost avoidance or savings realized through operational or organizational efficiencies; minimization of increases in ongoing security, operations, and maintenance costs; cost of project per court user; and total costs spent on a project as of the date of the reassessment (which for accounting purposes is March 31, 2019); and
• A comparison of the costs to repair/renovate existing facilities versus replacement, which was not scored within the cost-based evaluation. Instead, this comparison has been addressed in the court facility plans and reflected in the attached statewide list of projects by proposed project type (e.g., new construction versus renovation).
Statewide List of Capital-Outlay Projects The Statewide List of Trial Court Capital-Outlay Projects has been developed from the application of the revised prioritization methodology to the projects identified by the court facility plans. As defined in the methodology, trial court capital-outlay projects are considered those that increase a facility’s gross area, such as a building addition; that substantially renovate a major portion of a facility; that comprise a new facility or an acquisition; or that change the use of a facility, such as the conversion from non-court use to court use. Details of the list are as follows:
• A total of 80 projects for 41 of the 58 trial courts.
• All 80 projects affect 165 of the total 457 facilities in the judicial branch’s real estate portfolio.
• Project distribution among need groups is 18 Immediate, 29 Critical, 15 High, 9 Medium, and 9 Low.
• The total cost of each need group is Immediate at $2.3 billion, Critical at $7.9 billion, High at $1.3 billion, Medium at $1.6 billion, and Low at $0.1 billion.
• Of the 80 projects, 56 are for new construction and 24 for renovation and/or addition.
• Total cost for the 56 new construction projects is estimated at $10.6 billion. Total cost for the 24 renovation and/or addition projects is estimated at $2.6 billion.
• The total cost of all 80 projects is estimated at $13.2 billion.

3
Project scoring Needs-based scores. Projects are scored based on need and placed into one of five priority groups, and a scale of 25 points is used for the total of all needs-based criteria, as follows:
Prioritized Groups of Trial Court Capital-Outlay Projects
Immediate Need: 16–25 points Critical Need: 13–15.9 points High Need: 10–12.9 points
Medium Need: 7.5–9.9 points Low Need: 0–7.4 points
Cost-based scores. Projects within each priority group shown above are ranked based on the scoring of the cost criteria described above. Needs-based scoring and the cost-based scoring are entirely separate from one another. When combined, needs-based and cost-based scores do not change the priority group a project is placed in, only the rank of the project within the priority group. Project type In the list, project names are based on type, which include new construction, additions to existing buildings, and renovations of existing facilities with major scopes as well as minor scopes, such as build-outs of available shelled space. Each type is defined by its needs-based and cost-based scores and total score within its priority group, as well as its number of courtrooms and estimated total cost. Estimated project sizes Once project scopes were defined, square footage for new construction projects was estimated using a parametric model developed from the last 19 completed trial court capital-outlay projects. Square footage for projects involving renovation or an addition or both was estimated based on projects’ scopes and available space within existing buildings and/or on existing sites. Estimated project costs The estimated project costs presented in the list were derived from a project budgeting model. The primary components of this model—which include costs for hard construction; soft costs; furniture, fixtures, and equipment; project contingency; and land—are based on general and specific assumptions. This model does not include costs for phasing or swing space, which would be captured at the time actual cost estimates are prepared. The application of this model allowed for consistency in developing well-informed estimates for each project in the statewide list, but it does not replace a more detailed costing effort in the future, at the time the Judicial Council recommends individual capital-outlay projects to the California Department of Finance for consideration of funding through the state budget act process.
Attachments and Links 1. Attachment A: Statewide List of Trial Court Capital-Outlay Projects (Nov. 14, 2019), provided in
summary and detailed formats 2. Attachment B: Revision of Prioritization Methodology for Trial Court Capital-Outlay Projects
(Nov. 14, 2019)

County Project Name Priority Group CourtroomsProject
Cost (in millions)
Needs Score
Cost Score
Group Score
Lake New Lakeport Courthouse Immediate Need 4 $51.2 21.0 1.0 22.0
Mendocino New Ukiah Courthouse Immediate Need 7 $89.6 18.0 1.2 19.2
Nevada New Nevada City Courthouse Immediate Need 6 $91.8 18.0 0.6 18.6
Butte Butte County Juvenile Hall Addition and Renovation Immediate Need 1 $2.3 18.0 0.6 18.6
Monterey New Fort Ord Courthouse Immediate Need 7 $130.1 17.9 0.6 18.5
Lake New Clearlake Courthouse Immediate Need 1 $15.0 17.5 0.4 17.9
San Bernardino San Bernardino Juvenile Dependency Courthouse Addition and Renovation Immediate Need 2 $8.8 17.0 0.6 17.6
Solano New Solano Hall of Justice (Fairfield) Immediate Need 12 $170.2 17.0 0.6 17.6
Fresno New Fresno Courthouse Immediate Need 36 $483.1 16.5 1.0 17.5
Kern New Ridgecrest Courthouse Immediate Need 2 $42.2 17.0 0.4 17.4
Plumas New Quincy Courthouse Immediate Need 3 $65.9 17.0 0.2 17.2
Stanislaus New Modesto Courthouse Courtroom Renovation Immediate Need 3 $11.1 16.5 0.6 17.1
Los Angeles New Santa Clarita Courthouse Immediate Need 24 $345.0 16.4 0.6 17.0
San Luis Obispo New San Luis Obispo Courthouse Immediate Need 12 $184.9 16.5 0.4 16.9
San Joaquin New Tracy Courthouse Immediate Need 2 $34.4 16.5 0.4 16.9
Los Angeles New West Los Angeles Courthouse Immediate Need 32 $464.9 16.0 0.6 16.6
Kern New Mojave Courthouse Immediate Need 3 $56.8 16.0 0.4 16.4
Placer New Tahoe Area Courthouse Immediate Need 1 $34.8 16.0 0.4 16.4
Los Angeles New Inglewood Courthouse Critical Need 30 $432.1 15.7 0.6 16.3
Contra Costa New Richmond Courthouse Critical Need 6 $107.7 15.5 0.6 16.1
San Francisco New San Francisco Hall of Justice Critical Need 24 $460.1 15.5 0.4 15.9
Orange New Orange County Collaborative Courthouse Critical Need 3 $113.4 15.0 0.8 15.8
Santa Barbara New Santa Barbara Criminal Courthouse Critical Need 8 $102.8 14.5 1.2 15.7
El Dorado New Placerville Courthouse Critical Need 6 $92.2 14.8 0.6 15.4
Los Angeles New Van Nuys Courthouse (East/new + West/renovation) Critical Need 55 $922.4 14.8 0.6 15.4
Los Angeles New Downtown Los Angeles Courthouse (Mosk Replacement) Critical Need 47 $731.1 14.3 1.0 15.3
Fresno Fresno Juvenile Delinquency Courthouse Renovation Critical Need 2 $5.3 13.6 1.6 15.2
Inyo New Inyo County Courthouse Critical Need 2 $43.8 14.6 0.6 15.2
San Bernardino New Victorville Courthouse Critical Need 31 $392.5 14.6 0.6 15.2
Mariposa New Mariposa Courthouse Critical Need 2 $42.6 14.5 0.4 14.9
Los Angeles Chatsworth Courthouse Renovation Critical Need 7 $37.7 13.9 1.0 14.9
Santa Cruz New Santa Cruz Courthouse Critical Need 9 $139.8 13.7 1.0 14.7
San Diego New San Diego Juvenile Courthouse Critical Need 10 $121.4 14.0 0.6 14.6
Riverside New Riverside Juvenile Courthouse Critical Need 5 $77.9 14.0 0.6 14.6
Tulare New Tulare North County Courthouse Critical Need 14 $198.9 14.0 0.6 14.6
Los Angeles New West Covina Courthouse Critical Need 15 $215.5 13.9 0.6 14.5
Los Angeles New Eastlake Courthouse Critical Need 6 $119.1 14.1 0.4 14.5
Kern New Bakersfield Superior Courthouse Critical Need 33 $434.2 13.8 0.6 14.4
Sonoma New Sonoma Civil Courthouse Critical Need 8 $102.8 13.4 1.0 14.4
San Luis Obispo New Grover Beach Branch Courthouse Critical Need 1 $18.0 13.8 0.4 14.2
Alameda New Alameda County Community Justice Center Critical Need 57 $895.8 13.5 0.6 14.1
Critical Need
Statewide List of Trial Court Capital-Outlay ProjectsSummary Version
Immediate Need
Adopted by Judicial Council of California November 14, 2019 Page 1 of 2
Attachment A
County Project Name Priority Group CourtroomsProject
Cost (in millions)
Needs Score
Cost Score
Group Score
Imperial Winterhaven Branch Courthouse Addition and Renovation Critical Need 1 $3.6 13.5 0.6 14.1
Los Angeles Los Angeles Metropolitan Courthouse Renovation Critical Need 14 $215.6 13.5 0.6 14.1
Los Angeles New North Central Los Angeles Courthouse Critical Need 12 $196.3 13.5 0.6 14.1
Riverside New Palm Springs Courthouse Critical Need 9 $98.6 13.0 0.6 13.6
Orange New Orange South County Courthouse Critical Need 16 $232.0 13.0 0.6 13.6
Los Angeles Foltz Courthouse Renovation Critical Need 60 $1,400.9 13.0 0.4 13.4
San Diego San Diego South County Regional Courthouse Renovation High Need 4 $10.5 12.5 0.6 13.1
San Mateo New San Mateo Northern Branch Courthouse High Need 5 $94.4 12.3 0.6 12.9
Los Angeles New Pasadena Courthouse High Need 17 $256.9 12.0 0.6 12.6
Solano New Solano Justice Center (Vallejo) High Need 6 $100.9 12.0 0.6 12.6
Monterey New South Monterey County Courthouse High Need 1 $27.9 11.9 0.6 12.5
Del Norte New Del Norte County Main Courthouse High Need 3 $59.4 11.8 0.4 12.2
San Francisco San Francisco Civic Center Courthouse Renovation High Need 7 $44.9 11.2 0.8 12.0
San Diego San Diego North Regional Courthouse Complex Renovation - North Building High Need 14 $135.1 11.0 0.6 11.6
Riverside New Riverside Hall of Justice Annex High Need 10 $133.3 11.0 0.6 11.6
Riverside New Moreno Valley Courthouse High Need 9 $109.8 10.9 0.6 11.5
Humboldt New Eureka Courthouse High Need 9 $135.1 11.0 0.4 11.4
Merced New Merced Courthouse Annex High Need 1 $18.1 10.1 1.0 11.1
Yuba New Yuba County Courthouse High Need 6 $84.7 10.5 0.6 11.1
San Bernardino San Bernardino Courthouse Annex Renovation High Need 11 $46.5 10.2 0.8 11.0
Modoc New Barclay Justice Center High Need 2 $43.1 10.6 0.2 10.8
Ventura New Ventura East County Courthouse Medium Need 7 $94.1 9.4 0.6 10.0
Colusa Colusa Courthouse Annex Renovation Medium Need 1 $17.4 9.1 0.8 9.9
Santa Clara New Santa Clara Hall of Justice Medium Need 36 $521.0 9.0 0.6 9.6
Los Angeles Edelman Courthouse Renovation Medium Need 6 $112.1 8.4 0.6 9.0
Los Angeles New Los Angeles Mental Health Courthouse Medium Need 4 $112.3 8.5 0.4 8.9
Los Angeles New Lancaster Dependency Courthouse Medium Need 6 $89.1 8.2 0.6 8.8
San Diego San Diego East County Regional Center Renovation Medium Need 17 $169.7 8.0 0.6 8.6
Los Angeles New Torrance Dependency Courthouse and Traffic Annex Medium Need 7 $94.2 7.7 0.6 8.3
Los Angeles Compton Courthouse Renovation Medium Need 31 $340.7 7.5 0.6 8.1
Riverside Riverside Southwest Justice Center Renovation Low Need 1 $14.9 6.0 0.8 6.8
San Diego New San Diego Traffic Courthouse Low Need 4 $55.3 6.0 0.6 6.6
Santa Barbara Santa Maria Building G Renovation Low Need 1 $5.1 5.5 0.8 6.3
Butte Butte County Courthouse Addition and Renovation Low Need 2 $20.2 5.5 0.6 6.1
Sacramento Sacramento Juvenile Courthouse Renovation Low Need 2 $11.1 5.0 0.8 5.8
Riverside Banning Justice Center Addition Low Need 2 $21.9 4.5 0.6 5.1
Tehama Tehama Courthouse Renovation Low Need 2 $3.0 4.0 0.6 4.6
Yolo Yolo Superior Courthouse Renovation Low Need 0 $0.9 3.5 0.8 4.3
Santa Clara Santa Clara Family Justice Center Renovation Low Need 0 $1.9 2.5 0.8 3.3
Low Need
Medium Need
High Need
Critical Need, continued
Adopted by Judicial Council of California November 14, 2019 Page 2 of 2
County Project Name Priority Group CourtroomsProject
Cost (in millions)
Facility Condition
Index (FCI)
Physical Condition Overcrowding
Access to Court
Services
Seismic Risk Factor
Needs Score
Cost Avoidance Minimization
Project Cost per
Court User
Costs Spent to Date
Total Cost Points
Cost Score
Group Score
Lake New Lakeport Courthouse Immediate Need 4 $51.2 5.00 4.00 3.50 1.50 2.00 21.0 3.82 3.10 16.78 25.00 48.70 1.0 22.0
Mendocino New Ukiah Courthouse Immediate Need 7 $89.6 4.00 4.00 3.00 0.00 2.00 18.0 17.70 4.30 14.12 15.44 51.56 1.2 19.2
Nevada New Nevada City Courthouse Immediate Need 6 $91.8 3.50 3.20 3.27 0.00 3.00 18.0 3.62 2.61 14.42 2.35 23.00 0.6 18.6
Butte Butte County Juvenile Hall Addition and Renovation Immediate Need 1 $2.3 3.00 3.00 4.50 0.50 2.00 18.0 0.00 0.01 24.24 0.00 24.25 0.6 18.6
Monterey New Fort Ord Courthouse Immediate Need 7 $130.1 4.00 4.50 1.44 0.00 3.00 17.9 9.23 1.65 17.15 0.00 28.03 0.6 18.5
Lake New Clearlake Courthouse Immediate Need 1 $15.0 4.00 3.00 3.00 1.50 2.00 17.5 0.00 4.49 15.32 0.00 19.81 0.4 17.9
San Bernardino San Bernardino Juvenile Dependency Courthouse Addition and Renovation Immediate Need 2 $8.8 5.00 0.50 3.50 3.00 0.00 17.0 0.00 3.42 23.81 0.00 27.23 0.6 17.6
Solano New Solano Hall of Justice (Fairfield) Immediate Need 12 $170.2 3.00 4.00 2.00 0.00 3.00 17.0 0.00 3.13 18.52 0.00 21.65 0.6 17.6
Fresno New Fresno Courthouse Immediate Need 36 $483.1 2.50 4.00 1.66 1.50 2.00 16.5 9.94 1.91 19.40 11.29 42.54 1.0 17.5
Kern New Ridgecrest Courthouse Immediate Need 2 $42.2 5.00 1.86 3.77 2.00 0.00 17.0 2.58 1.58 16.16 0.00 20.32 0.4 17.4
Plumas New Quincy Courthouse Immediate Need 3 $65.9 2.50 4.50 2.00 0.00 3.00 17.0 0.00 2.06 1.48 1.38 4.92 0.2 17.2
Stanislaus New Modesto Courthouse Courtroom Renovation Immediate Need 3 $11.1 3.00 2.50 4.50 1.50 0.00 16.5 5.78 0.00 23.97 0.00 29.75 0.6 17.1
Los Angeles New Santa Clarita Courthouse Immediate Need 24 $345.0 2.05 4.37 2.02 0.00 3.00 16.4 0.00 5.91 17.76 1.19 24.86 0.6 17.0
San Luis Obispo New San Luis Obispo Courthouse Immediate Need 12 $184.9 3.50 2.50 3.50 0.50 2.00 16.5 0.71 1.59 17.72 0.00 20.02 0.4 16.9
San Joaquin New Tracy Courthouse Immediate Need 2 $34.4 5.00 2.50 3.50 1.50 0.00 16.5 0.00 1.43 18.43 0.00 19.86 0.4 16.9
Los Angeles New West Los Angeles Courthouse Immediate Need 32 $464.9 2.32 4.24 1.90 0.00 3.00 16.0 0.00 6.50 17.67 0.00 24.17 0.6 16.6
Kern New Mojave Courthouse Immediate Need 3 $56.8 3.00 2.00 4.50 2.00 0.00 16.0 0.00 0.38 17.11 0.12 17.61 0.4 16.4
Placer New Tahoe Area Courthouse Immediate Need 1 $34.8 2.50 3.00 4.50 1.00 0.00 16.0 1.25 0.22 13.53 0.00 15.00 0.4 16.4
Los Angeles New Inglewood Courthouse Critical Need 30 $432.1 2.23 4.16 1.90 0.00 3.00 15.7 0.00 6.30 17.74 0.00 24.04 0.6 16.3
Contra Costa New Richmond Courthouse Critical Need 6 $107.7 3.50 3.50 1.50 0.00 2.00 15.5 0.00 2.35 19.33 0.00 21.68 0.6 16.1
San Francisco New San Francisco Hall of Justice Critical Need 24 $460.1 4.00 3.00 2.00 0.00 2.00 15.5 0.00 3.58 14.08 0.00 17.66 0.4 15.9
Orange New Orange County Collaborative Courthouse Critical Need 3 $113.4 3.00 3.50 1.98 0.00 2.00 15.0 0.00 25.00 9.60 0.00 34.60 0.8 15.8
Santa Barbara New Santa Barbara Criminal Courthouse Critical Need 8 $102.8 3.00 3.00 2.00 0.00 2.00 14.5 14.01 2.18 19.09 25.00 60.28 1.2 15.7
El Dorado New Placerville Courthouse Critical Need 6 $92.2 3.17 2.27 2.33 0.00 2.00 14.8 3.31 2.06 18.69 3.48 27.54 0.6 15.4
Los Angeles New Van Nuys Courthouse (East/new + West/renovation) Critical Need 55 $922.4 2.36 3.90 1.83 0.00 3.00 14.8 0.00 4.72 16.47 0.00 21.19 0.6 15.4
Los Angeles New Downtown Los Angeles Courthouse (Mosk Replacement) Critical Need 47 $731.1 2.00 4.50 1.46 0.00 3.00 14.3 25.00 2.67 17.12 0.00 44.79 1.0 15.3
Fresno Fresno Juvenile Delinquency Courthouse Renovation Critical Need 2 $5.3 2.21 3.00 1.21 1.50 2.00 13.6 25.00 25.00 24.27 0.00 74.27 1.6 15.2
Inyo New Inyo County Courthouse Critical Need 2 $43.8 2.50 3.00 4.07 0.00 0.00 14.6 25.00 1.86 0.03 0.60 27.49 0.6 15.2
San Bernardino New Victorville Courthouse Critical Need 31 $392.5 2.15 2.71 2.25 3.00 2.00 14.6 0.00 0.37 20.69 0.00 21.06 0.6 15.2
Mariposa New Mariposa Courthouse Critical Need 2 $42.6 2.50 2.50 4.50 0.00 0.00 14.5 10.14 2.52 0.00 0.00 12.66 0.4 14.9
Los Angeles Chatsworth Courthouse Renovation Critical Need 7 $37.7 1.88 3.53 1.64 0.00 3.00 13.9 0.00 25.00 22.58 0.00 47.58 1.0 14.9
Santa Cruz New Santa Cruz Courthouse Critical Need 9 $139.8 2.44 3.15 1.76 0.00 2.00 13.7 25.00 1.91 18.30 0.00 45.21 1.0 14.7
San Diego New San Diego Juvenile Courthouse Critical Need 10 $121.4 4.00 2.00 3.00 0.00 0.00 14.0 0.00 1.25 20.22 0.00 21.47 0.6 14.6
Riverside New Riverside Juvenile Courthouse Critical Need 5 $77.9 2.50 1.00 3.00 2.50 0.00 14.0 0.00 0.60 20.66 0.00 21.26 0.6 14.6
Tulare New Tulare North County Courthouse Critical Need 14 $198.9 2.50 3.00 2.50 1.00 0.00 14.0 0.76 0.90 19.05 0.00 20.71 0.6 14.6
Los Angeles New West Covina Courthouse Critical Need 15 $215.5 3.38 3.12 1.18 0.00 3.00 13.9 0.00 6.02 17.76 0.00 23.78 0.6 14.5
Los Angeles New Eastlake Courthouse Critical Need 6 $119.1 2.50 3.00 3.13 0.00 2.00 14.1 0.00 1.23 14.82 0.17 16.22 0.4 14.5
Kern New Bakersfield Superior Courthouse Critical Need 33 $434.2 2.66 3.00 1.54 2.00 0.00 13.8 4.95 1.39 19.66 0.00 26.00 0.6 14.4
Sonoma New Sonoma Civil Courthouse Critical Need 8 $102.8 2.50 3.00 2.05 0.00 2.00 13.4 18.06 7.98 19.92 0.00 45.96 1.0 14.4
San Luis Obispo New Grover Beach Branch Courthouse Critical Need 1 $18.0 2.50 3.00 3.22 0.50 0.00 13.8 0.00 0.81 16.41 0.00 17.22 0.4 14.2
Alameda New Alameda County Community Justice Center Critical Need 57 $895.8 3.13 2.62 1.18 0.00 3.00 13.5 8.66 2.14 18.12 0.00 28.92 0.6 14.1
Security
Immediate Need5.00
5.00
5.00
5.00
5.00
4.00
5.00
5.00
4.81
4.32
5.00
5.00
4.93
4.50
4.00
4.48
4.50
5.00
Critical Need4.46
5.00
4.50
4.51
4.50
5.00
3.68
3.37
3.71
5.00
2.53
5.00
3.91
4.39
5.00
5.00
5.00
3.24
3.45
4.65
3.83
4.56
3.61
Statewide List of Trial Court Capital-Outlay Projects
Adopted by Judicial Council of California November 14, 2019 Page 1 of 2
Attachment A

County Project Name Priority Group CourtroomsProject
Cost (in millions)
Facility Condition
Index (FCI)
Physical Condition Overcrowding
Access to Court
Services
Seismic Risk Factor
Needs Score
Cost Avoidance Minimization
Project Cost per
Court User
Costs Spent to Date
Total Cost Points
Cost Score
Group Score
Security
Imperial Winterhaven Branch Courthouse Addition and Renovation Critical Need 1 $3.6 5.00 2.00 3.50 1.00 0.00 13.5 0.00 1.50 23.43 0.00 24.93 0.6 14.1
Los Angeles Los Angeles Metropolitan Courthouse Renovation Critical Need 14 $215.6 5.00 3.00 0.50 0.00 0.00 13.5 0.00 10.77 17.21 0.00 27.98 0.6 14.1
Los Angeles New North Central Los Angeles Courthouse Critical Need 12 $196.3 3.04 2.83 1.63 0.00 3.00 13.5 0.00 3.35 16.69 2.39 22.43 0.6 14.1
Riverside New Palm Springs Courthouse Critical Need 9 $98.6 1.50 3.00 3.00 2.50 0.00 13.0 0.00 0.18 22.09 0.00 22.27 0.6 13.6
Orange New Orange South County Courthouse Critical Need 16 $232.0 3.50 2.50 2.00 0.00 0.00 13.0 1.98 1.78 19.37 0.00 23.13 0.6 13.6
Los Angeles Foltz Courthouse Renovation Critical Need 60 $1,400.9 1.50 3.50 1.50 0.00 2.00 13.0 0.00 1.61 12.95 0.00 14.56 0.4 13.4
San Diego San Diego South County Regional Courthouse Renovation High Need 4 $10.5 4.00 1.50 2.00 0.00 0.00 12.5 0.00 4.79 24.33 0.00 29.12 0.6 13.1
San Mateo New San Mateo Northern Branch Courthouse High Need 5 $94.4 4.50 2.00 1.33 0.00 0.00 12.3 4.28 5.37 17.90 0.00 27.55 0.6 12.9
Los Angeles New Pasadena Courthouse High Need 17 $256.9 4.00 3.00 2.50 0.00 0.00 12.0 0.00 3.83 17.36 0.00 21.19 0.6 12.6
Solano New Solano Justice Center (Vallejo) High Need 6 $100.9 4.50 2.50 0.50 0.00 2.00 12.0 0.00 3.74 17.23 0.00 20.97 0.6 12.6
Monterey New South Monterey County Courthouse High Need 1 $27.9 4.50 2.00 2.69 0.00 0.00 11.9 1.13 3.10 12.98 8.56 25.77 0.6 12.5
Del Norte New Del Norte County Main Courthouse High Need 3 $59.4 3.00 1.50 2.29 0.00 0.00 11.8 3.03 3.23 6.45 0.00 12.71 0.4 12.2
San Francisco San Francisco Civic Center Courthouse Renovation High Need 7 $44.9 3.50 2.00 0.98 0.00 2.00 11.2 2.83 12.33 21.65 0.00 36.81 0.8 12.0
San Diego San Diego North Regional Courthouse Complex Renovation - North Building High Need 14 $135.1 1.50 2.50 2.00 0.00 0.00 11.0 0.00 1.80 21.30 0.00 23.10 0.6 11.6
Riverside New Riverside Hall of Justice Annex High Need 10 $133.3 3.50 2.00 0.50 2.50 0.00 11.0 0.00 3.57 21.36 0.00 24.93 0.6 11.6
Riverside New Moreno Valley Courthouse High Need 9 $109.8 3.50 2.00 0.50 2.50 0.00 10.9 4.73 3.97 21.71 0.00 30.41 0.6 11.5
Humboldt New Eureka Courthouse High Need 9 $135.1 2.00 3.00 2.03 1.50 2.00 11.0 0.00 1.77 17.12 0.00 18.89 0.4 11.4
Merced New Merced Courthouse Annex High Need 1 $18.1 2.27 0.73 0.83 1.50 0.00 10.1 13.51 13.92 18.24 0.00 45.67 1.0 11.1
Yuba New Yuba County Courthouse High Need 6 $84.7 3.00 2.00 2.50 0.50 0.00 10.5 3.23 1.49 16.39 0.00 21.11 0.6 11.1
San Bernardino San Bernardino Courthouse Annex Renovation High Need 11 $46.5 3.00 2.50 0.50 3.00 0.00 10.2 10.08 1.59 23.86 0.00 35.53 0.8 11.0
Modoc New Barclay Justice Center High Need 2 $43.1 3.00 2.50 2.15 0.00 0.00 10.6 2.04 4.90 0.00 0.00 6.94 0.2 10.8
Ventura New Ventura East County Courthouse Medium Need 7 $94.1 1.91 2.41 1.41 1.00 2.00 9.4 0.00 5.20 20.60 0.00 25.80 0.6 10.0
Colusa Colusa Courthouse Annex Renovation Medium Need 1 $17.4 2.50 1.00 3.30 0.00 0.00 9.1 16.25 6.50 8.48 0.00 31.23 0.8 9.9
Santa Clara New Santa Clara Hall of Justice Medium Need 36 $521.0 3.16 2.34 1.67 0.00 0.00 9.0 0.00 1.35 19.76 0.00 21.11 0.6 9.6
Los Angeles Edelman Courthouse Renovation Medium Need 6 $112.1 2.06 1.68 1.75 0.00 2.00 8.4 0.00 8.52 15.44 0.00 23.96 0.6 9.0
Los Angeles New Los Angeles Mental Health Courthouse Medium Need 4 $112.3 2.00 1.50 1.50 0.00 2.00 8.5 0.00 2.72 10.41 0.00 13.13 0.4 8.9
Los Angeles New Lancaster Dependency Courthouse Medium Need 6 $89.1 2.00 1.62 1.50 0.00 2.00 8.2 0.00 8.10 17.50 0.00 25.60 0.6 8.8
San Diego San Diego East County Regional Center Renovation Medium Need 17 $169.7 1.50 2.00 0.50 0.00 0.00 8.0 0.00 2.44 21.15 0.00 23.59 0.6 8.6
Los Angeles New Torrance Dependency Courthouse and Traffic Annex Medium Need 7 $94.2 2.10 1.53 1.57 0.00 2.00 7.7 0.00 7.14 18.24 0.00 25.38 0.6 8.3
Los Angeles Compton Courthouse Renovation Medium Need 31 $340.7 2.00 3.00 2.00 0.00 0.00 7.5 0.00 1.85 19.57 0.00 21.42 0.6 8.1
Riverside Riverside Southwest Justice Center Renovation Low Need 1 $14.9 1.50 1.00 0.50 2.50 0.00 6.0 0.00 13.93 20.87 0.00 34.80 0.8 6.8
San Diego New San Diego Traffic Courthouse Low Need 4 $55.3 3.00 1.50 0.50 0.00 0.00 6.0 0.00 4.92 19.50 0.00 24.42 0.6 6.6
Santa Barbara Santa Maria Building G Renovation Low Need 1 $5.1 3.00 1.50 0.50 0.00 0.00 5.5 0.00 10.16 22.92 0.00 33.08 0.8 6.3
Butte Butte County Courthouse Addition and Renovation Low Need 2 $20.2 1.50 2.00 1.00 0.50 0.00 5.5 0.00 5.85 20.01 0.00 25.86 0.6 6.1
Sacramento Sacramento Juvenile Courthouse Renovation Low Need 2 $11.1 2.00 0.50 0.50 1.50 0.00 5.0 0.00 9.95 23.02 0.00 32.97 0.8 5.8
Riverside Banning Justice Center Addition Low Need 2 $21.9 0.50 0.50 0.50 2.50 0.00 4.5 0.00 0.83 22.09 0.00 22.92 0.6 5.1
Tehama Tehama Courthouse Renovation Low Need 2 $3.0 0.50 0.50 0.50 2.00 0.00 4.0 0.00 2.05 24.51 0.00 26.56 0.6 4.6
Yolo Yolo Superior Courthouse Renovation Low Need 0 $0.9 0.50 1.50 0.50 0.50 0.00 3.5 0.00 7.30 25.00 0.00 32.30 0.8 4.3
Santa Clara Santa Clara Family Justice Center Renovation Low Need 0 $1.9 0.50 1.00 0.50 0.00 0.00 2.5 2.38 8.41 24.72 0.00 35.51 0.8 3.3
2.00
5.00
2.96
3.00
5.00
4.50
High Need
5.00
4.50
2.50
2.50
2.74
5.00
2.72
5.00
2.50
2.41
0.50
4.78
1.84
0.95
1.50
1.04
2.50
1.19
2.98
Medium Need0.68
0.50
0.50
0.50
Critical Need, continued
1.00
0.50
0.50
0.50
0.50
4.00
0.50
0.50
Low Need0.50
2.33
Adopted by Judicial Council of California November 14, 2019 Page 2 of 2

Revision of Prioritization Methodology for Trial Court Capital-Outlay Projects ADOPTED BY JUDICIAL COUNCIL ON:NOVEMBER 14, 2019
AS REQUIRED BY SENATE BILL 847(COMMITTEE ON BUDGET AND FISCAL
REVIEW; STATS. 2018, CH. 45, § 8): GOVERNMENT CODE SECTION 70371.9
Attachment B
i
TableofContents
REASSESSMENT OF TRIAL COURT CAPITAL-OUTLAY PLAN ................................ 1
CURRENT METHODOLOGY ............................................................................................ 1
REVISED METHODOLOGY .............................................................................................. 2
REASSESSMENT PROCESS .............................................................................................. 2
A. Methodology and Scoring .............................................................................................. 3
B. Needs-Based Physical Conditions Assessments ............................................................ 3
C. Needs-Based Court Facility Plans and Project Lists ...................................................... 4
D. Needs-Based Statewide Project List .............................................................................. 5
E. Cost-Based Evaluations: Avoidance, Savings, and Cost Minimization Strategies ........ 5
F. Calculations for Projects Affecting More Than One Existing Facility .......................... 5
NEEDS-BASED SCORING OF PROJECTS ....................................................................... 6
A. Facility Condition Index ................................................................................................ 6
B. Physical Condition ......................................................................................................... 6
1. Seismic Rating ........................................................................................................ 6
2. Fire and Life Safety ................................................................................................ 7
3. Environmental Hazards ........................................................................................... 8
4. Americans with Disabilities Act ............................................................................. 8
5. Conversion of Rating Points ................................................................................... 9
C. Security .......................................................................................................................... 9
D. Overcrowding ............................................................................................................... 10
E. Access to Court Services .............................................................................................. 10
F. Seismic Risk Factor ..................................................................................................... 11
COST-BASED SCORING OF PROJECTS ....................................................................... 12
A. Cost Avoidance or Savings Realized Through Operational or Organizational Efficiencies .......................................................................................... 13
B. Minimization of Increases in Ongoing Security, Operating, and Maintenance Costs . 14
C. Cost of Project per Court User ..................................................................................... 14
D. Total Costs Spent on a Project as of March 31, 2019 .................................................. 14

ii
FUNDING PROCESS ......................................................................................................... 15
A. Establishment of a Statewide Project List .................................................................... 15
B. Changes to Statewide Project List ................................................................................ 16
C. Project Phase Adjustments ........................................................................................... 16
D. No Substitutions of Projects Between Groups ............................................................. 16
E. How Requests for Funding Will Be Determined ......................................................... 16
PROCESS FOR ADDING OR DELETING PROJECTS IN THE TRIAL COURT CAPITAL-OUTLAY PLAN ............................................................................................... 16
APPENDIX A Text of Government Code section 70371.9
APPENDIX B Terms in Revision of Prioritization Methodology for Trial Court Capital-Outlay Projects
APPENDIX C The Need for New Judgeships in the Superior Courts: 2019 Update of the Judicial Needs Assessment (Nov. 2019)
1
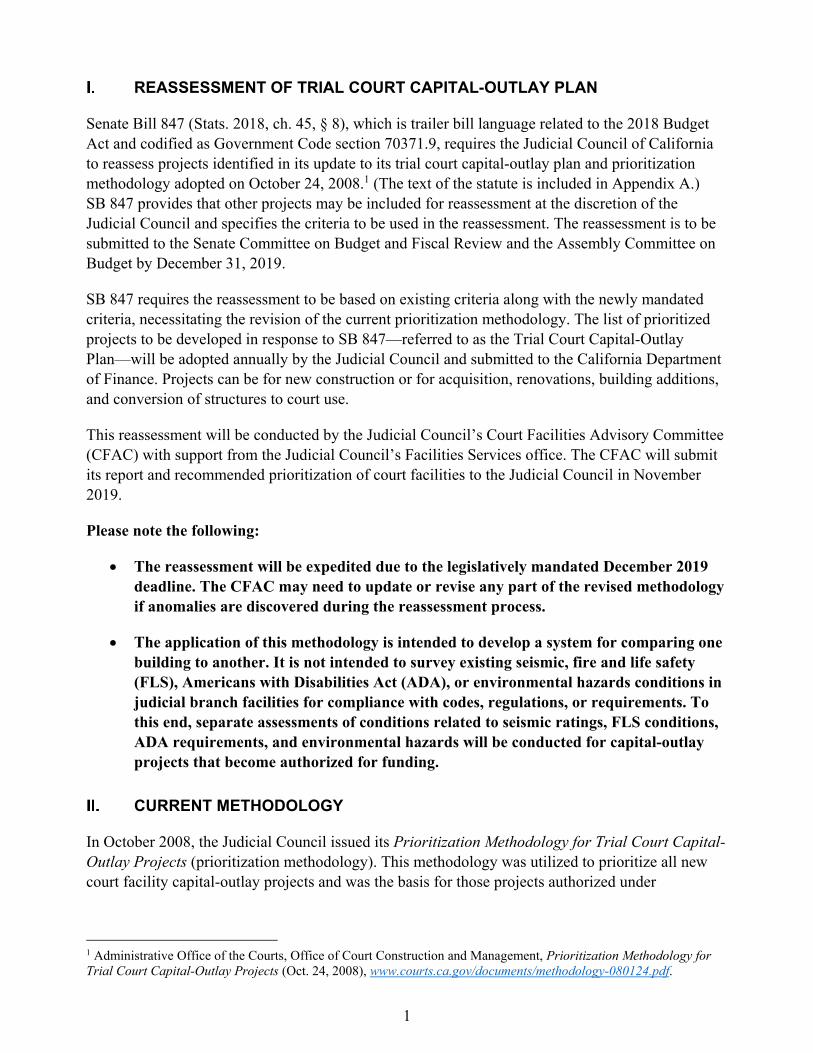
REASSESSMENT OF TRIAL COURT CAPITAL-OUTLAY PLAN
Senate Bill 847 (Stats. 2018, ch. 45, § 8), which is trailer bill language related to the 2018 Budget Act and codified as Government Code section 70371.9, requires the Judicial Council of California to reassess projects identified in its update to its trial court capital-outlay plan and prioritization methodology adopted on October 24, 2008.1 (The text of the statute is included in Appendix A.) SB 847 provides that other projects may be included for reassessment at the discretion of the Judicial Council and specifies the criteria to be used in the reassessment. The reassessment is to be submitted to the Senate Committee on Budget and Fiscal Review and the Assembly Committee on Budget by December 31, 2019.
SB 847 requires the reassessment to be based on existing criteria along with the newly mandated criteria, necessitating the revision of the current prioritization methodology. The list of prioritized projects to be developed in response to SB 847—referred to as the Trial Court Capital-Outlay Plan—will be adopted annually by the Judicial Council and submitted to the California Department of Finance. Projects can be for new construction or for acquisition, renovations, building additions, and conversion of structures to court use.
This reassessment will be conducted by the Judicial Council’s Court Facilities Advisory Committee (CFAC) with support from the Judicial Council’s Facilities Services office. The CFAC will submit its report and recommended prioritization of court facilities to the Judicial Council in November 2019.
Please note the following:
The reassessment will be expedited due to the legislatively mandated December 2019 deadline. The CFAC may need to update or revise any part of the revised methodology if anomalies are discovered during the reassessment process.
The application of this methodology is intended to develop a system for comparing one building to another. It is not intended to survey existing seismic, fire and life safety (FLS), Americans with Disabilities Act (ADA), or environmental hazards conditions in judicial branch facilities for compliance with codes, regulations, or requirements. To this end, separate assessments of conditions related to seismic ratings, FLS conditions, ADA requirements, and environmental hazards will be conducted for capital-outlay projects that become authorized for funding.
CURRENT METHODOLOGY
In October 2008, the Judicial Council issued its Prioritization Methodology for Trial Court Capital-Outlay Projects (prioritization methodology). This methodology was utilized to prioritize all new court facility capital-outlay projects and was the basis for those projects authorized under
1 Administrative Office of the Courts, Office of Court Construction and Management, Prioritization Methodology for Trial Court Capital-Outlay Projects (Oct. 24, 2008), www.courts.ca.gov/documents/methodology-080124.pdf.

2
Senate Bills 1407 and 1732. The last projects to be funded utilizing the current methodology were funded in the 2018–19 State Budget.
During the budget deliberation process, the Legislature noted the need to revise the current methodology and reassess all court facilities due to the current methodology’s age. Development of a revised prioritization methodology is a condition of any future funding requests for capital-outlay projects.
REVISED METHODOLOGY
The revised methodology has been prepared for use in developing a new set of prioritized trial court capital-outlay projects as required by SB 847, and enabling recommendations to the Judicial Council for the submission of funding requests for such projects. Trial court capital-outlay projects are considered those that increase a facility’s gross area, such as a building addition; that substantially renovate a major portion of a facility; that comprise a new facility or an acquisition; or that change the use of a facility, such as the conversion from non-court use to court use.
Generally, the methodology provides that projects will be scored based on need and placed into one of five priority groups. The projects within each priority group will then be ranked based on the scoring of the cost criteria identified in SB 847. Needs identified in the methodology inform the Trial Court Capital-Outlay Plan and the selection of projects proposed for funding.
A point range has been established for each of the five need-based priority groups. For example, projects scoring very high in each of the evaluated criteria will fall into the Immediate Need group. The Critical, High, Medium, and Low Need groups represent sets of projects that score lower in the various needs-based criteria categories. A scale of 25 points is used for the total of all needs-based criteria. The details of the scoring are described later in this document.
Prioritized Groups of Trial Court Capital-Outlay Projects
Immediate Need: 16–25 points Critical Need: 13–15.9 points
High Need: 10–12.9 points Medium Need: 7.5–9.9 points
Low Need: 0–7.4 points
Cost-based criteria as identified in SB 847 will impact the ranking of the projects within each of the five priority groups identified above.
Terms used in this document are defined in the attached Appendix B.
REASSESSMENT PROCESS
The process for reassessment of the projects identified in the Trial Court Capital-Outlay Plan consists of five activities:
1. Revision of the prioritization methodology consistent with SB 847;

3
2. Assessment of facilities occupied by trial courts, including physical condition assessments, as well as assessments related to security, access to court services, and overcrowding;
3. Development of court facility plans and court needs-based project lists;
4. Application of the prioritization methodology to all projects; and
5. Development of a statewide list of prioritized projects.
A. Methodology and Scoring
The revised methodology involves a two-step process. Step 1 identifies (1) the general physical condition of the buildings; (2) needed improvement to the physical condition of buildings to alleviate the totality of risks associated with seismic conditions, fire and life safety conditions, Americans with Disabilities Act requirements, and environmental hazards; (3) court security features within buildings; (4) access to court services; (5) overcrowding; and (6) projects that replace or renovate courtrooms in court buildings where there is a risk to court users due to potential catastrophic events.
In Step 2, the needs-based criteria and cost-based criteria are then used to rank projects within the priority groups.
In the most essential terms, the methodology can be described as:
Needs-based criteria = Priority Group Needs-based and cost-based criteria = Rank within Priority Group
B. Needs-Based Physical Conditions Assessments
The physical condition of buildings that house trial court functions will be determined by facility condition assessments (FCA).2 The FCAs will analyze the building systems and component conditions to determine their remaining useful life and provide the basis for determining a Facility Condition Index (FCI).
The FCI is an industry standard asset management methodology that is used to determine a building’s condition at a point in time. Limited strictly to condition, FCIs allow for an equivalent comparative analysis of diverse real estate portfolios.
FCI values are based on a 0–100 percent scale and are derived by dividing the repair costs for a building by its current replacement value. Costs for abatement of environmental hazards or to improve seismic or ADA conditions were not evaluated in the FCAs and therefore not factored into
2 Primarily, facility condition assessments (FCAs) were prepared for state-owned or county-owned buildings where a court’s occupied space included courtrooms or operations to support courtrooms. In county-owned facilities, FCAs were not prepared for facilities in which (1) a court’s exclusive area was less than 10,000 square feet or (2) a court’s share of space equity was less than 20 percent. FCAs were not prepared for facilities that are leased.

4
the FCI. Environmental hazards, seismic, and ADA conditions, as well as FLS conditions, are factored into the needs-based scoring of projects under Section V. below.
Other data sources, as described below, will provide information needed to evaluate security characteristics, conditions that would indicate overcrowding in existing facilities, and access to court services.
C. Needs-Based Court Facility Plans and Project Lists
The planning process will begin with development of a Court Facility Plan. The plan will be a collaborative process between the court and the Judicial Council planning team that will assess and document how each court intends to operate its facilities to provide judicial services to the public, as well as identify any additional facility needs or deficiencies. The Court Facility Plan will be based on data provided by the planning team to the court including:
Organization of the court and how court facilities are utilized to ensure public access to services;
Relevant information and data from the 2002–2003 Statewide Court Facilities Master Plan to support the project updates;
Authorized judgeships (as defined in the attached Appendix C) for access to services; and
Relationship of judicial need to facility need.
The planning process will also include an asset management evaluation. The asset management evaluation will identify:
Opportunities for lease consolidation;
Building consolidations that would provide future revenue or operating cost savings; and
Unique real estate and funding opportunities associated with the project.
Information that will be utilized to develop the asset management evaluation will include current leases, closed facilities, and justice partners’ plans (e.g., new jail locations, move of county partner functions, etc.).
The Court Facility Plan will articulate the optimum approach for use of court facilities for each court and identify projects that address deficiencies in the needs-based criteria. The Court Facility Plan will be the basis for future project requests for new facilities, facility renovations, replacements and/or consolidations, and will include a list of projects. The projects in the plan will be scored using the criteria in the approved methodology.
Needs-based criteria will be applied to the data generated by the FCA and Court Facility Plan processes, and will place projects into the priority groups identified above.

5
D. Needs-Based Statewide Project List
The Statewide Project List will be developed by consolidating the court project lists. The Statewide Project List will categorize the projects into five groups (Immediate, Critical, High, Medium, Low), in accordance with the approved prioritization methodology.
E. Cost-Based Evaluations: Avoidance, Savings, and Cost Minimization Strategies
SB 847 requires that projects be assessed considering cost avoidance, cost savings, and cost minimization strategies. Court projects identified in the Court Facility Plans and the project lists will identify costs, savings, and avoidances relative to each project, including:
The cost avoidance or savings that would be achieved through operational or organizational efficiencies created for the court or the state;
Ways to minimize increased ongoing costs, including, but not limited to, trial court security and operating and maintenance costs;
The projected cost of each proposed project, per court user; and
The total costs spent on the project as of the date of March 31, 2019.
The criterion identified in SB 847 as “a comparison of the cost to repair or renovate the existing facility versus the cost of replacement” will not be scored within the cost-based evaluation. Rather, it will be addressed in the Court Facility Plan and on the project list in terms of the type of project to be pursued (e.g., new construction vs. renovation). Needs-based and cost-based criteria will be used to rank projects within the priority grouping.
F. Calculations for Projects Affecting More Than One Existing Facility
For projects affecting only one building, the ratings of the single building will be used as explained above. In the case of multiple buildings affected by a project, the proportional share of the court-occupied area of each building will be used to determine each criterion’s rating. As shown below, the proportional share of the court-occupied area of each building is multiplied by the total of each criterion’s rating to develop the portion of the rating for that building affected by the project. For each criterion, these portions are then summed to develop the total rating as shown in the example below using the needs-based FCI criteria.
Sample FCI rating—Multiple Buildings
Existing Facility Facility Area % of Total FCI Points Facility Pt. Contribution
Main Courthouse 80,000 80% 5 5 x 0.8 = 4 Branch Courthouse 20,000 20% 3 3 x 0.2 = 0.6 Total 100,000 100% 4.6

6
NEEDS-BASED SCORING OF PROJECTS
Use of the needs-based criteria will enable the placement of every project into one of five priority groups: Immediate Need, Critical Need, High Need, Medium Need, and Low Need. The total points for the needs-based criteria will be 25. The 25 points will be allocated equally as follows, based on the five following criteria:
1. Facility Condition Index 5 Points
2. Physical Condition—composed of Seismic Rating, Fire and Life Safety, ADA, and Environmental Hazards 5 Points
3. Security 5 Points
4. Overcrowding 5 Points
5. Access to Court Services 5 Points
Total Points for Needs-Based Criteria 25 Points
To address the issue of seismic risk to court users, projects proposed to replace or renovate courtrooms in existing High Risk or Very High Risk buildings would receive up to 3 additional points in accordance with the table under Section V.F. below.
A. Facility Condition Index
FCI is defined as the cost to repair divided by the replacement cost and is represented by a percentage.
Approach:
A 10-year horizon will be used in applying the FCI; and
A 5-point scale will be used; points will be allocated in accordance with the following table:
Points 0 0.5 1.0 1.5 2.0 2.5 3.0 3.5 4.0 4.5 5.0
FCI Range % 0 1–5 6–10 11–15 16–20 21–25 26–30 31–35 36–40 41–45 >46
B. Physical Condition
Seismic, Fire and Life Safety, ADA, and Environmental Hazards categories will combine to contribute 5 points. These categories will be scored with a total score of 120 rating points, distributed as follows: Seismic, 40; FLS, 40; ADA, 20; and Environmental Hazards, 20. The total 120 rating points will be converted to a 5-point scale as explained below:
1. Seismic Rating
Defined as the score calculated using the Federal Emergency Management Agency (FEMA) P-154 Rapid Visual Screening of Buildings for Potential Seismic Hazards (FEMA P-154). This method will be used to establish consistent seismic scores for all 213 buildings. FEMA P-154 is a procedure to identify and screen buildings that are potentially seismically hazardous. This tool calculates a score based on the building’s structural system, age, visually identifiable deficiencies, seismicity, and soil type.
7
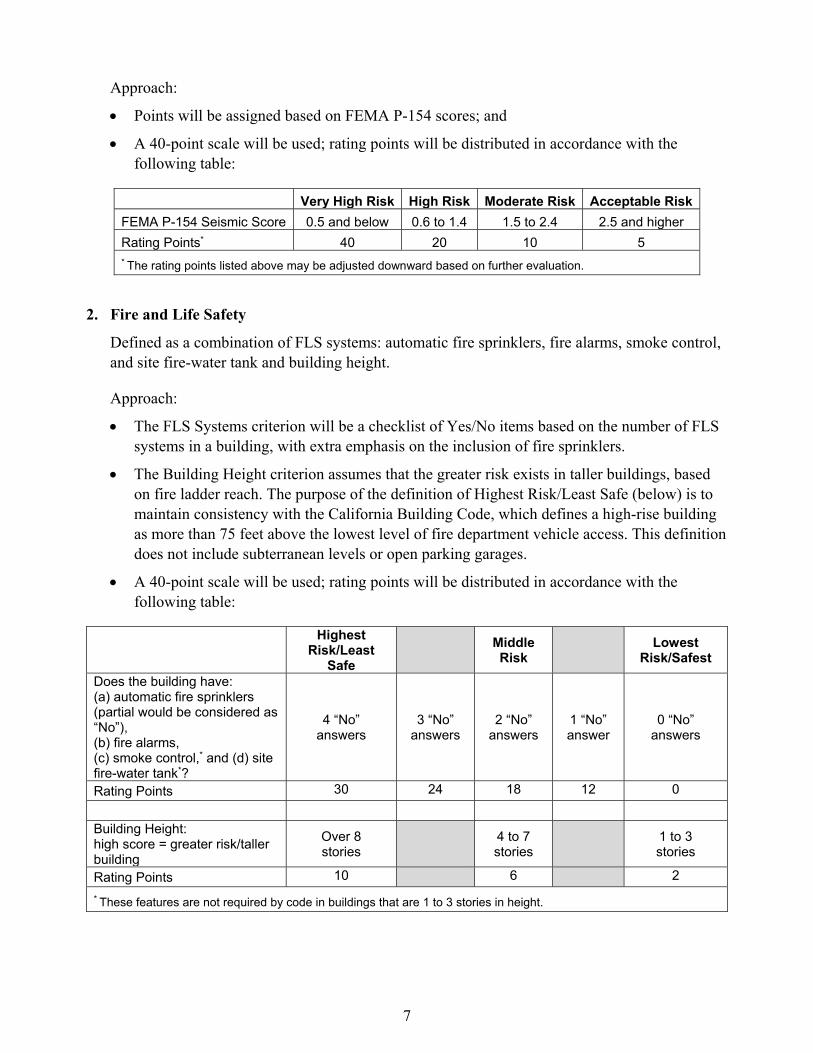
Approach:
Points will be assigned based on FEMA P-154 scores; and
A 40-point scale will be used; rating points will be distributed in accordance with the following table:
Very High Risk High Risk Moderate Risk Acceptable Risk
FEMA P-154 Seismic Score 0.5 and below 0.6 to 1.4 1.5 to 2.4 2.5 and higher Rating Points* 40 20 10 5 * The rating points listed above may be adjusted downward based on further evaluation.
2. Fire and Life Safety
Defined as a combination of FLS systems: automatic fire sprinklers, fire alarms, smoke control, and site fire-water tank and building height.
Approach:
The FLS Systems criterion will be a checklist of Yes/No items based on the number of FLS systems in a building, with extra emphasis on the inclusion of fire sprinklers.
The Building Height criterion assumes that the greater risk exists in taller buildings, based on fire ladder reach. The purpose of the definition of Highest Risk/Least Safe (below) is to maintain consistency with the California Building Code, which defines a high-rise building as more than 75 feet above the lowest level of fire department vehicle access. This definition does not include subterranean levels or open parking garages.
A 40-point scale will be used; rating points will be distributed in accordance with the following table:
Highest Risk/Least
Safe Middle
Risk Lowest
Risk/Safest
Does the building have: (a) automatic fire sprinklers (partial would be considered as “No”), (b) fire alarms, (c) smoke control,* and (d) site fire-water tank*?
4 “No” answers
3 “No” answers
2 “No” answers
1 “No” answer
0 “No” answers
Rating Points 30 24 18 12 0 Building Height: high score = greater risk/taller building
Over 8 stories 4 to 7
stories 1 to 3 stories
Rating Points 10 6 2 * These features are not required by code in buildings that are 1 to 3 stories in height.

8
3. Environmental Hazards
Includes products that contain asbestos or lead, or other hazardous materials such as polychlorinated biphenyls (PCBs), and may be determined based on the age of the building or other existing data.
Approach:
Ten rating points will be assigned to buildings that could contain materials made from asbestos-containing materials.
Ten rating points will be assigned to buildings that could contain materials made from lead or other hazardous materials, such as PCBs.
A 20-point scale will be used; rating points will be distributed in accordance with the following table:
Environmental Hazards Rating Points Risk of Asbestos Containing Materials 10 Risk of Lead or Other Hazardous Materials (e.g., PCBs) 10
Total Possible Points 20
4. Americans with Disabilities Act
Accessibility will be determined based on a checklist of Yes/No items defined by ADA elements, with emphasis on public areas (pathways, toilet rooms, etc.). The application of this methodology is not intended to produce a comprehensive ADA compliance survey. Rather, this scoring effort utilizes a checklist and visual inspection process to identify whether accessible public spaces of a specific type exist in an individual building, thus providing a system for comparing one building to another.
Approach:
Twenty rating points will be assigned based on whether areas are accessible. The more “No” answers, the less accessible the building is, and the more points provided.
A 20-point scale will be used; rating points will be distributed in accordance with the following table:
Categories Yes No
Exterior Path of Travel 0 4 Building Entrances 0 4 Interior Accessible Routes; Stairways and Elevators 0 4 Courtroom: Jury Box, Witness Stand, Clerk’s Station, Bench 0 4 Toilet Rooms—Public, Jury Deliberation 0 4 Total Possible Points 20

9
5. Conversion of Rating Points
As a final step, the accumulated physical condition rating points for each project, which can total up to 120, will be converted to the 5-point scale as follows:
Total: 5 Points 0.5 1 1.5 2 2.5 3 3.5 4 4.5 5.0 Total: 120 Rating Points 0–12 13–24 25–36 37–48 49–60 61–72 73–84 85–96 97–108 109–120
C. Security
The security criterion will be used to identify:
1. The extent to which judicial/staff circulation paths are separate from those for the public and in-custody individuals. Judicial/Staff Circulation refers to the degree of compliance with guidelines for private circulation paths exclusively dedicated to permit the judiciary and staff to enter and move through the facility separate and secure from both the public and in-custody individuals;
2. The extent to which in-custody circulation paths are also separate. Secure Circulation refers to the degree of compliance with guidelines for separate, secure means by which in-custody individuals are brought into the facility and moved from holding areas to the courtroom. A secure circulation route is completely separated from areas used by the public and by the judiciary and court staff; and
3. The capacity of the building entrance to accommodate security screening.
Approach:
Eighty rating points will be assigned based on whether there is an area at the facility entrance that can adequately accommodate a screening system, and judicial/staff circulation and secure circulation is:
o Deficient: Functional condition fails in one or more major aspects.
o Marginal: Functional condition has notable deficiencies.
o Adequate: Functional condition is acceptable or better.
o Not Applicable: Functional element is not applicable for this facility.
The 80 rating points will be distributed as defined in accordance with the following table:
Judicial/Staff Circulation Circulation deficient
Circulation marginal
Circulation adequate or not applicable to this facility
Points 35 17 0
Secure Circulation Circulation deficient
Circulation marginal
Circulation adequate or not applicable to this facility
Points 35 17 0
Ability to Accommodate Security Screening
No space to provide
screening
Space for minimal screening
Space available for screening or not applicable to this facility
Points 10 6 0
10
The following conversion table will then be applied to the total of the rating points:
Total: 5 Points 0.5 1 1.5 2 2.5 3 3.5 4 4.5 5.0 Total: 80 Rating Points 0–8 9–16 17–25 26–32 33–40 41–48 49–56 57–64 65–72 73–80
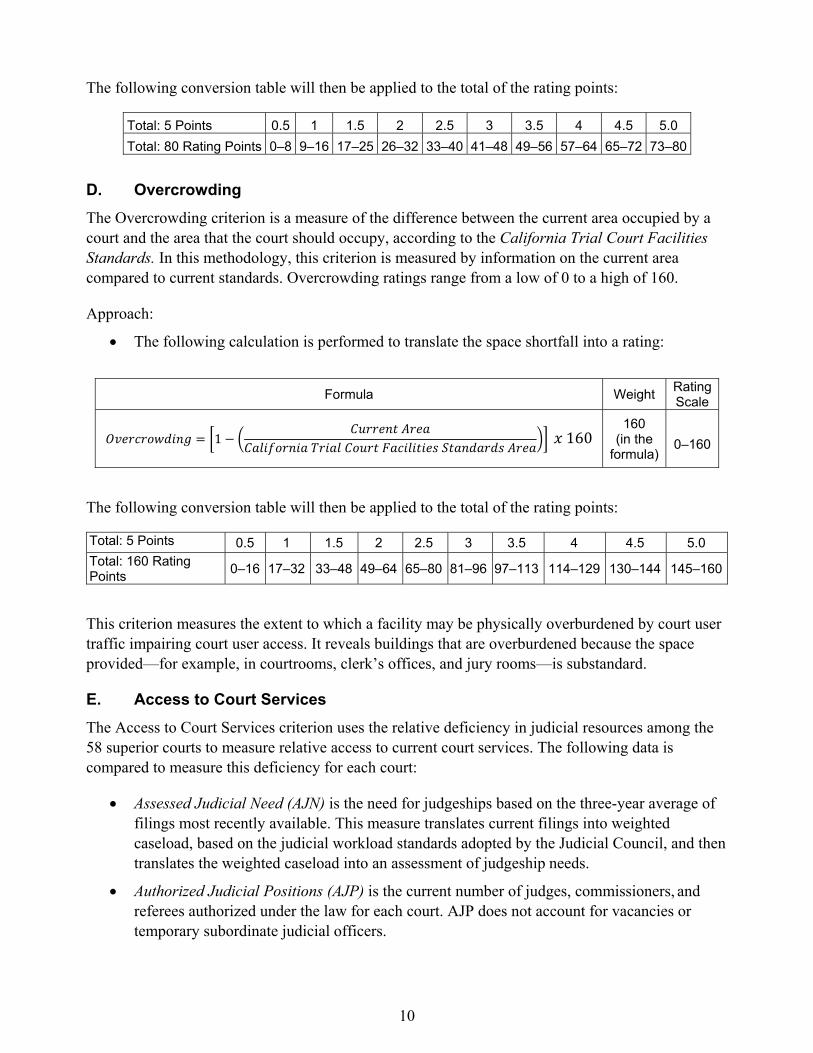
D. Overcrowding
The Overcrowding criterion is a measure of the difference between the current area occupied by a court and the area that the court should occupy, according to the California Trial Court Facilities Standards. In this methodology, this criterion is measured by information on the current area compared to current standards. Overcrowding ratings range from a low of 0 to a high of 160.
Approach:
The following calculation is performed to translate the space shortfall into a rating:
Formula Weight Rating Scale
1
160
160 (in the
formula) 0–160
The following conversion table will then be applied to the total of the rating points:
Total: 5 Points 0.5 1 1.5 2 2.5 3 3.5 4 4.5 5.0 Total: 160 Rating Points 0–16 17–32 33–48 49–64 65–80 81–96 97–113 114–129 130–144 145–160
This criterion measures the extent to which a facility may be physically overburdened by court user traffic impairing court user access. It reveals buildings that are overburdened because the space provided—for example, in courtrooms, clerk’s offices, and jury rooms—is substandard.
E. Access to Court Services
The Access to Court Services criterion uses the relative deficiency in judicial resources among the 58 superior courts to measure relative access to current court services. The following data is compared to measure this deficiency for each court:
Assessed Judicial Need (AJN) is the need for judgeships based on the three-year average of filings most recently available. This measure translates current filings into weighted caseload, based on the judicial workload standards adopted by the Judicial Council, and then translates the weighted caseload into an assessment of judgeship needs.
Authorized Judicial Positions (AJP) is the current number of judges, commissioners, and referees authorized under the law for each court. AJP does not account for vacancies or temporary subordinate judicial officers.

11
The difference between the AJN and the AJP identifies the relative deficiency in judicial resources or judicial need for a court. The ratio between the judicial need and the AJP defines the relative access to court services.
The point range for this criterion, as denoted below, is from 0 to 5, in half-point increments that reflect the broad range of relative deficiency in judicial resources among the courts in the 58 counties.
Rating Assigned to Project (Percentage Need Over AJP) Points Assigned
0% or below 0 1–10% 0.5
11–20% 1.0 21–30% 1.5 31–40% 2.0 41–50% 2.5 51–60% 3.0 61–70% 3.5 71–80% 4.0 81–90% 4.5
91–100%+ 5.0
For a proposed project involving fewer than all of the court facilities within a county, there will be a rebuttable presumption that the countywide percentage deficiency and the corresponding points will be assigned to that project.
As with the Overcrowding criterion discussed in Section D. above, the Access to Court Services criterion measures the extent to which a facility may be physically overburdened by court user traffic impairing court user access. It reveals buildings that are overburdened because the caseload justifies more space, including courtrooms, than is available. While needed judges beyond existing capacity increases an existing facility’s deficiency, an excess of judges over capacity does not decrease a facility’s deficiencies.
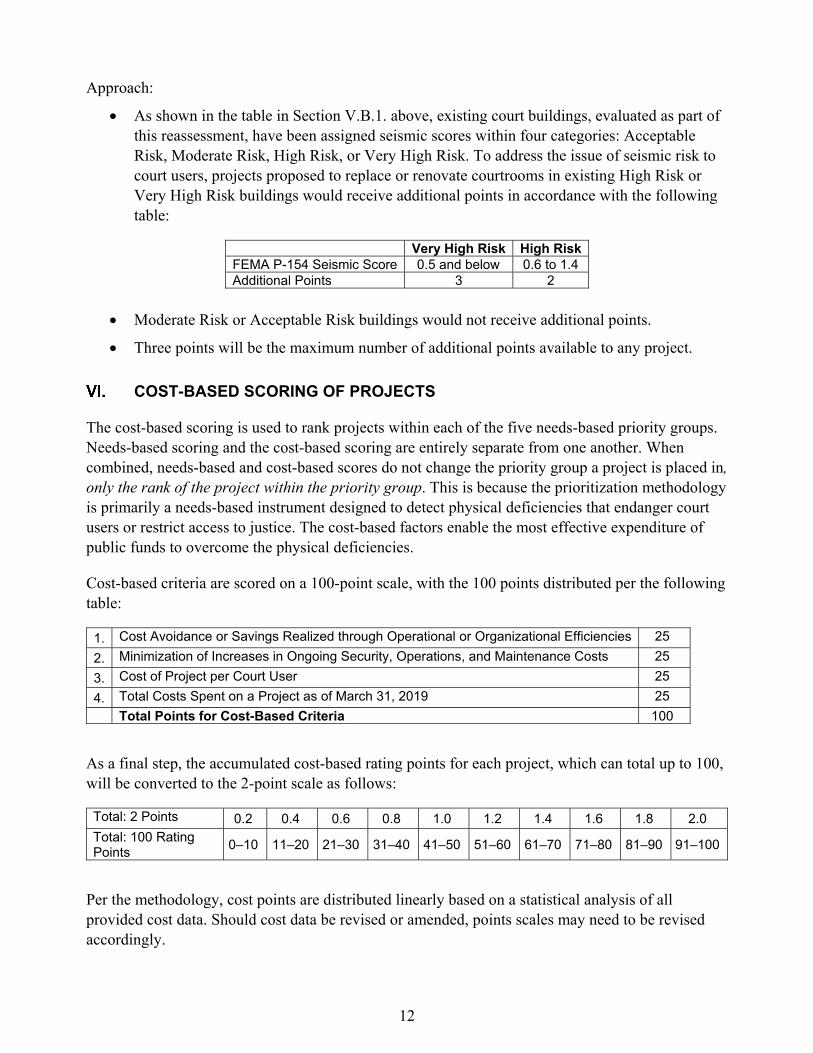
F. Seismic Risk Factor
All court users who participate in the justice process, including the public, court employees, and justice partners, are potentially placed at risk in existing courthouses from building failure due to potential catastrophic events. The seismic rating component of the Physical Condition criterion, under Section V.B.1. above, assesses the potential for physical damage to the facility due to a seismic event. The FEMA P-154 risk rating system does not fully account for the risk to court users posed by the physical damage that may be incurred. This Seismic Risk Factor criterion credits projects for mitigating risk to court users. Proposed projects that replace or renovate courtrooms in existing, seismically substandard buildings with a FEMA P-154 rating of High or Very High Risk are eligible to receive no more than 3 additional points.
12
Approach:
As shown in the table in Section V.B.1. above, existing court buildings, evaluated as part of this reassessment, have been assigned seismic scores within four categories: Acceptable Risk, Moderate Risk, High Risk, or Very High Risk. To address the issue of seismic risk to court users, projects proposed to replace or renovate courtrooms in existing High Risk or Very High Risk buildings would receive additional points in accordance with the following table:
Very High Risk High Risk FEMA P-154 Seismic Score 0.5 and below 0.6 to 1.4 Additional Points 3 2
Moderate Risk or Acceptable Risk buildings would not receive additional points.
Three points will be the maximum number of additional points available to any project.
COST-BASED SCORING OF PROJECTS
The cost-based scoring is used to rank projects within each of the five needs-based priority groups. Needs-based scoring and the cost-based scoring are entirely separate from one another. When combined, needs-based and cost-based scores do not change the priority group a project is placed in, only the rank of the project within the priority group. This is because the prioritization methodology is primarily a needs-based instrument designed to detect physical deficiencies that endanger court users or restrict access to justice. The cost-based factors enable the most effective expenditure of public funds to overcome the physical deficiencies.
Cost-based criteria are scored on a 100-point scale, with the 100 points distributed per the following table:
1. Cost Avoidance or Savings Realized through Operational or Organizational Efficiencies 25 2. Minimization of Increases in Ongoing Security, Operations, and Maintenance Costs 25 3. Cost of Project per Court User 25 4. Total Costs Spent on a Project as of March 31, 2019 25 Total Points for Cost-Based Criteria 100
As a final step, the accumulated cost-based rating points for each project, which can total up to 100, will be converted to the 2-point scale as follows:
Total: 2 Points 0.2 0.4 0.6 0.8 1.0 1.2 1.4 1.6 1.8 2.0 Total: 100 Rating Points 0–10 11–20 21–30 31–40 41–50 51–60 61–70 71–80 81–90 91–100
Per the methodology, cost points are distributed linearly based on a statistical analysis of all provided cost data. Should cost data be revised or amended, points scales may need to be revised accordingly.

13
The formula below, in conjunction with the data provided in the following table, provides the point values for each criterion described below under Sections A. through D. Any point calculation exceeding 25 has been capped at 25 points, and likewise, any values returning less than 0 has been capped at 0 points.
∗
Cost Avoidance
($/court user)
Cost Minimization ($/court user)
Project Cost Per User
($/court user)
Total Spent as of
3/31/19
A 2.83 3.45 * 10-2 –9.39 * 10-3 5.16 * 10-6
B 0 –6.21 * 10-3 25.5 –0.813 Representative Points
0 Points $0 $0 $2,712 $157,702
6.25 Points $2 $181 $2,046 $1,370,002
12.5 Points $4 $363 $1,380 $2,582,302
18.75 Points $7 $544 $715 $3,794,601
25 Points $9 $725 $49 $5,006,901
As previously stated, in the most essential terms the methodology can be described as:
Needs-based criteria = Priority Group Needs-based and cost-based criteria = Rank within Priority Group
A. Cost Avoidance or Savings Realized Through Operational or Organizational Efficiencies
The CFAC and Facilities Services will engage with the courts to assess the potential cost avoidance or savings that may be realized based on the implementation of each project. Generally, it is expected that such savings may be realized based on consolidation of multiple facilities into one larger facility and elimination of certain short-term leases in exchange of building a new facility, or a combination of the consolidation of owned facilities and elimination of leases within the same project. Any cost savings due to staff efficiencies related to consolidation or any other factors will be identified by the courts. Cost savings information identified by various courts will be reviewed for general conformance and consistency. Any anomalies will be discussed with the courts for resolution. Any anomalies that are not resolved with the courts will be referred to the CFAC for resolution.
The total identified cost avoidance or savings for each project will be “normalized” and converted to Cost Avoidance or Savings per Court User. This conversion will be accomplished taking into consideration the population of the county, the AJPs for the court, and the number of courtrooms that are impacted by the project.

14
B. Minimization of Increases in Ongoing Security, Operating, and Maintenance Costs
Facilities Services will calculate any potential minimization of increases to court security costs, using existing building security systems data. Minimization of planned increases to security costs is defined as the costs that will be incurred in the existing building (or buildings) if it remains in operation and is not being replaced by an approved project.
Approach:
The following formula will be used:
Cost (security cameras, access control, fencing and gates) + Screening Equipment Costs = Minimization of Increases in Ongoing Security Costs
Facilities Services will also calculate any potential for minimization of increases in ongoing operations and maintenance costs. Minimization of increases in ongoing operations and maintenance costs is defined as the cost of operating and maintaining the current facilities if the proposed project does not proceed compared to the cost of operating a new building designed to meet current codes. The delta is the minimization of costs.
Approach:
The following formula will be used:
Cost of current building maintenance + Cost of current building utilities + Cost of building Deferred Maintenance – Cost of Operating and Maintaining the New Building = Minimization of Increases in Ongoing Operating and Maintenance Costs
C. Cost of Project per Court User
The cost per court user is calculated based on the population of the county, the AJPs for the court, and the number of proposed project courtrooms. This value will be adjusted to compensate for counties with minimal population that are awarded the statutory minimum AJP of 2.3. (Note: The judicial branch’s smallest courts are statutorily provided with a minimum of two judgeships and are authorized to have at least 0.3 full-time equivalent (FTE) of a federally funded child support commissioner, for a total of 2.3 FTE judicial officers.)
The following formula will be used to determine the cost per court user:
#
D. Total Costs Spent on a Project as of March 31, 2019
The total costs spent as of March 31, 2019, on previously authorized projects that were placed on hold will be tabulated from the accounting records.

15
FUNDING PROCESS
A. Establishment of a Statewide Project List
The Judicial Council will adopt a list of projects categorized by Priority Group. This list will be reviewed by the CFAC, the Executive and Planning Committee, and any other council-appointed body with responsibility for advising the Judicial Council on facility matters. In adopting a list of projects for submission to the California Department of Finance (DOF) for requested inclusion in the Governor’s Budget proposal to the Legislature, the Judicial Council will follow these principles:
1. Projects will be prioritized on the needs-based program criteria established by this methodology, which ranks the projects into priority groupings. The cost-based criteria will be assigned points and will be used to sort projects within each priority group.
2. For submission to the DOF for consideration of inclusion in the Governor’s Budget, the Judicial Council may select projects based upon additional substantive considerations, including, without limitation, additional economic opportunity considerations, upon seismic safety and other risk factors, upon historical utilization of single-courtroom facilities, and/or upon changed circumstances.
3. Economic opportunities include, but are not limited to, free or reduced costs of land for new construction, viable financing partnerships or fund contributions by other government entities or private parties that result in lower project delivery costs, cost savings resulting from adaptive reuse of existing facilities or from build-outs using available shelled space, operational efficiencies from consolidation of court calendars and operations, and building operational cost savings from consolidation of facilities.
Consideration of economic opportunity allows the Judicial Council to request funding for projects that have documented capital or operating savings for the state. Judicial Council staff will work in collaboration with local courts to evaluate and document the economic opportunity of each eligible project.
4. Seismic safety and other risk factors include conditions related to expert evaluation, commissioned or adopted by the Judicial Council, beyond this methodology establishing that the building is at risk of causing loss of human life or significant disruption to a court’s/courts’ ability to operate in the event of an earthquake, fire, or other event. The Judicial Council may consider the need to phase projects and to engage in multiple projects to mitigate risk to a court or courts in determining the priority of a project and the order of funding for associated projects.
5. In the case of a proposed project to replace or renovate a single-courtroom facility in a county with more than one court facility, the Judicial Council may exclude the project after considering public access adjacency to the other courthouses in the county along with the historical frequency and volume of courtroom proceedings in the subject facility.
6. Changed circumstances include any developments, conditions, or new facts, which arose after the CFAC’s submission of this report and related Statewide Project List to the Judicial Council, provided that such circumstances bear upon the needs and/or cost criteria contained herein.
7. Any considerations so identified by the Judicial Council shall be described in its submission to the DOF.
16
B. Changes to Statewide Project List
Any additions or deletions to the list of projects shall be adopted by the Judicial Council. The CFAC, the Executive and Planning Committee, or any other council-appointed body with responsibility for advising the Judicial Council on facility matters will review recommended changes to the list.
C. Project Phase Adjustments
The final draft list of project priority groups described above will be reviewed to identify any phased projects. Should the second phase of a multiphase project fall in a higher priority group than its first phase, staff will switch the group assignment of those projects in order to correct the phasing discrepancy. As a result, the first-phase project will move to the higher-priority group, and the second-phase project will take the place of the first in its lower-priority group.
These phasing corrections, if required, will be documented in a report to the Judicial Council that details the results of this methodology’s application.
D. No Substitutions of Projects Between Groups
Substitution of a court’s project between groups will not be allowed.
E. How Requests for Funding Will Be Determined
Based on the Judicial Council’s approved update to the trial court capital-outlay plan and prioritization methodology and five-year infrastructure plan, Facilities Services will prepare documentation to request approval of capital-outlay funding through the Judicial Council–approved budget change proposal process.
This process consists of submission of initial funding requests and budget change proposal concepts for consideration of approval and prioritization through the CFAC and the Judicial Branch Budget Committee, and finally the Judicial Council.
PROCESS FOR ADDING OR DELETING PROJECTS IN THE TRIAL COURT CAPITAL-OUTLAY PLAN
If a court wishes to add or delete projects in the Trial Court Capital-Outlay Plan, the court may submit a written request including the project name; its description including size, number of courtrooms, and type of calendars planned; and other descriptive information about the project. The request shall be presented to the CFAC, which has responsibility for advising the Judicial Council on facility matters for its consideration and direction. At the direction of the Judicial Council, staff will include any changes in the next annual update to the Trial Court Capital-Outlay Plan.

Appendices
State of California
GOVERNMENT CODE
Section 70371.9
70371.9. (a) (1) The Judicial Council shall conduct, or contract with an independent contractor to conduct, a reassessment of those projects identified in its Update to Trial Court Capital-Outlay Plan and Prioritization Methodology adopted on October 24,2008, or the most recent version of that update, if any. Other projects may be included for reassessment at the discretion of Judicial Council. The reassessment shall be submitted to the Senate Committee on Budget and Fiscal Review and the Assembly Committee on Budget by December 31, 2019.
(2) The Judicial Council may exclude from the reassessment those projects that were canceled priorto June 30, 2018, and those that were approved in the Budget Act of 2018.
(b) A project subject to this section shall be reassessed and ranked, at minimum, on each of thefollowing:
(1) The criteria identified in the Update to Trial Court Capital-Outlay Plan and PrioritizationMethodology adopted on October 24, 2008, or the most recent version of that update, if any.
(2) The level of seismic risk, environmental hazards, and other health and safety hazards.
(3) The impact on court users, including, but not limited to, the level of public access to court services,such as accessibility to the courthouse.
(4) The cost avoidance or savings that would be achieved due to the project through operational ororganizational efficiencies created for the court or the state.
(5) Ways to minimize increased ongoing costs, including, but not limited to, trial court security andoperating and maintenance costs.
(6) A comparison of the cost to repair or renovate the existing facility versus the cost of replacement.
(7) The projected cost of each proposed project, per court user.
(8) The total costs spent on the project as of the date of the assessment.
(Added by Stats. 2018, Ch. 45, Sec. 8. (Senate Bill 847) Effective June 27, 2018.)
Appendix A

Terms in Revision of Prioritization Methodology for Trial Court Capital-Outlay ProjectsTERM DEFINITION
1. Access to Court Services
Access to Court Services criterion uses the relative deficiency in judicial resources among the 58 superior courts to measure relative access to current court services. The difference between the AJN and the AJP identifies the relative deficiency in judicial resources or judicial need of a court. The ratio between the judicial need and the AJP defines the relative access to court services: (AJN–AJP)/AJP = Deficiency
2. Assessed Judicial Needs (AJN)
Assessed Judicial Needs (AJN) is the need for judgeships based on the three-year average of filings most recently available. This measure translates current filings into weighted caseload, based on the judicial workload standards adopted by the Judicial Council, and then translates the weighted caseload into an assessment of judgeship needs.
3. Authorized Judicial Position (AJP)
Authorized Judicial Positions (AJP) is the current number of judges, commissioners, and referees authorized under the law for each court. AJP does not account for vacancies or temporary subordinate judicial officers.
4. Composite ScoreFor projects affecting multiple buildings, the proportional share of the court-occupied area of each building will be used to determine each criterion’s rating.
5. Cost-based CriteriaThe four criteria used to determine costs are: Cost Avoidance or Savings; Minimization of Ongoing Costs; Project Cost per Court User; and Total Costs on a Project Spent to Date.
6. Cost per Court User
The Cost per Court User is calculated based on the population of the County and the AJPs for the Court and the number of proposed project courtrooms. This value will be adjusted to compensate for Counties with minimal population that are awarded the statutory minimum AJP of 2.3. Project Costs per Court User = Cost / [County Population x (# Project Courtrooms/Authorized Judicial Positions)]
7. Court Facility Plan
The Court Facility Plan will articulate the optimum approach for use of court facilities for each court and identify projects that address deficiencies in the needs-based criteria. The plan will be the basis for future project requests for new facilities, facility renovations, replacements and/or consolidations, and will include a list of projects. The projects in the plan will be scored using the criteria in the approved methodology.
8. Environmental Hazards
Environmental Hazards include products that contain asbestos or lead or other hazardous materials, such as polychlorinated biphenyls (PCBs), and may be determined based on the age of the building or other existing data.
9. Needs-based Criteria
The five criteria used to determine need are Facility Condition Index, Physical Condition, Security, Overcrowding, and Access to Court Services. Projects to replace or renovate courtrooms in existing High Risk or Very High Risk buildings would receive additional consideration.
10. Normalizing Cost
Normalization of ratings means adjusting values measured on different scales to a notionally common scale. For this methodology, costs will be normalized to compensate for wide variety of court sizes.
11. Overcrowding
The Overcrowding criterion is a measure of the difference between the current area occupied by a court and the area that the court should occupy, according to the California Trial Court Facilities Standards. In this methodology, this criterion is measured by information on the current area compared to current standards.
12. Physical Assessments
Physical Assessments document the physical condition of buildings that house trial court functions. The assessments analyze the building systems and component conditions to determine their remaining useful life and provide the basis for determining a Facility Condition Index (FCI). The FCI is an industry standard asset management methodology that is used to determine a building’s condition at a point in time. Limited strictly to condition, FCIs allow for an equivalent comparative analysis of diverse real estate portfolios.
13. Physical ConditionPhysical Condition includes Seismic, Fire and Life Safety (FLS), Americans with Disabilities Act (ADA) and Environmental Hazards.
14. Priority GroupsProjects will be scored based on need and placed in one of five Priority Groups: Immediate Need, Critical Need, High Need, Medium Need, and Low Need.
15. Security
The security criterion will be used to identify the extent to which judicial/staff circulation paths are separate from those for the public and in-custody individuals; the extent to which in-custody circulation paths are also separate; and the capacity of the building entrance to accommodate security screening.
16. Seismic Rating
Seismic Rating is defined as the score calculated using the Federal Emergency Management Agency (FEMA) P-154 Rapid Visual Screening of Buildings for Potential Seismic Hazards. FEMA P-154 is a procedure to identify and screen buildings that are potentially seismically hazardous.This tool calculates a score based on the building’s structural system, age, visually identifiabledeficiencies, seismicity, and soil type.
17. Trial Court Capital-Outlay Project
Trial court capital-outlay projects are considered those that increase a facility’s gross area, such as a building addition; that substantially renovate a major portion of a facility; that comprise a new facility or an acquisition; or that change the use of a facility, such as the conversion from non-court use to court use.
Page 1 of 1
Appendix B
The Need for New
Judgeships in the
Superior Courts:
2019 Update of the
Judicial Needs
Assessment
REPORT TO THE LEGISLATURE UNDER
GOVERNMENT CODE SECTION
69614(C)(1) & (3)
NOVEMBER 2019
Appendix C
JUDICIAL COUNCIL OF CALIFORNIA
Hon. Tani G. Cantil-Sakauye
Chief Justice of California and
Chair of the Judicial Council
Martin Hoshino
Administrative Director
Judicial Council
OPERATIONS AND PROGRAMS DIVISION
Robert Oyung
Chief Operating Officer
BUSINESS MANAGEMENT SERVICES
Leah Rose-Goodwin
Manager, Office of Court Research
Kristin Greenaway
Supervising Research Analyst, Office of Court Research
Khulan Erdenebaatar
Senior Research Analyst, Office of Court Research
Primary Author of Report
1
This report is an update to The Need for New Judgeships in the Superior Courts: Preliminary
2018 Update of the Judicial Needs Assessment. It is based on new workload measures that were
developed from the 2018 Judicial Workload Study, which was in progress when the preliminary
2018 report was published. The new measures were approved by the Judicial Council at its
meeting on September 24, 2019.
Access to Justice Requires Having Sufficient Judicial Resources
Government Code section 69614(c)(1) requires the Judicial Council to report to the Legislature
and the Governor on or before November 1 of every even-numbered year on the need for new
judgeships in each superior court, using the uniform criteria for the allocation of judgeships
described in Government Code section 69614(b). Government Code section 69614(c)(3) requires
the Judicial Council to report on the status of the conversion of additional subordinate judicial
officer (SJO) positions to family or juvenile assignments.
The public’s right to timely access to justice is contingent on having adequate judicial resources
in every jurisdiction. The number of judgeships authorized and funded by the Legislature has not
kept pace with workload in all California trial courts, leaving some with serious shortfalls—as
high as 57 percent—between the number of judgeships needed and the number that have been
authorized and filled.
Securing resources to meet the workload-based need for new judgeships has been a top priority
for the Judicial Council for many years.
Quantifying the Need for New Judgeships in the Superior Courts
California is a pioneer in the measurement of judicial workload-based need, having been the first
state to use a weighted caseload methodology to assess the need for judicial officers, beginning
in 1963.1 Since then, weighted caseload has become a nationally accepted methodology for
measuring judicial workload. The current methodology used to assess the need for judicial
officers in the superior courts is based on a time study conducted in 2018, in which over 900
judicial officers in 19 courts participated. The time study findings resulted in the development of
a set of caseweights that quantify the amount of case processing time needed for different case
types, taking into account the full range of possible case processing outcomes and their relative
probability of occurrence. The caseweights that resulted from the 2018 time study were approved
by the Judicial Council in September 2019.
The caseweights are used to estimate judicial officer need by multiplying each caseweight by a
three-year rolling average of filings for that case type and dividing by the available time in
minutes that judicial officers have to hear cases. The result is expressed in full-time equivalent
(FTE) judicial positions.
1 Harry O. Lawson and Barbara J. Gletne, Workload Measures in the Court (National Center for State Courts, 1980).

2
Judicial Workload Measures Must be Updated to Reflect Current Case
Processing Need
Periodically, the workload measures that are used to assess workload need must be updated to
reflect changes in the law, technology, or case processing practices. The updated caseweights
approved by the Judicial Council reflect typical case processing times based on the most recent
workload study period and reflect recent changes to judicial workload resulting from legislative
and other policy changes that occurred up through the study period.
Such changes may also affect the practices of the court’s justice partners, which can, in turn,
affect court workload. Although filings have been declining, the workload associated with some
types of filings has increased—because of, for example, the need to hold more hearings and the
increased complexity of cases coming before the court (e.g., increasing mental health and
substance abuse issues, as well as larger numbers of defendants with multiple cases). On the
other hand, judicial workload in other areas not affected by such law and policy changes may
have declined. The net impact of workload increases v. decreases may vary by jurisdiction
depending on each court’s unique mix of cases.
2019 Statewide Judicial Need Shows a Critical Need for New
Judgeships
The 2019 Judicial Needs Assessment shows a shortage of judges relative to the workload needs
in California’s trial courts. Table 1, which summarizes the statewide judicial need compared to
available resources based on a three-year average of filings, from fiscal years 2015–16 through
2017–18, shows that 1,975.5 FTE judicial officers are needed statewide.
Table 1 shows that the total assessed need for judicial officers based on current workload
measures is 1,976 FTE. The Preliminary 2018 Update of the Judicial Needs Assessment findings
are also shown. Differences between the Preliminary 2018 Update and the 2019 Update are
based in part on changes to the workload measures and in part on updated filings data. The needs
assessment is always based on the three most recent years of filings data available—at the time
of the Preliminary 2018 Update, fiscal years 2014–15 through 2016–17. The 2019 Update is
based on filings from fiscal years 2015–16 through 2017–18. Using the most recent filings data
available ensures that the workload assessment is based on the most current data available.

3
Table 1. Statewide Need for Judicial Officers, 2018 (preliminary) and 2019 Judicial Needs
Assessments
Year Authorized Judicial
Positions (AJP)*
Authorized and Funded Judgeships
and Authorized SJO Positions
Assessed Judicial Need (AJN)
2018† (preliminary) 2,004.1 1,956.1 1,929.9
2019 2,004.1 1,956.1 1,975.5
* Includes the 48 judgeships that were authorized by Assembly Bill 159 (Stats. 2007, ch. 722) but never funded or filled. AB 159 originally authorized 50 judgeships, and 2 were funded in 2018 and allocated to the Superior Court of Riverside County. See Stats. 2018, ch. 45, § 6.
Does not include the 25 judgeships authorized and funded by the 2019 Budget Act.
† Preliminary 2018 Update of the Judicial Needs Assessment.
173 Judicial Officers Needed Statewide to Meet Workload Demand
Judicial need is calculated by taking the difference between the assessed judicial need in each
court and the number of authorized/funded positions in each court (shown in Appendix A).
Calculating the statewide need for judgeships is not as simple as subtracting the statewide
number of authorized and funded positions from the statewide assessed judicial need: the net
statewide calculations of judicial need do not accurately identify the court’s need for new
judgeships because judgeships are not allocated at the statewide level but are allocated to
individual trial courts.
By way of illustration, the branch’s smallest courts are statutorily provided with a minimum of
two judgeships and are authorized to have at least 0.3 FTE of a federally funded child support
commissioner, for a total of 2.3 FTE judicial officers. This statutory minimum applies even
though the workload need in those courts may translate to a much smaller number of judge
FTEs. As Appendix A shows, under a pure workload analysis, two of California’s two-judge
courts—Alpine and Sierra Counties—would need only 0.1 and 0.2 FTE judicial officers,
respectively, but have 2.3 FTE authorized positions. These courts thus show a negative number
in the need for new judicial officers. This negative number does not and should not offset the 37
judicial officers that Riverside County needs to meet its workload-based need.
The actual statewide need for new judgeships is calculated by adding the judicial need among
only the courts that have fewer judgeships than their workload demands. Judicial officer FTE
need—the difference between the assessed judicial need and the authorized judicial positions—is
rounded down to the nearest whole number to arrive at the number of judgeships needed for each
court.2 For example, Tulare County has a judicial officer FTE need of 4.7, which rounds down to
4 new judgeships.
2 Per the Judicial Council policy adopted in 2014, an exception is made for courts with judicial FTE need of more
than 0.8, but less than 1.0. For such courts, their actual judicial officer FTE need is reported without any rounding
down. In 2018, there were no courts with judicial officer FTEs in the range of 0.8–1.0. See Judicial Council of Cal.,
Advisory Com. Rep., Judicial Workload Assessment: 2014 Update of Judicial Needs Assessment and Proposed

4
Based on the 2019 Update of the Judicial Needs Assessment, 19 courts need new judgeships, for
a total need of 173 judges (Table 2). A map illustrating judge need is shown in Appendix B. The
need estimate does not include judicial vacancies resulting from retirements, elevations, or other
changes that have not yet been filled.3
Table 2. Need for New Judgeships, by Court
A B C D
Court
Authorized and Funded
Judicial Positions*
2019 Assessed Judicial
Need
Number of Judgeships
Needed†
(B − A)
Percentage Judicial
Need Over AJP (C / A)
Imperial 11.30 12.7 1 12
Humboldt 8.00 9.8 1 22
Lake 4.70 5.9 1 26
Sutter 5.30 6.8 1 29
Tehama 4.33 5.9 1 36
Placer 14.50 17.4 2 20
Madera 9.30 11.4 2 22
Kings 8.60 11.4 2 33
Merced 12.00 15.1 3 26
Shasta 12.00 15.9 3 33
Ventura 33.00 37.7 4 14
Tulare 23.00 27.7 4 20
Stanislaus 24.00 30.0 5 25
San Joaquin 33.50 41.8 8 25
Fresno 49.00 62.2 13 27
Kern 43.00 59.1 16 37
Sacramento 72.50 93.1 20 28
Riverside 80.00 117.3 37 47
San Bernardino 88.00 137.8 49 57
Total
173
* Does not include the 25 judgeships authorized and funded by the 2019 Budget Act.
† Rounded down to the nearest whole number.
Revision to Methodology Used to Prioritize New Judgeships (Nov. 7, 2014), www.courts.ca.gov/documents/jc-
20141212-itemT.pdf.
3 Judicial vacancies are reported monthly at www.courts.ca.gov/15893.htm.

5
Prioritization of New Judgeships
The California Budget Act of 2019 authorized and funded 25 new trial court judgeships upon
adoption of the Judicial Council’s Judicial Needs Assessment.4 Table 3 lists the twelve trial
courts that will be receiving the 25 new judgeships.
The determination of which courts are to receive judgeships is based on the Judicial Council’s
prioritization and ranking methodology, which considers courts with the greatest need relative to
the current complement of judicial officers and the goal to improve access to courts for the
greatest number of users.5 The methodology was first approved by the Judicial Council in 2001
and is codified in Government Code section 69614(b). Appendix C lists the allocation order for
each of the 173 judgeships needed in the California trial courts.
Table 3. Allocation of 25 New Judgeships Approved in Budget Act of 2019
Court Number of New
Judgeships
Fresno 2
Kern 2
Kings 1
Merced 1
Riverside 5
Sacramento 3
San Bernardino 6
San Joaquin 1
Shasta 1
Stanislaus 1
Tulare 1
Ventura 1
Total 25
Status of Conversion of Additional SJO Positions to Family and
Juvenile Assignments
As directed by Government Code section 69614(c)(3), this report also addresses the
implementation of conversions of additional SJO positions (above the 16 authorized per year)
that result in judges being posted to family or juvenile assignments previously held by SJOs.6
Conversions of additional positions were authorized for fiscal year 2011–12 (Gov. Code,
§ 69616), and under this authority 4 SJO positions were converted to judgeships—1 each in the
4 Dept. of Finance, California Budget 2019–20, Summary: Judicial Branch, www.ebudget.ca.gov/2019-
20/pdf/Enacted/BudgetSummary/JudicialBranch.pdf (as of Oct. 9, 2019).
5 Judicial Council of Cal., Staff Rep., Results of statewide assessment of judicial needs including list of
recommended new judgeships (Oct. 26, 2001), www.courts.ca.gov/documents/stateassess.pdf.
6 As authorized by Gov. Code, § 69615(c)(1)(C).

6
superior courts of Alameda (June 2012), Los Angeles (Jan. 2012), Orange (Jan. 2012), and
Sacramento (Mar. 2012) Counties. The courts that converted those positions have confirmed that
those family and juvenile calendars are now presided over by judges.
Conversions of 10 additional positions had been authorized for each fiscal year from 2013–14
through 2017–18 (Gov. Code, §§ 69617–69619.6, respectively), but no additional SJO positions
above the 16 authorized per year were converted under this authority.
Lack of Adequate Judicial Resources Is a Barrier to Access to Justice
The public’s right to timely access to justice should not be contingent on the resource levels in
the county in which they reside or bring their legal disputes. All Californians deserve to have the
proper number of judicial officers for the workload in their jurisdiction. This report highlights
the critical and ongoing need for new judgeships in the superior courts.
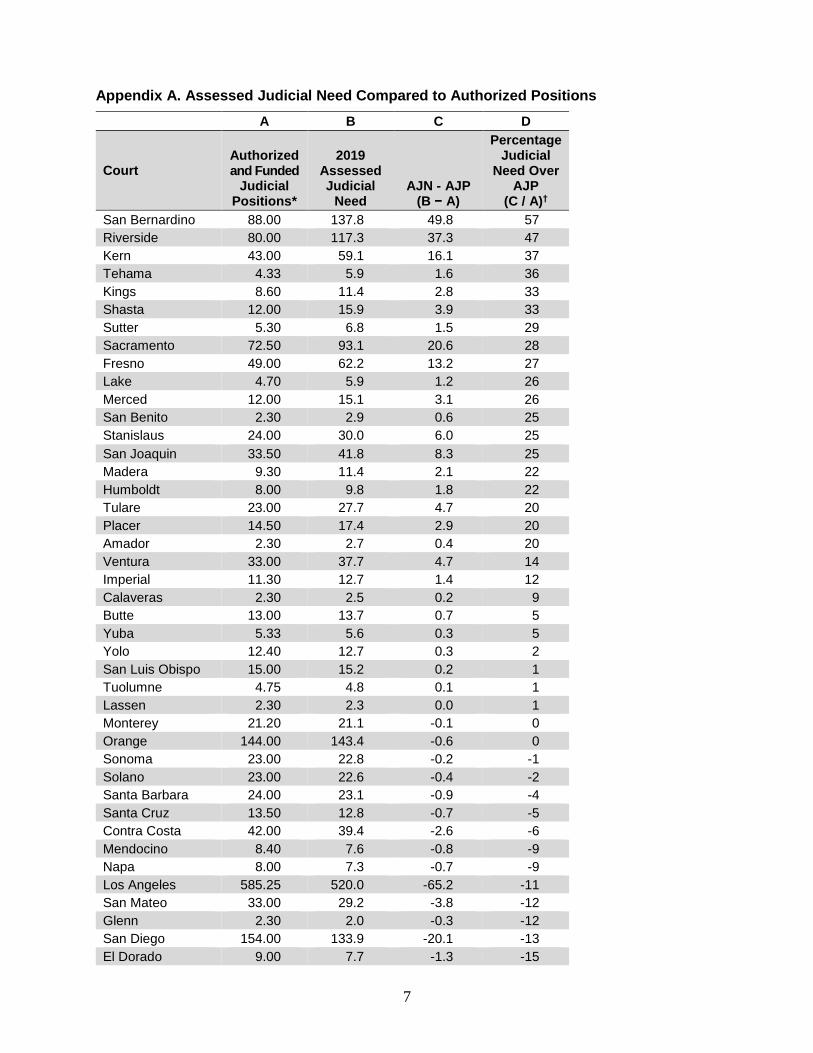
7
Appendix A. Assessed Judicial Need Compared to Authorized Positions
A B C D
Court Authorized and Funded
Judicial Positions*
2019 Assessed Judicial
Need AJN - AJP
(B − A)
Percentage Judicial
Need Over AJP
(C / A)†
San Bernardino 88.00 137.8 49.8 57
Riverside 80.00 117.3 37.3 47
Kern 43.00 59.1 16.1 37
Tehama 4.33 5.9 1.6 36
Kings 8.60 11.4 2.8 33
Shasta 12.00 15.9 3.9 33
Sutter 5.30 6.8 1.5 29
Sacramento 72.50 93.1 20.6 28
Fresno 49.00 62.2 13.2 27
Lake 4.70 5.9 1.2 26
Merced 12.00 15.1 3.1 26
San Benito 2.30 2.9 0.6 25
Stanislaus 24.00 30.0 6.0 25
San Joaquin 33.50 41.8 8.3 25
Madera 9.30 11.4 2.1 22
Humboldt 8.00 9.8 1.8 22
Tulare 23.00 27.7 4.7 20
Placer 14.50 17.4 2.9 20
Amador 2.30 2.7 0.4 20
Ventura 33.00 37.7 4.7 14
Imperial 11.30 12.7 1.4 12
Calaveras 2.30 2.5 0.2 9
Butte 13.00 13.7 0.7 5
Yuba 5.33 5.6 0.3 5
Yolo 12.40 12.7 0.3 2
San Luis Obispo 15.00 15.2 0.2 1
Tuolumne 4.75 4.8 0.1 1
Lassen 2.30 2.3 0.0 1
Monterey 21.20 21.1 -0.1 0
Orange 144.00 143.4 -0.6 0
Sonoma 23.00 22.8 -0.2 -1
Solano 23.00 22.6 -0.4 -2
Santa Barbara 24.00 23.1 -0.9 -4
Santa Cruz 13.50 12.8 -0.7 -5
Contra Costa 42.00 39.4 -2.6 -6
Mendocino 8.40 7.6 -0.8 -9
Napa 8.00 7.3 -0.7 -9
Los Angeles 585.25 520.0 -65.2 -11
San Mateo 33.00 29.2 -3.8 -12
Glenn 2.30 2.0 -0.3 -12
San Diego 154.00 133.9 -20.1 -13
El Dorado 9.00 7.7 -1.3 -15

8
A B C D
Court Authorized and Funded
Judicial Positions*
2019 Assessed Judicial
Need AJN - AJP
(B − A)
Percentage Judicial
Need Over AJP
(C / A)†
Santa Clara 82.00 66.8 -15.2 -19
Del Norte 2.80 2.3 -0.5 -19
Alameda 83.00 65.5 -17.5 -21
Marin 12.70 9.5 -3.2 -25
Colusa 2.30 1.7 -0.6 -26
Siskiyou 5.00 3.6 -1.4 -29
San Francisco 55.90 39.3 -16.6 -30
Inyo 2.30 1.5 -0.8 -33
Trinity 2.30 1.5 -0.8 -33
Nevada 7.60 4.8 -2.8 -36
Plumas 2.30 1.2 -1.1 -46
Mariposa 2.30 1.1 -1.2 -52
Mono 2.30 1.1 -1.2 -53
Modoc 2.30 1.0 -1.3 -58
Sierra 2.30 0.2 -2.1 -90
Alpine 2.30 0.1 -2.2 -95
* Authorized judicial positions (AJP) include both judgeships and subordinate judicial officer positions. Authorized judgeships consist of those codified in Government Code sections 69580–69611 plus the 50 judgeships that were authorized and funded by Senate Bill 56 (Stats. 2006, ch. 390), but not the 48 judgeships that were authorized with AB 159 but never funded. The authorized judicial positions also do not include the 25 judgeships authorized and funded in California Budget Act of 2019.
† Percentages in Appendix A differ slightly from those in table 2, Need for New Judgeships, by Court. Percentages in Appendix A are calculated based on the actual differences between AJN and AJP, whereas the percentages in table 2 are based on rounded-down differences between AJN and AJP, as explained on pages 3.

9
Appendix B. 2019 Judgeship Needs Map: Number of Judges Needed in California Courts
Based on Workload

10
Appendix C. Allocation Order of New Judgeships
Court Alloc. Order
Court Alloc. Order
Court Alloc. Order
Court Alloc. Order
San Bernardino 1 San Bernardino 45 Fresno 89 San Bernardino 133
Riverside 2 Sacramento 46 San Bernardino 90 Riverside 134
San Bernardino 3 Tulare 47 Riverside 91 Fresno 135
Sacramento 4 Kern 48 Kern 92 San Bernardino 136
Kern 5 Fresno 49 Sacramento 93 Riverside 137
Riverside 6 San Joaquin 50 San Bernardino 94 Sacramento 138
Fresno 7 San Bernardino 51 Riverside 95 San Bernardino 139
San Bernardino 8 Imperial 52 San Bernardino 96 Kern 140
San Joaquin 9 Riverside 53 Merced 97 Riverside 141
Riverside 10 San Bernardino 54 Riverside 98 San Bernardino 142
San Bernardino 11 Ventura 55 Fresno 99 San Joaquin 143
Sacramento 12 Kings 56 San Bernardino 100 San Bernardino 144
Kern 13 Sacramento 57 Sacramento 101 Riverside 145
Stanislaus 14 Merced 58 Kern 102 Sacramento 146
Shasta 15 Riverside 59 San Joaquin 103 San Bernardino 147
Riverside 16 Kern 60 Riverside 104 Fresno 148
San Bernardino 17 San Bernardino 61 San Bernardino 105 Riverside 149
Tulare 18 Stanislaus 62 Tulare 106 San Bernardino 150
Fresno 19 Fresno 63 San Bernardino 107 Kern 151
Kings 20 Riverside 64 Sacramento 108 San Bernardino 152
Merced 21 San Bernardino 65 Riverside 109 Sacramento 153
San Bernardino 22 Placer 66 Stanislaus 110 Riverside 154
Ventura 23 Sacramento 67 Kern 111 San Bernardino 155
Sacramento 24 San Joaquin 68 San Bernardino 112 Riverside 156
Riverside 25 Riverside 69 Fresno 113 San Bernardino 157
Kern 26 San Bernardino 70 Riverside 114 Sacramento 158
Placer 27 Kern 71 San Bernardino 115 Riverside 159
San Bernardino 28 San Bernardino 72 Ventura 116 San Bernardino 160
San Joaquin 29 Riverside 73 Sacramento 117 Fresno 161
Tehama 30 Shasta 74 Riverside 118 San Bernardino 162
Madera 31 Fresno 75 San Bernardino 119 Riverside 163
Riverside 32 Sacramento 76 Kern 120 Kern 164
Sutter 33 Tulare 77 San Bernardino 121 San Bernardino 165
San Bernardino 34 San Bernardino 78 Riverside 122 Sacramento 166
Fresno 35 Madera 79 San Joaquin 123 Riverside 167
Humboldt 36 Riverside 80 Fresno 124 San Bernardino 168
Sacramento 37 Kern 81 Sacramento 125 San Bernardino 169
Stanislaus 38 San Bernardino 82 San Bernardino 126 Riverside 170
Kern 39 Stanislaus 83 Riverside 127 San Bernardino 171
Riverside 40 Sacramento 84 San Bernardino 128 Riverside 172
Lake 41 Riverside 85 Riverside 129 San Bernardino 173
San Bernardino 42 Ventura 86 San Bernardino 130
Shasta 43 San Joaquin 87 Kern 131
Riverside 44 San Bernardino 88 Sacramento 132


![APPENDIX I [See Chapter II, paragraph 6] Extracts from ... · [See Chapter II, paragraph 6] Extracts from Government of India (Audit and Accounts) Order, 1936, issued as an order](https://img.pdfslide.us/doc/110x75/5fc2c829a3c8d52a3f083aed/appendix-i-see-chapter-ii-paragraph-6-extracts-from-see-chapter-ii-paragraph.jpg)


![GOVERNMENT OF PUNJAB DEPARTMENT OF LOCAL … · 6. In the said rules, for Appendix 'A', the following Appendix shall be substituted, namely:- "APPENDIX 'A' [see rule 1(3) and 5(2)]](https://img.pdfslide.us/doc/110x75/5f592f0b27618539310fcf52/government-of-punjab-department-of-local-6-in-the-said-rules-for-appendix-a.jpg)