Embed Size (px)
Citation preview
•
..
TECHNICAL REPORT STANDARD TITLE PAGE
1. Report No. 2. Government Ace",,,ion No. I 3. R.e;p; ent' I C .. t .. log No.
FHWA/TX-81/28+228-6 i--4.--=-T-, tI-.-an-d-S-ub-ti---:,I-. ·--.------'--~--------------r-::-5.--:::-Re-p-of-' -=-Oo-'-e ---' .----------:
i Traffic Capacity Through Work Zones on I Urban Freeways
Conrad L. Dudek and Stephen H. Richards
9. Perlo ... "ng 0'9an •• .,IIan Name and Addr ....
April 1981
Research Report: 228-6
10 War" Un.t No.
} I Cont,oct 0' e,a,.t No.
2-18-78-228
Texas Transportation Institute Texas A&r~ University System College Station, Texas 77843
I } l. Typ. al Repor' and P."ad Cove,ed
12. Spon.aring Agency Name and Add,e •• ----------------; Interim Texas State Department of Highways September 1977-April 1981
and Public Transportation Transportation Planning Division 14. Spanao,in; Agency Code
P. O. Box 5050, Austin, Texas 78763 15. Supplementa,y Note.
Research performed in Study Title: Traffic Report Contributi ons:
16. Ab,t,aet
cooperation with DOT, FHWA Management During Urban Freeway Maintenance Operations
Hugo C. Arizpe
This report summarizes f"indings of capacity studies conducted at urban freeway maintenance and construction work zones in Houston and Dallas. Studies were conducted on 5-, 4-, and 3-lane freeway sections. The results indicate that the per lane capacities are affected by the number of lanes open during the roadwork. For example, the average capacity on a 3-lal1e section with 2 lanes open was 1500 vphpl; while the average capacity with 1 lane open was only 1130 vphpl.
The report al so illustrates how the data can be used to estimate the effects of the lane closures in terms of queue length, and thus can be applied to work scheduling.
17. Key Wo,d, Ma i ntenance, Cons truct ion, Work Zones, Capacity, Freeway Operations, Lane Closure, Delay
18. Oi.t, ....... _ Stat __ ,
No restrictions. This document is available to the public through the National Technical Information Service, Springfield, VA 22161
19. Securr,y Clau". (of ,h •• 'etilO,t) 20. Secutt ty Clauif. (of thi. pooe) 21. No. of Page, 22. PnCtO
Unclassified Unclassified
Form DOT F 1700.7 18-U)
I

•

TRAFFIC CAPACITY THROUGH WORK ZONES ON URBAN FREEWAYS
by
Conrad L. Dudek Research Engineer
and
Stephen H. Richards Engineering Research Associate
Research Report 228-6
Traffi c ~1anagement Duri ng Urban Freeway Maintenance Operations
Research Study 2-18-78-228
Sponsored by
State Department of Highways and Public Transportation
In cooperation with the
U. S. Department of Transportation Federal Highway Administration
Texas Transportation Institute The Texas A&M University System
College Station, Texas
April 1981


ACKNOWLEDGMENTS
The authors wish to thank ~1essrs. Hunter Garrison and Larry Galloway
(District 12), and t~ilton Watkins and Henry Grann (District 18) for their
assistance in the conduct of this research. The review comments provided by
IVir. William Ward (Houston Urban Office) and Messrs. Tom Newbern, Heman Haenel,
and Blair Marsden (D-18T) are appreciated. The report was significantly
improved as a result of the reviews of the draft report.
The research direction was guided by a Technical Advisory Committee:
W. R. Brown, Supervisory Maintenance Engineer, D-18M Walter Collier, District Maintenance Engineer, District 15 Billie E. Davis, District Maintenance Engineer, District 2 Milton Dietert, Senior Traffic Engineer, District 15 Larry Galloway, Engineer Technician IV, District 12 Hunter Garrison, District Maintenance Engineer, District 12 Henry Grann, Supervisory Traffic Engineer, Disrict 18 Herman Haenel, Supervisory Traffic Engineer, D-18T Bobby Hodge, Supervisory Traffic Engineer, District 2 Tom Newbern, Traffic Engineer, D-18T Russell G. Taylor, Engineering Technician V, District 14 ~1ilton vJatkins, District Maintenance Engineer, District 18 John Wilder, District Maintenance Engineer, District 14
The contributions of the Committee members are gratefully acknowledged.
The contents of this report reflect the views of the authors who are
responsible for the facts and accuracy of the data presented herein. The
contents do not necessarily reflect the official views or policies of the
Federal Highway Administration. This report does not constitute a standard,
specification, or regulation.
i i

CONTENTS
FREEWAY WORK ZONE CAPACITY • • • • • • • • • • • • • • • • • • • •• 1 Capacity with Work Crew at Site. • • • • • • • • • • • 1 Capacity with No Work Activity at Site ••••• • • • • • •• 6 Shoulder Usage and Traffic Splitting on 3-Lane Section •••• 8
APPLICATION TO WORK SCHEDULIN G AND TRAFFIC CONTROL • • • • • • • •• 9 Estimating Traffic Volumes •••••••••• • • • • •• 9 Estimating Capacity • • • • • • • • • • • • • • • • •• 10 Estimat"ing Queue Length and Del ay ••••••••••••• 11 Example Problem • • • • • • • • • • • • • • • • • • • • •• 13
REFERENCES • . . . . • • • • • . . . APPENDIX A - CAPACITY DATA ••••••
APPENDIX B - METRIC CONVERSION FACTORS
. . . . . . . . . • • • •• 18
. . . . . . . . . . . •• 19
. . . • • • • • • . . . • •• 28
iii

FREEWAY WORK ZONE CAPACITY
This section of the report summarizes findings of capacity studies conducted
at 28 maintenance and construction work zones on freeways in Houston and Dallas.
All of these studies were made at sites where one or more traffic lanes were
closed. A total of 37 studies were conducted at work zones while the work crew
was at the site; 4 studies were conducted w~l"ile the work crew was either not
at the site or not occupying a closed lane directly adjacent to one of the
open lanes.
Capacity with Work Crew at Site
Figure 1 illustrates the range of volumes measured at several worksites
while the work crew was at the site. All volumes were measured while queues
were formed upstream from the lane closures, and thus, essentially represent
either the capacities of the bottlenecks created by the lane closures or the
effects of drivers gawkinq because of the work crew and machinery. Each point
in the Figure represents the volume observed during one study; therefore, it
is easy to view how the data cluster for each lane closure situation.
The designation (A,B) is used in this report to identify the various lane
closure situations evaluated. "A" represents the nurnber of lanes in one
direction during normal operations; "B" is the number of lanes open in one
direction through the work zone.
The average capacity for each closure situation studied is shown in
Table 1. The data show that the average lane capacity for the (3,2) and (4,2)
combinations was approximately 1500 vehicles per hour per lane (vphpl).
The studies conducted at worksites with (5,2) and (2,1) closure situa
tions indicate significant reductions in capacity (compared to 1500 vphpl).
The average capacity for these two situations was approximately 1350 vphpl. 1

• 3 Lanes - 1 Open
• • • •
2 Lanes - 1 Open - •••• •
5 Lanes - 2 Open • • •• 1 •
4 Lanes - 2 Open • •• •
....-____________ -.3 Lanes - 2 Open • Volume observed in one study .. • .. • •
- Range of observed volumes
4 Lanes - 3 Open --a.
1000 1100 1200 1300 1400 1500 1600 1700
Capaci.ty, Vehi cl es/Hour/Lane
Figure 1. Range of Observed Work Zone Capacities for Each Lane Closure Situation Studied (Work Crew at Site)
2
1800

TABLE 1. MEASURED WORK ZONE CAPACITY
Number of Lanes Number Average Capac; ty of
Normal Open Stud; es vph vphpl
3 1 5 1130 1130
2 1 8 1340 1340
5 2 8 2740 1370
4 2 4 2960 1480
3 2 8 3000 1500
4 3 4 4560 1520
3

Studies at (3,1) sites revealed even a greater reduction in capacity.
The average capacity was fourid to be orily 1130 vphpl.
Figure 2 shows the cumulative distr"ibutions of the observed work zone
capacities. The function of the Figure is to assist the users in identi
fying risks in using certain capacity values for a given lane closure situa
tion to estimate the effects of the lane closures (e.g., queue lengths).
For example, the 85th percentile for the (3,1) situation is 1020 vphpl.
This means that 85% of the studies conducted on 3-lane freeway sections with
1 lane open through the work zone resulted in capacity flows equal to or
greater than 1020 vphpl. The capaci ty flow was equal to or greater than
1330 vphpl in only 20% of the cases studied. Thus, to assume a capacity of
1500 vphpl for (3,1) work zones would tend to underestimate the length of
queues caused by the lane reduction at the vast majority of these work zones.
Because of the limited amount of data, no attempt was made to statis
tically correlate capacity to the type of road work. However, results of
individual studies summarized by type of work are presented in the Appendix.
The material in the Appendix indicate that there are characteristics at each
works ite that affect the flow through the work zone. Presence of on-ramps
and off-ramps, grades, alinement, percentage of trucks, etc., also affect the
flow. These factors were not evaluated in the studies performed as part of
this research.
It is also interesting to note that, even at the same site, there were
variations in maximum flow rate. Work activities (e.g., personnel adjacent
to an open traffic lane, trucks moving into and out of the closed lanes, etc.)
caused these variations.
4

Q)"'O ~Q)t:: Q) ~ Q) .s::~> ~ ~o..-til 0-° ~wQ)
(}1 0..- >,::::1 1Jtl.f-J';O 4-.~ > o ~"'O Q) to Q) O"IU "'0 to Q)
.f-J"'OQ) t::Q)U Q)~X U::::I W ~tIl~
~~o :::E
100 I '\. \
\ \ 85
80
60
40
\
\
Note: Parentheses figures indicate (no. of original lanes, no. of open lanes)
\\ (4,3)
\\ \
-------------i-----------------~1\ 20 ~ \
900 1000 1100 1200 1300
\ \
1400 1500
Capacity, Vehicles/Hour/Lane
1600 1700
Figure 2. Cumulative Distribution of Observed Work Zone Capacities

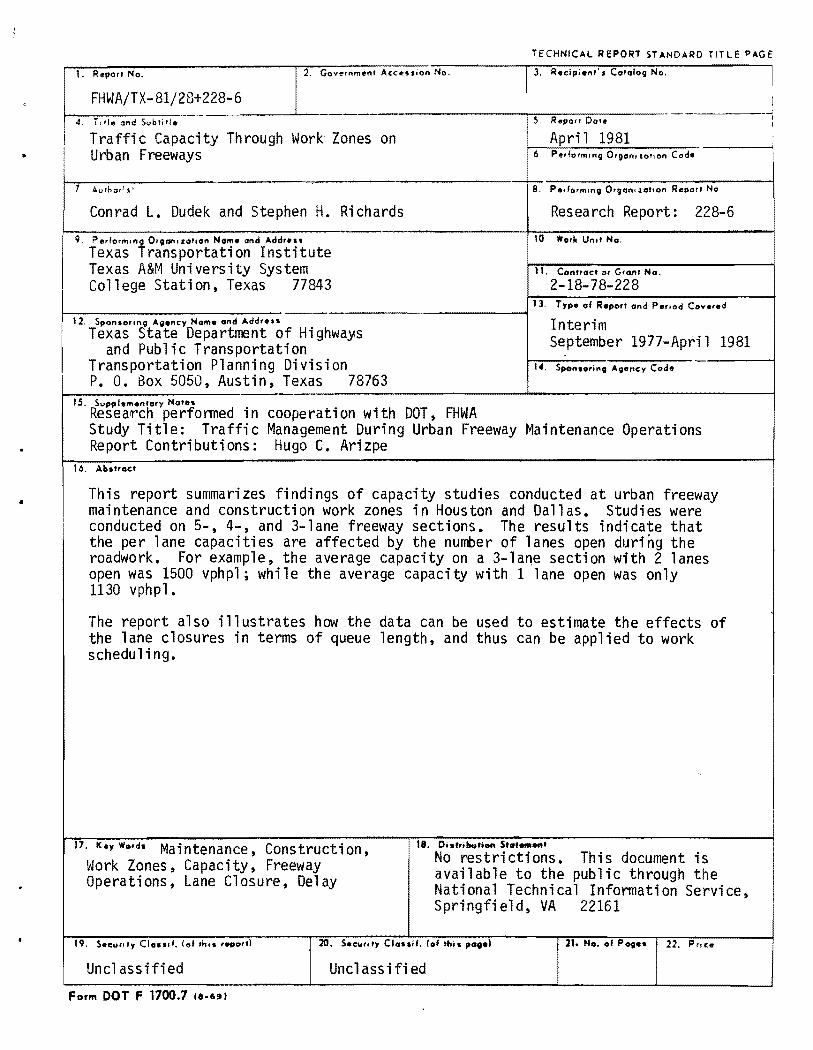
Table 2 is an atternpt to summarize typical capacities observed in
California by Kermode and Myra (1) and those observed in Texas by TTl. The
California data represent expanded hourly flow rates, whereas most of the Texas
data are full hour counts. The reader is cautioned that the typical capacities
by type of work zone shown in Table 2 for Texas freeways are based on limited
data. A summary of these data is contained in the Appendix. The amount of
data used to develop capacity rates for California was not indicated (1).
Capacity with No Work Activity at Site
Three studies were conducted at construction sites during the peak period
while the work crew was not at the site. These studies were conducted in
Houston on a 3-lane section of southbound 1-45. Two lanes were open during the
studies. The average capacity for this (3,2) lane closure situation was
1800 vphpl.
One study was conducted on the north 1-610 Loop "in Houston. The right
two lanes of a 4-lane section were closed. There was no work activity in the
closed lane immediately adjacent to traffic. A work crew and their machinery
did occupy the shoulder lane, however, which was one lane removed from moving ~
traffic. The volumes measured on the two open lanes over a period of 30 min-
utes were as follows: 926 vehicles in the lane adjacent to the closure and
730 vehicles in the median lane. These 30-minute volumes are equivalent to
flow rates of 1850 vph and 1475 vph. It was apparent from field observations
that the demand volumes were lower than the capacity of the two open lanes.
Queues did not form upstream from the work activity or the cone taper. There
was available capacity "in the median lane. The work crew (one lane away from
an open traffic lane) did not affect flow thru the work zone. It is estimated
6
•
-......J
TABLE 2. SUMMARY OF CAPACITY FOR SOME TYPICAL OPERATIONS*
Number of lanes one direction (Normal Operation)
Number of lanes open one direction (During Work)
Type of vJork • Median barrier/guardrail repair or
installation
• Pavement repair
• Resurfacing, asphalt removal
• Striping, sl ide removal
• Pavement markers
• Bridge repair
3
1
N/A
1050 vph
1050 vph
2
1
1500 vph
1400 vph
1200 vph 1300 vph
N/A 1200 vph
N/A 1100 vph
1350 vph 1350 vph
5
2
N/A
N/A
2750 vph
N/A
N/A
N/A
3 or 4
2
3200 vph 2940 vph
3000 vph 2900 vph
2600 vph 2900 vph
4
3
4800 vph 4570 vph
4500 vph
4000 vph
2600 vph 4000 vph
2400 vph 3600 vph
2200 vph 3400 vph
* Volumes not italicized represent capacity rates observed in California (Reference 1) Italicized volumes represent average capacities observed in Texas N/A = Not Available

that the capacity of the two open lanes under the above-cited conditions was
about 1800 vphpl. This volume could probably be sustained as long as queues
do not form.
Shoulder Usage and Traffic Splitting on 3-Lane Section
Generally, when maintenance work is required on the middle lane of a
3-lane section, both the middle lane and one of the exterior lanes are closed.
Table 2 indicates that the average capacity on the open lane may be between
1050 and 1350 vph depending on the type of road work. Results summarized in
an earlier report (~) indicated that the capacity could be increased to
3000 vph by using a traffic control approach called IIshiftingll whereby drivers
are encouraged to use the shoulder as an additional travel lane. In effect,
two lanes are open to traffic.
The report also indicates that the capacity could be increased to approxi
mately 3000 vph by using a traffic "splitting" approach. In this approach the
middle lane is closed and traffic is allowed to travel on both sides of the
work activity. It is important, however, that the lane closure technique
recommended in Reference 2 be used to implement the "splitting" approach.
Otherwise, considerable driver confusion could take place. The technique
involves closing the left lane far upstream from the work area so that only two
lanes of traffic enter the split area. Traffic is then "funneled" and split
using cones--one lane to the left, and the other to the right.
8

APPLICATION TO WORK SCHEDULING AND TRAFFIC CONTROL
Maintenance work on urban freeways, even if performed during off-peak
periods, can result in serious congestion and motorist delay. With increas
ing pressures from the motoring public to maintain acceptable levels of service
on urban freeways, it is "irnportant to analyze the potential impacts of a lane
closure in order to schedule the work during periods when the congestion
would be minimized and/or select the most effective alternative traffic
control techniques.
This portion of the report illustrates how the capacity study findings
can be applied to assist the ~sers in making decisions about scheduling
freeway maintenance. It discusses the requirements and procedures for
making estimates of traffic volumes and capacities.
Estimating Traffic Volumes
Work zone volumes are usually estimated from data routinely supplied by
automatic traffic counters installed at permanent locations. It is important
that current hourly volumes be used to estimate the potential impacts of a
lane closure. Volume maps showing ADTs are not adequate for this purpose.
Hourly traffic volumes recorded by the automatic counters during the previous
two weeks on the same day of the week as the scheduled work will provide
reasonable estimates of traffic demands.
Anticipated demand volumes at a work zone can also be estimated with good
accuracy by making an on-site traffic count (manned or machine) one or two
days prior to the work activity. The cost and time involved in conducting
these type special counts, however, restrict the use of this approach to
IIspecial cases. 1I
9

Hourly traffic volume data from permanent counters are readily available
to most users; howevever, there are some limitations in using the data. One
limitation is that the permanent count data may not provide an accurate esti
mate of work zone traffic volumes. Many freeway maintenance sites are a con
siderable distance from a permanent counter. The volumes recorded at the count
stations can differ greatly from those at the worksite, especially when there
are severaJ ramps between the count station and work zone. Traffic volumes on
a radial freeway, for example, may be much higher near the CBD compared to the
outskirts of the city. If the permanent counter is located near the city limits,
then the traffic volumes at a work zone near the CBD may be underestimated. In
this case, the congestion may be somewhat more severe than estimated.
It should be apparent from this discussion that there may be significant
problems and inaccuracies in using existing permanent counter data to estimate
work zone volumes. However, until new urban freeway counting programs are
developed and implemented, permanent counter data are probably the most practical.
The problem of estimating traffic demands at work zones is compounded by
the phenomenon of natural diversion. When encountering unusual congestion on
an urban freeway during the off-peak periods, many familiar drivers will leave
the freeway and travel on the frontage road to bypass the congestion or seek
alternate routes to their destinations (l,±). The extent of this natural
diversion is difficult to predict.
Estimating Capacity
Previously, 1500 vphpl was a conmon value used by many traffic control
planning analysts to estimate the flow through work zones. The capacity data
presented in the preceding chapter, however, provide better insight into
10

typical capacities at work zones on Texas freeways. For example, a review of
Figure 2 suggests that using a work zone capacity of 1500 vphpl for a (4,3),
(4,2), and (3,2) lane closure situation may not be too critical. However,
this value seems too high for estimating the impacts of the (3,1), (2,1), and
(5,2) closure situations.
As previously discussed, the cumulative distributions of observed work
zone capacities shown in Figure 2 can be used to identify risks associated
with using certain capacity values for a given lane closure situation to
estimate the effects of the lane closures (e.g., queue lengths).
Estimating Queue Length and Delay
The delays associated with stop-and-go driving which occur at work zones
involving a lane closure are the result of a lack of capacity. These work
zones, which have insufficient capacity to handle demand, are analogous to a
sand hourglass. The neck of the hourglass can handle only so much sand, and
there is nothing the excess sand on top can do but wait. When traffic demand
at a work zone exceeds the capacity of the work zone, vehicles begin to stack
up at the lane closure taper to wait their turn to pass through the work area.
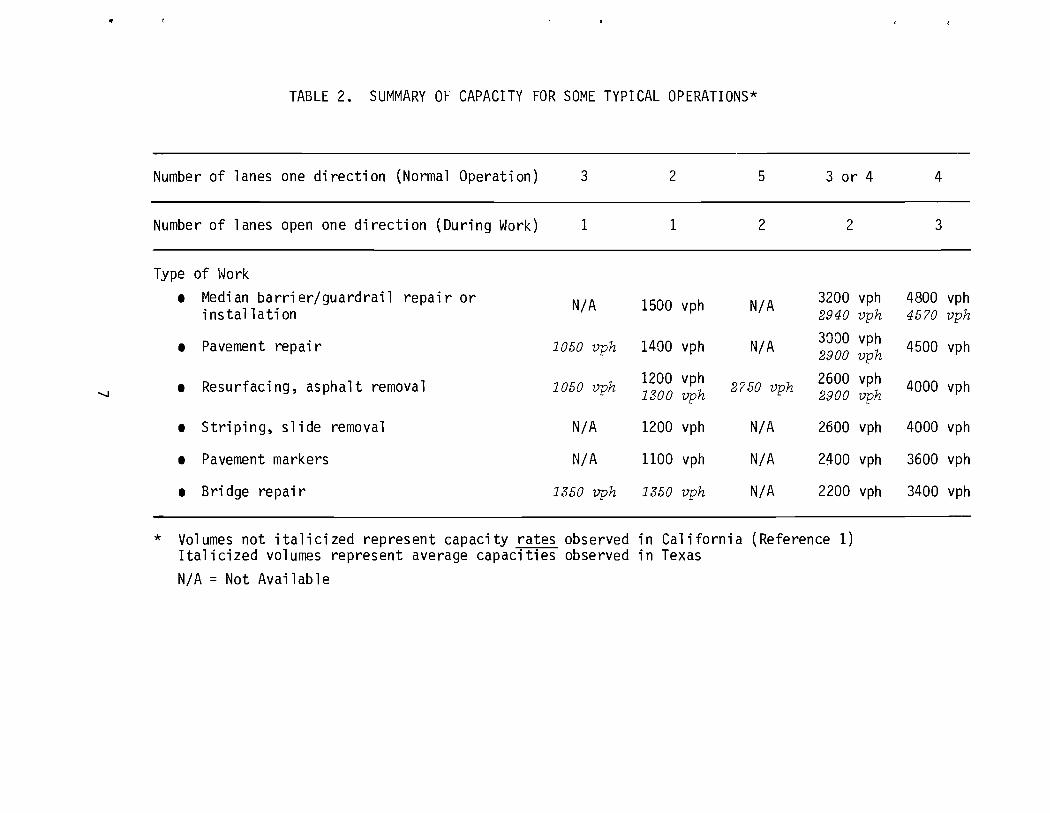
Figure 3 is a simple graphical procedure that can be used to roughly
estimate queue 1 ength and delays at work zones. These estoimates are obtai ned
by plotting the cumulative demand volumes and the cumulative service volumes
(capacity) versus time. As illustrated, the number of vehicles stored (or
queued) and individual vehicle delay at any given time can be estimated.
The length of traffic backup or queue length can be roughly estimated
using the following relationshtp:
11
III <l)
.--u
...s::: <l)
::::-4-o s...
~ ..0 ::::l
Z
<l) >
Number of Vehicles Backed up
(In Queue) at Time t
Delay Experienced by a Vehicle Driving
Demand Vo 1 ume _
t Time
at Time t
Service Volume (Capacity) During Lane Closure
t End of Work
Figure 3. Graphical Procedure for Estimating Queue Length and Delays at Work Zones
12

Where: Lt = Estimated length of backup (queue length in feet) at time t
Qt = Est-imated nurnber of vehicles in the queue at time t
N = Number of open lanes upstream from 'Iane closure
l = Average space occupied by a vehicle in the queue ( use .t = 40 ft.)
Examr:>le Problem
Figures 2 and 3 and Tables 1 and 2 present information to assist the
users in making decisions related to scheduling maintenance. The following
example demonstrates how the information may be used:
Assume maintenance work must occupy a 3-lane freeway section. The work
will require that the median lane be closed as shown in the sketch below •
•
//
The work will require approx-imately four hours to complete. This incl udes
the t-ime required to install and remove traffic control devices. Data
obtained from a nearby permanent counter during the previous two weeks
was used to estimate the following demand volumes:
13

Time Volume Anticipated (vph)
9-10 am 2920 10-11 am 3120 11-12 am 3200 12- 1 pm 3500 1- 2 pm 3830 2- 3 pm 3940 3- 4 pm 4620 4- 5 pm 5520
It should be noted at this point that any estimates of the queue length
and vehicle delays, using the procedure shown in Figure 3, will be influenced
by the accuracy of the demand volume data. The estimates are also greatly
influenced by assumed work zone capacity. The consequences of using different
capacity estimates are explored in this example problem.
Referring back to Table 1 and Figure 2, it is seen that the average
capacity for the (3,2) lane closure situations studied was 1500 vphpl or
3000 vph~ The 85th percentile ~as 1450 vphpl or 2900 vph; and the 100th
percentile was. 1420 vphpl' or 2840 vph·. Assuming these capacities (3000 vph,
2900 vph, 2840 vph), the graphical technique discussed earlier has been used
to estimate the resulting queue lengths and delays (see Figure 4).
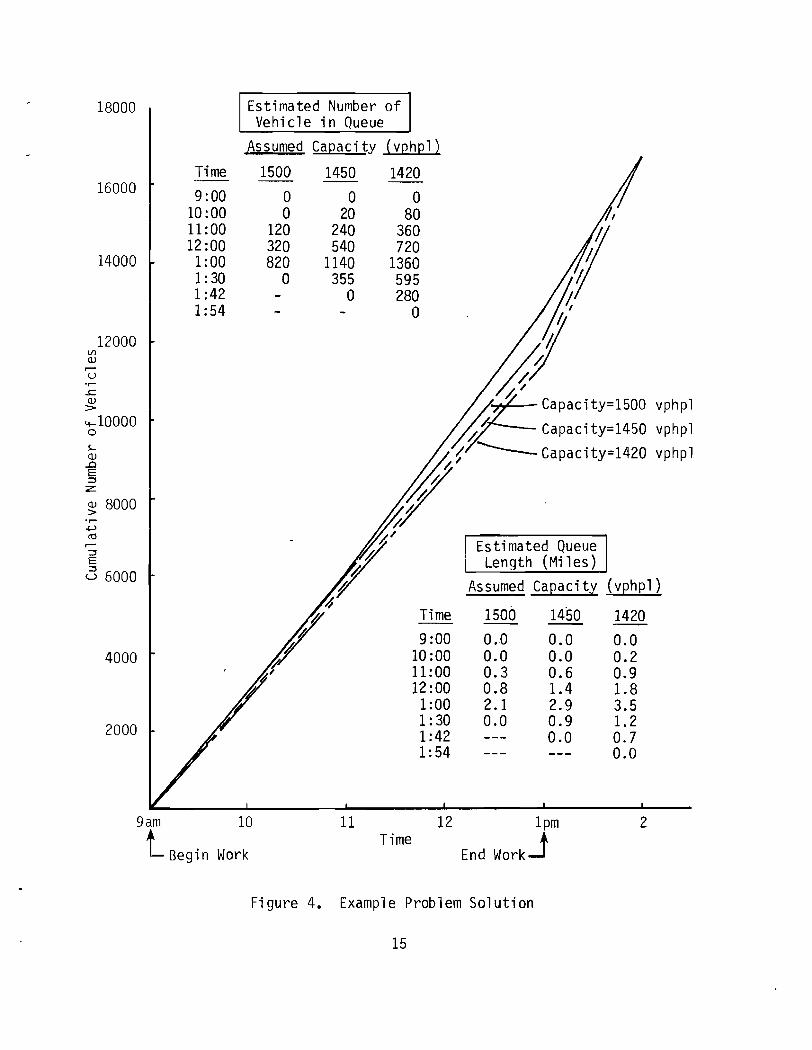
In Figure 4, the work is assumed to begin at 9 am. The estimated queue
length at 1pm, after 4 hours of maintenance work and assuming a capacity of
3000 vph, is 2.1 miles. The estimate using 2900 vph is 2.9 miles, almost one
mile longer; and the estimate using 2840 vph is 3.5 miles, about 1.5 miles longer.
Therefore, the capacity value is a very sens iti ve parameter when queue 1 ength
is estimated.
"'- Fi gure 2 shows that the average capacity value of 3000 vph (1500 vphpl)
is at the 60th percentile. This means that based on the data collected to date,
there is a 40% chance that the actual capacity may be lower than 3000 vph and
14
til OJ r-U 'r-.c OJ :>
18000
16000
14000
12000
4-10000 o s... OJ .0 E :::::s :z:
~ 8000 'r-+-' ro r-
:::::s E
c3 6000
4000
2000
Time
9:00 10:00 11 :00 12:00 1:00 1: 30 1:42 1 :54
Estimated Number of Vehicle in Queue
Assumed Capacity
1500
o o
120 320 820
o
/ r ~
1450
o 20
240 540
1140 355
o
'q
(vphpl)
1420
o 80
360 720
1360 595 280
o
Time 9:00
10 :00 11:00 12:00 1:00 1: 30 1:42 1:54
?,
if ;I'~ Capacity=1500 vphpl
~~ Capacity=1450 vphpl
Estimated Queue Length (Miles)
Assumed Capacity (vphpl)
1500
0.0 0.0 0.3 0.8 2.1 0.0
1450
0.0 0.0 0.6 1.4 2.9 0.9 0.0
1420
0.0 0.2 0.9 1.8 3.5 1.2 0.7 0.0
gam 10
l Begin Work
11 12 Ipm 2 Time
End workJ
Figure 4. Example Problem Solution
15

thus, the queue length longer than 2.1 miles. Likewise, there is only a 15%
chance that the traffic will back up farther than 2.9 miles, assuming the
maintenance work took 4 hours to complete. These estimates should be helpful
in deciding where to place the advance signs for the work zone.
It should be apparent that stop-and-go traffic extending for 2.9 miles
would be very undesirable. Thus, other options should be explored, for
example the following:
1. Perform the work on a Saturday or Sunday when the volumes are lower.
2. Perform the work at night.
3. Reduce the work time or split the work into two shifts.
4. Implement additional traffic control strategies.
Curves similar to those shown in Figure 4 can be developed for weekend or
nighttime work. It is not the intent of this report to discuss the merits or
problems of performing road work during these times. However, it sufficies
to say that the lower volumes associated with these time periods will result
in reduced congestion.
A review of Figure 4 indicates that, if the work could be completed within
3 hours or less, the amount of congestion would be greatly reduced. Assuming
a capacity of 3000 vph, the queue would extend an estimated 0.8 mile upstream
from the lane closure, and with a capacity of 2900 vph (85th percentile), the
queue would not extend more than 1.4 mile. If the work could be divided into
two 2-hour periods from 9-11 am on two separate days, then the expected queue
length would be greatly reduced to approximately 0.5 m"ile (assuming comparable
volumes both days).
Another option would be to implement additional traffic control strategies.
These might include entrance ramp closure and shoulder usage. Each of these
strategies should be evaluated for their merits before implementation.
16
Closing entrance ramps at and upstream from a work zone may possibly
reduce the traffic demands and greatly reduce queues such that work could be
performed for four continuous hours. Decisions concerning entrance ramp
closures including the time of closures should be based on the anticipated
freeway and entrance ramp traffic demands and the available capacity on the
alternate route (e.g., frontage road, arterial streets). Ramps should be
closed when the combination of the freeway and ramp volumes exceeds the work
zone capacity and there is available capacity on the alternate route. The
ramps should remain open when the traffic demands are less than the work
zone capacity. In the example problem, for example, the entrance ramps
should not be closed until approximately 10 am even though the maintenance
begins at 9 am. Closing ramps when available capacity still exists on the
freeway promotes driver discontent and may create unnecessary operational
problems on other facilities (e.g., frontage roads, arterial streets, etc.).
Ramp closure techniques are discussed in Reference 5. Provisions should be
made to achieve improved signal coordination on the frontage road whenever
ramps are closed.
Allowing traffic to use the shoulder is another way to increase work
zone capacity. Up to 1500 vph additional vehicles can be accommodated by
using the shoulder. Traffic control details for shoulder usage are presented
in Reference 2.
17


RE FERENCES
1. R. H. Kermode and W. A. Myra. Freeway Lane Closures. Traffic Engineering. February 1970.
2. C. L. Dudek and S. H. Richards. Traffic Management for Middle Lane Maintenance on Urban Freeways. Texas Transportation Institute. Report No. FHWA/TX-80/3+228-2. March 1980.
3. J. M. Turner, C. L. Dudek and J. D. Carvell. Real-Time Diversion of Freeway Traffic During Maintenance Operations. Transportation Research Record 683, 1978.
4. C. L. Dudek, W. R. Stockton, and D. R. Hatcher. San Antonio Motorist Information and Diversion System. Texas Transportation Institute. Report No. FHWA-RD-81/018. December 1980
5. S. H. Richards and C. L. Dudek. Special Traffic Management Requirements for Ma"intenance Work Zones on Urban Freeways. Texas Transportation Institute. Report No. FHWA/TX-81/ 228-8. June 1981.
18


APPENDIX A CAPACITY DATA
19


Number of Lanes - One Direction: 2 (Normal Operations)
Number of Lanes Open - One Direction: 1
Nature of I Side I Site Flow in Open Lanes Study Total Avg per Lane Peri od I Site Plan
Work Closed No. (vph) (vph) (
... R 1 1390 1390 60 I ... ..
Bridge R 1 1260 1260 60 Repa; r
R 1 1265 1265 25
N 0
I R 2 1350 1350 25
Bri dge I 1380 1380 60 I .. f' ..., _
Repai r R 2 tl.~A ____ ~-=-_ ..
R 2 1440 1440 60
L 3 1370 1370 60 Asphalt
.. Removal
.. .. L 3 1270 1270 45 ~'\. h~," 7// ,,~
... Locati on of capaci ty study

N .....
Number of Lanes - One Direction: 3 (Normal Operations)
Number of Lanes Open - One Direction: 1
Nature of I Side I Si te I Work Closed No.
Patch Overlay
and IResurfacing.
Bridge Repai r
L 4
L 5
R 6
L 7
R 8
Flow in Open Lanes Total Avg per Lane (vph) (vph)
1180 1180
1090 1090
990 990
1050 1050
1330 1330
Study Periodl (mi n.)
75
60
90
35
60
Site Plan
~ :..--:..- :..-~ #/ :21/ ...
:..-- ·~_t'hullunlll _ • 4$ Mil ~ __ • :.; .II1II _ _ :..--
- / Lane Drop :..-;:r' ...
:..--:..--:..-
.:..-:..- :..-
--......~;avo #~ ::?~
:..-:..-
2 dE
\ .

N N
Nature of Work
Patch and
Overlay
Side Site Closed No.
L 9
L 10
L 11
L 11
L 12
R 13
Number of Lanes - One Direction: 3 (Normal Operations)
Number of Lanes Open - One Direction: 2
Flow in Open Lanes Study Total Avg per Lane Peri od Site Plan (vph) (vph) (mi n.)
:. 'R _~~~'::. '..,>~ ",~.~. ' •• =.;<. ~.?PfoLW{~¥~>!~~¥-l'fi:;\¥M§:tVI~! 3140 1570 90 • •
~ /~ /~
~ ~
3020 1510 115 ~
''4§_ j C2 dU£J~i1&_lM • - - - - - -•
3010 1505 60 • > £4& % 2 1£ • aWifiiMhJt%iit_R • .- - - - _.- -• • 2880 1440 60 ~" .~
• cl4?Jii::aUi @_MMWJ£LQ 2850 1425 60 • • - - - - - -• • jl ~ (
• • - - ~ .- - - - • 3180 1590 35 - -~. ,'W'wh"A ~mi • • i@ W :;.Yo" •• :- ...... :'. "
~ ...

N W
Nature of Work
Shoulder Repai r
Freeway Widening
Side Si te Closed No.
l 14
R 15
Number of lanes - One Direction: 3 (Normal Operations)
Number of lanes Open - One Direction: 2
Flow in Open lanes Study Site Plan Total Avg per lane Period
(vph) ( vph) (mi n.)
, ~ • ,zs;~~~~l}1tt.~$l£Wk*&4.*.$Bt.tJiMjitiWRfM
1480 100 ~ ~ - -2960 - - - -~ ~
~"
~- ~ - - - - -~ ~
3000 1500 65 l ···-:r:·'··'~:·'%*WMkt*i:y1i±:j;4)i"$'¥-?~~);;::'&:~r -~ , ~/

Number of Lanes - One Direction: 3 (Normal Operations) ---
Number of Lanes Open - One Direction: f
Flow in Open Lanes Study Total Avg per Lane Period (vph) (vph) (minJ
Nature of I Side I Si te Work Closed No. Site Plan
CAPACITY WITH NO WORK ACTIVITY AT SITE
.,... Pavement
t 16 3560 1780 50 I
.,... L .,... .,...
Repai r :#/ "'''' I I N Freeway ..j:.l> Widening 17 3640 1820 45 I
... ... R -(Work ... .,... Vehi c1 es ... not in R 17 3660 1830 120
Adj acent

N (J1
N a tu re 0 f IS; de IS; te Work Closed No.
Pavement Repai r
Resurfaci ng
Bridge Pylon
onstructi 0
Concrete Medi an Barrier
nstallatio
R
R
L
L
18
19
20
21
Number of Lanes - One Direction: 4 (Normal Operations) -
Nunber of Lanes Open - One Di recti on: ___o;;;.2_
FloYI in Open Lanes Study· Total AV9per Lane Period (vph) I {vph) (min.)
Site Plan
2840 1420 45
2960 1480 60
3100 1550 60 ~- -~ ~- -,t"~ /P'y 7, 7~ ..
2940 1470 80 ..

Nature of I Side I Si te Work Closed No.
L ,I 22
L I 24
L I 24
•
Number of Lanes - One Direction: 4 (Normal Operations) ---
Number of Lanes Open - One Direction: ~
Flov, in Open Lanes Study Total Avg per Lane Period (vph) (vph)
4590 1530 45
.. ... ... ..
Site Pl an
...' ... ... ~, A;r--
4590 1530 75
4470 1490 75
... ... ... ... ... ... ...
A

Number of Lanes - One Direction: 5 (Normal Operations)
Number of Lanes Open - One Direction: 2
Nature of I Side I Site Flow in Open Lanes Study Total Avg per Lane Periodl Site Pl an Work Closed No. {vph} (vph) {min.}
L 25 2760 1380 60 Aspha It L 25 2680 1340 60 Removal
L 25 2620 1310 60
Aspha It I L 26 2740 1370 60 I :; ...... Remova 1 :- "'=" .. -. ....., ..... _ .... -.... . .• :- .. ~ IResurfacingl L 26 2720 1360 60 I ~" - :»~" -.. #/ )10.-
Resurfacing I L 27 2760 1380 60
R 28 2760 1380 60
Resurfacing R 28 2900 1450 50
,.
N CO
METR IC CONV ERSION FACTORS
Symbol
in It 'I'd mi
ln1
It' 'I'd' mil
oz Ib
up Tbsp II 01
c p\ q \ 9.1 It ' 'I'd '
OF
Approx imate Conversions to Motric Measures
When You Know
inches f.,.,\ Y',ds milM
square i1l<:hel sqUire f eet Iq u.r. Vardl squi re m ilM .crllS
ouneM paunch sho,t tons
(20001bl
t""spoons t.ble$poons fl uid ounces cups pints quart, 9allo ns cubIC fllllt cubic y~,ds
Multiplv by
LENGTH
· 2 .5 30
0 .9 1 .6
AREA
6.5 0.09 0.8 2.6 0.4
MASS (weight)
28 0.45 0 .9
VOLUME
5 15 30
0 .24 0 .47 0 .95 3 .8 0.03 0 .76
To Find
cent imeters centi meten moters kilo meters
sq~rll centimete ... square metttn square ineten sqUllr .. kilometers hectares
grilms k ilov rllmt tonn8S
millil it~
mill ilite" mi ll iliters lit ers liters lite" liters cub ic mete" cubic meters
TEMPERATUR E (exact)
Fahrenheit t .. mper.ture
5/9 (after subtrlctin; 321
Celsius temper.tur.
Symbol
em em m km
em' m' m' km' ha
g kg
ml ml ml I
m' m'
°c
<D
CD
~~
-cr>
g\
,.
""
.... -
5' So s
. , in • 2 .54 (ex.ctly l. For o lher e".ct con"elSions .nd mor e det.iled tables. see NBS Misc. Pub!. 286. Uniu of Weighlland Menures. 'Price $2.25 . SO <:'1.log No. Ct3.10;286.
= ==
==
('l N
N N
~
N
o N
(II
co
~
II)
~ ., COl
N
... ... o .... CII
CID
" <II
It!
., COl
N =---~-= e = u
Symbol
mm em m m k m
em' m' km' he
g kg
ml I I
m' m'
°c
Approximate Conversions from Metric Measures
When You Know
millimeters eenti meten met ....
mel .. ' kilometttrs
square centimeter, square m.,e" squlIr. kilometer, heel .... (10.000 m' )
Multiply by
LENGTH
0.04 0.4 3.3 1.1 0.6
AREA
0 .16 1 .2 0.4 2 .5
MASS (weight)
gr.m, kilogram, tonnes (1000 kg)
milliliters (iter, liters lit ... cubic meters cub ic meters
0 .0 35 2.2 1. 1
VOLUME
0 .03 2.1 1.06 0.26
35 1.3
To Find
Inch •• inch .. feet yard. mil ..
square inches squa,e ya rd. squ.r. miles acres
ounce, pounds short 10,\$
fl u id ounces pinu quaru ~!lon s
cub ic I .... , cubi c y~ ,ds
TEMPERATURE (exact)
Celsius temper alure
9/5 (then add 3 21
F~hrenh.il
temper~tur.
o OF F 32 98.6 21 2
-4f I I , ?, I '\ ~ I ' 8.0 I I " ~O, I " ~ ! , ?~ ~ i " i t" I 1 I
-40 -20 0 20 40 60 80 100 °c 37 °c
Symbol
in in It yd mi
in ' yd' mi'
01
Ib
fI oz pt qt lIal fI' Vd '
OF

•
•


![rss~'Dce- a.,]) R.e-1ssu1](https://img.pdfslide.us/doc/110x75/5f8f63b590e69168e30c6c5c/rssdce-a-re-1ssu1.jpg)