Embed Size (px)
Citation preview
TAX EQUITY ANALYSIS
FOR THE
CITY OF BERKELEY LAKE, GEORGIA
APRIL 2011
OBJECTIVES
• To provide a detailed review of all services delivered
by the City, including but not limited to the proposed
restoration of the Lake Berkeley dam
• To recommend viable options for offering equitable • To recommend viable options for offering equitable
fees, tax levies and/or service delivery assessments
DATA REVIEWED
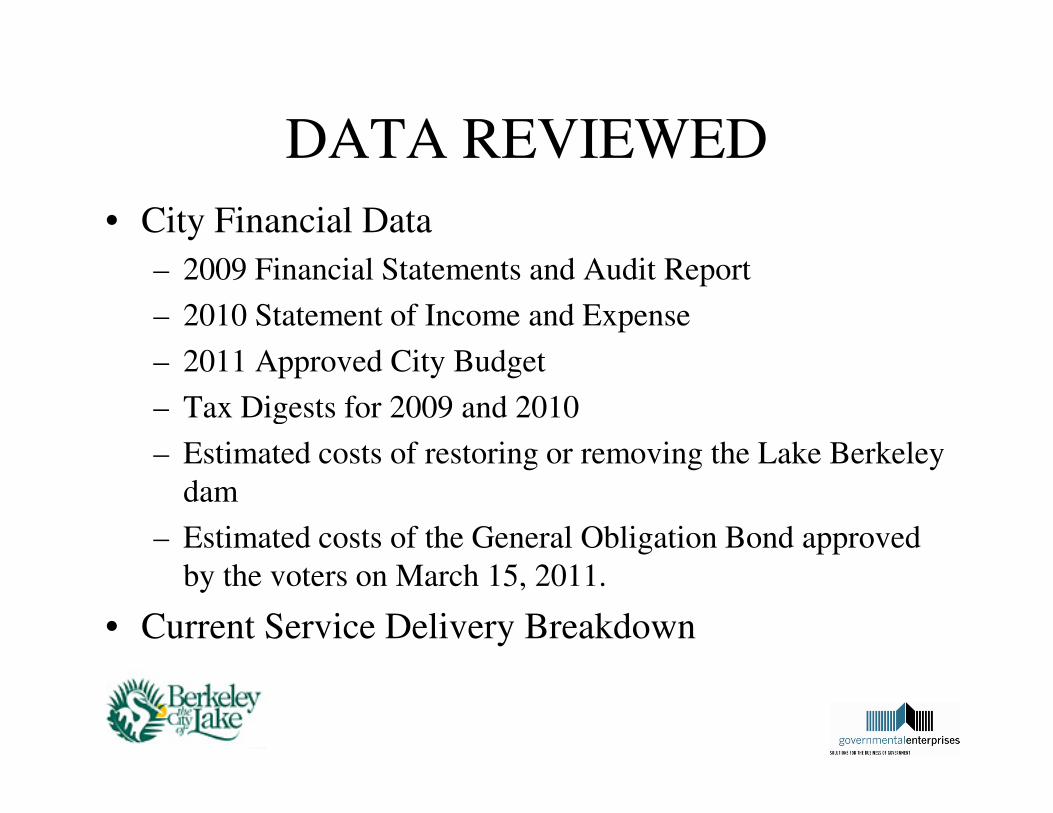
• City Financial Data
– 2009 Financial Statements and Audit Report
– 2010 Statement of Income and Expense
– 2011 Approved City Budget
– Tax Digests for 2009 and 2010– Tax Digests for 2009 and 2010
– Estimated costs of restoring or removing the Lake Berkeley
dam
– Estimated costs of the General Obligation Bond approved
by the voters on March 15, 2011.
• Current Service Delivery Breakdown
INTERVIEWS
• City of Berkeley Lake
– Mayor Lois Salter– Mayor Lois Salter
– City Administrator, Tom Rozier
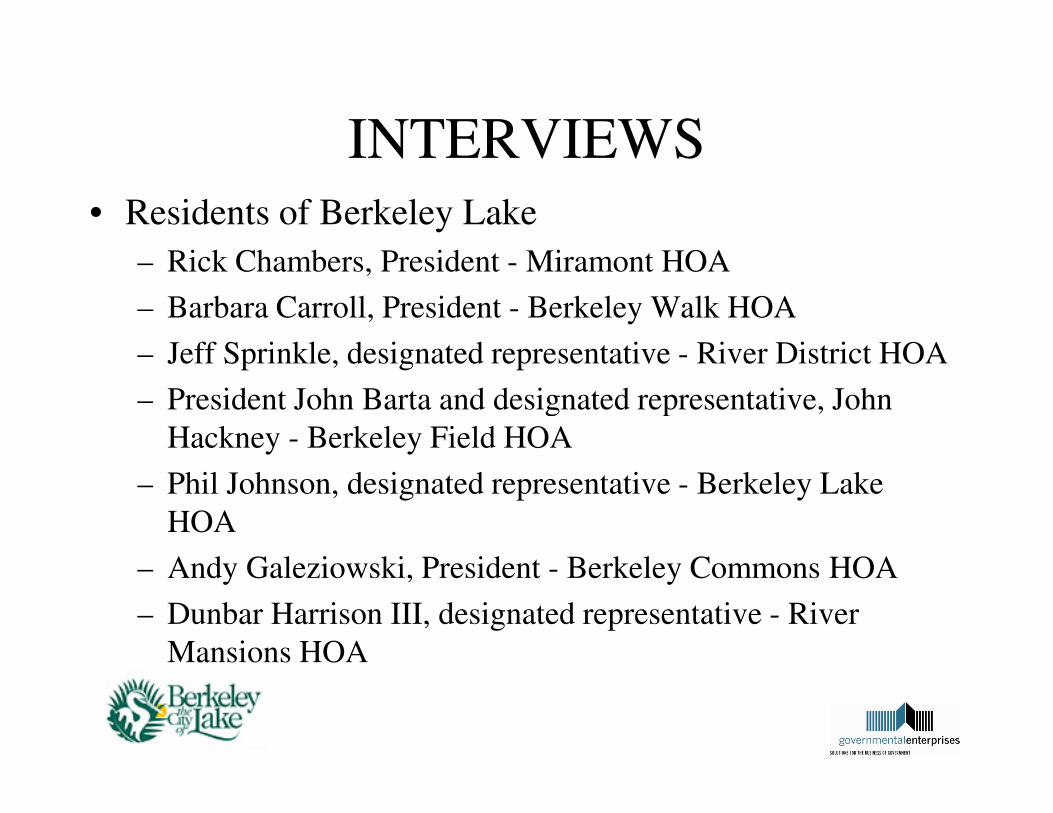
INTERVIEWS• Residents of Berkeley Lake
– Rick Chambers, President - Miramont HOA
– Barbara Carroll, President - Berkeley Walk HOA
– Jeff Sprinkle, designated representative - River District HOA
– President John Barta and designated representative, John – President John Barta and designated representative, John
Hackney - Berkeley Field HOA
– Phil Johnson, designated representative - Berkeley Lake
HOA
– Andy Galeziowski, President - Berkeley Commons HOA
– Dunbar Harrison III, designated representative - River
Mansions HOA
INTERVIEWS
• The Georgia Municipal Association
• The Gwinnett County Tax Assessor’s
Office
SUMMARY OF INTERVIEWS
Residents of Berkeley Lake
Feedback from the HOA’s reflected generally
positive attitudes towards the Mayor, City positive attitudes towards the Mayor, City
Council and City Management.
SUMMARY OF INTERVIEWS
Residents of Berkeley Lake
A somewhat contentious atmosphere between
the homeowners on the lake and those not on
the lake seemed to be driving much of the the lake seemed to be driving much of the
emotional energy surrounding the issue with
the dam.
SUMMARY OF INTERVIEWS
Residents of Berkeley Lake
Consensus among HOA’s that:
• Funding should be through millage rate adjustment, as
opposed to any type of special assessment
• The Green Space funding model (through general millage • The Green Space funding model (through general millage
rate) is fair and equitable
• There is some value of the lake to all parties, but not equal
value
• Repairing the dam is the correct and logical action
SUMMARY OF INTERVIEWS
Residents of Berkeley Lake
The one main disagreement is that lake front
owners feel that, because their land is valued so
much higher by being on the lake, the resultingmuch higher by being on the lake, the resulting
additional property taxes already sufficiently
make up for any differential in the value of the
lake. Generally, those property owners not
located on the lake disagreed.
SUMMARY OF INTERVIEWSThe Georgia Municipal Association (GMA)
• Mr. Lamar Norton
• Seeking parallels or situations comparable to the BL
dam situation
• The only comparable situation - Mountain Park, GA • The only comparable situation - Mountain Park, GA
(Fulton Co.)
– siltation problems in their lake
– City seeking funding alternatives for restoring their lake &
recovering expenditures for same
– Not as far along in the process as BL, watching to see what
BL did
SUMMARY OF INTERVIEWSThe Gwinnett County Tax Assessor’s Office
• Group assembled with special attention to their knowledge of
BL and lake property in general
• Housing market ultimately drives property valuation
• Therefore, this office reluctant to deal with “hypothetical”
situations or provide hard numberssituations or provide hard numbers
• General guidance -
– Forecasted a significantly negative impact on the City’s Tax Digest
were it not for the presence of the lake
– This negative impact, according to the Tax Assessor’s Office, would
likely manifest itself as significant value loss to the lake-front property,
with a potential “domino effect” rippling through the values of other
properties in the City
ANALYSIS & CONCLUSIONSGeneral City Services
• A thorough review of general services currently provided by the City revealed no “real” and very few “perceived” inequities
• We note that two gated subdivisions have privately-• We note that two gated subdivisions have privately-owned streets and have chosen to provide for their own street and (in the case of River District) sidewalk repair
• However, the level and expense of repair was termedto be minimal and not worth pressing for a millagedifferential
ANALYSIS & CONCLUSIONSGreen Space Acquisition
• Corner of Peachtree Industrial Boulevard and North
Berkeley Lake Road
• Property acquired by the City, partly to serve as a • Property acquired by the City, partly to serve as a
buffer to commercial activity and traffic along PIB,
and partly to function as a city park
ANALYSIS & CONCLUSIONSGreen Space Acquisition
• One or two comments from homeowners suggesting that
homeowners along Ridge Road benefitted exclusively from
this acquisition
• Yet, we found consensus among the various homeowners’
associations that the green space acquisition was funded
properly through common millage rate
• This method of funding consistent with other similar
acquisitions in other jurisdictions
• Our conclusion - the City acted appropriately in funding the
green space acquisition through common millage rate
ANALYSIS & CONCLUSIONSRestoration of Lake Berkeley Dam
• The only significant issue we found in our study
• The majority of homeowners’ representatives conceded that
the lake was of value to them, but maintained that the lake
front owners should bear a larger portion of the bill than those
away from the lakeaway from the lake
• This view in stark contrast to the widely held opinion that the
green space acquisition was found to be funded properly
through common millage rate
• This paradox explained by “Us vs. Them” atmosphere – makes
the dam issue somehow different from the green space
acquisition
ANALYSIS & CONCLUSIONSRestoration of Lake Berkeley Dam
• We rejected the development of any metric that attempted to
equate individual residents’ value of the lake to their proximity
to the lake, because it would be too subjective and open for
interpretation
• Instead, sought to examine the financial value of the lake to
the community as a whole
• By analyzing the effect on City revenues from property taxes
if the lake had not existed
ANALYSIS & CONCLUSIONSRestoration of Lake Berkeley Dam
• Not advocating that draining the lake is a
viable option – just evaluating impact of lake’s
existence on property tax revenues needed to existence on property tax revenues needed to
keep current level and mix of City services
ANALYSIS & CONCLUSIONSRestoration of Lake Berkeley Dam
First, we set out to establish the relative
property tax contributions from the various property tax contributions from the various
residential areas of the City.
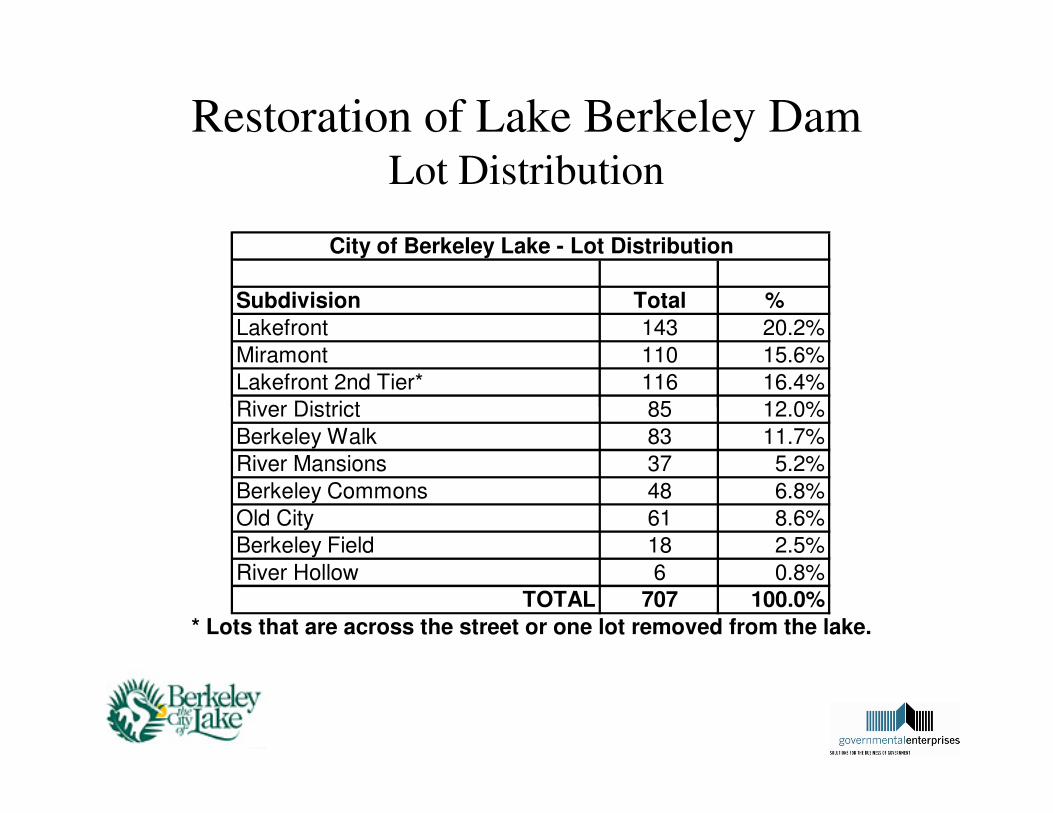
Restoration of Lake Berkeley DamLot Distribution
Subdivision Total %
Lakefront 143 20.2%
Miramont 110 15.6%
Lakefront 2nd Tier* 116 16.4%
River District 85 12.0%
City of Berkeley Lake - Lot Distribution
River District 85 12.0%
Berkeley Walk 83 11.7%
River Mansions 37 5.2%
Berkeley Commons 48 6.8%
Old City 61 8.6%
Berkeley Field 18 2.5%
River Hollow 6 0.8%TOTAL 707 100.0%
* Lots that are across the street or one lot removed from the lake.
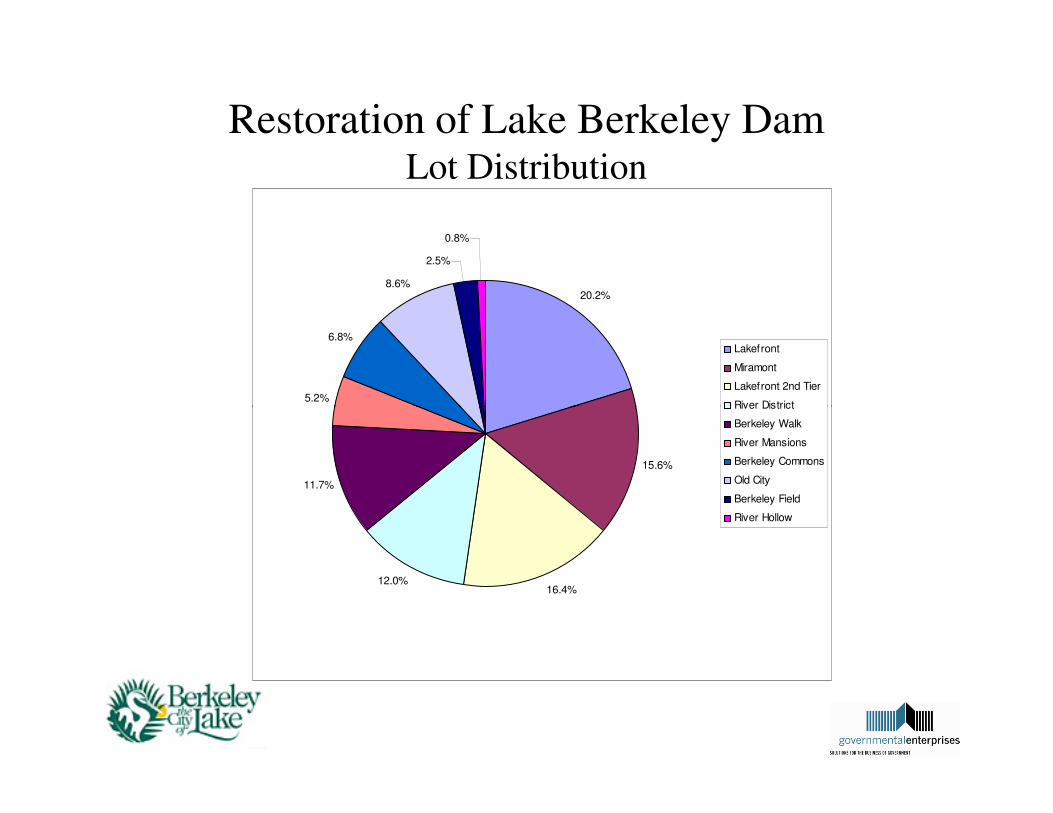
Restoration of Lake Berkeley DamLot Distribution
20.2%
5.2%
6.8%
8.6%
2.5%
0.8%
Lakefront
Miramont
Lakefront 2nd Tier
River District
15.6%
16.4%12.0%
11.7%
River District
Berkeley Walk
River Mansions
Berkeley Commons
Old City
Berkeley Field
River Hollow
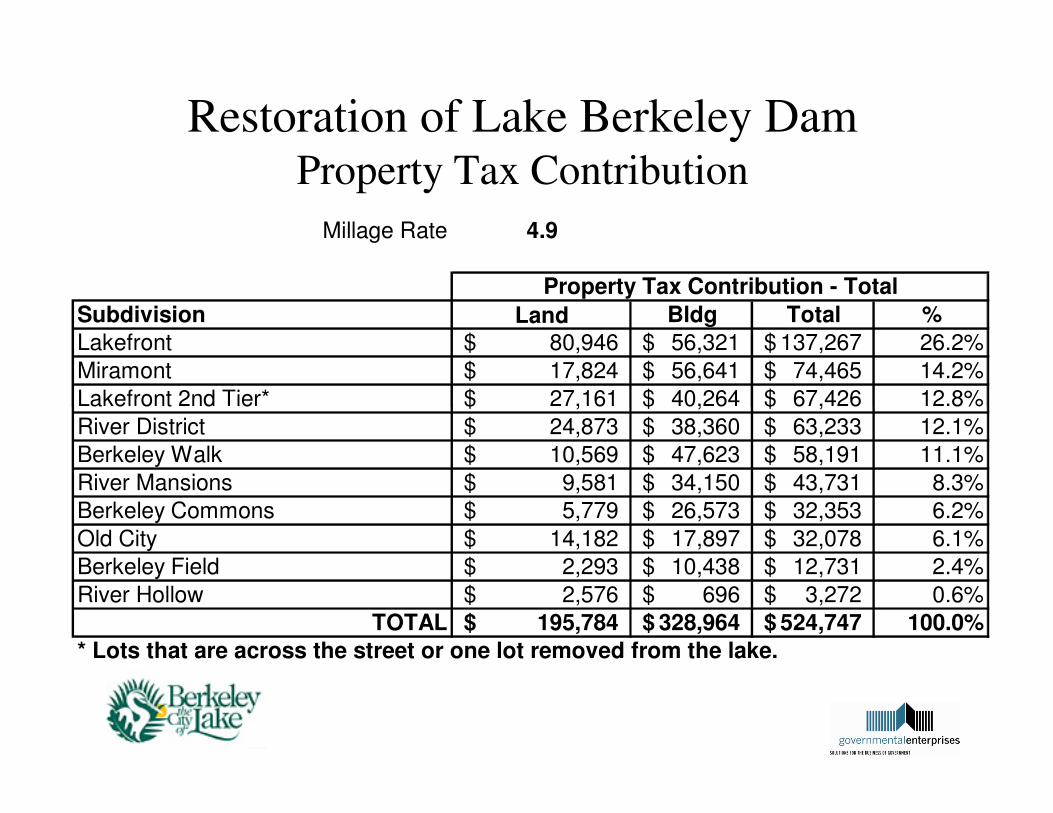
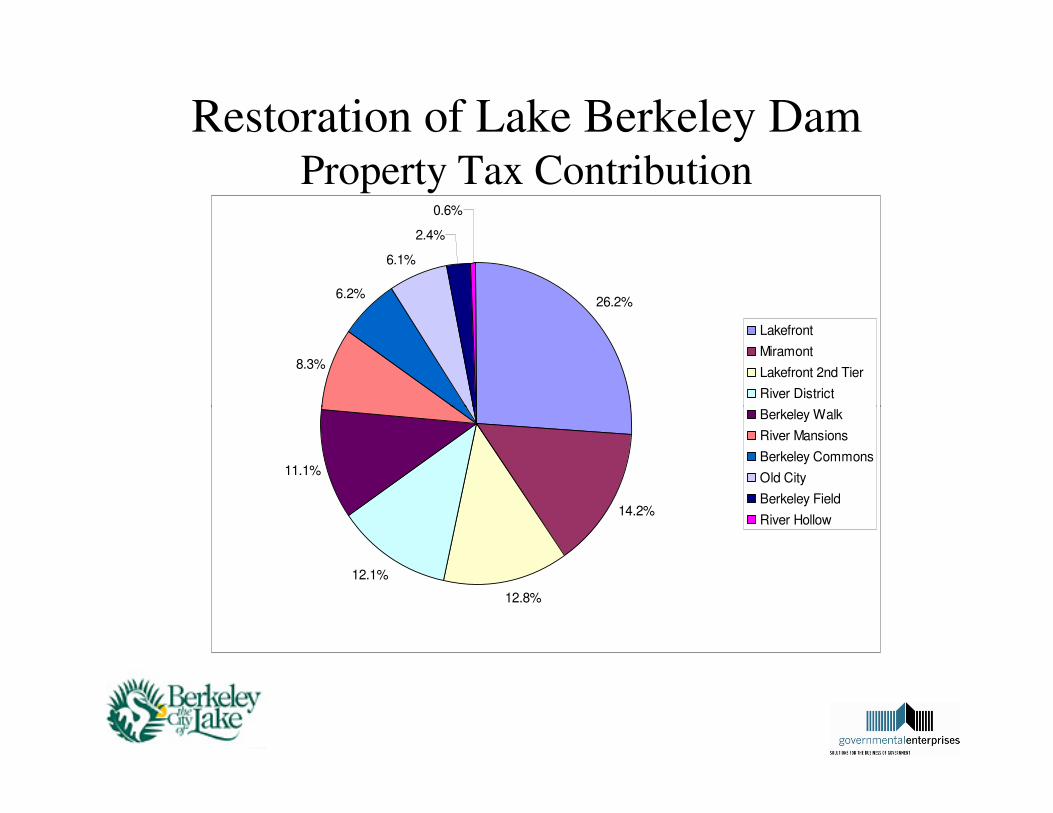
Restoration of Lake Berkeley DamProperty Tax Contribution
Millage Rate 4.9
Subdivision Land Bldg Total %
Lakefront 80,946$ 56,321$ 137,267$ 26.2%
Miramont 17,824$ 56,641$ 74,465$ 14.2%
Lakefront 2nd Tier* 27,161$ 40,264$ 67,426$ 12.8%
Property Tax Contribution - Total
Lakefront 2nd Tier* 27,161$ 40,264$ 67,426$ 12.8%
River District 24,873$ 38,360$ 63,233$ 12.1%
Berkeley Walk 10,569$ 47,623$ 58,191$ 11.1%
River Mansions 9,581$ 34,150$ 43,731$ 8.3%
Berkeley Commons 5,779$ 26,573$ 32,353$ 6.2%
Old City 14,182$ 17,897$ 32,078$ 6.1%
Berkeley Field 2,293$ 10,438$ 12,731$ 2.4%
River Hollow 2,576$ 696$ 3,272$ 0.6%
TOTAL 195,784$ 328,964$ 524,747$ 100.0%
* Lots that are across the street or one lot removed from the lake.
Restoration of Lake Berkeley DamProperty Tax Contribution
26.2%
8.3%
6.2%
6.1%
2.4%
0.6%
Lakefront
Miramont
Lakefront 2nd Tier
River District
Berkeley Walk
14.2%
12.8%
12.1%
11.1%
Berkeley Walk
River Mansions
Berkeley Commons
Old City
Berkeley Field
River Hollow
ANALYSIS & CONCLUSIONSRestoration of Lake Berkeley Dam
CONCLUSION
• Lakefront properties - 20.2% of the owners produce
26.2% of the contribution for funding city services. 26.2% of the contribution for funding city services.
• This due to higher land values on the lake.
ANALYSIS & CONCLUSIONSRestoration of Lake Berkeley Dam
Next step - “normalize” current land values
to correct for different-sized lots. to correct for different-sized lots.

Restoration of Lake Berkeley Dam2010 Tax Digest Data Broken Down into Dollars per Acre
City of Berkeley Lake 2010 FMV
Subdivision FMV # Acres $/acre
Lakefront 41,298,900$ 85.03 485,698$
River District 12,690,300$ 56.93 222,911$
Old City 7,235,500$ 41.99 172,315$
Lakefront 2nd Tier 13,857,900$ 87.03 159,231$
Miramont 9,093,800$ 61.18 148,640$
Berkeley Field 1,170,000$ 8.74 133,867$
River Hollow 1,314,100$ 11.43 114,969$
River Mansions 4,888,400$ 44.49 109,876$
Berkeley Commons 2,948,600$ 28.66 102,882$
Berkeley Walk 5,392,200$ 56.73 95,050$ Total 99,889,700$ 482.21 207,150$
ANALYSIS & CONCLUSIONSRestoration of Lake Berkeley Dam
CONCLUSION
• Lakefront property is currently valued at $485,698
per acre. River District came in second place at per acre. River District came in second place at
$222,911 per acre, or only 46% the value of
Lakefront property
ANALYSIS & CONCLUSIONSRestoration of Lake Berkeley Dam
The preceding analyses begs the question:
What would happen to the Berkeley Lake What would happen to the Berkeley Lake
Tax Digest if the lake were not there, and
what would have to happen to everyone’s
millage rates to maintain the current level of
City services to the community?
ANALYSIS & CONCLUSIONSRestoration of Lake Berkeley Dam
At this point, we took general direction from
the Gwinnett County Tax Assessor’s Office,
along with our own experience, and ran two
scenarios. The first scenario is conservative
and the second is somewhat more aggressive.
ANALYSIS & CONCLUSIONSRestoration of Lake Berkeley Dam
Scenario 1 - Conservative
• Assumes lakefront land value drops to the average of
all other City subdivisionsall other City subdivisions
• Assumes lakefront home values remain stable
• Assumes all non-Lakefront property values (land and
homes) remain stable
Restoration of Lake Berkeley Dam
Scenario 1 - Conservative
First, to determine the average land value of all First, to determine the average land value of all
non-lakefront properties, we re-ran the
normalized land values, removing Lakefront
from the data set.
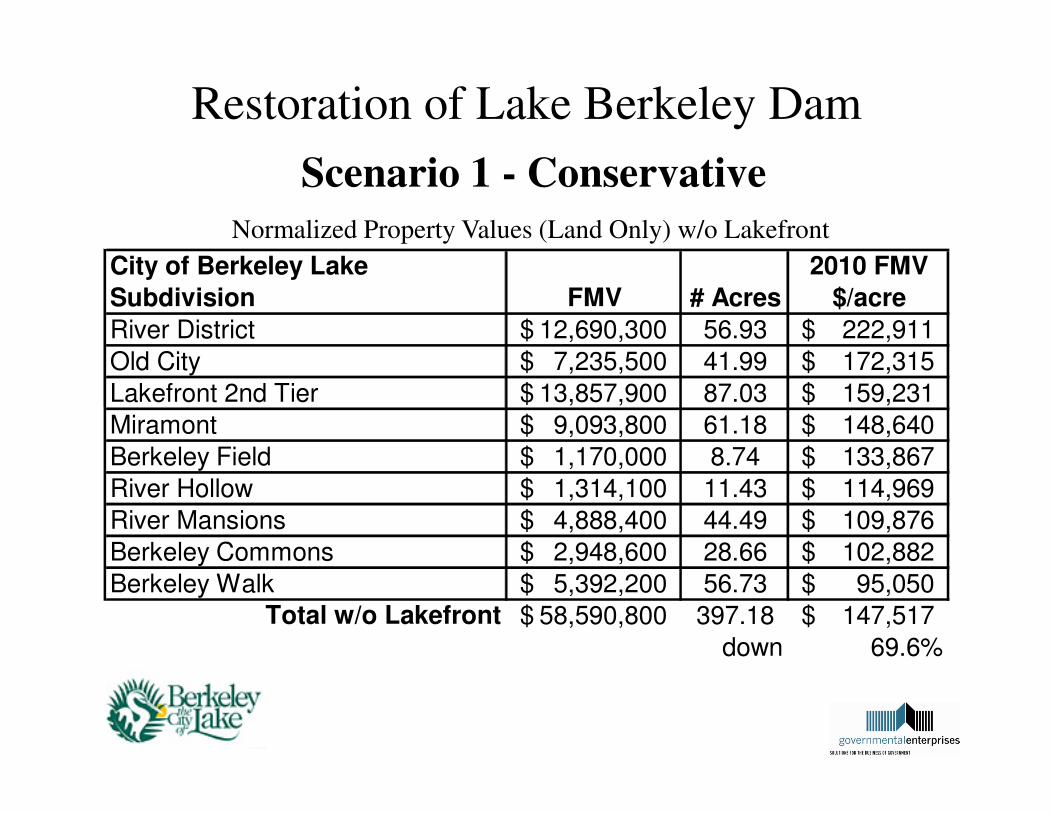
Normalized Property Values (Land Only) w/o Lakefront
City of Berkeley Lake 2010 FMV
Subdivision FMV # Acres $/acre
River District 12,690,300$ 56.93 222,911$
Old City 7,235,500$ 41.99 172,315$
Lakefront 2nd Tier 13,857,900$ 87.03 159,231$
Restoration of Lake Berkeley Dam
Scenario 1 - Conservative
Lakefront 2nd Tier 13,857,900$ 87.03 159,231$
Miramont 9,093,800$ 61.18 148,640$
Berkeley Field 1,170,000$ 8.74 133,867$
River Hollow 1,314,100$ 11.43 114,969$
River Mansions 4,888,400$ 44.49 109,876$
Berkeley Commons 2,948,600$ 28.66 102,882$
Berkeley Walk 5,392,200$ 56.73 95,050$ Total w/o Lakefront 58,590,800$ 397.18 147,517$
down 69.6%
Restoration of Lake Berkeley Dam
Scenario 1 - Conservative
Then, we recalculated the property tax
contributions from each neighborhood, assuming
the lakefront property values dropped to the the lakefront property values dropped to the
average of all other BL neighborhoods.
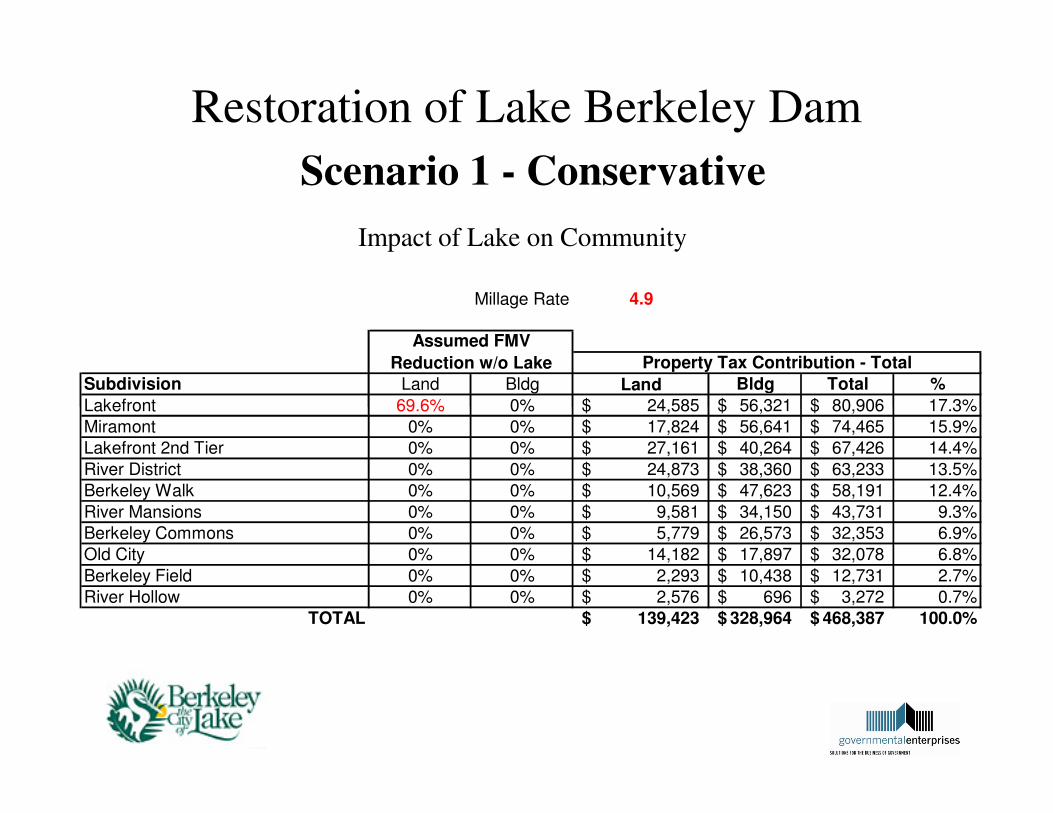
Restoration of Lake Berkeley Dam
Scenario 1 - Conservative
Impact of Lake on Community
Millage Rate 4.9
Subdivision Land Bldg Land Bldg Total %
Lakefront 69.6% 0% 24,585$ 56,321$ 80,906$ 17.3%
Property Tax Contribution - Total
Assumed FMV
Reduction w/o Lake
Lakefront 69.6% 0% 24,585$ 56,321$ 80,906$ 17.3%
Miramont 0% 0% 17,824$ 56,641$ 74,465$ 15.9%
Lakefront 2nd Tier 0% 0% 27,161$ 40,264$ 67,426$ 14.4%
River District 0% 0% 24,873$ 38,360$ 63,233$ 13.5%
Berkeley Walk 0% 0% 10,569$ 47,623$ 58,191$ 12.4%
River Mansions 0% 0% 9,581$ 34,150$ 43,731$ 9.3%
Berkeley Commons 0% 0% 5,779$ 26,573$ 32,353$ 6.9%
Old City 0% 0% 14,182$ 17,897$ 32,078$ 6.8%
Berkeley Field 0% 0% 2,293$ 10,438$ 12,731$ 2.7%
River Hollow 0% 0% 2,576$ 696$ 3,272$ 0.7%
TOTAL 139,423$ 328,964$ 468,387$ 100.0%
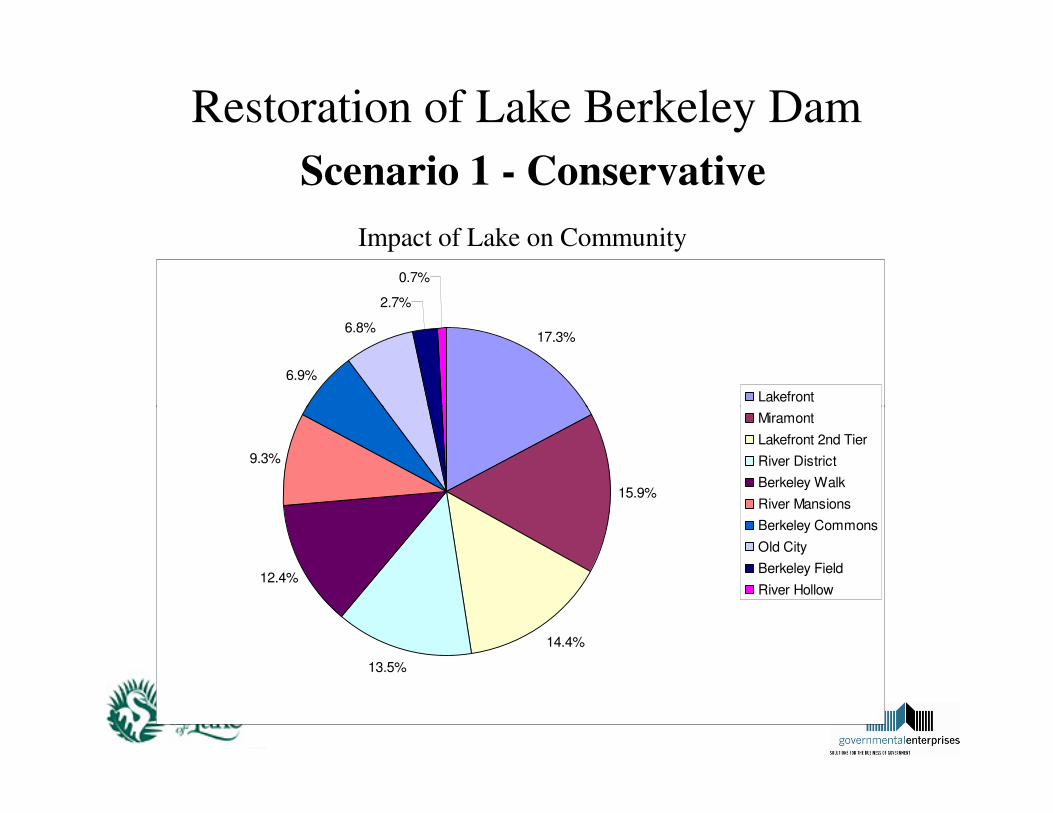
Restoration of Lake Berkeley Dam
Scenario 1 - Conservative
Impact of Lake on Community
17.3%
6.9%
6.8%
2.7%
0.7%
Lakefront
15.9%
14.4%
13.5%
12.4%
9.3%
Miramont
Lakefront 2nd Tier
River District
Berkeley Walk
River Mansions
Berkeley Commons
Old City
Berkeley Field
River Hollow
Restoration of Lake Berkeley Dam
Scenario 1 - Conservative
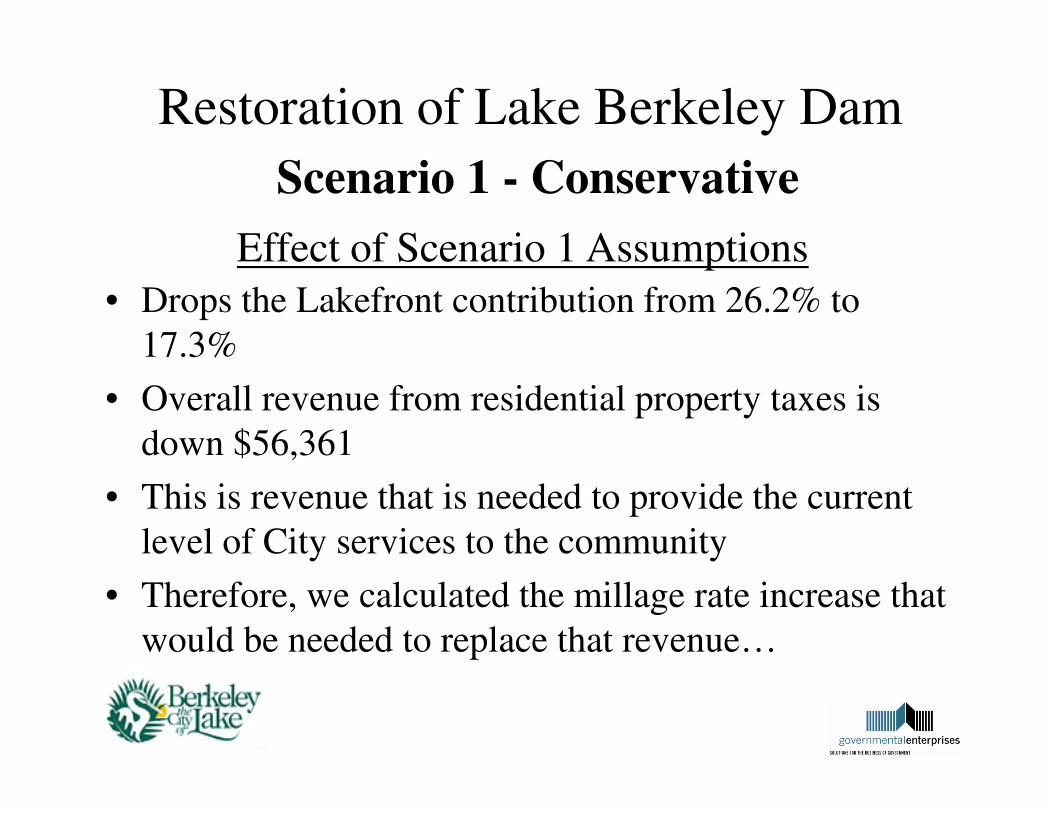
Effect of Scenario 1 Assumptions
• Drops the Lakefront contribution from 26.2% to
17.3%
• Overall revenue from residential property taxes is • Overall revenue from residential property taxes is
down $56,361
• This is revenue that is needed to provide the current
level of City services to the community
• Therefore, we calculated the millage rate increase that
would be needed to replace that revenue…
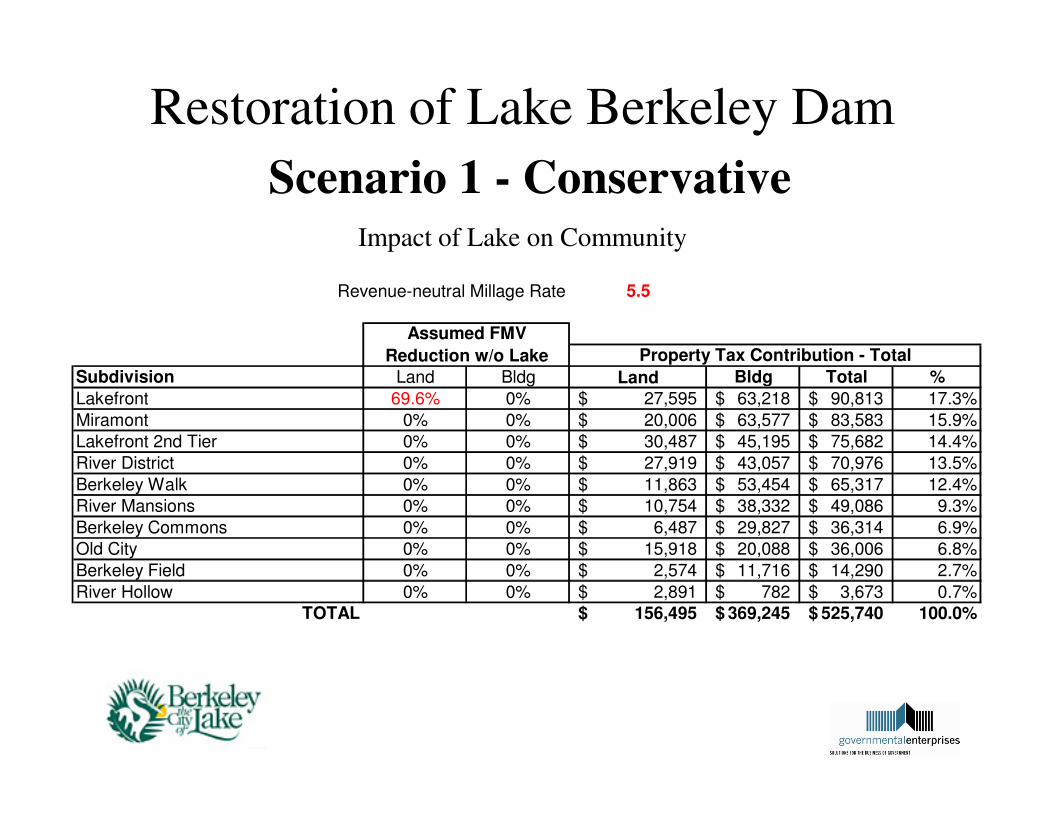
Restoration of Lake Berkeley Dam
Scenario 1 - ConservativeImpact of Lake on Community
Revenue-neutral Millage Rate 5.5
Subdivision Land Bldg Land Bldg Total %
Lakefront 69.6% 0% 27,595$ 63,218$ 90,813$ 17.3%
Property Tax Contribution - Total
Assumed FMV
Reduction w/o Lake
Lakefront 69.6% 0% 27,595$ 63,218$ 90,813$ 17.3%
Miramont 0% 0% 20,006$ 63,577$ 83,583$ 15.9%
Lakefront 2nd Tier 0% 0% 30,487$ 45,195$ 75,682$ 14.4%
River District 0% 0% 27,919$ 43,057$ 70,976$ 13.5%
Berkeley Walk 0% 0% 11,863$ 53,454$ 65,317$ 12.4%
River Mansions 0% 0% 10,754$ 38,332$ 49,086$ 9.3%
Berkeley Commons 0% 0% 6,487$ 29,827$ 36,314$ 6.9%
Old City 0% 0% 15,918$ 20,088$ 36,006$ 6.8%
Berkeley Field 0% 0% 2,574$ 11,716$ 14,290$ 2.7%
River Hollow 0% 0% 2,891$ 782$ 3,673$ 0.7%TOTAL 156,495$ 369,245$ 525,740$ 100.0%
Restoration of Lake Berkeley Dam
Scenario 1 - Conservative
Effect of Scenario 1 Assumptions
• Property tax revenue would be reduced by 11%
($56,361)
• To recover that lost revenue, everyone’s millage rate
must increase from 4.9 to 5.5
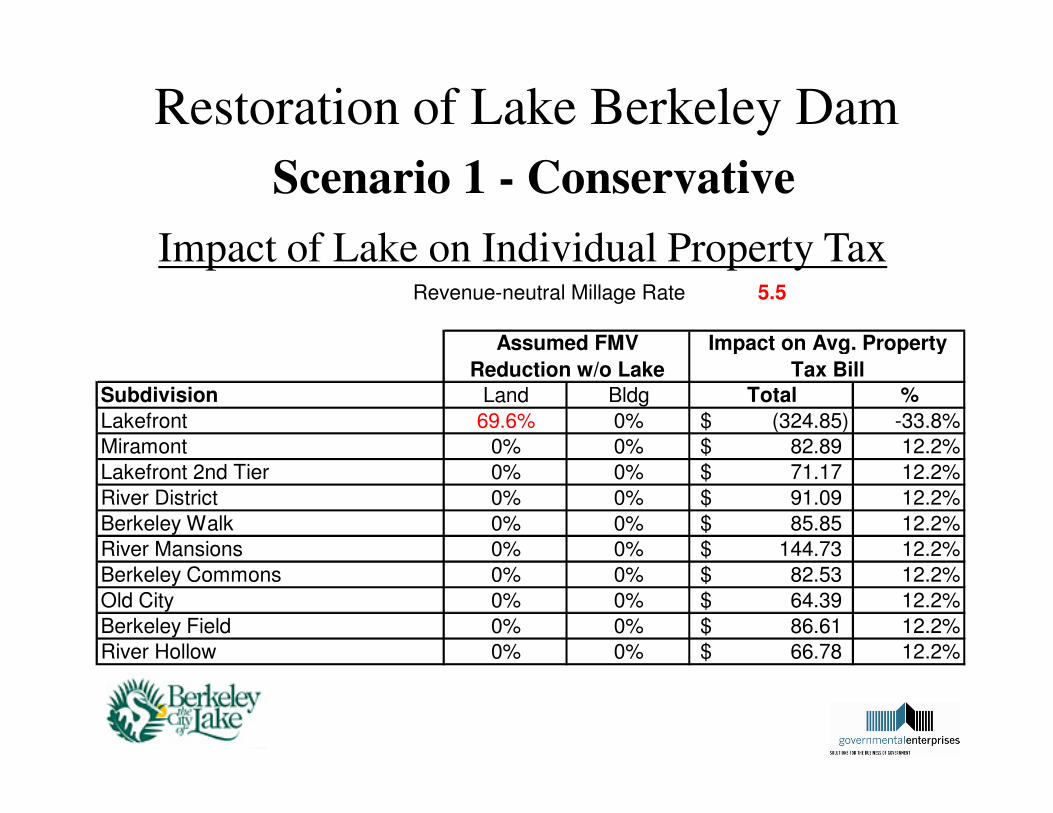
Restoration of Lake Berkeley Dam
Scenario 1 - Conservative
Impact of Lake on Individual Property TaxRevenue-neutral Millage Rate 5.5
Subdivision Land Bldg Total %
Assumed FMV
Reduction w/o Lake
Impact on Avg. Property
Tax Bill
Lakefront 69.6% 0% (324.85)$ -33.8%
Miramont 0% 0% 82.89$ 12.2%
Lakefront 2nd Tier 0% 0% 71.17$ 12.2%
River District 0% 0% 91.09$ 12.2%
Berkeley Walk 0% 0% 85.85$ 12.2%
River Mansions 0% 0% 144.73$ 12.2%
Berkeley Commons 0% 0% 82.53$ 12.2%
Old City 0% 0% 64.39$ 12.2%
Berkeley Field 0% 0% 86.61$ 12.2%
River Hollow 0% 0% 66.78$ 12.2%
ANALYSIS & CONCLUSIONSRestoration of Lake Berkeley Dam
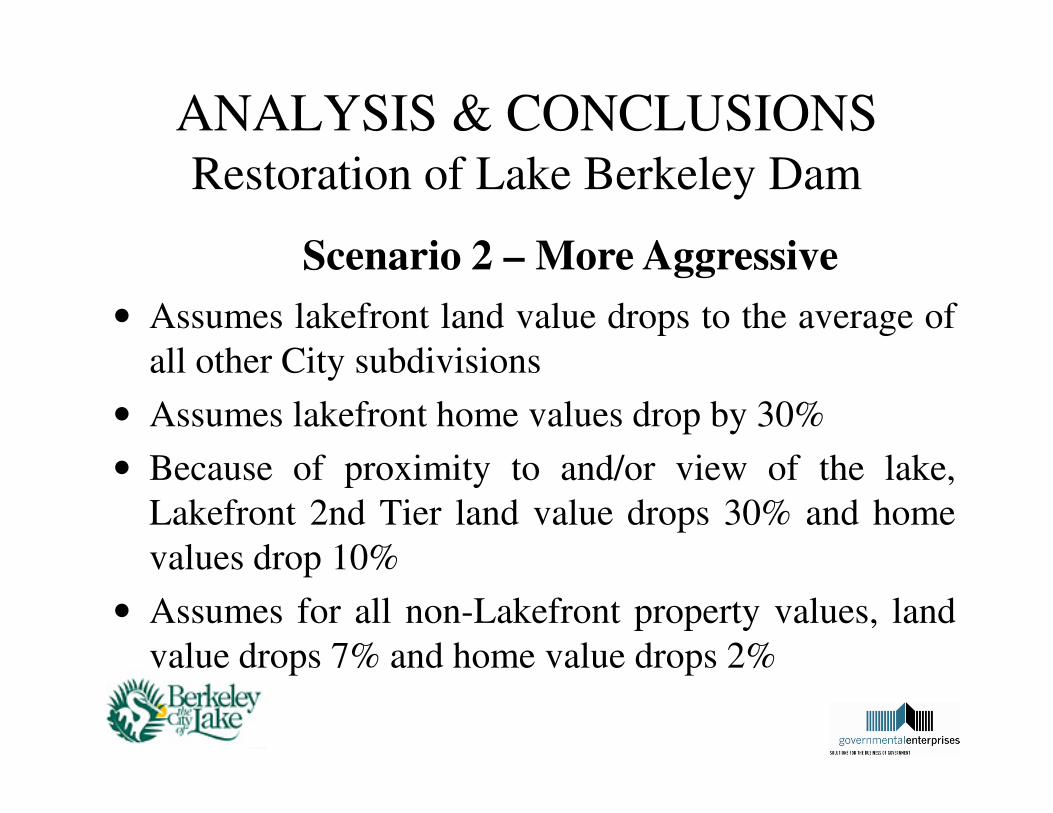
Scenario 2 – More Aggressive
• Assumes lakefront land value drops to the average of
all other City subdivisions
• Assumes lakefront home values drop by 30%• Assumes lakefront home values drop by 30%
• Because of proximity to and/or view of the lake,
Lakefront 2nd Tier land value drops 30% and home
values drop 10%
• Assumes for all non-Lakefront property values, land
value drops 7% and home value drops 2%
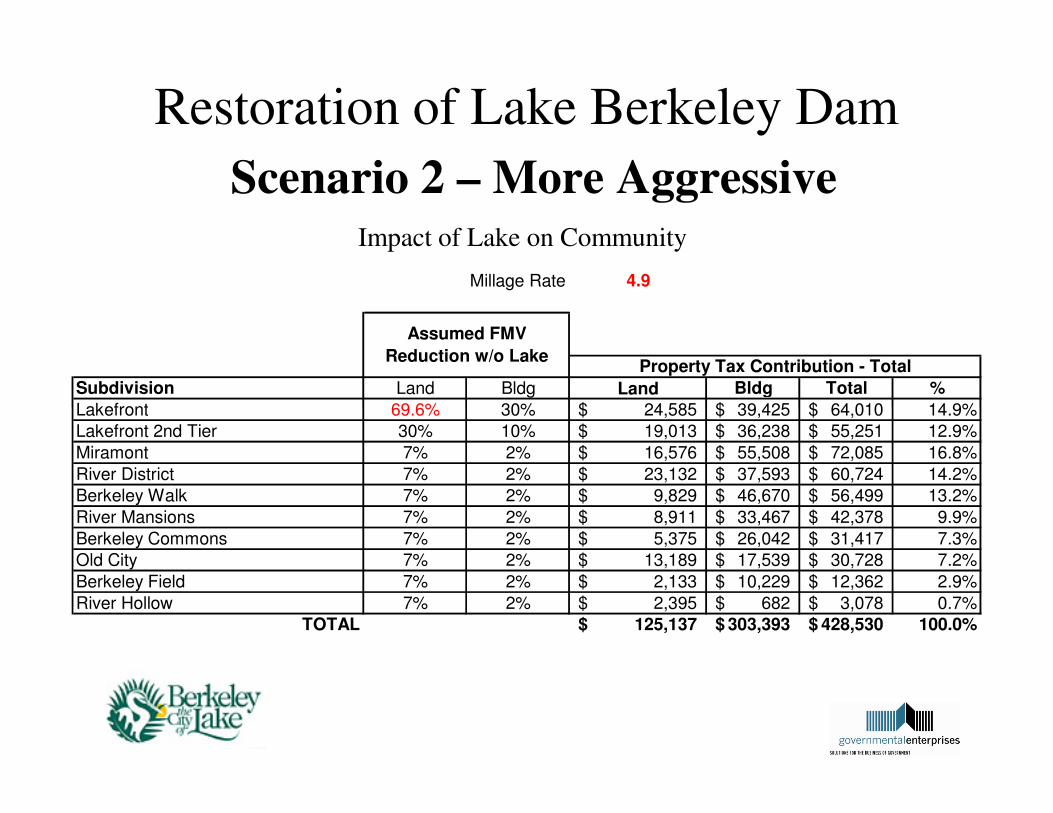
Restoration of Lake Berkeley Dam
Scenario 2 – More AggressiveImpact of Lake on Community
Millage Rate 4.9
Subdivision Land Bldg Land Bldg Total %
Lakefront 69.6% 30% 24,585$ 39,425$ 64,010$ 14.9%
Property Tax Contribution - Total
Assumed FMV
Reduction w/o Lake
Lakefront 69.6% 30% 24,585$ 39,425$ 64,010$ 14.9%Lakefront 2nd Tier 30% 10% 19,013$ 36,238$ 55,251$ 12.9%
Miramont 7% 2% 16,576$ 55,508$ 72,085$ 16.8%
River District 7% 2% 23,132$ 37,593$ 60,724$ 14.2%Berkeley Walk 7% 2% 9,829$ 46,670$ 56,499$ 13.2%
River Mansions 7% 2% 8,911$ 33,467$ 42,378$ 9.9%
Berkeley Commons 7% 2% 5,375$ 26,042$ 31,417$ 7.3%Old City 7% 2% 13,189$ 17,539$ 30,728$ 7.2%
Berkeley Field 7% 2% 2,133$ 10,229$ 12,362$ 2.9%
River Hollow 7% 2% 2,395$ 682$ 3,078$ 0.7%TOTAL 125,137$ 303,393$ 428,530$ 100.0%
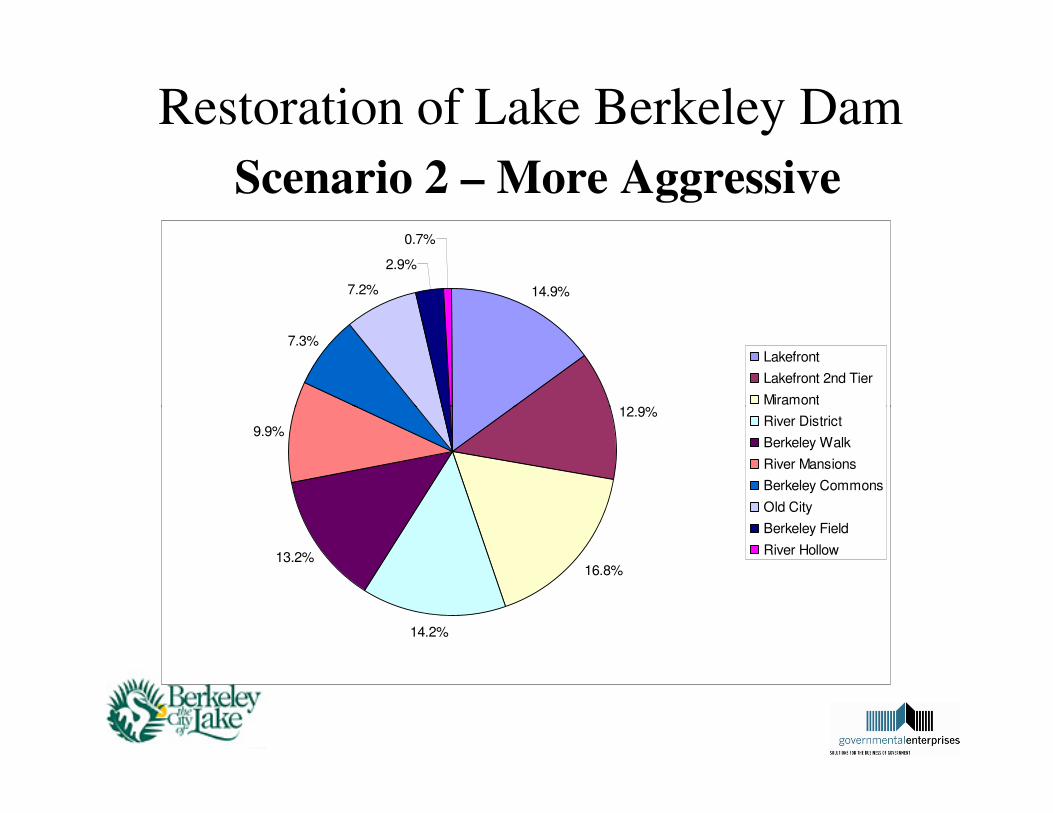
Restoration of Lake Berkeley Dam
Scenario 2 – More AggressiveImpact of Lake on Community
14.9%
12.9%
7.3%
7.2%
2.9%
0.7%
Lakefront
Lakefront 2nd Tier
Miramont12.9%
16.8%
14.2%
13.2%
9.9%
Miramont
River District
Berkeley Walk
River Mansions
Berkeley Commons
Old City
Berkeley Field
River Hollow
Restoration of Lake Berkeley Dam
Scenario 2 – More Aggressive
Effect of Scenario 2 Assumptions
• Drops the Lakefront contribution from 26.2% to
14.9%
• Overall revenue from residential property taxes is • Overall revenue from residential property taxes is
down $96,217
• This is revenue that is needed to provide the current
level of City services to the community
• Therefore, we calculated the millage rate increase that
would be needed to replace that revenue…
Restoration of Lake Berkeley Dam
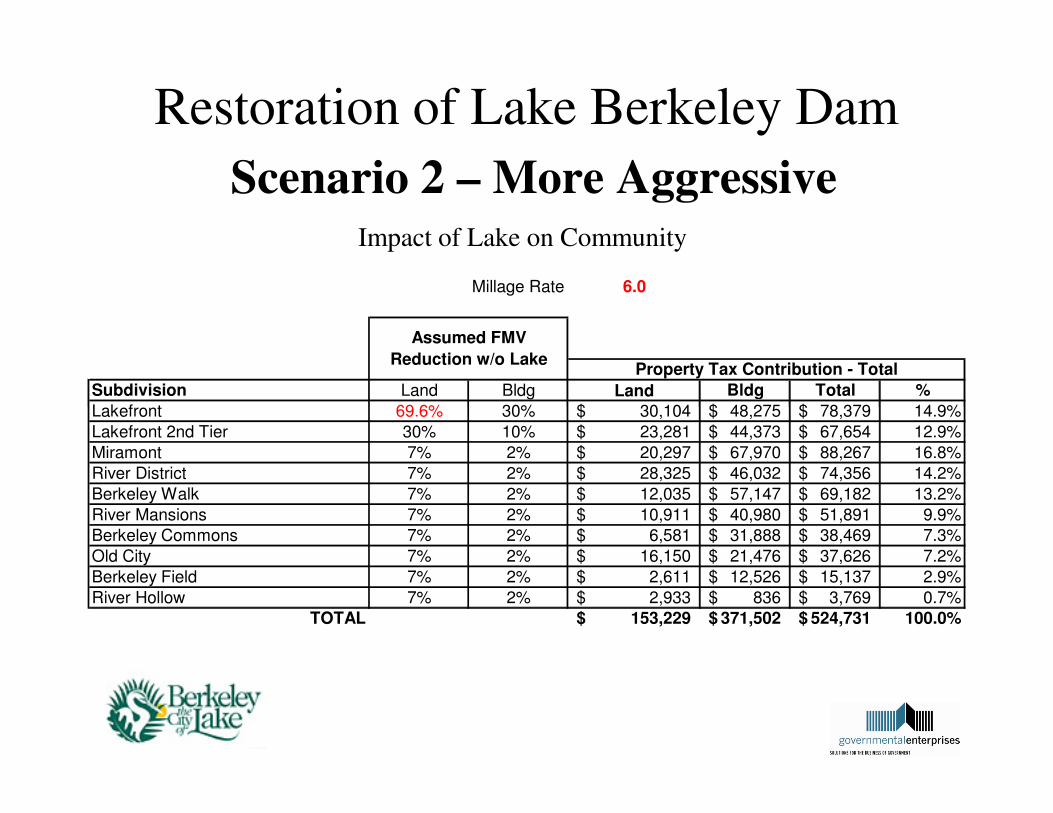
Scenario 2 – More AggressiveImpact of Lake on Community
Millage Rate 6.0
Subdivision Land Bldg Land Bldg Total %
Lakefront 69.6% 30% 30,104$ 48,275$ 78,379$ 14.9%
Property Tax Contribution - Total
Assumed FMV
Reduction w/o Lake
Lakefront 69.6% 30% 30,104$ 48,275$ 78,379$ 14.9%
Lakefront 2nd Tier 30% 10% 23,281$ 44,373$ 67,654$ 12.9%
Miramont 7% 2% 20,297$ 67,970$ 88,267$ 16.8%
River District 7% 2% 28,325$ 46,032$ 74,356$ 14.2%
Berkeley Walk 7% 2% 12,035$ 57,147$ 69,182$ 13.2%
River Mansions 7% 2% 10,911$ 40,980$ 51,891$ 9.9%Berkeley Commons 7% 2% 6,581$ 31,888$ 38,469$ 7.3%
Old City 7% 2% 16,150$ 21,476$ 37,626$ 7.2%
Berkeley Field 7% 2% 2,611$ 12,526$ 15,137$ 2.9%
River Hollow 7% 2% 2,933$ 836$ 3,769$ 0.7%TOTAL 153,229$ 371,502$ 524,731$ 100.0%
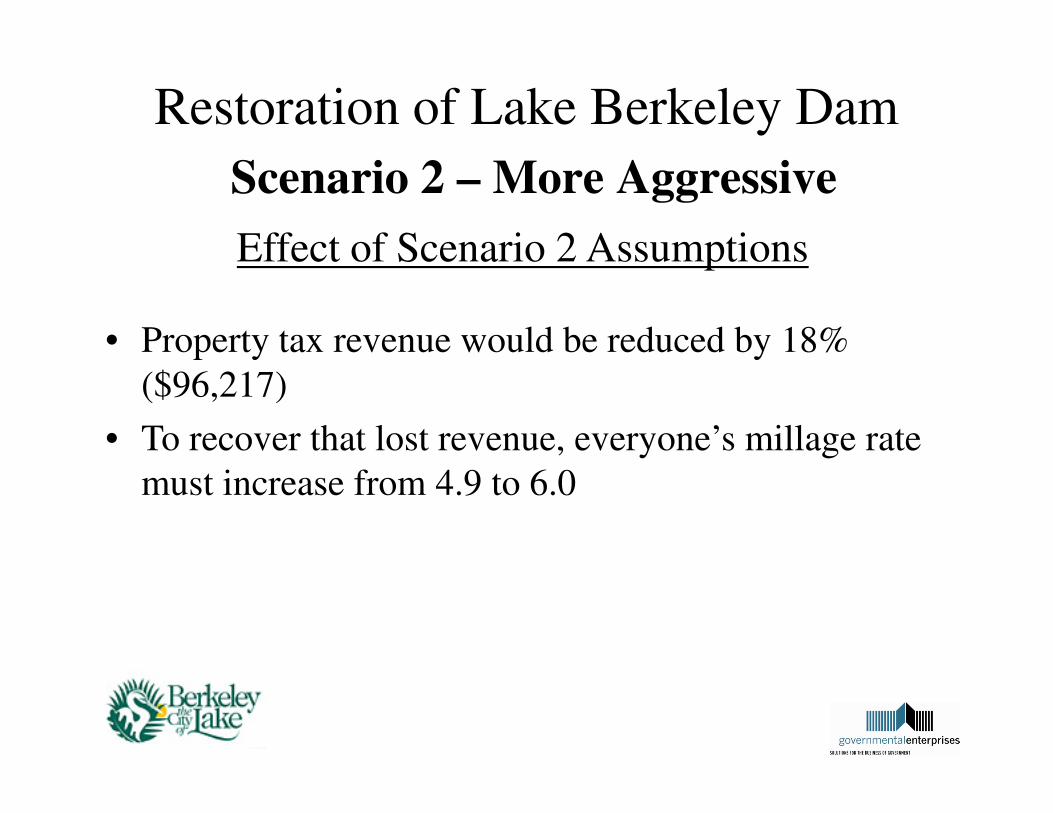
Restoration of Lake Berkeley Dam
Scenario 2 – More Aggressive
Effect of Scenario 2 Assumptions
• Property tax revenue would be reduced by 18%
($96,217)
• To recover that lost revenue, everyone’s millage rate
must increase from 4.9 to 6.0
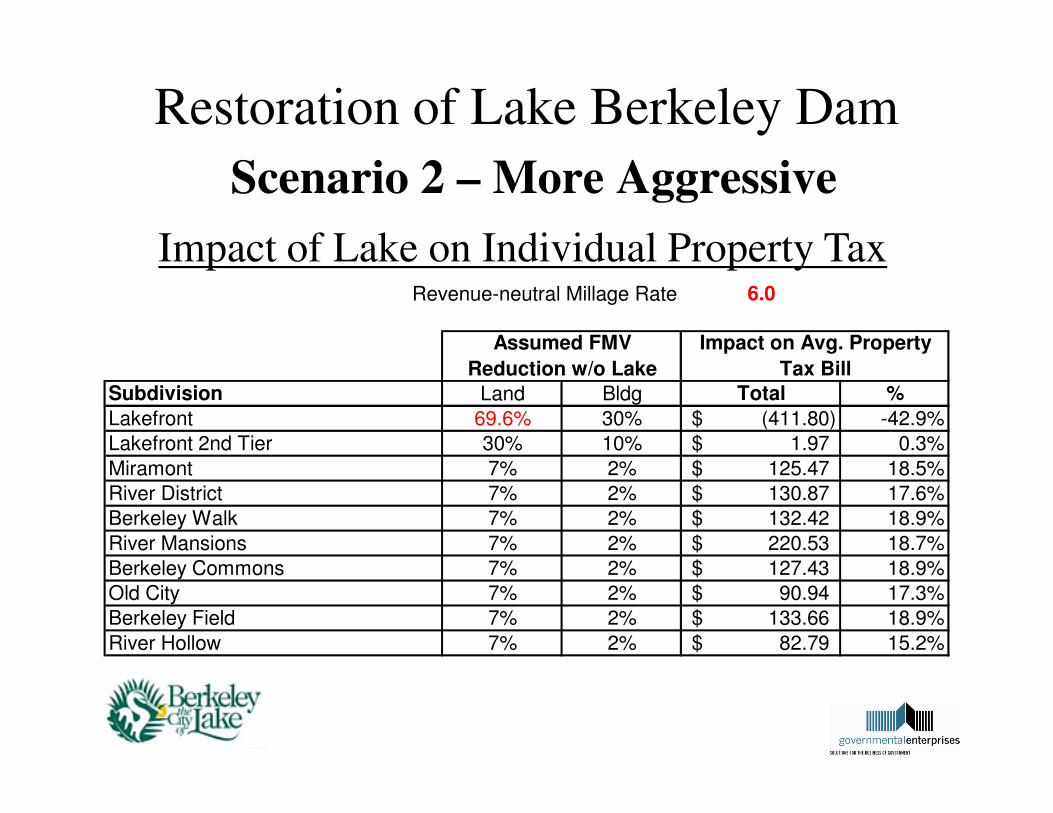
Restoration of Lake Berkeley Dam
Scenario 2 – More Aggressive
Impact of Lake on Individual Property TaxRevenue-neutral Millage Rate 6.0
Subdivision Land Bldg Total %
Assumed FMV
Reduction w/o Lake
Impact on Avg. Property
Tax Bill
Lakefront 69.6% 30% (411.80)$ -42.9%
Lakefront 2nd Tier 30% 10% 1.97$ 0.3%
Miramont 7% 2% 125.47$ 18.5%
River District 7% 2% 130.87$ 17.6%
Berkeley Walk 7% 2% 132.42$ 18.9%
River Mansions 7% 2% 220.53$ 18.7%
Berkeley Commons 7% 2% 127.43$ 18.9%
Old City 7% 2% 90.94$ 17.3%
Berkeley Field 7% 2% 133.66$ 18.9%
River Hollow 7% 2% 82.79$ 15.2%
ANALYSIS & CONCLUSIONSRestoration of Lake Berkeley Dam
Scenario 2 – More Aggressive
• While more aggressive than Scenario 1, Scenario 2
may still not be the worst case scenario
• One point emphasized by the Tax Assessor’s Office• One point emphasized by the Tax Assessor’s Office
• Tax digest ultimately driven by the housing market
• Would seek its own level based upon demand
• Without the lake, it was difficult to say just how low
property taxes could ultimately go
ANALYSIS & CONCLUSIONSRestoration of Lake Berkeley Dam
Conclusions from the Two Scenarios
• Because land values around the lake are so much
higher than the rest of the City’s residences, lake
front owners, who only represent about 20% of the front owners, who only represent about 20% of the
residents, are already carrying 26% of the financial
burden for all city services to the community
ANALYSIS & CONCLUSIONSRestoration of Lake Berkeley Dam
Conclusions from the Two Scenarios
• This differential in taxable value between Lakefront
and non-lake front lots serves, in effect, as a special
fee to the lake front owners for City services, a fee fee to the lake front owners for City services, a fee
that is a direct result of their proximity and access to
the lake
ANALYSIS & CONCLUSIONSRestoration of Lake Berkeley Dam
Conclusions from the Two Scenarios
• It is not immediate access to the lake that determines
the major portion of the value to each resident, but
rather the common financial gain to the community rather the common financial gain to the community
that is represented by the lake
ANALYSIS & CONCLUSIONSRestoration of Lake Berkeley Dam
Conclusions from the Two Scenarios
• Funding the dam restoration through a general
increase in millage rate is fair and equitable to all
partiesparties
IN SUMMARYGeneral City Services
• A review of City services revealed no significant
inequities
• We recommend no modifications• We recommend no modifications
IN SUMMARYGreen Space Acquisition
• Consensus among the residents that the green space
acquisition a few years ago was funded properly
through a common millage rate adjustment
• We also found this method of funding consistent with
other similar acquisitions in other jurisdictions
IN SUMMARYLake Berkeley Dam Restoration
• Our most conservative estimates indicate that, if the
lake did not exist, property tax revenue would be
reduced by 11% ($56,000)
• To recover that lost revenue, millage rate must
increase from 4.9 to 5.5 on every parcel in the city
IN SUMMARYLake Berkeley Dam Restoration
• Our more aggressive estimates indicate that, if the
lake did not exist, property tax revenue would be
reduced by 18% ($96,000)
• To recover that lost revenue, millage rate must
increase from 4.9 to 6.0 on every parcel in the city
IN SUMMARYLake Berkeley Dam Restoration
• Because land values around the lake are so much
higher than the rest of the City’s residences, that lake
front owners, who only represent about 20% of the
residents, are already carrying 26% of the financial residents, are already carrying 26% of the financial
burden for all city services to the community
IN SUMMARYLake Berkeley Dam Restoration
• This differential in taxable value between Lakefront
and non-lake front lots serves, in effect, as a special
fee to the lake front owners for City services, a fee
that is a direct result of their proximity and access to that is a direct result of their proximity and access to
the lake
IN SUMMARYLake Berkeley Dam Restoration
• It is not immediate access to the lake that determines
the major portion of the value to each resident, but
rather the common financial gain to the community
that is represented by the lakethat is represented by the lake
IN SUMMARYLake Berkeley Dam Restoration
• Funding the dam restoration through a general
increase in millage rate is fair and equitable to all
parties
TAX EQUITY ANALYSIS
FOR THE
CITY OF BERKELEY LAKE, GEORGIA
APRIL 2011


![[0411-2010-ED]-[31-03-2014 11_33_04]-RM 0411-2010-ED0001](https://img.pdfslide.us/doc/110x75/563dbb28550346aa9aaac129/0411-2010-ed-31-03-2014-113304-rm-0411-2010-ed0001.jpg)