Embed Size (px)
Citation preview
Government Procurement and Changes in Firm Transparency
The MIT Faculty has made this article openly available. Please share how this access benefits you. Your story matters.
Citation Samuels, Delphine. "Government Procurement and Changes in FirmTransparency." Accounting Review 96, 1 (February 2020): 401–430. ©2021 American Accounting Association
As Published http://dx.doi.org/10.2308/tar-2018-0343
Publisher American Accounting Association
Version Author's final manuscript
Citable link https://hdl.handle.net/1721.1/130468
Terms of Use Creative Commons Attribution-Noncommercial-Share Alike
Detailed Terms http://creativecommons.org/licenses/by-nc-sa/4.0/
Government procurement and changes in firm transparency
Delphine Samuels [email protected]
Sloan School of Management MIT
Draft: January 2020
Abstract: The government requires its suppliers to have certain internal information processes to reduce uncertainty about their ability to fulfill their commitments. I argue that these requirements improve suppliers’ internal information, which leads to better external reporting. Using a dataset of U.S. government contracts, I find a positive relation between government contract awards and firms’ external reporting quality. Consistent with procurement-related requirements driving this relation, I find that firms improve their external reporting when they begin contracting with the government, and that the magnitude of the improvement varies predictably with contract characteristics imposing greater requirements on contractors’ internal information processes. Finally, I use the establishment of the Cost Accounting Standards Board in 1970 as a shock to contractors’ internal information requirements, and find greater improvements in external reporting among firms subject to the CASB. Overall, these results suggest that the government as a customer contributes to shaping firms’ information environments. _________ This paper is based on my dissertation. I am very grateful to the members of my dissertation committee for their support, guidance, and insightful comments: Wayne Guay (co-chair), Luzi Hail, Chris Ittner (co-chair), and Dan Taylor. I also thank Brian Bushee, Paul Fischer, Robert Freeman, John Gallemore, Stephen Glaeser, Mirko Heinle, Eric Hirst, Bob Holthausen, Chongho Kim, Anya Kleymenova, Rick Lambert, Wayne Landsman, Lillian Mills (Editor), Cathy Schrand, Nemit Shroff, Robert Verrecchia, Frank Zhou, two anonymous reviewers, and seminar participants at the 2016 Carnegie Mellon Accounting Mini Conference, Columbia University, Harvard University, Massachusetts Institute of Technology, Stanford University, the University of Chicago, the University of California Los Angeles, the University of Michigan, the University of North Carolina, the University of Southern California, the University of Texas at Austin, the Wharton School of the University of Pennsylvania, and Yale University for helpful comments. Finally, I thank the Wharton School, the Connie K. Duckworth Endowed Doctoral Fellowship, the Deloitte Foundation, and MIT for their generous financial support.
Electronic copy available at: https://ssrn.com/abstract=3197640
1
1. Introduction
Information asymmetry between government agencies and their suppliers creates uncertainty
about the ability of suppliers to fulfill their commitments. For example, agencies require information to
assess whether the supplier has the financial resources to deliver the goods and services specified in the
contract and provide services or spare parts on an ongoing basis. To reduce the costs associated with this
information asymmetry, the U.S. federal government requires prospective and existing suppliers to have
certain financial attributes and internal information systems—particularly those suppliers that represent
an influential portion of its purchases. Building on prior literature, I predict that, to the extent that these
requirements improve suppliers’ internal information processes, government procurement will lead to
higher quality external reporting.
I investigate this prediction using a comprehensive dataset of over $7 trillion in U.S. government
contracts awarded between 2000 and 2016.1 These contracts provide a powerful setting to examine how
customer requirements on internal information processes relate to the supplier’s information environment
for several reasons. First, these contracts represent a substantial component of the U.S. economy. On
average, the U.S. government awards over $400 billion in contracts each year; it is the single largest buyer
of goods and services in the country. As a result, its requirements impact many suppliers. Second, the U.S.
government’s requirements and verification procedures are extensive and far more detailed than financial
audits performed by external auditors (DCAA, 2012). These procedures are formalized by the Federal
Acquisition Regulations (FARs), which include specific requirements pertaining to contractors’ internal
information processes. For example, prior to awarding a contract, the government determines whether a
prospective contractor has adequate financial resources and the necessary organization, accounting
1 The Federal Funding Accountability and Transparency Act of 2006 mandates the U.S. government to publicly disclose detailed information on its transactions with organizations receiving federal funds. These data are available in the Federal Procurement Data System–Next Generation database (FPDS–NG) at www.USAspending.gov. The initial site went live in 2007 and provides data starting in fiscal year 2000.
Electronic copy available at: https://ssrn.com/abstract=3197640
2
systems, and accounting and operational controls to perform the contract (e.g., Feldman and Keyes, 2011).
For some contracts, the government continues to monitor financial and operational compliance and
performance. More importantly, unlike for customers in the private sector, data on U.S. government
contracts are publicly available, enabling market participants (and researchers) to infer the scope and focus
of the requirements on suppliers, which vary with contract size and characteristics.2
I argue that government requirements on contractors’ internal information processes (i.e., the
implementation and monitoring of certain internal information systems) improve their external reporting
environment. This prediction relies on the joint hypothesis that (1) government requirements improve
firms’ internal information and (2) higher quality internal information leads to better external reporting.
With regard to the first link, I argue that contractors improve their internal information processes to satisfy
the requirements imposed by the FARs, resulting in an increase in quality. In other words, customer
demand justifies the implementation of costly systems that improve the internal information environment
and might otherwise not be cost effective. With regard to the second link, theoretical and empirical
research suggests a positive relation between the quality of the firm’s internal information processes and
external reporting environment: as managers gain access to higher quality internal information, this
information should manifest itself in improved external reporting (e.g., Verrecchia, 1990; Zimmerman,
2013).3 Consequently, if government requirements improve the production of internal information (e.g.,
by requiring accounting systems that more extensively track and project costs), then they should be
associated with better external reporting.
On the other hand, government procurement requirements need not result in an improved external
information environment. Institutional theories suggest that firms adopt externally imposed management
2 One added benefit of these data is their availability for all contract amounts. In contrast, the Compustat segment files only provide data for customers that represent over 10% of annual firm sales. 3 For example, firms with internal control weaknesses tend to generate lower quality management forecasts, as managers rely on erroneous internal reports (Feng, Li, and McVay, 2009). For further examples, see Doyle, Ge, and McVay (2007); Ashbaugh-Skaife, Collins, Kinney, and LaFond (2008); Dornates, Li, Peters, and Richardson (2013); and Ittner and Michels (2017).
Electronic copy available at: https://ssrn.com/abstract=3197640
3
accounting systems (i.e., ones that do not emerge from internal needs) in a superficial manner—
particularly those dependent on government funding (e.g., Scott, 1987; Geiger and Ittner, 1996; Sandholtz,
2012). Without substantive integration of these systems into their internal activities, contractors may make
little use of them for internal purposes and find their information environment unchanged. The government
may also not be effective or timely in its evaluation and monitoring of contractors, as a recent backlog of
contractor audits and evidence of audit deficiencies by the Defense Contracting Audit Agency (DCAA)
suggest (e.g., GAO, 2009; Francis, 2013). In addition, even if systems are integrated into contractors’
internal activities, they might be contract-specific, as opposed to firm-wide, and not applicable to external
reporting in any meaningful way.
I test my prediction using two attributes of the firm’s external reporting environment. First, I use
the quality of voluntary disclosure, measured by the existence of a management forecast over the fiscal
year and the number of forecasts provided (e.g., Shroff, Sun, White, and Zhang, 2013). Consistent with
disclosure theory (e.g., Verrecchia, 1990), I expect managers with better internal information to increase
voluntary disclosure (e.g., the likelihood, frequency, scope of their forecasts, or a combination of these).
That is, improvements in procurement-imposed internal information processes likely manifest in
improved projections of costs and revenues. Contractors are thus more likely to produce management
forecasts, and those forecasts are likely to be more frequent.
Second, I use the speed of a firm’s earnings announcement release after fiscal year-end. Gallemore
and Labro (2015) argue that the speed of the earnings release reflects the firm’s ability to efficiently
integrate information and discuss how firms that improve their information acquisition typically accelerate
the closing of their books. If government contracts result in improved internal information systems, I
would also expect accelerated releases of earnings announcements.
I measure the extent of internal information process requirements on firms using the existence and
size of government contracts, relative to the firm’s total sales. These variables allow me to examine
Electronic copy available at: https://ssrn.com/abstract=3197640
4
whether having a government contract itself has implications for the firm’s external reporting
environment, and whether the firm’s external reporting environment varies with the fraction of the firm’s
sales made to the government.4 Consistent with my prediction, I find a positive association between the
existence and size of government contracts and the subsequent quality of contractors’ external reporting
environment, after controlling for a host of potential confounders.
Although this association provides initial evidence of my prediction, it is subject to many potential
identification concerns. For example, the government may select firms with certain unobservable
attributes correlated with external reporting practices (e.g., high quality management), or firms may
improve their external reporting quality to increase their chances of winning a contract. Contract awards
may also increase the stability of firms’ earnings and cash flows and change their external reporting
attributes. To reduce such concerns, I use the establishment of the Cost Accounting Standards Board
(CASB) to study the effect of a change in the largest defense contractors’ internal information
requirements on their external reporting environment. In 1970, Congress established the CASB for the
purpose of promulgating a set of uniform Cost Accounting Standards (CAS) for defense contractors,
marking a significant increase in the requirements on their internal information processes.5 The advantage
of this analysis is that it exploits time-series variation in the requirements on well-established government
contractors, which helps alleviate concerns that my results are driven by differences between contractors
and noncontractors or potential confounders related to the award of a contract.
Employing a difference-in-differences design, I examine changes in the quality of the external
information environment of top 100 defense contractors around the establishment of the CASB. Because
the data on voluntary disclosure and earnings release dates are not readily available for this period, I use
a measure of illiquidity to proxy for external reporting quality, employing the proportion of zero return
4 My results are very similar when using the unscaled dollar amount obligated by the government, which represents an alternative measure of contract size from the government’s perspective. 5 All national defense contractors with contracts in excess of $100,000 were required to comply with the CASB’s regulations.
Electronic copy available at: https://ssrn.com/abstract=3197640
5
trading days in a given fiscal year (e.g., Lang, Lins, and Maffett, 2012). Consistent with my prediction, I
find a decrease in illiquidity for the top defense contractors after the establishment of the CASB, relative
to a control group of other firms in the same industry. Specifically, I find a persistent drop in illiquidity
after 1972—when the first two CAS became effective—and no discernible difference in illiquidity
between the treatment and control groups prior to the establishment of the CASB.
I perform several additional analyses in an effort to tighten the link between government contract
awards and changes in firms’ external reporting environment and corroborate the internal information
improvement mechanism. I begin by narrowing my focus to first-time government contractors. In contrast
to established contractors, these firms likely experience the strongest effects from procurement-related
requirements and should have significant time-series variation in their information environments. This
setting also allows me to track first-time contractors over time to observe when the quality of their
information environment changes, relative to the year of the initial award. Firms might begin adjusting
their reporting environment (a) during—or perhaps even in anticipation of—the government’s pre-award
evaluations, (b) when they are awarded the contract, or (c) afterward.
Using a difference-in-differences design, I find that the quality of external reporting improves when
firms begin contracting with the government. Specifically, the improvements appear in the year after the
initial contract award and seem persistent, while there are no discernible differences in external reporting
quality between first-time contractors and the control group prior to the contract award. Observing within-
firm improvements in the quality of the information environment around the initial contract award reduces
concerns that my results are driven by an omitted firm-specific factor, as opposed to the contract award.
I next examine whether the association between government contracts and external reporting varies
predictably with contract characteristics that directly influence the extent of the government’s internal
information requirements on contractors. These cross-sectional tests help provide corroborating evidence
on the internal information mechanism linking contract awards to improvements in external reporting and
Electronic copy available at: https://ssrn.com/abstract=3197640

6
reduce concerns that an omitted factor or alternative channel is driving my results. Within my sample of
government contractors, I find that the association between the size of the award and subsequent voluntary
disclosure varies with several contract characteristics that influence the extent of internal information
requirements: (1) whether the contractor has cost-reimbursement contracts; (2) whether the contractor
must adopt CAS; (3) whether the contractor must provide cost or pricing data; (4) whether the contractor
provides goods and services not available on commercial markets (e.g., missiles), as noncommercial items
are subject to greater government scrutiny than commercial ones (e.g., photocopiers); and (5) contract
duration. The evidence is consistent with more extensive requirements on internal information processes
being an impetus for my results.
Overall, this paper takes a first step in understanding the interaction between government-mandated
internal information systems and firms’ external reporting practices. Although I employ several distinct
tests to triangulate my results, each of these tests is predicated on a number of assumptions and subject to
identification concerns, and I caution the reader to be mindful of these limitations when drawing inferences
from the results.
Collectively, my results suggest that the government as a customer helps shape the firm’s external
reporting environment. To the extent that the oversight practices used by the government resemble those
used in other settings, my results may generalize beyond the government sector.6 In this regard, this study
contributes to a growing literature on the role of non-investor stakeholders, such as supply chain
participants, in shaping the firm’s information environment. One stream of papers studies how customers’
and suppliers’ demand for financial accounting information to assess firms’ underlying economic
performance influences reporting quality.7 A different stream focuses on how specific supplier monitoring
6 For example, cost-plus contracts in the construction industry typically require supplier cost audits (see http://content.aia.org/sites/default/files/2017-07/A102_2017.sample2.pdf for an example); and licensing agreements in the entertainment industry typically require revenue audits (Kim-Gina, 2018). 7 For example, Hui, Klasa, and Yeung (2012) suggest that firms cater to their customers’ or suppliers’ demand for greater accounting conservatism by recognizing more timely losses. See also Bowen, Ducharme, and Shores (1995), Raman and Shahrur (2008), and Costello (2013).
Electronic copy available at: https://ssrn.com/abstract=3197640
7
mechanisms improve firms’ operating performance (e.g., through information sharing, supplier audits, or
supplier certification).8 My study integrates these two literatures by examining how supplier oversight
mechanisms requiring the implementation and monitoring of internal information processes, rather than
the demand for financial accounting information, relates to their external reporting environment.
This paper also contributes to the literature linking firms’ internal information and external
reporting. In contrast to the textbook view that internal information requirements should be distinct from
those necessary for external reporting (e.g., Kaplan and Atkinson, 1998), a recent stream of literature
shows that firms’ internal and external reporting processes are closely aligned.9 My paper adds to this
literature by suggesting that improvements to internal information processes can be associated with better
external reporting.
Finally, my paper adds to the broader literature on the implications of government oversight for
firms’ financial reporting. While the effects of direct regulatory oversight on reporting are well studied,
less is understood about indirect channels through which government requirements might also affect
financial reporting practices. A recent study by Hanlon, Hoopes, and Shroff (2014) suggests that
monitoring by the tax authority helps improve reporting quality. Although, in some cases, an IRS audit
may include an examination of the firm’s internal controls and other processes related to financial
reporting, in the procurement setting, such monitoring procedures are far more extensive, and audit rates
far more frequent.10 Government procurement thus arguably represents a powerful setting to examine the
influence of government oversight on firms’ financial reporting.
8 See, e.g., Ittner, Larcker, Nagar, and Rajan (1999); Caglio and Ditillo (2008); and Anderson and Dekker (2009). 9 See e.g., Dichev, Graham, Harvey, and Rajgopal (2013); Gallemore and Labro (2015); Ittner and Michels (2017); and Shroff (2017). 10 See the Internal Revenue Manual (e.g., IRM 4.10.3) for specific IRS audit protocol, and data on audit rates at https://trac.syr.edu/tracirs/highlights/current/. Over the past two decades, IRS audit rates were between 20%–40% for the largest firms (total assets exceeding $250 million) and much lower for smaller firms. In contrast, virtually every government contractor undergoes some form of review either by a contracting officer, the DCAA, or both. See section 2 for further details.
Electronic copy available at: https://ssrn.com/abstract=3197640
8
2. Background and predictions
2.1 Institutional background
U.S. government procurement begins when an agency decides to purchase a product or service. To
help ensure that agencies obtain the best value with taxpayers’ money, the Federal Acquisition Regulations
(FARs) codify policies and procedures for each stage of this process. The agency’s contracting officer
(CO) first posts a request for proposal on the Federal Business Opportunities website, and prospective
contractors submit their offers. In addition to evaluating the offers, FAR 9.104 requires the CO to
determine whether a prospective contractor meets a number of “responsibility” criteria, including access
to adequate financial resources to perform the contract (FAR 9.104-1(a)) as well as the necessary
organization, experience, accounting and operational controls, and technical skills, or the ability to obtain
them (FAR 9.104-1(e)). FAR 9.105 requires the CO to obtain information and document that the
prospective contractor meets these standards. For example, the CO performs pre-award surveys to evaluate
prospective contractors’ financial and technical capabilities and accounting systems; the latter must be
sufficiently detailed to estimate, accumulate, and allocate the type of cost information required by the
contract. After the award, the CO continues to monitor contractors to ensure that these requirements
continue to be met (e.g., by performing an annual financial condition risk assessment).
Contract types are grouped into two broad categories: fixed price and cost reimbursement (FAR
16.101). In fixed-price contracts, the contractor provides a product or service to the government at a fixed
price that is not adjustable to incurred costs and bears full responsibility for the performance costs and
resulting profits or losses. FAR 16.202 deems that this form of contract is suitable when the CO can
establish fair and reasonable prices at the outset, to avoid potential renegotiations by the contractor. For
example, a fixed-price contract is used when there is adequate price competition or there are reasonable
price comparisons (FAR 16.202-2(a,b)), when available cost or pricing data provides realistic estimates
of the probable costs of performance (FAR 16.202-2(c)), or when performance uncertainties can be
Electronic copy available at: https://ssrn.com/abstract=3197640
9
identified and reasonable estimates of their cost impact can be made (FAR 16.202-2(d)). Providing these
estimates requires the accounting system to validate determinations of costs already incurred and support
estimates of future costs (e.g., provide data supporting projections of business prospects and related
operations costs, unit-cost trends such as those associated with labor efficiency, etc. (FAR 2.1)).
In cost-reimbursement contracts, revenue equals the contractor’s incurred cost of production plus a
fixed fee or profit margin. These contracts typically establish an estimate of total cost as a ceiling that the
contractor must not exceed (FAR 16.301-1). Prior to awarding the contract, the CO must obtain reasonable
assurance that efficient methods and effective cost controls are being used and that the accounting system
can determine costs applicable to the contract (e.g., can accurately track costs, segregate direct and indirect
costs, and allocate costs to their cost objects) (FAR 16.301-3). During contract performance, the contractor
bills the government for incurred costs, which are reviewed prior to issuing payment. The CO must
determine whether the costs are accurate, allowable, allocable to the contract, and in compliance with
applicable cost principles (e.g., government-mandated CAS). This process typically includes an in-depth
analysis of each cost item and may necessitate an audit of the underlying processes (e.g., billing, accounts
payable, labor timekeeping, etc.).
Importantly, the procedures the government performs to ensure that contractors meet these
requirements are much more extensive and detailed than financial audits performed by external auditors
or other government monitors (e.g., the tax authority). The DCAA supports COs from all government
agencies in their procurement decisions, as needed, and audits a substantial amount of incurred contractor
costs (e.g., in fiscal year 2017, the DCAA audited $281 billion in incurred costs (DCAA, 2018)). The
DCAA’s general audit interests are threefold: (a) identify and evaluate all activities that either contribute
to, or have an impact on, proposed or incurred costs of government contracts; (b) evaluate contractors’
financial policies, procedures, and internal controls; and (c) perform audits that identify opportunities for
contractors to reduce or avoid costs (i.e., operations audits) (DCAA, 2012). Although some of these audit
Electronic copy available at: https://ssrn.com/abstract=3197640
10
interests resemble those performed by external auditors (e.g., internal control audits), DCAA audits tend
to be broader and focus on account balances and cost elements that pertain to the contract in much greater
detail (Ahadiat and Ehrenreich, 1996).11 In short, virtually every contractor is subject to a review of the
internal information processes described above, either by the CO, the DCAA, or both.
2.2 Empirical predictions
2.2.1 Government contracting and the external reporting environment
I predict that government procurement is positively associated with the quality of contractors’
external reporting environment. This prediction relies on two arguments. First, the extensive requirements
imposed on contractors’ internal information processes by the FARs, as described in section 2.1, likely
improve the quality of these processes. Contractors may (i) implement systems they did not have or
enhance existing systems (either after t he contract award or in anticipation of it), (ii) undergo increased
monitoring of these systems, or both. Importantly, this argument assumes that contractors are willing to
undergo such changes to their internal information processes to comply with customer requirements, and
that these would otherwise not be deemed cost effective. This assumption seems reasonable, as the
literature suggests that firms tend to implement management accounting standards more deeply when
customers care about implementation or conduct more frequent inspections (e.g., Christmann and Taylor,
2006). Compliance with the FARs is key for government contractors, as inadequacies could result in
withheld billed receivables and the suspension of payments, contract termination, and suspension from
doing business with the government (FAR 9.4).
Second, to the extent that improvements in contractors’ internal information are relevant to external
reporting, I argue that such improvements will manifest themselves in higher quality external reporting.
The literature suggests that firms’ processes used for internal decision-making closely relate to those used
11 Similarly, although, in some cases, an IRS audit might entail a review of internal controls, inspection of physical assets, and interviews with employees (IRM 4.10.3), the IRS does not have requirements pertaining to the existence of specific internal information processes.
Electronic copy available at: https://ssrn.com/abstract=3197640
11
for external reporting. For example, Hemmer and Labro (2008) provide analytical evidence of a link
between financial accounting rules and management accounting systems. Dichev, Graham, Harvey, and
Rajgopal (2013) survey managers and find that over 80% assert that there is “a tight link between internal
and external reporting” (p. 10). Several papers examine specific attributes of internal information
processes, such as the implementation of enterprise systems or risk-based forecasting and planning, and
find that they are related to higher quality external reporting (e.g., Dornates, Li, Peters, and Richardson,
2013; Ittner and Michels, 2017). Of particular relevance to this argument, Corollary 1 of Verrecchia (1990)
predicts that an increase in the quality of the manager’s private information will result in improved external
reporting through more voluntary disclosure. Specifically, if the market observes that firms are endowed
with better information, it exerts more pressure on managers to provide voluntary disclosure by
discounting the firm’s price more heavily if information is withheld. As government contract awards are
publicly observable, I argue that the market expects improvements in contractors’ internal information
systems to result from their compliance with the FARs, resulting in improved external reporting.
The FARs require government contractors to collect and produce internal information that likely
improves their external reporting quality. For example, an accounting system that better tracks costs and
allocates them to cost objects is likely to produce information that more accurately reflects the economics
of the contractors’ underlying transactions (e.g., more accurate inventory and cost of goods sold accounts,
both at the segment and aggregate levels). In addition, contractors’ accounting systems must provide
estimates of future performance and cost projections, for example, by estimating total future costs in
support of cost-reimbursement contracts and providing cost or pricing data in support of fixed-price
contracts.12 Such estimates will likely aid management in forecasting earnings and other aggregate
accounting numbers. More generally, detailed audits of internal controls and accounting systems
underlying incurred and estimated costs (e.g., billing, accounts payable, labor timekeeping, etc.) also
12 See sections 2.1 and 2.2.2 for further details.
Electronic copy available at: https://ssrn.com/abstract=3197640

12
enhance the quality of internal information processes, which are useful in producing numbers for external
reporting.
On the other hand, there are several reasons the government’s requirements might not be related to
their contractors’ information environments. First, institutional theories argue that firms tend to adopt
management accounting systems imposed by external forces, such as legislative mandates or customers,
in a superficial fashion, without substantive integration into their daily activities. Although firms gain
legitimacy by implementing the systems, they may make little use of them internally (e.g., Bromley and
Powell, 2012; Sandholtz, 2012; Angst, Block, D’Arcy and Kelley, 2017). In particular, Scott (1987) argues
that management accounting systems imposed by government organizations on subordinate units that
depend on their funding tend to be implemented superficially, consistent with the findings in several
studies (e.g., Geiger and Ittner, 1996; Cavaluzzo and Ittner, 2004). These procedures might thus merely
represent an administrative burden.
It is also possible that the government’s procedures are not effective or timely in evaluating and
monitoring contractors’ information processes. In recent years, the government has built up a substantial
backlog of contractor audits, suggesting that it might not be performing required procedures (e.g., Francis,
2013), and the U.S. Government Accountability Office has published several reports highlighting
deficiencies in DCAA audits, such as compromise of auditor independence, insufficient audit testing, and
inadequate planning and supervision (e.g., GAO, 2009). Finally, even if the government’s evaluations and
monitoring are effective and these systems are deeply integrated into contractors’ internal activities,
improvements in some dimensions of internal information systems might not necessarily affect external
reporting. Unlike financial audits, the scope of government audits tends to be contract-specific, as opposed
to firm-wide, and their objective is not to assess the quality of external reporting.
Another consideration is that government-imposed costing requirements could divert resources
from other—perhaps more useful—internal systems. In particular, the FARs designate certain costs as
Electronic copy available at: https://ssrn.com/abstract=3197640

13
“unallowable”; they cannot be included in cost estimates or contract cost reimbursements. These include
public relations and advertising costs, bad debts, contingencies, lobbying and political costs, among others
(FAR 31.205). If contractors tailor their costing systems to the regulatory standards required for
reimbursement at the expense of more accurate costing systems, this could harm their measurement of
performance (e.g., Kaplan and Porter, 2011).13
2.2.2 Contractual characteristics and internal information requirements
In this section, I discuss five specific contract characteristics that impose more extensive requirements on
contractors’ internal information processes and increase the likelihood of heightened scrutiny by the
government. As vendors tend to implement management accounting standards more deeply when
customers conduct more frequent inspections (Christmann and Taylor, 2006), I predict a stronger
association between government procurement and external reporting quality for suppliers with contracts
that have any of these characteristics.
2.2.2.1 Cost-plus vs. fixed-price contracts
As discussed in section 2.1, contract pricing terms fall into two basic categories: fixed-price and
cost-reimbursement (also referred to as “cost-plus”) contracts.14 Cost-reimbursement contracts provide the
contractor with incentives to manipulate reported costs through cost inflation or cost shifting, which
typically leads the government to impose greater requirements on their internal information processes
(e.g., Rogerson, 1992; Chen and Gunny, 2014).15
13 By way of example, this problem is particularly acute in healthcare, where providers largely structure their costing processes around Medicare’s cost-plus reimbursement system, as opposed to their actual resource usage. According to Kaplan and Porter (2011), this results in “an almost complete lack of understanding of how much it costs to deliver patient care, much less how those cost compare to the outcomes achieved” (p. 48). 14 Contracts range on a spectrum between these two categories, from firm fixed price, fixed price incentive, cost plus incentive to pure cost plus. (Very few contracts are pure cost reimbursement contracts.) Incentive-type contracts can provide additional incentive to rein in costs below a certain threshold (e.g., a fixed price incentive contract specifies a target cost that, if achieved, increases the contract price up to a ceiling). I group all contracts in these two categories for the purpose of my analyses. 15 In support of this point, the DCAA’s 2014 report to Congress states that the agency prioritizes audits of contracts considered “high risk,” such as “circumstances where there may be less incentive to control costs such as on cost-type contracts” (DCAA, 2015, p.7).
Electronic copy available at: https://ssrn.com/abstract=3197640

14
2.2.2.2 Compliance with Cost Accounting Standards
Certain contractors must comply with Cost Accounting Standards (CAS), a set of 19 government-
specific accounting rules designed to achieve uniformity and consistency in their cost accounting
practices. These standards control how costs are measured, accumulated, and allocated to a final cost
object and are far more detailed than cost accounting guidance provided by GAAP.16 Depending on the
amount and type of contract award, a contractor could be subject to full CAS coverage (required to follow
all 19 standards), or modified coverage (required to follow only a subset of four standards, including
standards on consistency, the cost accounting period, and accounting for costs that are unallowable under
the FARs). Some contractors are exempt from CAS requirements altogether (e.g., sealed-bid contracts,
negotiated contracts under $500,000, etc.). Contractors subject to CAS coverage must formally document
and disclose their cost accounting practices in detail and are expected to follow the disclosed practices
consistently. The CO evaluates whether the disclosure statement adequately describes the contractor’s
cost accounting practices, whether the practices comply with the CAS, and whether they are followed
consistently.
2.2.2.3 Compliance with the provision of cost or pricing data
In certain circumstances, contractors must submit cost or pricing data along with their price
proposal and certify that the data are accurate, complete, and current through a “Certificate of Current
Cost or Pricing Data.” This requirement applies to contracts exceeding $700,000. However, when the
contract falls below this threshold, the CO can still request cost or pricing data (without a certification) if
they are necessary to establish a fair and reasonable price (FAR 15.4). The CO and DCAA then review
16 For example, CAS 401 requires accounting systems to estimate and accumulate costs in the same manner to avoid that a contractor estimates costs using one method (generating low costs) and then allocates costs using a different one (generating high costs). CAS 402 requires consistency in allocating costs incurred for a same purpose to avoid double counting (e.g., to avoid that cost items are allocated directly to a cost object and also included in indirect cost pools allocated to the same cost object). CAS 403 establishes criteria for the allocation of home office expenses to various segments. CAS 410 establishes criteria for the allocation of business unit general and administrative expenses to final cost objects. CAS 418 provides guidance for the consistent determination of direct and indirect costs. In contrast, GAAP does not directly address any of these issues.
Electronic copy available at: https://ssrn.com/abstract=3197640

15
the data and any necessary supporting schedules and documentation to establish their accuracy.
2.2.2.4 Procurement of commercial items
Commercial items are products of a type customarily used for nongovernment purposes and offered
to the general public or services offered to the government and the general public contemporaneously
under similar terms and conditions (e.g., office equipment, janitorial services, etc.). Such products and
services are subject to the discipline of the marketplace, reducing the need for processes to help achieve
competitive prices and efficient production. The FARs include a set of simplified and streamlined
acquisition procedures for commercial items, including the usage of only fixed price methods and the
reliance on the contractor’s quality assurance system as a substitute for government inspection and testing
(FAR 12). For many of these contracts, the FARs encourage simplified methods of contractor evaluation
limited to technical capability, price, and past performance. Moreover, such contracts are generally exempt
from Cost Accounting Standards (CAS) and from providing cost or pricing data to the contracting officer
(FAR 12.2).
2.2.2.5 Contract duration
Finally, I examine contract duration. Longer contracts represent a greater commitment by
government agencies and typically consume more government resources. I thus expect longer contracts
to impose heightened procurement-related requirements on contractors’ internal information processes.
3. Sample
My sample begins in October 1999, when data on federal procurement becomes available on the
Federal Procurement Data System–Next Generation database (FPDS–NG) (available at
www.USAspending.gov), and ends in September 2016 (spanning government fiscal years 2000–2016,
which run from October 1 through September 30). The database includes all contracts that are awarded
Electronic copy available at: https://ssrn.com/abstract=3197640

16
by the U.S. government and that exceed an individual transaction value of $3,000.17 Many firms have
multiple contracts that span several years. Consistent with prior research using these data (e.g., Mills,
Nutter, and Schwab, 2013; Goldman, Rocholl, and So, 2013), I use a firm’s aggregate contract award
amount for each fiscal year. I merge federal contract data from FPDS–NG with the CRSP/Compustat
population by the name of the vendor’s parent company, using a fuzzy matching algorithm. I then
manually inspect each match and delete any inaccurate matches. This yields a sample of 79,383 firm-year
observations, of which 23,182 are firm-years with government contract awards, representing 3,108 firms.18
Table 1, Panel A, provides details about yearly aggregate government contract awards on the
FPDS–NG by year. Between 2000 and 2016, the government awarded on average $421 billion in contracts
per year. About 26% of this amount represents cost reimbursement contracts, 20% is subject to CAS and
requires that contractors provide cost or pricing data to government agents, 81% represents contracts for
non-commercial products or services, and 50% has an average duration of over a year. Panel B provides
details about my sample of government-contract awards merged with the CRSP/Compustat population.
The sample represents about 40% of the total contract value, and the distribution of contract characteristics
resembles that in Panel A.19 Panel C details the industry composition of my sample. The dominant industry
is manufacturing, representing nearly 50% of all government contractors in my sample, followed by
business equipment (25%). Both of these industries have a relatively high proportion of cost
reimbursement contracts (36% and 24%, respectively), contracts requiring the adoption of CAS (32% and
17 A “contract” is any number of transactions between the government and the contractor, which includes the initial “contract award,” any subsequent “modifications” (e.g., an exercise of an option to modify the contract), or a “purchase order” pertaining to the contract. 18 Because many firms in my sample have subsidiaries that contract with the government, many contracts represent a negligible percentage of the parent firm’s sales, accounting for the highly right-skewed distribution in Table 2, Panel B. On the one hand, if a parent has subsidiaries that make substantive changes to their internal information processes, this could reflect improvements in the parent’s consolidated financial statements, even if their sales to the government are small, relative to the parent’s total revenue. On the other hand, if subsidiaries’ sales are negligible, relative to those of the parent, it is unclear to what extent they will influence the consolidated financial statements in the first place. Thus it is unclear which cutoff is appropriate, and I opted to include all government contracts in my analysis to avoid making a judgement call on this point. 19 Note that my data ends with government fiscal year 2016, on September 30, 2016. Consequently, my sample of firms with fiscal years 2016 is limited to firms with fiscal year-end dates between June 30 and September 30, 2016.
Electronic copy available at: https://ssrn.com/abstract=3197640

17
42%), contracts requiring the provision of cost or pricing data (29% and 39%), and noncommercial
contracts (88% and 95%). These industries also tend to have more contracts with a duration of over one
year (55% and 73%, respectively).
4. Research design and results
4.1 Government contracting and the information environment
I begin by examining the association between government contracting and the firm’s external
reporting environment. I use two distinct measures of contracting. First, I use Contract, an indicator
variable equal to one if the firm has a nonzero amount of federal dollars obligated through contract awards
in year t and zero otherwise. Using an indicator variable allows assessment of whether having a
government contract itself has implications for the firm’s external reporting environment. Second, I use
$Contract/Sales, a continuous measure of contract award size, relative to the firm’s sales. I expect the
government’s internal information requirements to vary with $Contract/Sales for two reasons. First, the
extent of these requirements is related to the dollar amount obligated by the government. Second, the
extent of the contractor’s compliance with government-imposed changes to its internal information
processes—and any resulting spillovers on the firm as a whole—likely varies with the importance of the
contract from the contractor’s perspective.20 Because $Contract/Sales is heavily right-skewed (see Table
2, Panel B), I transform the variable into quintile ranks scaled to range from 0 to 1.21 This transformation
has the advantage of being robust to both outliers and nonlinearities and eases the interpretation of the
results (i.e., the estimated regression coefficient measures the change in the dependent variable when
moving from the bottom quintile to the top quintile of contract size, ceteris paribus).
20 An alternative measure of contract size is to use the unscaled total amount obligated by the government (DollarsObligated), which directly measures the importance of the contract from the government’s perspective (e.g., Duguay, Rauter and Samuels, 2019). My results are robust to using this alternative measure adjusted for inflation (untabulated). 21 Consistent with prior studies (e.g., Mills, Nutter and Schwab, 2013), government contractors have an average annual contract value of about 5% of sales, and the distribution of this variable is heavily right-skewed, with a median of 0.1%, and a rapid increase in the top decile, from 5% at the 90th percentile to 77% at the 99th percentile. Contractors’ average amount of annual federal dollars obligated is $124 million, with a median of about $628,000. My results are also robust to using the natural logarithm of one plus $Contract/Sales as an alternative measure (untabulated).
Electronic copy available at: https://ssrn.com/abstract=3197640

18
Because firms’ internal information processes are unobservable, my research design warrants
measures of external reporting quality that relate as closely to internal information as possible. First, I use
two measures of voluntary disclosure. Consistent with disclosure theory, if the market observes that firms
are endowed with higher quality information (e.g., by observing the award of a government contract,
resulting in mandatory compliance with the FARs), it exerts more pressure on managers to provide
voluntary disclosure, and managers will disclose more. To adhere closely to this prediction, I use the
existence of management forecasts (VolDisc) and the number of forecasts issued over the fiscal year
(VolDisc_Freq) as measures of external reporting quality.22 Arguably, these measures relate closely to the
quality of firms’ internal information processes as required by the FARs. For example, improved cost
projections and pricing data are likely to facilitate the production of management forecasts, and forecasts
are likely to be more frequent and greater in scope.23 To capture voluntary disclosure broadly, I include
all available forecast items that the firm issued over the fiscal year, including quarterly and annual EPS,
EBITDA, operating profit, sales, capex, etc.24
Second, I use the speed of a firm’s earnings release, measured as the number of days between the
earnings announcement and the fiscal year-end, divided by 365 and multiplied by -1 (Speed). Gallemore
and Labro (2015) argue that the speed of the earnings release reflects the firms’ ability to quickly and
efficiently integrate information and discuss how firms that receive professional advice on how to improve
their information acquisition typically increase the speed at which they close their books. Many consulting
firms help contractors implement DCAA-compliant accounting and ERP systems to generate the
information required by government agencies. If government contracts result in improved internal
22 My results are also robust to using the natural logarithm of one plus VolDisc_Freq as the dependent variable (untabulated). 23 Consistent with the predictions of Verrecchia (1990), my results are also robust to using the likelihood and frequency of bad news forecasts, defined as management forecasts that fall short of the prevailing analyst consensus (untabulated). 24 Although IBES Guidance data does not include measures of firms’ cost forecasts, cost estimates can arguably be inferred if the firm provides both earnings and sales forecasts. I find that my results are robust to using the likelihood that the firm provides both an earnings and sales forecast over the fiscal year as an alternative dependent variable, consistent with the firm also increasing its cost forecasts (untabulated).
Electronic copy available at: https://ssrn.com/abstract=3197640
19
information systems, then I would also expect an acceleration in the firm’s release of earnings
announcements.
I examine the relation between government contracting and the quality of the firm’s external
reporting by estimating OLS regressions of the form:
Reportingt+1 = α0 + α1 Contractingt + θn Controlst + εt, (1)
where Contracting is one of two measures of government contracting defined above, Controls is a vector
of control variables listed and defined in Appendix A, and Reporting is one of three measures of the firm’s
external reporting quality defined above. Note that I measure Reporting in the year after the contract award
(t+1), which is the latest point at which I expect the firm’s reporting environment to adjust as a result. See
Appendix A for all variable definitions. I also include year and industry fixed effects in all my
specifications to control for common shocks that might impact both contract awards and firms’
information environment (e.g., defense spending) and industry practices unrelated to the government’s
internal information requirements. Throughout all my analyses, I cluster standard errors by firm and
winsorize all continuous variables at the top and bottom percentile.
Table 2, Panel A, presents descriptive statistics for my variables. About 47% of firm-years in my
sample provide a management forecast, and average forecast frequency is about 4.8. The average Speed
of a firm’s earnings announcement release is –0.14, about 51 days after year-end (0.14*365 = 51.1).
Descriptive statistics for the control variables show that my sample firms have a mean (median) return on
assets of –0.04 (0.02), a mean (median) leverage ratio of 0.22 (0.17), a mean (median) market-to-book
ratio of 5.4 (3.6), and mean (median) sales growth of 0.15 (0.07). Approximately 31% of firm-years in my
sample report a loss, and the average (median) annual buy-and-hold return is about 11.5% (5.1%) over
the fiscal year. Panel B provides descriptive statistics for my sample of government contractors. Notably,
firms in this sample tend to be larger, better performing, have lower return volatility, lower sales growth,
and lower growth opportunities, which underscores the need to control for these variables in my tests.
Electronic copy available at: https://ssrn.com/abstract=3197640
20
Table 3, Panel A, presents results from estimating equation (1). My measure of government
contracting is Contract in columns (1), (3), and (5), and $Contract/Sales in columns (2), (4), and (6). I
find positive and significant coefficients on Contract across all specifications, indicating that the quality
of external reporting for firms that contract with the government is significantly higher, relative to firms
that do not. Specifically, contractors are about 6.4% more likely to issue a management forecast, issue
about one additional forecast over the fiscal year, and release earnings about two days earlier (0.005 x 365
= 1.825). I also find positive and significant coefficients on $Contract/Sales across all specifications,
indicating that the same results apply to variations in contract size: firms with a larger percentage of sales
to the government have higher quality external reporting. Specifically, firms in the top quintile of
$Contract/Sales are about 9% more likely to issue a forecast, issue about 1.6 additional forecasts, and
release earnings about two days earlier relative to firms in the bottom quintile, without government
contract awards.
To examine to what extent my results are driven by firms with the largest contract awards, relative
to revenue, I also perform these tests for each quartile of $Contract/Sales > 0, relative to the benchmark
group of $Contract/Sales = 0. Specifically, I run the same specification as in Panel A, except that I replace
$Contract/Sales with binary indicator variables equal to one for firm-years within each quartile of
$Contract/Sales > 0 ($Contract/Sales_Q1 - $Contract/Sales_Q4). My results appear in Table 3, Panel B.
With the exception of the specification using Speed as the dependent variable, where the coefficient on
$Contract/Sales_Q4 is not significantly different from the coefficient on $Contract/Sales_Q1, the
coefficients on all other quartiles are monotonically increasing, and significantly greater than
$Contract/Sales_Q1. These results are consistent with the notion that external reporting quality is
increasing in the firm’s exposure to government contracting.
Although these baseline results are consistent with my prediction, they are also subject to certain
limitations. In particular, firms that contract with the government may have higher external reporting
Electronic copy available at: https://ssrn.com/abstract=3197640
21
quality for a variety of reasons, other than changes in their internal information processes. For example,
the government may select firms with certain unobservable attributes correlated with external reporting
practices (e.g., high quality management), or contract awards may increase the stability in firms’ earnings
and cash flows and change these practices. Similarly, contractors may simply improve their external
reporting directly to signal their financial stability, which is also one of the requirements for a contract.
My remaining tests aim to reduce some of these concerns and provide corroborating evidence of my
prediction.
4.2 Difference-in-differences analysis using first-time contract awards
In this section, I begin addressing some of these concerns by narrowing my focus to firms that first
begin contracting with the government. In contrast to established contractors, firms that begin a
contracting relationship likely experience the strongest effects from the government’s requirements and
should have significant time-series variation in their information environment. A design exploiting this
time-series variation allows me to examine the timing of the association between the initial contract award
and improvements in the information environment.25
I identify first-time contractors (treatment firms) as firms that receive an initial contract award in
my sample. To avoid including firms that have had contract awards outside of my sample window, I
require that a firm have at least two years without any federal dollars obligated prior to assigning it to the
treatment group. Moreover, to ensure that the contract award represents a sufficiently material amount to
warrant detectable changes in the firm’s information environment, I further restrict the sample to firms
with a cumulative $Contract/Sales greater or equal to 0.5% of sales over the time-series available in my
sample.26 I use propensity-score matching to form one-to-one matched-pairs by estimating a propensity
25 To illustrate this point, the serial autocorrelation of my treatment variables drops significantly for my sample of first-time contractors, relative to my total sample of contractors, as expected. For my total sample, the first-order, second-order, and third-order autocorrelation in $Contract/Sales (Contract) is 0.89 (0.85), 0.86 (0.81), and 0.83 (0.76), respectively. For my sample of first-time contractors, these numbers are 0.48 (0.64), 0.33 (0.46), and 0.21 (0.28), respectively. 26 Restricting the sample of first-time contractors to those with nonnegligible contract amounts increases confidence that the sample captures contractors that adjust their information processes to accommodate the government’s needs, and that those
Electronic copy available at: https://ssrn.com/abstract=3197640

22
score in the year prior to the treatment firm’s initial contract award as a function of the control variables
in equation (1). I then match each treatment firm to a corresponding control firm, with replacement, on
the propensity score, fiscal year, and industry and estimate the following difference-in-differences
regression.
Reportingt+1 = α0 + α1 Treated x Post + α2 Post + θn Controlst + γ + δ + εt, (2)
where Reporting is one of my three measures of external reporting, Treated is a binary indicator variable
equal to one for treatment firms, and zero for control firms, Post is a binary indicator variable equal to one
for fiscal years ended in the first year of the contract award, and Controls is the vector of control variables
used in equation (1). In addition to control variables, I include year and firm fixed effects, which absorb
the main effect on Treated in the model.
I estimate equation (2) over a period of three years prior to and three years after the contract award,
for a total of seven years. It is unclear precisely when firms begin changing their reporting environment,
relative to their initial contract award. For example, they might begin adjusting their reporting
environment in anticipation of the government’s evaluation procedures (e.g., during, or perhaps even
several years before, the negotiation), at the time they are awarded the contract or thereafter (e.g., when
they become subject to incurred cost audits). To illuminate the timing of this effect, I also examine trends
in external reporting quality around the initial contract award.
Table 4 presents my results. Panel A presents tests for covariate balance between the treatment and
control firms. With the exception of average SalesGrowth, which is marginally greater for the treatment
firms (mean difference = 0.123; p-value = 0.08), all other mean and median differences are not statistically
significant, suggesting that my treatment and control samples are similar, and increases confidence that
any differential change in external reporting for the treatment firms is not driven by pre-existing
changes will manifest themselves in external reporting. As expected, my results become weaker in both magnitude and significance when I also include first-time contractors below this threshold in my sample (untabulated).
Electronic copy available at: https://ssrn.com/abstract=3197640

23
differences between contractors and noncontractors.27 Panel B presents results from the difference-in-
differences regressions. Across all specifications (with and without linear control variables), the
coefficient (α1) is positive and statistically significant, suggesting that the external reporting quality of
first-time contractors improves after the contract award, relative to otherwise similar firms.
I next examine differences in external reporting quality between the treated and control firms by
year around the time of the initial contract award. Specifically, I estimate the same specifications as in
columns (1), (3), and (5), except that I interact Treated with every year, relative to the year of the initial
award, omitting year t-3 (the benchmark). I illustrate these results in Figure 1. For all three measures of
external reporting quality, I find that the difference-in-differences becomes significant in year t and
remains fairly persistent through t+3. Importantly, differences in external reporting quality between the
treatment and control firms are not statistically significant in the pre-period leading to the initial award,
suggesting that the improvements coincide with the award, as predicted.
Although this test reduces the concern that my results are driven by pre-existing differences
between contractors and noncontractors, as captured by my covariates, the concern remains that the
contract award might drive changes in external reporting other than through contractors’ changes to their
internal information processes. For example, the award represents a stream of revenues throughout the
duration of the contract as well as a greater potential for receiving future contracts (e.g., Goldman,
Rocholl, and So, 2013). It may also represent a more persistent stream of future earnings (Cohen and Li,
2016). A contract award is thus arguably good news, which may be related to greater and more timely
disclosure (e.g., Verrecchia, 1983).28 Although some of these factors are likely captured by the controls
27 A potential concern is that firms that first begin contracting with the government could be much younger, relative to other firms, and thus improve their external reporting quality more in the post period. I find that the difference in firm age between my treatment and control firms is not significantly different from zero (mean difference = -0.260; p-value = 0.769), and my results are robust to including firm age as an additional control variable (untabulated). 28 However, note that the effect of more persistent earnings on voluntary disclosure is theoretically ambiguous. Increased future earnings persistence can either result in reduced voluntary disclosure, because investors’ uncertainty about earnings is lower, or increased voluntary disclosure, because managers can better forecast earnings (e.g., Verrecchia, 1990).
Electronic copy available at: https://ssrn.com/abstract=3197640

24
included in my regressions, the concern remains that my models omit other correlated variables of this
nature.
4.3 Cross-sectional variation in characteristics with greater internal information requirements
The purpose of this section is to provide corroborating evidence on the mechanism linking
procurement-related requirements on contractors’ internal information processes to their external
reporting quality. I examine whether, within the sample of government contractors, the quality of their
external reporting varies predictably with contract characteristics that directly influence the scope and
extent of the government’s internal information requirements: (1) CostPlus, a binary indicator variable for
whether the firm has a cost reimbursement contract; (2) CAS, a binary indicator variable equal to one if
the firm has a contract subject to the CAS; (3) CPData, a binary indicator variable equal to one if the firm
has a contract requiring the provision of cost or pricing data to the government; (4) NonComm, a binary
indicator variable equal to one if the firm has a contract to provide noncommercial goods and services;
and (5) Duration, measured as the average annual length of all contracts signed during the fiscal year,
weighted by contract dollar amount, where annual length is the contract completion date minus signed
date, divided by 365.
I also construct an index (Index) combining these measures, using principal component analysis.
Appendix B presents the results from this analysis. The principal component output shows that only a
single factor has an eigenvalue greater than one, and this factor explains 43.2% of the variation in these
measures. The correlation matrix shows that all contract characteristics are fairly highly correlated with
the index and with each other, which suggests that these factors capture a common underlying economic
construct.
Within the sample of firm-years with government contracts, I estimate how the association between
$Contract/Sales and measures of external reporting quality varies with these contract characteristics in the
following model.
Electronic copy available at: https://ssrn.com/abstract=3197640

25
Reportingt+1 = α0 + α1 $Contract/Sales x Index + α2 $Contract/Sales + α3 Index
+ θn Controlst + γ + δ + εt, (3)
where Reporting is one of my three measures of external reporting, Index is as defined above, and Controls
is the vector of control variables used in equation (1). In addition to control variables, I include year fixed
effects as well as industry or firm fixed effects in the model.
Results appear in Table 5. Panel A presents results from examining the univariate association
between contract characteristics and the quality of contractors’ information environment. The panel shows
that firms with contracts that have any of the characteristics with greater internal information requirements
have significantly higher external reporting quality. Such firms are about 4% to 14% more likely to issue
a management forecast, provide between one to three additional forecasts over a given year, and issue
earnings roughly two to four days earlier, depending on the characteristic. These results provide initial
evidence that firms with greater government scrutiny have higher quality information environments.
Panel B presents results from the cross-sectional regressions in equation (3). When using VolDisc
and VolDisc_Freq as the dependent variable, α1 is positive and significant in all specifications, suggesting
that the relation between contract awards and external reporting quality is increasing in the government’s
internal information requirements. However, the relation between Speed and external reporting does not
seem to vary with Index. In Panel C, I examine these cross-sectional associations for each individual
contract characteristic. Each of the five characteristics appears to drive one or several specifications having
VolDisc or VolDisc_Freq as the dependent variable. The relation between $Contract/Sales and Speed is
also significantly greater for firms that have CostPlus contracts (when including year and firm fixed
effects). Collectively, these results are consistent with procurement-related requirements on contractors’
internal information processes being a mechanism behind higher quality external reporting.
Electronic copy available at: https://ssrn.com/abstract=3197640
26
5. Additional analyses
5.1 Establishment of the Cost Accounting Standards Board
A potential concern with the above analyses is that the award of a government contract itself
captures omitted factors correlated with external reporting quality, leading to self-selection, reverse
causality, and other identification concerns. In this section, I aim to reduce these concerns by using the
establishment of the Cost Accounting Standards Board (CASB) as a shock to the largest defense
contractors’ internal information requirements, and assessing its effect on their external reporting.
In the late 1960s, congressional hearings raised concerns over firms making excessive profits on
defense contracts through cost manipulation. Prior to the establishment of the CASB, the Armed Services
Procurement Act relied on GAAP to evaluate contractors’ cost accounting practices, which arguably
offered contractors discretion to select methods that overstated costs for reimbursement. In August 1970,
Congress passed a statute establishing the CASB for the purpose of promulgating cost accounting
standards (CAS) designed to achieve uniformity and consistency in the cost accounting principles
followed by defense contractors in estimating, accumulating, and reporting costs under federal contracts.29
All national defense contractors with contracts in excess of $100,000 had to comply. The defense industry
was widely opposed to a uniform set of cost accounting standards. Defense contractors incurred a net
decline in shareholder wealth over the two years of congressional hearings preceding the establishment of
the CASB, consistent with the market viewing it as a deterrent to contractors’ ability to extract excessive
reimbursements from the government (Pownall, 1986).
The CASB promulgated its first two CAS on July 1, 1972 (CAS 401 and CAS 402). At the same
time, the CASB also mandated that large defense contractors provide a “disclosure statement,” detailing
how they allocate costs to verify contractors’ compliance with the CAS, and ensure that the cost allocation
29 Public Law 91-379, an amendment to the Defense Production Act of 1950.
Electronic copy available at: https://ssrn.com/abstract=3197640

27
methods are followed consistently for all covered contracts (CASB, 1973).30 By 1980, the CASB had
promulgated a total of 19 CAS stating the principles for the measurement, allocation, and assignment of
various cost subjects.
To identify firms affected by the establishment of the CASB, I refer to the list of top 100 contractors
published by the Department of Defense in 1970. Seventy-two of these firms have the required
CRSP/Compustat data for my analysis and represent my treatment group. I use any remaining firms in the
CRSP/Compustat population that belong to the same SIC two-digit industries as my control group (2,097
firms). The data on which of these firms are also government contractors are not readily available, so there
are certainly other government contractors in my control group. However, this likely works against the
likelihood of finding my predicted results. Given the limitations in data availability during the period used
in this analysis (the data on voluntary disclosure and earnings announcement dates are not readily available
in this period), I use a measure of illiquidity to proxy for the quality of the information environment.
Market-based measures of illiquidity encompass all sources of public information and represent an ex-
post proxy for the firm’s overall quality of public information (e.g., Balakrishnan, Core, and Verdi, 2014).
I measure illiquidity using the proportion of zero return trading days in a given fiscal year
(Illiquidity) (e.g., Lang, Lins, and Maffett, 2012). Days without price movements typically reflect
infrequent trading—a manifestation of greater illiquidity. Using this measure is advantageous because
stock prices are readily available in the period of the CASB establishment.31 I estimate the following
difference-in-differences regression.
Illiquidityt+1 = β0 + β1 TopDefense x Post + θn Controlst + γ + δ + εt, (4)
30 The primary objective of the disclosure statement is to clearly describe the cost accounting practices the contractor intends to follow (i.e., define which costs will be charged directly to contracts, the methods used to make such charges, the methods of distinguishing direct costs from indirect costs, and the basis for allocating indirect costs to contracts) (CASB, 1999). 31 My results are also robust to using the proportion of zero volume trading days as an alternative dependent variable (untabulated). My results are also robust to using the Amihud (2002) measure of illiquidity (calculated as the natural logarithm of one plus the average annual absolute value of returns scaled by dollar volume) (untabulated), although sparse availability of volume data during this period reduces the sample by about 20%.
Electronic copy available at: https://ssrn.com/abstract=3197640
28
where TopDefense is a binary indicator variable equal to one for firms in the treatment group and zero for
firms in the control group, and Post is a binary indicator variable equal to one for fiscal years equal to or
greater than 1970. Controls is a vector including the control variables defined in equation (1), except for
NAnalysts and NInstit, which are not readily available during this period. I also include year and firm fixed
effects in the model, which absorb the main effects on Treated and Post. The coefficient β1 estimates the
within-firm difference in the quality of the information environment for contractors after the establishment
of the CASB, relative to other firms in the same industries. I estimate this model over six years prior to
and six years after the CASB establishment (fiscal years 1964–1976). I use a relatively long window
because it is unclear whether the establishment of the CASB itself in 1970 had an immediate effect on
contractors, or whether the effect manifests itself after the promulgation of the first CAS in 1972. To
illuminate the timing of any effect of the CASB on contractors’ information environment, I also examine
trends in Illiquidity around this event.
My results appear in Table 6. Panel A presents descriptive statistics. Firms in my treatment group
are significantly larger, with greater growth opportunities, lower return volatility, and a lower percentage
of zero return trading days. Panel B presents results from estimating the difference-in-differences
regressions. Column (1) presents results from estimating the model in equation (4) in a larger sample
without including control variables, and column (2) presents results after including controls. In both
specifications, the difference-in-differences coefficient (β1) is negative and statistically significant,
indicating that within-firm differences in the number of zero-return trading days are significantly lower
for top defense contractors after the establishment of the CASB.
Next, I examine trends in Illiquidity in the years surrounding the establishment of the CASB. I
estimate the same specification as in column (1) of Panel B, except that I interact TopDefense with every
year from 1967 to 1976, using the prior period’s average (1964–1966) as the benchmark. I illustrate these
results in Figure 2. The figure shows that differences in Illiquidity between treatment and control groups
Electronic copy available at: https://ssrn.com/abstract=3197640
29
appear in 1973, immediately after the promulgation of the first CAS, and that these differences persist
through 1976. Importantly, there appear to be no significant differences in external reporting quality
between the treatment and control groups in the period before the establishment of the CASB, consistent
with the parallel trends assumption.
Although these results provide corroborating evidence of my prediction, the promulgation of the
CAS coincided with several events in 1972–1973 surrounding the Vietnam war that likely resolved some
uncertainty regarding defense contractors’ prospects (e.g., draft peace accord of October 1972 between
Vietnam and the United States and Paris Peace Accords of January 1973). I cannot rule out that these
concurrent events (at least in part) contribute to my results, which should thus be interpreted with caution.
5.2 Changes in the information environment after the discontinuance of government contracting
My collective results suggest that procurement-related requirements on contractors’ internal
information processes are associated with improvements in external reporting. However, it isn’t clear
whether these improvements stem from (i) the implementation or enhancement of internal information
systems, (ii) stronger monitoring of them, or both. In an attempt to disentangle these two channels, I
examine changes in the information environment of contractors that end their relationship with the
government. I expect that the implementation or enhancement of internal information systems would lead
to somewhat permanent changes in external reporting quality, as firms likely incur the bulk of the costs
upon implementation, and it may thus be cost-effective to keep these systems in place. On the other hand,
if the effect comes predominantly from the government’s ongoing monitoring, then I would expect
external reporting to decline and revert to its pre-existing levels, once the contracting relationship ends.
My analysis mirrors my tests using first-time contractors (section 4.2, Table 4), except that I identify
treatment firms as those that discontinue contracting with the government in my sample. My results appear
in Table 7. The covariate balance in Panel A shows no significant differences in covariate means and
medians between my treatment and control groups, suggesting they are similar along key dimensions of
Electronic copy available at: https://ssrn.com/abstract=3197640
30
the information environment in the year preceding the treatment firms’ last year of contracting. Panel B
presents results from the difference-in-differences regressions. Across all specifications, the coefficient
on Treated x Post is not significantly different from zero, suggesting that any improvements in the
information environment resulting from procurement-related requirements stem primarily from the
implementation of better internal information processes, as opposed to the government’s ongoing
monitoring. However, α1 is negative when using VolDisc_Freq as the dependent variable in columns (3)
and (4). Although not statistically significant at conventional levels (t-stats = –1.28 and –1.37,
respectively), the sample size is markedly smaller, relative my previous analyses (1,486 observations),
which is suggestive of low power. Thus, these results do not conclusively rule out the monitoring channel,
and should generally be interpreted with caution.32
5.3 Robustness to alternative measures of external reporting quality
Management forecast accuracy is an alternative measure of external reporting quality that is
arguably also closely related to firms’ internal information processes (e.g., Gallemore and Labro, 2015).
In Table 8, I show that my main results are robust to using this measure as the dependent variable. I
measure Accuracy using the absolute value of management’s last available estimate of earnings per share
before fiscal year-end minus the firm’s actual earnings per share, divided by the stock price at the end of
the year and multiplied by negative one. This measure is conditional on the issuance of an earnings
forecast, reducing the sample to 18,117 observations. In columns (1) and (2) of Table 8, I estimate the
same specification as in Table 3, except that I replace the dependent variable with Accuracy, and find that
the coefficients on Contract and $Contract/Sales are positive and strongly significant, as predicted.
As discussed in section 5.1, market-based measures of illiquidity encompass all sources of public
information and are useful ex-post proxies for the firm’s overall information environment quality.
32 Note that this test is subject to the same caveats as the test using contract starters, as discussed in section 4.2 (i.e., the results could be driven by changes in firm fundamentals subsequent to the discontinuance of a contract that are omitted from my controls and correlated with changes in external reporting).
Electronic copy available at: https://ssrn.com/abstract=3197640

31
Although illiquidity represents the market’s interpretation of the firm’s information environment and is
thus arguably more removed from its internal processes (unlike supply-side measures such as voluntary
disclosure), these measures have the added advantage of capturing any improvements to the firm’s
information as perceived by market participants. That is, even if a contractor’s internal information
processes are of sufficient quality and do not need any improvement, a government audit can increase
their quality as perceived by investors and other stakeholders. In columns (3) and (4) of Table 8, I estimate
the same specification as in Table 3, except that I replace the dependent variable with Illiquidity (as defined
in section 5.1 and Table 6) and find that the coefficients on both measures of government contracting are
negative and strongly significant, consistent with my prediction.
6. Conclusion
I examine the association between customer internal information requirements and the firm’s
external reporting environment, using U.S. government contracts. The Federal Acquisition Regulations
require contractors to have certain financial attributes and internal information processes. I argue that these
requirements help improve contractors’ internal information, and that these improvements manifest
themselves in better external reporting. I test my prediction using various research designs and employing
multiple measures of procurement-related requirements and external reporting. I find that both the
existence and size of government contracts are positively associated with the quality of firms’ voluntary
disclosure and the speed of their earnings releases. I also find higher levels of external reporting quality
for firms that begin contracting with the government for the first time, relative to an otherwise similar
control group.
I also focus on specific oversight mechanisms and examine contract characteristics directly related
to the extent of internal information requirements and find that the association between the size of
government contract awards and the quality of firms’ external reporting environment increases with these
characteristics. I further examine the effect of one of these mechanisms, compliance with cost accounting
Electronic copy available at: https://ssrn.com/abstract=3197640

32
standards, on the quality of the information environment by using the establishment of the Cost
Accounting Standards Board in 1970. I find that the information environment improved significantly for
top military contractors subject to CASB-related requirements, relative to other firms in the same
industries.
These findings suggest that the government’s oversight of its suppliers’ internal information is quite
extensive, potentially raising concerns regarding the consequences of recently proposed budget cuts. The
DCAA has struggled with an incurred cost audit backlog over the past two decades, resulting in reduced
savings on claims from suppliers. The 2016 defense authorization act prohibited the DCAA from
providing audit support to nondefense agencies, and the more recent 2017 hiring freeze further suppressed
its efforts to decrease the audit backlog. Such budget cuts are likely to impair the efficiency of the
procurement process (e.g., Maucione, 2017).
Collectively, my results suggest that customers play a role in shaping the firm’s external reporting
environment. Although my study focuses on government contracts, many of the oversight practices used
by the government resemble those used in other settings. For example, certain industries use contracts
requiring supplier cost audits (e.g., contracts with target cost-incentive fees in the construction industry),
or revenue audits (e.g., license agreements in the entertainment industry). To the extent that such
procedures influence suppliers’ internal information processes, I expect my results to generalize beyond
the government sector.
Electronic copy available at: https://ssrn.com/abstract=3197640
33
References Ahadiat, N., and Ehrenreich, K., 1996. Regulatory audit functions and auditor-contractor
relationships. Managerial Auditing Journal, 11 (6): 4–10. Amihud, Y., 2002. Illiquidity and stock returns: cross-section and time-series effects. Journal of
Financial Markets, 5(1): 31–56. Anderson, S., and Dekker, H., 2009. Strategic cost management in supply chains, Part 2: Executional
cost management. Accounting Horizons, 23 (3): 289–305. Angst, C., Block, E., D’arcy, J., and Kelley, K., 2017. When do IT security investments matter?
Accounting for the influence of institutional factors in the context of healthcare data breaches. MIS Quarterly, 41(3): 893–916.
Ashbaugh-Skaife, H., Collins, D., Kinney, W., and LaFond, R., 2008. The effect of SOX internal control deficiencies and their remediation on accrual quality. The Accounting Review, 83 (1): 217–250.
Balakrishnan, K., Core, J., and Verdi, R., 2014. The relation between reporting quality and financing and investment: Evidence from changes in financing capacity. Journal of Accounting Research 52: 1–36.
Bowen, R., DuCharme, L., and Shores D., 1995. Stakeholders’ implicit claims and accounting method choice. Journal of Accounting and Economics 20 (3): 255–295.
Bromley, P., and Powell, W., 2012. From smoke and mirrors to walking the talk: Decoupling in the contemporary world. Academy of Management Annals, 6(1): 483–530.
Caglio, A., and Ditillo, A., 2008. A review and discussion of management control in inter-firm relationships: Achievements and future directions. Accounting, Organizations and Society, 33 (7): 865–898.
CASB, 1973. Progress report to the Congress. CASB, 1999. The future role of the Cost Accounting Standards Board (CASB). Cavalluzzo, K., and Ittner, C., 2004. Implementing performance measurement innovations: evidence
from government. Accounting, Organizations and Society, 29(3-4): 243–267. Chen, H., and Gunny, K., 2014. Profitability and cost shifting in government procurement contracts.
Working paper. Christmann, P., and Taylor, G., 2006. Firm self-regulation through international certifiable standards:
Determinants of symbolic versus substantive implementation. Journal of International Business Studies, 37(6): 863–878.
Cohen, D., and Li, B., 2016. Why do firms hold less cash? A customer base explanation. Working paper. Costello, A., 2013. Mitigating incentive conflicts in inter–firm relationships: Evidence from long–term
supply contracts. Journal of Accounting and Economics, 56 (1): 19–39. DCAA, 2012. Manual: Information for contractors. DCAA, 2015. Report to Congress on FY 2014 Activities. DCAA, 2018. Report to Congress on FY 2017 Activities. Dichev, I., Graham, J., Harvey, C., and Rajgopal, S., 2013. Earnings quality: Evidence from the
field. Journal of Accounting and Economics, 56 (2): 1–33. Dorantes, C., Li, C., Peters, G., and Richardson, V., 2013. The effect of enterprise systems
implementation on the firm information environment. Contemporary Accounting Research, 30 (4): 1427–1461.
Doyle, J., Ge, W., and McVay, S., 2007. Accruals quality and internal control over financial reporting. The Accounting Review, 82 (5): 1141–1170.
Duguay, R., Rauter, T. and Samuels, D., 2019. The impact of open data on public procurement. Working paper.
Electronic copy available at: https://ssrn.com/abstract=3197640

34
Feldman, S., and Keyes N., 2011. Government Contracts in a Nutshell, 5th Edition. St. Paul: West Publishing Co.
Feng, M., Li, C. and McVay, S., 2009. Internal control and management guidance. Journal of Accounting and Economics, 48 (2): 190–209.
Francis, D., 2013. Pentagon’s failure to audit contracts wastes billions. The Fiscal Times, May 21, 2013. Gallemore, J., and Labro, E., 2015. The importance of the internal information environment for tax
avoidance. Journal of Accounting and Economics, 60(1): 149–167. GAO, 2009. Report to the Committee on Homeland Security and Governmental Affairs, U.S. Senate on
DCAA Audits. Geiger, D., and Ittner, C., 1996. The influence of funding source and legislative requirements on
government cost accounting practices. Accounting, Organizations and Society, 21(6): 549–567. Goldman, E., Rocholl, J., and So, J., 2013. Politically connected boards of directors and the allocation of
procurement contracts. Review of Finance 17(5): 1617–1648. Hanlon, M., Hoopes, J., and Shroff, N., 2014. The effect of tax authority monitoring and enforcement on
financial reporting quality. The Journal of the American Taxation Association, 36 (2): 137–170. Hemmer, T., and Labro, E., 2008. On the optimal relation between the properties of managerial and
financial reporting systems. Journal of Accounting Research, 46 (5): 1209–1240. Hui, K., Klasa, S., and Yeung E., 2012. Corporate suppliers and customers and accounting conservatism.
Journal of Accounting and Economics 53 (1): 115–135. Ittner, C., Larcker, D., Nagar, V., and Rajan, M., 1999. Supplier selection, monitoring practices, and
firm performance. Journal of Accounting and Public Policy, 18 (3): 253–281. Ittner, C. and Michels, J., 2017. Risk-based forecasting and planning and management earnings
forecasts. Review of Accounting Studies, 22(3): 1005–1047. Kaplan, R., and Atkinson, A., 1998. Advanced Management Accounting. 3 Prentice-Hall. Kaplan, R., and Porter, M., 2011. How to solve the cost crisis in health care. Harvard Business
Review, 89 (9): 46–52. Kim-Gina, J., 2018. External verifiability of accounting information and intangible asset
transactions. Working paper. Lang, M., Lins, K., and Maffett, M., 2012. Transparency, liquidity, and valuation: International evidence
on when transparency matters most. Journal of Accounting Research, 50(3): 729 –774. Maucione, S., 2017. Hiring freeze is shooting DoD in the foot when it comes to efficiency. Federal
News Network, April 6, 2017. Mills, L., Nutter, S., and Schwab, C., 2013. Do federal contractors suffer tax-related political costs? The
Accounting Review, 88 (3): 977–1005. Pownall, G., 1986. An empirical analysis of the regulation of the defense contracting industry: The Cost
Accounting Standards Board. Journal of Accounting Research, 291–315. Raman, K., and Shahrur H., 2008. Relationship-specific investments and earnings management:
Evidence on corporate suppliers and customers. The Accounting Review 83 (4): 1041–1081. Rogerson, W., 1992. Contractual solutions to the hold-up problem. The Review of Economic Studies, 59
(4): 777–793. Sandholtz, K., 2012. Making standards stick: A theory of coupled vs. decoupled
compliance. Organization Studies, 33(5-6): 655-679. Scott, W., 1987. The adolescence of institutional theory. Administrative Science Quarterly: 493–511. Shroff, N., 2017. Corporate investment and changes in GAAP. Review of Accounting Studies, 22(1): 1–
63. Shroff, N., Sun, A., White, H., and Zhang, W., 2013. Voluntary disclosure and information asymmetry:
Evidence from the 2005 securities offering reform. Journal of Accounting Research, 51 (5): 1299–1345.
Electronic copy available at: https://ssrn.com/abstract=3197640

35
Verrecchia, R., 1983. Discretionary disclosure. Journal of Accounting and Economics, 5: 179–194. Verrecchia, R., 1990. Information quality and discretionary disclosure. Journal of Accounting and
Economics, 12 (4): 365–380. Zimmerman, J., 2013. Accounting for decision making and control (8th ed.). Irwin /McGraw Hill
Publishing Company, New York.
Electronic copy available at: https://ssrn.com/abstract=3197640

36
Appendix A. Variable definitions
Measures of government contract awards DollarsObligated Total federal dollars obligated to a firm (“dollars obligated” from the Federal
Procurement Data System available at USAspending.gov) over the fiscal year.
$Contract/Sales DollarsObligated scaled by sales at fiscal year-end.
Contract Binary indicator variable equal to one if DollarsObligated is nonmissing. Measures of the reporting environment
VolDisc Binary indicator variable equal to one if the firm issued a management forecast over the fiscal year.
VolDisc_Freq Number of management forecasts issued over the fiscal year.
Speed Number of days between the earnings announcement date and the end of the fiscal year, divided by 365 and multiplied by negative one.
Illiquidity Proportion of zero-return trading days over the fiscal year. Control variables
Size Natural logarithm of market value of equity.
Leverage Long-term debt plus short-term debt, scaled by total assets.
MTB Market value of equity divided by book value of equity.
SalesGrowth End of fiscal year sales minus beginning of fiscal year sales, divided by beginning of fiscal year sales.
ROA Return on assets, measured as income before extraordinary items scaled by total assets.
Loss Binary indicator variable equal to one if income before extraordinary items is negative and zero otherwise.
Returns Buy-and-hold return over the fiscal year.
σReturns Standard deviation of monthly returns over the fiscal year.
SpecialItems Special items scaled by total assets.
BigN Binary indicator variable equal to one if the firm is audited by a Big N auditor over the fiscal year.
NAnalysts Number of analysts with one-year-ahead earnings forecasts as of the end of the fiscal year.
NInstit Number of institutional investors as of the end of the fiscal year. Variables used in cross-sectional tests
Index Index constructed as the first principal component of CPData, CAS, CostPlus, NonComm, and Duration.
CPData Binary indicator variable equal to one if the firm is required to provide cost or pricing data to the government.
CAS Binary indicator variable equal to one if the firm is subject to cost accounting standards, pursuant to FAR 30.
CostPlus Binary indicator variable equal to one if the firm has “cost reimbursement” contracts as defined by FAR 16.3.
NonComm Binary indicator variable equal to one if the firm provides goods or services that are not subject to commercial item acquisition procedures, pursuant to FAR 12.
Duration Average annual length of all contracts signed during the fiscal year, weighted by contract dollar amount, where annual length is the contract completion date minus signed date, divided by 365.
Electronic copy available at: https://ssrn.com/abstract=3197640

Appendix B. Principal component analysis of contract characteristics with greater internal information requirements
Panel A presents the output from the principal component analysis used to construct the index of procurement-related internal information requirements (Index). I construct the index as the first principal component of five contract characteristics associated with greater internal information requirements: CostPlus, CAS, CPData, NonComm and Duration. Panel B presents correlations between the index and its five components.
Panel A. Principal component output
Factor Eigenvalue
Proportion of the variation explained
Cumulative Proportion of the
variation explained
Contract
Characteristics
First Principal Component
Weights 1st 2.158 0.432 0.432 CostPlus 0.365 2nd 0.975 0.195 0.627 CAS 0.371 3rd 0.899 0.180 0.807 CPData 0.375 4th 0.528 0.106 0.912 NonComm 0.204 5th 0.440 0.088 1.000 Duration 0.101
Panel B. Correlation matrix Index CostPlus CAS CPData NonComm Duration Index 1.000 CostPlus 0.790 1.000 CAS 0.803 0.478 1.000 CPData 0.811 0.489 0.559 1.000 NonComm 0.442 0.258 0.171 0.194 1.000 Duration 0.327 0.242 0.225 0.204 0.123 1.000
Electronic copy available at: https://ssrn.com/abstract=3197640

38
Figure 1. Trends in the external information environment around first-time contract awards This figure plots trends in the external reporting environment around firms’ first contract awards. Specifically, this figure presents the difference-in-differences in Forecast, Frequency, and Speed between first-time contractors and a matched sample of otherwise similar firms, as estimated in Table 4, for every year relative t-3 (the benchmark), where t represents the year that the contract is initially awarded. The bars represent 90% confidence intervals. All variables are defined in Appendix A.
-0.05
0.00
0.05
0.10
0.15
0.20
0.25
0.30t–3 t–2 t–1 t t+1 t+2 t+3
Fore
cast
t+1
-1.00
-0.50
0.00
0.50
1.00
1.50
2.00
2.50
3.00t–3 t–2 t–1 t t+1 t+2 t+3
Freq
uenc
y t+1
-0.01-0.010.000.010.010.020.020.030.030.04
t–3 t–2 t–1 t t+1 t+2 t+3
Spee
d t+
1
Electronic copy available at: https://ssrn.com/abstract=3197640
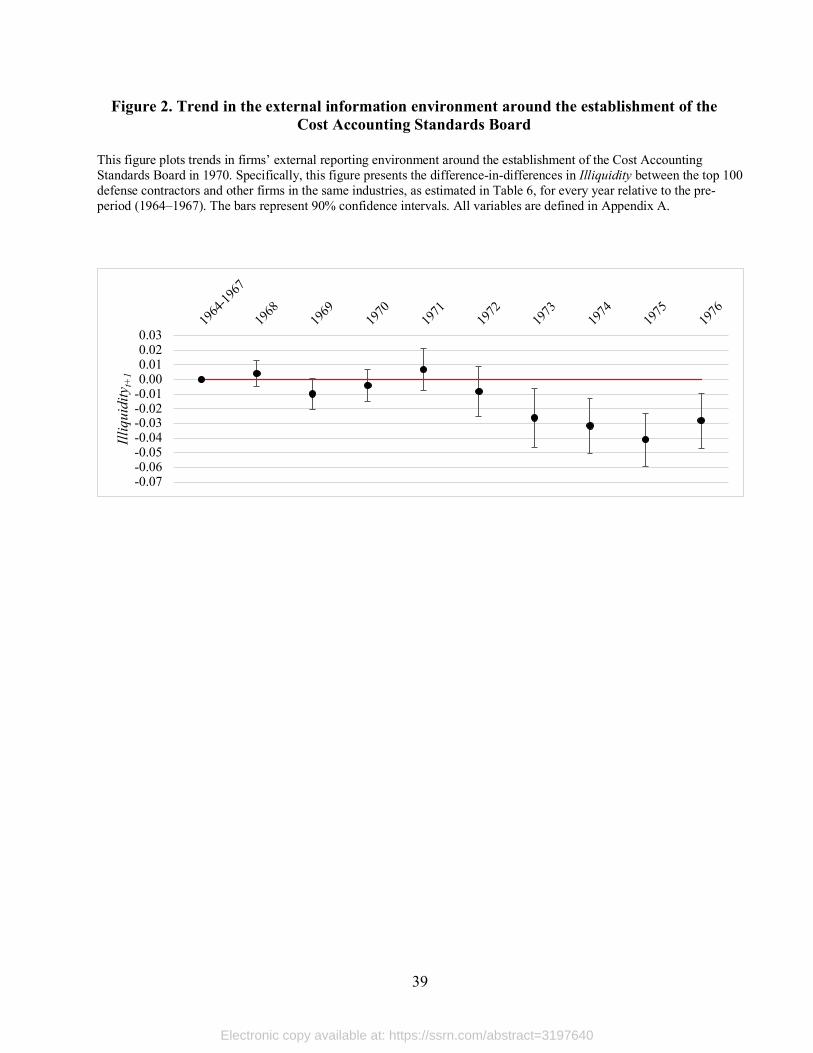
39
Figure 2. Trend in the external information environment around the establishment of the Cost Accounting Standards Board
This figure plots trends in firms’ external reporting environment around the establishment of the Cost Accounting Standards Board in 1970. Specifically, this figure presents the difference-in-differences in Illiquidity between the top 100 defense contractors and other firms in the same industries, as estimated in Table 6, for every year relative to the pre-period (1964–1967). The bars represent 90% confidence intervals. All variables are defined in Appendix A.
-0.07-0.06-0.05-0.04-0.03-0.02-0.010.000.010.020.03
1964
-1967
1968
1969
1970
1971
1972
1973
1974
1975
1976
Illiq
uidi
tyt+
1
Electronic copy available at: https://ssrn.com/abstract=3197640

Table 1. U.S. government contract awards
This table presents descriptive statistics for U.S. government contract awards for government fiscal years 2000 through 2016 (i.e., October 1, 1999–September 30, 2016). The table presents the total value of contract awards by year (in billions of dollars), the total number of contracts, the share of value awarded subject to cost reimbursement pricing (CostPlus), the share of value awarded subject to cost accounting standards (CAS), the share of value awarded subject to the requirement to provide cost or pricing data (CPData), the share of value awarded not subject to commercial items acquisition procedures (NonComm), and the share of value by contract duration (Duration). Panel A presents descriptive statistics by government fiscal year for the entire sample of U.S. government contracts downloaded from USAspending.gov. Panel B presents descriptive statistics by firm fiscal year for the sample of CRSP/Compustat contracts used in the analysis. Panel C presents the distribution of the sample of CRSP/Compustat contracts used in the analysis by industry, using the Fama-French 12 industry classification.
Panel A. U.S. government contract awards
Government Fiscal Year
Contract value Number of
contracts CostPlus CAS CPData NonComm
Duration > 1 year
($ billions) (% of value) (% of value) (% of value) (% of value) (% of value) 2000 206 594,574 0.24 0.02 0.22 0.86 0.51 2001 223 641,969 0.25 0.09 0.20 0.83 0.52 2002 264 830,361 0.22 0.10 0.20 0.81 0.51 2003 325 1,183,238 0.23 0.15 0.20 0.82 0.50 2004 339 1,997,099 0.23 0.18 0.23 0.84 0.50 2005 390 2,918,378 0.24 0.13 0.13 0.90 0.45 2006 430 3,792,822 0.25 0.15 0.09 0.87 0.47 2007 469 4,107,291 0.27 0.19 0.16 0.82 0.52 2008 540 4,500,387 0.27 0.19 0.16 0.82 0.51 2009 540 3,490,967 0.30 0.23 0.15 0.81 0.49 2010 559 3,532,784 0.23 0.27 0.17 0.76 0.45 2011 538 3,398,114 0.26 0.26 0.25 0.78 0.49 2012 520 3,120,004 0.25 0.26 0.24 0.77 0.51 2013 463 2,507,805 0.26 0.29 0.24 0.76 0.51 2014 445 2,521,275 0.28 0.27 0.23 0.75 0.48 2015 438 4,360,396 0.28 0.27 0.23 0.75 0.51 2016 474 4,808,498 0.28 0.29 0.24 0.76 0.52
Mean 421 2,841,527 0.26 0.20 0.20 0.81 0.50 Sum 7,163 48,305,962
Electronic copy available at: https://ssrn.com/abstract=3197640
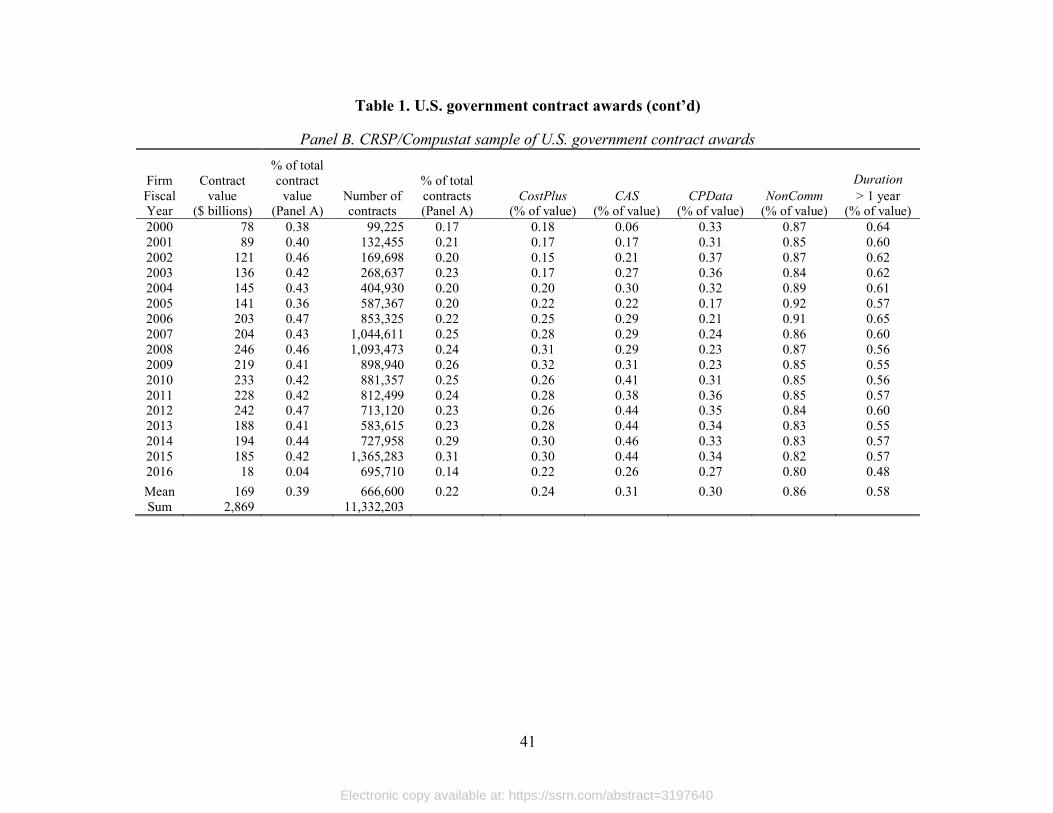
41
Table 1. U.S. government contract awards (cont’d)
Panel B. CRSP/Compustat sample of U.S. government contract awards
Firm FiscalYear
Contract value
($ billions)
% of total contract
value (Panel A)
Number of contracts
% of total contracts (Panel A)
CostPlus CAS CPData NonComm Duration
> 1 year (% of value) (% of value) (% of value) (% of value) (% of value)
2000 78 0.38 99,225 0.17 0.18 0.06 0.33 0.87 0.64 2001 89 0.40 132,455 0.21 0.17 0.17 0.31 0.85 0.60 2002 121 0.46 169,698 0.20 0.15 0.21 0.37 0.87 0.62 2003 136 0.42 268,637 0.23 0.17 0.27 0.36 0.84 0.62 2004 145 0.43 404,930 0.20 0.20 0.30 0.32 0.89 0.61 2005 141 0.36 587,367 0.20 0.22 0.22 0.17 0.92 0.57 2006 203 0.47 853,325 0.22 0.25 0.29 0.21 0.91 0.65 2007 204 0.43 1,044,611 0.25 0.28 0.29 0.24 0.86 0.60 2008 246 0.46 1,093,473 0.24 0.31 0.29 0.23 0.87 0.56 2009 219 0.41 898,940 0.26 0.32 0.31 0.23 0.85 0.55 2010 233 0.42 881,357 0.25 0.26 0.41 0.31 0.85 0.56 2011 228 0.42 812,499 0.24 0.28 0.38 0.36 0.85 0.57 2012 242 0.47 713,120 0.23 0.26 0.44 0.35 0.84 0.60 2013 188 0.41 583,615 0.23 0.28 0.44 0.34 0.83 0.55 2014 194 0.44 727,958 0.29 0.30 0.46 0.33 0.83 0.57 2015 185 0.42 1,365,283 0.31 0.30 0.44 0.34 0.82 0.57 2016 18 0.04 695,710 0.14 0.22 0.26 0.27 0.80 0.48
Mean 169 0.39 666,600 0.22 0.24 0.31 0.30 0.86 0.58 Sum 2,869 11,332,203
Electronic copy available at: https://ssrn.com/abstract=3197640
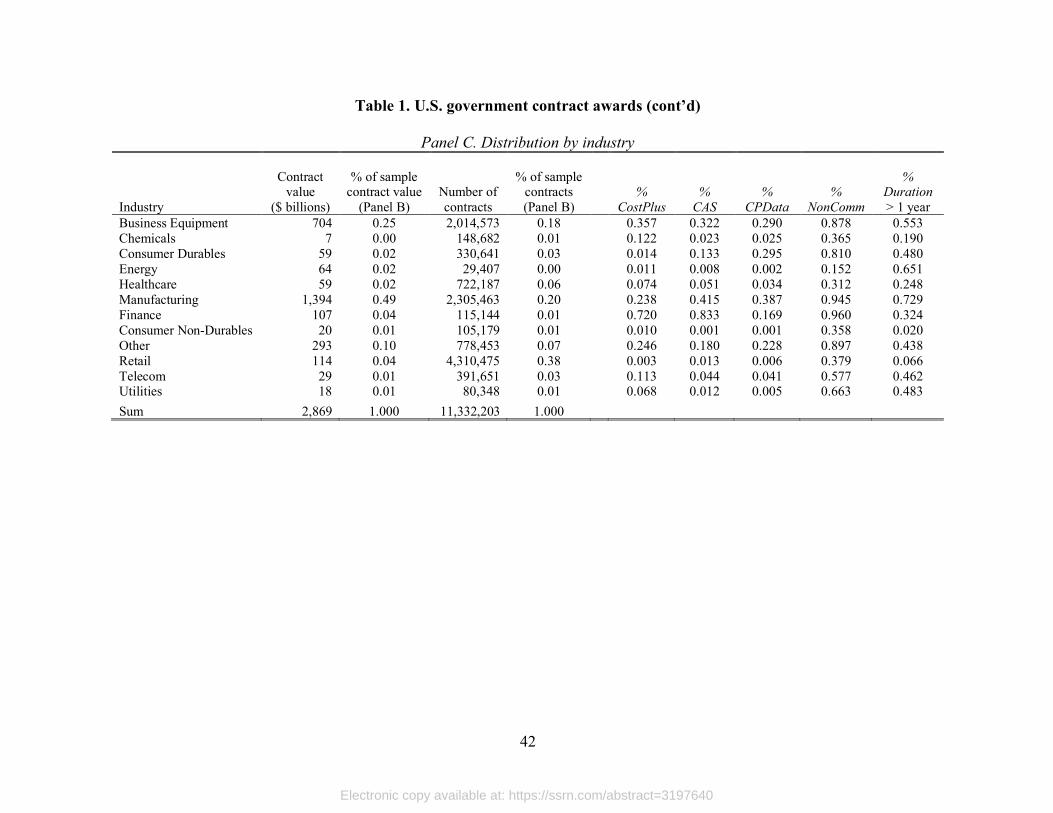
42
Table 1. U.S. government contract awards (cont’d)
Panel C. Distribution by industry
Industry
Contract value
($ billions)
% of sample contract value
(Panel B) Number of contracts
% of sample contracts (Panel B)
% CostPlus
% CAS
% CPData
% NonComm
%
Duration > 1 year
Business Equipment 704 0.25 2,014,573 0.18 0.357 0.322 0.290 0.878 0.553 Chemicals 7 0.00 148,682 0.01 0.122 0.023 0.025 0.365 0.190 Consumer Durables 59 0.02 330,641 0.03 0.014 0.133 0.295 0.810 0.480 Energy 64 0.02 29,407 0.00 0.011 0.008 0.002 0.152 0.651 Healthcare 59 0.02 722,187 0.06 0.074 0.051 0.034 0.312 0.248 Manufacturing 1,394 0.49 2,305,463 0.20 0.238 0.415 0.387 0.945 0.729 Finance 107 0.04 115,144 0.01 0.720 0.833 0.169 0.960 0.324 Consumer Non-Durables 20 0.01 105,179 0.01 0.010 0.001 0.001 0.358 0.020 Other 293 0.10 778,453 0.07 0.246 0.180 0.228 0.897 0.438 Retail 114 0.04 4,310,475 0.38 0.003 0.013 0.006 0.379 0.066 Telecom 29 0.01 391,651 0.03 0.113 0.044 0.041 0.577 0.462 Utilities 18 0.01 80,348 0.01 0.068 0.012 0.005 0.663 0.483
Sum 2,869 1.000 11,332,203 1.000
Electronic copy available at: https://ssrn.com/abstract=3197640

Table 2. Descriptive statistics This table presents descriptive statistics for the variables used in the analysis. Panel A provides descriptive statistics for my full sample. Panel B provides descriptive statistics for my sample of government contractors and shows differences in firm characteristics between my sample of contractors and noncontractors. All variables are defined in Appendix A.
Panel A: Descriptive statistics Variable Observations Mean Std 25th Median 75th
Measures of reporting
VolDisc 79,383 0.469 0.499 0.000 0.000 1.000 VolDisc_Freq 79,383 4.785 7.835 0.000 0.000 7.000 Speed 79,383 –0.142 0.065 –0.181 –0.132 –0.090
Control variables
Size 79,383 6.042 2.199 4.421 5.995 7.548 Leverage 79,383 0.222 0.220 0.029 0.168 0.346 MTB 79,383 5.426 8.283 2.196 3.636 6.858 SalesGrowth 79,383 0.149 0.492 –0.041 0.067 0.206 ROA 79,383 –0.038 0.245 –0.023 0.017 0.061 Loss 79,383 0.314 0.464 0.000 0.000 1.000 Returns 79,383 0.115 0.600 –0.236 0.051 0.334 σReturns 79,383 0.136 0.095 0.071 0.109 0.169 SpecialItems 79,383 –0.018 0.067 –0.009 0.000 0.000 BigN 79,383 0.720 0.449 0.000 1.000 1.000 NAnalysts 79,383 4.921 6.171 0.000 2.000 7.000 NInstit 79,383 120.141 156.443 19.000 70.000 152.000
Electronic copy available at: https://ssrn.com/abstract=3197640
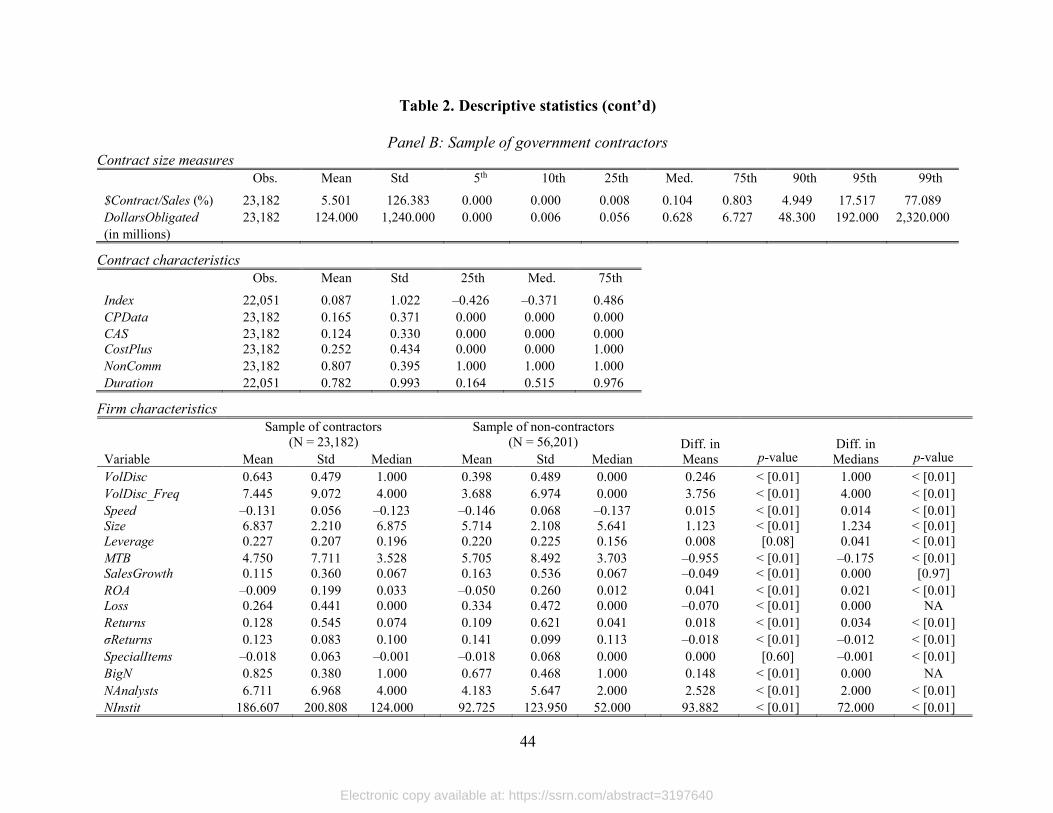
44
Table 2. Descriptive statistics (cont’d)
Panel B: Sample of government contractors Contract size measures
Obs. Mean Std 5th 10th 25th Med. 75th 90th 95th 99th
$Contract/Sales (%) 23,182 5.501 126.383 0.000 0.000 0.008 0.104 0.803 4.949 17.517 77.089 DollarsObligated 23,182 124.000 1,240.000 0.000 0.006 0.056 0.628 6.727 48.300 192.000 2,320.000 (in millions)
Contract characteristics Obs. Mean Std 25th Med. 75th
Index 22,051 0.087 1.022 –0.426 –0.371 0.486 CPData 23,182 0.165 0.371 0.000 0.000 0.000 CAS 23,182 0.124 0.330 0.000 0.000 0.000 CostPlus 23,182 0.252 0.434 0.000 0.000 1.000 NonComm 23,182 0.807 0.395 1.000 1.000 1.000 Duration 22,051 0.782 0.993 0.164 0.515 0.976
Firm characteristics
Sample of contractors
(N = 23,182) Sample of non-contractors
(N = 56,201)
Diff. in Means
Diff. in Medians
Variable Mean Std Median Mean Std Median p-value p-value VolDisc 0.643 0.479 1.000 0.398 0.489 0.000 0.246 < [0.01] 1.000 < [0.01] VolDisc_Freq 7.445 9.072 4.000 3.688 6.974 0.000 3.756 < [0.01] 4.000 < [0.01] Speed –0.131 0.056 –0.123 –0.146 0.068 –0.137 0.015 < [0.01] 0.014 < [0.01] Size 6.837 2.210 6.875 5.714 2.108 5.641 1.123 < [0.01] 1.234 < [0.01] Leverage 0.227 0.207 0.196 0.220 0.225 0.156 0.008 [0.08] 0.041 < [0.01] MTB 4.750 7.711 3.528 5.705 8.492 3.703 –0.955 < [0.01] –0.175 < [0.01] SalesGrowth 0.115 0.360 0.067 0.163 0.536 0.067 –0.049 < [0.01] 0.000 [0.97] ROA –0.009 0.199 0.033 –0.050 0.260 0.012 0.041 < [0.01] 0.021 < [0.01] Loss 0.264 0.441 0.000 0.334 0.472 0.000 –0.070 < [0.01] 0.000 NA Returns 0.128 0.545 0.074 0.109 0.621 0.041 0.018 < [0.01] 0.034 < [0.01] σReturns 0.123 0.083 0.100 0.141 0.099 0.113 –0.018 < [0.01] –0.012 < [0.01] SpecialItems –0.018 0.063 –0.001 –0.018 0.068 0.000 0.000 [0.60] –0.001 < [0.01] BigN 0.825 0.380 1.000 0.677 0.468 1.000 0.148 < [0.01] 0.000 NA NAnalysts 6.711 6.968 4.000 4.183 5.647 2.000 2.528 < [0.01] 2.000 < [0.01] NInstit 186.607 200.808 124.000 92.725 123.950 52.000 93.882 < [0.01] 72.000 < [0.01]
Electronic copy available at: https://ssrn.com/abstract=3197640

45
Table 3. Government contracting and the information environment
This table presents results from estimating the association between government contracting and the firm’s information environment. In Panel A, Columns (1), (3), and (5) measure government contracting, using an indicator variable for whether a contract was awarded (Contract). Columns (2), (4), and (6) measure government contracting, using the size of the award, relative to firm sales ($Contract/Sales), transformed into quintile ranks scaled to range from 0 to 1. Panel B uses the same specification as in columns (2), (4), and (6) of Panel A, except that I replace $Contract/Sales with binary indicator variables equal to one for firm-years within each quartile of $Contract/Sales > 0 ($Contract/Sales_Q1 - $Contract/Sales_Q4), where the omitted group represents firm-years with $Contract/Sales = 0. All other variables are defined in Appendix A. t-statistics appear in parentheses and are based on standard errors clustered by firm. ***, **, and * denote statistical significance at the 0.01, 0.05, and 0.10 levels (two-tail), respectively.
Panel A: Association between government contracting and firms’ external reporting
VolDisct+1 VolDisc_Freqt+1 Speedt+1
Variable Pred. sign (1) (2) (3) (4) (5) (6)
Contract + 0.064*** 0.959*** 0.005*** (7.72) (6.31) (4.98) $Contract/Sales + 0.091*** 1.596*** 0.005*** (7.69) (6.97) (3.81)
Control variables
Sizet 0.009*** 0.010*** –0.032 –0.020 0.008*** 0.008*** (3.09) (3.38) (–0.81) (–0.52) (17.35) (17.52) Leveraget 0.082*** 0.084*** 1.395*** 1.430*** –0.018*** –0.018*** (5.08) (5.25) (5.29) (5.43) (–9.00) (–8.91) MTBt –0.001** –0.001** –0.000 0.000 –0.0001** –0.0001** (–2.40) (–2.39) (–0.01) (0.02) (–2.46) (–2.47) SalesGrowtht 0.001 0.001 0.081* 0.083* –0.003*** –0.003*** (0.27) (0.24) (1.88) (1.94) (–6.89) (–6.95) ROAt 0.196*** 0.197*** 2.402*** 2.422*** 0.014*** 0.014*** (16.49) (16.64) (14.78) (14.96) (7.83) (7.89) Losst –0.023*** –0.023*** –0.648*** –0.640*** –0.008*** –0.008*** (–3.97) (–3.90) (–6.89) (–6.81) (–9.55) (–9.54) Returnst 0.028*** 0.028*** 0.623*** 0.619*** 0.003*** 0.003*** (9.26) (9.17) (14.01) (13.90) (6.10) (6.06) σReturnst 0.026 0.028 –3.537*** –3.473*** –0.032*** –0.033*** (0.99) (1.05) (–9.70) (–9.56) (–7.94) (–7.98) SpecialItems –0.364*** –0.367*** –4.668*** –4.716*** –0.011** –0.011** (–11.46) (–11.58) (–10.40) (–10.52) (–2.31) (–2.38) BigN 0.087*** 0.087*** 1.079*** 1.086*** 0.019*** 0.019*** (10.66) (10.71) (8.65) (8.70) (17.94) (17.95) NAnalysts 0.031*** 0.031*** 0.446*** 0.447*** 0.001*** 0.001*** (36.57) (36.76) (29.44) (29.65) (16.32) (16.33) NInstit –0.00008** –0.00007** 0.002** 0.002** 0.00002*** 0.00002*** (–2.26) (–2.17) (2.12) (2.10) (4.71) (4.87)
Year Effects Yes Yes Yes Yes Yes Yes Industry Effects Yes Yes Yes Yes Yes Yes Observations 79,383 79,383 79,383 79,383 79,383 79,383 R2 (%) 34.0 34.0 34.3 34.4 39.8 39.8
Electronic copy available at: https://ssrn.com/abstract=3197640
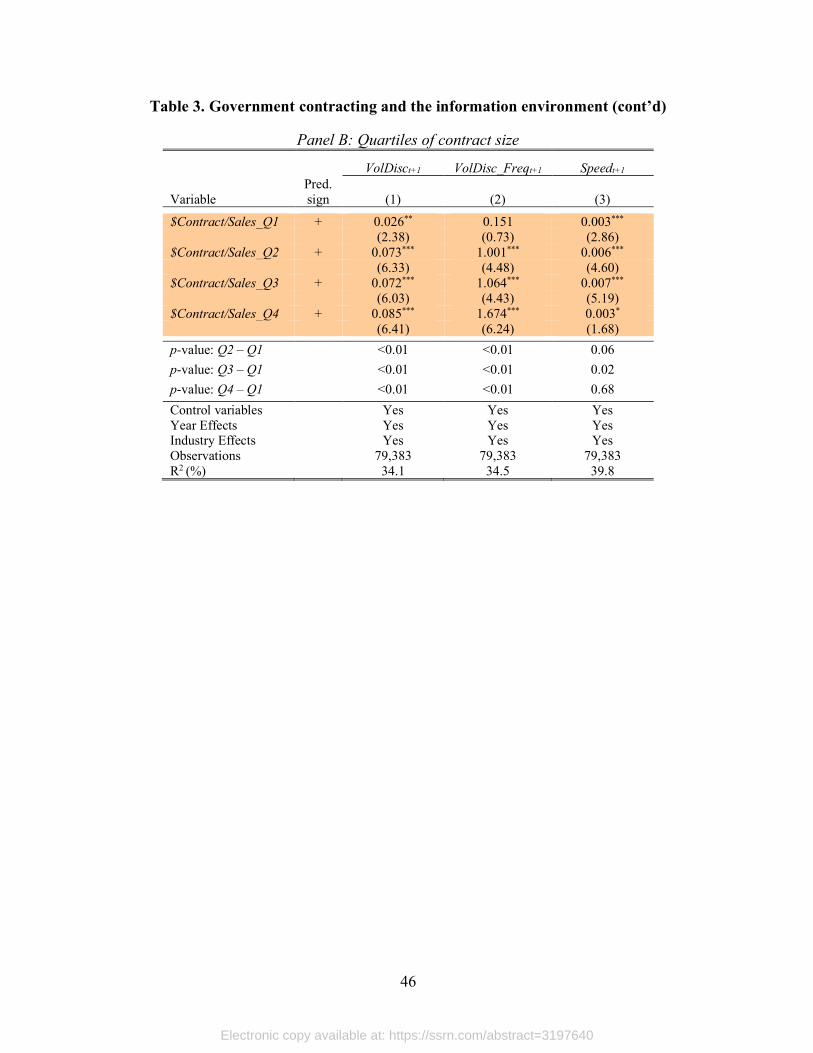
46
Table 3. Government contracting and the information environment (cont’d)
Panel B: Quartiles of contract size
VolDisct+1 VolDisc_Freqt+1 Speedt+1
Variable Pred. sign (1) (2) (3)
$Contract/Sales_Q1 + 0.026** 0.151 0.003*** (2.38) (0.73) (2.86) $Contract/Sales_Q2 + 0.073*** 1.001*** 0.006*** (6.33) (4.48) (4.60) $Contract/Sales_Q3 + 0.072*** 1.064*** 0.007*** (6.03) (4.43) (5.19) $Contract/Sales_Q4 + 0.085*** 1.674*** 0.003* (6.41) (6.24) (1.68)
p-value: Q2 – Q1 <0.01 <0.01 0.06
p-value: Q3 – Q1 <0.01 <0.01 0.02
p-value: Q4 – Q1 <0.01 <0.01 0.68
Control variables Yes Yes Yes Year Effects Yes Yes Yes Industry Effects Yes Yes Yes Observations 79,383 79,383 79,383 R2 (%) 34.1 34.5 39.8
Electronic copy available at: https://ssrn.com/abstract=3197640
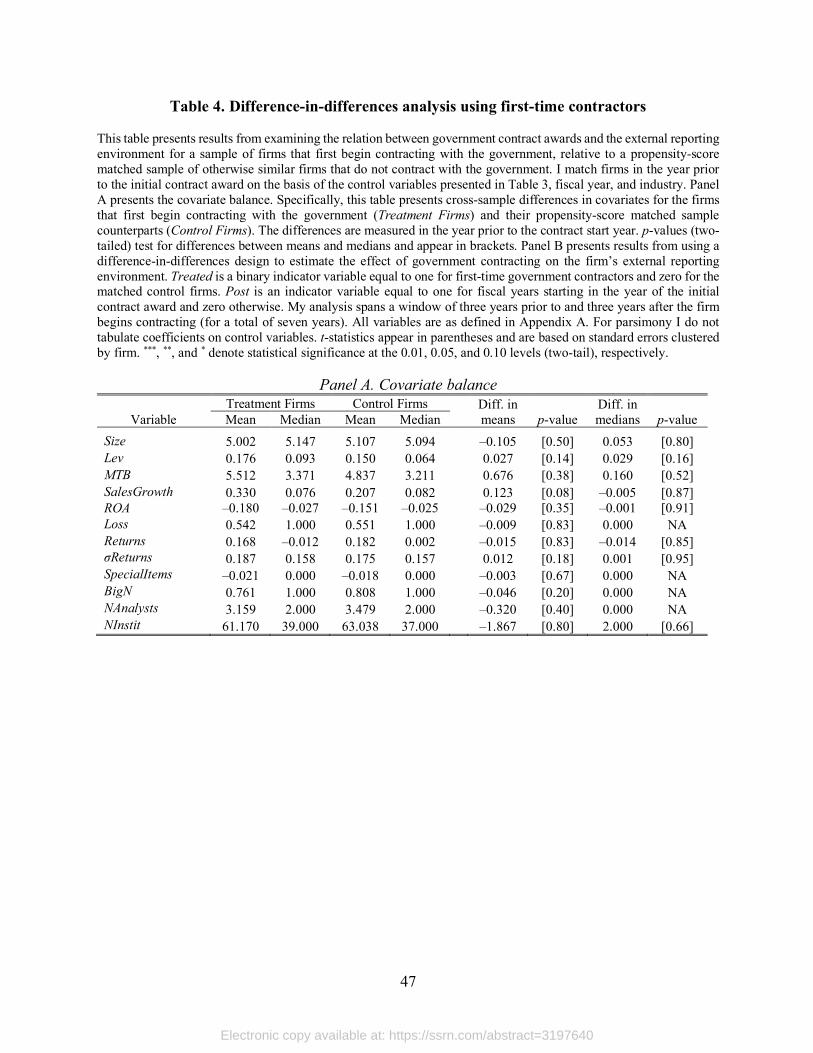
47
Table 4. Difference-in-differences analysis using first-time contractors
This table presents results from examining the relation between government contract awards and the external reporting environment for a sample of firms that first begin contracting with the government, relative to a propensity-score matched sample of otherwise similar firms that do not contract with the government. I match firms in the year prior to the initial contract award on the basis of the control variables presented in Table 3, fiscal year, and industry. Panel A presents the covariate balance. Specifically, this table presents cross-sample differences in covariates for the firms that first begin contracting with the government (Treatment Firms) and their propensity-score matched sample counterparts (Control Firms). The differences are measured in the year prior to the contract start year. p-values (two-tailed) test for differences between means and medians and appear in brackets. Panel B presents results from using a difference-in-differences design to estimate the effect of government contracting on the firm’s external reporting environment. Treated is a binary indicator variable equal to one for first-time government contractors and zero for the matched control firms. Post is an indicator variable equal to one for fiscal years starting in the year of the initial contract award and zero otherwise. My analysis spans a window of three years prior to and three years after the firm begins contracting (for a total of seven years). All variables are as defined in Appendix A. For parsimony I do not tabulate coefficients on control variables. t-statistics appear in parentheses and are based on standard errors clustered by firm. ***, **, and * denote statistical significance at the 0.01, 0.05, and 0.10 levels (two-tail), respectively.
Panel A. Covariate balance
Variable Treatment Firms Control Firms Diff. in
means p-value Diff. in medians p-value Mean Median Mean Median
Size 5.002 5.147 5.107 5.094 –0.105 [0.50] 0.053 [0.80] Lev 0.176 0.093 0.150 0.064 0.027 [0.14] 0.029 [0.16] MTB 5.512 3.371 4.837 3.211 0.676 [0.38] 0.160 [0.52] SalesGrowth 0.330 0.076 0.207 0.082 0.123 [0.08] –0.005 [0.87] ROA –0.180 –0.027 –0.151 –0.025 –0.029 [0.35] –0.001 [0.91] Loss 0.542 1.000 0.551 1.000 –0.009 [0.83] 0.000 NA Returns 0.168 –0.012 0.182 0.002 –0.015 [0.83] –0.014 [0.85] σReturns 0.187 0.158 0.175 0.157 0.012 [0.18] 0.001 [0.95] SpecialItems –0.021 0.000 –0.018 0.000 –0.003 [0.67] 0.000 NA BigN 0.761 1.000 0.808 1.000 –0.046 [0.20] 0.000 NA NAnalysts 3.159 2.000 3.479 2.000 –0.320 [0.40] 0.000 NA NInstit 61.170 39.000 63.038 37.000 –1.867 [0.80] 2.000 [0.66]
Electronic copy available at: https://ssrn.com/abstract=3197640

48
Table 4. Difference-in-differences analysis using first-time contractors (cont’d)
Panel B. Difference-in-differences regressions
VolDisct+1 VolDisc_Freqt+1 Speedt+1
Variable Pred. sign (1) (2) (3) (4) (5) (6)
Treated x Post + 0.066** 0.058** 0.849** 0.776* 0.013*** 0.011*** (2.22) (2.02) (1.99) (1.93) (3.61) (3.30) Post –0.016 –0.006 –0.668** –0.510 –0.013*** –0.011*** (–0.61) (–0.21) (–2.00) (–1.57) (–4.09) (–3.73)
Control variables
Sizet 0.033** –0.071 0.007*** (1.98) (–0.29) (3.63) Leveraget 0.070 3.099*** 0.000 (1.04) (3.42) (0.03) MTBt 0.001 0.016* –0.000 (1.17) (1.82) (–0.82) SalesGrowtht 0.009 –0.184 –0.001 (0.94) (–1.36) (–1.23) ROAt 0.101** 1.287*** 0.012** (2.56) (2.63) (2.19) Losst –0.042** –0.760** –0.006** (–2.00) (–2.29) (–2.37) Returnst –0.001 0.240* 0.001 (–0.11) (1.95) (0.92) σReturnst –0.116 –3.051** 0.004 (–1.24) (–2.49) (0.40) SpecialItems –0.184* –1.517 0.013 (–1.72) (–1.54) (0.84) BigN 0.052 0.557* 0.007 (1.61) (1.88) (1.45) NAnalysts 0.006 0.076 0.001 (1.48) (0.82) (1.26) NInstit 0.001** 0.032*** 0.000 (2.13) (5.20) (0.31)
Year Effects Yes Yes Yes Yes Yes Yes Firm Effects Yes Yes Yes Yes Yes Yes Observations 3,006 3,006 3,006 3,006 3,006 3,006 R2 (%) 68.5 69.5 74.8 76.5 76.0 77.3
Electronic copy available at: https://ssrn.com/abstract=3197640
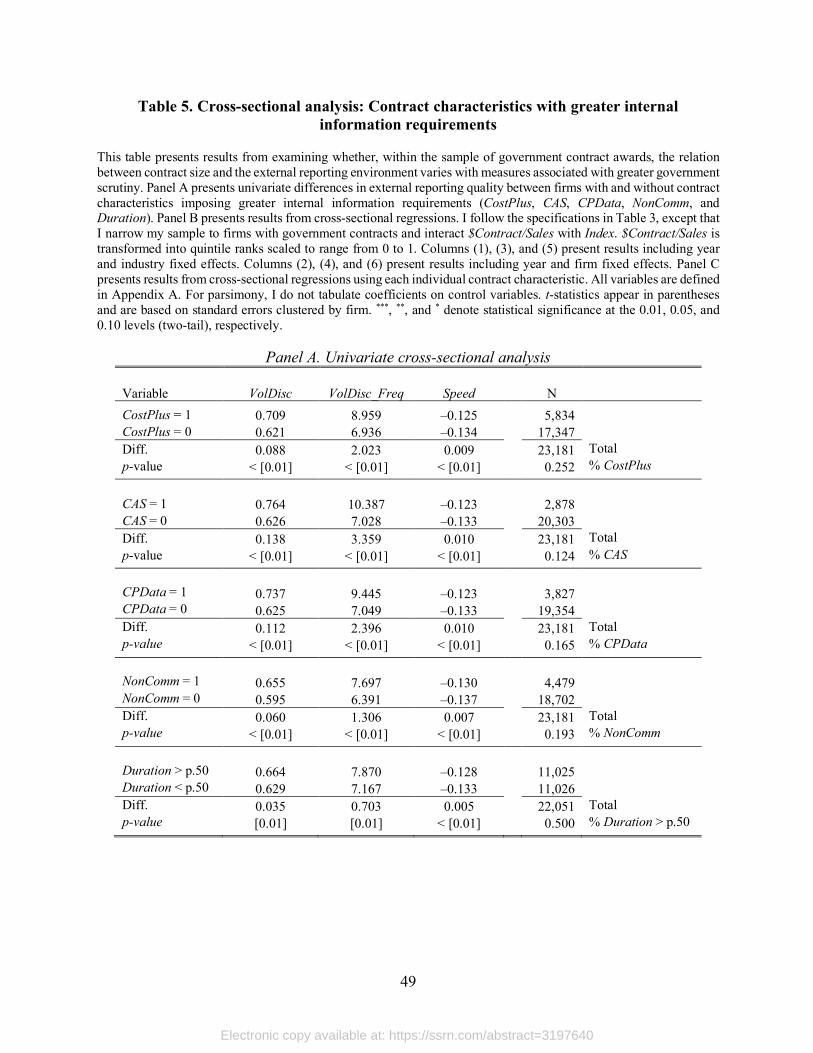
49
Table 5. Cross-sectional analysis: Contract characteristics with greater internal information requirements
This table presents results from examining whether, within the sample of government contract awards, the relation between contract size and the external reporting environment varies with measures associated with greater government scrutiny. Panel A presents univariate differences in external reporting quality between firms with and without contract characteristics imposing greater internal information requirements (CostPlus, CAS, CPData, NonComm, and Duration). Panel B presents results from cross-sectional regressions. I follow the specifications in Table 3, except that I narrow my sample to firms with government contracts and interact $Contract/Sales with Index. $Contract/Sales is transformed into quintile ranks scaled to range from 0 to 1. Columns (1), (3), and (5) present results including year and industry fixed effects. Columns (2), (4), and (6) present results including year and firm fixed effects. Panel C presents results from cross-sectional regressions using each individual contract characteristic. All variables are defined in Appendix A. For parsimony, I do not tabulate coefficients on control variables. t-statistics appear in parentheses and are based on standard errors clustered by firm. ***, **, and * denote statistical significance at the 0.01, 0.05, and 0.10 levels (two-tail), respectively.
Panel A. Univariate cross-sectional analysis
Variable VolDisc VolDisc_Freq Speed
N
CostPlus = 1 0.709 8.959 –0.125 5,834 CostPlus = 0 0.621 6.936 –0.134 17,347 Diff. 0.088 2.023 0.009 23,181 Total p-value < [0.01] < [0.01] < [0.01] 0.252 % CostPlus
CAS = 1 0.764 10.387 –0.123 2,878 CAS = 0 0.626 7.028 –0.133 20,303 Diff. 0.138 3.359 0.010 23,181 Total p-value < [0.01] < [0.01] < [0.01] 0.124 % CAS
CPData = 1 0.737 9.445 –0.123 3,827 CPData = 0 0.625 7.049 –0.133 19,354 Diff. 0.112 2.396 0.010 23,181 Total p-value < [0.01] < [0.01] < [0.01] 0.165 % CPData
NonComm = 1 0.655 7.697 –0.130 4,479 NonComm = 0 0.595 6.391 –0.137 18,702 Diff. 0.060 1.306 0.007 23,181 Total p-value < [0.01] < [0.01] < [0.01] 0.193 % NonComm
Duration > p.50 0.664 7.870 –0.128 11,025 Duration < p.50 0.629 7.167 –0.133 11,026 Diff. 0.035 0.703 0.005 22,051 Total p-value [0.01] [0.01] < [0.01] 0.500 % Duration > p.50
Electronic copy available at: https://ssrn.com/abstract=3197640
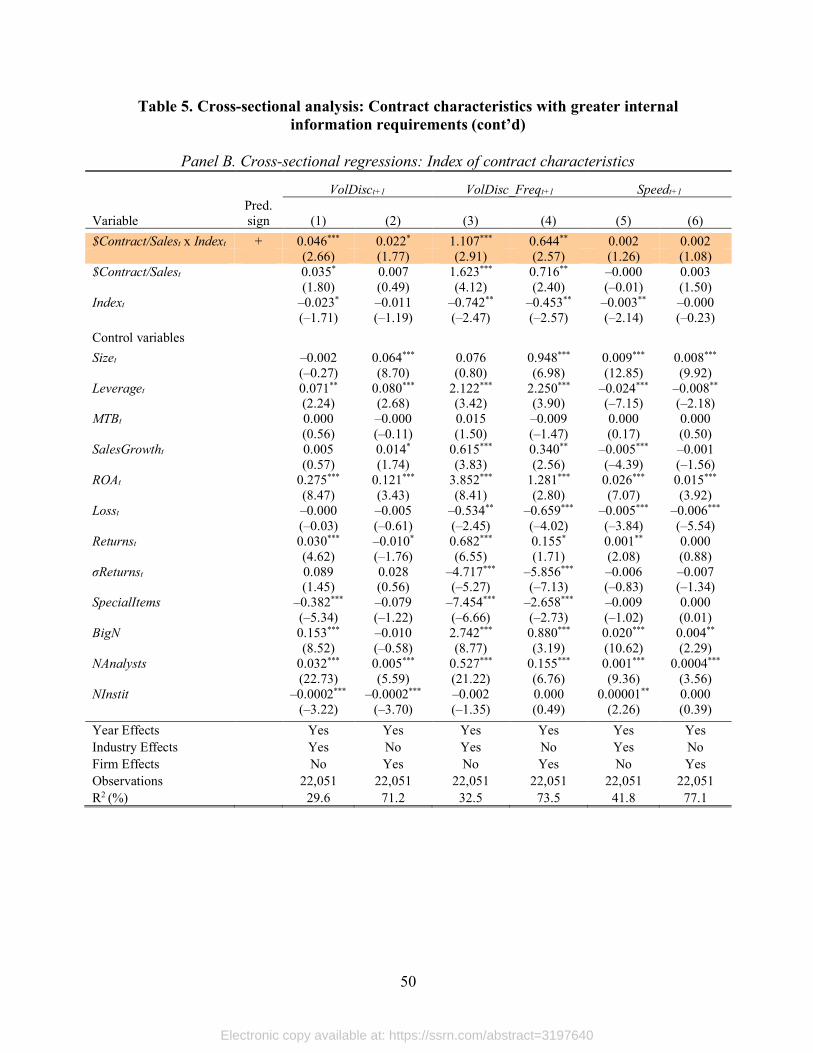
50
Table 5. Cross-sectional analysis: Contract characteristics with greater internal information requirements (cont’d)
Panel B. Cross-sectional regressions: Index of contract characteristics
VolDisct+1 VolDisc_Freqt+1 Speedt+1
Variable Pred. sign (1) (2) (3) (4) (5) (6)
$Contract/Salest x Indext + 0.046*** 0.022* 1.107*** 0.644** 0.002 0.002 (2.66) (1.77) (2.91) (2.57) (1.26) (1.08) $Contract/Salest 0.035* 0.007 1.623*** 0.716** –0.000 0.003 (1.80) (0.49) (4.12) (2.40) (–0.01) (1.50) Indext –0.023* –0.011 –0.742** –0.453** –0.003** –0.000 (–1.71) (–1.19) (–2.47) (–2.57) (–2.14) (–0.23)
Control variables
Sizet –0.002 0.064*** 0.076 0.948*** 0.009*** 0.008*** (–0.27) (8.70) (0.80) (6.98) (12.85) (9.92) Leveraget 0.071** 0.080*** 2.122*** 2.250*** –0.024*** –0.008** (2.24) (2.68) (3.42) (3.90) (–7.15) (–2.18) MTBt 0.000 –0.000 0.015 –0.009 0.000 0.000 (0.56) (–0.11) (1.50) (–1.47) (0.17) (0.50) SalesGrowtht 0.005 0.014* 0.615*** 0.340** –0.005*** –0.001 (0.57) (1.74) (3.83) (2.56) (–4.39) (–1.56) ROAt 0.275*** 0.121*** 3.852*** 1.281*** 0.026*** 0.015*** (8.47) (3.43) (8.41) (2.80) (7.07) (3.92) Losst –0.000 –0.005 –0.534** –0.659*** –0.005*** –0.006*** (–0.03) (–0.61) (–2.45) (–4.02) (–3.84) (–5.54) Returnst 0.030*** –0.010* 0.682*** 0.155* 0.001** 0.000 (4.62) (–1.76) (6.55) (1.71) (2.08) (0.88) σReturnst 0.089 0.028 –4.717*** –5.856*** –0.006 –0.007 (1.45) (0.56) (–5.27) (–7.13) (–0.83) (–1.34) SpecialItems –0.382*** –0.079 –7.454*** –2.658*** –0.009 0.000 (–5.34) (–1.22) (–6.66) (–2.73) (–1.02) (0.01) BigN 0.153*** –0.010 2.742*** 0.880*** 0.020*** 0.004** (8.52) (–0.58) (8.77) (3.19) (10.62) (2.29) NAnalysts 0.032*** 0.005*** 0.527*** 0.155*** 0.001*** 0.0004*** (22.73) (5.59) (21.22) (6.76) (9.36) (3.56) NInstit –0.0002*** –0.0002*** –0.002 0.000 0.00001** 0.000 (–3.22) (–3.70) (–1.35) (0.49) (2.26) (0.39)
Year Effects Yes Yes Yes Yes Yes Yes Industry Effects Yes No Yes No Yes No Firm Effects No Yes No Yes No Yes Observations 22,051 22,051 22,051 22,051 22,051 22,051 R2 (%) 29.6 71.2 32.5 73.5 41.8 77.1
Electronic copy available at: https://ssrn.com/abstract=3197640

51
Table 5. Cross-sectional analysis: Contract characteristics with greater internal information requirements (cont’d)
Panel C. Cross-sectional regressions: Individual contract characteristics
VolDisct+1 VolDisc_Freqt+1 Speedt+1
Variable Pred. sign (1) (2) (3) (4) (5) (6)
$Contract/Salest x CostPlust + 0.079** 0.049** 1.401** 0.960** 0.005 0.006** (2.24) (2.19) (2.07) (2.24) (1.41) (2.53) $Contract/Salest 0.014 –0.010 1.158*** 0.225 –0.003 0.001 (0.74) (–0.74) (3.10) (0.81) (–1.23) (0.34) CostPlust –0.040 –0.027* –1.007** –0.554* –0.005* –0.003 (–1.58) (–1.74) (–2.17) (–1.86) (–1.89) (–1.64)
Observations 23,181 23,182 23,181 23,182 23,181 23,182 R2 (%) 0.292 0.708 0.322 0.733 0.418 0.771
$Contract/Salest x CASt + 0.132** 0.047 2.695** 1.293* 0.004 –0.001 (2.45) (1.22) (2.17) (1.86) (0.72) (–0.20) $Contract/Salest 0.020 –0.003 1.061*** 0.339 –0.001 0.002 (1.16) (–0.22) (3.12) (1.28) (–0.73) (1.27) CASt –0.084* –0.028 –1.684 –0.775 –0.006 0.002 (–1.93) (–0.96) (–1.64) (–1.38) (–1.36) (0.80)
Observations 23,181 23,182 23,181 23,182 23,181 23,182 R2 (%) 0.292 0.708 0.323 0.733 0.418 0.771
$Contract/Salest x CPDatat + 0.071* –0.029 1.681* 0.010 0.003 –0.001 (1.66) (–1.00) (1.94) (0.02) (0.66) (–0.30) $Contract/Salest 0.016 0.003 1.047*** 0.481* –0.001 0.002 (0.89) (0.24) (3.00) (1.82) (–0.63) (1.31) CPDatat –0.022 0.025 –0.826 –0.215 –0.005 0.002 (–0.67) (1.16) (–1.25) (–0.58) (–1.49) (0.83)
Observations 23,181 23,182 23,181 23,182 23,181 23,182 R2 (%) 0.292 0.708 0.323 0.733 0.418 0.771
$Contract/Salest x NonCommt + 0.092*** 0.011 1.990*** 0.460 –0.005 –0.003 (2.98) (0.47) (3.70) (1.19) (–1.44) (–1.26) $Contract/Salest –0.043 –0.007 –0.190 0.088 0.003 0.005* (–1.48) (–0.31) (–0.38) (0.23) (0.92) (1.87) NonCommt –0.021 –0.006 –0.802*** –0.202 –0.001 0.001 (–1.52) (–0.57) (–2.89) (–1.06) (–0.38) (0.60)
Observations 23,181 23,182 23,181 23,182 23,181 23,182 R2 (%) 0.292 0.708 0.323 0.733 0.418 0.771
$Contract/Salest x Durationt + 0.011 0.020** 0.264 0.123 0.001 0.001 (0.90) (2.53) (1.00) (0.77) (0.89) (1.10) $Contract/Salest 0.037* –0.011 1.333*** 0.458 –0.003 0.002 (1.85) (–0.72) (3.14) (1.40) (–1.50) (1.37) Durationt –0.008 –0.010** –0.150 –0.037 –0.001 –0.001** (–0.96) (–2.03) (–1.02) (–0.39) (–1.34) (–2.04)
Observations 22,051 22,051 22,051 22,051 22,051 22,051 R2 (%) 0.295 0.712 0.324 0.734 0.417 0.771
Controls Yes Yes Yes Yes Yes Yes Year Effects Yes Yes Yes Yes Yes Yes Industry Effects Yes No Yes No Yes No Firm Effects No Yes No Yes No Yes
Electronic copy available at: https://ssrn.com/abstract=3197640

52
Table 6. Establishment of the Cost Accounting Standards Board
This table presents results from estimating the effect of the establishment of the Cost Accounting Standards Board in 1970 on firms’ external reporting environment. TopDefense is a binary indicator variable equal to one for firms among the top 100 military contractors in 1970 (treatment group) and zero for all other CRSP/Compustat firms in the same industries. Post is a binary indicator variable equal to one for fiscal years ended after 1970. Illiquidity is measured by the proportion of zero-return trading days over the fiscal year. All other variables are defined in Appendix A. Panel A presents descriptive statistics for all variables used in the analysis in the treatment and control groups. Panel B presents results for difference-in-differences regressions. Column (1) presents results from a specification including year and firm fixed effects. Column (2) presents results from a specification including year and firm fixed effects and control variables. My analysis spans fiscal years 1964–1976 and includes 72 treatment firms and 2,097 control firms. t-statistics appear in parentheses and are based on standard errors clustered by firm. ***, **, and * denote statistical significance at the 0.01, 0.05, and 0.10 levels (two-tail), respectively.
Panel A. Descriptive statistics
Treatment group (TopDefense = 1) Control group (TopDefense = 0) Variable Obs. Mean Std 25th Median 75th Obs. Mean Std 25th Median 75th
Measure of reporting
Illiquidity 865 0.138 0.092 0.071 0.115 0.175 15,296 0.275 0.202 0.131 0.210 0.357
Control variables
Size 801 6.104 1.600 5.033 6.191 7.334 13,203 3.602 1.818 2.247 3.396 4.835 Leverage 801 0.269 0.148 0.168 0.264 0.349 13,203 0.263 0.178 0.132 0.251 0.367 MTB 801 3.257 2.566 1.955 2.595 3.702 13,203 3.088 2.856 1.637 2.320 3.477 SalesGrowth 801 0.141 0.237 0.024 0.105 0.190 13,203 0.153 0.253 0.024 0.119 0.234 ROA 801 0.051 0.042 0.034 0.051 0.070 13,203 0.054 0.059 0.029 0.054 0.084 Loss 801 0.052 0.223 0.000 0.000 0.000 13,203 0.095 0.293 0.000 0.000 0.000 Returns 801 0.143 0.477 –0.166 0.081 0.388 13,203 0.117 0.560 –0.271 0.019 0.363 σReturns 801 0.102 0.047 0.068 0.093 0.128 13,203 0.130 0.063 0.086 0.118 0.160 SpecialItems 801 0.000 0.004 0.000 0.000 0.000 13,203 –0.001 0.006 0.000 0.000 0.000 BigN 801 0.245 0.430 0.000 0.000 0.000 13,203 0.323 0.468 0.000 0.000 1.000
Electronic copy available at: https://ssrn.com/abstract=3197640
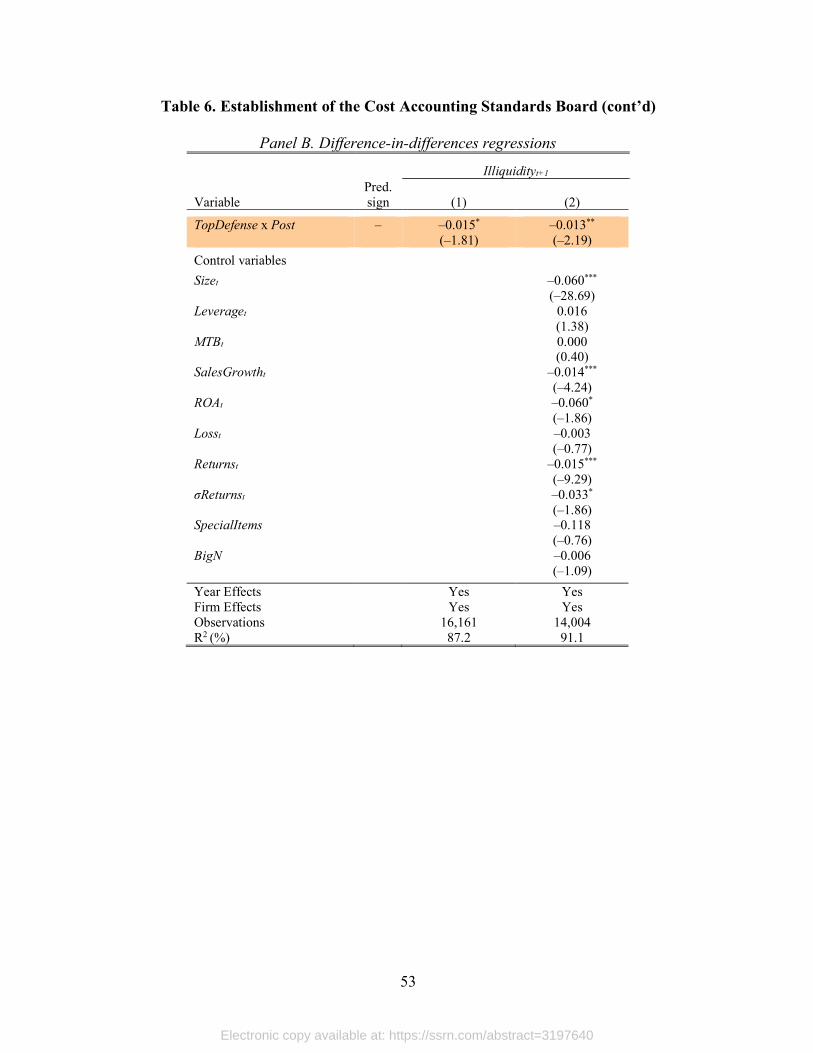
53
Table 6. Establishment of the Cost Accounting Standards Board (cont’d)
Panel B. Difference-in-differences regressions
Illiquidityt+1
Variable Pred. sign (1) (2)
TopDefense x Post – –0.015* –0.013** (–1.81) (–2.19)
Control variables
Sizet –0.060*** (–28.69) Leveraget 0.016 (1.38) MTBt 0.000 (0.40) SalesGrowtht –0.014*** (–4.24) ROAt –0.060* (–1.86) Losst –0.003 (–0.77) Returnst –0.015*** (–9.29) σReturnst –0.033* (–1.86) SpecialItems –0.118 (–0.76) BigN –0.006 (–1.09)
Year Effects Yes Yes Firm Effects Yes Yes Observations 16,161 14,004 R2 (%) 87.2 91.1
Electronic copy available at: https://ssrn.com/abstract=3197640

54
Table 7. Changes in the information environment after contract discontinuance
This table presents results from examining the relation between government contract awards and the external reporting environment for a sample of firms that discontinued contracting with the government, relative to a propensity-score matched sample of otherwise similar firms that do not contract with the government. I match firms in the year prior to the last year of contracting with the government on the basis of the control variables presented in Table 3, fiscal year, and industry. Panel A presents the covariate balance. Specifically, this table presents cross-sample differences in covariates for the firms that discontinue contracting with the government (Treatment Firms) and their propensity-score matched sample counterparts (Control Firms). The differences are measured in the year prior to the last year of contracting. p-values (two-tailed) tests for differences between means and medians and appear in brackets. Panel B presents results from using a difference-in-differences design to estimate the effect of the discontinuance of government contracting on the firm’s external reporting environment. Treated is a binary indicator variable equal to one for firms that discontinue contracting with the government and zero for the matched control firms. Post is an indicator variable equal to one for fiscal years starting in the year of contract discontinuance and zero otherwise. My analysis spans a window of three years prior to and three years after the firm discontinues contracting (for a total of seven years). All variables are as defined in Appendix A. For parsimony I do not tabulate coefficients on control variables. t-statistics appear in parentheses and are based on standard errors clustered by firm. ***, **, and * denote statistical significance at the 0.01, 0.05, and 0.10 levels (two-tail), respectively.
Panel A. Covariate balance
Variable Treatment Firms Control Firms Diff. in
means p-value Diff. in medians p-value Mean Median Mean Median
Size 5.710 5.880 5.732 5.608 –0.022 [0.94] 0.272 [0.51] Lev 0.226 0.146 0.194 0.136 0.032 [0.26] 0.010 [0.82] MTB 5.298 3.560 3.955 2.868 1.343 [0.12] 0.693 [0.10] SalesGrowth 0.121 0.050 0.092 0.057 0.028 [0.64] –0.007 [0.84] ROA –0.092 0.007 –0.053 0.013 –0.039 [0.24] –0.006 [0.66] Loss 0.445 0.000 0.403 0.000 0.042 [0.52] 0.000 NA Returns 0.191 0.056 0.190 0.085 0.001 [0.99] –0.029 [0.68] σReturns 0.153 0.127 0.147 0.112 0.006 [0.63] 0.015 [0.23] SpecialItems –0.008 0.000 –0.015 0.000 0.007 [0.23] 0.000 NA BigN 0.697 1.000 0.723 1.000 –0.025 [0.68] 0.000 NA NAnalysts 4.353 2.000 3.378 2.000 0.975 [0.15] 0.000 NA NInstit 116.983 65.000 109.294 69.000 7.689 [0.70] –4.000 [0.79]
Electronic copy available at: https://ssrn.com/abstract=3197640

55
Table 7. Changes in the information environment after contract discontinuance (cont’d)
Panel B. Difference-in-differences regressions
VolDisct+1 VolDisc_Freqt+1 Speedt+1
Variable Pred. sign (1) (2) (3) (4) (5) (6)
Treated x Post –/0 0.008 0.009 –0.649 –0.719 0.000 0.000 (0.21) (0.23) (–1.28) (–1.37) (0.09) (0.01) Post –0.023 –0.023 0.055 0.153 –0.001 0.000 (–0.68) (–0.71) (0.07) (0.22) (–0.15) (0.02)
Control variables
Sizet 0.035 0.188 0.005* (1.35) (0.57) (1.70) Leveraget 0.032 –1.927 –0.008 (0.29) (–0.96) (–0.59) MTBt 0.000 –0.002 –0.000 (0.57) (–0.24) (–0.88) SalesGrowtht 0.022 –0.053 0.000 (1.17) (–0.32) (0.01) ROAt 0.092 0.985 0.011 (1.09) (1.25) (1.39) Losst 0.006 0.066 –0.011*** (0.19) (0.20) (–3.21) Returnst –0.028 0.256 0.001 (–1.52) (1.11) (0.63) σReturnst 0.088 0.631 –0.004 (0.58) (0.35) (–0.30) SpecialItems 0.072 –1.888 0.027 (0.43) (–0.89) (1.24) BigN –0.030 –0.436 0.000 (–0.50) (–0.77) (0.08) NAnalysts –0.002 0.079 0.001 (–0.38) (1.06) (1.45) NInstit 0.000 0.008 –0.000 (1.14) (1.36) (–0.77)
Year Effects Yes Yes Yes Yes Yes Yes Firm Effects Yes Yes Yes Yes Yes Yes Observations 1,486 1,486 1,486 1,486 1,486 1,486 R2 (%) 75.5 75.9 82.1 82.5 78.4 79.5
Electronic copy available at: https://ssrn.com/abstract=3197640
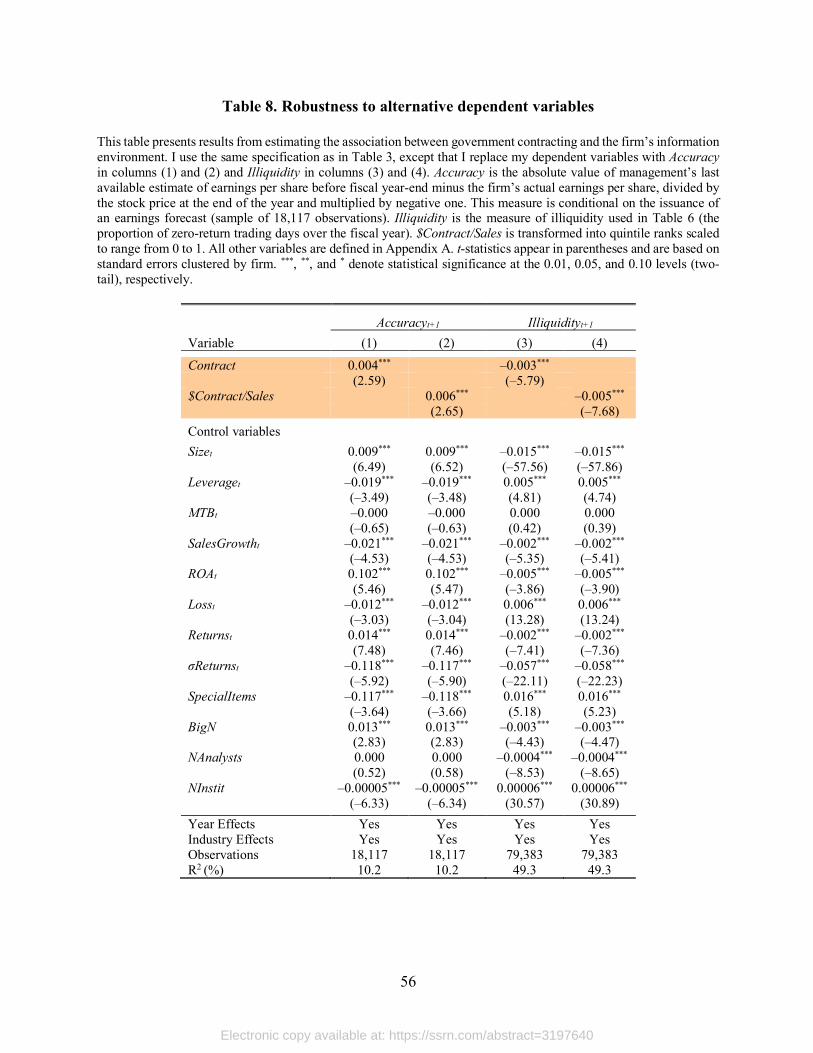
56
Table 8. Robustness to alternative dependent variables
This table presents results from estimating the association between government contracting and the firm’s information environment. I use the same specification as in Table 3, except that I replace my dependent variables with Accuracy in columns (1) and (2) and Illiquidity in columns (3) and (4). Accuracy is the absolute value of management’s last available estimate of earnings per share before fiscal year-end minus the firm’s actual earnings per share, divided by the stock price at the end of the year and multiplied by negative one. This measure is conditional on the issuance of an earnings forecast (sample of 18,117 observations). Illiquidity is the measure of illiquidity used in Table 6 (the proportion of zero-return trading days over the fiscal year). $Contract/Sales is transformed into quintile ranks scaled to range from 0 to 1. All other variables are defined in Appendix A. t-statistics appear in parentheses and are based on standard errors clustered by firm. ***, **, and * denote statistical significance at the 0.01, 0.05, and 0.10 levels (two-tail), respectively.
Accuracyt+1 Illiquidityt+1
Variable (1) (2) (3) (4)
Contract 0.004*** –0.003*** (2.59) (–5.79) $Contract/Sales 0.006*** –0.005*** (2.65) (–7.68)
Control variables
Sizet 0.009*** 0.009*** –0.015*** –0.015*** (6.49) (6.52) (–57.56) (–57.86) Leveraget –0.019*** –0.019*** 0.005*** 0.005*** (–3.49) (–3.48) (4.81) (4.74) MTBt –0.000 –0.000 0.000 0.000 (–0.65) (–0.63) (0.42) (0.39) SalesGrowtht –0.021*** –0.021*** –0.002*** –0.002*** (–4.53) (–4.53) (–5.35) (–5.41) ROAt 0.102*** 0.102*** –0.005*** –0.005*** (5.46) (5.47) (–3.86) (–3.90) Losst –0.012*** –0.012*** 0.006*** 0.006*** (–3.03) (–3.04) (13.28) (13.24) Returnst 0.014*** 0.014*** –0.002*** –0.002*** (7.48) (7.46) (–7.41) (–7.36) σReturnst –0.118*** –0.117*** –0.057*** –0.058*** (–5.92) (–5.90) (–22.11) (–22.23) SpecialItems –0.117*** –0.118*** 0.016*** 0.016*** (–3.64) (–3.66) (5.18) (5.23) BigN 0.013*** 0.013*** –0.003*** –0.003*** (2.83) (2.83) (–4.43) (–4.47) NAnalysts 0.000 0.000 –0.0004*** –0.0004*** (0.52) (0.58) (–8.53) (–8.65) NInstit –0.00005*** –0.00005*** 0.00006*** 0.00006*** (–6.33) (–6.34) (30.57) (30.89)
Year Effects Yes Yes Yes Yes Industry Effects Yes Yes Yes Yes Observations 18,117 18,117 79,383 79,383 R2 (%) 10.2 10.2 49.3 49.3
Electronic copy available at: https://ssrn.com/abstract=3197640