Embed Size (px)
Citation preview
EC3 Working Papers 17
1
Google Scholar Metrics 2014: a low cost bibliometric tool
Alberto Martín-Martín1, Juan Manuel Ayllón1, Enrique Orduña-Malea2,
Emilio Delgado López-Cózar1
1 EC3: Evaluación de la Ciencia y de la Comunicación Científica, Universidad de Granada (Spain) 2 EC3: Evaluación de la Ciencia y de la Comunicación Científica, Universidad Politécnica de Valencia (Spain)
ABSTRACT
We analyse the main features of the third edition of Google Scholar Metrics (GSM), released in June 2014, focusing on its more important changes, strengths, and weaknesses. Additionally, we present some figures that outline the dimensions of this new edition, and we compare them to those of previous editions. Principal among these figures are the number of visualized publications, publication types, languages, and the maximum and minimum h5-index and h5-median values by language, subject area, and subcategory. This new edition is marked by continuity. There is nothing new other than the updating of the time frame (2009-2013) and the removal of some redundant subcategories (from 268 to 261) for English written publications. Google has just updated the data, which means that some of the errors discussed in previous studies still persist. To sum up, GSM is a minimalist information product with few features, closed (it cannot be customized by the user), and simple (navigating it only takes a few clicks). For these reasons, we consider it a “low cost” bibliometric tool, and propose a list of features it should incorporate in order to stop being labeled as such. Notwithstanding the above, this product presents a stability in its bibliometric indicators that supports its ability to measure and track the impact of scientific publications.
KEYWORDS
Google Scholar / Google Scholar Metrics / Journals / Citations / Bibliometrics / H Index / Evaluation / Rankings
EC3’s Document Series: EC3 Working Papers, 17 Document History Version 1.0, Published on 8 July 2014, Granada
Cite as: Martín-Martín, A.; Ayllón, J.M.; Orduña-Malea, E.; Delgado López-Cózar, E. (2014). Google Scholar Metrics 2014: a low cost bibliometric tool. EC3 Working Papers, 17: 8 July 2014.
Corresponding author: Emilio Delgado López-Cózar. [email protected]

EC3 Working Papers 17
2
1. WHAT IS NEW IN GOOGLE SCHOLAR METRICS 2014? No surprises. Almost with the punctuality of a fine Swiss watch, Google released, on June the 26th, 20141, its ranking of scientific publications: Google Scholar Metrics (GSM). Last year’s version was published a bit later in the summer, on July the 24th, 2013. Google has stopped being different: it seems that from now on, these coveted lists of publications sorted by their scientific impact (that is, their h index) will be released every summer, whether it is on June, like this year, or July, like last year. This means that GSM: Google Scholar Metrics will join its competitors JCR (Journal Citation Reports) and SJR (Scimago Journal Rank) in updating the product on a yearly basis. We can only welcome that the American company has decided to keep supporting GSM, a free product which is also very different from traditional journal rankings. This support might very well dispel the concerns about the continuity of its big brother, Google Scholar. Competition is healthy, and scientists can only be pleased about this variety of search and ranking tools, especially when they are offered free of charge. Continuity and stability are the norm in this edition, since there is nothing new except for the removal of some subcategories (from 268 to 261) for English written publications. In short, Google has just updated the data, which means that some of the errors outlined in previous studies still persist [1-5]: the visualization of a limited number of publications (100 for those that are not published in English), the lack of categorization by subject areas and subcategories for non-English publications, and normalization problems (unification of journal titles, problems in the linking of documents, and problems in the search and retrieval of publication titles). As an example, it is inexcusable that there are duplicates to be found in a ranking of the top 100 publications (according to their h5-index) of a particular language. This is the case with the journal 日本機械学会論文集 C 編, which appears in the 42nd and 69th positions in the Japanese rankings, and in the Portuguese ranking, Pesquisa Agropecuária Brasileira appears in the 15th and 22nd positions, Revista Brasileira de Engenharia Agrícola e Ambiental in the 25th and 37th positions, and Revista brasileira de atividade física e saúde in the 91st and 93rd. In our previous studies, we have described again and again the underlying philosophy embedded in all of Google’s academic products. These products have been created in the image and likeness of Google’s general search engine: fast, simple, easy to use, understand and, last but not least, accessible to everyone free of charge. GSM follows all these precepts, and it is, in the end, nothing more than:
- A hybrid between a bibliometric tool (indicators based on citation counts), and a bibliography (a list of highly cited documents, and of the documents that cite them).
- It offers a simple, straightforward journal classification scheme (although it also includes some conferences and repositories).
1 http://googlescholar.blogspot.com.es/2014/06/2014-scholar-metrics-released.html

Google Scholar Metrics 2014: a low cost bibliometric tool
3
- It is based on two basic bibliometric indicators (the h index, and the median number of citations for the articles that contribute in the h index).
- It covers a single five-year time frame (the current one being 2009-2013). - It uses rudimentary journal inclusion criteria, namely: publishing at least
100 articles during the last five-year period, and having received at least one citation.
- It provides lists of publications according to the language their documents are written in. For all of them, except for English publications (these are a total of 8: Chinese, Portuguese, German, Spanish, French, Japanese, Dutch, and Italian) it offers lists of only 100 titles: those with the higher h index. For English publications, however, it shows a total of 18 different publications, grouped in 8 subject areas and 261 subcategories. For each publication it shows the titles of the documents whose citations contribute to the h index, and for each one of these documents, in turn, the titles of the documents that cite them.
- It provides a search feature that, for any given set of keywords, will retrieve a list of 20 publications whose titles contain the selected keywords. In the cases where there are more than 20 publications that satisfy the query, only the first 20 results (those with a higher h index), will be displayed.
- It doesn’t perform any kind of quality control in the indexing process nor in the information visualization process.
To sum up, GSM is a minimalist information product with few features, closed (it cannot be customized by the user), and simple (navigating it only takes a few clicks). If GSM wants to stop being labeled as a “low cost bibliometric tool”, it should incorporate a wider range of features. At the very least, it should:
- Display the total number of publications indexed in GSM, as well as their countries and language of publication. Our estimations lead us to believe that this figure is probably higher than 40,000 [5]. In the case of Spain, there are over 1,000 publications indexed, which make up about 45% of the total number of academic publications in Spain [6, 7].
- Provide some other basic and descriptive bibliometric indicators, like the total number of documents published in the journals indexed in GSM, and the total number of citations received in the analysed time frame. These are the two essential parameters that make it possible to assess the reliability and accuracy of any bibliometric indicator. Other indicators could be added in order to elucidate other issues like self-citation rates, impact over time (immediacy index), or to normalize results (citation average).
- Provide the complete list of documents of any given publication that have received n citations and especially those that have received “0” citations. This would allow us to verify the accuracy of the information provided by this product. It is true, much to Google’s credit, that this information could be extracted, though not easily, from Google Scholar.
- Provide a detailed list of the conferences and repositories included in the product. The statement Google makes about including some conferences in the Engineering & Computer Science area, and some
EC3 Working Papers 17
4
document collections like the mega-repositories arXiv, RePec and SSRN, is much too vague.
- Define the criteria that has been followed for the creation of the classification scheme (areas and subcategories), and the rules and procedures followed when assigning publications to these areas and subcategories.
- Enable the selection of different time frames for the calculation of indicators and the visualization and sorting of publications. The significant disparities in publishing processes and citation habits between areas (publishing speed, pace of obsolescence) require the possibility to customize the time frame according to the particularities of any given subject area.
- Enable access to previous versions of Google Scholar Metrics (2007-2011, 2008-2012) to ensure that it is possible to assess the evolution of publications over time. Moreover, they could dare venture into the unknown and do something no one else has done before: a dynamic product, with indicators and rankings updated in real-time, just as Google Scholar does.
- Enable browsing publications by language, country and subcategory, and directly display all results for these selections.
- Remove visualization restrictions: currently 100 results for each language and 20 for each subcategory or keyword search.
- Enable the visualization of results by country of publication and by publisher.
- Enable sorting results according to various criteria (publication title, country, language, publishers), as well as according to other indicators (h index, h median, number of documents per publication, number of citations, self-citation rate…).
- Enable searching not only by publication title, but also by country and language of publication.
- Enable an option for exporting global results, as well as results by discipline, or those of a custom query.
- Enable an option for reporting errors detected by users, so they can be fixed (duplicate titles, erroneous titles, incorrect links, deficient calculations…).
2. GOOGLE SCHOLAR METRICS 2014 IN NUMBERS Below we offer some data with the goal of shedding some light over the dimensions of this new edition of GSM and its differences, in quantitative terms, with previous versions of the product. 2.1. Publications visualized through GSM rankings The total number of publications that can be visualized in the 2014 rankings is 7,100. Now, however, since 1,338 of them (24.7%) are classified in more than one subject area (Table 1), the number of unique publications is lower: 5,418.

Google Scholar Metrics 2014: a low cost bibliometric tool
5
Table 1 Distribution of publications according to number of assigned subcategories
in Google Scholar Metrics 2014 Nº of
subcategories Publications
N % 1 4,100 75.7 2 1,131 20.9 3 125 2.3 4 51 0.9 5 6 0.1 6 5 0.1
Total 5,418 100.0 In 2014 there is a slight drop in the number of publications if we compare it with the previous edition (2008-2012), where 7,171 publications could be visualized in the rankings (5,462 unique publications). 2.2. Languages of visualized publications in GSM rankings GSM rankings show an overwhelming skew towards the English language [8]: in this edition, the rankings show a total of 4,435 English-written publications (89%), and only 983 written in other languages, namely Chinese, Portuguese, German, Spanish, French, Italian, Japanese and Dutch (Figure 1). For all these languages, only 100 publications are shown in the language rankings, except in the case of Dutch publications, where only 83 items are shown.
Figure 1
Distribution of publications according to languages in the Google Scholar Metrics 2014 rankings
89%
2% 2% 2% 1%
1% 1% 1% 1%
English
Chinese
Portuguese
German
Spanish
French
Italian
Japanese
Dutch

EC3 Working Papers 17
6
2.3. Types of publications visualized in GSM rankings The predominant type of publication in the GSM rankings is the scientific journal: up to 5,068 of the total of 5,418 visualized publications (93.5%) belong to this type of publication (Figure 2).
Figure 2 Distribution of publications according to the type of source
in the Google Scholar Metrics 2014 rankings
As is apparent from Table 2, if we compare the current version of the product with the last version (2008-2012), there haven’t been any significant changes in the share each type of source holds.
Table 2 Distribution of publications according to the type of source
in Google Scholar Metrics rankings 2008-2012 and 2009-2013
Sources Publications 2008-2012 % 2009-2013 %
Repositories 115 2.1 118 2.2 Conferences 241 4.4 232 4.3 Journals 5,107 93.5 5,068 93.5 Total 5,463 100 5,418 100
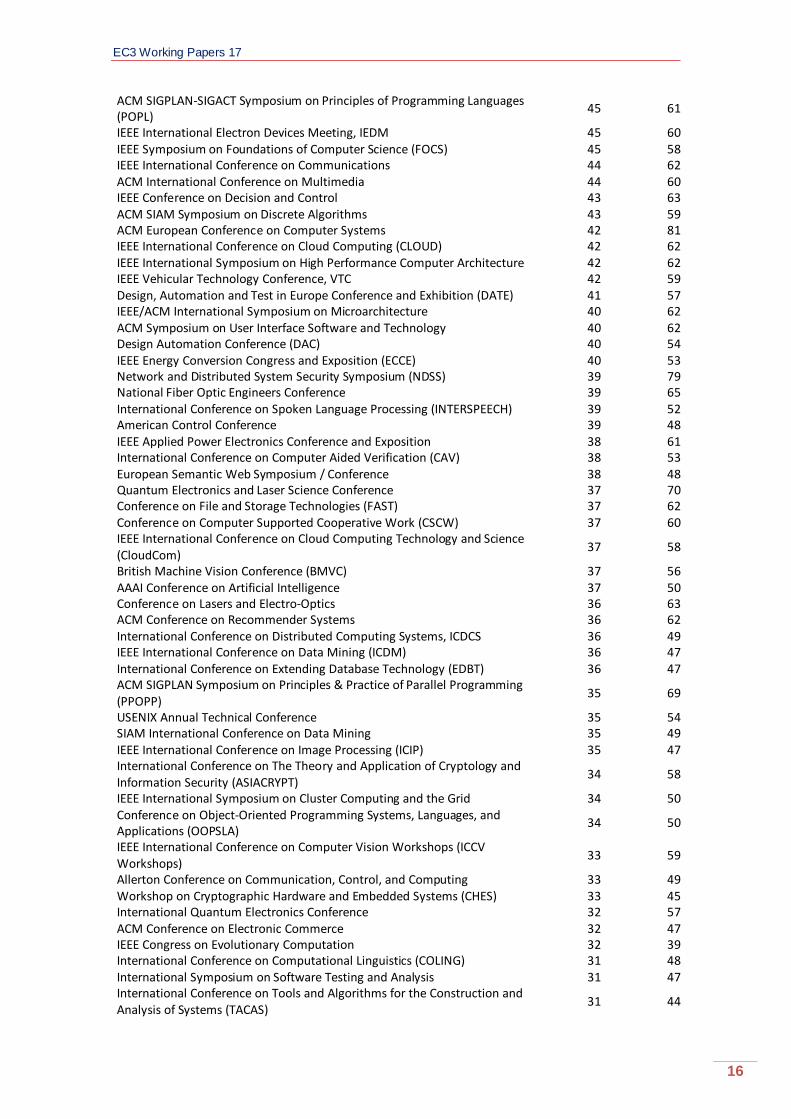
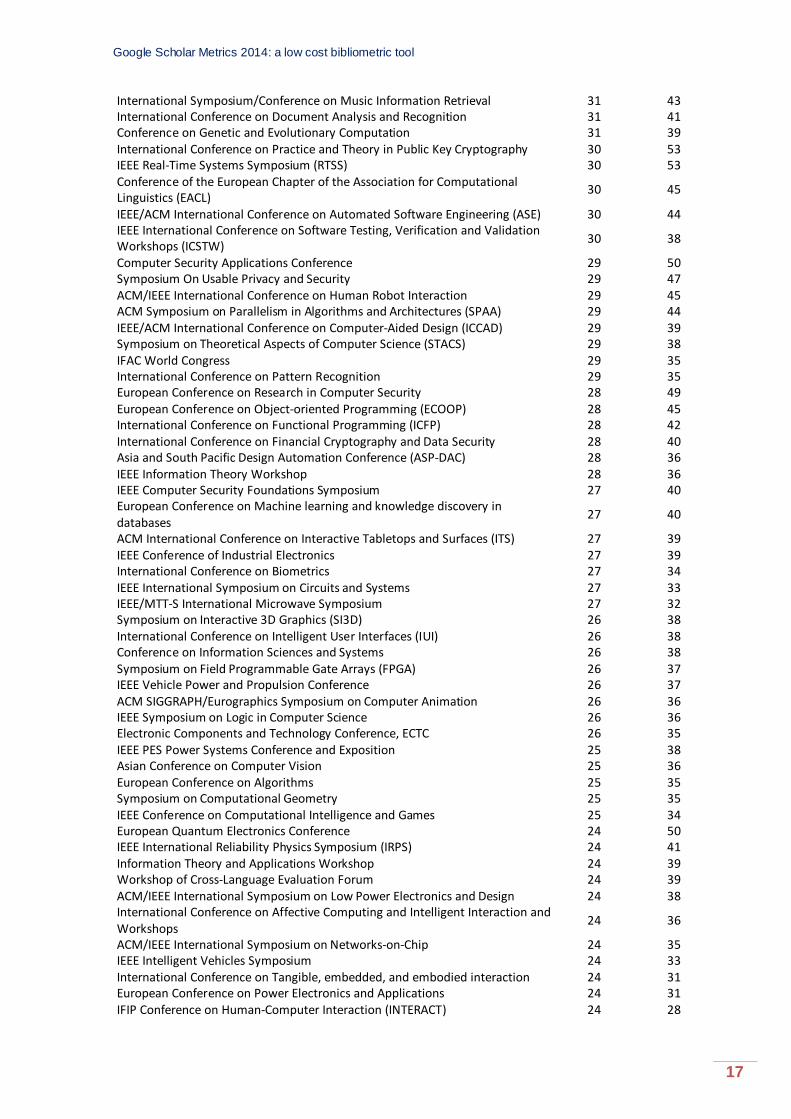
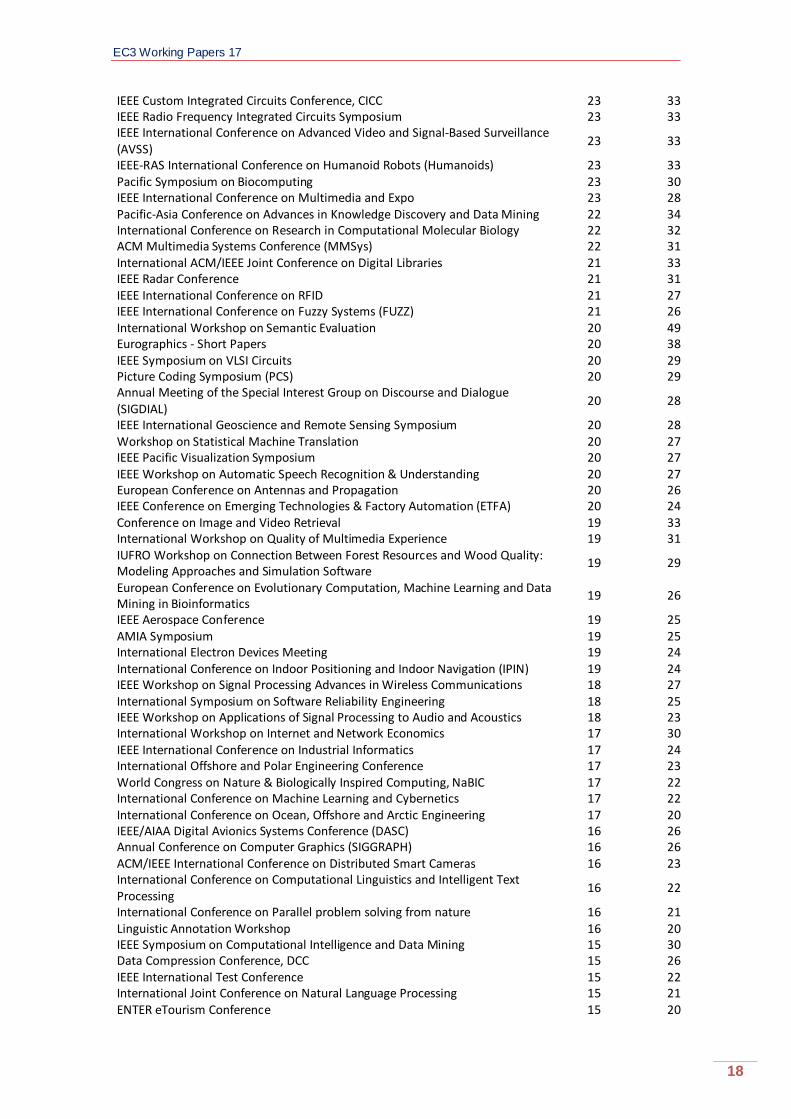
Conferences only make up 4.3% (232) of the visualized publications in the rankings. For the complete list of conferences, see Appendix 1. They are mostly concentrated in the Computer Science area, especially in subcategories like Computational Linguistics, Computer Hardware Design, Computer Networks & Wireless Communication, Computer Security & Cryptography, Computer Vision & Pattern Recognition, Computing Systems, Data Mining & Analysis, and Databases & Information Systems (Table 3).
2% 4%
94%
Repositories Conferences Journals
Google Scholar Metrics 2014: a low cost bibliometric tool
7
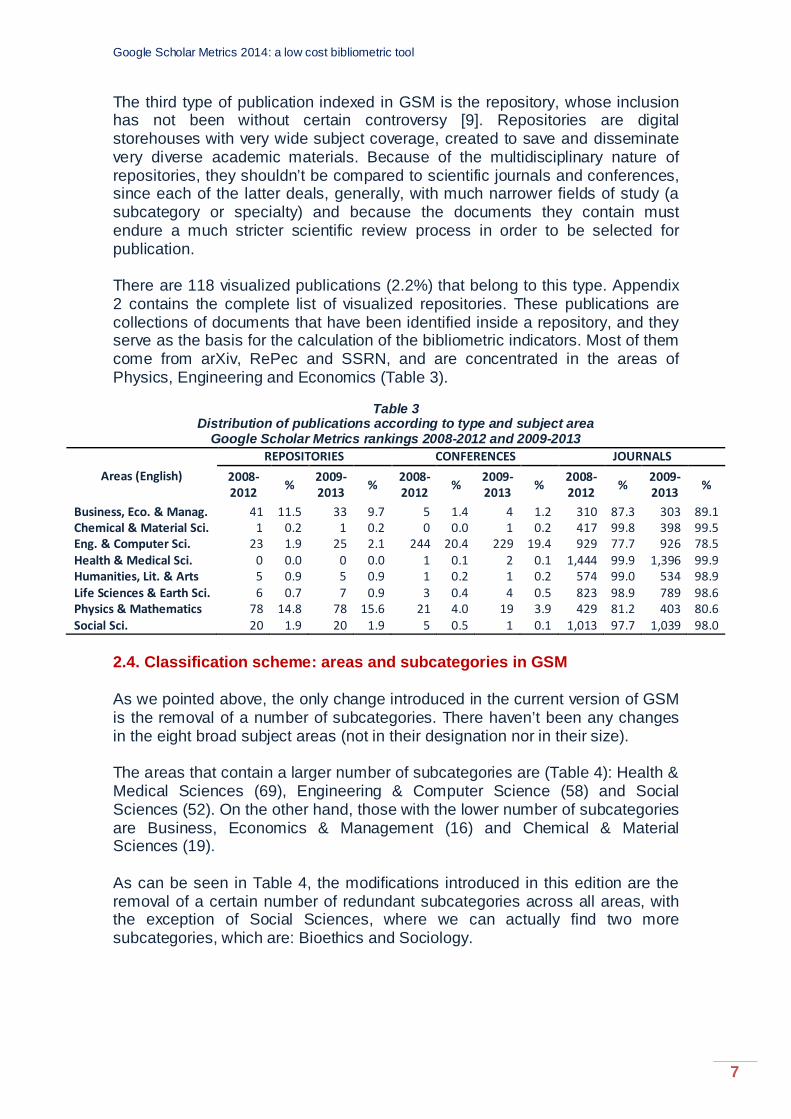
The third type of publication indexed in GSM is the repository, whose inclusion has not been without certain controversy [9]. Repositories are digital storehouses with very wide subject coverage, created to save and disseminate very diverse academic materials. Because of the multidisciplinary nature of repositories, they shouldn’t be compared to scientific journals and conferences, since each of the latter deals, generally, with much narrower fields of study (a subcategory or specialty) and because the documents they contain must endure a much stricter scientific review process in order to be selected for publication. There are 118 visualized publications (2.2%) that belong to this type. Appendix 2 contains the complete list of visualized repositories. These publications are collections of documents that have been identified inside a repository, and they serve as the basis for the calculation of the bibliometric indicators. Most of them come from arXiv, RePec and SSRN, and are concentrated in the areas of Physics, Engineering and Economics (Table 3).
Table 3 Distribution of publications according to type and subject area
Google Scholar Metrics rankings 2008-2012 and 2009-2013
Areas (English) REPOSITORIES CONFERENCES JOURNALS
2008- 2012 % 2009-
2013 % 2008- 2012 % 2009-
2013 % 2008- 2012 % 2009-
2013 %
Business, Eco. & Manag. 41 11.5 33 9.7 5 1.4 4 1.2 310 87.3 303 89.1 Chemical & Material Sci. 1 0.2 1 0.2 0 0.0 1 0.2 417 99.8 398 99.5 Eng. & Computer Sci. 23 1.9 25 2.1 244 20.4 229 19.4 929 77.7 926 78.5 Health & Medical Sci. 0 0.0 0 0.0 1 0.1 2 0.1 1,444 99.9 1,396 99.9 Humanities, Lit. & Arts 5 0.9 5 0.9 1 0.2 1 0.2 574 99.0 534 98.9 Life Sciences & Earth Sci. 6 0.7 7 0.9 3 0.4 4 0.5 823 98.9 789 98.6 Physics & Mathematics 78 14.8 78 15.6 21 4.0 19 3.9 429 81.2 403 80.6 Social Sci. 20 1.9 20 1.9 5 0.5 1 0.1 1,013 97.7 1,039 98.0
2.4. Classification scheme: areas and subcategories in GSM As we pointed above, the only change introduced in the current version of GSM is the removal of a number of subcategories. There haven’t been any changes in the eight broad subject areas (not in their designation nor in their size). The areas that contain a larger number of subcategories are (Table 4): Health & Medical Sciences (69), Engineering & Computer Science (58) and Social Sciences (52). On the other hand, those with the lower number of subcategories are Business, Economics & Management (16) and Chemical & Material Sciences (19). As can be seen in Table 4, the modifications introduced in this edition are the removal of a certain number of redundant subcategories across all areas, with the exception of Social Sciences, where we can actually find two more subcategories, which are: Bioethics and Sociology.

EC3 Working Papers 17
8
Table 4 Number of subcategories by subject area
Google Scholar Metrics 2008-2012 and 2009-2013 Subject Areas Nº of subcategories
2008-2012 2009-2013 Physics & Mathematics 26 24 Chemical & Material Sciences 20 19 Engineering & Computer Science 59 58 Health & Medical Sciences 72 69 Life Sciences & Earth Sciences 41 39 Humanities, Literature & Arts 28 26 Business, Economics & Management 17 16 Social Sciences 50 52
TOTAL 287 269 It is important, however, to note that the number of unique subcategories is lower than the summation of subcategories in the eight aforementioned areas. This is so because some subcategories are included in more than one subject area. Particularly, this phenomenon is present in 44 subcategories in the 2008-2012 version of GSM, and in 42 subcategories in the current 2009-2013 version (Table 5). If these duplicates are not taken into account, the total number of unique subcategories for the 2008-2012 version is 268 subcategories, and 261 for the current version.
Table 5 List of duplicate subcategories
Google Scholar Metrics 2008-2012 and 2009-2013 SUBCATEGORIES 2008-2012 2009-2013
Lipids 3 0 African Studies & History 2 2 Architecture 2 2 Asian Studies & History 2 2 Biochemistry 2 2 Bioethics 2 2 Bioinformatics & Computational Biology 2 2 Biomedical Technology 2 2 Biophysics 2 2 Biotechnology 2 2 Canadian Studies & History 2 2 Ceramic Engineering 2 2 Chinese Studies & History 2 2 Combustion & Propulsion 2 2 Development Economics 2 2 Economic History 2 2 Educational Administration 2 2 Educational Technology 2 2 Environmental & Geological Engineering 2 2 Epistemology & Scientific History 2 2 Feminism & Women's Studies 2 2 Food Science & Technology 2 2 Game Theory and Decision Science 2 2 History 2 2 Human Resources & Organizations 2 2 Library & Information Science 2 2 Materials Engineering 2 2 Medical Informatics 2 2

Google Scholar Metrics 2014: a low cost bibliometric tool
9
Medicinal Chemistry 2 2 Microscopy 2 0 Middle Eastern & Islamic Studies 2 2 Molecular Biology 2 2 Molecular Modeling 2 2 Nanotechnology 2 2 Oil, Petroleum & Natural Gas 2 2 Paleontology 2 2 Plasma & Fusion 2 2 Public Health 2 2 Sex & Sexuality 2 2 Sustainable Development 2 2 Sustainable Energy 2 2 Technology Law 2 2 Virology 2 2 Wood Science & Technology 2 2
TOTAL 89 84 2.5. Bibliometric indicators of the publications in the GSM rankings First of all, differences between scientific areas regarding bibliometric indicators become apparent once more. In Table 6 we present the maximum and minimum h5-index and h5-median values according to the subject area as shown in the GSM rankings for English written publications (Appendix 3 presents the same indicators by subcategories). It should be kept in mind that this is just a matter of the sizes and the cognitive and methodological natures of these scientific communities, which lead to very diverse publishing and citation habits.
Table 6
Maximum and minimum h5-index and h5-median values according to the subject area in the GSM rankings for English written publications (2009-2013)
SUBJECT AREAS Maximum H5-Index
Minimum H5-Index
Maximum H5-Median
Minimum H5-Median
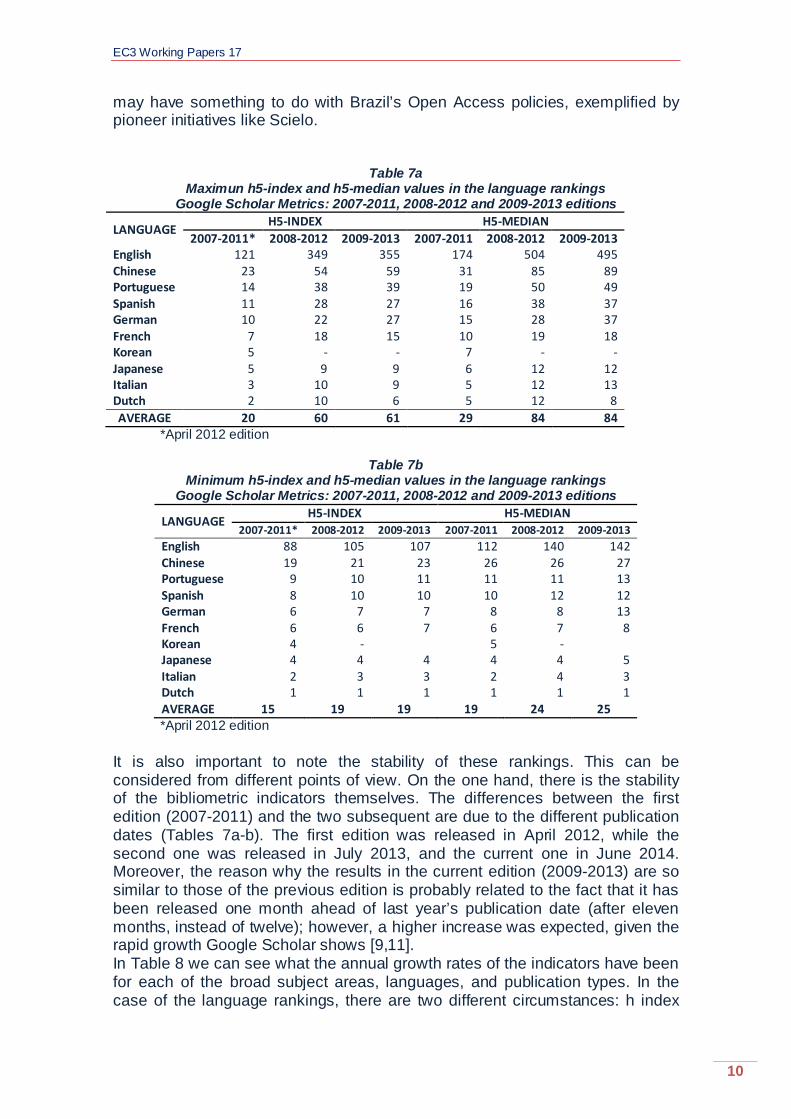
Life Sciences & Earth Sciences 355 108 495 146 Health & Medical Sciences 329 129 495 176 Chemical & Material Sciences 193 102 339 133 Physics & Mathematics 191 107 263 140 Engineering & Computer Science 174 93 253 130 Business, Economics & Management 168 63 241 92 Social Sciences 81 45 116 59 Humanities, Literature & Arts 38 25 72 30 Secondly, the significant differences among h index values for the publications of the nine languages covered in GSM (Tables 7a and 7b) should once again be stressed. English written publications have much better results than publications in other languages. It is no wonder that Chinese publications hold the second place, considering the high scientific output in this language. It is surprising, however, that Portuguese publications seem to do better than Spanish publications, considering that the size of the Spanish-speaking scientific community is larger than the Portuguese community. The explanation
EC3 Working Papers 17
10
may have something to do with Brazil’s Open Access policies, exemplified by pioneer initiatives like Scielo.
Table 7a Maximun h5-index and h5-median values in the language rankings
Google Scholar Metrics: 2007-2011, 2008-2012 and 2009-2013 editions
LANGUAGE H5-INDEX H5-MEDIAN 2007-2011* 2008-2012 2009-2013 2007-2011 2008-2012 2009-2013
English 121 349 355 174 504 495 Chinese 23 54 59 31 85 89 Portuguese 14 38 39 19 50 49 Spanish 11 28 27 16 38 37 German 10 22 27 15 28 37 French 7 18 15 10 19 18 Korean 5 - - 7 - - Japanese 5 9 9 6 12 12 Italian 3 10 9 5 12 13 Dutch 2 10 6 5 12 8 AVERAGE 20 60 61 29 84 84
*April 2012 edition
Table 7b Minimum h5-index and h5-median values in the language rankings
Google Scholar Metrics: 2007-2011, 2008-2012 and 2009-2013 editions
LANGUAGE H5-INDEX H5-MEDIAN 2007-2011* 2008-2012 2009-2013 2007-2011 2008-2012 2009-2013
English 88 105 107 112 140 142 Chinese 19 21 23 26 26 27 Portuguese 9 10 11 11 11 13 Spanish 8 10 10 10 12 12 German 6 7 7 8 8 13 French 6 6 7 6 7 8 Korean 4 - 5 - Japanese 4 4 4 4 4 5 Italian 2 3 3 2 4 3 Dutch 1 1 1 1 1 1 AVERAGE 15 19 19 19 24 25
*April 2012 edition It is also important to note the stability of these rankings. This can be considered from different points of view. On the one hand, there is the stability of the bibliometric indicators themselves. The differences between the first edition (2007-2011) and the two subsequent are due to the different publication dates (Tables 7a-b). The first edition was released in April 2012, while the second one was released in July 2013, and the current one in June 2014. Moreover, the reason why the results in the current edition (2009-2013) are so similar to those of the previous edition is probably related to the fact that it has been released one month ahead of last year’s publication date (after eleven months, instead of twelve); however, a higher increase was expected, given the rapid growth Google Scholar shows [9,11]. In Table 8 we can see what the annual growth rates of the indicators have been for each of the broad subject areas, languages, and publication types. In the case of the language rankings, there are two different circumstances: h index

Google Scholar Metrics 2014: a low cost bibliometric tool
11
values for English, Portuguese, Chinese and German publications (especially the last two) are increasing, while those of Spanish, French, Italian and Dutch are decreasing. The French and especially the Dutch cases draw our attention. Conversely, when we focus on the results by broad subject areas, we detect a more uniform behaviour: growth rates are mainly positive yet modest, except in the case of Physics & Mathematics. A similar situation can be found in the three publication types, although the higher growth in the group of conferences should be noted.
Table 8 Variation in the maximum h5-index values by subject areas, languages and publication
types. Google Scholar Metrics: 2008-2012 and 2009-2013 editions
SUBJECT AREAS VARIATION %
H5-INDEX H5-MEDIAN Life Sciences & Earth Sciences ▲1.72 ▼-1.79 Health & Medical Sciences ▲5.79 ▼-1.59 Chemical & Material Sciences ▲6.04 ▲16.49 Physics & Mathematics ▼-3.05 ▲0.38 Engineering & Computer Science ▲6.75 ▲5.86 Business, Economics & Management ▲4.35 ▲8.56 Social Sciences ▲2.22 ▲1.47 Humanities, Literature & Arts ▬0.00 ▲10.77
LANGUAGES VARIATION %
H5-INDEX H5-MEDIAN English ▲1.72 ▼-1.79 Chinese ▲9.26 ▲4.71 Portuguese ▲2.63 ▲4.00 Spanish ▼-3.57 ▲13.16 German ▲22.73 ▲18.75 French ▼-16.67 ▼-16.67 Japanese ▬ 0.00 ▲7.69 Italian ▼-10.00 ▲13.33 Dutch ▼-40.00 ▲8.33
PUBLICATION
TYPES VARIATION %
H5-INDEX H5-MEDIAN Journals ▲1.72 ▼-1.79 Conferences ▲11.32 ▼-4.02 Repositories ▲4.35 ▲8.56
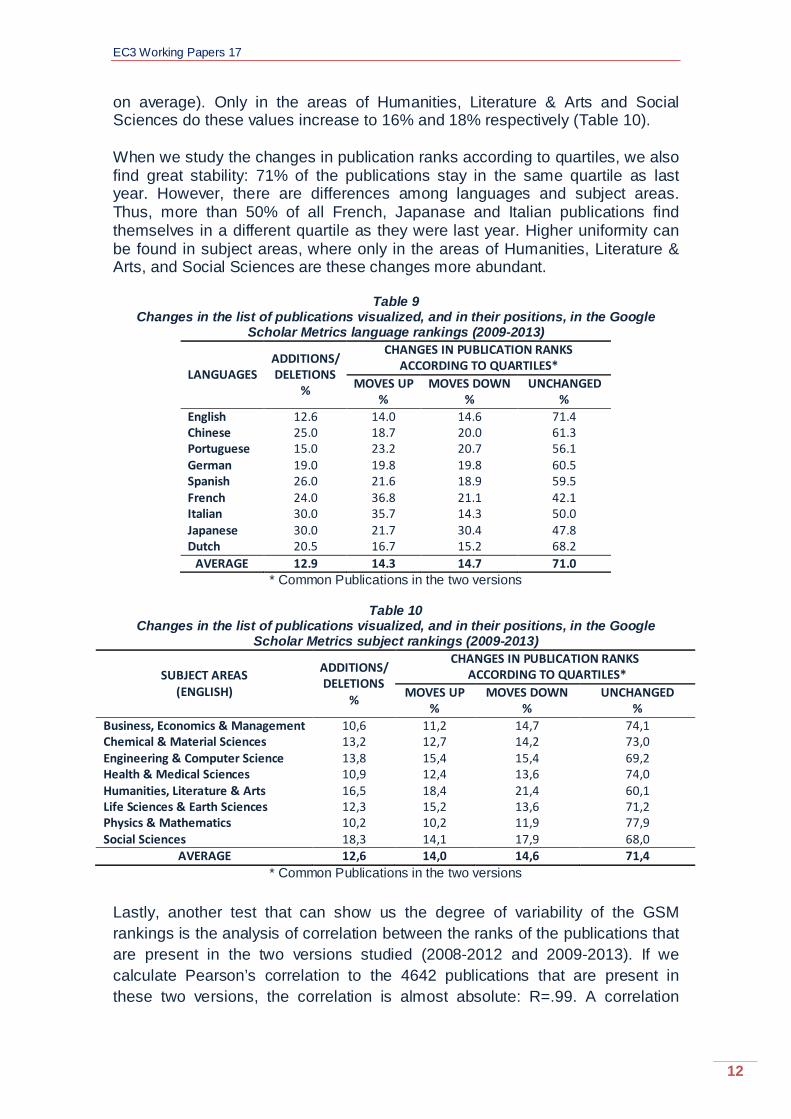
On the other hand, the stability of GSM must be analysed from the perspective of the publications that enter or slide off the list, as well as from the perspective of the changes in the positions these publications hold in the rankings (Tables 9 and 10) when we compare the current version to the previous one (2008-2012). Global rate of incoming/outgoing titles can be considered as very low (12.9%), although there are differences among languages. It is very low for English written publications (12.6%), and much higher for Chinese, Spanish, Italian and Japanese publications, where it goes above 25% (Table 9). If we apply this analysis to the publications grouped by subject areas –only for English written publications- the number of incoming/outgoing titles remains quite low (12.6%
EC3 Working Papers 17
12
on average). Only in the areas of Humanities, Literature & Arts and Social Sciences do these values increase to 16% and 18% respectively (Table 10). When we study the changes in publication ranks according to quartiles, we also find great stability: 71% of the publications stay in the same quartile as last year. However, there are differences among languages and subject areas. Thus, more than 50% of all French, Japanase and Italian publications find themselves in a different quartile as they were last year. Higher uniformity can be found in subject areas, where only in the areas of Humanities, Literature & Arts, and Social Sciences are these changes more abundant.
Table 9 Changes in the list of publications visualized, and in their positions, in the Google
Scholar Metrics language rankings (2009-2013)
LANGUAGES ADDITIONS/ DELETIONS
%
CHANGES IN PUBLICATION RANKS ACCORDING TO QUARTILES*
MOVES UP %
MOVES DOWN %
UNCHANGED %
English 12.6 14.0 14.6 71.4 Chinese 25.0 18.7 20.0 61.3 Portuguese 15.0 23.2 20.7 56.1 German 19.0 19.8 19.8 60.5 Spanish 26.0 21.6 18.9 59.5 French 24.0 36.8 21.1 42.1 Italian 30.0 35.7 14.3 50.0 Japanese 30.0 21.7 30.4 47.8 Dutch 20.5 16.7 15.2 68.2
AVERAGE 12.9 14.3 14.7 71.0 * Common Publications in the two versions
Table 10
Changes in the list of publications visualized, and in their positions, in the Google Scholar Metrics subject rankings (2009-2013)
SUBJECT AREAS (ENGLISH)
ADDITIONS/ DELETIONS
%
CHANGES IN PUBLICATION RANKS ACCORDING TO QUARTILES*
MOVES UP %
MOVES DOWN %
UNCHANGED %
Business, Economics & Management 10,6 11,2 14,7 74,1 Chemical & Material Sciences 13,2 12,7 14,2 73,0 Engineering & Computer Science 13,8 15,4 15,4 69,2 Health & Medical Sciences 10,9 12,4 13,6 74,0 Humanities, Literature & Arts 16,5 18,4 21,4 60,1 Life Sciences & Earth Sciences 12,3 15,2 13,6 71,2 Physics & Mathematics 10,2 10,2 11,9 77,9 Social Sciences 18,3 14,1 17,9 68,0
AVERAGE 12,6 14,0 14,6 71,4 * Common Publications in the two versions
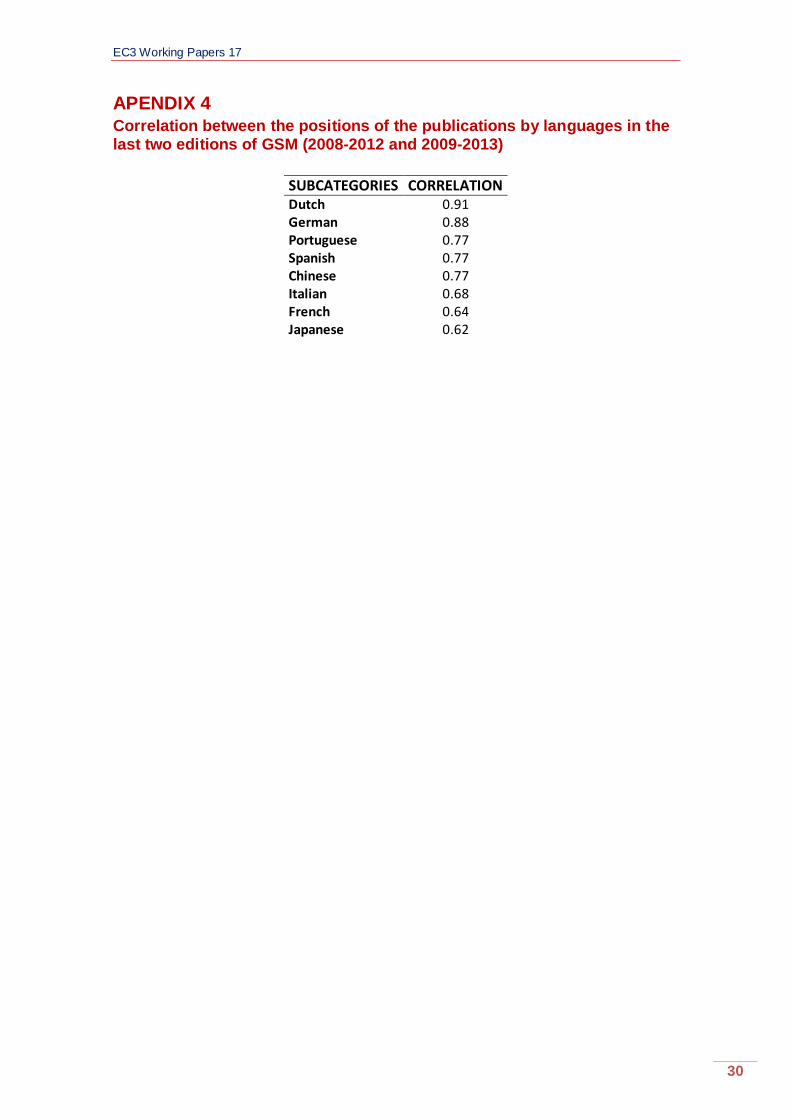
Lastly, another test that can show us the degree of variability of the GSM rankings is the analysis of correlation between the ranks of the publications that are present in the two versions studied (2008-2012 and 2009-2013). If we calculate Pearson’s correlation to the 4642 publications that are present in these two versions, the correlation is almost absolute: R=.99. A correlation

Google Scholar Metrics 2014: a low cost bibliometric tool
13
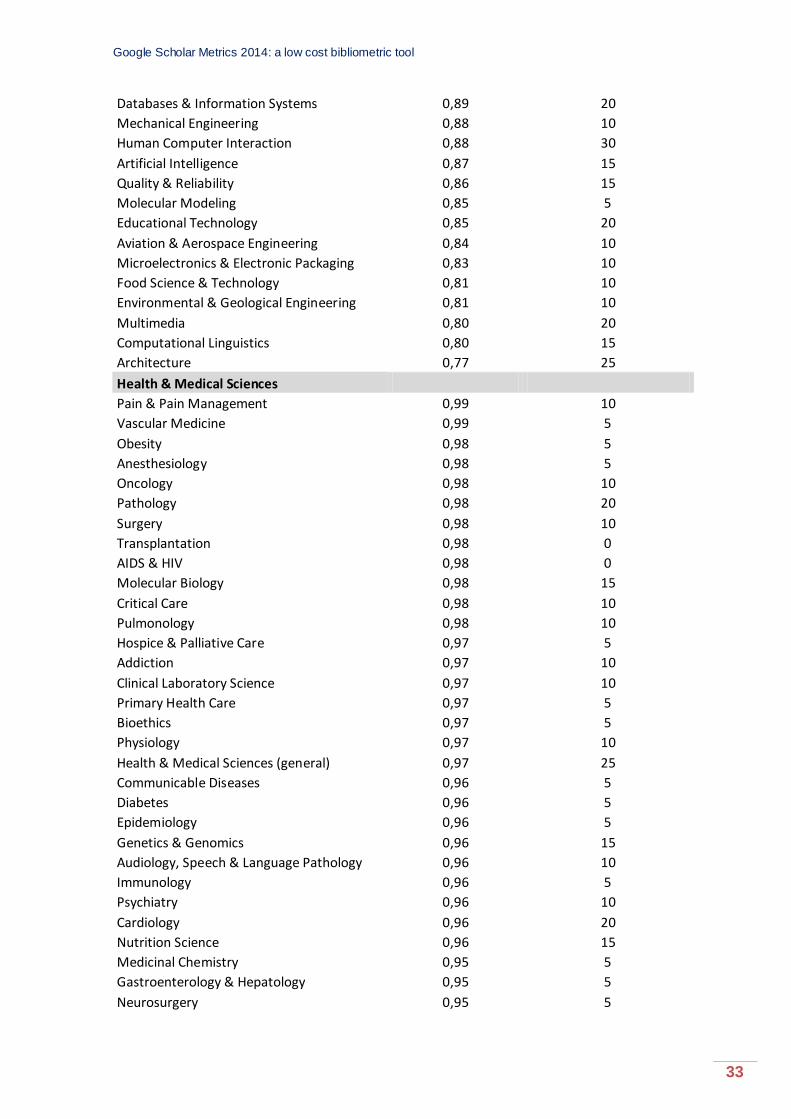
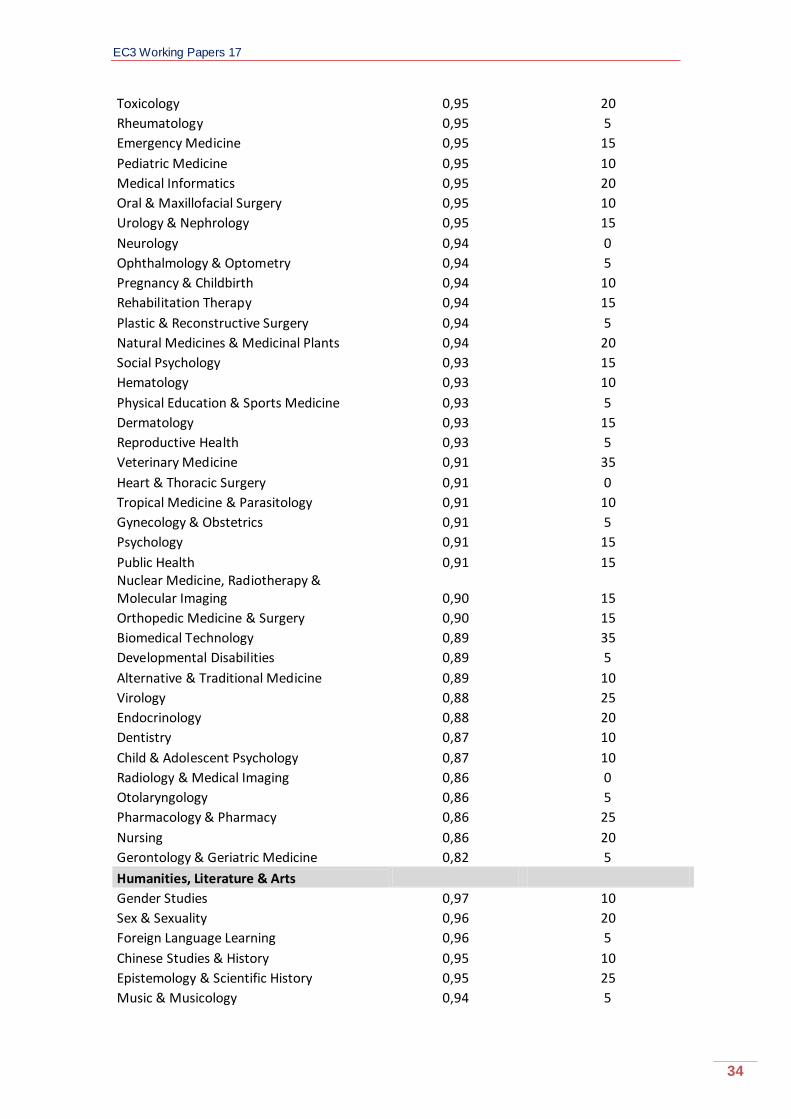
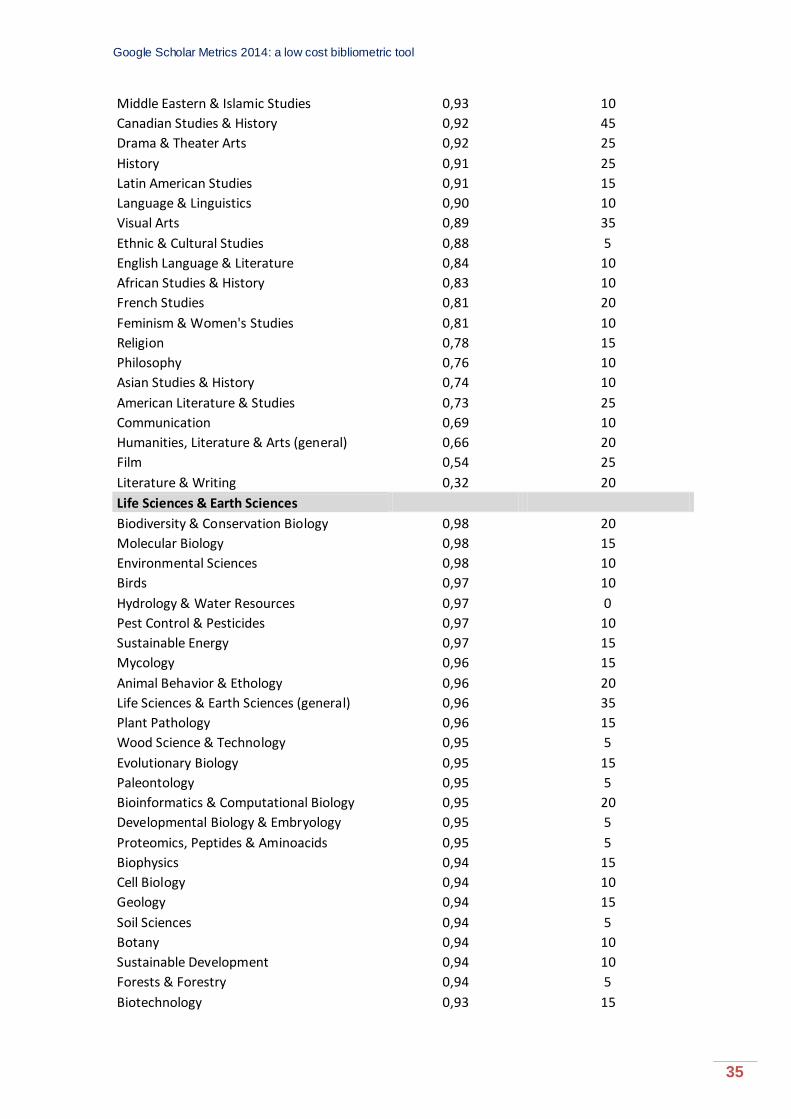
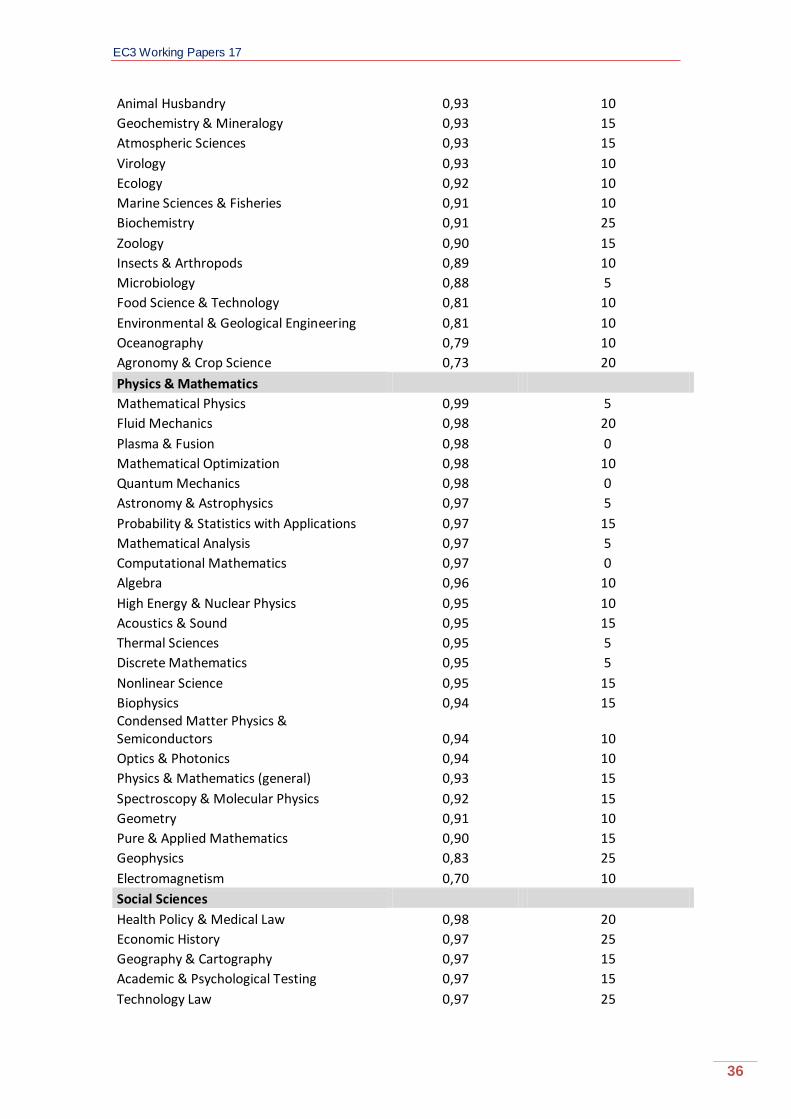
analysis by languages and subcategories confirms the above. There is high correlation in almost the totality of cases. The lowest results can be found in the rankings of French, Japanese and Italian publications, and in the subcategories present in Humanities, Literature & Arts, and Social Sciences. Appendix 4 and 5 show the correlation results for each of the languages and subcategories present in GSM. 3. CONCLUSIONS We have established that Google has opted for giving stability to its product instead of adding any more features or improvements, or even correcting some of its greatest shortfalls, which have been outlined in previous works (duplicate titles, errors in the links between documents and the source where they have been published, search deficiencies…). We should welcome the continuity of this initiative, which brings some fresh air to the scientific information market, and creates opportunities for the study of other kinds of impacts created by scientific output. The stability of the indicators is a serious matter, since it reinforces the credibility of the data managed by Google Scholar in the construction of the GSM publication rankings. Despite all technical and methodological errors Google Scholar Metrics presents as a source for scientific evaluation, and despite the fact that we don’t entirely know how everything works behind scenes, we can say that, from a stability point of view, these rankings can be considered as trustworthy and reliable. This does not, however, prevent us from considering that there is clearly a lot of room for improvement for GSM as an information service. In analogy to the world of airlines, we cannot but consider GSM as a “low cost” bibliometric tool. To be completely fair, we should say “no cost”, since users don’t have to pay anything to access it (beyond the cost of the Internet connection), as opposed to what happens with real low cost airlines. From this point of view, it could be argued we shouldn’t demand more of Google. Offering a tool that has required a great deal of effort for solving numerous technical problems (storing and processing great quantities of data, identifying different versions of the same document and merging them, calculating indicators, enabling fast and agile search and visualization features…) free of charge is definitely to be appreciated. However, we cannot overlook these technical and methodological shortcomings if we are to compare this product to other canonical bibliometric journal rankings. Since it is based on the most comprehensive and less skewed scientific database in existance at the moment (Google Scholar), GSM is a valuable tool for learning the impact of thousands of publications that are not covered in any other bibliometric indexes. However, we cannot lose sight of its Achilles’s heel, something we have been reporting insistently: it is vulnerable to tampering, and it is not transparent enough that the scientific community will be able to detect this kind of manipulation [10]. Publishers, in the pursuit of boosting their journals’s impact, may not only manipulate editorial policies (which already

EC3 Working Papers 17
14
happens more frequently than is generally thought), but they could also begin to directly control the impact of their journals by suggesting that authors cite studies published in the same journal. They may also, whether by themselves or in coordination with other parties, upload documents to the Web with citations to studies in their journal. For this reason, it is of the utmost importance that there should be two versions of the h index, one including self-citations, and one that does not take them into account. It is also necessary to find a way to clearly display the sources that provide citations. ACKNOWLEDGMENTS This study has been funded through the project HAR2011-30383-C02-02 granted by the Dirección General de Investigación y Gestión del Plan Nacional de I+D+I, Ministerio de Economía y Competitividad, Spanish Government. REFERENCES
1. Delgado López-Cózar, E; Cabezas-Clavijo, Á (2012). Google Scholar Metrics updated: Now it begins to get serious. EC3 Working Papers 8: 16 de noviembr de 2012. Available:http://digibug.ugr.es/bitstream/10481/22439/6/Google%20Scholar%20Metrics%20updated.pdf
2. Delgado-López-Cózar, E., y Cabezas-Clavijo, Á. (2012). Google Scholar Metrics: an unreliable tool for assessing scientific journals.El Profesional de la Información, 21(4), 419–427. Available:http://dx.doi.org/10.3145/epi.2012.jul.15
3. Cabezas-Clavijo, Á., y Delgado-López-Cózar, E. (2012). Scholar Metrics: el impacto de las revistas según Google, ¿un divertimento o un producto científico aceptable? EC3 Working Papers, (1). Available: http://eprints.rclis.org/16830/1/Google%20Scholar%20Metrics.pdf
4. Cabezas-Clavijo, Álvaro; Delgado López-Cózar, Emilio (2013). Google Scholar Metrics 2013: nothing new under the sun. EC3 Working Papers, 12: 25 de julio de 2013. Available: http://arxiv.org/ftp/arxiv/papers/1307/1307.6941.pdf
5. Delgado López-Cózar, E.; Cabezas Clavijo, A. (2013). Ranking journals: could Google Scholar Metrics be an alternative to Journal Citation Reports and Scimago Journal Rank? Learned Publishing, 26 (2): 101-113. Available:http://arxiv.org/ftp/arxiv/papers/1303/1303.5870.pdf
6. Delgado López-Cózar, E.; Ayllón, JM, Ruiz-Pérez, R. (2013). Índice H de las revistas científicas españolas según Google Scholar Metrics (2007-2011). 2ª edición. EC3 Informes, 3: 9 de abril de 2013. Available: http://digibug.ugr.es/handle/10481/24141
7. Ayllón Millán, J.M.; Ruiz-Pérez, R.; Delgado López-Cózar, E. Índice H de las revistas científicas españolas según Google Scholar Metrics (2008-2012). EC3 Reports, 7 (2013). Available: http://hdl.handle.net/10481/29348
8. Delgado López-Cózar, E.; Robinson-Garcia, N. Repositories in Google Scholar Metrics or what is this document type doing in a place as such?. Cybermetrics, 2012, 16(1), paper 4. Available:http://libro.ugr.es/bitstream/10481/22019/1/repositorios_cybermetrics.pdf
9. Orduña-Malea, E.; Delgado López-Cózar, E. (2014). Google Scholar Metrics evolution: an analysis according to languages. Scientometrics, 98 (3): 2353-2367. Available: http://arxiv.org/abs/1310.6162
10. Delgado López‐Cózar, E., Robinson‐García, N., Torres‐Salinas, D. (2014). The Google Scholar Experiment: how to index false papers and manipulate bibliometric indicators. Journal of the Association for Information Science and Technology, 65(3), 446-454. Available: http://arxiv.org/ftp/arxiv/papers/1309/1309.2413.pdf
11. Winter, J.C., Zadpoor, A. A., Dodou, D. (2014). The expansion of Google Scholar versus Web of Science: a longitudinal study. Scientometrics, 98(2), 1547-1565.

Google Scholar Metrics 2014: a low cost bibliometric tool
15
APPENDIX 1 Ranking of visualized conferences in Google Scholar Metrics (2009-2013)
CONFERENCES H5-INDEX H5-MEDIAN IEEE Conference on Computer Vision and Pattern Recognition, CVPR 118 167 International World Wide Web Conferences (WWW) 83 131 IEEE International Conference on Computer Vision, ICCV 79 138 Annual Joint Conference of the IEEE Computer and Communications Societies (INFOCOM) 76 110
ACM SIGKDD International Conference on Knowledge discovery and data mining 69 113 International Conference on Machine Learning (ICML) 69 103 ACM SIGCOMM Conference 67 131 EGU General Assembly Conference Abstracts 66 100 ACM Symposium on Information, Computer and Communications Security 65 110 International Conference on Very Large Databases 64 92 Meeting of the Association for Computational Linguistics (ACL) 62 84 ACM SIGMOD Conference 61 90 IEEE International Conference on Robotics and Automation 61 87 European Conference on Computer Vision 59 96 IEEE International Solid-State Circuits Conference 59 79 International Conference on Software Engineering 57 94 Society of Photo-Optical Instrumentation Engineers (SPIE) Conference Series 56 70 Symposium on Networked Systems: Design and Implementation (NSDI) 54 84 ACM International Conference on Web Search and Data Mining 54 82 International Symposium on Computer Architecture (ISCA) 53 98 IEEE Symposium on Security and Privacy 53 85 Conference on Empirical Methods in Natural Language Processing (EMNLP) 53 78 IEEE Power and Energy Society General Meeting 53 77 International Conference on Data Engineering Workshops 52 68 International Conference on Architectural Support for Programming Languages and Operating Systems (ASPLOS) 51 87
ACM Symposium on Theory of Computing 51 77 USENIX Security Symposium 51 76 ECS Meeting Abstracts 51 75 OFC/NFOEC Conference on Optical Fiber communication/National Fiber Optic Engineers Conference 50 67
IEEE International Symposium on Information Theory 49 80 ACM SIGIR Conference on Research and development in information retrieval 49 71 IEEE/IAS Industrial and Commercial Power Systems Technical Conference 49 67 International Conference on Weblogs and Social Media 48 87 Annual International Conference on Theory and Applications of Cryptographic Techniques (EUROCRYPT) 48 79
ACM International Conference on Information and Knowledge Management 48 62 Internet Measurement Conference 47 78 IEEE International Conference on Acoustics, Speech and Signal Processing (ICASSP) 47 65
IEEE Transactions on Circuits and Systems I: Regular Papers 47 64 Society for Economic Dynamics Meeting Papers 46 80 Annual International Conference on Mobile computing and networking 46 72 SIGPLAN Conference on Programming Language Design and Implementation (PLDI) 46 71
IEEE International Symposium on Parallel & Distributed Processing 46 67 International Joint Conference on Artificial Intelligence (IJCAI) 46 63 Conference on Advances in cryptology 45 77 IEEE GLOBECOM Workshops 45 63 IEEE/RSJ International Conference on Intelligent Robots and Systems 45 62
EC3 Working Papers 17
16
ACM SIGPLAN-SIGACT Symposium on Principles of Programming Languages (POPL) 45 61
IEEE International Electron Devices Meeting, IEDM 45 60 IEEE Symposium on Foundations of Computer Science (FOCS) 45 58 IEEE International Conference on Communications 44 62 ACM International Conference on Multimedia 44 60 IEEE Conference on Decision and Control 43 63 ACM SIAM Symposium on Discrete Algorithms 43 59 ACM European Conference on Computer Systems 42 81 IEEE International Conference on Cloud Computing (CLOUD) 42 62 IEEE International Symposium on High Performance Computer Architecture 42 62 IEEE Vehicular Technology Conference, VTC 42 59 Design, Automation and Test in Europe Conference and Exhibition (DATE) 41 57 IEEE/ACM International Symposium on Microarchitecture 40 62 ACM Symposium on User Interface Software and Technology 40 62 Design Automation Conference (DAC) 40 54 IEEE Energy Conversion Congress and Exposition (ECCE) 40 53 Network and Distributed System Security Symposium (NDSS) 39 79 National Fiber Optic Engineers Conference 39 65 International Conference on Spoken Language Processing (INTERSPEECH) 39 52 American Control Conference 39 48 IEEE Applied Power Electronics Conference and Exposition 38 61 International Conference on Computer Aided Verification (CAV) 38 53 European Semantic Web Symposium / Conference 38 48 Quantum Electronics and Laser Science Conference 37 70 Conference on File and Storage Technologies (FAST) 37 62 Conference on Computer Supported Cooperative Work (CSCW) 37 60 IEEE International Conference on Cloud Computing Technology and Science (CloudCom) 37 58
British Machine Vision Conference (BMVC) 37 56 AAAI Conference on Artificial Intelligence 37 50 Conference on Lasers and Electro-Optics 36 63 ACM Conference on Recommender Systems 36 62 International Conference on Distributed Computing Systems, ICDCS 36 49 IEEE International Conference on Data Mining (ICDM) 36 47 International Conference on Extending Database Technology (EDBT) 36 47 ACM SIGPLAN Symposium on Principles & Practice of Parallel Programming (PPOPP) 35 69
USENIX Annual Technical Conference 35 54 SIAM International Conference on Data Mining 35 49 IEEE International Conference on Image Processing (ICIP) 35 47 International Conference on The Theory and Application of Cryptology and Information Security (ASIACRYPT) 34 58
IEEE International Symposium on Cluster Computing and the Grid 34 50 Conference on Object-Oriented Programming Systems, Languages, and Applications (OOPSLA) 34 50
IEEE International Conference on Computer Vision Workshops (ICCV Workshops) 33 59
Allerton Conference on Communication, Control, and Computing 33 49 Workshop on Cryptographic Hardware and Embedded Systems (CHES) 33 45 International Quantum Electronics Conference 32 57 ACM Conference on Electronic Commerce 32 47 IEEE Congress on Evolutionary Computation 32 39 International Conference on Computational Linguistics (COLING) 31 48 International Symposium on Software Testing and Analysis 31 47 International Conference on Tools and Algorithms for the Construction and Analysis of Systems (TACAS) 31 44
Google Scholar Metrics 2014: a low cost bibliometric tool
17
International Symposium/Conference on Music Information Retrieval 31 43 International Conference on Document Analysis and Recognition 31 41 Conference on Genetic and Evolutionary Computation 31 39 International Conference on Practice and Theory in Public Key Cryptography 30 53 IEEE Real-Time Systems Symposium (RTSS) 30 53 Conference of the European Chapter of the Association for Computational Linguistics (EACL) 30 45
IEEE/ACM International Conference on Automated Software Engineering (ASE) 30 44 IEEE International Conference on Software Testing, Verification and Validation Workshops (ICSTW) 30 38
Computer Security Applications Conference 29 50 Symposium On Usable Privacy and Security 29 47 ACM/IEEE International Conference on Human Robot Interaction 29 45 ACM Symposium on Parallelism in Algorithms and Architectures (SPAA) 29 44 IEEE/ACM International Conference on Computer-Aided Design (ICCAD) 29 39 Symposium on Theoretical Aspects of Computer Science (STACS) 29 38 IFAC World Congress 29 35 International Conference on Pattern Recognition 29 35 European Conference on Research in Computer Security 28 49 European Conference on Object-oriented Programming (ECOOP) 28 45 International Conference on Functional Programming (ICFP) 28 42 International Conference on Financial Cryptography and Data Security 28 40 Asia and South Pacific Design Automation Conference (ASP-DAC) 28 36 IEEE Information Theory Workshop 28 36 IEEE Computer Security Foundations Symposium 27 40 European Conference on Machine learning and knowledge discovery in databases 27 40
ACM International Conference on Interactive Tabletops and Surfaces (ITS) 27 39 IEEE Conference of Industrial Electronics 27 39 International Conference on Biometrics 27 34 IEEE International Symposium on Circuits and Systems 27 33 IEEE/MTT-S International Microwave Symposium 27 32 Symposium on Interactive 3D Graphics (SI3D) 26 38 International Conference on Intelligent User Interfaces (IUI) 26 38 Conference on Information Sciences and Systems 26 38 Symposium on Field Programmable Gate Arrays (FPGA) 26 37 IEEE Vehicle Power and Propulsion Conference 26 37 ACM SIGGRAPH/Eurographics Symposium on Computer Animation 26 36 IEEE Symposium on Logic in Computer Science 26 36 Electronic Components and Technology Conference, ECTC 26 35 IEEE PES Power Systems Conference and Exposition 25 38 Asian Conference on Computer Vision 25 36 European Conference on Algorithms 25 35 Symposium on Computational Geometry 25 35 IEEE Conference on Computational Intelligence and Games 25 34 European Quantum Electronics Conference 24 50 IEEE International Reliability Physics Symposium (IRPS) 24 41 Information Theory and Applications Workshop 24 39 Workshop of Cross-Language Evaluation Forum 24 39 ACM/IEEE International Symposium on Low Power Electronics and Design 24 38 International Conference on Affective Computing and Intelligent Interaction and Workshops 24 36
ACM/IEEE International Symposium on Networks-on-Chip 24 35 IEEE Intelligent Vehicles Symposium 24 33 International Conference on Tangible, embedded, and embodied interaction 24 31 European Conference on Power Electronics and Applications 24 31 IFIP Conference on Human-Computer Interaction (INTERACT) 24 28
EC3 Working Papers 17
18
IEEE Custom Integrated Circuits Conference, CICC 23 33 IEEE Radio Frequency Integrated Circuits Symposium 23 33 IEEE International Conference on Advanced Video and Signal-Based Surveillance (AVSS) 23 33
IEEE-RAS International Conference on Humanoid Robots (Humanoids) 23 33 Pacific Symposium on Biocomputing 23 30 IEEE International Conference on Multimedia and Expo 23 28 Pacific-Asia Conference on Advances in Knowledge Discovery and Data Mining 22 34 International Conference on Research in Computational Molecular Biology 22 32 ACM Multimedia Systems Conference (MMSys) 22 31 International ACM/IEEE Joint Conference on Digital Libraries 21 33 IEEE Radar Conference 21 31 IEEE International Conference on RFID 21 27 IEEE International Conference on Fuzzy Systems (FUZZ) 21 26 International Workshop on Semantic Evaluation 20 49 Eurographics - Short Papers 20 38 IEEE Symposium on VLSI Circuits 20 29 Picture Coding Symposium (PCS) 20 29 Annual Meeting of the Special Interest Group on Discourse and Dialogue (SIGDIAL) 20 28
IEEE International Geoscience and Remote Sensing Symposium 20 28 Workshop on Statistical Machine Translation 20 27 IEEE Pacific Visualization Symposium 20 27 IEEE Workshop on Automatic Speech Recognition & Understanding 20 27 European Conference on Antennas and Propagation 20 26 IEEE Conference on Emerging Technologies & Factory Automation (ETFA) 20 24 Conference on Image and Video Retrieval 19 33 International Workshop on Quality of Multimedia Experience 19 31 IUFRO Workshop on Connection Between Forest Resources and Wood Quality: Modeling Approaches and Simulation Software 19 29
European Conference on Evolutionary Computation, Machine Learning and Data Mining in Bioinformatics 19 26
IEEE Aerospace Conference 19 25 AMIA Symposium 19 25 International Electron Devices Meeting 19 24 International Conference on Indoor Positioning and Indoor Navigation (IPIN) 19 24 IEEE Workshop on Signal Processing Advances in Wireless Communications 18 27 International Symposium on Software Reliability Engineering 18 25 IEEE Workshop on Applications of Signal Processing to Audio and Acoustics 18 23 International Workshop on Internet and Network Economics 17 30 IEEE International Conference on Industrial Informatics 17 24 International Offshore and Polar Engineering Conference 17 23 World Congress on Nature & Biologically Inspired Computing, NaBIC 17 22 International Conference on Machine Learning and Cybernetics 17 22 International Conference on Ocean, Offshore and Arctic Engineering 17 20 IEEE/AIAA Digital Avionics Systems Conference (DASC) 16 26 Annual Conference on Computer Graphics (SIGGRAPH) 16 26 ACM/IEEE International Conference on Distributed Smart Cameras 16 23 International Conference on Computational Linguistics and Intelligent Text Processing 16 22
International Conference on Parallel problem solving from nature 16 21 Linguistic Annotation Workshop 16 20 IEEE Symposium on Computational Intelligence and Data Mining 15 30 Data Compression Conference, DCC 15 26 IEEE International Test Conference 15 22 International Joint Conference on Natural Language Processing 15 21 ENTER eTourism Conference 15 20

Google Scholar Metrics 2014: a low cost bibliometric tool
19
Workshop on Positioning, Navigation and Communication 15 20 IEEE International Conference on Semantic Computing 15 18 European Conference on Genetic Programming 15 18 IEEE Spoken Language Technology Workshop (SLT) 15 17 International Conference on Natural Computation 15 17 Web3D / VRML Symposium 14 20 IEEE/ION Position, Location and Navigation Symposium 14 19 European Conference on Synthetic Aperture Radar 14 19 International Conference on Fuzzy Systems and Knowledge Discovery 14 18 ACM Symposium on Virtual Reality Software and Technology 14 17 ACM International Health Informatics Symposium 14 17 International Conference on Computer Safety, Reliability, and Security 14 17 IEEE International Conference on Ultra-Wideband 14 17 IEEE International Conference on Plasma Science (ICOPS) 13 31 International ITG Workshop on Smart Antennas (WSA) 13 21 European Radar Conference 13 16 IEEE Electric Ship Technologies Symposium 12 20 International Symposium on Turbo Codes and Iterative Information Processing 12 17 GI-Jahrestagung 11 14 Multikonferenz Wirtschaftsinformatik (MKWI) 10 15 International Radar Symposium 10 12 International Conference on Quantum Information 9 21 Biennial Symposium on Communications (QBSC) 9 17 International Conference on Computer Graphics, Imaging and Visualization, CGIV 9 14
IEEE International Symposium on Phased Array Systems and Technology 9 12 IEEE/NPSS Symposium on Fusion Engineering SOFE 9 11 Australian Communications Theory Workshop (AusCTW) 8 10 Canadian Workshop on Information Theory 8 10 International Symposium on Information Theory and Its Applications 8 10 Asian-Pacific Conference on Synthetic Aperture Radar 8 9 International Conference on Ground Penetrating Radar 7 11 ESA Workshop on Satellite Navigation Technologies and European Workshop on GNSS Signals and Signal Processing (NAVITEC) 7 9
Conférence en Recherche d'Infomations et Applications (CORIA) 7 9 IEEE CIE International Conference on Radar 6 7

EC3 Working Papers 17
20
APPENDIX 2 Ranking of repositories visualized in Google Scholar Metrics (2009-2013)
REPOSITORIES H5-INDEX H5-MEDIAN NBER Working Papers 168 241 arXiv Cosmology and Extragalactic Astrophysics (astro-ph.CO) 162 222 arXiv High Energy Physics - Phenomenology (hep-ph) 145 194 arXiv Mesoscale and Nanoscale Physics (cond-mat.mes-hall) 138 198 arXiv Materials Science (cond-mat.mtrl-sci) 136 227 arXiv Quantum Physics (quant-ph) 128 204 arXiv High Energy Physics - Theory (hep-th) 124 174 arXiv High Energy Physics - Experiment (hep-ex) 118 178 arXiv Superconductivity (cond-mat.supr-con) 109 162 arXiv High Energy Astrophysical Phenomena (astro-ph.HE) 107 140 CEPR Discussion Papers 105 148 arXiv Galaxy Astrophysics (astro-ph.GA) 101 138 arXiv Solar and Stellar Astrophysics (astro-ph.SR) 101 127 arXiv Earth and Planetary Astrophysics (astro-ph.EP) 95 128 arXiv Information Theory (cs.IT) 92 137 arXiv Quantum Gases (cond-mat.quant-gas) 91 139 arXiv Strongly Correlated Electrons (cond-mat.str-el) 90 129 arXiv Optics (physics.optics) 90 125 IZA Discussion Papers 81 118 arXiv Nuclear Theory (nucl-th) 78 101 arXiv Physics and Society (physics.soc-ph) 76 109 arXiv General Relativity and Quantum Cosmology (gr-qc) 76 98 arXiv Instrumentation and Methods for Astrophysics (astro-ph.IM) 71 115 arXiv High Energy Physics - Lattice (hep-lat) 69 94 arXiv Statistical Mechanics (cond-mat.stat-mech) 69 94 arXiv Nuclear Experiment (nucl-ex) 68 100 Policy Research Working Paper Series 62 87 MPRA Paper 62 82 arXiv Statistics Theory (math.ST) 61 102 arXiv Optimization and Control (math.OC) 61 99 arXiv Soft Condensed Matter (cond-mat.soft) 59 81 arXiv Atomic Physics (physics.atom-ph) 58 90 European Central Bank Working Paper Series 57 98 CESifo Working Paper Series 57 87 arXiv Other Condensed Matter (cond-mat.other) 52 77 arXiv Learning (cs.LG) 50 78 arXiv Probability (math.PR) 50 61 arXiv Instrumentation and Detectors (physics.ins-det) 49 84 CEP Discussion Papers 48 85 arXiv Mathematical Physics (math-ph) 47 65 Bank for International Settlements Working Papers 46 97 arXiv Networking and Internet Architecture (cs.NI) 46 72 arXiv Analysis of PDEs (math.AP) 45 54 arXiv Disordered Systems and Neural Networks (cond-mat.dis-nn) 44 66 arXiv Data Structures and Algorithms (cs.DS) 44 56 arXiv Methodology (stat.ME) 43 65 arXiv Fluid Dynamics (physics.flu-dyn) 43 54 arXiv Databases (cs.DB) 42 57 Bank of Italy Working Papers 41 63 arXiv Machine Learning (stat.ML) 40 68 eSocialSciences Working Papers 40 61 arXiv Plasma Physics (physics.plasm-ph) 40 57

Google Scholar Metrics 2014: a low cost bibliometric tool
21
arXiv Populations and Evolution (q-bio.PE) 40 56 arXiv Biological Physics (physics.bio-ph) 40 50 arXiv Distributed, Parallel, and Cluster Computing (cs.DC) 39 71 arXiv Numerical Analysis (math.NA) 39 49 World Bank Policy Research Working Paper Series 38 63 arXiv Computer Vision and Pattern Recognition (cs.CV) 38 50 arXiv Algebraic Geometry (math.AG) 38 48 Department of Economics and Business, Universitat Pompeu Fabra Economics Working Papers 37 72
arXiv Combinatorics (math.CO) 37 46 HAL Working Papers 36 69 arXiv Social and Information Networks (cs.SI) 36 60 arXiv Applications (stat.AP) 36 52 arXiv Digital Libraries (cs.DL) 35 65 arXiv Number Theory (math.NT) 34 48 Harvard Business School Working Papers 33 61 Harvard University, John F. Kennedy School of Government Working Paper Series 33 59
arXiv Functional Analysis (math.FA) 33 52 arXiv Chaotic Dynamics (nlin.CD) 33 46 arXiv Computer Science and Game Theory (cs.GT) 33 44 arXiv Differential Geometry (math.DG) 33 43 Federal Reserve Bank of San Francisco Working Paper Series 32 73 OECD Economics Department Working Papers 32 56 arXiv Quantitative Methods (q-bio.QM) 32 49 Deep Sea Research Part I: Oceanographic Research Papers 32 44 arXiv Computational Complexity (cs.CC) 32 39 arXiv Cryptography and Security (cs.CR) 31 50 CReAM Discussion Paper Series 31 50 arXiv Pattern Formation and Solitons (nlin.PS) 31 41 IFPRI discussion papers 30 50 arXiv Representation Theory (math.RT) 30 37 arXiv Exactly Solvable and Integrable Systems (nlin.SI) 29 45 arXiv Genomics (q-bio.GN) 29 44 arXiv Logic in Computer Science (cs.LO) 29 43 arXiv Molecular Networks (q-bio.MN) 29 41 arXiv Classical Analysis and ODEs (math.CA) 29 39 arXiv Dynamical Systems (math.DS) 29 35 Hong Kong Institute for Monetary Research Working Papers 28 42 Resources For the Future Discussion Papers 28 40 arXiv Computation and Language (cs.CL) 27 57 arXiv Biomolecules (q-bio.BM) 27 44 arXiv Programming Languages (cs.PL) 27 41 World Institute for Development Economic Research (UNU-WIDER) Working Paper Series 26 38
arXiv Discrete Mathematics (cs.DM) 26 30 arXiv Group Theory (math.GR) 25 31 arXiv Geometric Topology (math.GT) 24 34 arXiv Quantum Algebra (math.QA) 24 32 arXiv Operator Algebras (math.OA) 24 30 Human Development Research Papers 23 41 arXiv Complex Variables (math.CV) 23 32 arXiv Symplectic Geometry (math.SG) 23 28 arXiv Rings and Algebras (math.RA) 23 27 arXiv Commutative Algebra (math.AC) 22 26 arXiv Atomic and Molecular Clusters (physics.atm-clus) 21 33 arXiv Algebraic Topology (math.AT) 21 30

EC3 Working Papers 17
22
arXiv Metric Geometry (math.MG) 20 30 arXiv Computational Geometry (cs.CG) 20 28 CSAE Working Paper Series 19 28 ADBI Working Papers 18 31 arXiv Neural and Evolutionary Computing (cs.NE) 18 28 Asian Development Bank Economics Working Paper Series 17 27 Brooks World Poverty Institute Working Paper Series 16 35 Instituto de Pesquisa Econômica Aplicada-IPEA Discussion Papers 14 22 Asian Economic Papers 13 26 arXiv History and Philosophy of Physics (physics.hist-ph) 13 18 East Asian Bureau of Economic Research Trade Working Papers 12 25 Escola de Economia de São Paulo, Getulio Vargas Foundation (Brazil) Textos para discussão 12 20
arXiv Graphics (cs.GR) 9 17

Google Scholar Metrics 2014: a low cost bibliometric tool
23
APPENDIX 3 Maximum and minimum h5-index and h5-median values by subject area and subcategory, as they appear in the Google Scholar Metrics publication rankings (2009-2013)
AREAS AND SUBCATEGORIES MAXIMUM H5-INDEX
MINIMUM H5-INDEX
MAXIMUM H5-MEDIAN
MINIMUM H5-MEDIAN
Chemical & Material Sciences 193 102 339 133 Analytical Chemistry 102 45 132 57 Chemical & Material Sciences (general) 193 42 339 55 Materials Engineering 174 72 253 95 Nanotechnology 174 32 247 41 Organic Chemistry 171 37 247 49 Biochemistry 164 63 281 79 Electrochemistry 100 10 130 13 Dispersion Chemistry 92 18 112 24 Polymers & Plastics 87 31 161 40 Inorganic Chemistry 78 12 114 15 Medicinal Chemistry 78 25 97 30 Chemical Kinetics & Catalysis 74 20 97 28 Crystallography & Structural Chemistry 70 16 85 20 Molecular Modeling 68 13 97 20 Corrosion 67 3 89 4 Composite Materials 59 11 75 15 Combustion & Propulsion 58 11 97 15 Ceramic Engineering 46 7 58 9 Oil, Petroleum & Natural Gas 36 10 44 13 Engineering & Computer Science 174 93 253 130 Materials Engineering 174 72 253 95 Nanotechnology 174 32 247 41 Biotechnology 129 36 197 49 Biomedical Technology 118 30 143 40 Computer Vision & Pattern Recognition 118 25 182 34 Sustainable Energy 108 29 161 41 Bioinformatics & Computational Biology 104 19 205 24 Engineering & Computer Science (general) 98 49 162 66 Information Theory 93 8 152 10 Artificial Intelligence 89 36 122 46 Automation & Control Theory 86 26 124 35 Computer Networks & Wireless Communication 86 42 143 58 Signal Processing 84 31 127 41 Databases & Information Systems 83 32 131 47 Food Science & Technology 83 35 112 41 Water Supply & Treatment 82 16 105 19 Educational Technology 81 18 116 28 Operations Research 81 27 109 38 Human Computer Interaction 78 24 123 28 Power Engineering 78 22 104 31 Remote Sensing 75 12 98 15

EC3 Working Papers 17
24
Computer Hardware Design 70 23 94 33 Data Mining & Analysis 69 13 113 19 Computer Graphics 68 9 95 14 Molecular Modeling 68 13 97 20 Computer Security & Cryptography 65 27 110 40 Computational Linguistics 62 15 84 17 Robotics 61 23 88 29 Combustion & Propulsion 58 11 97 15 Evolutionary Computation 57 14 92 17 Fuzzy Systems 57 12 92 14 Software Systems 57 27 94 38 Library & Information Science 56 17 80 21 Microelectronics & Electronic Packaging 55 19 73 23 Computing Systems 54 34 98 49 Environmental & Geological Engineering 54 19 72 22 Structural Engineering 54 20 78 25 Metallurgy 53 13 66 15 Manufacturing & Machinery 51 17 72 23 Medical Informatics 51 14 78 17 Theoretical Computer Science 51 24 77 33 Civil Engineering 49 20 62 25 Mechanical Engineering 49 22 60 28 Game Theory and Decision Science 48 16 63 24 Plasma & Fusion 48 9 65 11 Transportation 48 24 64 30 Ceramic Engineering 46 7 58 9 Multimedia 46 16 62 22 Quality & Reliability 44 12 60 14 Wood Science & Technology 40 6 52 8 Mining & Mineral Resources 36 8 47 10 Oil, Petroleum & Natural Gas 36 10 44 13 Textile Engineering 36 4 48 6 Radar, Positioning & Navigation 35 6 52 7 Aviation & Aerospace Engineering 33 12 46 19 Ocean & Marine Engineering 30 11 38 15 Technology Law 20 7 31 8 Architecture 17 3 25 4 Health & Medical Sciences 329 129 495 176 Health & Medical Sciences (general) 329 70 495 102 Molecular Biology 223 60 343 78 Oncology 205 66 306 92 Genetics & Genomics 188 46 270 59 Cardiology 178 50 274 62 Hematology 156 34 200 43 Neurology 135 65 220 84 Gastroenterology & Hepatology 132 47 181 62 Immunology 129 48 226 67 Biomedical Technology 118 30 143 40 Pediatric Medicine 117 37 162 44 Pulmonology 114 31 150 41 Communicable Diseases 113 49 148 62 Diabetes 113 25 163 32

Google Scholar Metrics 2014: a low cost bibliometric tool
25
Pharmacology & Pharmacy 110 55 186 68 Rheumatology 107 26 148 32 Endocrinology 106 46 139 60 Nutrition Science 103 34 136 46 Psychiatry 103 50 143 67 Vascular Medicine 103 33 136 44 Virology 98 32 125 39 Gynecology & Obstetrics 97 33 175 40 Urology & Nephrology 96 36 144 46 Critical Care 95 13 140 17 Psychology 92 52 142 67 Radiology & Medical Imaging 92 39 122 53 Surgery 90 36 124 48 Toxicology 89 39 118 48 Physiology 83 34 179 46 AIDS & HIV 82 15 122 19 Anesthesiology 82 22 115 28 Nuclear Medicine, Radiotherapy & Molecular Imaging 80 26 107 32 Medicinal Chemistry 78 25 97 30 Ophthalmology & Optometry 78 34 110 39 Orthopedic Medicine & Surgery 75 38 100 49 Physical Education & Sports Medicine 75 36 95 46 Reproductive Health 75 29 103 36 Social Psychology 75 21 114 31 Clinical Laboratory Science 74 10 109 11 Epidemiology 74 29 97 38 Transplantation 74 13 100 18 Pathology 73 29 119 36 Pain & Pain Management 72 13 106 19 Gerontology & Geriatric Medicine 71 36 99 48 Dermatology 70 28 95 35 Obesity 69 6 95 7 Public Health 69 31 98 39 Child & Adolescent Psychology 64 30 95 40 Dentistry 63 31 81 40 Heart & Thoracic Surgery 62 10 79 13 Addiction 61 21 84 26 Developmental Disabilities 59 16 78 25 Natural Medicines & Medicinal Plants 59 20 87 23 Plastic & Reconstructive Surgery 59 12 72 13 Tropical Medicine & Parasitology 59 25 74 27 Emergency Medicine 58 18 85 21 Primary Health Care 58 11 84 16 Neurosurgery 57 13 74 16 Veterinary Medicine 54 24 73 29 Medical Informatics 51 14 78 17 Nursing 49 24 67 29 Rehabilitation Therapy 48 20 60 32 Otolaryngology 47 23 66 27 Hospice & Palliative Care 46 7 62 9 Oral & Maxillofacial Surgery 44 13 62 16

EC3 Working Papers 17
26
Pregnancy & Childbirth 39 21 58 31 Alternative & Traditional Medicine 37 16 54 21 Audiology, Speech & Language Pathology 35 11 51 17 Bioethics 29 8 40 11 Life Sciences & Earth Sciences 355 108 495 146 Life Sciences & Earth Sciences (general) 355 57 495 78 Molecular Biology 223 60 343 78 Cell Biology 223 72 343 95 Biochemistry 164 63 281 79 Biotechnology 129 36 197 49 Developmental Biology & Embryology 121 29 192 35 Environmental Sciences 115 44 151 55 Sustainable Energy 108 29 161 41 Microbiology 105 47 161 60 Bioinformatics & Computational Biology 104 19 205 24 Virology 98 32 125 39 Botany 93 42 132 51 Atmospheric Sciences 89 34 120 46 Evolutionary Biology 86 18 142 21 Food Science & Technology 83 35 112 41 Ecology 83 37 124 53 Sustainable Development 75 25 105 34 Proteomics, Peptides & Aminoacids 74 20 101 27 Biophysics 65 25 81 30 Hydrology & Water Resources 62 15 83 20 Soil Sciences 61 21 82 27 Biodiversity & Conservation Biology 60 28 89 35 Geology 59 30 74 40 Geochemistry & Mineralogy 58 16 71 23 Animal Husbandry 56 19 70 23 Agronomy & Crop Science 55 30 75 40 Environmental & Geological Engineering 54 19 72 22 Forests & Forestry 53 15 72 17 Oceanography 49 30 84 34 Marine Sciences & Fisheries 49 33 71 42 Zoology 48 18 64 23 Insects & Arthropods 48 20 81 27 Animal Behavior & Ethology 47 11 65 13 Plant Pathology 46 13 75 16 Wood Science & Technology 40 6 52 8 Paleontology 39 12 50 16 Pest Control & Pesticides 37 10 46 12 Mycology 37 11 49 16 Birds 25 7 36 10 Physics & Mathematics 191 107 263 140 Physics & Mathematics (general) 191 43 263 54 Astronomy & Astrophysics 162 33 222 44 High Energy & Nuclear Physics 145 39 194 47 Condensed Matter Physics & Semiconductors 138 38 227 48 Quantum Mechanics 128 7 204 9 Optics & Photonics 122 35 186 53

Google Scholar Metrics 2014: a low cost bibliometric tool
27
Geophysics 91 27 127 36 Spectroscopy & Molecular Physics 73 26 101 33 Biophysics 65 25 81 30 Mathematical Analysis 64 22 95 30 Pure & Applied Mathematics 64 16 95 19 Mathematical Optimization 61 18 99 24 Nonlinear Science 61 21 78 26 Probability & Statistics with Applications 61 34 113 39 Computational Mathematics 60 25 78 34 Electromagnetism 58 20 75 25 Thermal Sciences 58 17 76 20 Mathematical Physics 52 15 78 20 Fluid Mechanics 51 14 77 16 Acoustics & Sound 49 16 75 23 Plasma & Fusion 48 9 65 11 Algebra 43 20 62 26 Geometry 43 20 62 27 Discrete Mathematics 37 18 48 22 Business, Economics & Management 168 63 241 92 Economics 168 50 241 80 Finance 116 31 179 41 Economic Policy 105 32 148 53 Human Resources & Organizations 81 37 118 54 Entrepreneurship & Innovation 73 19 101 27 Business, Economics & Management (general) 72 33 122 52 Strategic Management 72 42 113 61 Marketing 65 26 111 36 Tourism & Hospitality 63 13 91 18 Development Economics 62 16 111 20 International Business 60 15 84 24 Accounting & Taxation 57 20 87 28 Game Theory and Decision Science 48 16 63 24 Emergency Management 39 4 56 7 Educational Administration 32 11 48 14 Economic History 22 3 33 3 Social Sciences 81 45 116 59 Cognitive Science 92 32 138 42 Environmental & Occupational Medicine 89 28 118 34 Environmental Law & Policy 87 16 115 20 Educational Technology 81 18 116 28 Human Resources & Organizations 81 37 118 54 Health Policy & Medical Law 77 9 111 11 Sustainable Development 75 25 105 34 Ethics 70 10 98 11 Public Health 69 31 98 39 Social Sciences (general) 66 31 96 38 Development Economics 62 16 111 20 Library & Information Science 56 17 80 21 Political Science 54 25 85 33 Education 52 32 86 46 Educational Psychology & Counseling 52 17 74 22

EC3 Working Papers 17
28
Science & Engineering Education 52 20 70 28 Diplomacy & International Relations 48 16 75 22 Geography & Cartography 47 18 70 24 Sociology 47 30 82 38 Teaching & Teacher Education 47 18 61 22 Sex & Sexuality 46 11 60 13 Urban Studies & Planning 46 24 79 34 Family Studies 44 13 64 15 Public Policy & Administration 42 15 57 22 Academic & Psychological Testing 40 10 54 13 Anthropology 40 12 51 15 Forensic Science 40 10 58 15 Higher Education 40 15 54 21 Law 39 27 71 37 Paleontology 39 12 50 16 Social Work 39 21 60 27 Archaeology 38 10 45 14 Criminology, Criminal Law & Policing 36 19 49 25 Special Education 33 16 48 23 Educational Administration 32 11 48 14 Epistemology & Scientific History 32 9 43 12 Human Migration 32 9 55 13 Early Childhood Education 30 12 59 19 Bioethics 29 8 40 11 Chinese Studies & History 29 6 44 9 Military Studies 27 9 45 11 Feminism & Women's Studies 25 6 36 9 African Studies & History 24 8 38 12 Asian Studies & History 24 12 36 16 International Law 23 14 40 19 Economic History 22 3 33 3 History 22 8 33 12 European Law 21 5 31 5 Technology Law 20 7 31 8 Architecture 17 3 25 4 Canadian Studies & History 17 3 26 5 Middle Eastern & Islamic Studies 15 5 24 6 Humanities, Literature & Arts 38 25 72 30 Sex & Sexuality 46 11 60 13 Communication 45 20 72 31 Language & Linguistics 36 16 51 23 Gender Studies 35 10 41 12 Foreign Language Learning 34 13 50 18 Epistemology & Scientific History 32 9 43 12 Ethnic & Cultural Studies 32 10 55 14 Philosophy 32 15 44 20 Humanities, Literature & Arts (general) 31 14 44 18 Music & Musicology 31 9 43 12 Chinese Studies & History 29 6 44 9 Religion 26 8 30 11 Feminism & Women's Studies 25 6 36 9 African Studies & History 24 8 38 12
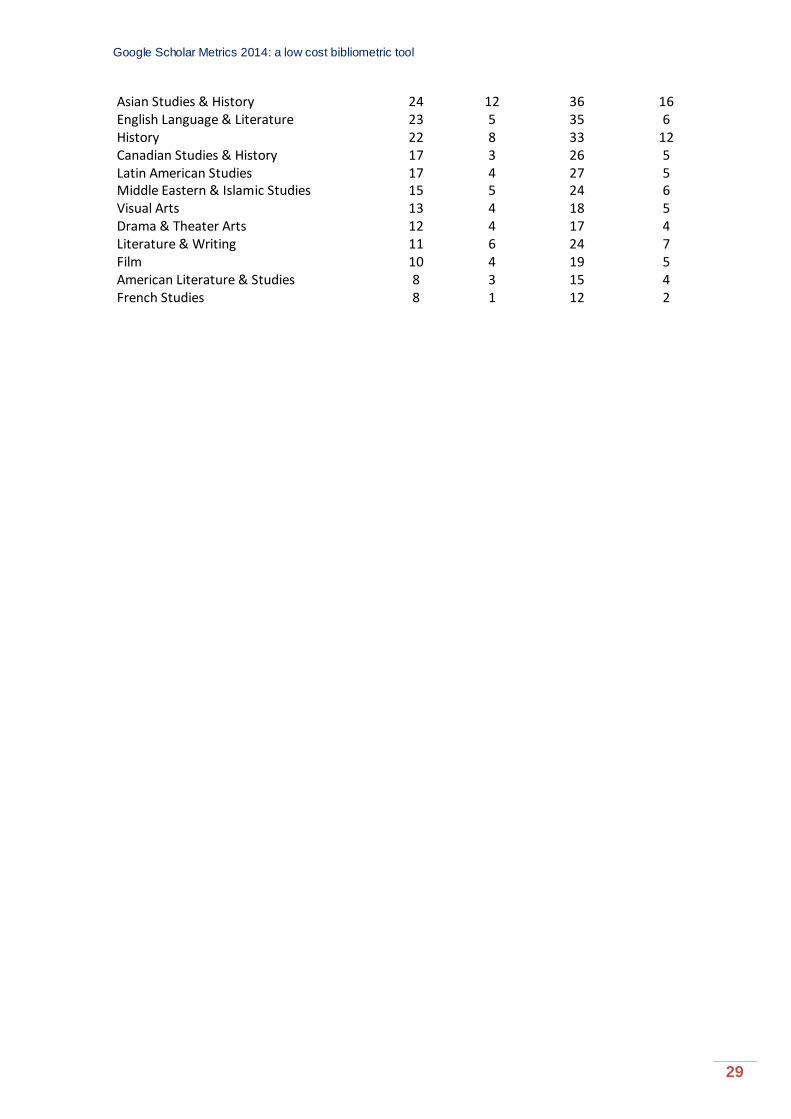
Google Scholar Metrics 2014: a low cost bibliometric tool
29
Asian Studies & History 24 12 36 16 English Language & Literature 23 5 35 6 History 22 8 33 12 Canadian Studies & History 17 3 26 5 Latin American Studies 17 4 27 5 Middle Eastern & Islamic Studies 15 5 24 6 Visual Arts 13 4 18 5 Drama & Theater Arts 12 4 17 4 Literature & Writing 11 6 24 7 Film 10 4 19 5 American Literature & Studies 8 3 15 4 French Studies 8 1 12 2
EC3 Working Papers 17
30
APENDIX 4 Correlation between the positions of the publications by languages in the last two editions of GSM (2008-2012 and 2009-2013)
SUBCATEGORIES CORRELATION Dutch 0.91 German 0.88 Portuguese 0.77 Spanish 0.77 Chinese 0.77 Italian 0.68 French 0.64 Japanese 0.62

Google Scholar Metrics 2014: a low cost bibliometric tool
31
APPENDIX 5 Correlation between the positions of the publications by subcategories in the last two editions of GSM (2008-2012 and 2009-2013)
SUBCATEGORIES CORRELATION ADDITIONS / DELETIONS %
Business, Economics & Management Emergency Management 0,98 20 Economic History 0,97 25 Marketing 0,96 10 Human Resources & Organizations 0,95 10 Entrepreneurship & Innovation 0,95 5 International Business 0,95 5 Economics 0,94 5 Finance 0,94 0 Development Economics 0,94 5 Game Theory and Decision Science 0,93 15 Educational Administration 0,93 15 Accounting & Taxation 0,92 10 Tourism & Hospitality 0,92 10 Strategic Management 0,89 5 Economic Policy 0,86 10 Business, Economics & Management (general) 0,80 20 Chemical & Material Sciences Corrosion 0,99 15 Electrochemistry 0,98 10 Inorganic Chemistry 0,98 25 Composite Materials 0,98 5 Dispersion Chemistry 0,97 5 Materials Engineering 0,96 5 Analytical Chemistry 0,96 5 Nanotechnology 0,96 5 Chemical Kinetics & Catalysis 0,95 10 Medicinal Chemistry 0,95 5 Polymers & Plastics 0,95 15 Ceramic Engineering 0,95 15 Oil, Petroleum & Natural Gas 0,93 5 Crystallography & Structural Chemistry 0,92 10 Combustion & Propulsion 0,92 0 Biochemistry 0,91 25 Organic Chemistry 0,88 35 Chemical & Material Sciences (general) 0,87 50 Molecular Modeling 0,85 5

EC3 Working Papers 17
32
Engineering & Computer Science Metallurgy 0,99 10 Mining & Mineral Resources 0,98 30 Plasma & Fusion 0,98 0 Data Mining & Analysis 0,97 20 Fuzzy Systems 0,97 30 Remote Sensing 0,97 10 Technology Law 0,97 25 Sustainable Energy 0,97 15 Structural Engineering 0,96 5 Ocean & Marine Engineering 0,96 10 Materials Engineering 0,96 5 Water Supply & Treatment 0,96 10 Computer Graphics 0,96 10 Robotics 0,96 10 Nanotechnology 0,96 5 Wood Science & Technology 0,95 5 Bioinformatics & Computational Biology 0,95 20 Power Engineering 0,95 20 Medical Informatics 0,95 20 Information Theory 0,95 10 Ceramic Engineering 0,95 15 Computer Hardware Design 0,95 5 Computer Vision & Pattern Recognition 0,95 15 Software Systems 0,94 20 Library & Information Science 0,94 15 Engineering & Computer Science (general) 0,94 15 Oil, Petroleum & Natural Gas 0,93 5 Game Theory and Decision Science 0,93 15 Textile Engineering 0,93 20 Biotechnology 0,93 15 Combustion & Propulsion 0,92 0 Radar, Positioning & Navigation 0,92 10 Transportation 0,92 15 Computer Security & Cryptography 0,91 25 Computing Systems 0,91 35 Automation & Control Theory 0,91 0 Manufacturing & Machinery 0,91 5 Computer Networks & Wireless Communication 0,91 10 Signal Processing 0,90 0 Operations Research 0,90 0 Civil Engineering 0,90 5 Evolutionary Computation 0,89 20 Biomedical Technology 0,89 35 Theoretical Computer Science 0,89 15
Google Scholar Metrics 2014: a low cost bibliometric tool
33
Databases & Information Systems 0,89 20 Mechanical Engineering 0,88 10 Human Computer Interaction 0,88 30 Artificial Intelligence 0,87 15 Quality & Reliability 0,86 15 Molecular Modeling 0,85 5 Educational Technology 0,85 20 Aviation & Aerospace Engineering 0,84 10 Microelectronics & Electronic Packaging 0,83 10 Food Science & Technology 0,81 10 Environmental & Geological Engineering 0,81 10 Multimedia 0,80 20 Computational Linguistics 0,80 15 Architecture 0,77 25 Health & Medical Sciences Pain & Pain Management 0,99 10 Vascular Medicine 0,99 5 Obesity 0,98 5 Anesthesiology 0,98 5 Oncology 0,98 10 Pathology 0,98 20 Surgery 0,98 10 Transplantation 0,98 0 AIDS & HIV 0,98 0 Molecular Biology 0,98 15 Critical Care 0,98 10 Pulmonology 0,98 10 Hospice & Palliative Care 0,97 5 Addiction 0,97 10 Clinical Laboratory Science 0,97 10 Primary Health Care 0,97 5 Bioethics 0,97 5 Physiology 0,97 10 Health & Medical Sciences (general) 0,97 25 Communicable Diseases 0,96 5 Diabetes 0,96 5 Epidemiology 0,96 5 Genetics & Genomics 0,96 15 Audiology, Speech & Language Pathology 0,96 10 Immunology 0,96 5 Psychiatry 0,96 10 Cardiology 0,96 20 Nutrition Science 0,96 15 Medicinal Chemistry 0,95 5 Gastroenterology & Hepatology 0,95 5 Neurosurgery 0,95 5
EC3 Working Papers 17
34
Toxicology 0,95 20 Rheumatology 0,95 5 Emergency Medicine 0,95 15 Pediatric Medicine 0,95 10 Medical Informatics 0,95 20 Oral & Maxillofacial Surgery 0,95 10 Urology & Nephrology 0,95 15 Neurology 0,94 0 Ophthalmology & Optometry 0,94 5 Pregnancy & Childbirth 0,94 10 Rehabilitation Therapy 0,94 15 Plastic & Reconstructive Surgery 0,94 5 Natural Medicines & Medicinal Plants 0,94 20 Social Psychology 0,93 15 Hematology 0,93 10 Physical Education & Sports Medicine 0,93 5 Dermatology 0,93 15 Reproductive Health 0,93 5 Veterinary Medicine 0,91 35 Heart & Thoracic Surgery 0,91 0 Tropical Medicine & Parasitology 0,91 10 Gynecology & Obstetrics 0,91 5 Psychology 0,91 15 Public Health 0,91 15 Nuclear Medicine, Radiotherapy & Molecular Imaging 0,90 15 Orthopedic Medicine & Surgery 0,90 15 Biomedical Technology 0,89 35 Developmental Disabilities 0,89 5 Alternative & Traditional Medicine 0,89 10 Virology 0,88 25 Endocrinology 0,88 20 Dentistry 0,87 10 Child & Adolescent Psychology 0,87 10 Radiology & Medical Imaging 0,86 0 Otolaryngology 0,86 5 Pharmacology & Pharmacy 0,86 25 Nursing 0,86 20 Gerontology & Geriatric Medicine 0,82 5 Humanities, Literature & Arts Gender Studies 0,97 10 Sex & Sexuality 0,96 20 Foreign Language Learning 0,96 5 Chinese Studies & History 0,95 10 Epistemology & Scientific History 0,95 25 Music & Musicology 0,94 5
Google Scholar Metrics 2014: a low cost bibliometric tool
35
Middle Eastern & Islamic Studies 0,93 10 Canadian Studies & History 0,92 45 Drama & Theater Arts 0,92 25 History 0,91 25 Latin American Studies 0,91 15 Language & Linguistics 0,90 10 Visual Arts 0,89 35 Ethnic & Cultural Studies 0,88 5 English Language & Literature 0,84 10 African Studies & History 0,83 10 French Studies 0,81 20 Feminism & Women's Studies 0,81 10 Religion 0,78 15 Philosophy 0,76 10 Asian Studies & History 0,74 10 American Literature & Studies 0,73 25 Communication 0,69 10 Humanities, Literature & Arts (general) 0,66 20 Film 0,54 25 Literature & Writing 0,32 20 Life Sciences & Earth Sciences Biodiversity & Conservation Biology 0,98 20 Molecular Biology 0,98 15 Environmental Sciences 0,98 10 Birds 0,97 10 Hydrology & Water Resources 0,97 0 Pest Control & Pesticides 0,97 10 Sustainable Energy 0,97 15 Mycology 0,96 15 Animal Behavior & Ethology 0,96 20 Life Sciences & Earth Sciences (general) 0,96 35 Plant Pathology 0,96 15 Wood Science & Technology 0,95 5 Evolutionary Biology 0,95 15 Paleontology 0,95 5 Bioinformatics & Computational Biology 0,95 20 Developmental Biology & Embryology 0,95 5 Proteomics, Peptides & Aminoacids 0,95 5 Biophysics 0,94 15 Cell Biology 0,94 10 Geology 0,94 15 Soil Sciences 0,94 5 Botany 0,94 10 Sustainable Development 0,94 10 Forests & Forestry 0,94 5 Biotechnology 0,93 15
EC3 Working Papers 17
36
Animal Husbandry 0,93 10 Geochemistry & Mineralogy 0,93 15 Atmospheric Sciences 0,93 15 Virology 0,93 10 Ecology 0,92 10 Marine Sciences & Fisheries 0,91 10 Biochemistry 0,91 25 Zoology 0,90 15 Insects & Arthropods 0,89 10 Microbiology 0,88 5 Food Science & Technology 0,81 10 Environmental & Geological Engineering 0,81 10 Oceanography 0,79 10 Agronomy & Crop Science 0,73 20 Physics & Mathematics Mathematical Physics 0,99 5 Fluid Mechanics 0,98 20 Plasma & Fusion 0,98 0 Mathematical Optimization 0,98 10 Quantum Mechanics 0,98 0 Astronomy & Astrophysics 0,97 5 Probability & Statistics with Applications 0,97 15 Mathematical Analysis 0,97 5 Computational Mathematics 0,97 0 Algebra 0,96 10 High Energy & Nuclear Physics 0,95 10 Acoustics & Sound 0,95 15 Thermal Sciences 0,95 5 Discrete Mathematics 0,95 5 Nonlinear Science 0,95 15 Biophysics 0,94 15 Condensed Matter Physics & Semiconductors 0,94 10 Optics & Photonics 0,94 10 Physics & Mathematics (general) 0,93 15 Spectroscopy & Molecular Physics 0,92 15 Geometry 0,91 10 Pure & Applied Mathematics 0,90 15 Geophysics 0,83 25 Electromagnetism 0,70 10 Social Sciences Health Policy & Medical Law 0,98 20 Economic History 0,97 25 Geography & Cartography 0,97 15 Academic & Psychological Testing 0,97 15 Technology Law 0,97 25

Google Scholar Metrics 2014: a low cost bibliometric tool
37
Diplomacy & International Relations 0,97 25 Sex & Sexuality 0,96 20 Education 0,96 10 Forensic Science 0,96 10 European Law 0,96 30 Ethics 0,96 15 Human Resources & Organizations 0,95 10 Chinese Studies & History 0,95 10 Epistemology & Scientific History 0,95 25 Paleontology 0,95 5 International Law 0,95 15 Political Science 0,95 5 Early Childhood Education 0,95 10 Urban Studies & Planning 0,94 10 Educational Psychology & Counseling 0,94 0 Library & Information Science 0,94 15 Environmental Law & Policy 0,94 10 Sustainable Development 0,94 10 Development Economics 0,94 5 Anthropology 0,93 25 Educational Administration 0,93 15 Middle Eastern & Islamic Studies 0,93 10 Human Migration 0,93 0 Family Studies 0,93 15 Canadian Studies & History 0,92 45 Archaeology 0,92 15 Military Studies 0,91 5 History 0,91 25 Cognitive Science 0,91 10 Higher Education 0,91 10 Teaching & Teacher Education 0,91 15 Public Health 0,91 15 Science & Engineering Education 0,90 5 Environmental & Occupational Medicine 0,90 15 Criminology, Criminal Law & Policing 0,88 15 Public Policy & Administration 0,87 10 Special Education 0,87 25 Educational Technology 0,85 20 Law 0,84 5 African Studies & History 0,83 10 Feminism & Women's Studies 0,81 10 Social Work 0,78 20 Architecture 0,77 25 Asian Studies & History 0,74 10 Social Sciences (general) 0,56 35