Embed Size (px)
Citation preview
Good Practice Performance Indicators
Engineering Practices Working Group
Performance Indicator Sub-Group
Engineering Performance Metrics
D. C. Lowe
October 21, 2003
2
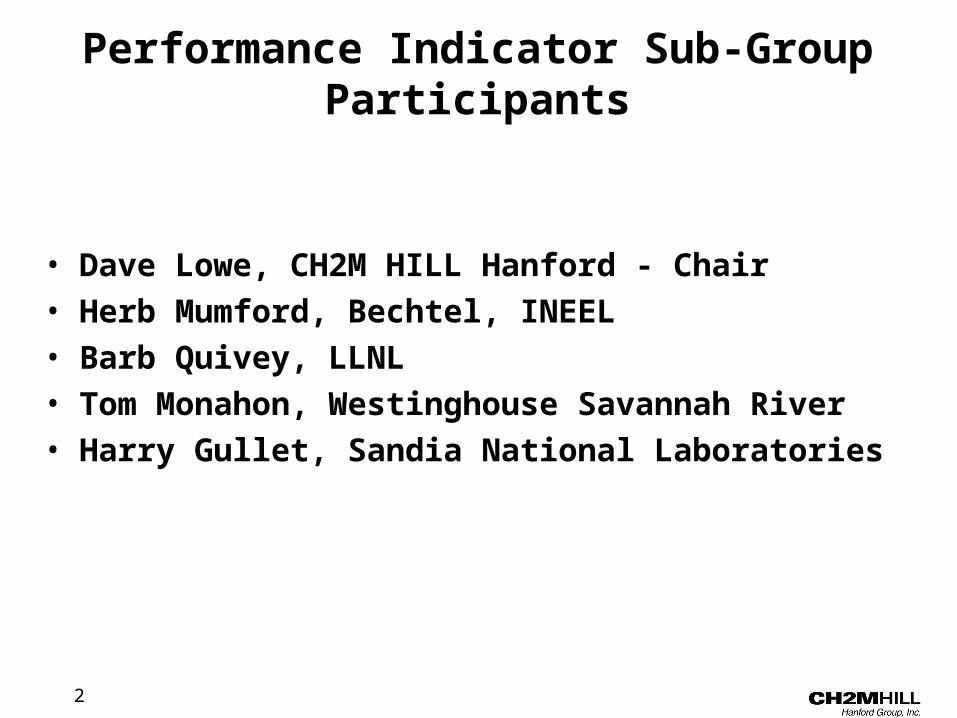
Performance Indicator Sub-Group Participants
• Dave Lowe, CH2M HILL Hanford - Chair• Herb Mumford, Bechtel, INEEL• Barb Quivey, LLNL• Tom Monahon, Westinghouse Savannah River• Harry Gullet, Sandia National Laboratories
3
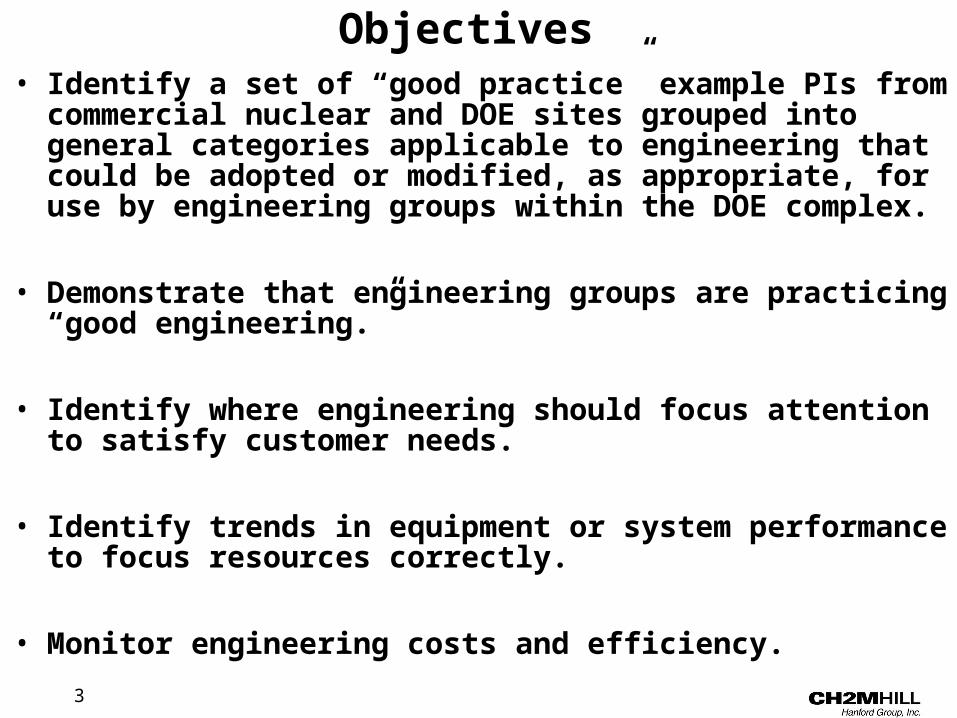
Objectives • Identify a set of “good practice” example PIs from
commercial nuclear and DOE sites grouped into general categories applicable to engineering that could be adopted or modified, as appropriate, for use by engineering groups within the DOE complex.
• Demonstrate that engineering groups are practicing “good engineering.”
• Identify where engineering should focus attention to satisfy customer needs.
• Identify trends in equipment or system performance to focus resources correctly.
• Monitor engineering costs and efficiency.
4
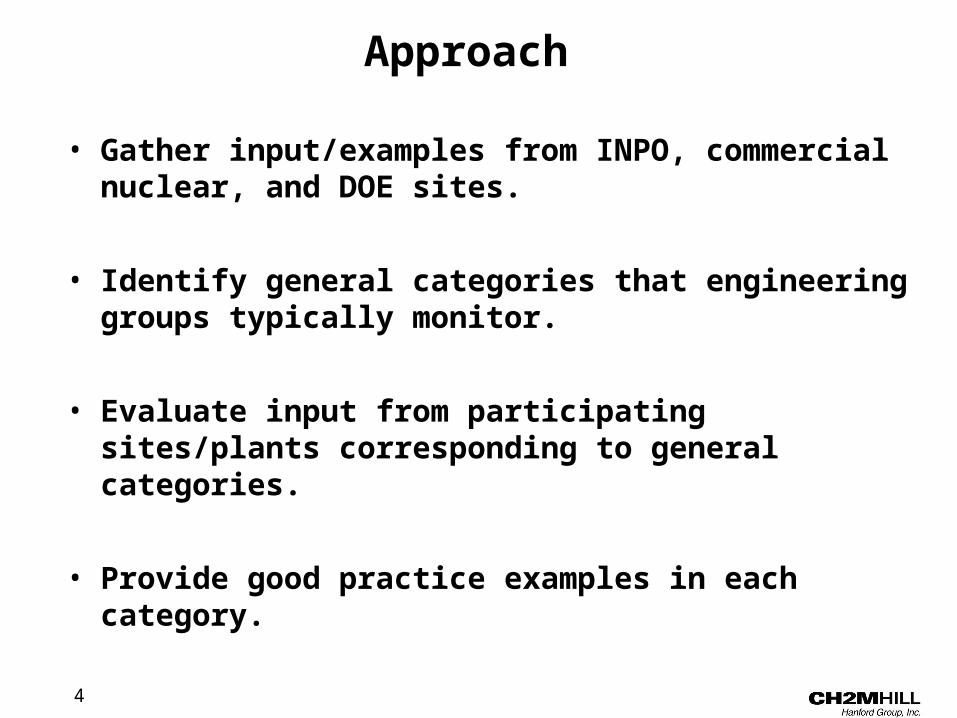
Approach
• Gather input/examples from INPO, commercial nuclear, and DOE sites.
• Identify general categories that engineering groups typically monitor.
• Evaluate input from participating sites/plants corresponding to general categories.
• Provide good practice examples in each category.
5
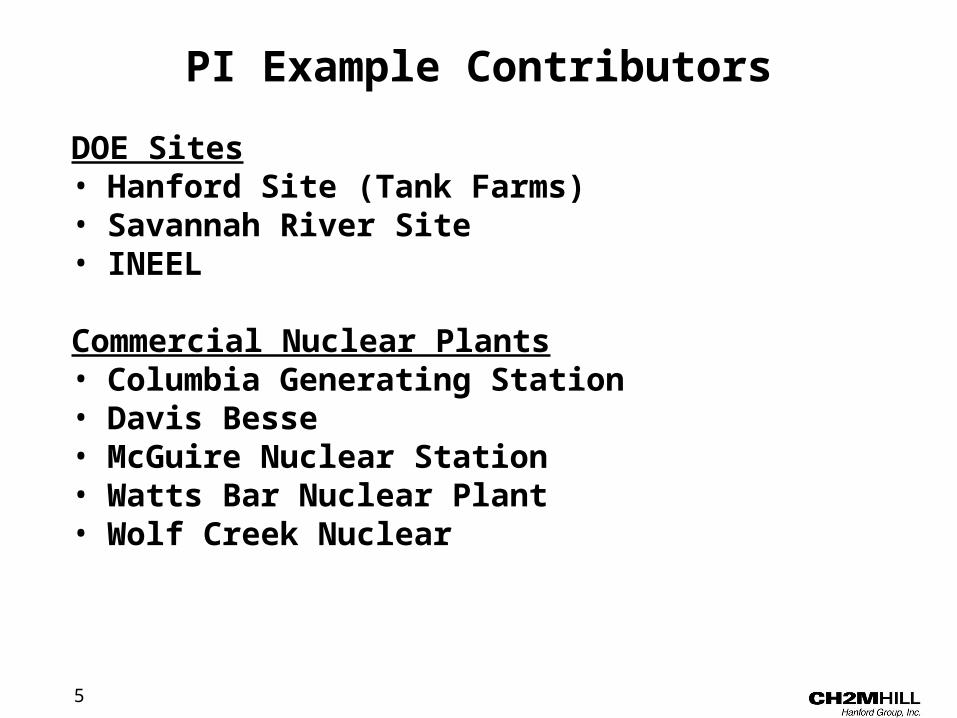
PI Example Contributors
DOE Sites• Hanford Site (Tank Farms)• Savannah River Site• INEEL
Commercial Nuclear Plants• Columbia Generating Station• Davis Besse• McGuire Nuclear Station• Watts Bar Nuclear Plant• Wolf Creek Nuclear
6
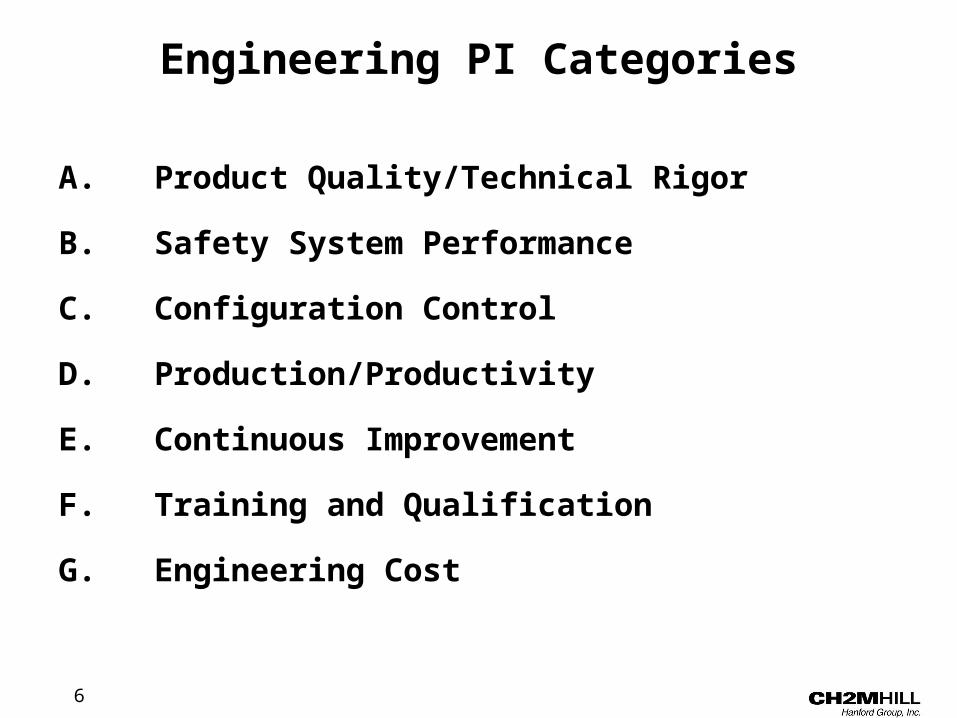
Engineering PI Categories
A. Product Quality/Technical Rigor
B. Safety System Performance
C. Configuration Control
D. Production/Productivity
E. Continuous Improvement
F. Training and Qualification
G. Engineering Cost
7
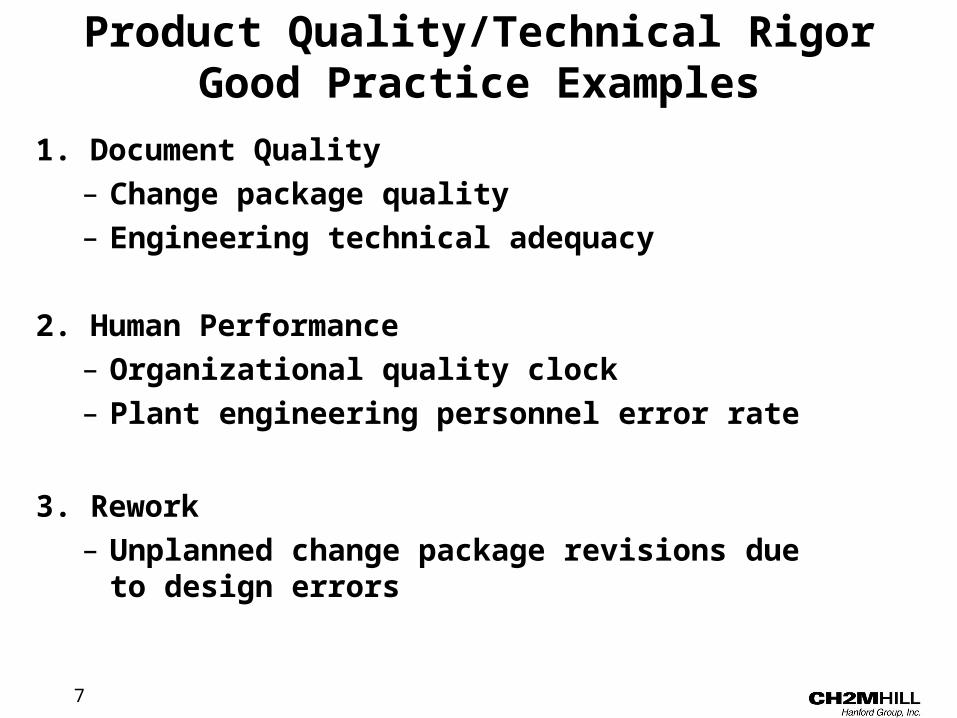
Product Quality/Technical RigorGood Practice Examples
1. Document Quality– Change package quality– Engineering technical adequacy
2. Human Performance– Organizational quality clock– Plant engineering personnel error rate
3. Rework– Unplanned change package revisions due to
design errors
8
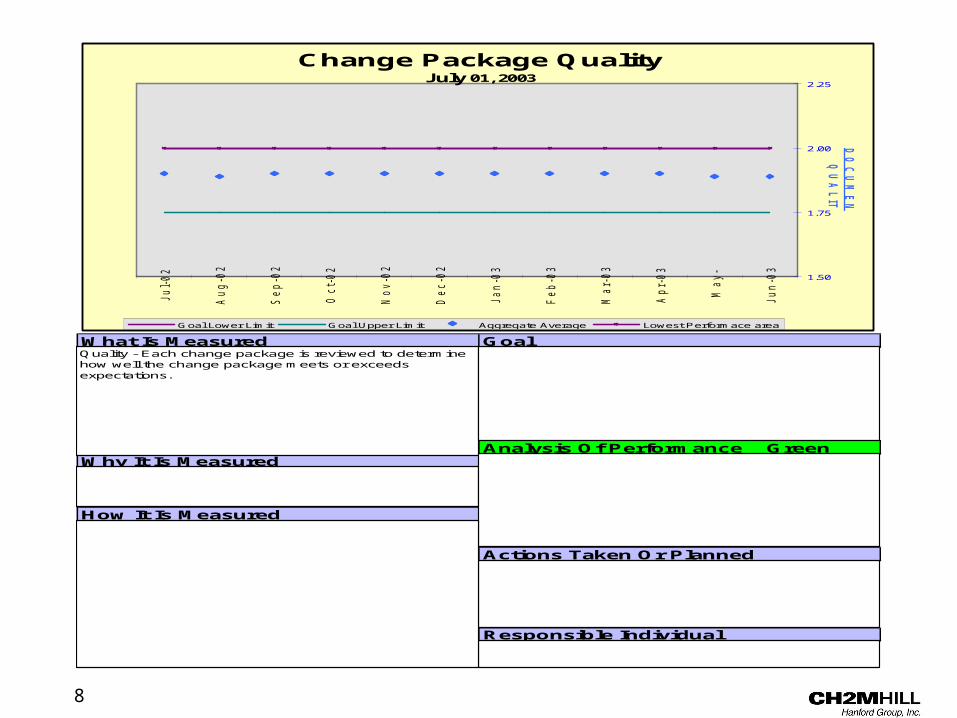
What Is Measured Goal
Analysis Of Performance GreenWhy It Is Measured
How It Is Measured
Actions Taken Or Planned
Responsible Individual
Change Package QualityJuly 01, 2003
Jul-
02
Aug-0
2
Sep-0
2
Oct-
02
Nov-0
2
Dec-0
2
Jan
-03
Feb-03
Mar-03
Apr-03
May-
Jun
-03
1.50
1.75
2.00
2.25
DO
CU
ME
NT
AT
ION
QU
AL
ITY
Goal Lower Limit Goal Upper Limit Aggregate Average Lowest Performace area
Quality - Each change package is reviewed to determine how well the change package meets or exceeds expectations.
Change Package Quality is important to the safe, reliable and efficient operation of the power plant.
Change package quality has been improving.
Dan Dandreo - Supervisor Projects Design Engineering (Ext. 8382)
Green - 1 year weighted average between 1.75 and 2.00
Yellow - Trend value goes below 1.50
Red - Trend value goes above 2.00
Engineering Management continues to monitor change package quality as well as unplanned package revisions and incorporates improvements through the Engineering Support Training Program.
As each change package is reviewed by the responsible supervisor, a specially derived attribute is used to determine how well the change package meets or exceeds expectations. If the trend value falls below 1.75 the evaluator's expectations need to be reviewed. If the trend value goes above 2.00 the quality of the change packages needs to be improved.
All revisions to these change packages are evaluated against the same quality attributes.
9
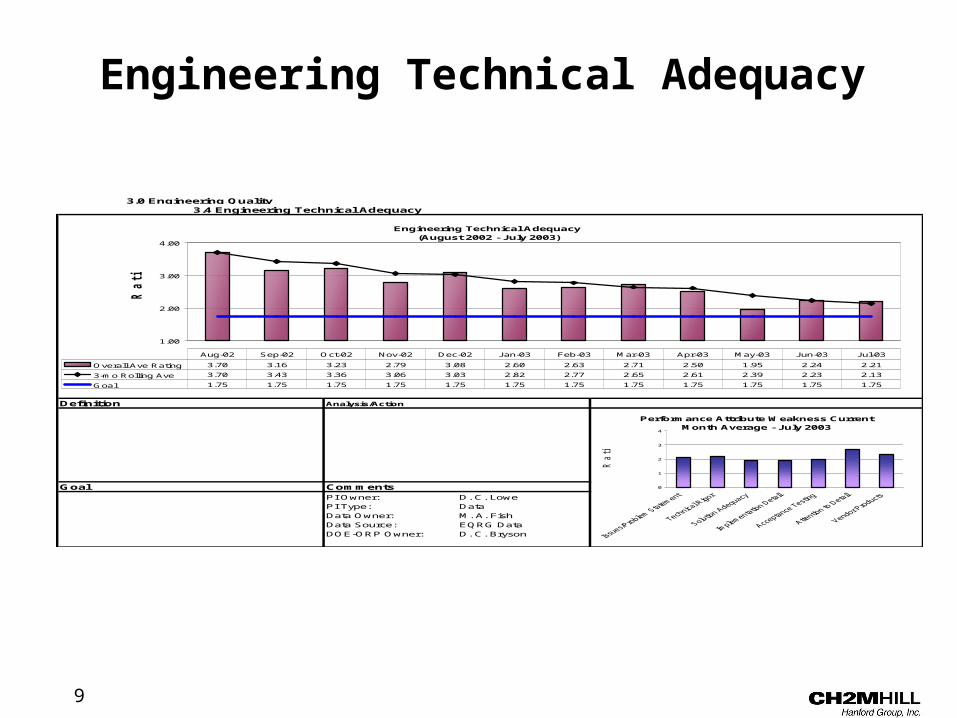
3.0 Engineering Quality3.4 Engineering Technical Adequacy
Definition Analysis/Action
Goal CommentsPI Owner: D. C. LowePI Type: DataData Owner: M. A. FishData Source: EQRG DataDOE-ORP Owner: D. C. Bryson
This PI depicts evaluation of engineering document quality. This lagging performance indicator is used to track and trend the quality attributes required to establish a healthy Engineering Organization. The data is based on Engineering Quality Review Group (EQRG) assessment and subsequent rating of engineering documents reviewed using typical performance attributes.
Analysis: There is a recent decrease in quality apparent in the attention to detail in Engineering products reviewed over last 60 days. The 3 month rolling average continues to improve.
Action: Discipline leads will continue to target pre-release reviews for overall improvement and provide mentoring as required.
The goal is to produce all Engineering documentation such that if reviewed by the Engineering Quality Review Group the documentation would rate a <1.75.
Performance Attribute Weakness Current Month Average - July 2003
0
1
2
3
4
Rating
Engineering Technical Adequacy (August 2002 - July 2003)
1.00
2.00
3.00
4.00
Ratin
g
Overall Ave Rating 3.70 3.16 3.23 2.79 3.08 2.60 2.63 2.71 2.50 1.95 2.24 2.21
3-mo Rolling Ave 3.70 3.43 3.36 3.06 3.03 2.82 2.77 2.65 2.61 2.39 2.23 2.13
Goal 1.75 1.75 1.75 1.75 1.75 1.75 1.75 1.75 1.75 1.75 1.75 1.75
Aug-02 Sep-02 Oct-02 Nov-02 Dec-02 Jan-03 Feb-03 Mar-03 Apr-03 May-03 Jun-03 Jul-03
Engineering Technical Adequacy
10
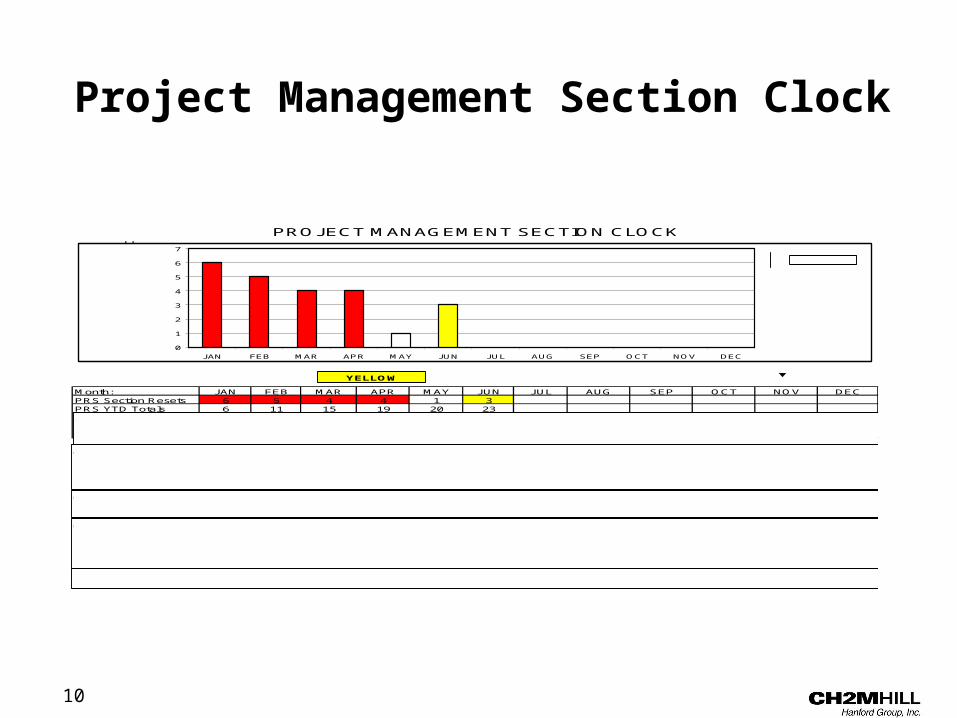
Month: JAN FEB MAR APR MAY JUN JUL AUG SEP OCT NOV DECPRS Section Resets 6 5 4 4 1 3PRS YTD Totals 6 11 15 19 20 23
PROJECT MANAGEMENT SECTION CLOCK
0
1
2
3
4
5
6
7
JAN FEB MAR APR MAY JUN JUL AUG SEP OCT NOV DEC
Nu
mb
er o
f S
ectio
n C
lock R
ese
ts
GOOD
YELLOW
DEFINITIONThe Project Management Section (PRS) defines events as any reset of the PRS Event Free Clock that is directly related to the operation of the facility. This does not include those administrative errors or training events related to PRS.
RANKING CRITERIA GREEN: No Section Clock Reset Events for the month. WHITE: < 2 Section Clock Reset Events for the month. YELLOW: < 4 Section Clock Reset Events for the month. RED: > 4 Section Clock Reset Events for the month.
OBJECTIVE/GOALThe goal is to maintain the highest standard of event mitigation by encompassing all of PRS performance duties into one category. PRS goal is to limit the number of events in this category to less than or equal to 12 events per year.
ANALYSIS CR Number Date Description CR 03-04831 6/04/03 Violation of Unescorted Access Requirements CR 03-04675 6/10/03 Violation of Procedure - Communication CR 03-05175 6/30/03 Violation of Procedure - Comply to Work Order
Analysis Responsibility - G. Wilson Achievement Responsibility - C. A. Hawley
Current Month:
Project Management Section Clock
11
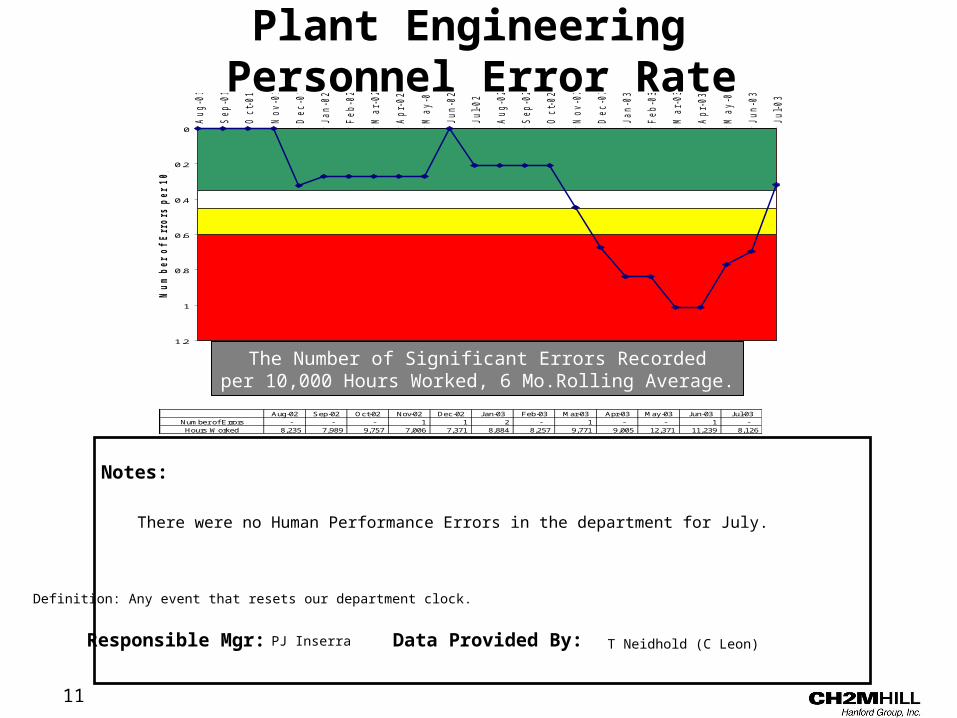
Plant Engineering Personnel Error Rate
The Number of Significant Errors Recordedper 10,000 Hours Worked, 6 Mo.Rolling Average.
Notes:
Responsible Mgr: Data Provided By:PJ Inserra T Neidhold (C Leon)
Definition: Any event that resets our department clock.
Aug-02 Sep-02 Oct-02 Nov-02 Dec-02 Jan-03 Feb-03 Mar-03 Apr-03 May-03 Jun-03 Jul-03Number of Errors - - - 1 1 2 - 1 - - 1 - Hours Worked 8,235 7,989 9,757 7,006 7,371 8,884 8,257 9,771 9,005 12,371 11,239 8,126
0
0.2
0.4
0.6
0.8
1
1.2
Aug-01
Sep-01
Oct-
01
Nov-01
Dec-01
Jan-02
Feb-02
Mar-02
Apr-02
May-02
Jun-02
Jul-02
Aug-02
Sep-02
Oct-
02
Nov-02
Dec-02
Jan-03
Feb-03
Mar-03
Apr-03
May-03
Jun-03
Jul-03
Nu
mb
er o
f E
rro
rs p
er 1
0,0
00 H
ou
rs W
orked
There were no Human Performance Errors in the department for July.
12
What Is Measured Goal
Analysis Of Performance (Green)Why It Is Measured
How It Is Measured
Actions Taken Or Planned
Responsible Individual
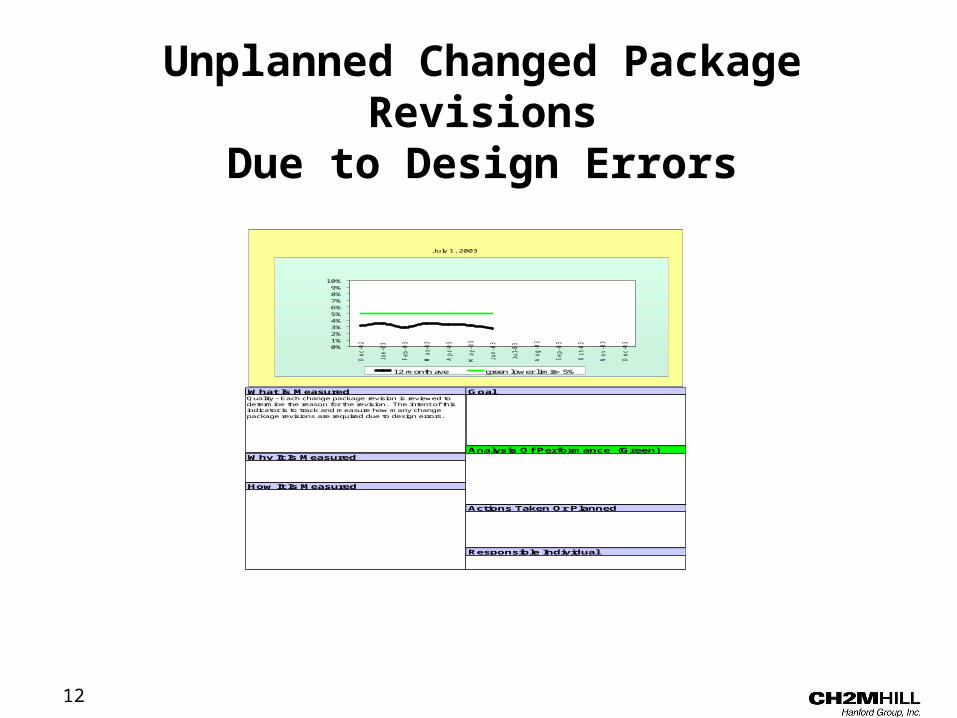
Quality - Each change package revision is reviewed to determine the reason for the revision. The intent of this indicator is to track and measure how many change package revisions are required due to design errors.
Change Package Quality is important to the safe, reliable and efficient operation of the power plant.
Rolling 12 Month average
June 03: Green (2.7%)May 03: Green(3.2%)April 03: Green (3.4%)March 03: Green ( 3.6%)
Dan Dandreo - Supervisor Projects Design Engineering (Ext. 8382)
Green - Design errors average less than or equal to 5 %
Yellow - Design errors average greater than 5% and less than or equal to 10%.
Red - Design errors average above 10%
Engineering Management will monitor unplanned package revisions that are design errors and incorporate improvements through the Engineering Support Training Program. Since EIS will mandate a change in tracking mod revisions, evaluation and methodology may need revision.
Each change package revision is reviewed and graded by the responsible supervisor using the change package quality data base.
A 12 month running average is used to derive the above chart information.
Unplanned Change Package Revisions Due to Design Errors
0%1%2%3%4%5%6%7%8%9%
10%
Dec-0
2
Jan
-0
3
Feb
-0
3
Mar-0
3
Ap
r-0
3
May
-0
3
Ju
n-0
3
Ju
l-0
3
Au
g-0
3
Sep
-0
3
Oct-
03
No
v-0
3
Dec-0
3
12 month ave green lower limit= 5%
July 1, 2003
Unplanned Changed Package RevisionsDue to Design Errors
13
Path Forward
• Finalize “Safety System Performance” category
• Sub-group review of additional categories and selection of good practice examples
• Compile file report of good practice examples
• Target completion: March 1, 2004
14
Backup Slides
15
Document QualityChange Package Quality
This PI tracks the quality of change packages as determined from a review performed by the responsible supervisor.
Strengths:• All the reviews and scoring are performed to a set of
predetermined criteria.• The PI includes descriptive information on what is
measured, how it is measured and what is considered good performance.
• An action level is indicated on the chart.• The change package customer rates the quality of
the product.
16
Suggested Improvement:• The PI would benefit from a clear visual indication that
shows the direction of increasing or decreasing performance.
• Total population of work packages reviewed vs. the percentage meeting quality expectations would provide information that could be used to benchmark among different sites.
• Information should be provided on how the one-year weighted average plot data is calculated. Major rating criteria should be stated.
Document QualityChange Package Quality
17
Document Quality Engineering Technical Adequacy
This PI tracks the quality of engineering documentation as determined by a quality review group comprised of senior level engineers.
Strengths:• All the reviews and scoring are performed to a set of
predetermined criteria.
• The PI includes a sub-chart that shows what attributes are reviewed and an average score for each attribute.
• A goal is indicated on the chart.
• A three-month rolling average is included so that trends are not masked by an individual month’s data.
18
Suggested Improvement:• The PI would benefit from a clear visual indication
that shows the direction of increasing or decreasing performance.
• Total population of documents reviewed vs. percentage meeting quality expectations would provide information that could be used to benchmark among different sites.
• Information should be provided on how the average document rating is calculated. Major rating criteria should be stated.
Document Quality Engineering Technical Adequacy
19
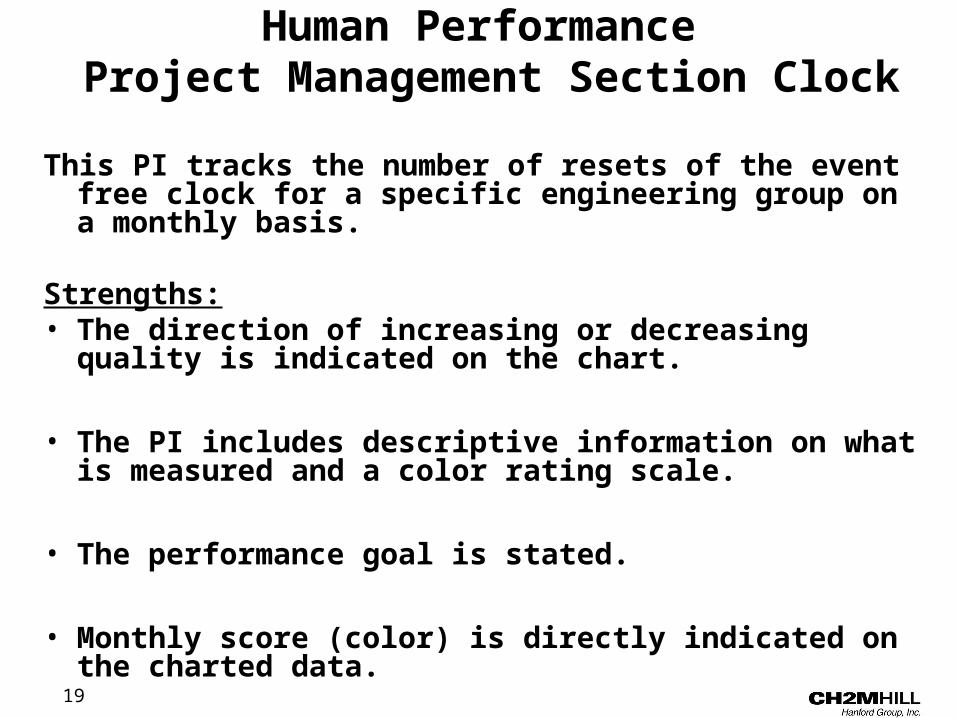
Human Performance Project Management Section Clock
This PI tracks the number of resets of the event free clock for a specific engineering group on a monthly basis.
Strengths:• The direction of increasing or decreasing quality is
indicated on the chart.
• The PI includes descriptive information on what is measured and a color rating scale.
• The performance goal is stated.
• Monthly score (color) is directly indicated on the charted data.
20
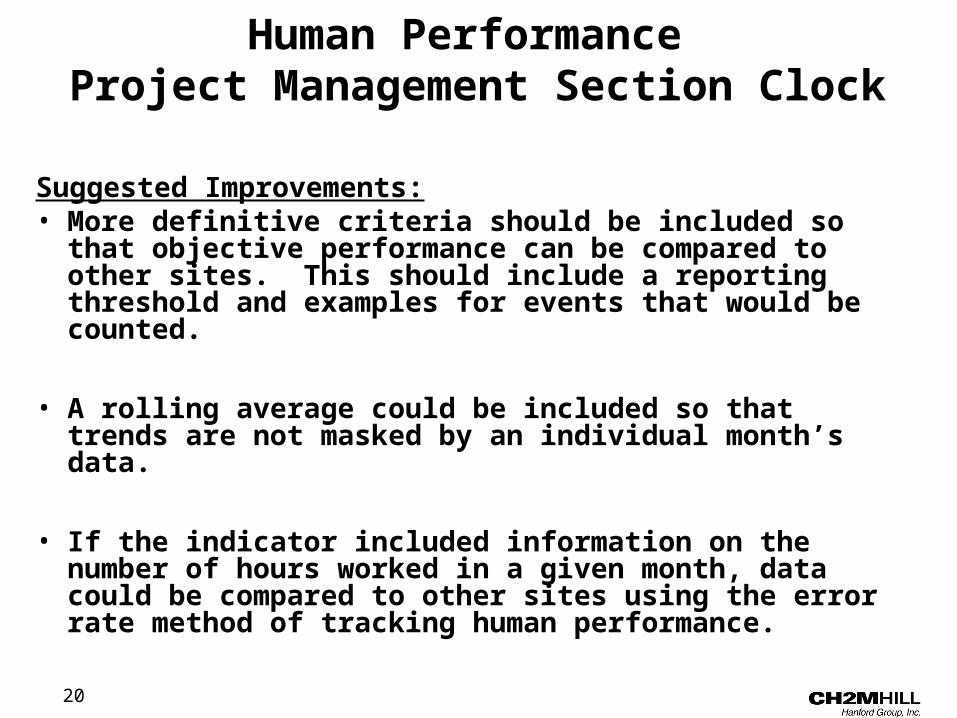
Suggested Improvements:• More definitive criteria should be included so that
objective performance can be compared to other sites. This should include a reporting threshold and examples for events that would be counted.
• A rolling average could be included so that trends are not masked by an individual month’s data.
• If the indicator included information on the number of hours worked in a given month, data could be compared to other sites using the error rate method of tracking human performance.
Human Performance Project Management Section Clock
21
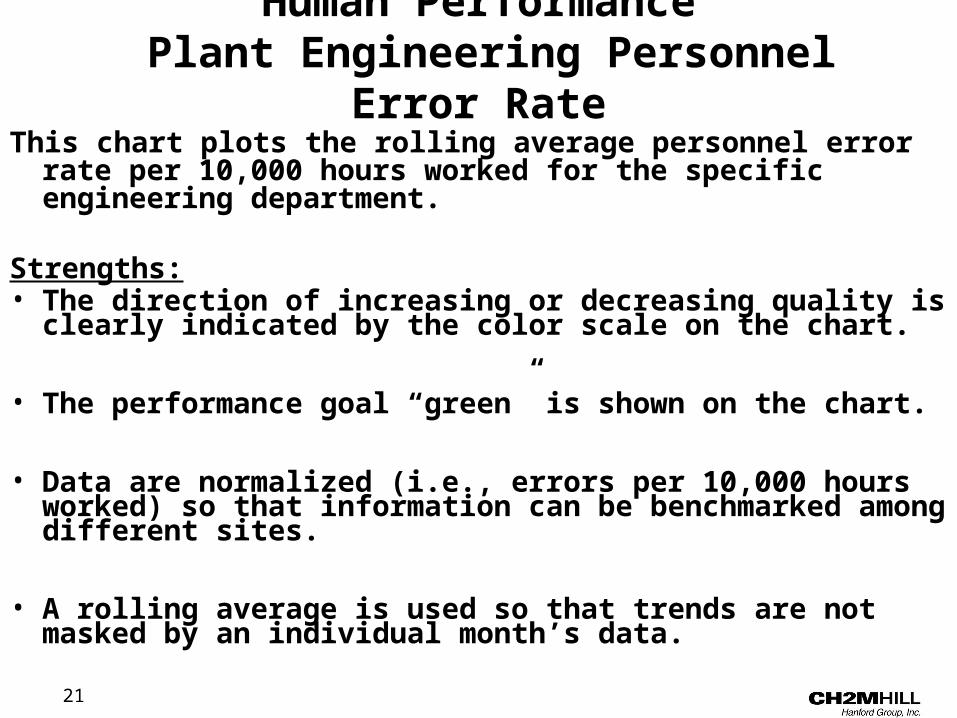
Human Performance Plant Engineering Personnel Error Rate
This chart plots the rolling average personnel error rate per 10,000 hours worked for the specific engineering department.
Strengths:• The direction of increasing or decreasing quality is clearly
indicated by the color scale on the chart.
• The performance goal “green” is shown on the chart.
• Data are normalized (i.e., errors per 10,000 hours worked) so that information can be benchmarked among different sites.
• A rolling average is used so that trends are not masked by an individual month’s data.
22
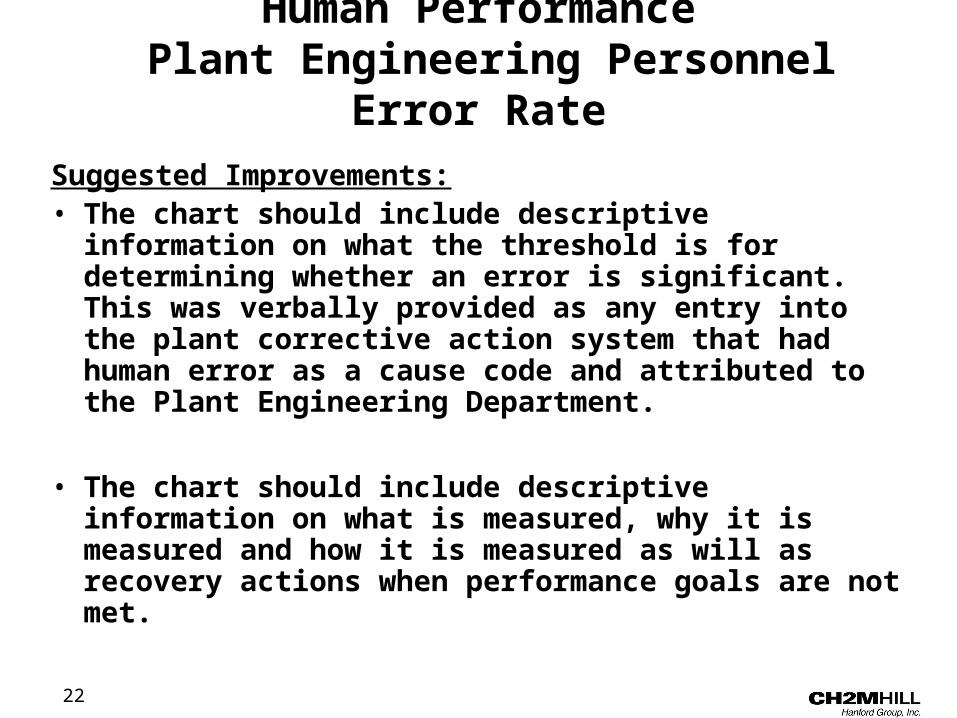
Suggested Improvements:• The chart should include descriptive information on
what the threshold is for determining whether an error is significant. This was verbally provided as any entry into the plant corrective action system that had human error as a cause code and attributed to the Plant Engineering Department.
• The chart should include descriptive information on what is measured, why it is measured and how it is measured as will as recovery actions when performance goals are not met.
Human Performance Plant Engineering Personnel Error Rate
23
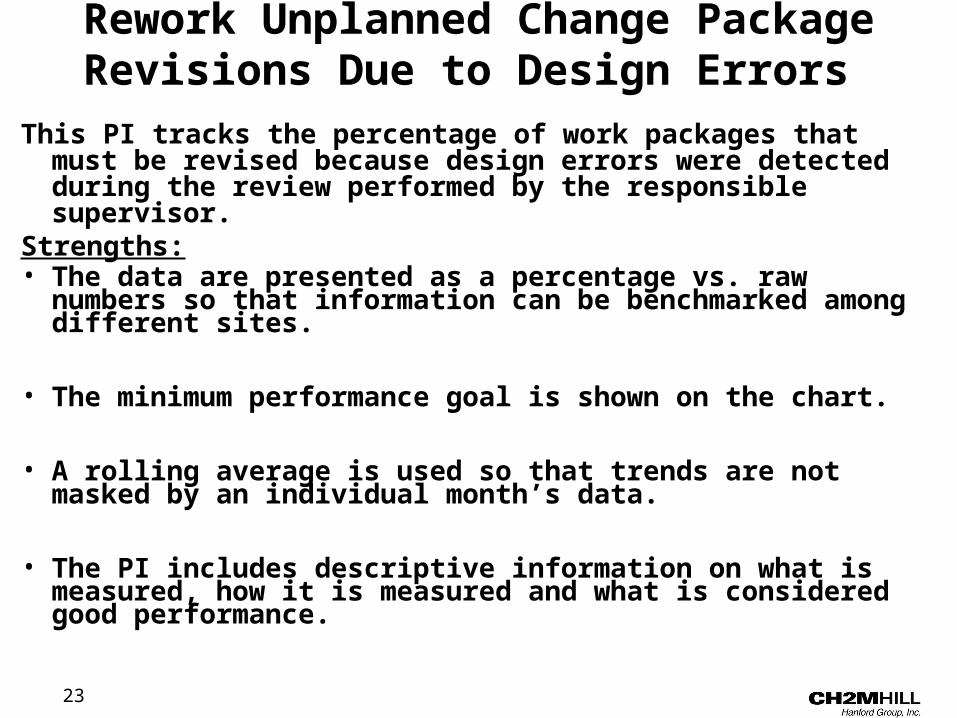
Rework Unplanned Change Package Revisions Due to Design Errors
This PI tracks the percentage of work packages that must be revised because design errors were detected during the review performed by the responsible supervisor.
Strengths:• The data are presented as a percentage vs. raw numbers
so that information can be benchmarked among different sites.
• The minimum performance goal is shown on the chart.
• A rolling average is used so that trends are not masked by an individual month’s data.
• The PI includes descriptive information on what is measured, how it is measured and what is considered good performance.
24
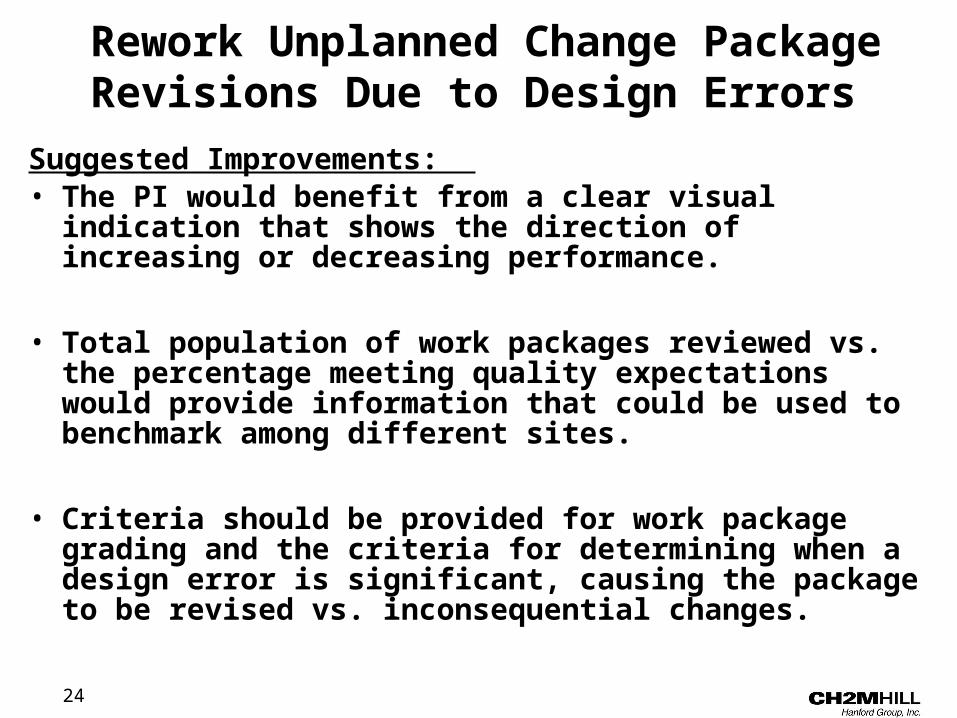
Rework Unplanned Change Package Revisions Due to Design Errors
Suggested Improvements: • The PI would benefit from a clear visual indication that
shows the direction of increasing or decreasing performance.
• Total population of work packages reviewed vs. the percentage meeting quality expectations would provide information that could be used to benchmark among different sites.
• Criteria should be provided for work package grading and the criteria for determining when a design error is significant, causing the package to be revised vs. inconsequential changes.