Embed Size (px)
Citation preview
Lean engineering performance measurement model
Amir Hossein Hejazi
A Thesis
in
The Department
of
Mechanical and Industrial Engineering
Presented in Partial Fulfillment of the Requirements
for the Degree of Master of Applied Science (Industrial Engineering) at
Concordia University
Montreal, Quebec, Canada
October 2014
© Amir Hossein Hejazi, 2014
CONCORDIA UNIVERSITY
School of Graduate Studies
This is to certify that the thesis prepared
By: Amir Hossein Hejazi
Entitled: Lean engineering performance measurement model
and submitted in partial fulfillment of the requirements for the degree of
Master of Applied Science in Industrial Engineering
complies with the regulations of the University and meets the accepted standards with respect to
originality and quality.
Signed by the final examining committee:
Dr. Akif A. Bulgak Chair
Dr. Gerard J. Gouw Examiner
Dr. Isabelle Dostaler Examiner
Dr. Nadia Bhuiyan Supervisor
Approved by ________________________________________________
Chair of Department or Graduate Program Director
________________________________________________
Dean of Faculty
Date ________________________________________________
III
Abstract
Lean engineering performance measurement model
Amir Hossein Hejazi
Today, the application of lean principles is not limited to the shop floor: it is extended to the
entire enterprise. Knowledge-based activities, in particular, product development, can
significantly benefit from the application of lean principles. R&D intensive organizations such as
aerospace have started to implement lean in their product development processes, however, the
performance measurement systems that are in place are obsolete and do not promote lean goals
and principles. These methods are not capable of measuring the benefits of adopting lean
initiatives in the product development process. In this research, a lean engineering performance
measurement (LEPM) model is developed that takes into account key lean principles and
performance indicators and measures the performance of the engineering process from a lean
perspective. This model was implemented in the engineering process of a case company to
measure and promote lean initiatives.
IV
Acknowledgements
I would like to express my sincere gratitude to my supervisor, Dr. Nadia Bhuiyan, for her
continuous guidance, support, patience, and encouragement throughout the course of this
research and also for giving me this opportunity to carry out this research.
I would also like to deeply thank my parents, my brother, and my sisters, for unconditional love
and support they provided me through my entire life, without which, none of this would have
been possible.
V
Table of Contents
List of Figures .............................................................................................................................. VII
List of Tables ............................................................................................................................. VIII
1 INTRODUCTION ................................................................................................................... 1
1.1 Background ...................................................................................................................... 1
1.2 Objectives and methodology ............................................................................................ 7
1.3 Thesis organization .......................................................................................................... 8
2 LITERATURE REVIEW ...................................................................................................... 10
2.1 Implementing lean in the product development process ................................................ 10
2.2 Lean product development ............................................................................................. 14
2.3 Summary ........................................................................................................................ 18
3 LEAN PERFORMANCE MEASUREMENT....................................................................... 19
3.1 Performance measurement system for product development ........................................ 19
3.2 Lean performance measurement literature ..................................................................... 28
3.3 Lean performance measurement gaps ............................................................................ 41
4 LEAN ENGINEERING PERFORMANCE MEASUREMENT MODEL ........................... 47
4.1 LEPM model: Introduction ............................................................................................ 47
4.2 LEPM model: Measurement process overview ............................................................. 48
4.3 LEPM model: Description and formulation ................................................................... 49
5 CASE COMPANY IMPLEMENTATION RESULTS AND ANALYSIS .......................... 68
VI
5.1 Case company description .............................................................................................. 68
5.2 Performance measurement at case company .................................................................. 69
5.3 Performance analysis and implications .......................................................................... 79
5.4 Summary ........................................................................................................................ 81
6 CONCLUSIONS, LIMITATIONS, AND FUTURE RESEARCH ...................................... 83
6.1 Conclusions .................................................................................................................... 83
6.2 Limitations and future research ...................................................................................... 86
BIBLIOGRAPHY ......................................................................................................................... 87
APPENDIX A ............................................................................................................................... 93
APPENDIX B ............................................................................................................................... 94
VII
List of Figures
Figure 1-1 Waste in engineering process (McManus, 2005) .......................................................... 4
Figure 1-2 Use of lean enablers in engineering programs (Oehmen, et al., 2012) ......................... 6
Figure 2-1 Lean product development flow framework (Oppenheim, 2004) ............................... 16
Figure 3-1 Elements of a performance measurement system for R&D (Chiesa, et al., 2009) ..... 21
Figure 3-2 Leanness definition (Bayou & Korvin, 2008) ............................................................. 30
Figure 4-1 Major inputs and outputs of LEPM model .................................................................. 48
Figure 4-2 Daily charges to tasks by engineers collected via excel sheets ................................... 49
Figure 4-3 Available working time decomposition in LEPM model ........................................... 51
Figure 4-4 Processing time decomposition in LEPM model ........................................................ 64
Figure 5-1 Percentage VA, NVA, RNVA average occurrence in a completed task (1st VS) ....... 74
Figure 5-2 Percentage NVA elements average occurrence in a completed task (1st VS) ............. 74
Figure 5-3 Percentage VA, NVA, RNVA average occurrence in a completed task (2nd
VS) ...... 78
Figure 5-4 Percentage NVA elements average occurrence in a completed task (2nd
VS) ............ 78
VIII
List of Tables
Table 2-1 Coverage of lean practices in the literature 1977–1999 (Bayou & Korvin, 2008) ....... 13
Table 2-2 Lean product development principles (Liker & Morgan, 2006) .................................. 14
Table 3-1 Major characteristics of an effective performance measurement system ..................... 27
Table 3-2 Performance metrics for lean product introduction (Haque & Moore, 2004) .............. 29
Table 3-3 Top 10 R&D metrics used by Industry in 1998 (Teresko, 2008) ................................. 34
Table 3-4 Top 10 R&D metrics used by Industry in 2008 (Teresko, 2008) ................................. 34
Table 5-1 Performance metrics calculated at individual level ...................................................... 71
Table 5-2 Performance metrics calculated at product family level .............................................. 76
Table Appendix-1 Sample of daily charges collected by Company A ......................................... 93
Table Appendix-2 Sample of calculation of model metrics using Microsoft Excel ..................... 94
1
1 INTRODUCTION
In this chapter, first, a background review is presented. Then, the objectives and the methodology
of the research are discussed. Finally, the outline of the thesis is provided in the last section.
1.1 Background
Lean, derived from the Toyota Production System (TPS), is a methodology that aims to increase
value for all stakeholders while eliminating waste. The lean implementation process starts by
identifying value, mapping the value stream (identifying required processing steps to deliver
value to the customer, including both material and information flow), and continues to create a
smooth workflow, establish pull (vs push) in the process, and seek perfection (Womack & Jones,
2003). The application of lean principles in manufacturing has shown to result in significant
improvements and savings. This success has encouraged non-manufacturing industries as well to
implement lean initiatives in their work processes to achieve the same results. Globalization,
reduction in military markets and reduced civil aircraft orders resulted in loss of profit and the
emergence of over-capacity in the aerospace market. Thus, aerospace companies also started to
rethink their existing operations and adopted lean in their organizations. In the US, Lockheed
Martin’sAeronauticsandPratt & Whitney, and in the UK, BAE Systems, were among aerospace
companies that started to adopt lean in their manufacturing operations (Crute, Ward, Brown, &
Graves, 2003).
To remain competitive in this changing economy, companies must have better quality, advanced
technology, and lower cost compared to their competitors; this characterizes a lean enterprise
(Comm & Mathaisel, 2000). Major value creation and waste elimination is not achievable by the
2
sole application of lean to the manufacturing process. Lean thinking must be fostered by the
entire organization in order to achieve a long term lean enterprise (Liker & Morgan, 2006), and
to be successful, an appropriate change strategy within the whole organization is required
(Bhasin, 2011).
A significant portion of the value that is aimed to be delivered to the customer is created in the
product development process, when the manufacturing process has not yet even started. It is in
the product development process that the product (design specifications, materials to be used,
etc.) and the processes required to manufacture and deliver the product to the final customers are
defined (Hoppmann, Rebentisch, Dombrowski, & Zahn, 2011). No matter how lean is the
manufacturing process, a poorly designed product can never create value for the final customer.
To create value, the characteristics of a product have tomeetcustomers’demand (voice of the
customer) and fulfill their requirements. Moreover, nearly 80%ofaproduct’scostisdetermined
during product design, before the start of the manufacturing process (Crute, Ward, Brown, &
Graves, 2003; McManus, Haggerty, & Murman, 2005). Therefore, to accomplish significant
benefits from lean applications, the entire enterprise must become lean and “the key is
engineering” (McManus, Haggerty, & Murman, 2005).
Knowledge-based activities such as design, product development, and new product introduction
(or generally speaking an engineering process) has great potential to benefit significantly from
the application of lean principles (Baines, Lightfoot, Williams, & Greenough, 2006; Hoppmann,
Rebentisch, Dombrowski, & Zahn, 2011; Oehmen, et al., 2012). In product development, we
deal with the most advanced products and engineering processes, however, we deal at the same
time with the design process, which is one of the most wasteful engineering efforts (Oppenheim,
2004).
3
The engineering process suffers enormously from waste. Nevertheless, since in engineering we
deal with a workflow (flow of information) that is invisible most of the time, as opposed to the
visible physical flow of products (flow of material) in manufacturing, waste is neither transparent
nor tangible as it is in manufacturing. For example holding unnecessary inventory (raw material,
work in progress, and finished products) which is considered a major source of waste in the lean
methodology, can easily be seen and quantified in a manufacturing plant by taking a walk in the
shop floor. Inventory in manufacturing is “physicallyandfinanciallyvisible” (Baines, Lightfoot,
Williams, & Greenough, 2006). However, in product development, inventory (which is in the
form of information about product specifications) is hidden, thus, there is a need to make it
transparent and quantifiable so it could be targeted for improvement.
From a lean perspective, all work activities are classified into one of the three following
categories: 1) value-added (VA): activities that create value for stakeholders, 2) required non-
value-added (RNVA): activities that do not create any value but are unavoidable and should be
minimized, or 3) non-value-added (NVA) activities: activities that do not create any value and
should be eliminated (Womack & Jones, 2003). In product development a poor performance can
waste resources, time, information/knowledge, opportunity/potential, money/invest, and
motivation of an organization (Bauch, 2004).
Large-scale engineering programs are one of the most challenging activities for any organization
to manage. U.S. Department of Defense engineering development programs exceed extensively
their budgeted cost and schedule. The largest 96 engineering programs in total incurred a roughly
300 billion dollars of added cost and incurred an average of 2 years of schedule overrun
(Oehmen, et al., 2012).
4
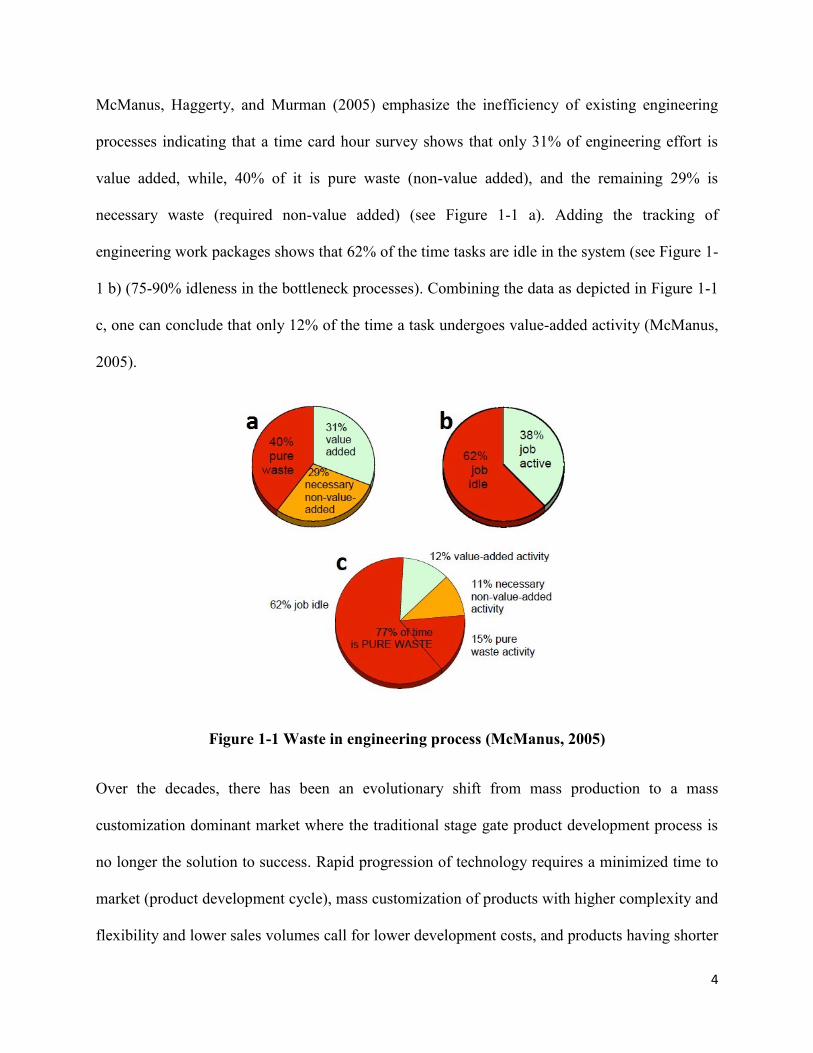
McManus, Haggerty, and Murman (2005) emphasize the inefficiency of existing engineering
processes indicating that a time card hour survey shows that only 31% of engineering effort is
value added, while, 40% of it is pure waste (non-value added), and the remaining 29% is
necessary waste (required non-value added) (see Figure 1-1 a). Adding the tracking of
engineering work packages shows that 62% of the time tasks are idle in the system (see Figure 1-
1 b) (75-90% idleness in the bottleneck processes). Combining the data as depicted in Figure 1-1
c, one can conclude that only 12% of the time a task undergoes value-added activity (McManus,
2005).
Figure 1-1 Waste in engineering process (McManus, 2005)
Over the decades, there has been an evolutionary shift from mass production to a mass
customization dominant market where the traditional stage gate product development process is
no longer the solution to success. Rapid progression of technology requires a minimized time to
market (product development cycle), mass customization of products with higher complexity and
flexibility and lower sales volumes call for lower development costs, and products having shorter
5
lifecycles leave no space for failure, requiring higher quality. Today, companies need to
continuously improve their product development performance on time, cost, and quality
dimensions to be able to survive in the market (Hoppmann, Rebentisch, Dombrowski, & Zahn,
2011). Implementing lean principles in the product development process is a solution that offers
shorter development cycles, accelerated time to market, reduced development cost, improved
manufacturability and quality of products, and fewer production start-up problems (Karlsson &
Åhlström, 1996).
About 60–90% of the total time charged to research & development tasks in aerospace and
defense programs is waste (Oppenheim, 2004). This waste can be minimized by applying lean to
product development process in the aerospace sector (Baines, Lightfoot, Williams, &
Greenough, 2006). Research conducted by UK Lean Aerospace Initiative (UK LAI) supports the
benefits of applying lean principles at different process levels to aerospace engineering processes
in both large and SME’s (Haque, 2003).
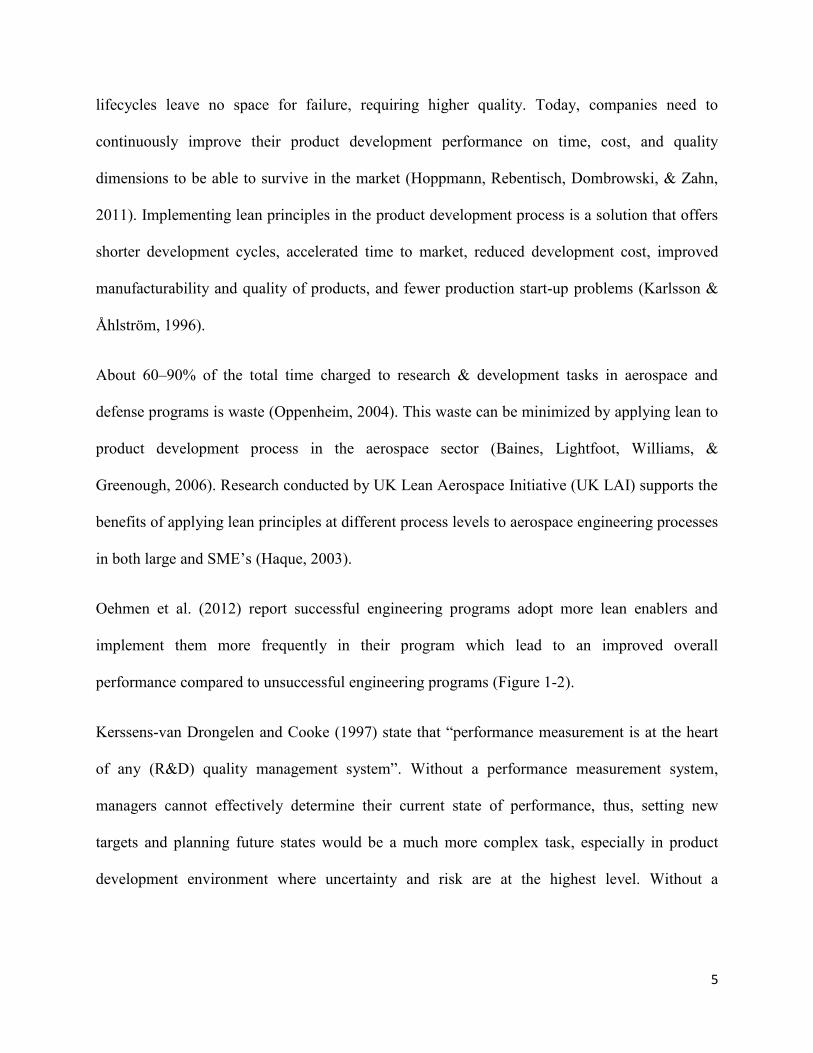
Oehmen et al. (2012) report successful engineering programs adopt more lean enablers and
implement them more frequently in their program which lead to an improved overall
performance compared to unsuccessful engineering programs (Figure 1-2).
Kerssens-van Drongelen and Cooke (1997) state that “performance measurement is at the heart
of any (R&D) quality management system”. Without a performance measurement system,
managers cannot effectively determine their current state of performance, thus, setting new
targets and planning future states would be a much more complex task, especially in product
development environment where uncertainty and risk are at the highest level. Without a
6
performance measurement system, keyquestionslike“howwellarewedoing?”, “what have we
learned?”, and“whatshouldwedointhefuture?”remainunanswered (Tatikonda, 2008).
Figure 1-2 Use of lean enablers in engineering programs (Oehmen, et al., 2012)
Performance is a function of efficiency and effectiveness. A performance measurement system
comprises a set of performance measures to quantify both the efficiency and effectiveness of
actions. (Neely, Gregory, & Platts, 2005).
The need for the development of an effective performance measurement system for product
development arose during 1990s, when market changes occurred. A performance measurement
system that could evaluate efficiency and effectiveness of research and development process
(R&D) and its alignment with strategies was needed (Chiesa, Frattini, Lazzarotti, & Manzini,
2009). Increased competitiveness, globalization, higher demand of customized products, reduced
7
product lifecycles, rapid changes in customer requirements and market trends, higher degree of
technological tools, higher speed of technology evolution, more robust standards, and
profitability are amongst characteristics of the modern product development environment which
call for an effective performance measurement system to measure and monitor product
development process (Kerssens-van Drongelen, Nixon, & Pearson, 2000).
Achieving continuous improvement and seeking perfection is a lean principle and also the
ultimate goal of any organization that wants to survive and succeed in this competitive
environment. Measurement plays a vital role in any continuous improvement method. It is
impossible to adopt and benefit from process improvement methods such as PDCA (Plan, Do,
Check, Act) or DMAIC (Define, Measure, Analyze, Improve and Control) without appropriate
data collection, measurement and analysis which are the foundational activities (constituting
check phase in PDCA or measure phase in DMAIC) in these methods. Therefore, in order to
coordinate, integrate, and manage all effort within product development process to transform into
a lean engineering environment, once the organization has defined its goals, it is important to
implement a performance measurement system that can identify the gap between current and
desired performance states and track the progress towards achieving lean goals.
1.2 Objectives and methodology
This research aims to develop a performance measurement model that can evaluate the effects of
adopting lean in the engineering process. The model presented here is based on the model
developed by Beauregard, Thomson, and Bhuiyan (2008) for an aerospace engineering company.
The focus is to improve the model in terms of measurement and applicability in order to
8
implement it in any type of engineering work regardless of the industry or size of the
organization, to effectively measure and promote lean engineering performance.
First, lean principles, tools, technique, and goals in product development were studied. Second,
literature on requirements of a performance measurement model for product development and
relative work in the field of lean product development performance measurement were examined
and gaps and opportunities were identified. Third, the engineering effort was analyzed in order to
identify hidden waste in engineering process and enable differentiating between value-added,
non-value-added, and required non-value-added elements of engineering effort. Finally, the
model developed by Beauregard, Thomson, and Bhuiyan (2008) was analyzed and modified in
order to improve its performance measurement effectivity and extend its applicability.
Model equations are modified to improve the model. To measure performance, total waste
incurred while processing tasks in a value stream is taken into account while the original model
takes into account waste for completed tasks. New performance measures are developed that
account for wasteful aspects of engineering work which are unique to the engineering process
and had received no attention in the existing publications. Moreover, a decomposition chart is
developed for available working time so as to enable the discrimination of waste from value-
added part of engineering effort.
1.3 Thesis organization
The research presented in this thesis is organized in six chapters. In second chapter, the literature
on the lean product development is reviewed. In third chapter, existing literature and work in the
field of lean performance measurement is discussed and the gaps and opportunities are identified.
The lean engineering performance measurement model developed in this research is presented in
9
chapter four. Chapter five provides the results of implementing the model in an engineering
company to measure lean engineering performance. Finally, in chapter six, conclusions,
limitations, and opportunities for future research are presented.
10
2 LITERATURE REVIEW
In this chapter, a review of the lean product development literature is presented.
2.1 Implementing lean in the product development process
Lean product development is capable of addressing emerging issues in the market. However, the
application of lean to the product development process has been lacking (Baines, Lightfoot,
Williams, & Greenough, 2006; Haque, 2003; Haque & Moore, 2004). This can be partly due to
the fact that application of lean principles to functions other than manufacturing, where we deal
with low volume, highly customized products, is a challenge. However, this lower volume may
enhance the achievement of a single piece flow which is one of the five lean principles (Crute,
Ward, Brown, & Graves, 2003).
In order to successfully implement lean, traditional systems, practices, and behavior must be
changed within the organization (Baines, Lightfoot, Williams, & Greenough, 2006). In the lean
transformation process, speed of change and results are not the same in every company (Soriano-
Meier & Forrester, 2002). Factors such as change strategy (targeted vs. holistic), company
culture, product focus, senior management commitment and consistency of focus, time and space
for performance improvements (Crute, Ward, Brown, & Graves, 2003), piecemeal adoption of
lean components, and contextual factors (Fullerton & Wempe, 2009) cause variations in
performance effects.
The problem with applying lean to firms operating in high variability, low volume environments
arises when a tool-based approach to lean is taken (Lander & Liker, 2007). Many companies that
had success in lean manufacturing, adopt only some lean tools in their product development
11
process as a short term solution (Liker & Morgan, 2006). According to Browning (2000), there
are two approaches to getting lean: liposuction approach and exercise approach. In the
liposuction approach, the emphasis is on removing non-value-added activities by performing
only some kaizen events. In the exercise approach, the focus is on maximizing value by ensuring
the quality of input as well as the process itself, so that the value of the product is maximized.
Adopting some lean tools such as Kanban, Heijunka, 5S, and poke-yoke, will not assure
continuous improvement. Results from such discrete application of lean tools are not significant
(Baines, Lightfoot, Williams, & Greenough, 2006). Rather than applying some lean tools and
techniques in a piecemeal manner, lean should be adopted in a holistic manner (Crute, Ward,
Brown, & Graves, 2003; Karlsson & Åhlström, 1996; Hoppmann, Rebentisch, Dombrowski, &
Zahn, 2011). Implementing some lean techniques is not enough for accomplishing lean product
development (Karlsson & Åhlström, 1996). This tool-based approach to lean is more common in
western organizations that view lean as a set of tools and techniques. In Japanese companies,
lean is treated as a culture and philosophy that is applied throughout the whole organization
(Baines, Lightfoot, Williams, & Greenough, 2006). Sole focus on waste removal cannot identify
root causes of waste. To maximize value, no matter how lean the activities, the structure of
product development (the sequencing and coordination of activities and deliverables) should also
become lean (Browning, 2000).
Bhasin (2011) stresses the importance of lean implementation as a philosophy. He argues that
organizations that implement lean as a philosophy have better overall performance with respect
to those only implementing some lean tools. Fewer barriers, wider application of lean across the
organization, wider tool application, an appropriate culture, and lean change strategy are among
common characteristics of such organizations.
12
Shah and Ward (2003) did research to examine the effects of three contextual factors namely
plant size, plant age and unionization status on the implementation of 22 lean manufacturing
practices. They combined those 22 practices in order to form four lean bundles of interrelated
lean practices, i.e. just-in-time (JIT), total quality management (TQM), total preventive
maintenance (TPM), and human resource management (HRM). They studied the effects of
implementing such bundles on operational performance. Based on the literature review, they
developed the following four propositions to test: 1) unionized plants are less likely to implement
lean manufacturing practices than nonunionized or partially unionized plants; 2) older plants are
less likely to implement lean manufacturing practices than newer plants; 3) large manufacturers
are more likely to implement lean practices than small manufacturers; 4) implementation of lean
bundles, each representing groups of related lean practices, will have a positive impact on
operational performance. They empirically examined these propositions using sample data from
Industry Week’sCensusofManufacturers.
Shah and Ward (2003) revealed that contextual factors in an organization such as plant size,
plant age and unionization status significantly influence the implementation of lean practices but
to different extents, where, the influence of plant size seems to be more substantial than others.
Their results reveal that implementation of lean practices as lean bundles contribute substantially
to the operating performance which supports the previously discussed studies regarding
systematic use of lean practices. They argue that regardless of contextual factors, companies that
implement lean practices in bundles have performance advantage over those that implement
individual lean practices.
13
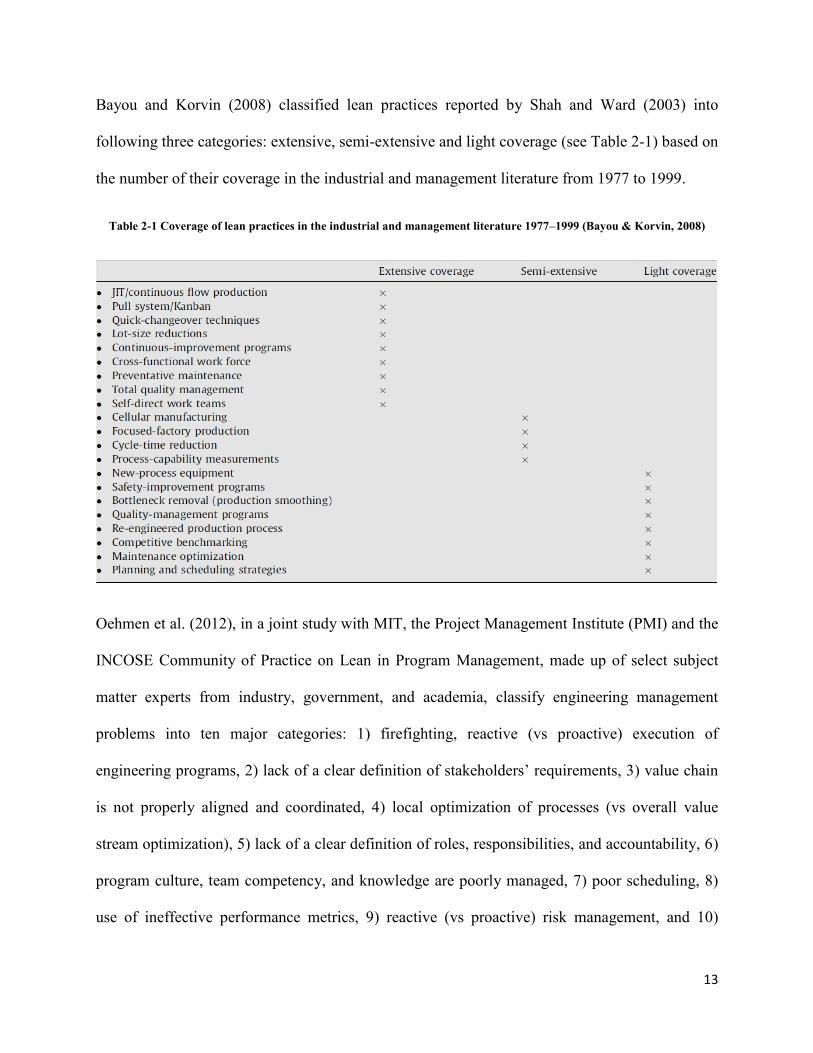
Bayou and Korvin (2008) classified lean practices reported by Shah and Ward (2003) into
following three categories: extensive, semi-extensive and light coverage (see Table 2-1) based on
the number of their coverage in the industrial and management literature from 1977 to 1999.
Table 2-1 Coverage of lean practices in the industrial and management literature 1977–1999 (Bayou & Korvin, 2008)
Oehmen et al. (2012), in a joint study with MIT, the Project Management Institute (PMI) and the
INCOSE Community of Practice on Lean in Program Management, made up of select subject
matter experts from industry, government, and academia, classify engineering management
problems into ten major categories: 1) firefighting, reactive (vs proactive) execution of
engineering programs, 2) lackofacleardefinitionofstakeholders’requirements,3) value chain
is not properly aligned and coordinated, 4) local optimization of processes (vs overall value
stream optimization), 5) lack of a clear definition of roles, responsibilities, and accountability, 6)
program culture, team competency, and knowledge are poorly managed, 7) poor scheduling, 8)
use of ineffective performance metrics, 9) reactive (vs proactive) risk management, and 10)
14
improper program acquisition and contracting practices. They argue that lean practices can be
implemented to correct and prevent such problems and identify the best in class lean practices to
address such engineering management problems. They propose 43 lean enablers with 286
subenablers and categorize these practices into 6 categories referring to the lean principle that the
practice aims to promote (sixth principle used in their categorization is respect for people).
2.2 Lean product development
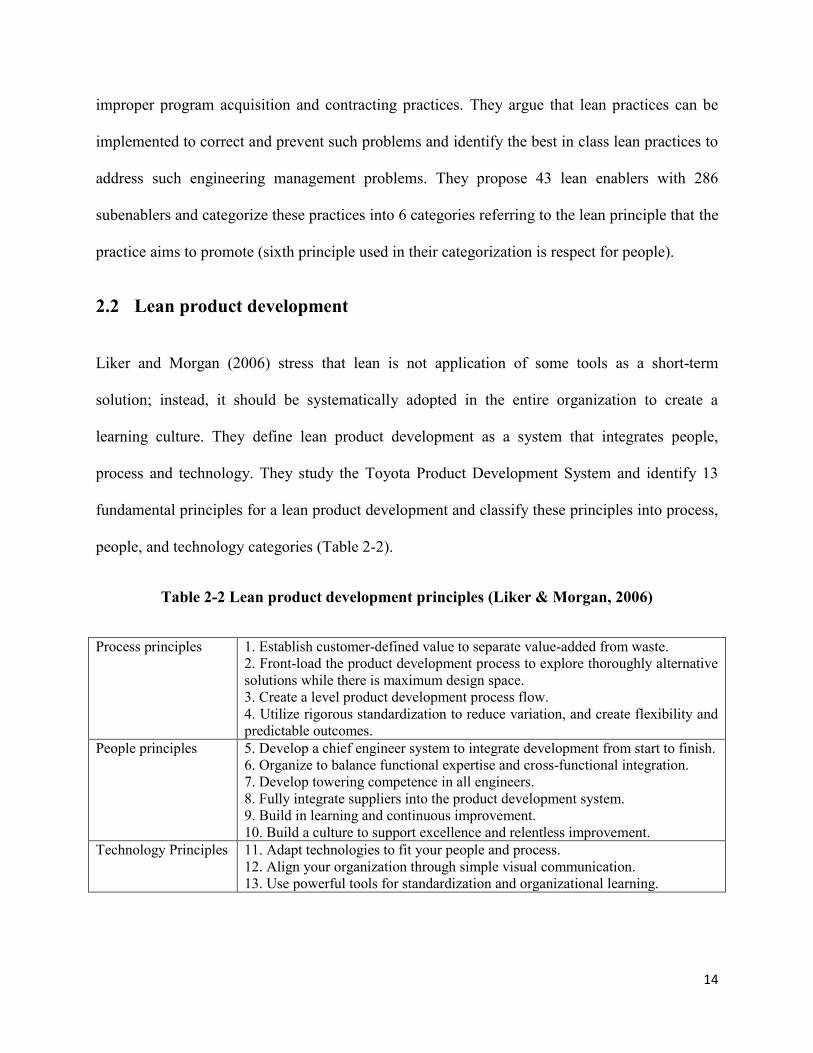
Liker and Morgan (2006) stress that lean is not application of some tools as a short-term
solution; instead, it should be systematically adopted in the entire organization to create a
learning culture. They define lean product development as a system that integrates people,
process and technology. They study the Toyota Product Development System and identify 13
fundamental principles for a lean product development and classify these principles into process,
people, and technology categories (Table 2-2).
Table 2-2 Lean product development principles (Liker & Morgan, 2006)
Process principles 1. Establish customer-defined value to separate value-added from waste.
2. Front-load the product development process to explore thoroughly alternative
solutions while there is maximum design space.
3. Create a level product development process flow.
4. Utilize rigorous standardization to reduce variation, and create flexibility and
predictable outcomes.
People principles 5. Develop a chief engineer system to integrate development from start to finish.
6. Organize to balance functional expertise and cross-functional integration.
7. Develop towering competence in all engineers.
8. Fully integrate suppliers into the product development system.
9. Build in learning and continuous improvement.
10. Build a culture to support excellence and relentless improvement.
Technology Principles 11. Adapt technologies to fit your people and process.
12. Align your organization through simple visual communication.
13. Use powerful tools for standardization and organizational learning.
15
According to Karlsson and Åhlström (1996), lean product development is a system of
interrelated techniques including supplier involvement, simultaneous engineering (concurrent
engineering), use of cross-functional teams, integration (as opposed to coordination) of various
functional aspects of the project, use of a heavyweight team structure, and strategic management
of projects. They carry out a longitudinal study to identify hindering and supporting factors to
implementation of lean in product development process.
McManus, Haggerty, and Murman (2005) define goals of lean engineering as creating the right
products, with effective lifecycle and enterprise integration, using efficient engineering processes
and explain a number of lean engineering techniques for achievement of each goal. They also
discuss the results of applying those lean engineering techniques to aerospace programs.
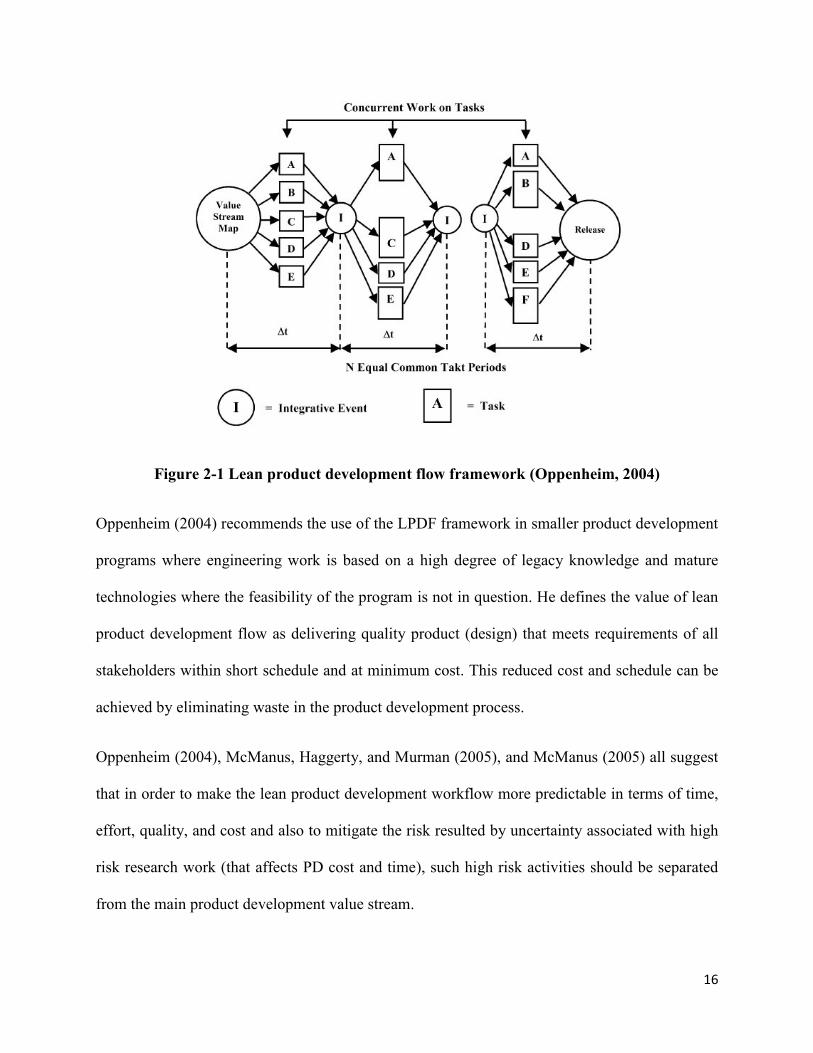
In an effort to apply lean to engineering work of the product development process, Oppenheim
(2004) developed a general framework based on lean principles called lean product development
flow (LPDF). To create smooth flow throughout the engineering value stream, he proposes
parsing the engineering work into short and equal takt periods of 1 week, each ending in an
integrative event. This type of scheduling requires dynamic allocation of resources depending on
the effort required for each task. Figure 2-1 depicts the lean product development flow
framework. By splitting traditionally long and continuous engineering work into shorter and
equal subtasks, the author attempts to minimize the batch size in product development as in the
case of lean production. He argues shorter takt periods and frequent review events would reduce
waste, error discovery time, and information churning in product development.
16
Figure 2-1 Lean product development flow framework (Oppenheim, 2004)
Oppenheim (2004) recommends the use of the LPDF framework in smaller product development
programs where engineering work is based on a high degree of legacy knowledge and mature
technologies where the feasibility of the program is not in question. He defines the value of lean
product development flow as delivering quality product (design) that meets requirements of all
stakeholders within short schedule and at minimum cost. This reduced cost and schedule can be
achieved by eliminating waste in the product development process.
Oppenheim (2004), McManus, Haggerty, and Murman (2005), and McManus (2005) all suggest
that in order to make the lean product development workflow more predictable in terms of time,
effort, quality, and cost and also to mitigate the risk resulted by uncertainty associated with high
risk research work (that affects PD cost and time), such high risk activities should be separated
from the main product development value stream.
17
There is not yet a consensus on the definition of lean in product development. For example, a
shift from focusing on waste reduction towards focusing on value creation is emerging in
publications (Baines, Lightfoot, Williams, & Greenough, 2006). Browning (2000) points out that
in product development, lean is not minimizing cost, cycle time, or waste, instead, lean is
maximizing value for the customers within the constraints of all stakeholders. He argues that
value in product development is not necessarily increased by removing activities, sometimes
more activities are required to increase value. He indicates that in the product development
process, producing useful information creates value and due to the iterative nature of product
development activities, the most important factor to add value is getting the right information in
the right place at the right time. He adds that to deliver value which is a function of product
performance, affordability, and availability, a lean product development process is required
which can affect all these three dimensions.
Hoppmann, Rebentisch, Dombrowski, and Zahn (2011) argue that existing definitions of lean
product development are not consistent and assert that current empirical research in this area is
weak. They define lean as a system that comprises a set of highly interrelated and interdependent
components. To integrate existing work on lean product development into a consistent
framework, they use content analysis to study 27 lean product development publications and
derive 11 major components for lean product development as follows: 1) strong project manager,
2) specialist career path, 3) workload leveling, 4) responsibility-based planning and control, 5)
cross-project knowledge transfer, 6) simultaneous engineering, 7) supplier integration, 8) product
variety management, 9) rapid prototyping, simulation and testing, 10) process standardization,
and 11) set-based engineering.
18
2.3 Summary
From the literature review it is clear that to achieve a lean product development process, a
holistic view of lean should be taken (Karlsson & Åhlström, 1996; Browning, 2000; Crute,
Ward, Brown, & Graves, 2003; Oppenheim, 2004; McManus, Haggerty, & Murman, 2005;
Baines, Lightfoot, Williams, & Greenough, 2006; Lander & Liker, 2007; Hoppmann,
Rebentisch, Dombrowski, & Zahn, 2011). To make the transition from a traditional stage gate
product development process to a lean process, a number of tools and techniques have been
developed and introduced over the years. Nonetheless, the remaining issue is selecting the
appropriate ones and adapting them for implementation in the lean transformation process and
evaluating the effect of such implementation on product development performance in order to
measure the progress achieved towards leanness. In order to successfully apply lean especially to
a new environment as engineering, a principle-based approach should be taken. Lean should be
understood as a socio-technical system and the progress made should be measured to be
consistent with its principles (Lander & Liker, 2007). Therefore a model capable of measuring
performance of product development process with respect to lean principles is required.
19
3 LEAN PERFORMANCE MEASUREMENT
In this chapter, a review of the research in the field of lean performance measurement is
presented and gaps and opportunities are identified and discussed.
3.1 Performance measurement system for product development
A number of researchers studied the design of a performance measurement system for the
research and development process and identified the challenges associated with it. Product
development environment has high level of uncertainty, risk, and fuzzy, delayed, intangible, and
non-repetitive outcomes which make performance measurement a challenging activity (Chiesa &
Masella, 1996; Brown & Svenson, 1998; Kerssens-van Drongelen, Nixon, & Pearson, 2000;
Driva, Pawar, & Menon, 2001; Mascarenhas Hornos da Costa, Oehmen, Rebentisch, &
Nightingale, 2014).
Kerssens-van Drongelen, Nixon, and Pearson (2000) defined the following factors as problems
associated with designing a performance measurement system for R&D: complexity of
separating and identifying the contribution of R&D department (apart from other functions) to
company performance, R&D outputs being intangible and hard to quantify, the difficulty of
identifying exact relations between R&D final outcomes, intermediate outputs, and inputs, the
delay between the end of R&D efforts and recognizing its outcome in the market, determining
the right metrics for measurement and the right standards to measure performance against, and
the acceptance of such systems in an R&D environment.
Kuczmarski (2001) asserts that having a great number of metrics, excessive concentration on the
outcomes of the process, irregular measurement of metrics, focusing more on reducing costs
20
rather than increasing value, lack of a learning culture and the existence of a blame culture in the
company will result in the failure of the implementation of a performance measurement system
in innovative based activities.
As reported by Meyer, the following features should be considered in the design of a
performance measurement system: 1) the primary objective of the measurement should be
providing engineers with information to improve their performance (and not the managers), 2)
engineers should be involved in the design of their own performance measurement system, 3)
metrics should be able to measure cross functional process performance, and 4) having too many
metrics should be avoided (as cited in Parry & Turner, 2006).
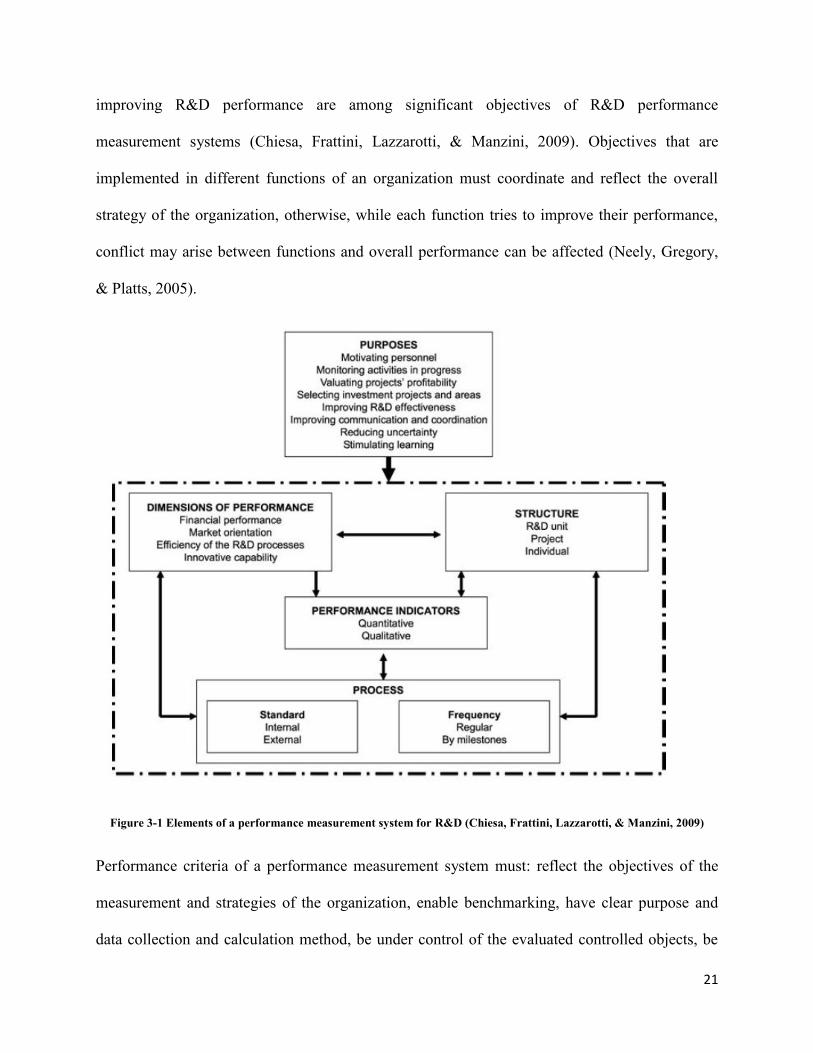
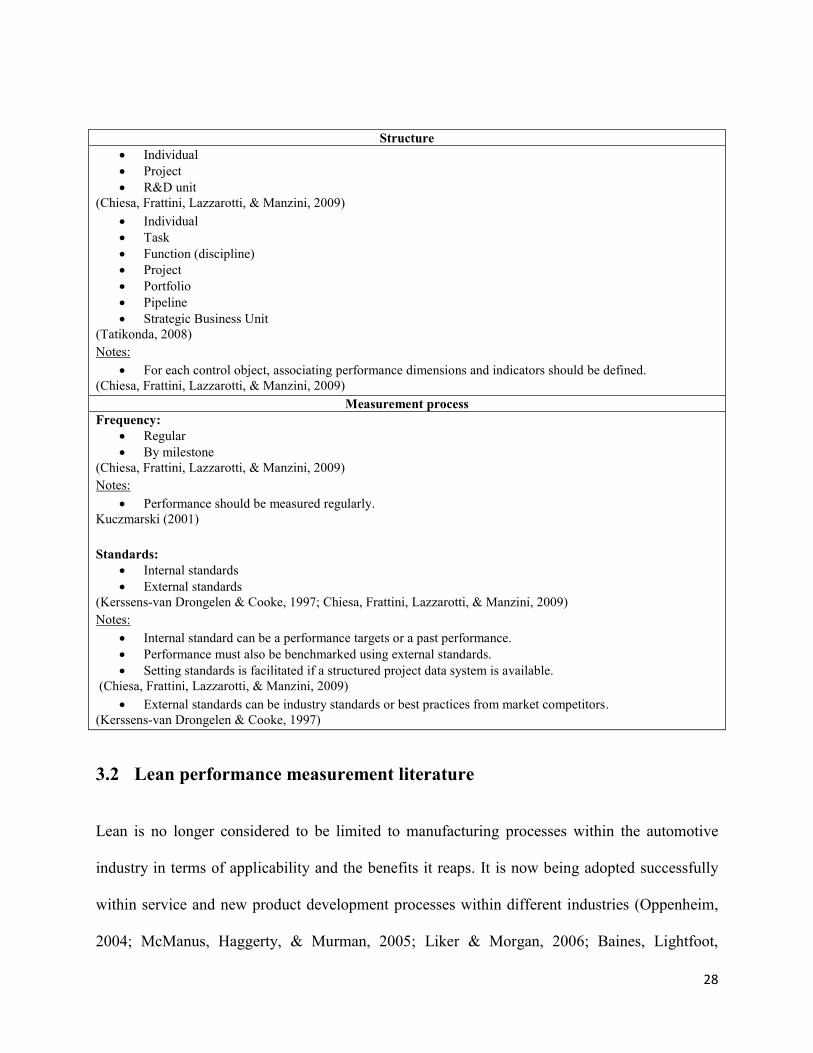
According to the literature review conducted by Chiesa, Frattini, Lazzarotti, and Manzini (2009),
a performance measurement system for R&D comprises five major elements namely: 1)
measurement objectives, 2) dimensions of performance, 3) indicators with which performance
dimensions are measured, 4) structure (control objects whose performance is measured), and 5)
measurement process (measurement frequency and standards). These elements, illustrated in
Figure 3-1, are highly interconnected and interdependent in their design. For example, a change
in the objective can affect measurement frequency and analysis process (Kerssens-van
Drongelen & Cooke, 1997).
Identifying the objectives of measurement is the predominant step for designing an R&D
performance measurement system. Designs of other elements are highly affected by the
objectives selected (Kerssens-van Drongelen & Cooke, 1997; Chiesa, Frattini, Lazzarotti, &
Manzini, 2009). Diagnosing activity to support decision making, motivating personnel,
enhancing communication and coordination, learning, reducing R&D risks and uncertainty, and
21
improving R&D performance are among significant objectives of R&D performance
measurement systems (Chiesa, Frattini, Lazzarotti, & Manzini, 2009). Objectives that are
implemented in different functions of an organization must coordinate and reflect the overall
strategy of the organization, otherwise, while each function tries to improve their performance,
conflict may arise between functions and overall performance can be affected (Neely, Gregory,
& Platts, 2005).
Figure 3-1 Elements of a performance measurement system for R&D (Chiesa, Frattini, Lazzarotti, & Manzini, 2009)
Performance criteria of a performance measurement system must: reflect the objectives of the
measurement and strategies of the organization, enable benchmarking, have clear purpose and
data collection and calculation method, be under control of the evaluated controlled objects, be
22
objective rather than subjective, and be selected by involving people influenced by measurement
(Neely, Gregory, & Platts, 2005).
Performance can be measured in four dimension as follows: 1) financial, accounts for
profitability of R&D, 2) market orientation, refers to conformance of R&D deliverables to voice
of customers, 3) efficiency, measures performance of R&D in terms of time, effort, and cost in
the process of delivering outputs, and 4) innovative capability, evaluates knowledge developed
by R&D (Chiesa, Frattini, Lazzarotti, & Manzini, 2009).
Identification of the right performance measures will enhance measurement implementation
since they can provide enhanced visibility, a change of attitude, and a clearer customer oriented
focus for employees and managers (Crute, Ward, Brown, & Graves, 2003). According to
Maskell, performance metrics of world class manufacturing companies all have the following
primary features in common: metrics are aligned with manufacturing strategy, non-financial
metrics are included, different measurement methods are used to suit different areas of
application, metrics are easy to use and provide fast feedback, metrics are updated, instead of a
focus on monitoring, metrics are implemented to improve performance (as cited in Parry &
Turner, 2006).
In a performance measurement system, metrics can be qualitative, quantitative, or a combination
of the two. In terms of accuracy, reliability, and comparability, quantitative methods are more
effective. Qualitative measurements are affected by the subjectivity of the person executing the
evaluation, therefore, results can be highly subject to personal preference and bias (Kerssens-van
Drongelen & Cooke, 1997; Tatikonda, 2008; Chiesa, Frattini, Lazzarotti, & Manzini, 2009).
Hence, qualitative metrics should be used in balance with quantitative metrics to reduce such
23
side effects while sustaining the ability to evaluate unmeasurable dimensions of performance in a
product development environment (Chiesa, Frattini, Lazzarotti, & Manzini, 2009).
Metrics selected for performance measurement should suit the measurement objective as well as
other components of the performance measurement system as these components are highly
interdependent. To facilitate metric selection, Kerssens-van Drongelen, Nixon, and Pearson
(2000) developed a taxonomy for R&D metrics using a cubic model and positioned metrics that
were mentioned in existing industrial R&D publications. Criteria used for categorization of
metrics are: time span covered (metrics referring to performance in the distant past, recent past,
near future, or far future), performance aspects (metrics referring to general, quality,
innovativeness, timeliness, cost, or quantity aspect), and the closeness to organizational goals
(metrics referring to inputs, activities, outputs, or outcomes).
Financial performance metrics are more popular than non-financial metrics (Driva, Pawar, &
Menon, 2001; Kerssens-van Drongelen, Nixon, & Pearson, 2000). Financial metrics are more
effective to show profitability from a high level perspective, but these measures do not reflect
efficiency level utilized to achieve such profit and due to the nature of new product development
activities, these indicators are lagging. In order to be able to fully benefit from performance
measurement, different types of metrics should be linked and used in combination, which seems
to be lacking in existing work in this area (Driva, Pawar, & Menon, 2001; Soriano-Meier &
Forrester, 2002). This combination must focus on the product development process as well as its
outputs to enable the measurement of tangible and intangible organization assets (Haque &
Moore, 2004).
24
A performance measurement system must link organizational strategies at the corporate level to
actions at the operational level. Parry and Turner (2006) argue that financial measures are
lagging, outcome focused, and can be misinterpreted. These indicators are not sufficient to
measure business performance and they cannot promote lean thinking. Use of a financial metric
such as return on investment to evaluate product development process performance has its own
complexities. It is difficult to assess the amount of profit that results from the product
development process as a separate function. Moreover, this profit does not occur at the end of the
product development process and there is a delay until this profit is made and the results are
available for performance measurement. It may take years to launch a product into the market
after it is developed (Chiesa & Masella, 1996; Kerssens-van Drongelen & Cooke, 1997). To
improve performance measurement, a combination of financial and non-financial measures must
be used (Parry & Turner, 2006; Fullerton & Wempe, 2009).
Defining correct norms and standards to measure performance against is a big challenge,
especially in R&D (Kerssens-van Drongelen & Cooke, 1997; Chiesa, Frattini, Lazzarotti, &
Manzini, 2009). R&D activities are classified as a project type of work, a non-repetitive process
which delivers a unique output, compared to manufacturing work that is classified as operation
type of work and is an ongoing repetitive process aimed to produce the same output each time.
This adds to the complexity of defining proper standards to enable benchmarking as well as
defining new targets in this environment. However, in product development as opposed to basic
research, most of the processing steps are based on the legacy knowledge and are known
beforehand (Kerssens-van Drongelen & Cooke, 1997).
Performance standards can either be internal or external. Internal standards can be targets set for
performance or be a previous established performance derived from performance records
25
(Chiesa, Frattini, Lazzarotti, & Manzini, 2009). External standards can be industry standards or
best practices from market competitors that are used for benchmarking (Kerssens-van Drongelen
& Cooke, 1997). A high amount of complexity, risk, uncertainty, variability, diversity, and
uniqueness of products and services in R&D environment together with the lack of interest of
firms to share information with the outside world (due to sensitivity of information and
confidentiality reasons) make defining external standards to measure performance against very
complex and rare. Therefore, companies tend to use internal standards to benchmark
performance (Driva, Pawar, & Menon, 2000; Chiesa, Frattini, Lazzarotti, & Manzini, 2009;
Driva, Pawar, & Menon, 2001). Comm and Mathaisel (2000) define lack of time, lack of
resources, and the existence of a competitive market as benchmarking barriers. Proper
performance measurement and documentation of performance data enables development of
appropriate standards and improves accuracy of future forecast of performance (Kerssens-van
Drongelen & Cooke, 1997).
Measurement frequency depends on key elements of a performance measurement system as well
as the level at which performance is measured, resources that are required for measurement, and
the cost associated with measurement. For example, Measurements at process level are done
more frequently than the measurements at organizational level. Measurements are usually carried
out before reaching to or at the project’smilestonesoronaregularperiodicbasis(e.g.weekly,
monthly, quarterly, and yearly) (Chiesa, Frattini, Lazzarotti, & Manzini, 2009).
In a study to examine the differences between the performance measurement systems in research
(basic and applied research) and in new product development, Chiesa, Frattini, Lazzarotti, and
Manzini (2009) found no significant difference between the elements (monitored performance,
control objects, frequency, indicators, and standards) of the two types of systems based on their
26
empirical research. However, they stress that personnel motivation seems to be of higher
importance as an objective for the research activities and project profitability measurement
seems to be of higher importance as an objective for the development activities. Kerssens-van
Drongelen and Cooke (1997) indicate that research and development activities are different in
nature, but report no differences between the measurement methods in applied research and in
product development based on their empirical research.
Kerssens-van Drongelen, Nixon, and Pearson (2000) divide performance measurement methods
into quantitative (based on computation), qualitative (based on assessment) and semi-quantitative
(based on ratings that convert judgment into values) methods. They further subdivide
quantitative methods into financial method and nonfinancial method. Based on the degree of
objectivity or subjectivity of measurement and individuals performing measurement, they
classify performance measurement methods in the literature into four following categories:
subjective measurement, semi-objective customers’measurement, semi-objective non-involved
person measurement, and objective.
There exist some misconceptions that measuring product development productivity may be in
contrast with its nature and constraints creativity and demotivates engineers. These
misconceptions can be a result of people that fear the measurement of performance will put
stress on their inadequacies and lack of productivity or they doubt benefits of such evaluation
owing to a previous failure in performance measurement (Brown & Svenson, 1998). In
knowledge intensive work like engineering design, demotivation occurs when a performance
measurement system is applied inappropriately or it is used simply to control performance
without promoting continuous improvement (Parry & Turner, 2006). Resistance to change can
also demotivate benchmarking (Comm & Mathaisel, 2000).
27
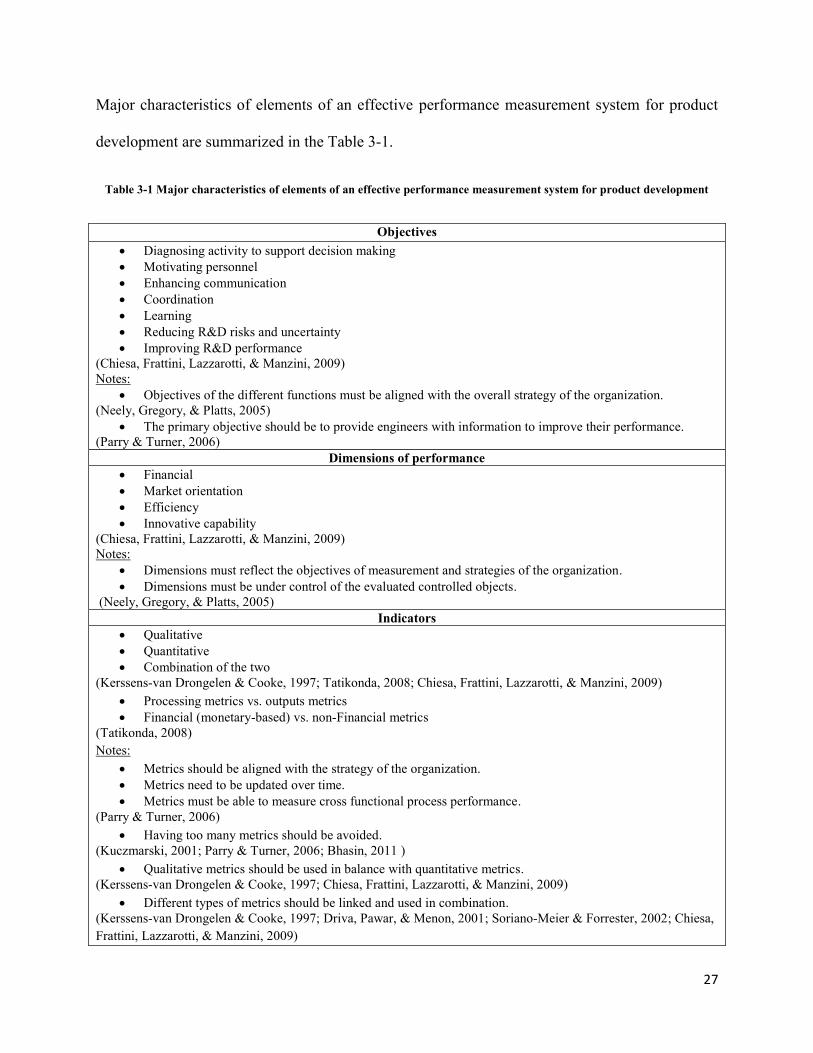
Major characteristics of elements of an effective performance measurement system for product
development are summarized in the Table 3-1.
Table 3-1 Major characteristics of elements of an effective performance measurement system for product development
Objectives
Diagnosing activity to support decision making
Motivating personnel
Enhancing communication
Coordination
Learning
Reducing R&D risks and uncertainty
Improving R&D performance
(Chiesa, Frattini, Lazzarotti, & Manzini, 2009)
Notes:
Objectives of the different functions must be aligned with the overall strategy of the organization.
(Neely, Gregory, & Platts, 2005)
The primary objective should be to provide engineers with information to improve their performance.
(Parry & Turner, 2006)
Dimensions of performance
Financial
Market orientation
Efficiency
Innovative capability
(Chiesa, Frattini, Lazzarotti, & Manzini, 2009)
Notes:
Dimensions must reflect the objectives of measurement and strategies of the organization.
Dimensions must be under control of the evaluated controlled objects.
(Neely, Gregory, & Platts, 2005)
Indicators
Qualitative
Quantitative
Combination of the two
(Kerssens-van Drongelen & Cooke, 1997; Tatikonda, 2008; Chiesa, Frattini, Lazzarotti, & Manzini, 2009)
Processing metrics vs. outputs metrics
Financial (monetary-based) vs. non-Financial metrics
(Tatikonda, 2008)
Notes:
Metrics should be aligned with the strategy of the organization.
Metrics need to be updated over time.
Metrics must be able to measure cross functional process performance.
(Parry & Turner, 2006)
Having too many metrics should be avoided.
(Kuczmarski, 2001; Parry & Turner, 2006; Bhasin, 2011 )
Qualitative metrics should be used in balance with quantitative metrics.
(Kerssens-van Drongelen & Cooke, 1997; Chiesa, Frattini, Lazzarotti, & Manzini, 2009)
Different types of metrics should be linked and used in combination.
(Kerssens-van Drongelen & Cooke, 1997; Driva, Pawar, & Menon, 2001; Soriano-Meier & Forrester, 2002; Chiesa,
Frattini, Lazzarotti, & Manzini, 2009)
28
Structure
Individual
Project
R&D unit
(Chiesa, Frattini, Lazzarotti, & Manzini, 2009)
Individual
Task
Function (discipline)
Project
Portfolio
Pipeline
Strategic Business Unit
(Tatikonda, 2008)
Notes:
For each control object, associating performance dimensions and indicators should be defined.
(Chiesa, Frattini, Lazzarotti, & Manzini, 2009)
Measurement process
Frequency:
Regular
By milestone
(Chiesa, Frattini, Lazzarotti, & Manzini, 2009)
Notes:
Performance should be measured regularly.
Kuczmarski (2001)
Standards:
Internal standards
External standards
(Kerssens-van Drongelen & Cooke, 1997; Chiesa, Frattini, Lazzarotti, & Manzini, 2009)
Notes:
Internal standard can be a performance targets or a past performance.
Performance must also be benchmarked using external standards.
Setting standards is facilitated if a structured project data system is available.
(Chiesa, Frattini, Lazzarotti, & Manzini, 2009)
External standards can be industry standards or best practices from market competitors.
(Kerssens-van Drongelen & Cooke, 1997)
3.2 Lean performance measurement literature
Lean is no longer considered to be limited to manufacturing processes within the automotive
industry in terms of applicability and the benefits it reaps. It is now being adopted successfully
within service and new product development processes within different industries (Oppenheim,
2004; McManus, Haggerty, & Murman, 2005; Liker & Morgan, 2006; Baines, Lightfoot,
29
Williams, & Greenough, 2006; Parry & Turner, 2006; Soriano-Meier & Forrester, 2002).
Organizations within aerospace sector have also started to implement lean in their product
development process (Haque & Moore, 2004). Nonetheless, a performance measurement system
that embeds lean principles and has the ability to evaluate efficiency of existing engineering
approaches and processes with respect to lean is lacking (Haque & Moore, 2004).
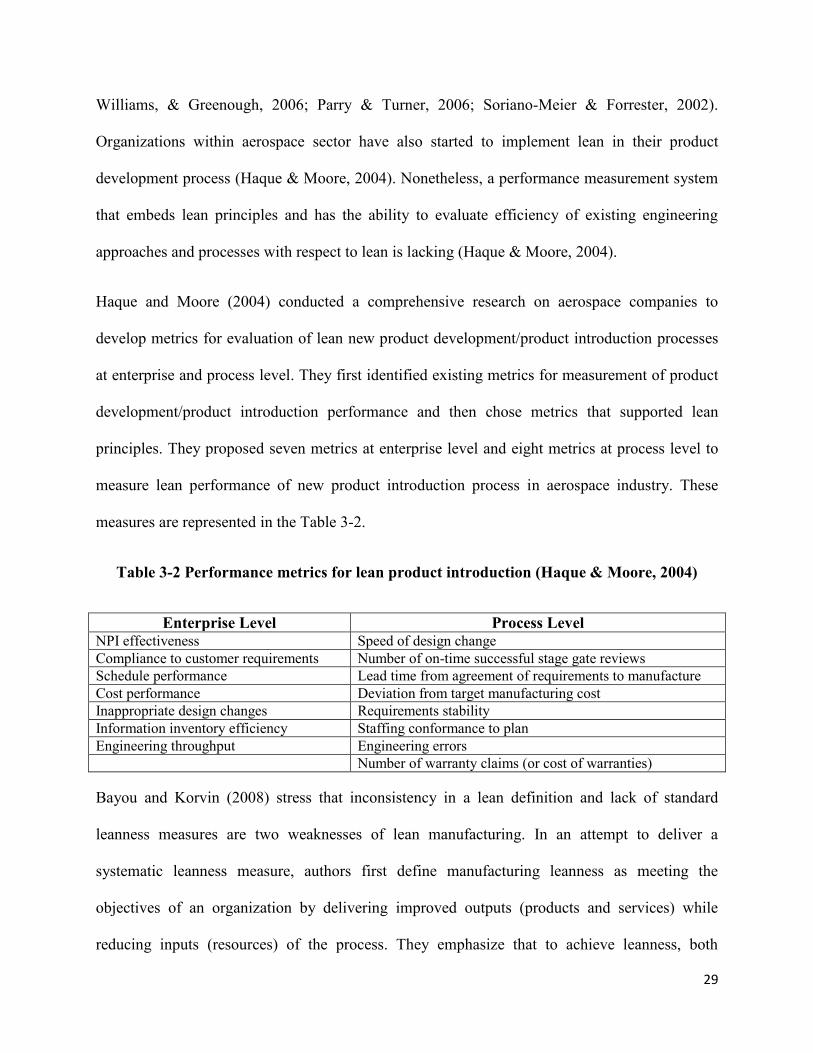
Haque and Moore (2004) conducted a comprehensive research on aerospace companies to
develop metrics for evaluation of lean new product development/product introduction processes
at enterprise and process level. They first identified existing metrics for measurement of product
development/product introduction performance and then chose metrics that supported lean
principles. They proposed seven metrics at enterprise level and eight metrics at process level to
measure lean performance of new product introduction process in aerospace industry. These
measures are represented in the Table 3-2.
Table 3-2 Performance metrics for lean product introduction (Haque & Moore, 2004)
Enterprise Level Process Level NPI effectiveness Speed of design change
Compliance to customer requirements Number of on-time successful stage gate reviews
Schedule performance Lead time from agreement of requirements to manufacture
Cost performance Deviation from target manufacturing cost
Inappropriate design changes Requirements stability
Information inventory efficiency Staffing conformance to plan
Engineering throughput Engineering errors
Number of warranty claims (or cost of warranties)
Bayou and Korvin (2008) stress that inconsistency in a lean definition and lack of standard
leanness measures are two weaknesses of lean manufacturing. In an attempt to deliver a
systematic leanness measure, authors first define manufacturing leanness as meeting the
objectives of an organization by delivering improved outputs (products and services) while
reducing inputs (resources) of the process. They emphasize that to achieve leanness, both
30
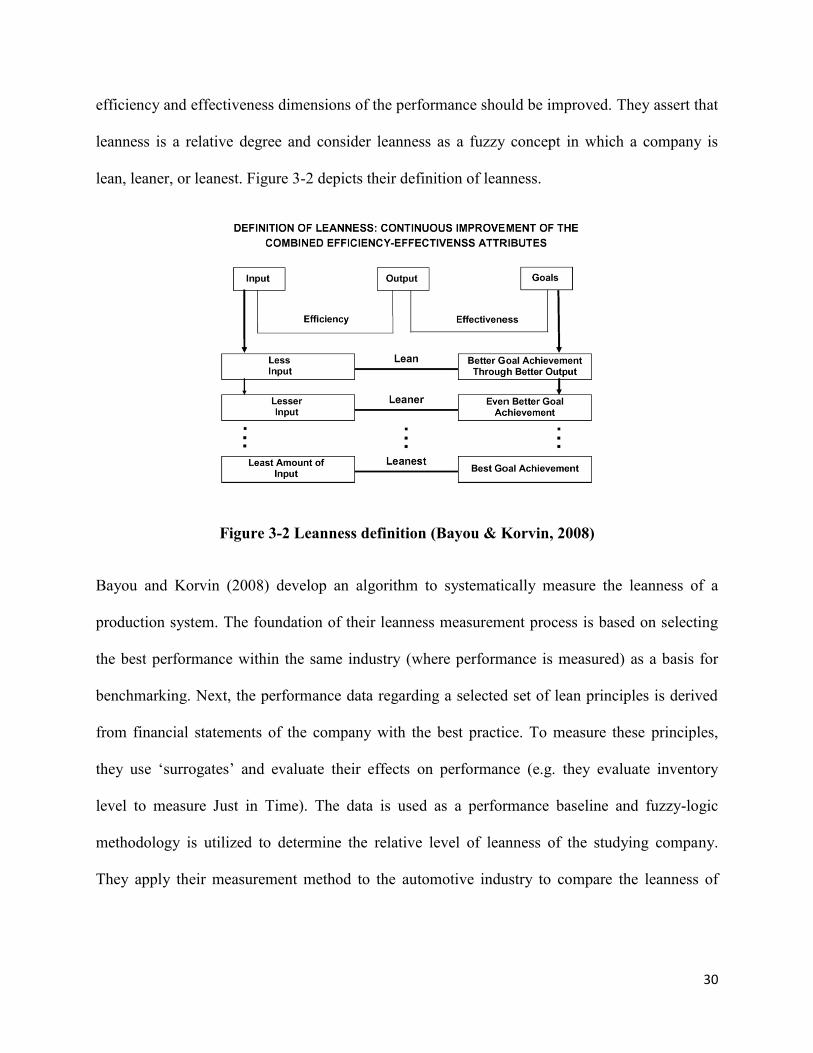
efficiency and effectiveness dimensions of the performance should be improved. They assert that
leanness is a relative degree and consider leanness as a fuzzy concept in which a company is
lean, leaner, or leanest. Figure 3-2 depicts their definition of leanness.
Figure 3-2 Leanness definition (Bayou & Korvin, 2008)
Bayou and Korvin (2008) develop an algorithm to systematically measure the leanness of a
production system. The foundation of their leanness measurement process is based on selecting
the best performance within the same industry (where performance is measured) as a basis for
benchmarking. Next, the performance data regarding a selected set of lean principles is derived
from financial statements of the company with the best practice. To measure these principles,
they use ‘surrogates’ and evaluate their effects on performance (e.g. they evaluate inventory
level to measure Just in Time). The data is used as a performance baseline and fuzzy-logic
methodology is utilized to determine the relative level of leanness of the studying company.
They apply their measurement method to the automotive industry to compare the leanness of
31
production systems of Ford Motor Company and General Motors using Honda Motor Company
as the best practice.
To measure leanness, Bayou and Korvin (2008) take into account only a few lean practices
namely: JIT, Kaizen, and quality control, while other lean principles are left out. However, to
appropriately measure implementation of lean tools and techniques, all the resulting effects on
performance must be identified which requires a comprehensive study and consideration of
contextual factors of the work setting. Hence using some surrogates of some lean principles is
not enough for proper measurement of lean initiatives. Another shortcoming of such a paradigm
is that by the time the data is available for measurement, it is already too late to take corrective
actions and data is not actionable.
In a study to develop a model to evaluate the adoption of lean production principles in
manufacturing firms (degree of leanness), Soriano-Meier and Forrester (2002) conducted a
survey on 33 companies within UK ceramics tableware industry. They first derived nine
components of leanness based on the framework developed by Karlsson & Åhlström as follows:
the elimination of waste, continuous improvement, zero defects, JIT deliveries, pull of materials,
multifunctional teams, decentralization, integration of functions, and vertical information
systems. Then they created questionnaires to evaluate the level of lean implementation and the
level of commitment of management to lean production. Senior production managers and
managing directors of the engaging companies were asked to assess the adoption level of nine
lean components in their companies on a seven point scale (ranging from 1 representing no
adoption to 7 for total adoption, with 4 for partial adoption). These rates were used in a
quantitative analysis to evaluate the degree of leanness of the companies.
32
Comm and Mathaisel (2000) emphasize on the importance of benchmarking in the lean
transformation process. They stress that since leanness is a relative measure, only internal and
external benchmarking of performance can enable evaluation of degree of leanness. They argue
an effective benchmarking is not limited to evaluation of financial metrics, but it goes beyond to
measure performance in terms of time, cost, schedule, and quality. Only this type of
benchmarking can enable quality improvement and learning throughout the organization.
Companies can learn from each other and implement this learning to improve their performance.
Nonetheless, performance dimensions and indicators used should drive lean philosophy. They
propose measuring six performance dimensions namely: efficiency, quality,
reliability/dependability, capacity, flexibility, and customer satisfaction and list some related
indicators for each dimension. They explain an eight step model for evaluation of lean
implementation and benchmarking in public sector that at the time was being used in the military
aerospace sector. Their proposed model resembles the procedure of DMAIC method with a focus
on directing improvements towards a lean manufacturing environment.
Oppenheim (2004) suggested success metrics such as the amount of throughput time cut, amount
of waste removed, value stream schedule completed as expected, and good morale of the team to
measure lean performance in his lean product development flow framework.
A number of publications focused on examining existing R&D performance measures in
literature and practice. Mascarenhas Hornos da Costa, Oehmen, Rebentisch, and Nightingale
(2014) conducted systematic literature review, focus-group discussions, and survey to examine
most commonly used metrics by program managers during product development management
from a lean perspective. They argued that existing categorization methods of metrics proposed in
literature do not completely reflect lean principles. Based on the type of information that metrics
33
address, they classified performance measures into new categories namely: stakeholder value and
benefits, program objectives and requirements, results from product, results from process, and
people. Performance metrics were further discriminated using criteria such as number of metrics
per category, unit of analysis, provided level of insight, lean principle fitness, and number of
times a metrics was mentioned in literature. They qualitatively evaluated metrics using a survey
based on their usefulness and their usage during R&D program management and reported a list
of the most and least used and useful metrics. Five most used metrics listed are: 1) certified
process, 2) program/project met revenue goals, 3) % growth in sales from new products, 4) labor
relations climate between R&D personnel, and 5) exploitation of relationships with partners.
They report top five least used metric as: 1) total cost of project, 2) delivery of product to cost, 3)
customer satisfaction, 4) new product quality level, and 5) % of respected milestones.
Driva, Pawar, and Menon (2000) conducted a survey to identify product development
performance metrics that was used in companies and also identify the metrics that companies
intend to implement in the future to measure product development performance. They report
total cost of project, on-time delivery of development project, actual project cost compared to
budget, actual vs. target time for project completion, and lead time to market as the top five
product development metrics used by the companies.
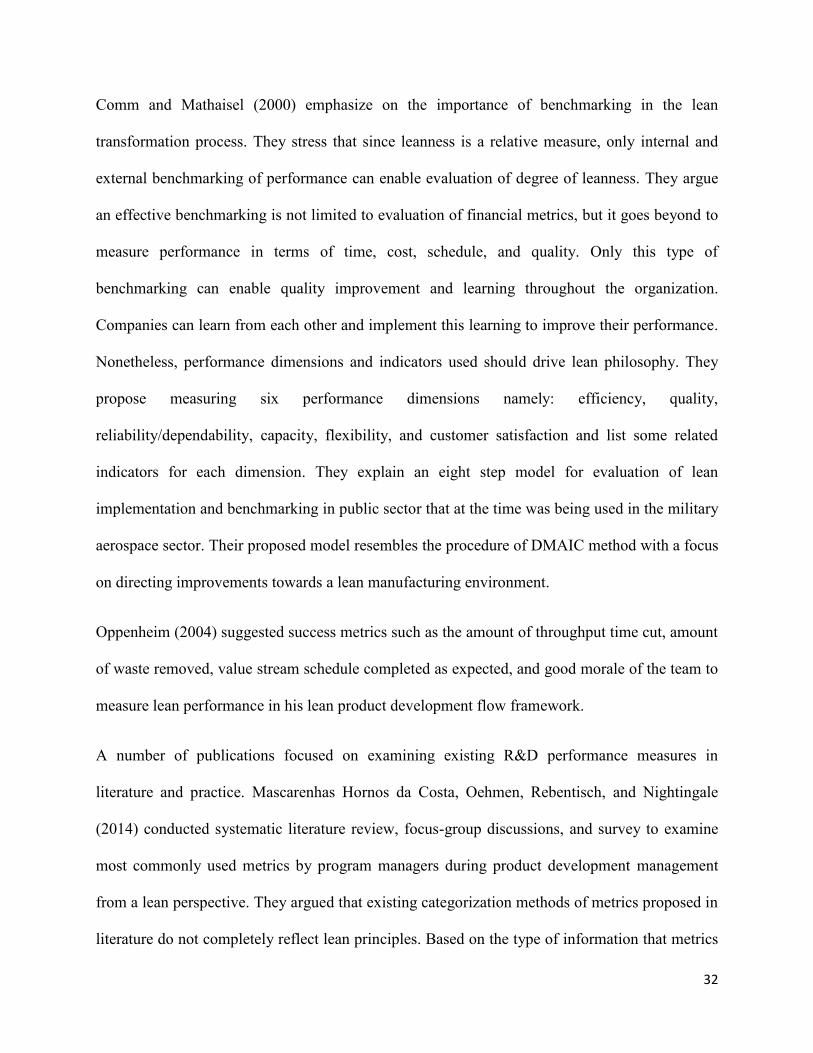
In 1998, Goldense Group, Inc. (GGI) in USA (Teresko, 2008) conducted a survey to find most
frequently used R&D metrics within different industries. The top 10 R&D metrics found in their
primary research are listed in the Table 3-3.
34
Table 3-3 Top 10 R&D metrics used by Industry in 1998 (Teresko, 2008)
1) R&D spending as a percentage of sales 76%
2) New products completed/released 68%
3) Number of approved projects ongoing 61%
4) Total active products supported 54%
5) Total patents filed/pending/awarded 51%
6) Current-year percentage of sales due to new products released in past x years 48%
7) Percentage of resources/investment dedicated 46%
8) Percentage of increase/decrease in R&D head count 43%
9) Percentage of resources/investment dedicated to sustaining products 39%
10) Average development cost per projects/product 39%
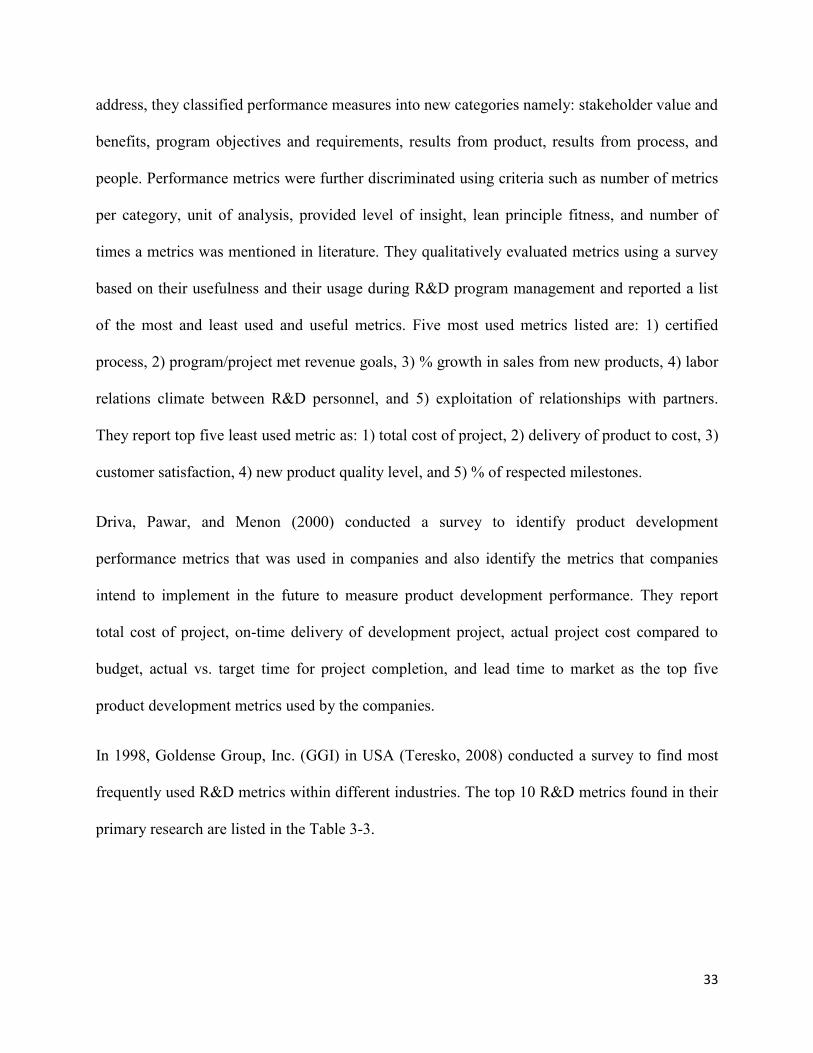
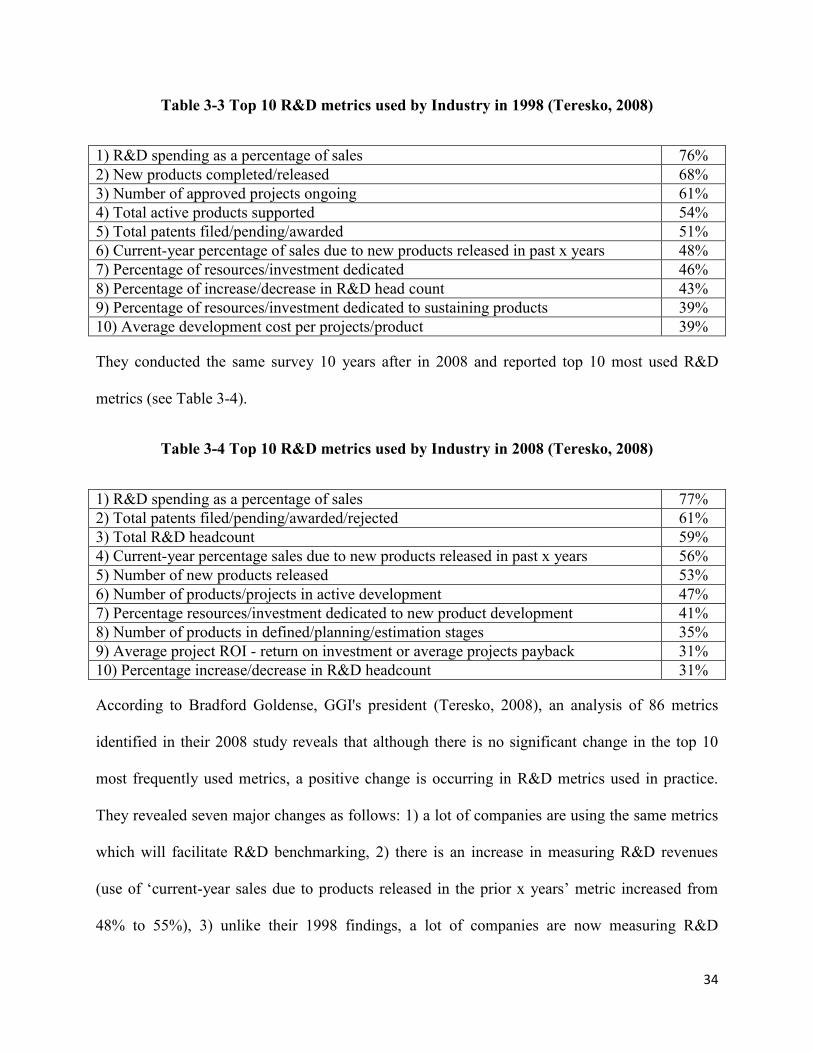
They conducted the same survey 10 years after in 2008 and reported top 10 most used R&D
metrics (see Table 3-4).
Table 3-4 Top 10 R&D metrics used by Industry in 2008 (Teresko, 2008)
1) R&D spending as a percentage of sales 77%
2) Total patents filed/pending/awarded/rejected 61%
3) Total R&D headcount 59%
4) Current-year percentage sales due to new products released in past x years 56%
5) Number of new products released 53%
6) Number of products/projects in active development 47%
7) Percentage resources/investment dedicated to new product development 41%
8) Number of products in defined/planning/estimation stages 35%
9) Average project ROI - return on investment or average projects payback 31%
10) Percentage increase/decrease in R&D headcount 31%
According to Bradford Goldense, GGI's president (Teresko, 2008), an analysis of 86 metrics
identified in their 2008 study reveals that although there is no significant change in the top 10
most frequently used metrics, a positive change is occurring in R&D metrics used in practice.
They revealed seven major changes as follows: 1) a lot of companies are using the same metrics
which will facilitate R&D benchmarking, 2) there is an increase in measuring R&D revenues
(useof ‘current-yearsalesdue toproducts released in thepriorxyears’metric increasedfrom
48% to 55%), 3) unlike their 1998 findings, a lot of companies are now measuring R&D
35
profitability (28%ofcompaniesuse‘currentyearprofitsduetoproductsreleasedinthepriorx
years’metric), 4) there is an overall increase in metrics that measure R&D revenue and profit
(e.g. ‘average of returns from projects for first x years’, and ‘revenues and profits after release to
market’), 5) due to the emergence of open innovation in the industry use of metrics that can
measure multi-party development are increased (e.g. ‘percentage revenues and/or profits from
technology licensing’ and ‘percentage revenues and/orprofitsfromtechnologysales’),6) there is
an increase in measuring productivityofR&D(e.g.‘products released per engineer or developer’
and ‘revenues and/or profits per engineer or developer’), and 7) companies are improving
existing measurement methods and new measures are being developed and implemented (e.g.
20% of companies evaluate 'return on innovation').
The Goldense Group, Inc. (GGI) report (Teresko, 2008) reveals that financial metrics that
measure R&D function in term of its share in business profit are on the rise. Yet, as it was
mentioned earlier, it is difficult to separate the profit that is resulted by R&D function from the
profit resulted from other functions of the organization. These types of financial metrics have
their own shortcomings. First, they cannot omit profit share of other functions, therefore the
evaluation is not accurate. Second, it is assumed that profitability at a given point in time is the
only metric of business performance. To turn a successful design into a successful and profitable
product in the market, integrated effort of R&D function along with other function (e.g.
marketing and manufacturing) of an organization is required (Chiesa & Masella, 1996).
In the design process of a performance measurement system, contextual factors such as strategy,
type, resources, and sector of the target organization should be taken into consideration (Chiesa,
Frattini, Lazzarotti, & Manzini, 2009).
36
Costa, et al. (2014) argue that to ensure successful implementation of lean enablers introduced by
Oehmen et al. (Oehmen, et al., 2012) in engineering programs, performance indicators should be
used. They propose two types of performance metrics to evaluate the implementation level and
the effect of 43 lean enablers on performance.
Beisheim and Stotz (2013) argue that defining key performance indicators for engineering
department is a daunting challenge. They claim measuring efficiency of engineering work is not
possible by using data provided by existing metrics such as project costs, milestone dates,
number of new products, and number of change requests. The authors use already existing
product data of purchasing, logistics, engineering, and production departments (derived from
product data management (PDM) and enterprise resource planning (ERP) systems) to develop a
new KPI for the design and engineering department called standardization degree. According to
this metric, each part is categorized into one of the following three categories, namely preferred
part, service part, or run-out part, depending on their usage and consumption in a given period of
time. They argue that use of this KPI in the beginning of the product development process will
lead to reduced product development cost and time. They attempt to promote the idea of
reducing the number of parts used in a product by highlighting those parts in preferred part
category to the designing team so they could select parts from this category to implement in the
final product while developing new products in the future projects.
Chiesa and Masella (1996) argue that every performance measurement system of R&D should
have quantitative metrics that evaluate the activities under full or partial control of R&D
executives. They present a performance measurement system framework for R&D function and
focus on productivity and adherence to scheduling dimensions to evaluate efficiency of R&D.
For performance measurement of individual projects, they recommended metrics including the
37
ratio of technical progress to time, the ratio of time to technical progress, the ratio of cost to
technical progress, and the ratio of cost to time and to time per technical progress unit. They
propose the following metrics for performance measurement of a portfolio of projects: the
number of applications generated from single project or sequence of projects, the number of
project parts jointly carried out with other projects, the number of duplications, percentage of
projects technically successful, and percentage of projects abandoned after a certain degree of
completion.
Disregarding non-financial measures and simply relying on financial metrics to measure
adoption of lean initiatives significantly reduces the effectivity of measurement. Fullerton and
Wempe (2009) stress that methodological inconsistencies, piecemeal adoption of lean elements,
and contextual factors can lead to fluctuations in lean manufacturing performance effects. The
authors propose another source for lean performance variations i.e. the utilization of non-
financial manufacturing performance (NFMP) measures that drive lean practice. They use
structural equation modeling (SEM) and collect data using questionnaires from 121 US
manufacturing executives to examine the relationship between the utilization of non-financial
manufacturing performance measures in the implementation of lean initiatives and the financial
performance of a firm.
Fullerton and Wempe (2009) chose the following metrics as non-financial manufacturing
performance measures in their study: inventory turns, equipment downtime, on-time delivery,
scrap, rework, setup times, labor productivity, throughput time, and manufacturing cycle
efficiency. They examine the following relationships: 1) they examine the relationship between
shop-floor employee involvement and three lean practices in particular setup time reduction,
cellular manufacturing, and quality improvement, 2) they examine the relationship between three
38
lean practices and utilization of NFMP measures, 3) they examine direct relationship between
lean practices and financial performance (i.e. profitability), 4) they examine the direct
relationship between the utilization of NFMP measures and profitability of a firm, and 5) they
examine the mediating role of NFMP measures in the relationship between lean practices and
financial performance. Their study reveals that NFMP measurement plays a mediating role and
not a moderating role (despite the general belief) in the relationship between lean manufacturing
and financial performance of a firm. Thus the utilization of NFMP metrics plays a vital role
rather than just an amplifying role in the financial performance of a firm during the lean
implementation and transformation process. They stress that data provided by NFMP
measurement will enable companies to achieve profitability.
Parry and Turner (2006) report that in addition to performance measurement systems, lean visual
tools are also being adopted in organizations to promote and drive lean in real time. They claim
that lean visual tools can make the flow of work visual, establish a clear communication
throughout the organization, facilitate performance measurement and forecasting, and provide
timely feedback, which makes them a dynamic measurement system. Due to their successful
implementation in the manufacturing, utilization of these tools is now extended from shop floor
to the entire organization. Visual tools such as value stream maps, 5S, Andon boards, updated
standard work charts, displays with key financial measures, and Kanban are implemented in a
process to demonstrate current state, reveal deficiencies and waste, and to promote continuous
improvement to achieve a better future state.
Parry and Turner (2006) argue that use of physical visual tools (a board or a paper) is more
effective than using software based tools since due to physical limitation of physical tools only
valuable data is represented on such tools while software based tools have no such limitation and
39
are prone to representation of excessive data with no use which can lead to confusion and less
effectivity. They reveal that aerospace companies in particular Rolls Royce Civil Aerospace,
Airbus UK, and Weston Aerospace have developed lean visual tools in order to promote lean and
facilitate communication and performance measurement. For example, in Rolls Royce Civil
Aerospace, they have developed a visual control system by communicating the output predicted
by ERP system to a large board to display movement of the product through the processes on the
shop floor to create smooth flow and support lean manufacturing. In Airbus UK, they have
developed visual boards to facilitate management of the process of their Long Range Aircraft
Maintenance Manuals division which is a complex knowledge-based process and requires clear
communication and transfer of data throughout its entire value stream. They state that all these
lean visual tools represent the current state of a complex work process in a simple way and are
designed and owned by the teams executing the work themselves.
Beauregard, Thomson, and Bhuiyan (2008) developed a model to evaluate the benefits of
introducing lean principles in the engineering process of an aerospace company as part of their
research on development of a new framework for lean engineering implementation. They
proposed five steps for implementing lean engineering. First, the engineering demand is
identified. Second, the engineering value stream bottleneck is identified and targeted for
improvement. Third, tasks are scheduled concerning bottleneck process limitations. Fourth,
processes upstream of bottleneck are synchronized and coordinated to the pace of the bottleneck
process. Fifth, value stream performance is measured in order to monitor the progress. They
proposed a lean engineering financial model that evaluates significant aspects of engineering
work at different phases during its lifecycle and compares them to a performance baseline.
40
Beauregard, Thomson, and Bhuiyan (2008) introduced new variables to measure unaccounted
for, wasteful aspects of engineering work. For example a variable called restart is proposed that
evaluates the amount of time an engineer spends on reviewing an engineering task to be able to
continue to progress it after having a long period of inactivity on the task. They also introduced a
new variable called wasted setup. In their proposed model, lead time days of each engineering
task are classified as either a touch day or a non-touch day based on whether or not a minimum
amount of effort (2 hours of work) is spent on the task on that day to advance it. All efforts spent
on tasks on a non-touch day (lead time day with charges of less than 2 hours to the task) is then
considered waste and are categorized as wasted setup since these effort did not properly advance
the task and only wasted resources working on those tasks. Waste is then calculated as the
aggregated value of setup, restart, and wasted setup times. Intellectual work in progress
(inventory) is equal to the amount of time spent on tasks that remain incomplete at the end of the
period of measurement. Then, values of these variables for the period of measurement are
converted into financial values by using an hourly engineering rate and are compared to baseline
values of the same variables. Engineering performance to fulfill waste reduction, inventory
reduction, lead time reduction, and throughput improvement is measured and aggregated to
calculate a scalar called lean savings which represents the financial value of all savings achieved
due to lean engineering efforts during the period of measurement. Beauregard (2010) used the
model to compare performance of pre-certification and post-certification engineering tasks in an
aerospace company.
41
3.3 Lean performance measurement gaps
Research on performance measurement in new product development is very limited relatively
(Driva, Pawar, & Menon, 2000; Tatikonda, 2008; Beisheim & Stotz, 2013). Scholars have
criticized traditional metrics and performance measurement systems in R&D (Mascarenhas
Hornos da Costa, Oehmen, Rebentisch, & Nightingale, 2014). In modern economy, traditional
management accounting systems can no longer provide essential data for effective decision
making, as they were designed to suit traditional mass production environment. To successfully
achieve strategies in long term, it is critical to provide proper feedback at the right time to people
who are working to achieve these strategies (Fullerton & Wempe, 2009).
Advanced concepts such as lean are now adopted by organizations to ensure market survival and
profitability of the business, however, performance measurement systems that are in place are
obsolete and outdated. These performance measurement systems should be reviewed and the
metrics need to be modified and updated to correspond to modern product development process
needs (Kerssens-van Drongelen & Cooke, 1997; Driva, Pawar, & Menon, 2000; Driva, Pawar, &
Menon, 2001; Haque & Moore, 2004). “If lean is the aim, then it is necessary to use
performance measuresthatpromoteleanbehavior”(Haque & Moore, 2004).
Most of the academic research done on product development performance measurement is
concentrated on the development of metrics and/or key performance indicators (KPIs) rather than
a holistic development of a set of metrics that have proper linkages and could fit in a system of
performance measurement for an environment such as product development (Tatikonda, 2008;
Kerssens-van Drongelen & Cooke, 1997; Driva, Pawar, & Menon, 2000). Research on how to
42
design this system of performance measurement for different types of research and development
activities also requires further attention (Chiesa, Frattini, Lazzarotti, & Manzini, 2009).
Bhasin (2011) summarize the literature on the weakness of traditional performance measures and
reports the following shortcoming for traditional measures: traditional measures do not fit
strategic decision, traditional metrics are historical and difficult to correlate, they provide little
information on the root problems, financial and non-financial measures are weakly connected,
traditional measures focus on functional processes (vs cross-functional processes), intangible
assets receive small attention, creating value is neglected, too many metrics are used, traditional
measures do not promote continuous improvement, and operational and strategic level measures
are not effective connected.
Tatikonda (2008) stress that most recent studies on new product development performance
measurement focus on project level tactical outcomes and SBU level financial and market
outcomes while there is a gap on measurement of objects at the intermediate organizational level,
linking metrics, developing metrics as a set, and developing effective predictive processing
measures (versus existing historical outputs metrics).
Most of the studies reviewed in the previous section focused on identifying some metrics (that
are used in the industry) and/or developing some individual measures to promote lean while
others developed qualitative measures of leanness.
A number of proposed metrics count the number of failures and/or successes in the engineering
process. On the one hand, there are metrics that try to count the number of failures (errors) in
engineering work. For example, a metric like the number of design changes only indicates how
many times a change has occurred to a design in the product development process (pre or post
43
release to manufacturing) without elaborating on how these changes affected the process in terms
of time, cost, and effort (how much effort was spent to implement changes, correct the designs
and how much waste was produced).
Changes to design can be a result of a request from a customer, a change in specifications, or due
to an engineering error (Haque & Moore, 2004). Each design change has different impact
(magnitude) on the product development process. Factors such as the dimension in which the
change occurs, when it occurs (early or late in the process), and the magnitude of the
dependencies of other designs (how sensitive designs are to this change) to this change can affect
the impact of a design change. A change in a specification that can make all the downstream
effort useless which requires a complete redesign of all dependent elements in the system is
different than a small change in a parameter that will only result in minor rework (Design
Structure Matrix is one of the tools used to define relationships and dependencies of design
elements). Design changes made earlier in the process of product development are less costly
and easier to correct. As we move forward in the product development process these changes
impose more cost and effort e.g. changes made after release of design to production (McManus,
Haggerty, & Murman, 2005). Therefore, we need metrics that can appropriately discriminate the
performance of product development process not only based on the number of changes occurred
but also considering the effect of these changes (the magnitude) so we could accurately
benchmark performance.
On the other hand, there are metrics that try to count the number of success (achievements) in the
product development process. For example metrics such as the number of new designs
introduced. This type of metrics that only count the outcomes of a complex engineering effort
neglect one important aspect that is the level of efficiency with which the engineering process
44
delivered those outcomes. It may happen that an engineering department delivers more new
designs in a period but with a greater percentage of waste occurred during that period. Thus, such
metrics does not reflect the level of efficiency of the engineering department and simple use of
them will falsely imply that a better performance was achieved in a period leaving out the
efficiency. Another problem associated with this type of bibliometric analysis is that a greater
value for such metrics does not necessarily lead to a better business performance, hence, these
metrics are only helpful when they are analyzed along with other type of metrics in a
comprehensive performance measurement system (Kerssens-van Drongelen & Cooke, 1997).
A number of researchers developed qualitative measures of leanness. They based their evaluation
of leanness on questionnaires and only considered implementation of some lean components,
disregarding lean as a system of principles. For example, evaluation of the degree of leanness
based on a questionnaire as conducted by Soriano-Meier and Forrester (2002) has its own
drawbacks. First, as any other qualitative assessment method, subjectivity and bias can highly
affect the results. Second, a higher level of commitment to lean and adoption of its components
and techniques does not necessarily lead to a higher degree of leanness.
It is neither how much you want to become lean, nor how many lean tools you use that define
leanness. Lean tools are implemented in a process so that a lean state of performance can be
achieved, hence, the outcome of such implementation (effectivity and efficiency of the
performance) is the appropriate metric for evaluation of the degree of leanness. Rather than
assessing the rate of lean components adoption, achieved performance must be evaluated with
respect to lean goals. In their research, they viewed lean as a set of elements rather than a system
of principles. These lean elements are all designed to serve as a springboard for building a lean
process. There is no lean implementation approach that fits all companies (Bhasin, 2011). One
45
should appropriately select the techniques that fit and are effective for a given work
environment. Appropriate systematic application of lean principles is required to ensure leanness
and the degree achieved can only be evaluated based on the objective measurement of outcomes
of the application process and not based on the subjective assessments of the inputs of the
process.
Performance measurement models that are capable of evaluating the degree of leanness in
organizations are missing, hence, objective comparison and benchmarking of leanness is a
challenge (Soriano-Meier & Forrester, 2002; Bayou & Korvin, 2008). Implementation of a
common model that integrates key lean performance indicators eliminates measurement
inconsistencies and enables relative and reliable benchmarking that can identify best practice and
drive continuous improvement by implementing best practice throughout the organization.
Utilization of a common performance measurement system will promote continuous
improvement, competitiveness, and enables internal and external benchmarking throughout the
organization and across industries (Haque & Moore, 2004; Bayou & Korvin, 2008).
Following, a number of weaknesses associated with research on lean product development
performance measurement is summarized: 1) focus on developing individual measures rather
than developing a set of properly linked metrics (Kerssens-van Drongelen & Cooke, 1997;
Driva, Pawar, & Menon, 2000; Tatikonda, 2008; Bhasin, 2011), 2) formulate lean as
implementation of some tools and not a system of principles while measuring leanness of an
organization, 3) efficiency of engineering process which is the third goal of lean engineering
(McManus, Haggerty, & Murman, 2005) is left out, 4) provide little information that is historical
and not actionable (Tatikonda, 2008; Bhasin, 2011); by the time the feedback is available it is too
late to make any corrective or predictive action, 5) have too many metrics (Kuczmarski, 2001;
46
Bhasin, 2011), 6) do not promote lean behavior (Bhasin, 2011), 7) do not provide engineers with
useful information to help improve their performance, 8) do not account for wasteful aspect of
engineering work; since waste parameters are often transferred from manufacturing process
disregarding wasteful aspects of work that only exist in engineering (e.g. the time required for
mental preparation of engineers that changes in time in the case of idleness), and 9) leanness is
qualitatively evaluated based on questionnaires (subjective vs objective measurement of the level
of leanness) which can highly be subject to personal preference and bias (Kerssens-van
Drongelen & Cooke, 1997; Tatikonda, 2008; Chiesa, Frattini, Lazzarotti, & Manzini, 2009).
47
4 LEAN ENGINEERING PERFORMANCE MEASUREMENT MODEL
In this chapter, the lean engineering performance measurement (LEPM) model developed in this
research is presented and discussed in detail.
4.1 LEPM model: Introduction
To address the need for a performance measurement model (vs. an individual lean metric) that
takes into account key lean principles and performance indicators, a lean engineering
performance measurement (LEPM) model is developed. The model comprises a set of metrics to
evaluate the efficiency of engineering processes from a lean perspective. In the development of
the model, lean is treated as a system of principles rather than implementation of some tools,
hence, a set of metrics is developed that is capable of evaluating the effects of implementing lean
initiatives in the overall performance of an engineering process. The LEPM model can help
managers with choosing the right set of available lean tools and techniques in the process of lean
transformation by providing them with information that is vital for effective decision-making.
Therefore, best practices can be identified and extended to the whole organization, thus, more
improvements can take place.
The LEPM model is used on a periodic basis to measure key performance dimensions of
engineering tasks from a lean perspective. Measured values are then compared against some
previously established baseline that is used as a standard to determine the progress achieved
towards lean goals of waste elimination, lead time reduction, intellectual inventory reduction,
and throughput improvement. The focus of the model is on evaluating the efficiency of
engineering processes, the third goal of lean engineering as stated by McManus, Haggerty, and
Murman (2005).
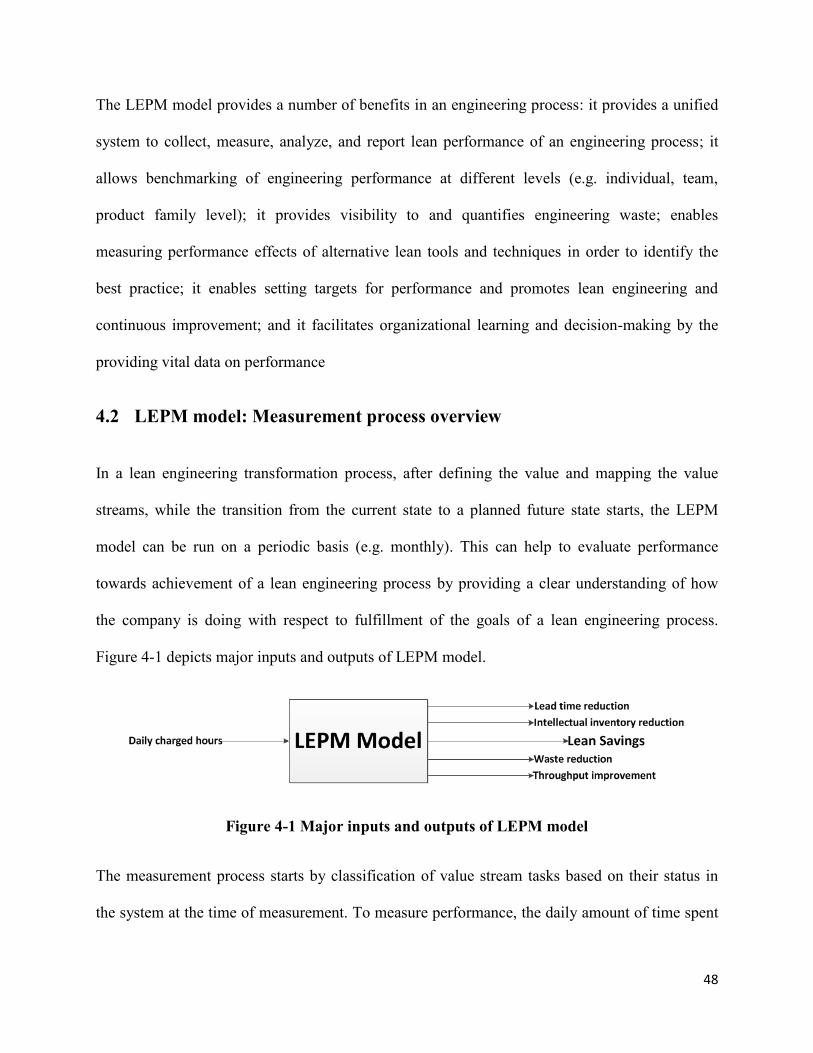
48
The LEPM model provides a number of benefits in an engineering process: it provides a unified
system to collect, measure, analyze, and report lean performance of an engineering process; it
allows benchmarking of engineering performance at different levels (e.g. individual, team,
product family level); it provides visibility to and quantifies engineering waste; enables
measuring performance effects of alternative lean tools and techniques in order to identify the
best practice; it enables setting targets for performance and promotes lean engineering and
continuous improvement; and it facilitates organizational learning and decision-making by the
providing vital data on performance
4.2 LEPM model: Measurement process overview
In a lean engineering transformation process, after defining the value and mapping the value
streams, while the transition from the current state to a planned future state starts, the LEPM
model can be run on a periodic basis (e.g. monthly). This can help to evaluate performance
towards achievement of a lean engineering process by providing a clear understanding of how
the company is doing with respect to fulfillment of the goals of a lean engineering process.
Figure 4-1 depicts major inputs and outputs of LEPM model.
Figure 4-1 Major inputs and outputs of LEPM model
The measurement process starts by classification of value stream tasks based on their status in
the system at the time of measurement. To measure performance, the daily amount of time spent
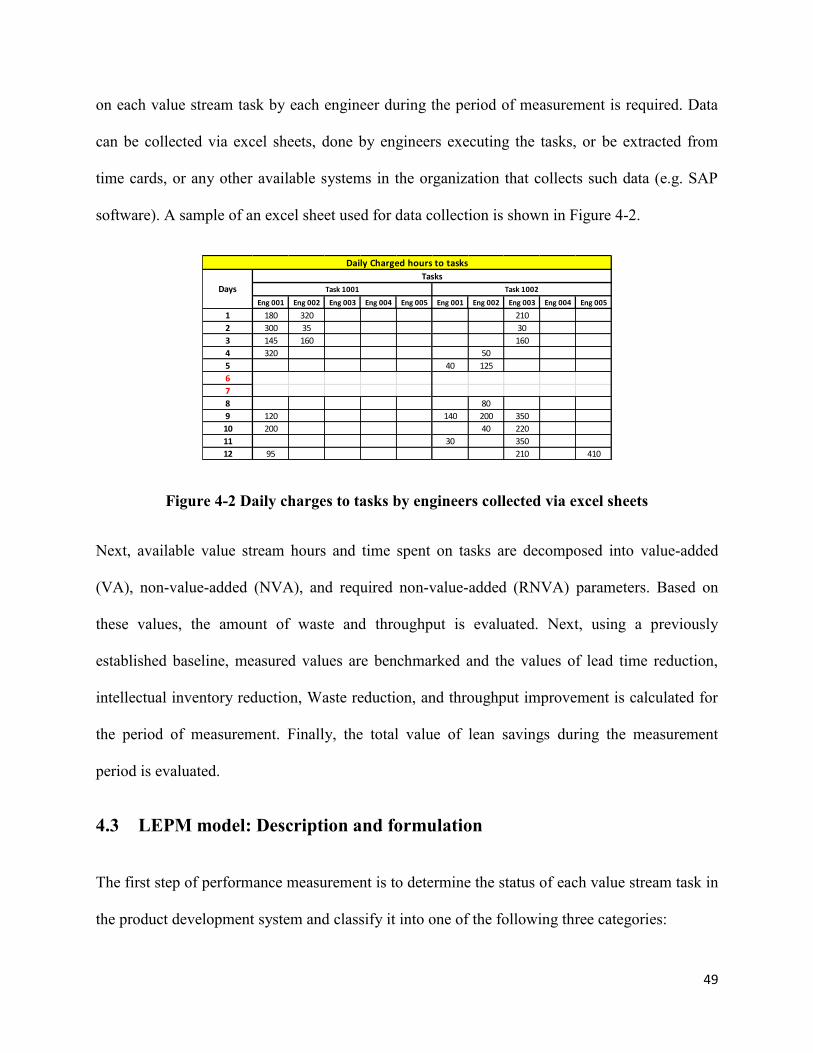
49
on each value stream task by each engineer during the period of measurement is required. Data
can be collected via excel sheets, done by engineers executing the tasks, or be extracted from
time cards, or any other available systems in the organization that collects such data (e.g. SAP
software). A sample of an excel sheet used for data collection is shown in Figure 4-2.
Figure 4-2 Daily charges to tasks by engineers collected via excel sheets
Next, available value stream hours and time spent on tasks are decomposed into value-added
(VA), non-value-added (NVA), and required non-value-added (RNVA) parameters. Based on
these values, the amount of waste and throughput is evaluated. Next, using a previously
established baseline, measured values are benchmarked and the values of lead time reduction,
intellectual inventory reduction, Waste reduction, and throughput improvement is calculated for
the period of measurement. Finally, the total value of lean savings during the measurement
period is evaluated.
4.3 LEPM model: Description and formulation
The first step of performance measurement is to determine the status of each value stream task in
the product development system and classify it into one of the following three categories:
Eng 001 Eng 002 Eng 003 Eng 004 Eng 005 Eng 001 Eng 002 Eng 003 Eng 004 Eng 005
1 180 320 210
2 300 35 30
3 145 160 160
4 320 50
5 40 125
6
7
8 80
9 120 140 200 350
10 200 40 220
11 30 350
12 95 210 410
Daily Charged hours to tasks
Days
Tasks
Task 1001 Task 1002
50
1) Completed tasks (|I| = n): tasks that are completed (delivered) during measurement period.
i ∈ I = 1, . . , n: Completed tasks
2) Active incomplete tasks (|I′| = n′): active tasks in the system that are not completed during
measurement period.
i′ ∈ I′ = 1, . . , n′: Active incomplete tasks
3) Non-active incomplete tasks (|I′′| = n′′): tasks that are suspended (aborted) before being
completed or completed tasks that are not incorporated into the final product (e.g. developed
features that are dropped).
i′′ ∈ I′′ = 1, . . , n′′: Non-active Incomplete tasks
Then, the available working time for the value stream (total working time available for resources
to work on values stream tasks during the period of measurement) is decomposed into smaller
elements which can be further classified as VA, NVA, and RNVA effort. We need to break
down value-added activities in order to enable visibility of hidden non-value-added activities,
since most of these wasteful efforts exist within larger value-added activities (Oppenheim, 2004).
Without such decomposition, measuring performance of engineering activities from a lean
perspective would not be effective as a significant amount of engineering waste is left out and is
considered to be an inherent part of the normal effort required to process a task (existing studies
lack such a decomposition). Therefore, the following flowchart (Figure 4-3) is developed to help
break down available value stream working hours into proposed LEPM model parameters. These
parameters make the hidden non-value-added part of engineering activities transparent so one
could appropriately measure the effectiveness and efficiency with which the available working
hours was used to progress the tasks towards completion.
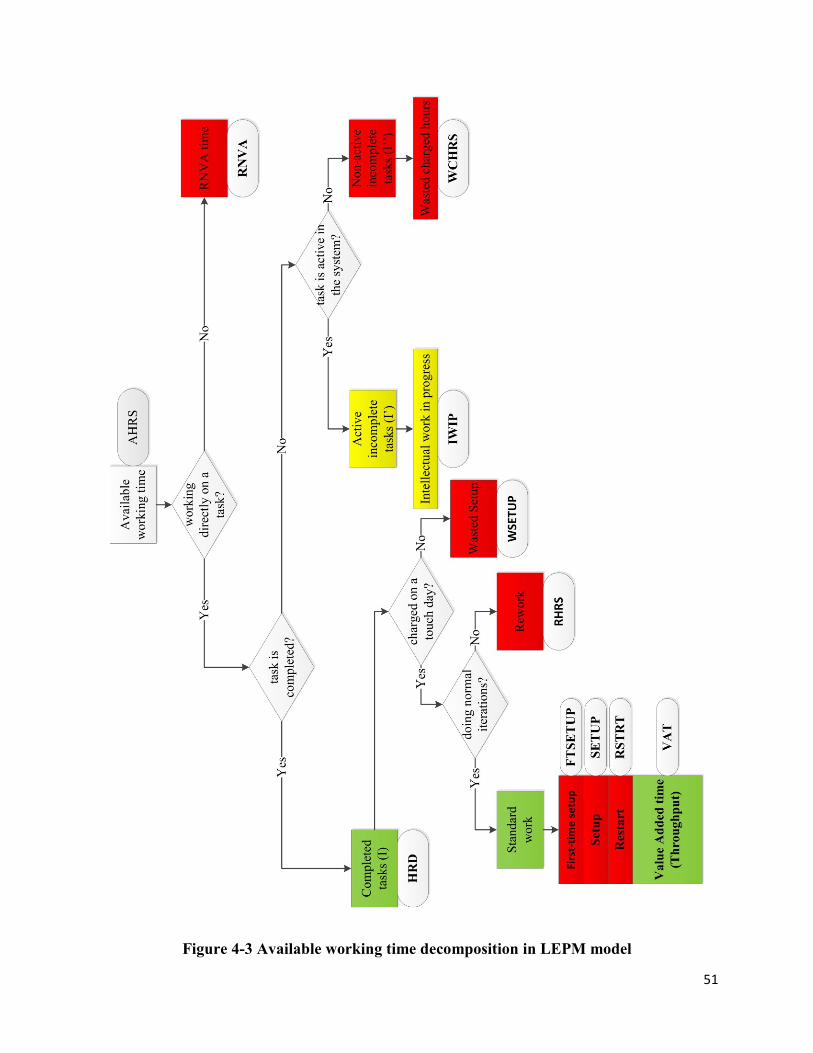
51
Figure 4-3 Available working time decomposition in LEPM model
52
The decomposition process is discussed in detail in this section.
For each completed task (𝑖), lead time (𝐿𝑇𝑖) is calculated as the number of elapsed days between
the first charge and the last charge to that task minus the number of non-working days within this
period.
𝐿𝑇𝑖 = 𝐹𝑖 − 𝑆𝑖 − 𝑁𝑊𝐷 + 1 (1)
where 𝐹𝑖 is the date of last hour charged to task 𝑖, 𝑆𝑖 is the date of first hour charged to task 𝑖, and
𝑁𝑊𝐷 is the number of non-working days (e.g. weekends, holidays) within the lead time period.
Average task lead time (𝐿𝑇̅̅̅̅ ) is evaluated:
𝐿𝑇̅̅̅̅ =∑ 𝐿𝑇𝑖
𝑛𝑖=1
𝑛
(2)
where n is the number of completed tasks during the measurement period.
Average charged hours (𝐶𝐻𝑅𝑆̅̅ ̅̅ ̅̅ ̅̅ ), is the total amount of time charged to completed tasks over the
number of completed tasks.
𝐶𝐻𝑅𝑆̅̅ ̅̅ ̅̅ ̅̅ =∑ ∑ ∑ 𝐶𝐻𝑅𝑆𝑖𝑗𝑘
𝑙𝑘=1
𝑚𝑗=1
𝑛𝑖=1
𝑛
(3)
where 𝑖 ∈ 𝐼 = 1, . . , 𝑛 is the number of completed tasks, 𝑗 ∈ 𝐽 = 1, . . , 𝑚 represents the number of
working days within period of measurement, 𝑘 ∈ 𝐾 = 1, . . , 𝑙 represents the number of engineers
(resources) in the engineering system, and 𝐶𝐻𝑅𝑆𝑖𝑗𝑘 is the hours charged to task 𝑖 on day 𝑗 by
engineer 𝑘.
The average number of engineers (�̅�) that charged to completed tasks is calculated as follows:
�̅� =∑ 𝑁𝑖
𝑛𝑖=1
𝑛
(4)
53
where 𝑁𝑖 is the number of engineers that charged to task 𝑖.
Hours delivered (𝐻𝑅𝐷) is simply the total amount of hours charged to completed tasks.
𝐻𝑅𝐷 = ∑ ∑ ∑ 𝐶𝐻𝑅𝑆𝑖𝑗𝑘
𝑙
𝑘=1
𝑚
𝑗=1
𝑛
𝑖=1
= 𝑛 × 𝐶𝐻𝑅𝑆̅̅ ̅̅ ̅̅ ̅̅
(5)
As previously discussed, in addition to the non-value-added part of engineering effort, idleness
of tasks also significantly contributes to the creation of waste in the engineering process. One
study shows only 31% of engineering effort is value-added while engineering work packages are
idle in the system 62% of the time (McManus, Haggerty, & Murman, 2005), hence, only 12% of
the time a task undergoes value-added activity (McManus, 2005). Idleness of tasks also leads to
an increased level of work in progress inventory which is another major source of waste. More
importantly, this intellectual work in progress inventory contains valuable information that can
lose its value in time.
Technologies become obsolete, engineering errors remain hidden, and even projects can fail if
this information is stored without being worked on for a long time. Kato (2005) defines rotten
inventory as the information inventory that requires partial or complete rework due to internal or
external changes caused by market change, requirements change, and technical difficulties. He
reports in one case study, the information stored as inventory was wasted at the rate of 6% a
month, meaning that a task that is idle for a month on average requires an extra 6% of effort by
engineers in order to be delivered. This puts more emphasis on the importance of minimizing
inventories in the product development system, as holding larger inventories of information leads
to more rework and higher levels of inventory, since the engineers need to stop other tasks and
charge extra effort to these tasks in order to deliver them. On the other hand, the more and longer
the tasks are idle in the system before being worked on again, the more and longer mental setup
54
is required by engineers to complete them (Bauch, 2004). Hence, idleness of tasks creates a chain
of wasteful events in the engineering value stream leading to poor performance. Therefore, by
reducing idleness of tasks, the waste is reduced and engineering performance is improved.
In what follows, a number of metrics are discussed that highlight and account for such type of
waste and promote incremental improvement in those dimensions.
Each lead time day of a given task is classified as either a touch day or alternatively a non-touch
day, based on whether or not charges made to the task on that day effectively contributed to the
progression of the task. A predetermined parameter called 𝑀𝑇𝑇𝑃𝑖, that is the minimum time
required to effectively progress task 𝑖, is used for such classification. The value of 𝑀𝑇𝑇𝑃𝑖 for
each task or product family depends on the contextual factors and is determined inside the
company based on previous performance data and discussion within engineering teams executing
the tasks. Each lead time day is then considered a touch day if a minimum of 𝑀𝑇𝑇𝑃𝑖 hours is
spent on the given task during that day by at least one engineer. Setup time (intellectual,
paperwork or computer), and task complexity are among factors that set a minimum limit to the
time that is required to effectively progress a task. A task with greater setup time and/or greater
complexity will consequently require a greater amount of time to be effectively progressed,
therefore, has a greater 𝑀𝑇𝑇𝑃𝑖 value. If the amount of time spent on a task by engineers during a
lead time day is lower than 𝑀𝑇𝑇𝑃𝑖, then charges on that day do not effectively contribute to
progression of the task towards completion and that day is classified a non-touch day. The
average number of touch days 𝑇𝐷̅̅ ̅̅ is calculated using the formula below:
𝑇𝐷̅̅ ̅̅ =∑ ∑ 𝑇𝐷𝑖𝑗
𝑚𝑗=1
𝑛𝑖=1
𝑛
(6)
55
𝑇𝐷𝑖𝑗 is a binary variable indicating whether day 𝑗 for task 𝑖 is a touch day or alternatively a non-
touch day. For each task (𝑖) we have 𝑇𝐷𝑖𝑗 = 1 if 𝐶𝐻𝑅𝑆𝑖𝑗𝑘 ≥ 𝑀𝑇𝑇𝑃𝑖 for at least one engineer 𝑘
on day 𝑗, otherwise 𝑇𝐷𝑖𝑗 = 0.
𝑁𝑇𝐷̅̅ ̅̅ ̅̅ = 𝐿𝑇̅̅̅̅ − 𝑇𝐷̅̅ ̅̅ (7)
where 𝑁𝑇𝐷̅̅ ̅̅ ̅̅ represents the average number of non-touch days.
Touch time ratio (𝑇𝑇𝑅) is the number of touch days over lead time. It evaluates how effective
the lead time is used to progress the tasks towards completion. The lower the touch time ratio,
the idler the task has been in the system within its lead time period. This inactivity results in
increased level of intellectual work in progress, longer lead times, and longer queues in the
engineering system, thus increasing waste and lowering performance. A value stream with a low
touch time ratio should immediately be analyzed in order to identify root causes of the problem
to increase the touch time ratio.
𝑇𝑇𝑅 =∑
𝑇𝐷𝑖𝐿𝑇𝑖
𝑛𝑖=1
𝑛
(8)
𝑇𝑇𝑅 represents the touch time ratio of completed tasks, and 𝑇𝐷𝑖 = ∑ 𝑇𝐷𝑖𝑗𝑚𝑗=1 is the total number
of touch days of task 𝑖.
The task idleness mentioned earlier is a result of high number of days with no charge and/or days
with charges lower than 𝑀𝑇𝑇𝑃𝑖. Kato (2005) identifies thirteen types of inventory of information
(reasons for which information is stored as inventory and task becomes idle) in product
development as follows: 1) taking care of a more urgent task in the project, 2) switching to a
higher priority task outside of the project, 3) waiting for information from another task, 4)
review/testing work, 5) day off, 6) maintenance of documents, 7) rework discovery, 8) other
engineers’ availability, 9) downstream engineer’s availability, 10) waiting for an answer, 11)
56
ambiguous information, 12) limited availability of tool/board/system, and 13) Others. Charged
hours to tasks on non-touch days are considered waste in this model in the sense that these
charges do not significantly progress the task towards completion and at the same time interrupt
continuous flow of other tasks that engineers could have been charging to instead (Beauregard,
Thomson, & Bhuiyan, 2008).
Based on Little’s Law we know that the following relationship between work in progress,
throughput, and lead time holds for a production system:
WIP = Throughput × lead time = T × LT (9)
Therefore to reduce work in progress inventory which is waste and requires extra financing, the
lead time must be reduced. Lead time reduction can be achieved either by increasing the touch
time ratio or decreasing the average task lead time (Beauregard, Thomson, & Bhuiyan, 2008).
Hours charged to active incomplete tasks (i′ ∈ I′ = 1, . . , n′) during the measurement period are
considered intellectual work in progress (𝐼𝑊𝐼𝑃). Intellectual work in progress is the amount of
engineering work waiting in the system to be further processed before it can be delivered. Work
in progress is a form of inventory, therefore holding an excess level of it is considered waste
since the capital tied up in it could be used elsewhere to generate higher amount of returns for the
organization. Reducing intellectual work in progress levels results in increased cash flow (due to
faster order to cash cycle) and more profit for all the stakeholders (Beauregard, Thomson, &
Bhuiyan, 2008).
𝐼𝑊𝐼𝑃 = ∑ ∑ ∑ 𝐶𝐻𝑅𝑆𝑖′𝑗𝑘
𝑙
𝑘=1
𝑚
𝑗=1
𝑛′
𝑖′=1
(10)
57
where 𝐼𝑊𝐼𝑃 represents the intellectual work in progress hours at the end of the measurement
period, 𝑖′ ∈ 𝐼′ = 1, . . , 𝑛′ is the number of active incomplete tasks, and 𝐶𝐻𝑅𝑆𝑖′𝑗𝑘 is the amount of
hours charged to active incomplete task 𝑖′ on day 𝑗 by engineer 𝑘.
Evaluation of waste starts by calculating the amount of wasted charged hours. The total amount
of time spent on non-active incomplete tasks such as incomplete tasks that are aborted, or
completed tasks that are not incorporated into the final product (e.g. developed features that are
dropped) is classified as wasted charged hours (𝑊𝐶𝐻𝑅𝑆), owing to the fact that effort spent on
these tasks did not create any value for stakeholders and the time could have been used to
progress a value-added tasks instead.
𝑊𝐶𝐻𝑅𝑆 = ∑ ∑ ∑ 𝐶𝐻𝑅𝑆𝑖′′𝑗𝑘
𝑙
𝑘=1
𝑚
𝑗=1
𝑛′′
𝑖′′=1
(11)
where 𝑊𝐶𝐻𝑅𝑆 represents the wasted charged hours, 𝑖′′ ∈ 𝐼′′ = 1, . . , 𝑛′′ is the number of non-
active incomplete tasks, and 𝐶𝐻𝑅𝑆𝑖′′𝑗𝑘 is the hours charged to task 𝑖′′ on day 𝑗 by engineer 𝑘.
Developed knowledge for tasks that are classified under this category needs to be properly
documented and shared across the engineering teams so that learning can occur (engineer can
learn from mistakes and prevent reinvention of knowledge). If knowledge is effectively captured,
individual learning will lead to organizational learning (Lander & Liker, 2007). One of the
barriers to sharing information of such failed tasks is the existence of a blame culture in
organizations. Instead of blaming engineers, the root cause of the failure must be analyzed and
targeted (Oehmen, et al., 2012). Knowledge developed for such activities may also have the
potential of being used in another project.
58
One of the lean techniques used in engineering companies is set-based design. In set-based
design, multiple alternative designs are taken into account and developed simultaneously and
decisions are delayed as much as possible in the process to keep the design space open. The
number of design alternatives needs to be kept limited otherwise this process becomes a resource
of waste itself. These companies will surely end up with some designs that are not implemented
into the final product (Haque & Moore, 2004). The 𝑊𝐶𝐻𝑅𝑆 metric enables manager to
effectively make decisions on choosing the appropriate level of set based design (vs. point based
design) to run future tasks based on performance information that the model provides.
A key aspect in the product development process is the effectivecaptureofcustomers’subjective
statements of requirements for the products and services (voice of the customer). The next step is
to effectively convert these requirements into objective characteristics for products and services
which appropriately correspond and meet the demands of all stakeholders. Quality function
deployment (QFD) is one of the powerful tools widely used in the industry which will streamline
this process. This will result in a reduction in the effort spent on development of features and
products which does not comply with customers’ requirements (reduction in value of
the 𝑊𝐶𝐻𝑅𝑆 metrics) and are a waste of time, cost and resources and affect project schedule and
budget.
Before charging to a task for the first time, engineers need to analyze requirements of the task
and mentally prepare themselves. This process is time consuming. Depending on the task type,
task complexity, and skills and proficiency of the engineers, this preparation may require some
minutes to several hours.
𝐹𝑇𝑆𝐸𝑇𝑈𝑃̅̅ ̅̅ ̅̅ ̅̅ ̅̅ ̅̅ ̅ = 𝐹𝑇𝑆𝑇 × �̅� (12)
59
where 𝐹𝑇𝑆𝐸𝑇𝑈𝑃̅̅ ̅̅ ̅̅ ̅̅ ̅̅ ̅̅ ̅ represents average first-time setup time, and 𝐹𝑇𝑆𝑇 is a predetermined value
that represents average time required for an engineer to setup for a task for the first time.
Any type of setup is a non-value-added activity and reducing it is an important goal of lean.
Single Minute Exchange of Die (SMED) developed by Shigeo Shingo is one of the most well-
known methods of setup reduction in lean manufacturing.
In addition to first time setup, each time an engineer charges to a task, or there is a change of
tasks occurring, some effort (intellectual, paperwork, or computer) is required to prepare
engineer for the task.
𝑆𝐸𝑇𝑈𝑃̅̅ ̅̅ ̅̅ ̅̅ ̅ =𝑆𝑇 × ∑ ∑ ∑ 𝑆𝐸𝑇𝑈𝑃𝑖𝑗𝑘 × 𝑇𝐷𝑖𝑗
𝑙𝑘=1
𝑚𝑗=1
𝑛𝑖=1
𝑛
(13)
where 𝑆𝐸𝑇𝑈𝑃̅̅ ̅̅ ̅̅ ̅̅ ̅ represents average setup time, 𝑆𝑇 is a predetermined value that refers to the
average time required for an engineer to setup for a task, and 𝑆𝐸𝑇𝑈𝑃𝑖𝑗𝑘 is a binary variable
where 𝑆𝐸𝑇𝑈𝑃𝑖𝑗𝑘 = 1 if CHRSijk > 0, and 𝑆𝐸𝑇𝑈𝑃𝑖𝑗𝑘
= 0 otherwise. All charged hours to a task
on a non-touch day are considered waste and are later categorized as wasted setup in the model.
To prevent recalculation of setups for these charges, 𝑆𝐸𝑇𝑈𝑃𝑖𝑗𝑘 is multiplied by 𝑇𝐷𝑖𝑗 in the
formula above.
For each time an engineer that has more than a predetermined period of inactivity (no charge) on
a given task and charges again to the task after this period, another type of setup called restart
(𝑅𝑆𝑇𝑅𝑇) is determined in the model. This restart is assigned to account for extra preparation and
review that is required before charging again to the task and is different from the regular setup
mentioned earlier.
60
𝑅𝑆𝑇𝑅𝑇̅̅ ̅̅ ̅̅ ̅̅ ̅ =𝑅𝑇 × ∑ ∑ ∑ 𝑅𝑆𝑇𝑅𝑇𝑖𝑗𝑘
𝑙𝑘=1
𝑚𝑗=1
𝑛𝑖=1
𝑛
(14)
where 𝑅𝑆𝑇𝑅𝑇̅̅ ̅̅ ̅̅ ̅̅ ̅ represents average restart time, 𝑅𝑇 is a predetermined value referring to the
average time required for an engineer to restart for a task, 𝑅𝑆𝑇𝑅𝑇𝑖𝑗𝑘 is a binary variable where
𝑅𝑆𝑇𝑅𝑇𝑖𝑗𝑘 = 1 if there is a period of more than 𝑅𝑃 days of inactivity between the charge of
engineer 𝑘 on day 𝑗 to task 𝑖 and the last charge of that engineer to the task, and 𝑅𝑆𝑇𝑅𝑇𝑖𝑗𝑘 = 0
otherwise. 𝑅𝑃 is the predetermined duration of inactivity period that requires the engineer to
restart prior to charging to the task again.
As mentioned earlier, all charged hours to tasks on non-touch days are considered waste and are
classified as wasted setup.
𝑊𝑆𝐸𝑇𝑈𝑃̅̅ ̅̅ ̅̅ ̅̅ ̅̅ ̅̅ =∑ ∑ ∑ 𝐶𝐻𝑅𝑆𝑖𝑗𝑘 × (1 − 𝑇𝐷𝑖𝑗)𝑙
𝑘=1𝑚𝑗=1
𝑛𝑖=1
𝑛
(15)
where 𝑊𝑆𝐸𝑇𝑈𝑃̅̅ ̅̅ ̅̅ ̅̅ ̅̅ ̅̅ represents average wasted setup.
Rework is a major contributor to waste, leading to poor cost and schedule performance. Rework
iterations are time and resource consuming. Rework here refers to extra iterations that are
performed to correct work (information) already completed. In engineering work, rather by doing
non-value-added activities, waste is mostly created by performing value-added activities with the
wrong information which imposes a lot of rework on the engineering system (Browning, 2000).
Insufficient quality of information, low quality processing, change in requirements, and
availability of new information are among factors leading to rework.
𝑅𝐻𝑅𝑆̅̅ ̅̅ ̅̅ ̅̅ =∑ ∑ ∑ 𝑅𝐻𝑅𝑆𝑖𝑗𝑘
𝑙𝑘=1
𝑚𝑗=1
𝑛𝑖=1
𝑛
(16)
where 𝑅𝐻𝑅𝑆̅̅ ̅̅ ̅̅ ̅̅ represents average rework, and 𝑅𝐻𝑅𝑆𝑖𝑗𝑘 is the rework hours (hours spent on a task
to correct the work already done) charged to task 𝑖 on day 𝑗 by engineer 𝑘.
61
Available working time (𝐴𝐻𝑅𝑆) is simply the total amount of hours engineers were available to
work on value stream tasks during the measurement period.
𝐴𝐻𝑅𝑆 = ∑ ∑ 𝐴𝐻𝑅𝑆𝑗𝑘𝑙𝑘=1
𝑚𝑗=1 (17)
where 𝐴𝐻𝑅𝑆 represents the available working time, and 𝐴𝐻𝑅𝑆𝑗𝑘 is the available working hours
of engineer 𝑘 on day 𝑗.
A significant amount of an engineer’s availableworking time is spent on required non-value-
added activities such as creating presentations, reports, updating databases and schedules, or
other tasks which are an inappropriateuseofanengineer’sskills (Bauch, 2004). In aerospace,
roughly every engineering task requires a formal process for tractability, quality, safety, and
regulatory purposes. These formal processes mostly refer to outdated practices, and include
irrelevant data, or lack key practices and lead to inefficiency of engineering processes
(McManus, Haggerty, & Murman, 2005). Recent defense contracts also suffer from a significant
amount of required non-value-added activities such as ample administrative responsibilities,
complex reports, approvals, and releases (Oppenheim, 2004). Time spent on such required non-
value-added activities must be minimized and eliminated where possible. RNVA time variable in
this model, allows for evaluation of time spent on such activities in order to highlight this
wasteful dimension of engineering work and promote minimizing it.
RNVA time reflects the amount of time engineers do not charge directly to activities that
progress a value stream task towards completion but they work on necessary supporting tasks
e.g. the time spent to review work (inspection), create reports and presentations for a task. The
amount of non-productive time can also be classified into this variable (e.g. time that engineers
spend waiting for information, approvals, and verifications).
62
𝑅𝑁𝑉𝐴 = 𝐴𝐻𝑅𝑆 − [𝐻𝑅𝐷 + 𝐼𝑊𝐼𝑃 + 𝑊𝐶𝐻𝑅𝑆] (18)
where 𝑅𝑁𝑉𝐴 represents the RNVA (required non-value-added time) time. It should be noted that
while measuring charged hours to tasks for the period of measurement, the amount of time that is
spent on such supporting activities should not be included in the charged hours (𝐶𝐻𝑅𝑆𝑖𝑗𝑘) in
order to enable calculation of such metric using this equation.
Next, the calculation of waste for the value stream is performed. Average waste for completed
tasks is evaluated by aggregating the average values of first-time setup, setup, restart, wasted
setup, and rework.
𝑊𝐴𝑆𝑇𝐸̅̅ ̅̅ ̅̅ ̅̅ ̅̅𝐼 = 𝐹𝑇𝑆𝐸𝑇𝑈𝑃̅̅ ̅̅ ̅̅ ̅̅ ̅̅ ̅̅ ̅ + 𝑆𝐸𝑇𝑈𝑃̅̅ ̅̅ ̅̅ ̅̅ ̅ + 𝑅𝑆𝑇𝑅𝑇̅̅ ̅̅ ̅̅ ̅̅ ̅ + 𝑊𝑆𝐸𝑇𝑈𝑃̅̅ ̅̅ ̅̅ ̅̅ ̅̅ ̅̅ + 𝑅𝐻𝑅𝑆̅̅ ̅̅ ̅̅ ̅̅ (19)
𝑊𝐴𝑆𝑇𝐸̅̅ ̅̅ ̅̅ ̅̅ ̅̅𝐼 is the average waste for completed tasks.
𝑊𝑃𝐶𝑌̅̅ ̅̅ ̅̅ ̅̅�̅� = 100 ×
𝑊𝐴𝑆𝑇𝐸̅̅ ̅̅ ̅̅ ̅̅ ̅̅𝐼
𝐶𝐻𝑅𝑆̅̅ ̅̅ ̅̅ ̅̅
(20)
𝑊𝑃𝐶𝑌̅̅ ̅̅ ̅̅ ̅̅�̅� is the percentage waste for completed tasks.
Average waste for active incomplete tasks is evaluated by calculating the five mentioned waste
metrics for active incomplete tasks by replacing set of completed tasks (𝑖 ∈ 𝐼 = 1, . . , 𝑛) with the
set of active incomplete tasks (𝑖′ ∈ 𝐼′ = 1, . . , 𝑛′) in the equation above and calculating each
metric for active incomplete tasks.
𝑊𝐴𝑆𝑇𝐸̅̅ ̅̅ ̅̅ ̅̅ ̅̅𝐼′ = 𝐹𝑇𝑆𝐸𝑇𝑈𝑃̅̅ ̅̅ ̅̅ ̅̅ ̅̅ ̅̅
�̅�′ + 𝑆𝐸𝑇𝑈𝑃̅̅ ̅̅ ̅̅ ̅̅�̅�′ + 𝑅𝑆𝑇𝑅𝑇̅̅ ̅̅ ̅̅ ̅̅
�̅�′ + 𝑊𝑆𝐸𝑇𝑈𝑃̅̅ ̅̅ ̅̅ ̅̅ ̅̅ ̅̅𝐼′ + 𝑅𝐻𝑅𝑆̅̅ ̅̅ ̅̅ ̅̅
𝐼′ (21)
where 𝑊𝐴𝑆𝑇𝐸̅̅ ̅̅ ̅̅ ̅̅ ̅̅𝐼′ is the average waste for active incomplete tasks.
𝑊𝑃𝐶𝑌̅̅ ̅̅ ̅̅ ̅̅�̅�′ = 100 ×
𝑊𝐴𝑆𝑇𝐸̅̅ ̅̅ ̅̅ ̅̅ ̅̅𝐼′
𝐼𝑊𝐼𝑃𝑛′
(22)
𝑊𝑃𝐶𝑌̅̅ ̅̅ ̅̅ ̅̅�̅�′ is the percentage waste for active incomplete tasks.
63
Finally, by adding wasted charged hours and RNVA time to the sum of waste of completed tasks
and active incomplete tasks, the total amount of waste (𝑇𝑊𝐴𝑆𝑇𝐸) in the engineering value
stream is evaluated.
𝑇𝑊𝐴𝑆𝑇𝐸 = (𝑛 × 𝑊𝐴𝑆𝑇𝐸̅̅ ̅̅ ̅̅ ̅̅ ̅̅𝐼) + (𝑛′ × 𝑊𝐴𝑆𝑇𝐸̅̅ ̅̅ ̅̅ ̅̅ ̅̅
𝐼′) + 𝑊𝐶𝐻𝑅𝑆 + 𝑅𝑁𝑉𝐴 (23)
where 𝑇𝑊𝐴𝑆𝑇𝐸 represents the total waste.
𝑊𝑃𝐶𝑌̅̅ ̅̅ ̅̅ ̅̅ ̅ = 100 ×𝑇𝑊𝐴𝑆𝑇𝐸
𝐴𝐻𝑅𝑆
(24)
𝑊𝑃𝐶𝑌̅̅ ̅̅ ̅̅ ̅̅ ̅ is the percentage total waste.
Year to date throughput hours (𝑇𝑌) is the difference between available working hours and total
waste.
𝑇𝑌 = 𝐴𝐻𝑅𝑆 − 𝑇𝑊𝐴𝑆𝑇𝐸 (25)
where 𝑇𝑌 refers to the year to date throughput hours.
𝑇𝐷 =𝑇𝑌
𝑚
(26)
𝑇𝐷 is the daily throughput, and 𝑚 is the number of working days within measurement period.
𝑇𝐷𝑃𝑅𝐻 =𝑇𝑌
𝐴𝐻𝑅𝑆
(27)
where 𝑇𝐷𝑃𝑅𝐻 represents throughput delivered per resource hour.
Rework rate is calculated as the total amount of rework hours charged to completed tasks over
the hours delivered.
𝑅𝑅 =∑ ∑ ∑ 𝑅𝐻𝑅𝑆𝑖𝑗𝑘
𝑙𝑘=1
𝑚𝑗=1
𝑛𝑖=1
𝐻𝑅𝐷
(28)
where 𝑅𝑅 represents rework rate.
For each completed task, the processing time (𝑃𝑇𝑖) is evaluated.
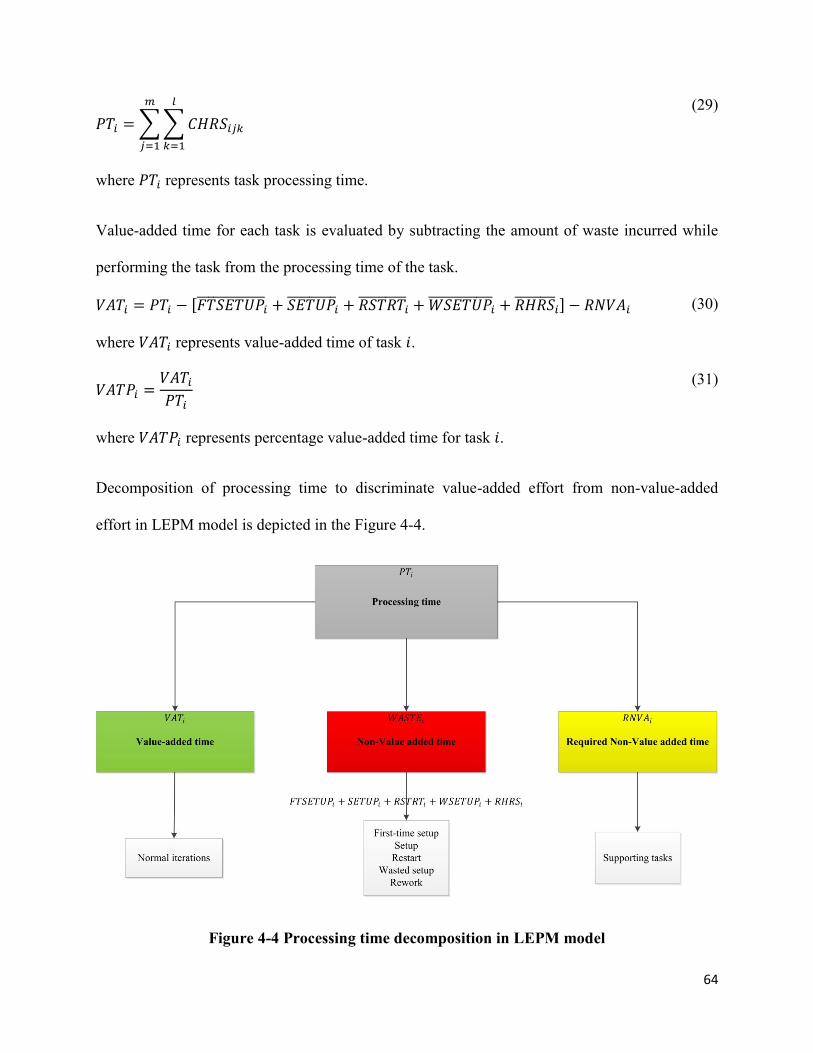
64
𝑃𝑇𝑖 = ∑ ∑ 𝐶𝐻𝑅𝑆𝑖𝑗𝑘
𝑙
𝑘=1
𝑚
𝑗=1
(29)
where 𝑃𝑇𝑖 represents task processing time.
Value-added time for each task is evaluated by subtracting the amount of waste incurred while
performing the task from the processing time of the task.
𝑉𝐴𝑇𝑖 = 𝑃𝑇𝑖 − [𝐹𝑇𝑆𝐸𝑇𝑈𝑃̅̅ ̅̅ ̅̅ ̅̅ ̅̅ ̅̅�̅� + 𝑆𝐸𝑇𝑈𝑃̅̅ ̅̅ ̅̅ ̅̅
�̅� + 𝑅𝑆𝑇𝑅𝑇̅̅ ̅̅ ̅̅ ̅̅�̅� + 𝑊𝑆𝐸𝑇𝑈𝑃̅̅ ̅̅ ̅̅ ̅̅ ̅̅ ̅̅
𝑖 + 𝑅𝐻𝑅𝑆̅̅ ̅̅ ̅̅ ̅̅𝑖] − 𝑅𝑁𝑉𝐴𝑖 (30)
where 𝑉𝐴𝑇𝑖 represents value-added time of task 𝑖.
𝑉𝐴𝑇𝑃𝑖 =𝑉𝐴𝑇𝑖
𝑃𝑇𝑖
(31)
where 𝑉𝐴𝑇𝑃𝑖 represents percentage value-added time for task 𝑖.
Decomposition of processing time to discriminate value-added effort from non-value-added
effort in LEPM model is depicted in the Figure 4-4.
Figure 4-4 Processing time decomposition in LEPM model
65
Now, the engineering performance during measurement period is compared to a previously
established baseline.
𝑊𝑃𝐶𝐼̅̅ ̅̅ ̅̅ ̅̅ = 𝑊𝑃𝐶𝐵̅̅ ̅̅ ̅̅ ̅̅ ̅ − 𝑊𝑃𝐶𝑌̅̅ ̅̅ ̅̅ ̅̅ ̅ (32)
where 𝑊𝑃𝐶𝐼̅̅ ̅̅ ̅̅ ̅̅ represents percentage waste improvement, and 𝑊𝑃𝐶𝐵̅̅ ̅̅ ̅̅ ̅̅ ̅ is the percentage waste
baseline that is used as a standard to benchmark performance against.
Year to date throughput improvement (𝑇𝐼) is the difference between year to date throughput
hours and prorated baseline throughput hours.
𝑇𝐼 = 𝑇𝑌 − (𝑇𝐵 × 𝑀
12)
(33)
where 𝑇𝐼 represents year to date throughput improvement, 𝑇𝑌 is the year to date throughput
hours, 𝑇𝐵 is the baseline throughput, and 𝑀 is the number of months within the period of
measurement used to prorate the baseline throughput hours.
Major benefits of lean implementation in the engineering process are lead time reduction, waste
reduction, throughput improvement, and intellectual work in progress inventory reduction. These
values are calculated using an hourly engineering rate (𝑅) in this model (Beauregard, Thomson,
& Bhuiyan, 2008).
Lead time reduction savings can be achieved by a reduction of the number of non-touch days
and/or a reduction of the average task lead time as discussed earlier. A reduction in the number
of non-touch days will decrease carrying cost for intellectual work in progress inventory
(𝐼𝑊𝐼𝑃). Holding tasks in inventory delays generation of potential revenues which can be earned
by delivering those tasks. Carrying cost for intellectual work in progress can be calculated using
weighted average cost of capital (WACC), or carrying cost (cc) (Beauregard, Thomson, &
Bhuiyan, 2008).
66
𝐿𝑇𝑅𝑁𝑇𝐷 = ((𝑁𝑇𝐷𝐵 ×
𝑀12) − 𝑁𝑇𝐷𝑌
𝑛 + 𝑛′) × 𝐼𝑊𝐼𝑃̅̅ ̅̅ ̅̅
�̅� × 𝑅 × 𝑐𝑐
(34)
where 𝐿𝑇𝑅𝑁𝑇𝐷 represents saving associated with a reduction in the number of non-touch days,
𝑁𝑇𝐷𝐵 is the baseline non-touch days, 𝑁𝑇𝐷𝑌 is the year to date non-touch days (total number of
non-touch days for all complete and active incomplete tasks), 𝐼𝑊𝐼𝑃̅̅ ̅̅ ̅̅�̅� is the average intellectual
work in progress inventory for current period (𝑃) and can be calculated using the following
formula: 𝐼𝑊𝐼𝑃̅̅ ̅̅ ̅̅�̅� = (
𝐼𝑊𝐼𝑃+𝐼𝑊𝐼𝑃𝑃−1
2), 𝑅 is the hourly engineering rate, and 𝑐𝑐 is the carrying cost
of intellectual inventory defined as a percentage of the inventory value.
A reduction in the average lead time results in saving achieved by an output differential of a lead
time delta.
𝐿𝑇𝑅𝐿𝑇 = (𝐿𝑇̅̅̅̅𝐵 − 𝐿𝑇̅̅̅̅
𝑌) × 𝑇𝐷 × 𝑅 (35)
𝐿𝑇𝑅𝐿𝑇 represents saving associated with average lead time reduction, 𝐿𝑇̅̅̅̅𝐵 is the baseline average
lead time, 𝐿𝑇̅̅̅̅𝑌 is the year to date average lead time, and 𝑇𝐷 is the daily throughput.
Lead time reduction saving is the sum of saving associated with a reduction in the number of
non-touch days and saving associated with average lead time reduction.
𝐿𝑇𝑅 = 𝐿𝑇𝑅𝑁𝑇𝐷 + 𝐿𝑇𝑅𝐿𝑇 (36)
where 𝐿𝑇𝑅 represents Lead time reduction.
Another lean engineering saving is intellectual inventory reduction (𝐼𝑅) that is a result of a
reduction in intellectual work in progress inventory level (compared to the baseline inventory
level) which leads to a carrying cost cutback (to reduce calculation fluctuations it can be carried
on a three month rolling average basis) (Beauregard, Thomson, & Bhuiyan, 2008).
67
𝐼𝑅 = ((𝐼𝑊𝐼𝑃𝐵 × 𝑀
12) − 𝐼𝑊𝐼𝑃𝑌) × 𝑅 × 𝑐𝑐
(37)
where 𝐼𝑅 represents intellectual inventory reduction, 𝐼𝑊𝐼𝑃𝐵 is the baseline intellectual work in
progress, and 𝐼𝑊𝐼𝑃𝑌 is the year to date intellectual work in progress.
Waste reduction (𝑊𝑅) is evaluated as the product of percentage waste improvement, available
working time, and hourly engineering rate.
𝑊𝑅 = 𝑊𝑃𝐶𝐼̅̅ ̅̅ ̅̅ ̅̅ × 𝐴𝐻𝑅𝑆 × 𝑅 (38)
where 𝑊𝑅 represents waste reduction.
Throughput saving (𝑇𝑆) is calculated as throughput improvement, times the hourly engineering
rate.
𝑇𝑆 = 𝑇𝐼 × 𝑅 (39)
where 𝑇𝑆 represents throughput saving.
And finally total lean savings is evaluated.
𝐿𝑆 = 𝐿𝑇𝑅 + 𝐼𝑅 + 𝑊𝑅 + 𝑇𝑆 (40)
where 𝐿𝑆 represents lean savings.
It should be noted that in this model, the value of throughput saving is equal to the value of waste
reduction, thus, one can remove savings resulting from throughput improvement from the lean
savings equation (Equation 40) to get a more balanced value of lean savings.
68
5 CASE COMPANY IMPLEMENTATION RESULTS AND ANALYSIS
In this chapter, the results of the implementation of the LEPM model in a case company are
discussed.
5.1 Case company description
The case studied is a small international engineering consultant company that provides civil
design (architectural, structural, electrical, and mechanical), supervision, and construction
services to its customers. The general design process in the case company comprises two phases.
Phase 1 includes developing preliminary architectural design and phase 2 includes developing
detailed structural and architectural designs. Due to confidentiality, the name of the company and
details of data will remain undisclosed.
The case company, from now on referred to as company A, agreed to collect and provide data
required for the model. During the measurement time, engineers involved in the company’s
construction design unit (architectural and structural design units) were asked to measure the
amount of time they spend daily on selected project tasks discriminating between work, rework,
and RNVA effort and record this data on the standard project timesheets of the company that are
used to keep track of the time spent on design projects. These measured values were primarily
verified by the managers of each engineering unit to avoid any measurement inconsistencies. The
data collection process was conducted inside the company. The required data for the model was
extracted from the project timesheets for the selected project tasks by the managers of each
engineering unit. Finally, the data was validated by the senior manager of the company and was
provided in order to have the engineering performance of the company measured using the
LEPM model. Tasks studied are definable, tractable and are based on a high degree of legacy
69
knowledge of the company (required activities and processing steps are equal across different
tasks). Engineers determined the required values for fixed parameters of the model (such as
𝐹𝑇𝑆𝑇: average time required for a resource to setup for a task for the first time).
Differentiation of normal and extra iterations (rework) of work was done based on an internal
consensus between engineers. These wasteful iterations can occur in the design process due to a
number of reasons. Most of the wasteful design iterations occur in phase 2 of design inside the
company. For example, structural analysis of the preliminary architectural design may impose
changes and corrections to architectural design. These changes are required due to problems
associated with the feasibility or manufacturability of the design proposed by architects (due to
an engineering error made while trying to perfect the design). Changes made to any design can
impose rework on already developed plans and increase the magnitude of work required to
complete a task. These types of changes in design due to an engineering error are considered
pure waste. Moreover, drawings are sent to municipal authorities to be the validated. If a drawing
is rejected (e.g. due to violation of regulations), design changes and corrections are required by
authorities. Revisions should be made and the design needs to be resubmitted to authorities in
order to have it validated (this resubmission of design and having to redo the work already done
is pure waste and is considered rework in the company).
5.2 Performance measurement at case company
The LEPM model is used to track performance at two different levels inside Company A; at the
individual level and product family level. First, data regarding the performance of an
architectural engineer that works on the tasks of the same product family is presented and
70
discussed. Second, the performance of the design team comprising architectural and structural
engineers with respect to a selected value stream is discussed.
Data regarding performance at individual level was provided by the company and the
performance metrics were calculated (see Table 5-1). Eleven tasks were studied during the
measurement period. The status of each value stream task at the end of the measurement period
was determined and tasks were classified into model categories; 5 completed tasks, 5 active
incomplete tasks, and 1 non-active incomplete task.
Value stream available working time was evaluated (308 hours) and decomposed into VA, NVA,
and RNVA elements using available working time decomposition chart. Values of the
predetermined parameters of the model provided by the engineering team are as follows:
𝐹𝑇𝑆𝑇: Average time required for an engineer to setup for a task for the first time = 90 Minutes
𝑀𝑇𝑇𝑃𝑖: Minimum time required to effectively progress a task = 60 Minutes
𝑆𝑇: Average time required for an engineer to setup for a task: = 10 Minutes
𝑅𝑃: Inactivity period that requires the engineer to restart prior to charging to task = 5 Days
𝑅𝑇: Restart time = 45 Minutes
Rework is calculated as the sum of all the hours spent on correcting defective design.
Values of all lean engineering performance metrics are calculated using Microsoft Excel based
on the LEPM model equations presented in previous chapter and the performance is compared to
a previous performance of the company.
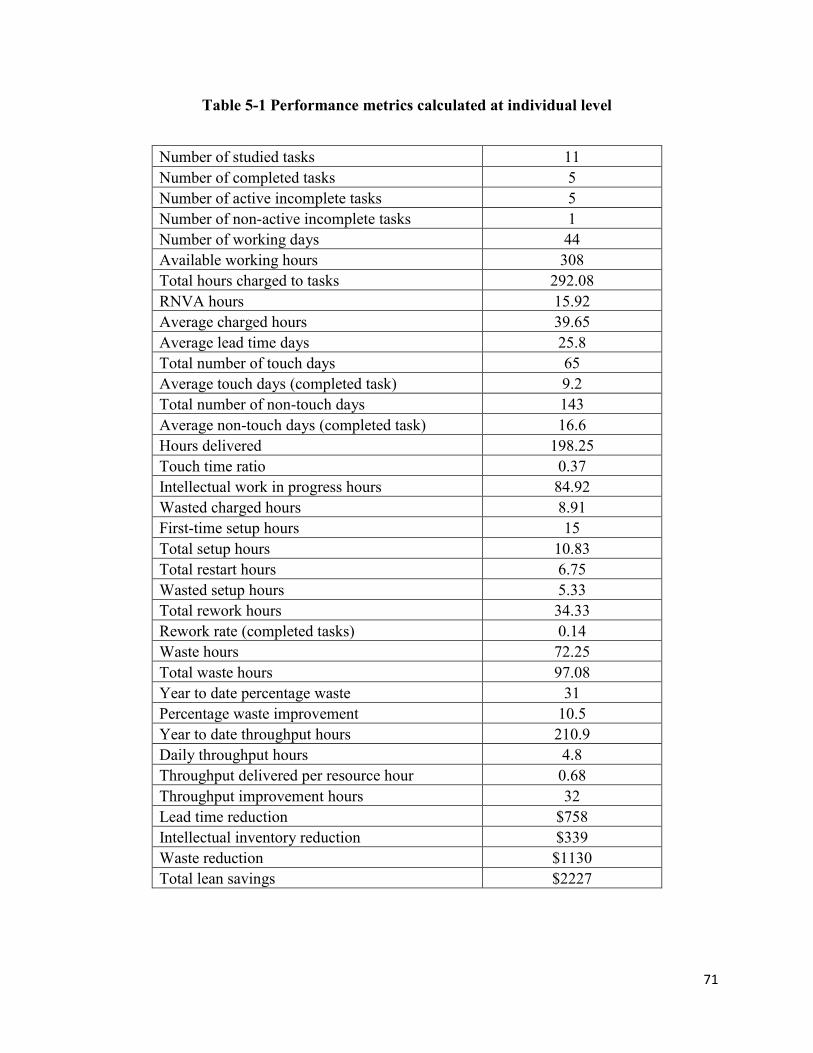
71
Table 5-1 Performance metrics calculated at individual level
Number of studied tasks 11
Number of completed tasks 5
Number of active incomplete tasks 5
Number of non-active incomplete tasks 1
Number of working days 44
Available working hours 308
Total hours charged to tasks 292.08
RNVA hours 15.92
Average charged hours 39.65
Average lead time days 25.8
Total number of touch days 65
Average touch days (completed task) 9.2
Total number of non-touch days 143
Average non-touch days (completed task) 16.6
Hours delivered 198.25
Touch time ratio 0.37
Intellectual work in progress hours 84.92
Wasted charged hours 8.91
First-time setup hours 15
Total setup hours 10.83
Total restart hours 6.75
Wasted setup hours 5.33
Total rework hours 34.33
Rework rate (completed tasks) 0.14
Waste hours 72.25
Total waste hours 97.08
Year to date percentage waste 31
Percentage waste improvement 10.5
Year to date throughput hours 210.9
Daily throughput hours 4.8
Throughput delivered per resource hour 0.68
Throughput improvement hours 32
Lead time reduction $758
Intellectual inventory reduction $339
Waste reduction $1130
Total lean savings $2227
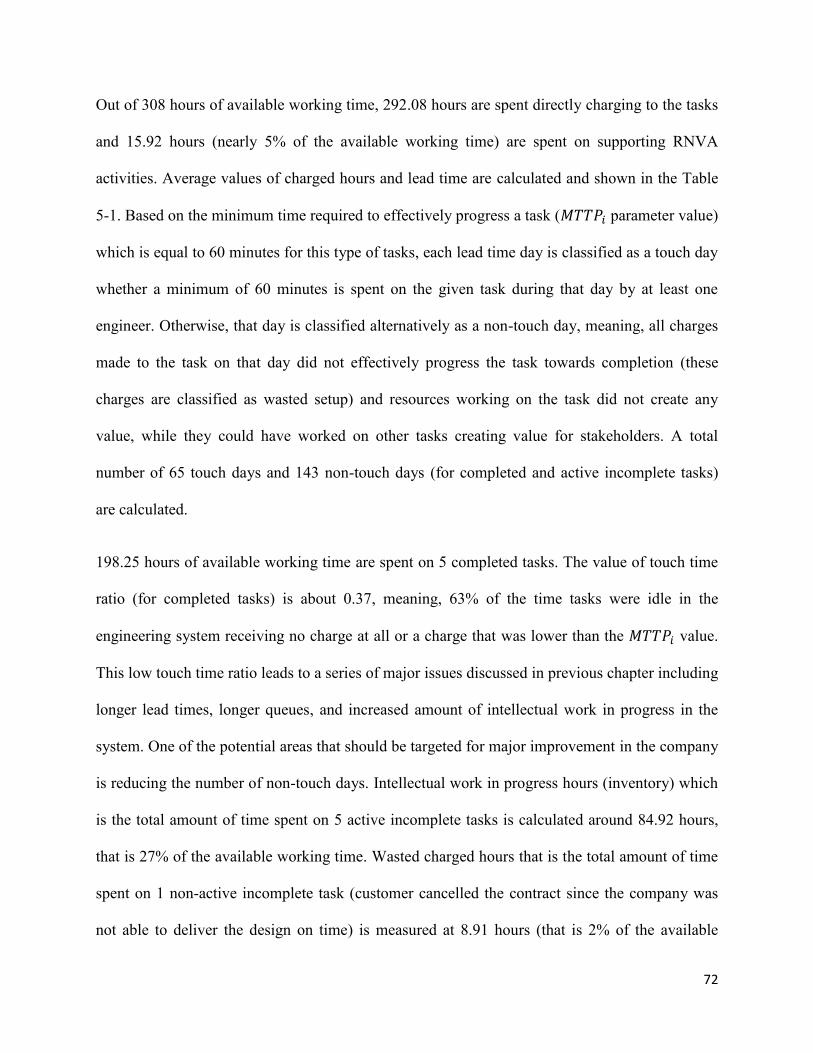
72
Out of 308 hours of available working time, 292.08 hours are spent directly charging to the tasks
and 15.92 hours (nearly 5% of the available working time) are spent on supporting RNVA
activities. Average values of charged hours and lead time are calculated and shown in the Table
5-1. Based on the minimum time required to effectively progress a task (𝑀𝑇𝑇𝑃𝑖 parameter value)
which is equal to 60 minutes for this type of tasks, each lead time day is classified as a touch day
whether a minimum of 60 minutes is spent on the given task during that day by at least one
engineer. Otherwise, that day is classified alternatively as a non-touch day, meaning, all charges
made to the task on that day did not effectively progress the task towards completion (these
charges are classified as wasted setup) and resources working on the task did not create any
value, while they could have worked on other tasks creating value for stakeholders. A total
number of 65 touch days and 143 non-touch days (for completed and active incomplete tasks)
are calculated.
198.25 hours of available working time are spent on 5 completed tasks. The value of touch time
ratio (for completed tasks) is about 0.37, meaning, 63% of the time tasks were idle in the
engineering system receiving no charge at all or a charge that was lower than the 𝑀𝑇𝑇𝑃𝑖 value.
This low touch time ratio leads to a series of major issues discussed in previous chapter including
longer lead times, longer queues, and increased amount of intellectual work in progress in the
system. One of the potential areas that should be targeted for major improvement in the company
is reducing the number of non-touch days. Intellectual work in progress hours (inventory) which
is the total amount of time spent on 5 active incomplete tasks is calculated around 84.92 hours,
that is 27% of the available working time. Wasted charged hours that is the total amount of time
spent on 1 non-active incomplete task (customer cancelled the contract since the company was
not able to deliver the design on time) is measured at 8.91 hours (that is 2% of the available
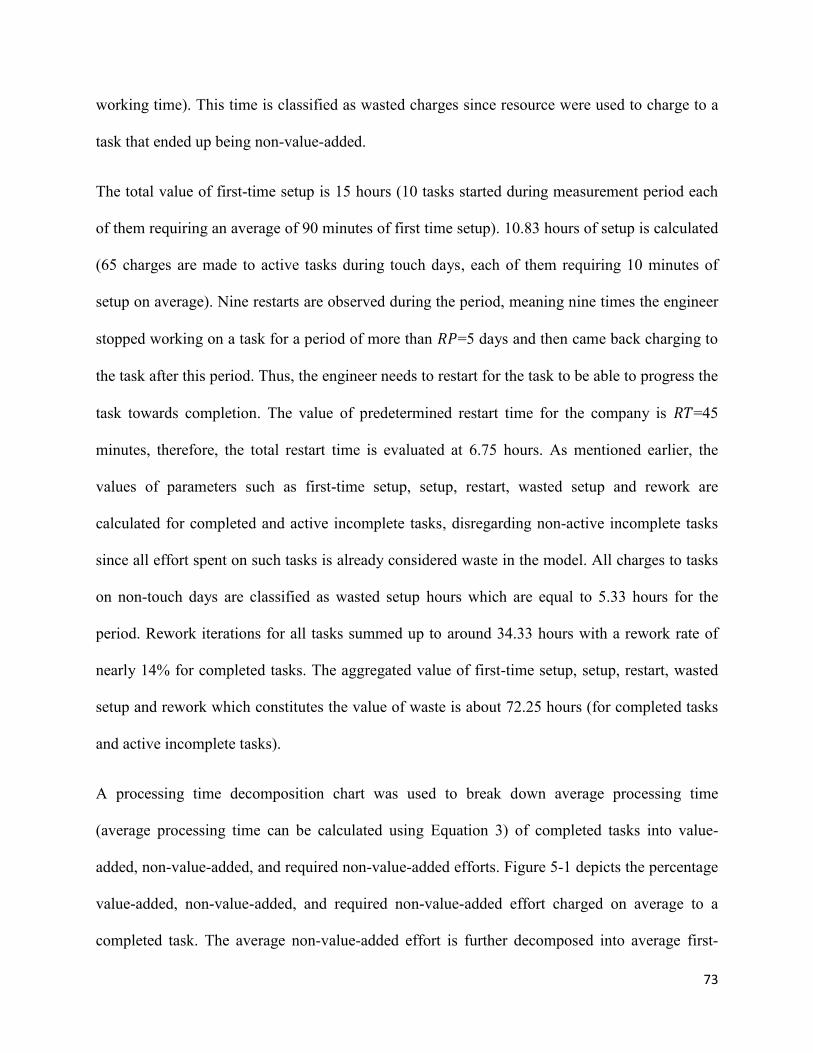
73
working time). This time is classified as wasted charges since resource were used to charge to a
task that ended up being non-value-added.
The total value of first-time setup is 15 hours (10 tasks started during measurement period each
of them requiring an average of 90 minutes of first time setup). 10.83 hours of setup is calculated
(65 charges are made to active tasks during touch days, each of them requiring 10 minutes of
setup on average). Nine restarts are observed during the period, meaning nine times the engineer
stopped working on a task for a period of more than 𝑅𝑃=5 days and then came back charging to
the task after this period. Thus, the engineer needs to restart for the task to be able to progress the
task towards completion. The value of predetermined restart time for the company is 𝑅𝑇=45
minutes, therefore, the total restart time is evaluated at 6.75 hours. As mentioned earlier, the
values of parameters such as first-time setup, setup, restart, wasted setup and rework are
calculated for completed and active incomplete tasks, disregarding non-active incomplete tasks
since all effort spent on such tasks is already considered waste in the model. All charges to tasks
on non-touch days are classified as wasted setup hours which are equal to 5.33 hours for the
period. Rework iterations for all tasks summed up to around 34.33 hours with a rework rate of
nearly 14% for completed tasks. The aggregated value of first-time setup, setup, restart, wasted
setup and rework which constitutes the value of waste is about 72.25 hours (for completed tasks
and active incomplete tasks).
A processing time decomposition chart was used to break down average processing time
(average processing time can be calculated using Equation 3) of completed tasks into value-
added, non-value-added, and required non-value-added efforts. Figure 5-1 depicts the percentage
value-added, non-value-added, and required non-value-added effort charged on average to a
completed task. The average non-value-added effort is further decomposed into average first-
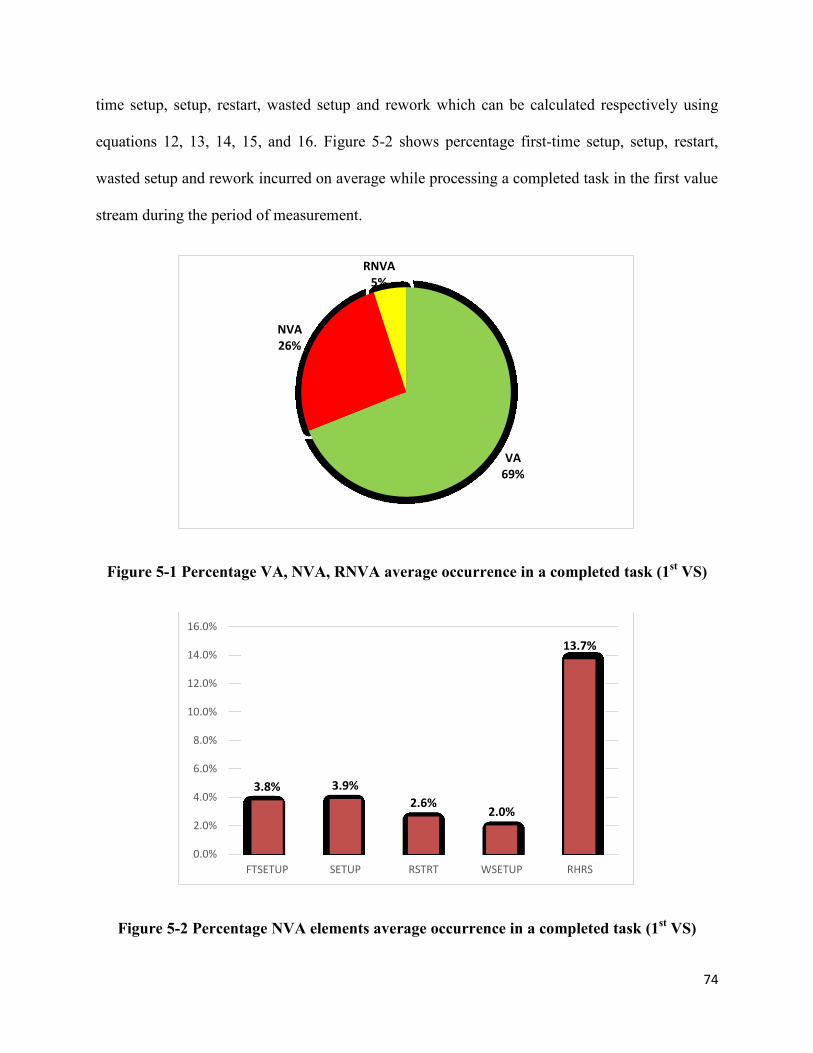
74
time setup, setup, restart, wasted setup and rework which can be calculated respectively using
equations 12, 13, 14, 15, and 16. Figure 5-2 shows percentage first-time setup, setup, restart,
wasted setup and rework incurred on average while processing a completed task in the first value
stream during the period of measurement.
Figure 5-1 Percentage VA, NVA, RNVA average occurrence in a completed task (1st VS)
Figure 5-2 Percentage NVA elements average occurrence in a completed task (1st VS)
VA 69%
NVA 26%
RNVA 5%
3.8% 3.9%
2.6% 2.0%
13.7%
0.0%
2.0%
4.0%
6.0%
8.0%
10.0%
12.0%
14.0%
16.0%
FTSETUP SETUP RSTRT WSETUP RHRS
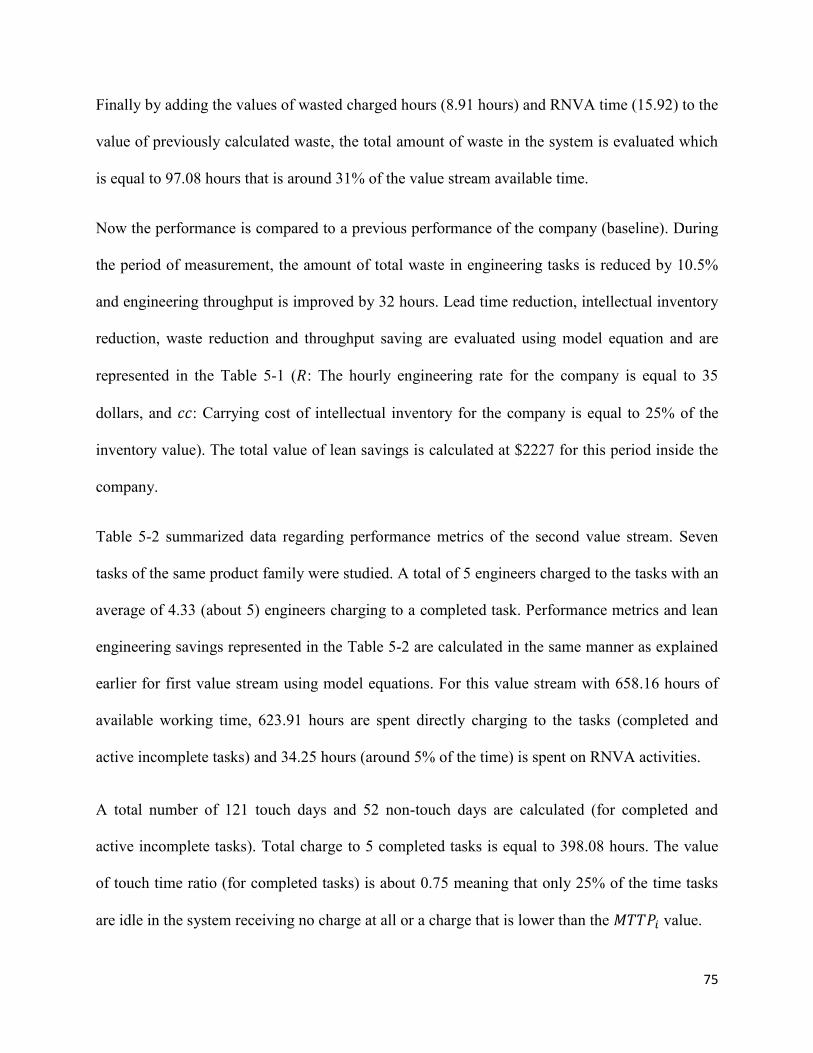
75
Finally by adding the values of wasted charged hours (8.91 hours) and RNVA time (15.92) to the
value of previously calculated waste, the total amount of waste in the system is evaluated which
is equal to 97.08 hours that is around 31% of the value stream available time.
Now the performance is compared to a previous performance of the company (baseline). During
the period of measurement, the amount of total waste in engineering tasks is reduced by 10.5%
and engineering throughput is improved by 32 hours. Lead time reduction, intellectual inventory
reduction, waste reduction and throughput saving are evaluated using model equation and are
represented in the Table 5-1 (𝑅: The hourly engineering rate for the company is equal to 35
dollars, and 𝑐𝑐: Carrying cost of intellectual inventory for the company is equal to 25% of the
inventory value). The total value of lean savings is calculated at $2227 for this period inside the
company.
Table 5-2 summarized data regarding performance metrics of the second value stream. Seven
tasks of the same product family were studied. A total of 5 engineers charged to the tasks with an
average of 4.33 (about 5) engineers charging to a completed task. Performance metrics and lean
engineering savings represented in the Table 5-2 are calculated in the same manner as explained
earlier for first value stream using model equations. For this value stream with 658.16 hours of
available working time, 623.91 hours are spent directly charging to the tasks (completed and
active incomplete tasks) and 34.25 hours (around 5% of the time) is spent on RNVA activities.
A total number of 121 touch days and 52 non-touch days are calculated (for completed and
active incomplete tasks). Total charge to 5 completed tasks is equal to 398.08 hours. The value
of touch time ratio (for completed tasks) is about 0.75 meaning that only 25% of the time tasks
are idle in the system receiving no charge at all or a charge that is lower than the 𝑀𝑇𝑇𝑃𝑖 value.
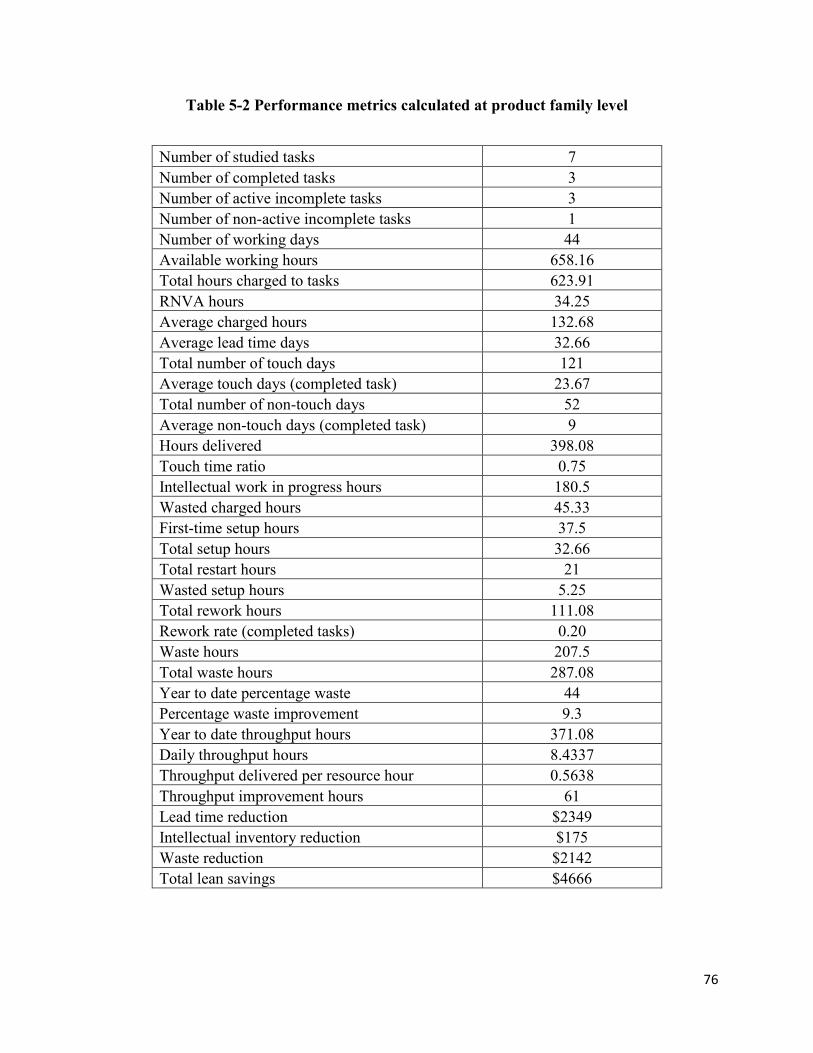
76
Table 5-2 Performance metrics calculated at product family level
Number of studied tasks 7
Number of completed tasks 3
Number of active incomplete tasks 3
Number of non-active incomplete tasks 1
Number of working days 44
Available working hours 658.16
Total hours charged to tasks 623.91
RNVA hours 34.25
Average charged hours 132.68
Average lead time days 32.66
Total number of touch days 121
Average touch days (completed task) 23.67
Total number of non-touch days 52
Average non-touch days (completed task) 9
Hours delivered 398.08
Touch time ratio 0.75
Intellectual work in progress hours 180.5
Wasted charged hours 45.33
First-time setup hours 37.5
Total setup hours 32.66
Total restart hours 21
Wasted setup hours 5.25
Total rework hours 111.08
Rework rate (completed tasks) 0.20
Waste hours 207.5
Total waste hours 287.08
Year to date percentage waste 44
Percentage waste improvement 9.3
Year to date throughput hours 371.08
Daily throughput hours 8.4337
Throughput delivered per resource hour 0.5638
Throughput improvement hours 61
Lead time reduction $2349
Intellectual inventory reduction $175
Waste reduction $2142
Total lean savings $4666
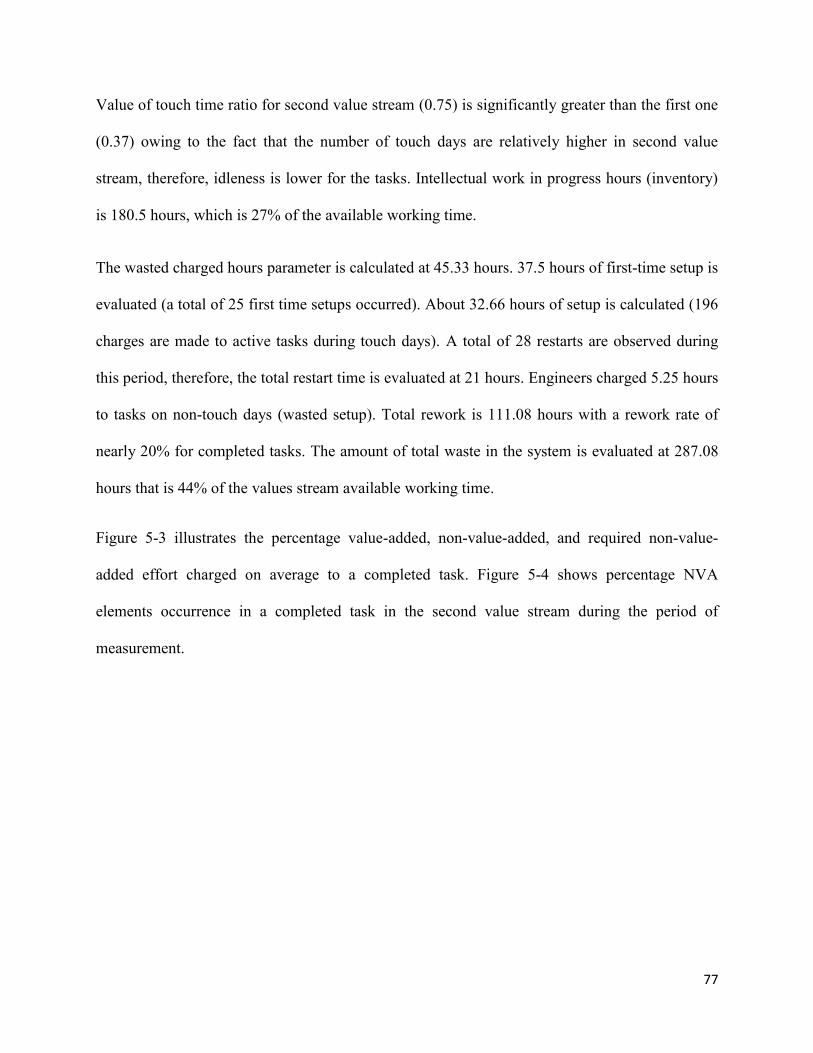
77
Value of touch time ratio for second value stream (0.75) is significantly greater than the first one
(0.37) owing to the fact that the number of touch days are relatively higher in second value
stream, therefore, idleness is lower for the tasks. Intellectual work in progress hours (inventory)
is 180.5 hours, which is 27% of the available working time.
The wasted charged hours parameter is calculated at 45.33 hours. 37.5 hours of first-time setup is
evaluated (a total of 25 first time setups occurred). About 32.66 hours of setup is calculated (196
charges are made to active tasks during touch days). A total of 28 restarts are observed during
this period, therefore, the total restart time is evaluated at 21 hours. Engineers charged 5.25 hours
to tasks on non-touch days (wasted setup). Total rework is 111.08 hours with a rework rate of
nearly 20% for completed tasks. The amount of total waste in the system is evaluated at 287.08
hours that is 44% of the values stream available working time.
Figure 5-3 illustrates the percentage value-added, non-value-added, and required non-value-
added effort charged on average to a completed task. Figure 5-4 shows percentage NVA
elements occurrence in a completed task in the second value stream during the period of
measurement.
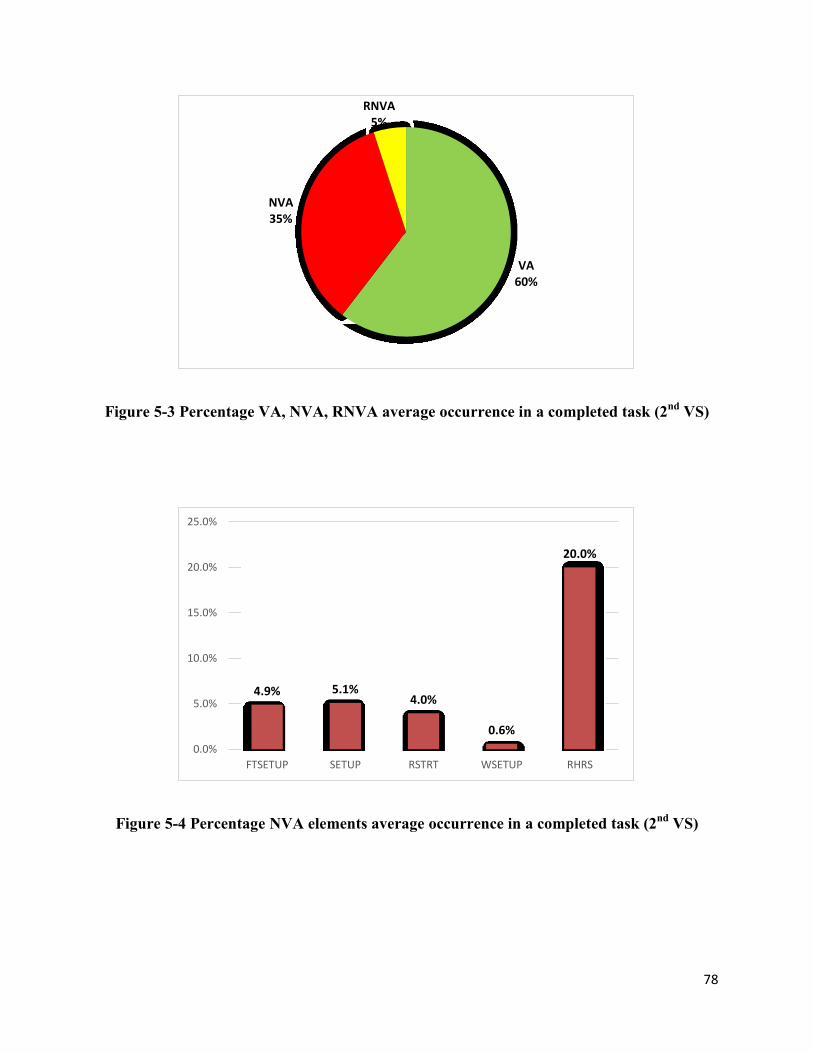
78
Figure 5-3 Percentage VA, NVA, RNVA average occurrence in a completed task (2nd
VS)
Figure 5-4 Percentage NVA elements average occurrence in a completed task (2nd
VS)
VA 60%
NVA 35%
RNVA 5%
4.9% 5.1% 4.0%
0.6%
20.0%
0.0%
5.0%
10.0%
15.0%
20.0%
25.0%
FTSETUP SETUP RSTRT WSETUP RHRS
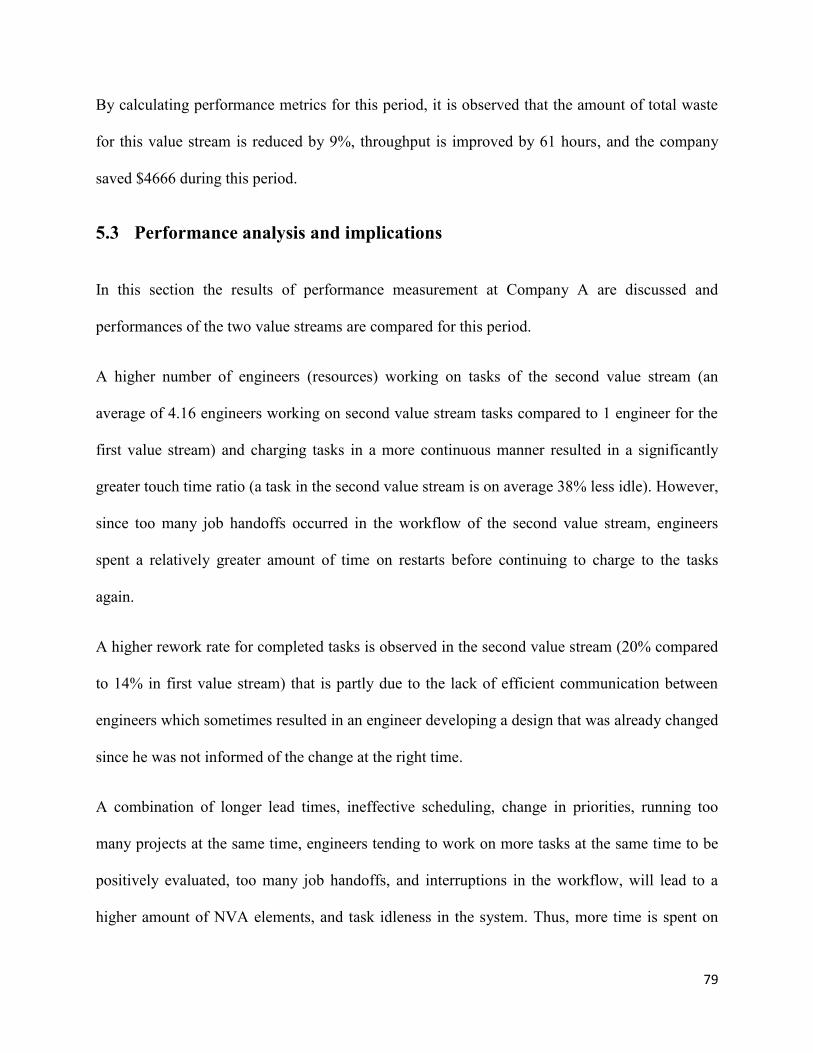
79
By calculating performance metrics for this period, it is observed that the amount of total waste
for this value stream is reduced by 9%, throughput is improved by 61 hours, and the company
saved $4666 during this period.
5.3 Performance analysis and implications
In this section the results of performance measurement at Company A are discussed and
performances of the two value streams are compared for this period.
A higher number of engineers (resources) working on tasks of the second value stream (an
average of 4.16 engineers working on second value stream tasks compared to 1 engineer for the
first value stream) and charging tasks in a more continuous manner resulted in a significantly
greater touch time ratio (a task in the second value stream is on average 38% less idle). However,
since too many job handoffs occurred in the workflow of the second value stream, engineers
spent a relatively greater amount of time on restarts before continuing to charge to the tasks
again.
A higher rework rate for completed tasks is observed in the second value stream (20% compared
to 14% in first value stream) that is partly due to the lack of efficient communication between
engineers which sometimes resulted in an engineer developing a design that was already changed
since he was not informed of the change at the right time.
A combination of longer lead times, ineffective scheduling, change in priorities, running too
many projects at the same time, engineers tending to work on more tasks at the same time to be
positively evaluated, too many job handoffs, and interruptions in the workflow, will lead to a
higher amount of NVA elements, and task idleness in the system. Thus, more time is spent on
80
NVA efforts (first-time setup, setup, restart, wasted setup and rework) while this time could be
minimized or eliminated to be used to create value.
Setup time is calculated each time a charge is made to a task, thus, as the number of resources
increases, setup time is also increased. Furthermore, processing tasks using smaller charges
requires more setup time (Fullerton & Wempe, 2009). In order to reduce setup hours in the
engineering process, companies need to reduce average time required for setup, reduce the
number of charges to tasks, or process tasks using larger charges.
The total amount of waste in the second value stream is 13% higher (44% compared to 31% in
the first value stream). It has to be noted that as the number of engineers working on tasks
increases, consequently due to an increase in the number of charges, job switching, and job hand-
offs, the values of first-time setup, setups, restarts, and rework is increased, therefore, more
waste is created in the engineering system. Thus, while the number of resources working on the
tasks is increased, an effective scheduling and communication must be put in place in order to
control and minimize creation of such wasteful activities.
During this period, by the use of model, improvement in performance is observed in every
dimension in both value streams due to a preliminary implementation of lean principles in the
engineering department of the company. The management agrees that there still remains a major
opportunity for improvement in their engineering department if the remaining obstacles are
tackled as it is just the start for them on their path to transform into a lean engineering company.
The implementation of the LEPM model in Company A enabled performance measurement at
different levels. It provided visibility on the waste hidden in their engineering process and
provided a tool for measuring that waste and tracking improvement efforts. As a result, setting
81
targets inside the company for improvement is now possible for the manager as the model
metrics provide a unified measurement system to coordinate all engineering effort inside
engineering department. Now, they can use the model to measure effects of different scheduling
and work processing approaches on performance of their engineering department and identify
best possible practice that suits their strategies.
One of the potential areas that should be immediately targeted for improvement is reducing the
number of non-touch days for the first value stream (by effective scheduling and changing work
approach). Engineers have begun to correct their work behavior to minimize waste parameters.
Before, engineers were interested in increasing the number of tasks they were working on at the
same time, instead of focusing on completing already started tasks and delivering them.
One significant achievement of model introduction and implementation in Company A was to
bring attention to existence of phenomena such as setups, restarts, wasted charged hours, and
other waste parameters in the engineering process. Upon introduction, engineers quickly
acknowledged the existence of such wasteful phenomena and stated that they occur in everyday
work. One engineer said “there was never any attempt made to discriminate these wasteful
efforts from normal work. No one ever evaluated how much time is spent on such wasteful
activities because they are considered to be an inherent part of normal work and not to be waste”.
5.4 Summary
The implementation of the LEPM model in the engineering process of a company that is
different in size (small engineering consultant company vs. major aerospace company) and
industry (civil vs. aerospace) compared to the company where the original model was designed
for and implemented, validates the fact that the new version of the model is applicable to the
82
engineering process in general and is not limited to any specific engineering process or
organization. The use of performance metrics and phenomena that exist in any engineering
process, modification of equations, and the use of flexible parameters for which the values are
determined in the company where the model is implemented, allow the model to be tailored and
adapted to the characteristics of any engineering process and company.
Performance measurement can influence organizational behavior to coordinate and align
engineering effort with the strategies of the organization (Neely, Gregory, & Platts, 2005). By
developing new performance indicators that measure and promote lean initiatives in the
engineering process, hidden omnipresent waste in engineering work becomes transparent,
therefore, dimensions of work that are critical to lean transformation are highlighted to receive
more attention of engineers thus enabling more improvement.
Lean tools and techniques impact different dimensions of work, hence, effective decision making
would be a complex task for managers if proper measures that can consolidate all these effects
into one scalar are not available (Bayou & Korvin, 2008). The LEPM model provides managers
insight into selection of the appropriate lean tools and techniques by measuring the effects of
implementation of such tools and techniques on performance. Therefore, it enables
benchmarking of lean performance at different levels and identifies the best practice.
83
6 CONCLUSIONS, LIMITATIONS, AND FUTURE RESEARCH
In this chapter, conclusions of the research, limitations, and future research opportunities are
discussed.
6.1 Conclusions
In this thesis, a lean engineering performance measurement (LEPM) model was developed to
address the need for a model that can measure the performance effects of implementing lean
initiatives in the engineering process. This research is aimed to improve the model developed by
Beauregard, Thomson, and Bhuiyan (2008) for an aerospace engineering company in terms of
measurement effectivity and model applicability in order to introduce a new model that can
measure the effects of adopting lean initiatives in any engineering process regardless of the
industry or size of the organization.
As part of the improvement, the model equations were modified; calculation of engineering
waste is extended to take into account entire value stream tasks (vs completed task); new metrics
are developed that account for those types of waste that are unique to the engineering process
and had received no attention in the design of existing measurement methods (most of the times
only waste concepts of manufacturing are considered and transferred to product development.); a
decomposition chart is developed for available working time that enables breaking down
engineering effort into VA, NVA, and RNVA elements. The most significant contribution of this
research is the development of new performance metrics and the decomposition chart. The
author believes lack of such metrics and a decomposition chart that provide visibility to hidden
waste inherent in the engineering effort is one of the reasons why such wasteful aspects are
neglected in the first place and are not targeted for immediate improvement.
84
Furthermore, performance metrics are properly linked and are presented as a model (and not
some individual metrics) that can measure engineering performance at different organizational
levels from a lean perspective and promotes lean in engineering. To measure leanness, most
existing methods treat lean as a set of some tools and base their evaluation on a subjective
assessment, while the LEPM model treats lean as a holistic system and objectively measures
performance. Hence, performance effects of implementing lean tools and techniques into
engineering process can be evaluated to track progress achieved towards fulfillment of lean goals
such as waste elimination, lead time reduction, intellectual inventory reduction, and throughput
improvement and also to identify best practice.
The original model was implemented in the engine design prcoess of a major aerospace company
(Beauregard, 2010). The new model presented here was successfully implemented in civil design
process of an engineering consultant company to measure lean engineering performance which
validates the general applicability of the new model.
Although the model measures performance of engineering process from a lean perspective, since
the performance dimensions being measured and targeted for improvement (waste elimination,
lead time reduction, intellectual inventory reduction, and throughput improvement) are of high
importance for any engineering process, the model can also be implemented as a performance
measurement system by companies who are seeking continuous improvement (and not directly
pursuing a lean process) to measure and track engineering performance. Phenomena described
and performance metrics developed for the model do not only exist in the engineering, but in the
knowledge-based processes as well, therefore, the model can also be implemented in knowledge-
based processes as a performance measurement tool.
85
While implementing the model to measure the performance of knowledge-based processes of
projects that are highly research intensive and are classified as research projects rather than
product development projects, the focus should be on minimizing waste. Although the required
activities of such projects are less known beforehand (due to higher uncertainty associated with
research projects) and the projects are more unique in nature which can lead to performance
variations across different projects (e.g. on lead time dimension), this would not affect the
importance of minimizing and eliminating NVA and RNVA activities that are performed while
executing these projects. The amount of time spent on activities such as first-time setup, setup,
restart, wasted setup, and rework that exist in any type of knowledge-based process creates no
value, therefore, it is a pure waste of time and resources of the company. Using resources to
deliver knowledge that ends up being of no value (classified as wasted charged hours in the
model) for the stakeholders is also a huge waste of time and resources. The amount of time that
is spent on performing necessary tasks such as research and development (R&D) and other
supporting tasks (RNVA time) such as creating presentations, reports, and attending meetings
should be minimized (to a certain extent when it comes to R&D) considering that resources can
use this time in order to directly charge and progress the tasks towards completion. To achieve
improvements on such wasteful dimension in order to increase the efficiency of the process, time
spent on such wasteful activities should be measured, controlled, and targeted for improvement.
The LEPM model provides a tool that can measure performance and track improvements on such
wasteful dimensions.
In multiple discussions on the LEPM model with academics, managers, engineers, and fellow
researchers, they all admitted that waste phenomena introduced in the model exist as inherent
parts of their normal everyday work, however, as in the case of the company, most admitted that
86
they had never made any effort to control and reduce the amount of time spent on such wasteful
activities as they are considered as part of normal effort and not waste.
6.2 Limitations and future research
The LEPM model is best applicable to measure performance of engineering tasks that are
definable, tractable, and are based on a high degree of legacy knowledge where required
processing steps and activities are known beforehand where benchmarking performance is more
appropriate.
For future research, an optimization model for scheduling engineering tasks can be developed
which takes into account performance metrics of LEPM model while minimizes engineering
waste and maximizes lean engineering performance.
The relationship between alternative scheduling algorithms and lean engineering performance
can be studied in order to identify optimum scheduling algorithm.
The performance effect of implementing lean tools and techniques in engineering process can
also be measured and analyzed.
If required data is available, the model can be implemented to benchmark leanness of
performance of engineering processes within and across industries to identify best in class
processes. Efficiency of product development processes, time spent on RNVA activities, tasks
classified in wasted charges category, and magnitude of waste metrics can also be examined in
detail and analyzed.
87
BIBLIOGRAPHY
Baines, T. S., Lightfoot, H., Williams, G. M., & Greenough, R. (2006). State-of-the-art in lean
design engineering: A literature review on white collar lean. Proceedings of the
Institution of Mechanical Engineers, Part B: Journal of Engineering Manufacture,
220(9), 1539-1547.
Bauch, C. (2004). Lean Product Development: making waste transparent. Diploma thesis,
Massachusetts Institute of Technology.
Bayou, M.E., & Korvin, A. D. (2008). Measuring the leanness of manufacturing systems—a case
study of Ford Motor Company and General Motors. Journal of Engineering and
Technology Management, 25(4), 287-304.
Beauregard, Y. (2010). A multi-criteria performance study of lean engineering. Thesis (Ph. D.)
Department of Mechanical and Industrial Engineering, Concordia University.
Beauregard, Y., Thomson, V., & Bhuiyan, N. (2008). Lean engineering logistics: load leveling of
design jobs with capacity considerations. Canadian Aeronautical and Space Journal,
54(2), 19-33.
Beisheim, N., & Stotz, F. (2013). Key Performance Indicators for Design and Engineering. In G.
R. Josip Stjepandić, Concurrent Engineering Approaches for Sustainable Product
Development in a Multi-Disciplinary Environment (pp. 341-351). Springer London.
Bhasin, S. (2011). Performance of organisations treating lean as an ideology. Business Process
Management Journal, 17 (6), 986 - 1011.
88
Brown, M. G., & Svenson, R. A. (1998). Measuring R&D productivity. Research-Technology
Management, 41(6), 30-35.
Browning, T. R. (2000). Value-based product development: refocusing lean. Engineering
Management Society, 2000. Proceedings of the 2000 IEEE, 168-172.
Chiesa, V., & Masella, C. (1996). Searching for an effective measure of R&D performance.
Management Decision, 34(7), 49-57.
Chiesa, V., Frattini, F., Lazzarotti, V., & Manzini, R. (2009). Performance measurement of
research and development activities. European Journal of Innovation Management,
12(1), 25-61.
Comm, C. L., & Mathaisel, D. F. (2000). A paradigm for benchmarking lean initiatives for
quality improvement. Benchmarking: An International Journal, 7(2), 118-128.
Costa, J. M., Rossi, M., Rebentisch, E., Terzic, S., Taisch, M., & Nightingale, D. (2014). What to
Measure for Success in Lean System Engineering Programs? Procedia Computer
Science, 28, 789-798.
Crute, V., Ward, Y., Brown, S., & Graves, A. (2003). Implementing Lean in aerospace—
challenging the assumptions and understanding the challenges. Technovation, 23(12),
917-928.
Driva, H., Pawar, K., & Menon, U. (2000). Measuring product development performance in
manufacturing organisations. International Journal of Production Economics, 63(2), 147-
159.
89
Driva, H., Pawar, K. S., & Menon, U. (2001). Performance evaluation of new product
development from a company perspective. Integrated Manufacturing Systems, 12(5),
368-378.
Fullerton, R. R., & Wempe, W. F. (2009). Lean manufacturing, non-financial performance
measures, and financial performance. International Journal of Operations & Production
Management, 29(3), 214-240.
Haque, B. (2003). Lean engineering in the aerospace industry. Proceedings of the Institution of
Mechanical Engineers, Part B: Journal of Engineering Manufacture, 217 (10), 1409-
1420.
Haque, B., & Moore, M. J. (2004). Measures of performance for lean product introduction in the
aerospace industry. Proceedings of the Institution of Mechanical Engineers, Part B:
Journal of Engineering Manufacture, 218(10), 1387-1398.
Hines, P., Holweg, M., & Rich, N. (2004). Learning to evolve: A review of contemporary lean
thinking. International Journal of Operations & Production Management, 24(10), 994-
1011.
Hoppmann, J., Rebentisch, E., Dombrowski, U., & Zahn, T. (2011). A Framework for
Organizing Lean Product Development. Engineering Management Journal, 23(1).
Karlsson, C., & Åhlström, P. (1996). The difficult path to lean product development. Journal of
Product Innovation Management, 13(4), 283-295.
90
Kato, J. (2005). Development of a Process for Continuous Creation of Lean Value in Product
Development Organizations. MS Thesis in Mechanical Engineering, Massachusetts
Institute of Technology.
Kerssens-van Drongelen, I. C., & Cooke, A. (1997). Design principles for the development of
measurement systems for research and development processes. R&D Management, 27(4),
345-357.
Kerssens-van Drongelen, I., Nixon, B., & Pearson, A. (2000). Performance measurement in
industrial R&D. International Journal of Management Reviews, 2(2), 111-143.
Kuczmarski, T. D. (2001). Five fatal flaws of innovation metrics. Marketing Management, 10(1),
34-39.
Lander, E., & Liker, J. K. (2007). The Toyota Production System and art: making highly
customized and creative products the Toyota way. International Journal of Production
Research, 45(16), 3681–3698.
Liker, J. K., & Morgan, J. M. (2006). The Toyota way in services: the case of lean product
development. The Academy of Management Perspectives 20(2), 5-20.
Mascarenhas Hornos da Costa, J., Oehmen, J., Rebentisch, E., & Nightingale, D. (2014). Toward
a better comprehension of Lean metrics for research and product development
management. R&D Management, 44(4), 370-383.
McManus, H. L. (2005). Product Development Value Stream Mapping (PDVSM) Manual.
Cambridge: The Lean Aerospace Initiative, Massachusetts Institute of Technology.
91
McManus, H., Haggerty, A., & Murman, E. (2005). Lean Engineering: Doing the Right Thing
Right. 1st International Conference on Innovation and Integration in Aerospace
Sciences, 4-5 August. Belfast, Northern Ireland.
Neely, A., Gregory, M., & Platts, K. (2005). Performance measurement system design A
literature review and research agenda. International Journal of Operations & Production
Management, 25 (12), 1228-1263.
Oehmen, J., & Rebentisch, E. (2010). Waste in lean product development. LAI Paper Series
Lean Product Development for Practitioners, Cambridge, MA, LAI and MIT.
Oehmen, J., Oppenheim, B. W., Secor, D., Norman, E., Rebentisch, E., Sopko, J. A., ... &
Driessnack, J. (2012). The Guide to Lean Enablers for Managing Engineering Programs,
Version 1. Cambridge, MA: Joint MIT-PMI-INCOSE Community of Practice on Lean in
Program Management,.
Oppenheim, B. W. (2004). Lean Product Development Flow. Systems Engineering, 7(4), 352-
376.
Parry, G. C., & Turner, C. E. (2006). Application of lean visual process management tools.
Production Planning & Control, 17(1), 77-86.
Shah, R., & Ward, P. T. (2003). Lean manufacturing: context, practice bundles, and
performance. Journal of Operations Management, 21(2), 129-149.
Soriano-Meier, H., & Forrester, P. L. (2002). A model for evaluating the degree of leanness of
manufacturing firms. Integrated Manufacturing Systems, 13(2), 104-109.
92
Tatikonda, M. V. (2008). Product Development Performance Measurement. In S. K. Christoph
H. Loch, Handbook of New Product Development Management (pp. 200-215). Oxford,
United Kingdom: Elsevier.
Teresko, J. (2008). The Future of R&D: Leveraging Innovation. Industry Week, Penton
Publishing, Cleveland, Ohio, USA, May 2008, Downloaded from
http://www.goldensegroupinc.com/CompPub/Quotations/the-future-of-research-and-
development-leveraging-innovation-Q33.shtml.
Womack, J. P., & Jones, D. T. (2003). Banish Waste and Create Wealth in Your Corporation,
Revised and Updated. New York: Free Press.
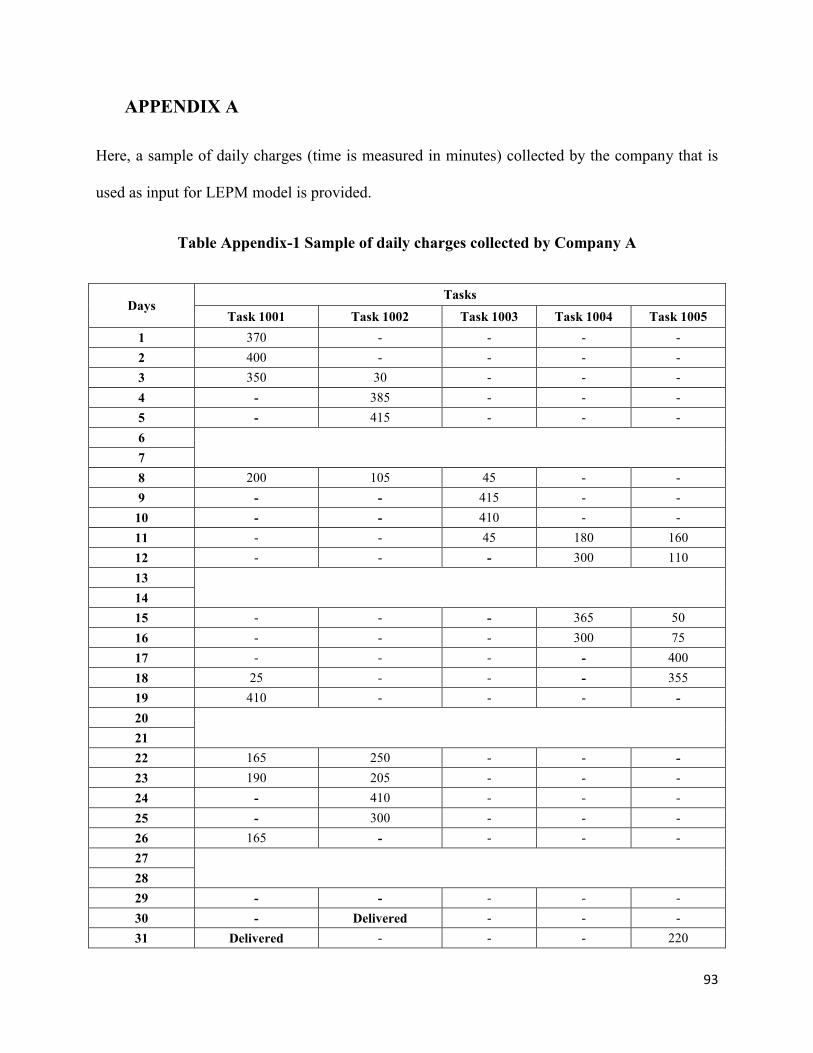
93
APPENDIX A
Here, a sample of daily charges (time is measured in minutes) collected by the company that is
used as input for LEPM model is provided.
Table Appendix-1 Sample of daily charges collected by Company A
Days Tasks
Task 1001 Task 1002 Task 1003 Task 1004 Task 1005
1 370 - - - -
2 400 - - - -
3 350 30 - - -
4 - 385 - - -
5 - 415 - - -
6
7
8 200 105 45 - -
9 - - 415 - -
10 - - 410 - -
11 - - 45 180 160
12 - - - 300 110
13
14
15 - - - 365 50
16 - - - 300 75
17 - - - - 400
18 25 - - - 355
19 410 - - - -
20
21
22 165 250 - - -
23 190 205 - - -
24 - 410 - - -
25 - 300 - - -
26 165 - - - -
27
28
29 - - - - -
30 - Delivered - - -
31 Delivered - - - 220
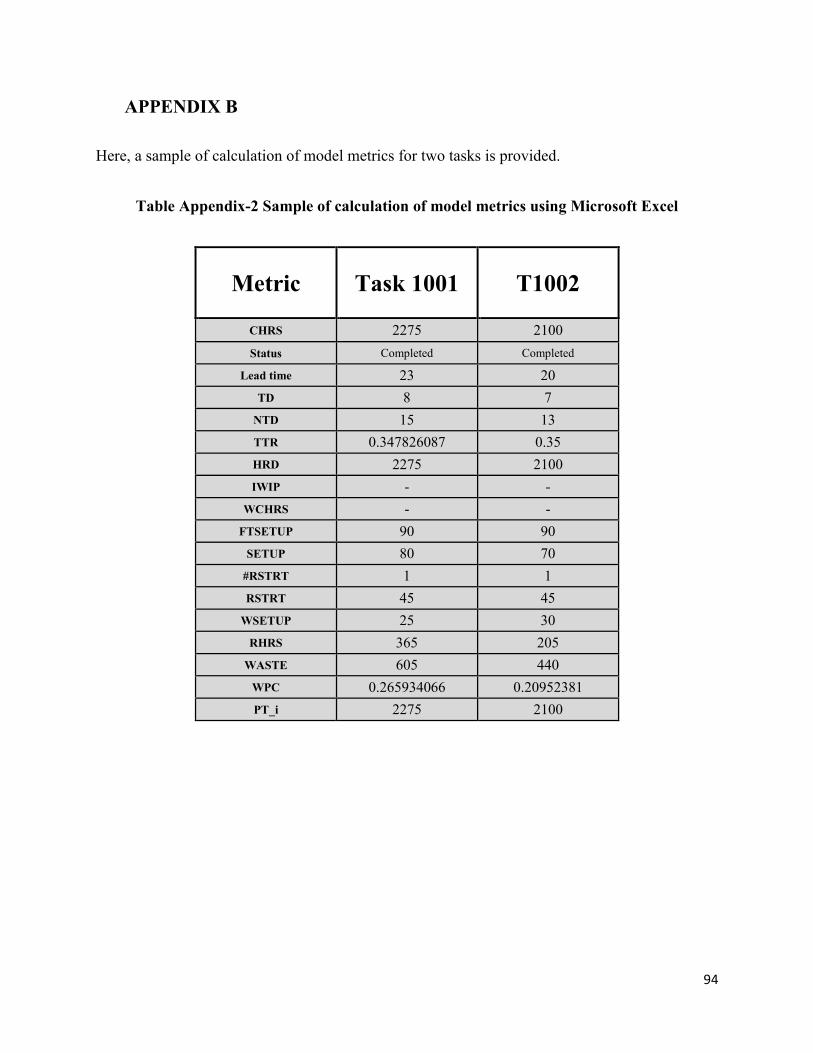
94
APPENDIX B
Here, a sample of calculation of model metrics for two tasks is provided.
Table Appendix-2 Sample of calculation of model metrics using Microsoft Excel
Metric Task 1001 T1002
CHRS 2275 2100
Status Completed Completed
Lead time 23 20
TD 8 7
NTD 15 13
TTR 0.347826087 0.35
HRD 2275 2100
IWIP - -
WCHRS - -
FTSETUP 90 90
SETUP 80 70
#RSTRT 1 1
RSTRT 45 45
WSETUP 25 30
RHRS 365 205
WASTE 605 440
WPC 0.265934066 0.20952381
PT_i 2275 2100