Embed Size (px)
Citation preview

Instruction ManualNo. 012-08904A
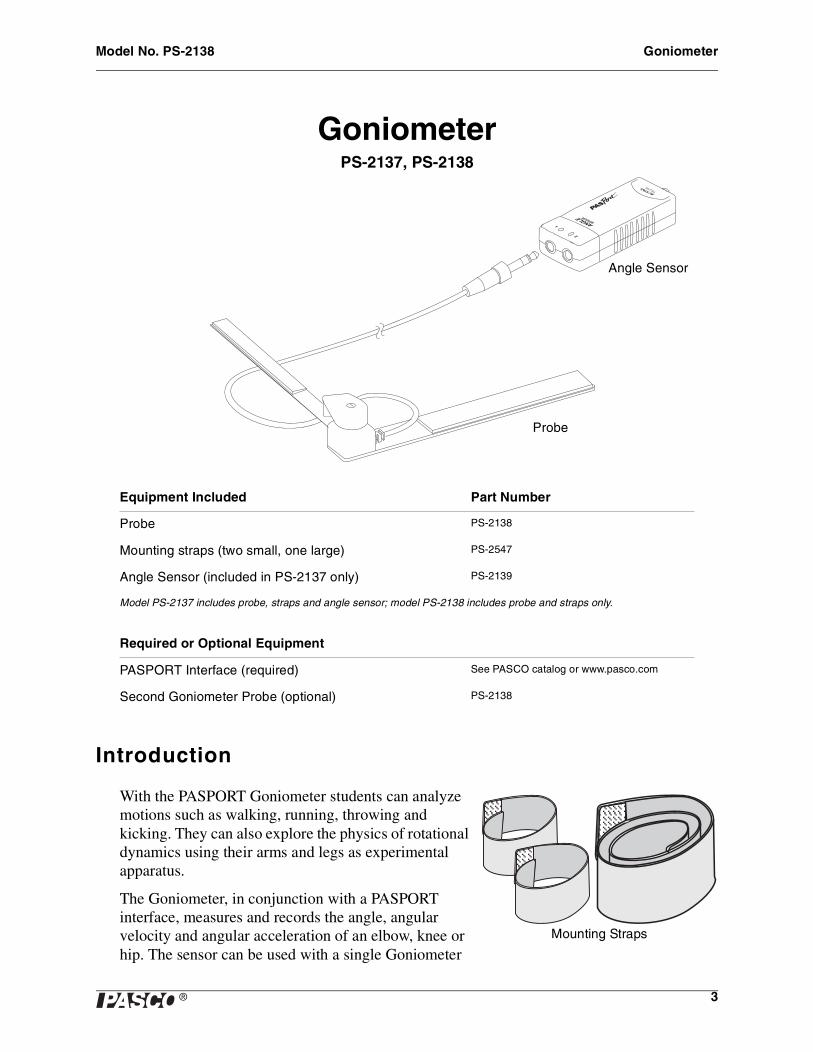
GoniometerPS-2138, PS-2137

Goniometer Model No. PS-2138
Contents
Introduction . . . . . . . . . . . . . . . . . . . . . . . . . . . . . . . . . . . . . . . . . . . . . . . . . . . . . . . . . 3
Probe Mounting . . . . . . . . . . . . . . . . . . . . . . . . . . . . . . . . . . . . . . . . . . . . . . . . . . . . . . 4
Sensor Setup . . . . . . . . . . . . . . . . . . . . . . . . . . . . . . . . . . . . . . . . . . . . . . . . . . . . . . . . 5
Suggested Activities . . . . . . . . . . . . . . . . . . . . . . . . . . . . . . . . . . . . . . . . . . . . . . . . . . 6
Experiment . . . . . . . . . . . . . . . . . . . . . . . . . . . . . . . . . . . . . . . . . . . . . . . . . . . . . . . . . . 9
Experiment Teachers' Notes and Sample Data . . . . . . . . . . . . . . . . . . . . . . . . . . . . 19
Other Sample Data . . . . . . . . . . . . . . . . . . . . . . . . . . . . . . . . . . . . . . . . . . . . . . . . . . . 23
Safety . . . . . . . . . . . . . . . . . . . . . . . . . . . . . . . . . . . . . . . . . . . . . . . . . . . . . . . . . . . . . 25
Specifications. . . . . . . . . . . . . . . . . . . . . . . . . . . . . . . . . . . . . . . . . . . . . . . . . . . . . . . 25
Technical Support . . . . . . . . . . . . . . . . . . . . . . . . . . . . . . . . . . . . . . . . . . . . . . . . . . . 25
Copyright . . . . . . . . . . . . . . . . . . . . . . . . . . . . . . . . . . . . . . . . . . . . . . . . . . . . . . . . . . 25
Limited Warranty . . . . . . . . . . . . . . . . . . . . . . . . . . . . . . . . . . . . . . . . . . . . . . . . . . . . 25
Model No. PS-2138 Goniometer
3�
GoniometerPS-2137, PS-2138
Model PS-2137 includes probe, straps and angle sensor; model PS-2138 includes probe and straps only.
Introduction
With the PASPORT Goniometer students can analyze motions such as walking, running, throwing and kicking. They can also explore the physics of rotational dynamics using their arms and legs as experimental apparatus.
The Goniometer, in conjunction with a PASPORT interface, measures and records the angle, angular velocity and angular acceleration of an elbow, knee or hip. The sensor can be used with a single Goniometer
Equipment Included Part Number
Probe PS-2138
Mounting straps (two small, one large) PS-2547
Angle Sensor (included in PS-2137 only) PS-2139
������
�
������
�
�
������
Probe
Angle Sensor
Required or Optional Equipment
PASPORT Interface (required) See PASCO catalog or www.pasco.com
Second Goniometer Probe (optional) PS-2138
Mounting Straps
Goniometer Probe Mounting
4 �
Probe (included) or with an optional second probe to measure two joints simultaneously. You can use multiple sensors together to support even more probes. The probe is easily attached to the body using the included hook-and-loop mounting straps.
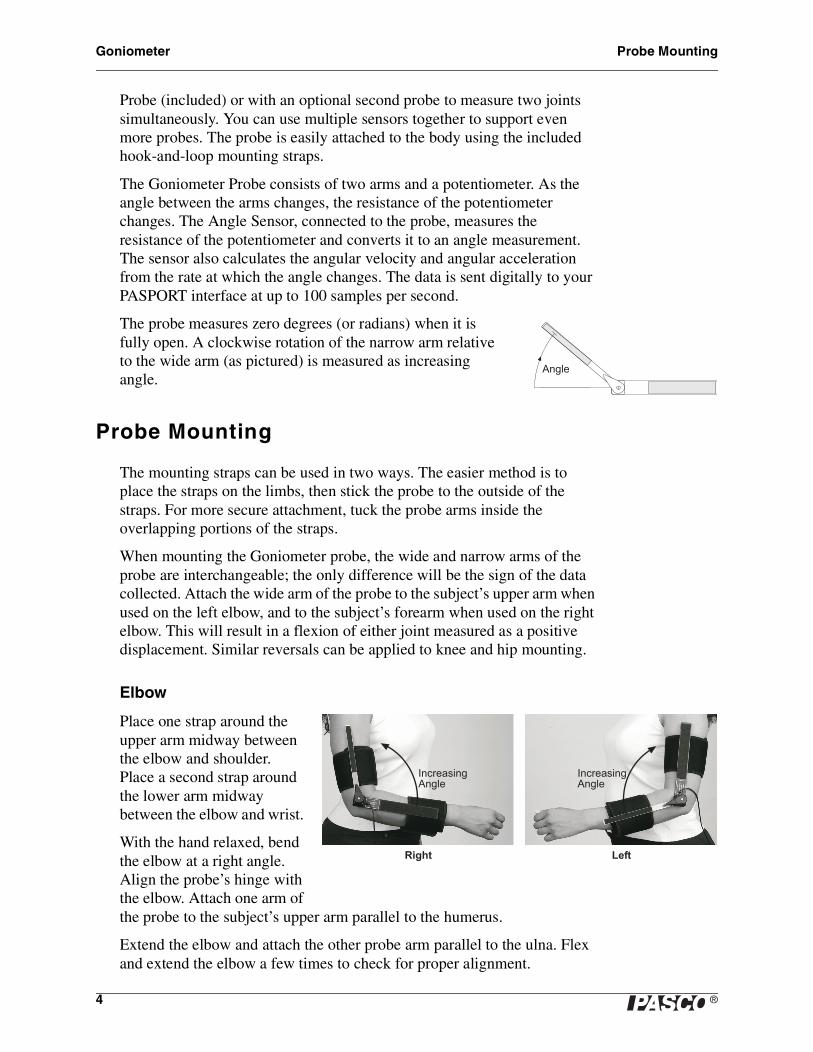
The Goniometer Probe consists of two arms and a potentiometer. As the angle between the arms changes, the resistance of the potentiometer changes. The Angle Sensor, connected to the probe, measures the resistance of the potentiometer and converts it to an angle measurement. The sensor also calculates the angular velocity and angular acceleration from the rate at which the angle changes. The data is sent digitally to your PASPORT interface at up to 100 samples per second.
The probe measures zero degrees (or radians) when it is fully open. A clockwise rotation of the narrow arm relative to the wide arm (as pictured) is measured as increasing angle.
Probe Mounting
The mounting straps can be used in two ways. The easier method is to place the straps on the limbs, then stick the probe to the outside of the straps. For more secure attachment, tuck the probe arms inside the overlapping portions of the straps.
When mounting the Goniometer probe, the wide and narrow arms of the probe are interchangeable; the only difference will be the sign of the data collected. Attach the wide arm of the probe to the subject’s upper arm when used on the left elbow, and to the subject’s forearm when used on the right elbow. This will result in a flexion of either joint measured as a positive displacement. Similar reversals can be applied to knee and hip mounting.
Elbow
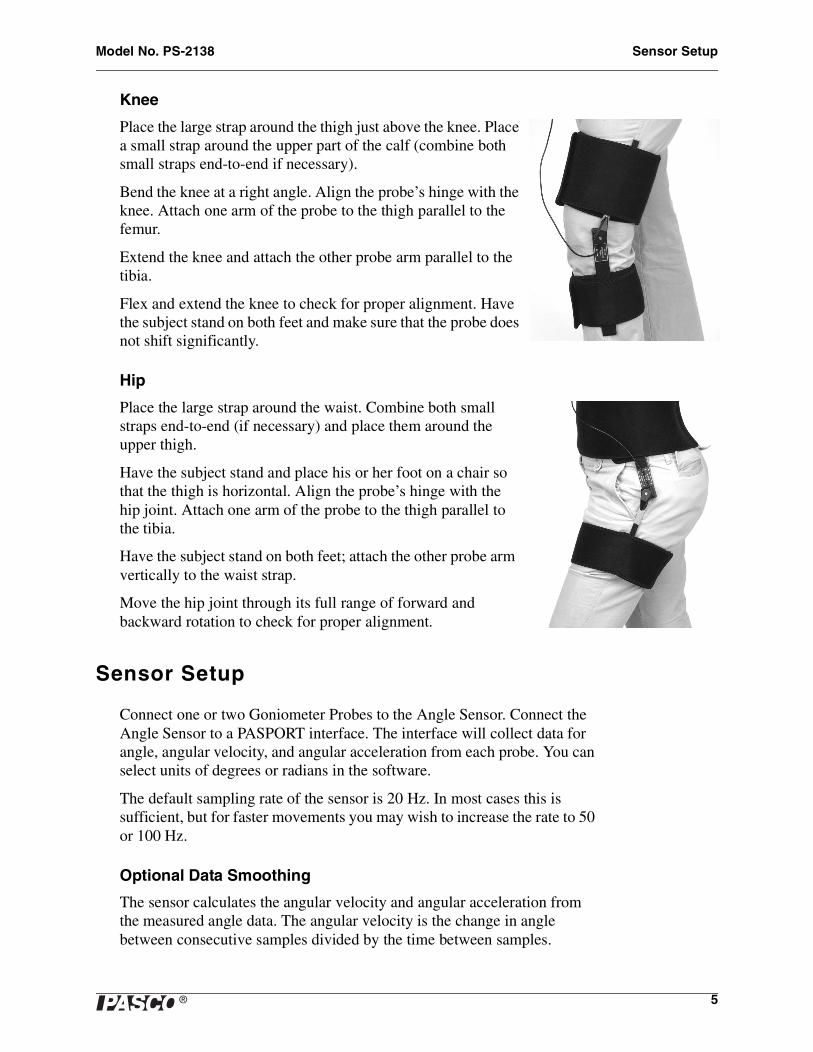
Place one strap around the upper arm midway between the elbow and shoulder. Place a second strap around the lower arm midway between the elbow and wrist.
With the hand relaxed, bend the elbow at a right angle. Align the probe’s hinge with the elbow. Attach one arm of the probe to the subject’s upper arm parallel to the humerus.
Extend the elbow and attach the other probe arm parallel to the ulna. Flex and extend the elbow a few times to check for proper alignment.
�����
�������������
�������������
����� ����
Model No. PS-2138 Sensor Setup
5�
Knee
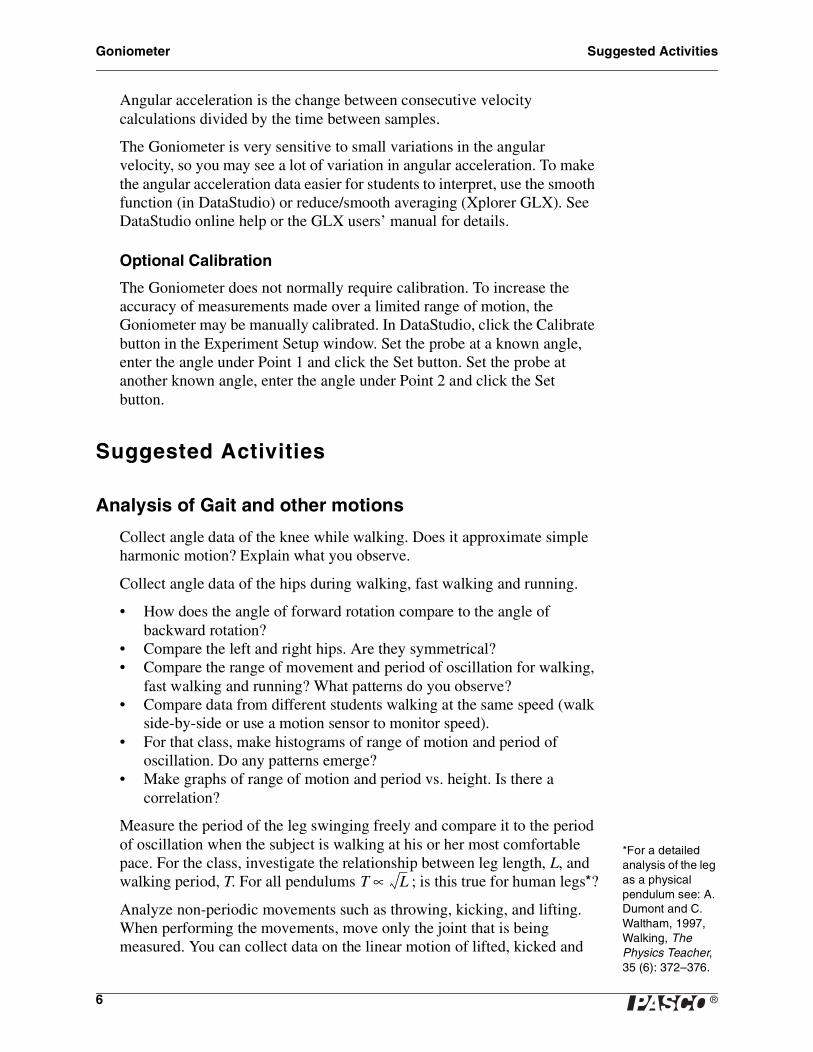
Place the large strap around the thigh just above the knee. Place a small strap around the upper part of the calf (combine both small straps end-to-end if necessary).
Bend the knee at a right angle. Align the probe’s hinge with the knee. Attach one arm of the probe to the thigh parallel to the femur.
Extend the knee and attach the other probe arm parallel to the tibia.
Flex and extend the knee to check for proper alignment. Have the subject stand on both feet and make sure that the probe does not shift significantly.
Hip
Place the large strap around the waist. Combine both small straps end-to-end (if necessary) and place them around the upper thigh.
Have the subject stand and place his or her foot on a chair so that the thigh is horizontal. Align the probe’s hinge with the hip joint. Attach one arm of the probe to the thigh parallel to the tibia.
Have the subject stand on both feet; attach the other probe arm vertically to the waist strap.
Move the hip joint through its full range of forward and backward rotation to check for proper alignment.
Sensor Setup
Connect one or two Goniometer Probes to the Angle Sensor. Connect the Angle Sensor to a PASPORT interface. The interface will collect data for angle, angular velocity, and angular acceleration from each probe. You can select units of degrees or radians in the software.
The default sampling rate of the sensor is 20 Hz. In most cases this is sufficient, but for faster movements you may wish to increase the rate to 50 or 100 Hz.
Optional Data Smoothing
The sensor calculates the angular velocity and angular acceleration from the measured angle data. The angular velocity is the change in angle between consecutive samples divided by the time between samples.
Goniometer Suggested Activities
6 �
Angular acceleration is the change between consecutive velocity calculations divided by the time between samples.
The Goniometer is very sensitive to small variations in the angular velocity, so you may see a lot of variation in angular acceleration. To make the angular acceleration data easier for students to interpret, use the smooth function (in DataStudio) or reduce/smooth averaging (Xplorer GLX). See DataStudio online help or the GLX users’ manual for details.
Optional Calibration
The Goniometer does not normally require calibration. To increase the accuracy of measurements made over a limited range of motion, the Goniometer may be manually calibrated. In DataStudio, click the Calibrate button in the Experiment Setup window. Set the probe at a known angle, enter the angle under Point 1 and click the Set button. Set the probe at another known angle, enter the angle under Point 2 and click the Set button.
Suggested Activities
Analysis of Gait and other motions
Collect angle data of the knee while walking. Does it approximate simple harmonic motion? Explain what you observe.
Collect angle data of the hips during walking, fast walking and running.
• How does the angle of forward rotation compare to the angle of backward rotation?
• Compare the left and right hips. Are they symmetrical?• Compare the range of movement and period of oscillation for walking,
fast walking and running? What patterns do you observe?• Compare data from different students walking at the same speed (walk
side-by-side or use a motion sensor to monitor speed). • For that class, make histograms of range of motion and period of
oscillation. Do any patterns emerge? • Make graphs of range of motion and period vs. height. Is there a
correlation?
Measure the period of the leg swinging freely and compare it to the period of oscillation when the subject is walking at his or her most comfortable pace. For the class, investigate the relationship between leg length, L, and walking period, T. For all pendulums ; is this true for human legs*?
Analyze non-periodic movements such as throwing, kicking, and lifting. When performing the movements, move only the joint that is being measured. You can collect data on the linear motion of lifted, kicked and
T L∝
*For a detailed analysis of the leg as a physical pendulum see: A. Dumont and C. Waltham, 1997, Walking, The Physics Teacher, 35 (6): 372–376.
Model No. PS-2138 Suggested Activities
7�
thrown objects using Photogate Tape (ME-6664), a Photogate (ME-9204B) and a Digital Adapter (PS-2159).
Collect data from two or more joints simultaneously while walking, running, jumping, throwing, kicking, etc. How do the joints work together when performing these actions?
Oscillations
Collect data for the following:
• Lower leg freely dangling about the knee showing simple harmonic motion, subject seated on a high surface.
• Leg with unbent knee freely dangling about the hip, subject standing on the opposite foot on a low surface.
• Leg with knee bent at right angle freely dangling about the hip.
Do angle, angular velocity, and angular acceleration approximate simple harmonic motion? Determine the period, frequency and amplitude of the oscillations.
What is the relationship between the phases of angle, angular velocity, and angular acceleration?
How does bending the knee affect the frequency of the dangling leg?
Skeletal Parts
Mount the Goniometer on articulated skeletal parts. In conjunction with force sensors attached with string the points of tendon attachment, measure the forces exerted by muscles when lifting objects of various mass, or performing throwing and kicking movements.

Goniometer Suggested Activities
8 �
Model No. PS-2138 Goniometer
9�
Experiment
In this activity you will rotate your arm about your elbow and investigate how the position, velocity and acceleration of your hand relate to the angle, angular velocity and angular acceleration of your arm.
Part 1: Arc Length vs. Angle
When you rotate your forearm about your elbow (while keeping your upper arm stationary) your hand traces out an arc, or part of a circle. You will use a pen and white board to mark the path of your hand. The Goniometer will measure the angle through which your forearm rotates.
Setup
1. Connect the Goniometer to the interface.
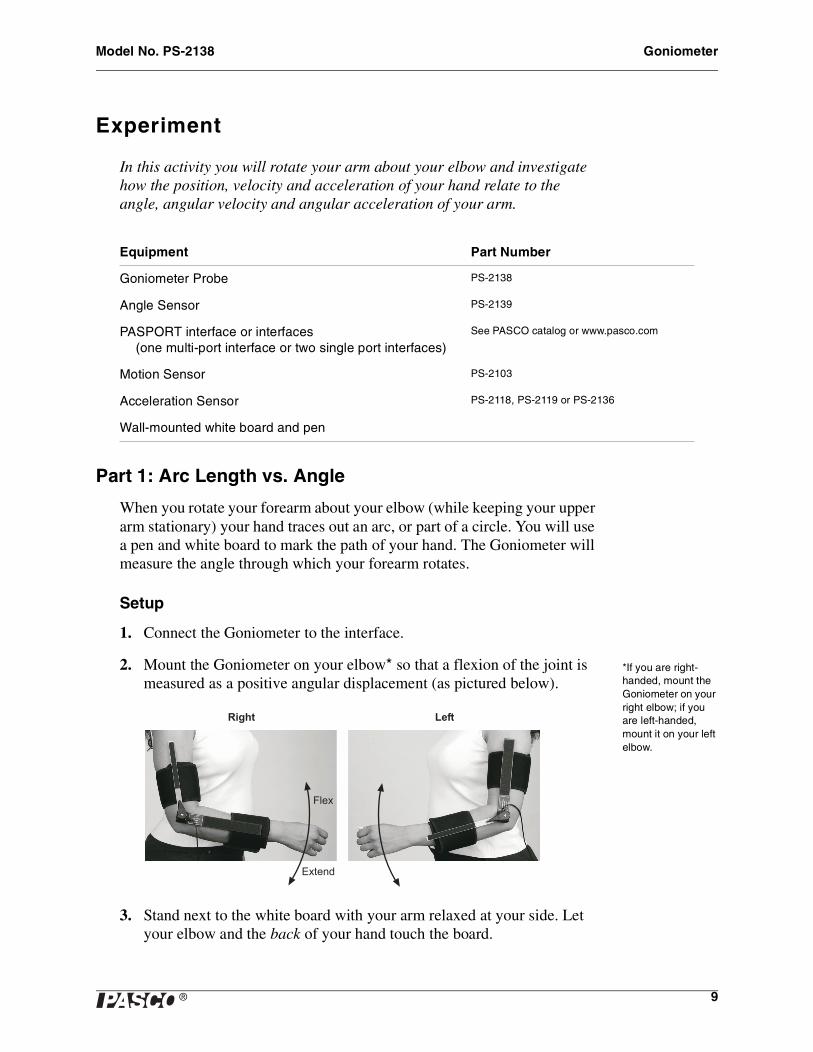
2. Mount the Goniometer on your elbow* so that a flexion of the joint is measured as a positive angular displacement (as pictured below).
3. Stand next to the white board with your arm relaxed at your side. Let your elbow and the back of your hand touch the board.
Equipment Part Number
Goniometer Probe PS-2138
Angle Sensor PS-2139
PASPORT interface or interfaces(one multi-port interface or two single port interfaces)
See PASCO catalog or www.pasco.com
Motion Sensor PS-2103
Acceleration Sensor PS-2118, PS-2119 or PS-2136
Wall-mounted white board and pen
*If you are right-handed, mount the Goniometer on your right elbow; if you are left-handed, mount it on your left elbow.
����� ����
���
� ����

Goniometer Experiment
10 �
4. Place a pen in your hand (as shown) so that you will draw on the board while keeping the back of your hand closest to the board.
5. Have a partner mark the location of your elbow on the board, and measure the distance from your elbow to the pen.
Distance from elbow to pen
Procedure
1. Fully extend your elbow and place the pen tip on the board.
2. Start data collection.
3. Draw an arc on the board by flexing your elbow. Move only your forearm and hand, while keeping your elbow at the marked location on the board.
4. Stop data collection.
It is important not to twist your hand in order to allow your arm to rotate in a plane parallel to the board.
�������������� ��������������
������������������������������������ ��� �����
�
Model No. PS-2138 Experiment
11�
Analysis
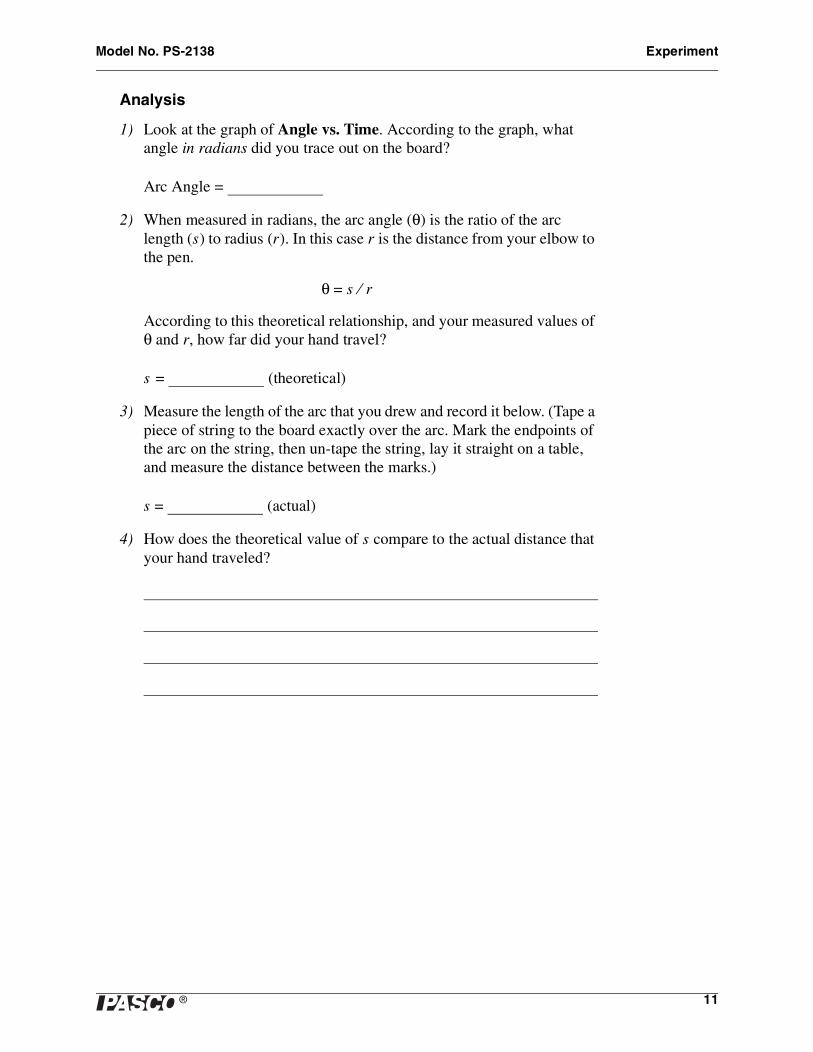
1) Look at the graph of Angle vs. Time. According to the graph, what angle in radians did you trace out on the board?
Arc Angle =
2) When measured in radians, the arc angle (θ) is the ratio of the arc length (s) to radius (r). In this case r is the distance from your elbow to the pen.
θ = s ⁄ r
According to this theoretical relationship, and your measured values of θ and r, how far did your hand travel?
s = (theoretical)
3) Measure the length of the arc that you drew and record it below. (Tape a piece of string to the board exactly over the arc. Mark the endpoints of the arc on the string, then un-tape the string, lay it straight on a table, and measure the distance between the marks.)
s = (actual)
4) How does the theoretical value of s compare to the actual distance that your hand traveled?

Goniometer Experiment
12 �
Part 2: Tangential Velocity vs. Angular Velocity
When you rotate your forearm about the elbow, your hand does not move in a straight line, but it always moves in a direction perpendicular to your forearm. This direction is described as tangential.
As you rotate your arm, the magnitude of your hand’s tangential velocity (vT) equals the change in the arc length traced by your hand (∆s) divided by the change in time (∆t)
vT = ∆s ⁄ ∆t
The angular velocity (ω) of your forearm equals the change in angle (∆θ) divided by the change in time (∆t).
ω = ∆θ ⁄ ∆t
In Part 1, you discovered that the relationship between arc length and angle is s = r θ, thus:
∆s = r ∆θ
Predict
You will use the Motion Sensor to measure the tangential velocity of your hand, and the Goniometer to measure the angular velocity of your forearm. Based on the above equations, write an equation predicting what you will discover about the relationship between vT and ω.
Setup
1. Connect the Goniometer and Motion Sensor to the interface (or interfaces).
2. Place the Goniometer on your elbow so that a flexion of the joint is measured as a positive angular displacement.
Model No. PS-2138 Experiment
13�
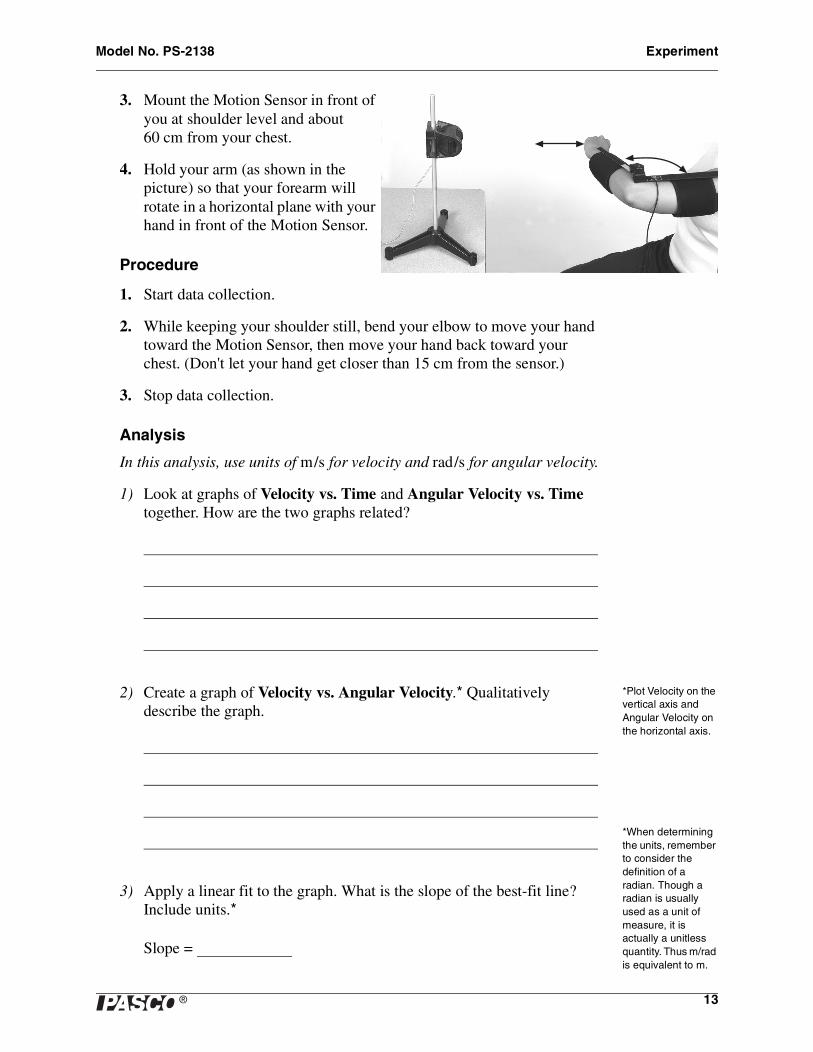
3. Mount the Motion Sensor in front of you at shoulder level and about 60 cm from your chest.
4. Hold your arm (as shown in the picture) so that your forearm will rotate in a horizontal plane with your hand in front of the Motion Sensor.
Procedure
1. Start data collection.
2. While keeping your shoulder still, bend your elbow to move your hand toward the Motion Sensor, then move your hand back toward your chest. (Don't let your hand get closer than 15 cm from the sensor.)
3. Stop data collection.
Analysis
In this analysis, use units of m/s for velocity and rad/s for angular velocity.
1) Look at graphs of Velocity vs. Time and Angular Velocity vs. Time together. How are the two graphs related?
2) Create a graph of Velocity vs. Angular Velocity.* Qualitatively describe the graph.
3) Apply a linear fit to the graph. What is the slope of the best-fit line? Include units.*
Slope =
*Plot Velocity on the vertical axis and Angular Velocity on the horizontal axis.
*When determining the units, remember to consider the definition of a radian. Though a radian is usually used as a unit of measure, it is actually a unitless quantity. Thus m/rad is equivalent to m.
Goniometer Experiment
14 �
4) Write the equation of the best-fit line in terms of vT, ω and slope. Does the relationship represented by this equation support the prediction that you made earlier?
5) What physical quantity is represented by the slope? Measure this quantity directly and compare it to the value of slope.
Model No. PS-2138 Experiment
15�
Part 3: Centripetal and Tangential Accelerations
When your forearm rotates about your elbow the velocity of your hand is entirely in the tangential direction, but the acceleration is not. There are two components to the acceleration of your hand: tangential (perpendicular to your forearm), and centripetal (parallel to your forearm.) You will use the Acceleration Sensor to measure both components.
The magnitude of tangential acceleration (aT) is equal to the change in magnitude of tangential velocity (∆vT) divided by the change in time (∆t).
aT = ∆vT ⁄ ∆t
The angular acceleration (α) of your forearm equals the change in angular velocity (∆ω) divided by the change in time (∆t).
α = ∆ω ⁄ ∆t
In Part 2, you discovered that the relationship between tangential velocity and angular velocity is vT = r ω, thus:
∆vT = r ∆ω
Predict
You will use the Acceleration Sensor to measure the tangential acceleration of your hand, and the Goniometer to measure the angular acceleration of your forearm. Based on the above equations, write an equation predicting what you will discover about the relationship between aT and α.
Setup
1. Connect the Goniometer and Acceleration Sensor to the interface (or interfaces).
2. Set the sample rates of both sensors to 20 Hz.
3. Place the Goniometer on your elbow so that a flexion of the joint is measured as a positive angular displacement.
Goniometer Experiment
16 �
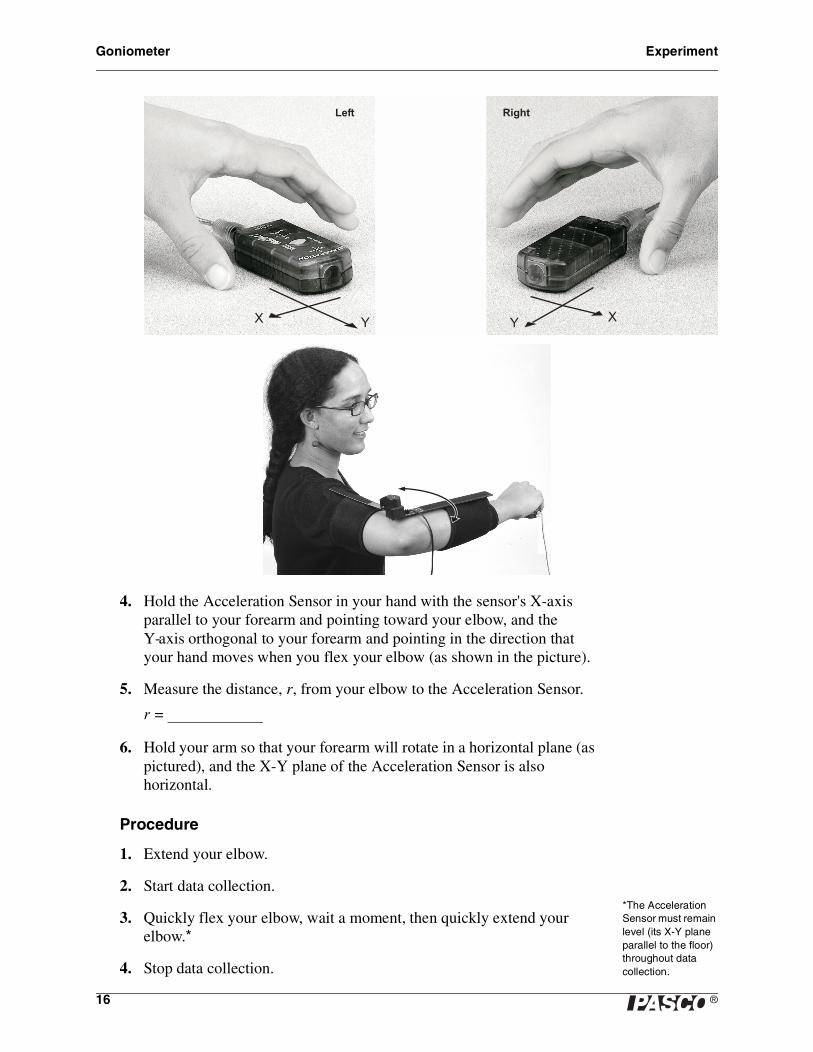
4. Hold the Acceleration Sensor in your hand with the sensor's X-axis parallel to your forearm and pointing toward your elbow, and the Y-axis orthogonal to your forearm and pointing in the direction that your hand moves when you flex your elbow (as shown in the picture).
5. Measure the distance, r, from your elbow to the Acceleration Sensor.
r =
6. Hold your arm so that your forearm will rotate in a horizontal plane (as pictured), and the X-Y plane of the Acceleration Sensor is also horizontal.
Procedure
1. Extend your elbow.
2. Start data collection.
3. Quickly flex your elbow, wait a moment, then quickly extend your elbow.*
4. Stop data collection.
���� �����
�� � �
*The Acceleration Sensor must remain level (its X-Y plane parallel to the floor) throughout data collection.

Model No. PS-2138 Experiment
17�
Analysis
In this analysis, use units of m/s/s or m/s2 for acceleration, rad/s for angular velocity, and rad/s/s or rad/s2 for angular acceleration.
Tangential Acceleration
1) Look at graphs of Angular Acceleration vs. Time and Tangential Acceleration vs. Time together.* How are the graphs related?
2) Create a graph of Tangential Acceleration vs. Angular Acceleration and apply a linear fit.* What is the slope of the best-fit line (including units)?
3) Write the equation of the best fit line in terms of aT, α and slope. Does the relationship represented by the best-fit line support the prediction that you made earlier?
4) What physical quantity is represented by the slope? Measure this quantity directly and compare it to the value of slope.
*Tangential Acceleration is measured by the sensor as “Acceleration, Y.”
*Plot Tangential Acceleration on the vertical axis and Angular Acceleration on the horizontal axis.
Goniometer Experiment
18 �
Centripetal Acceleration
5) Look at graphs of Angular Velocity vs. Time and Centripetal Acceleration vs. Time together.* How are the graphs related?
6) The Acceleration Sensor was oriented so that acceleration toward the elbow was measured as positive. When the angular velocity of your arm was positive, was the centripetal acceleration of your hand toward or away from your elbow?
7) When the angular velocity of your arm was negative, was the centripetal acceleration of your hand toward or away from your elbow?
8) Create a graph of Centripetal Acceleration vs. Angular Velocity.* The theoretical relationship between Centripetal Acceleration (aC) and Angular Velocity (ω) is aC = r ω2, where r is a constant. Does your data appear to support this relationship? Explain your reasoning.
9) Create a graph of aC versus ω2. Apply a linear fit. According to the slope of the best-fit line, what is the value of r (including units)?
r = (from best-fit line)
10) Compare this value to the distance from your elbow to the acceleration sensor.
*Centripetal Acceleration is measured by the sensor as “Acceleration, X.”
*Plot Centripetal Acceleration on the vertical axis and Angular Velocity on the horizontal axis.
Model No. PS-2138 Experiment Teachers' Notes and Sample Data
19�
Experiment Teachers' Notes and Sample Data
Part 1
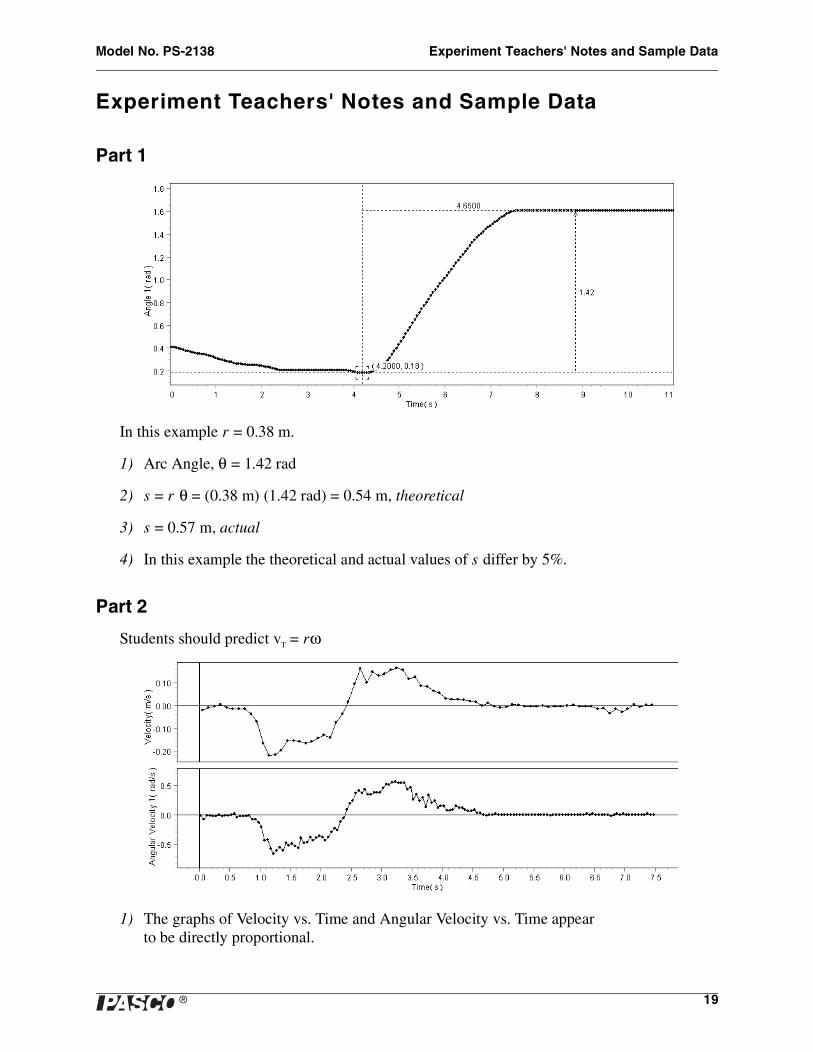
In this example r = 0.38 m.
1) Arc Angle, θ = 1.42 rad
2) s = r θ = (0.38 m) (1.42 rad) = 0.54 m, theoretical
3) s = 0.57 m, actual
4) In this example the theoretical and actual values of s differ by 5%.
Part 2
Students should predict vT = rω
1) The graphs of Velocity vs. Time and Angular Velocity vs. Time appear to be directly proportional.
Goniometer Experiment Teachers' Notes and Sample Data
20 �
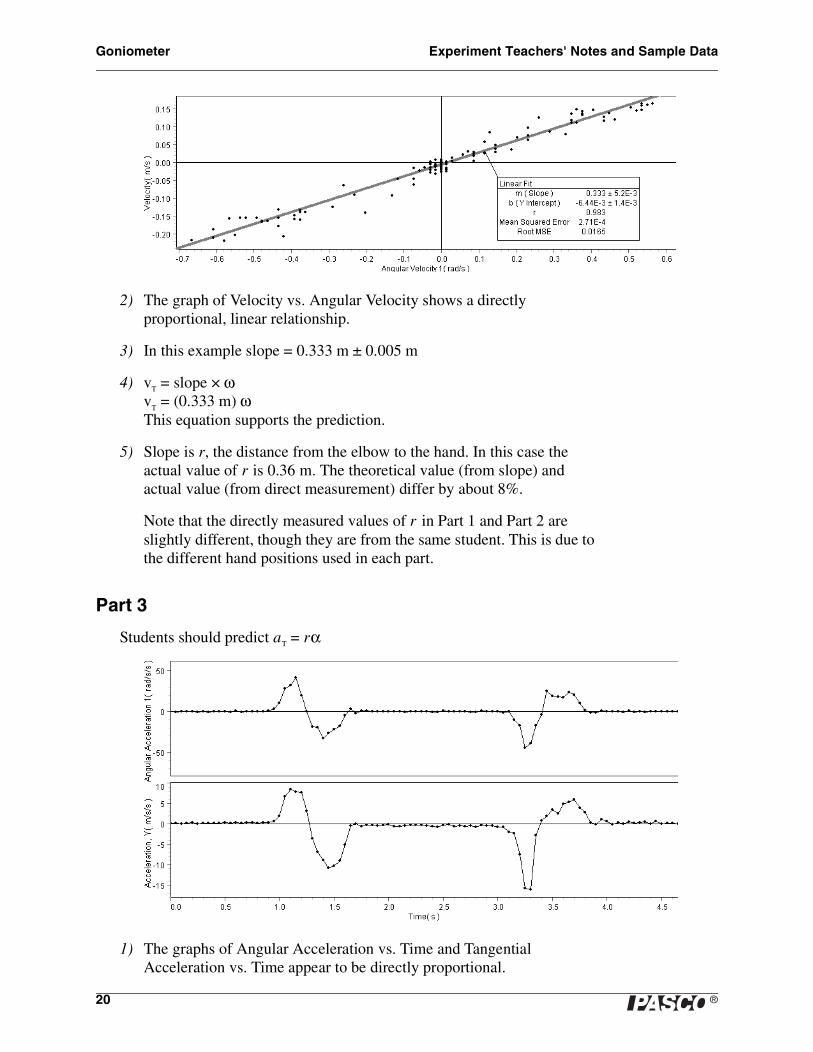
2) The graph of Velocity vs. Angular Velocity shows a directly proportional, linear relationship.
3) In this example slope = 0.333 m ± 0.005 m
4) vT = slope × ωvT = (0.333 m) ωThis equation supports the prediction.
5) Slope is r, the distance from the elbow to the hand. In this case the actual value of r is 0.36 m. The theoretical value (from slope) and actual value (from direct measurement) differ by about 8%.
Note that the directly measured values of r in Part 1 and Part 2 are slightly different, though they are from the same student. This is due to the different hand positions used in each part.
Part 3
Students should predict aT = rα
1) The graphs of Angular Acceleration vs. Time and Tangential Acceleration vs. Time appear to be directly proportional.
Model No. PS-2138 Experiment Teachers' Notes and Sample Data
21�
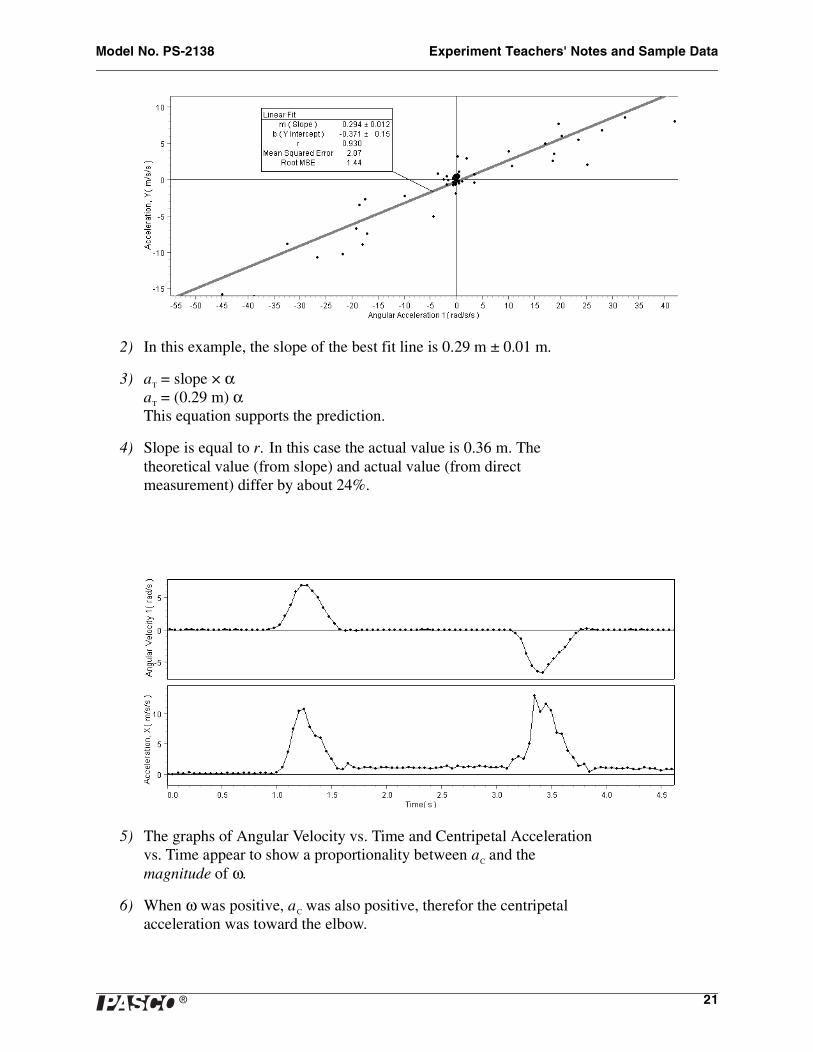
2) In this example, the slope of the best fit line is 0.29 m ± 0.01 m.
3) aT = slope × αaT = (0.29 m) αThis equation supports the prediction.
4) Slope is equal to r. In this case the actual value is 0.36 m. The theoretical value (from slope) and actual value (from direct measurement) differ by about 24%.
5) The graphs of Angular Velocity vs. Time and Centripetal Acceleration vs. Time appear to show a proportionality between aC and the magnitude of ω.
6) When ω was positive, aC was also positive, therefor the centripetal acceleration was toward the elbow.

Goniometer Experiment Teachers' Notes and Sample Data
22 �
7) When ω was negative, aC was positive, therefor the centripetal acceleration was toward the elbow.
8) In theory, the graph of aC versus ω is a parabola. Though the data contains a lot of scatter, that relationship is evident in the collected data.
9) On the graph of aC versus ω2, the slope of the best-fit line is the theoretical value of r, in this case 0.232 m ± 0.008 m.
10) The theoretical and actual values of r differ by about 55%.
In Part 3, your students will probably find that the values of r according to the best-fit lines differ significantly from the actual value; and that the graphs themselves contain significant scatter or noise.
Have them compare the different sensors, procedures, and mathematics (including the calculations done inside the sensor) used in each part of the
Model No. PS-2138 Other Sample Data
23�
experiment, and consider how these factors contribute to precision and accuracy of the collected data.
Other Sample Data
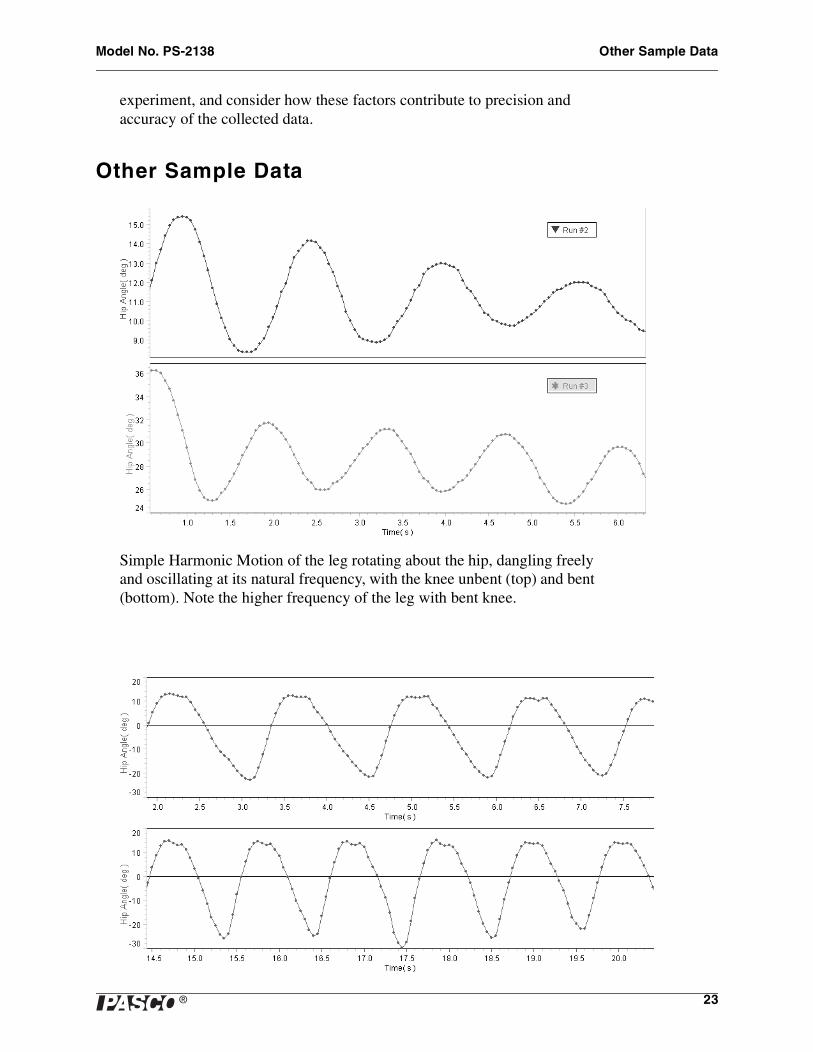
Simple Harmonic Motion of the leg rotating about the hip, dangling freely and oscillating at its natural frequency, with the knee unbent (top) and bent (bottom). Note the higher frequency of the leg with bent knee.
Goniometer Other Sample Data
24 �
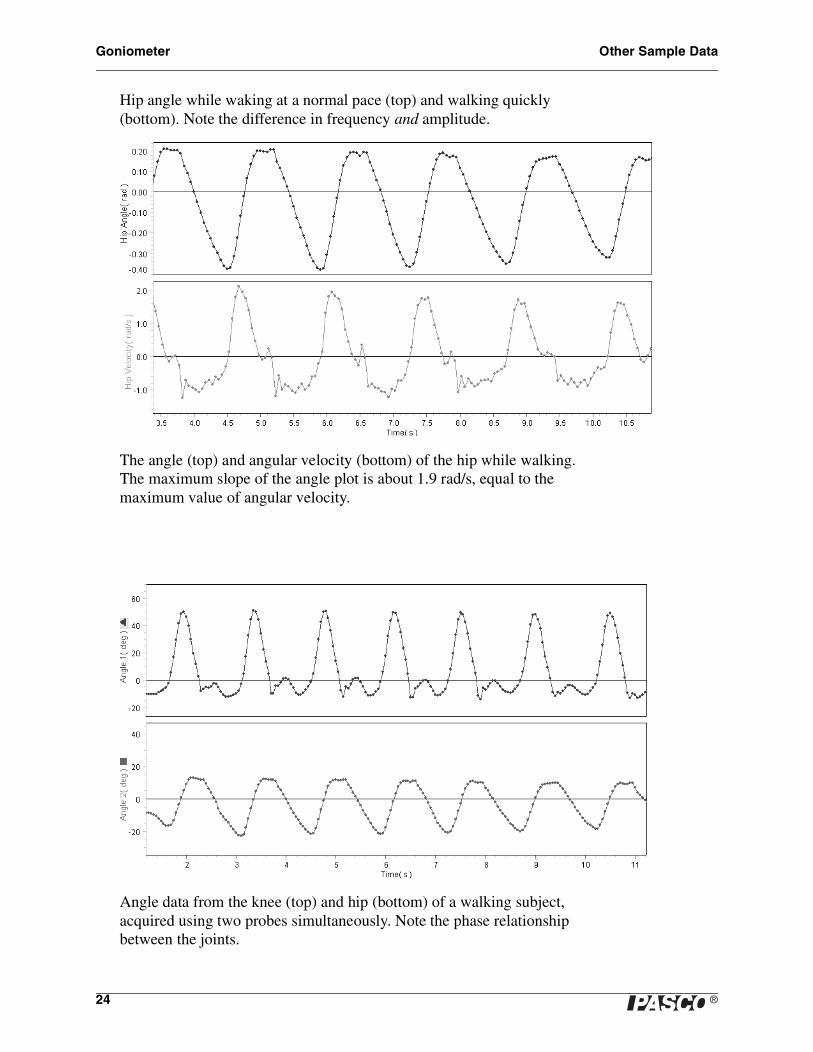
Hip angle while waking at a normal pace (top) and walking quickly (bottom). Note the difference in frequency and amplitude.
The angle (top) and angular velocity (bottom) of the hip while walking. The maximum slope of the angle plot is about 1.9 rad/s, equal to the maximum value of angular velocity.
Angle data from the knee (top) and hip (bottom) of a walking subject, acquired using two probes simultaneously. Note the phase relationship between the joints.
Model No. PS-2138 Goniometer
Safety
Read the instructions before using this product. Students should be supervised by their instructors. When using this product, follow the instructions in this manual and all local safety guidelines that apply to you.
Ensure that students are aware of these safety precautions before using the Goniometer.
Place the mounting straps on the body snugly but not too tightly. The straps should not constrict blood flow or breathing. Remove all straps at the first sign of discomfort.
When performing physical activities such as walking or running, do so only at a comfortable rate. Some activities call for students to stand or sit on raised surfaces; use only surfaces that are safe and appropriate for these activities.
Specifications
PS-2138 Goniometer Probe used with PS-2139 Angle Sensor and a PASPORT interface.
Technical Support
For assistance with any PASCO product, contact PASCO at:
Address: PASCO scientific10101 Foothills Blvd.Roseville, CA 95747-7100
Phone: (916) 786-3800(800) 772-8700
Fax: (916) 786-3292
Web: www.pasco.com
Email: [email protected]
Copyright
The PASCO scientific 012-08904A Goniometer Instruction Manual is copyrighted with all rights reserved. Permission is granted to non-profit educational institutions for reproduction of any part of this manual, providing the reproductions are used only for their laboratories and are not sold for profit. Reproduction under any other circumstances, without the written consent of PASCO scientific, is prohibited.
Limited Warranty
For a description of the product warranty, see the PASCO catalog.
Range -170°–170°
Accuracy ±1° calibrated±3° uncalibrated
Resolution 0.04°
Sampling rate 20 Hz default100 Hz maximum
Probe arm length 21 cm
Mounting straps Large: 15 × 120 cmSmall: 10 × 18 cm
Author: Alec Ogston
The PASCO Goniometer was developed in cooperation with Dr. Nancy Beverly, Mercy College, Dobbs Ferry NY.