Embed Size (px)
Citation preview
COMPANY NAME:
DOCUMENT NAME:
CONTENT:
GOLD REEF RESORTS
ANNUAL REPORT 2009
ANALYSIS OF THE YEAR

FACT: 2009 was a tough trading year that challenged
many companies on a number of levels. It also gave
organisations the opportunity to excel where others
thought it was impossible and to be truly transparent
in a time where uncovering truths became the order of
the day. Gold Reef Resorts adopted a “no frills, no fuss”
approach to doing business but never compromised
on their values and standards the company has become
renown for. Now those are the facts.

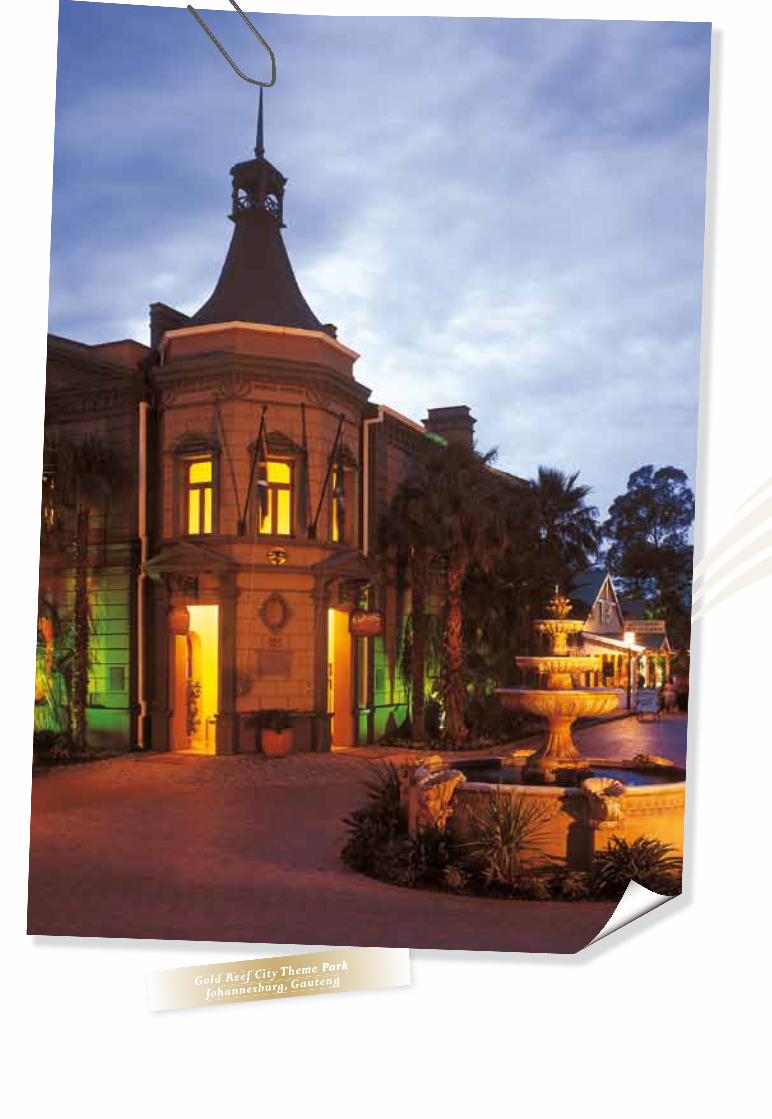
Gold Reef City Theme ParkJohannesburg, Gauteng
GROUP OBJECTIVES
• We constantly strive to be the best at what we do.
• We are in the business of providing good value family fun and entertainment to our patrons.
• We strive at all times to enhance the quality of our patrons’ experience through exceptional service and product in all spheres of activity.
• We expect from our staff dedication to the highest principles of quality, service and integrity.
• We contribute to our country as a responsible corporate citizen and conduct our affairs accordingly.
• We aim to deliver consistent earnings growth and to enhance shareholder value.
• We offer all staff the opportunity to be part of a winning team, just reward, quality training, advancement commensurate with merit and freedom to reach the highest levels of employment.
LIKE MANY OF MAN’S GREAT ACHIEVEMENTS, OUR COMPANY WAS BORN FROM A VISION. WHILE IT WILL CONTINUE TO GROW FROM THIS DYNAMIC FOUNDATION, CERTAIN CORE VALUES WILL REMAIN CONSTANT:

Silverstar CasinoWest Rand, Gauteng
CONTENTS
Defi nitions .......................
.........1
2009 Financial Highlights ............3
8 Year Review .......................
.....4
Investment Portfolio .....................6
Directorate & Management ............7
Chairman’s Report .....................12
Chief Executive Offi cer’s Report ..... 15
Sustainability Report .................22
Corporate Governance Report ........40
Code of Ethics ....................
......45
Remuneration Report .................50
Annual Financial Statements ........ 61
Analysis of Shareholders ............ 142
JSE Performance ......................
142
Shareholders’ Diary ................. 143
Corporate Information .............. 144
Notice of Annual General Meeting 145
Form of Proxy (attached)
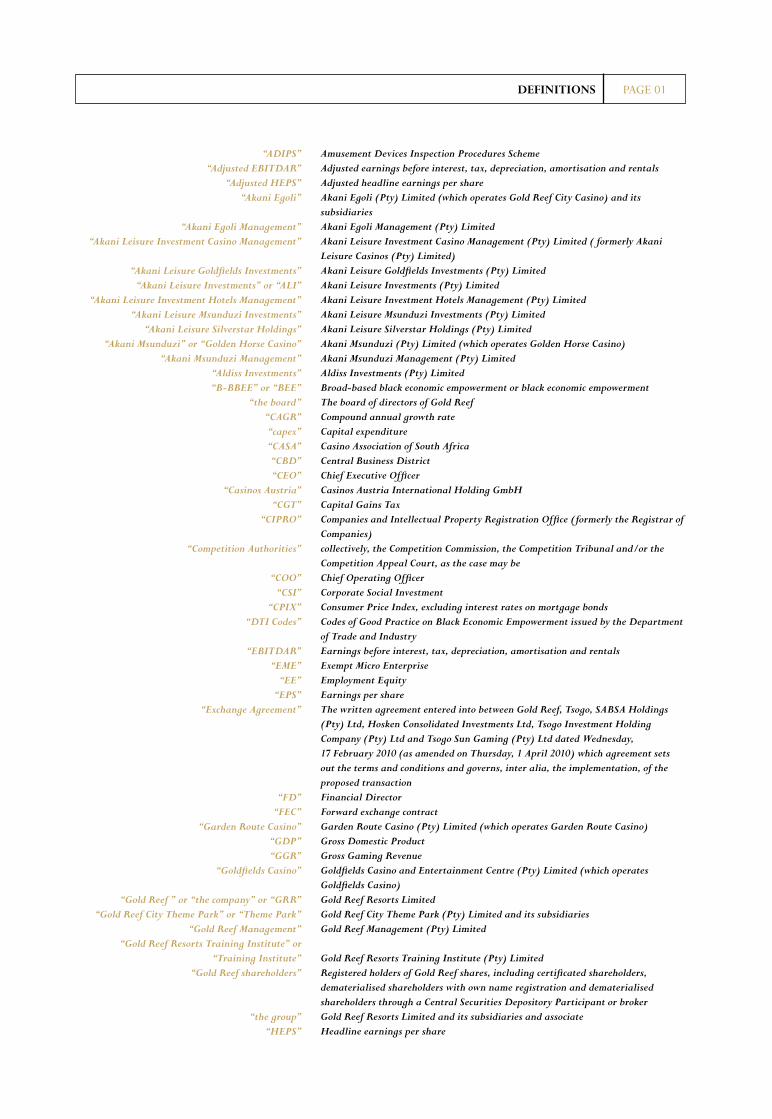
PAGE 01DEFINITIONS
“ADIPS”“Adjusted EBITDAR”
“Adjusted HEPS”“Akani Egoli”
“Akani Egoli Management”“Akani Leisure Investment Casino Management”
“Akani Leisure Goldfields Investments”“Akani Leisure Investments” or “ALI”
“Akani Leisure Investment Hotels Management”“Akani Leisure Msunduzi Investments”
“Akani Leisure Silverstar Holdings”“Akani Msunduzi” or “Golden Horse Casino”
“Akani Msunduzi Management”“Aldiss Investments”“B-BBEE” or “BEE”
“the board”“CAGR”“capex”“CASA”“CBD”“CEO”
“Casinos Austria”“CGT”
“CIPRO”
“Competition Authorities”
“COO”“CSI”
“CPIX”“DTI Codes”
“EBITDAR”“EME”
“EE”“EPS”
“Exchange Agreement”
“FD”“FEC”
“Garden Route Casino”“GDP”“GGR”
“Goldfields Casino”
“Gold Reef ” or “the company” or “GRR”“Gold Reef City Theme Park” or “Theme Park”
“Gold Reef Management”“Gold Reef Resorts Training Institute” or
“Training Institute”“Gold Reef shareholders”
“the group”“HEPS”
Amusement Devices Inspection Procedures SchemeAdjusted earnings before interest, tax, depreciation, amortisation and rentalsAdjusted headline earnings per shareAkani Egoli (Pty) Limited (which operates Gold Reef City Casino) and its subsidiariesAkani Egoli Management (Pty) LimitedAkani Leisure Investment Casino Management (Pty) Limited ( formerly Akani Leisure Casinos (Pty) Limited)Akani Leisure Goldfields Investments (Pty) LimitedAkani Leisure Investments (Pty) LimitedAkani Leisure Investment Hotels Management (Pty) LimitedAkani Leisure Msunduzi Investments (Pty) LimitedAkani Leisure Silverstar Holdings (Pty) LimitedAkani Msunduzi (Pty) Limited (which operates Golden Horse Casino)Akani Msunduzi Management (Pty) LimitedAldiss Investments (Pty) LimitedBroad-based black economic empowerment or black economic empowermentThe board of directors of Gold ReefCompound annual growth rateCapital expenditureCasino Association of South AfricaCentral Business DistrictChief Executive OfficerCasinos Austria International Holding GmbHCapital Gains TaxCompanies and Intellectual Property Registration Office (formerly the Registrar of Companies)collectively, the Competition Commission, the Competition Tribunal and/or the Competition Appeal Court, as the case may beChief Operating OfficerCorporate Social InvestmentConsumer Price Index, excluding interest rates on mortgage bondsCodes of Good Practice on Black Economic Empowerment issued by the Department of Trade and IndustryEarnings before interest, tax, depreciation, amortisation and rentalsExempt Micro EnterpriseEmployment EquityEarnings per shareThe written agreement entered into between Gold Reef, Tsogo, SABSA Holdings (Pty) Ltd, Hosken Consolidated Investments Ltd, Tsogo Investment Holding Company (Pty) Ltd and Tsogo Sun Gaming (Pty) Ltd dated Wednesday, 17 February 2010 (as amended on Thursday, 1 April 2010) which agreement sets out the terms and conditions and governs, inter alia, the implementation, of the proposed transactionFinancial DirectorForward exchange contractGarden Route Casino (Pty) Limited (which operates Garden Route Casino)Gross Domestic ProductGross Gaming RevenueGoldfields Casino and Entertainment Centre (Pty) Limited (which operates Goldfields Casino)Gold Reef Resorts LimitedGold Reef City Theme Park (Pty) Limited and its subsidiariesGold Reef Management (Pty) Limited
Gold Reef Resorts Training Institute (Pty) LimitedRegistered holders of Gold Reef shares, including certificated shareholders, dematerialised shareholders with own name registration and dematerialised shareholders through a Central Securities Depository Participant or brokerGold Reef Resorts Limited and its subsidiaries and associateHeadline earnings per share

PAGE 02 DEFINITIONS CONTINUED
“HR”“IFRS”
“Inkonka Investments”“JIBAR”
“JSE”“King II Report”
“King III Report”“KPI”
“LTIP”“Lukhanji Leisure” or “Queens Casino”
“Merged Entity”“Mogale Silverstar Holdings”
“the prior year”“NAV”
“NTAV”“Newshelf 786”
“NPAT”“NRGP”“PAYE”
“proposed transaction”
“QME”“Richard Moloko Consortium”
“Richard Moloko Consortium Holdings”“Silverstar Casino”
“SA”“SARGF”“SARGT”
“SARS”“SDL”
“SENS”“SRP”“STC”
“Tanglepark Trading”“THETA”
“Tsogo”“Tsogo Sun Expansion”
“UIF”“UK”
“USA”“VAT”
“West Coast Leisure” or “Mykonos Casino”“the year”
Human ResourcesInternational Financial Reporting StandardsInkonka Investments (Pty) LimitedJohannesburg Inter-bank Agreed RateJSE LimitedThe King Report on Corporate Governance for South Africa 2002The King Report on Corporate Governance for South Africa 2009Key performance indicatorLong-term Incentive PlanLukhanji Leisure (Pty) Limited (which operates Queens Casino & Hotel)Comprises the combined Gold Reef and Tsogo businessesMogale Silverstar Holdings (Pty) LimitedGold Reef ’s fi nancial year ended 31 December 2008Net asset valueNet tangible asset valueNewshelf 786 (Pty) LimitedNet profi t after taxNational Responsible Gambling ProgrammePay As You EarnThe proposed merger of Gold Reef and Tsogo through the acquisition by Gold Reef of the entire issued ordinary share capital of Tsogo in exchange for which Gold Reef will allot and issue Gold Reef shares to Tsogo shareholders, as contemplated in the Exchange AgreementQualifying Medium-sized EnterpriseRichard Moloko Consortium (Pty) LimitedRichard Moloko Consortium Holdings (Pty) LimitedSilverstar Casino (Pty) Limited (which operates Silverstar Casino) and its subsidiariesSouth AfricaSouth African Responsible Gambling FoundationSouth African Responsible Gambling TrustSouth African Revenue ServicesSkills development levySecurities Exchange News ServiceSecurities Regulation PanelSecondary tax on companiesTanglepark Trading (Pty) LimitedTourism and Hospitality Education and Training AuthorityTsogo Sun Holdings (Proprietary) LimitedTsogo Sun Expansion No.1 (Pty) Ltd (previously Main Street 581 (Pty) Ltd)Unemployment insurance fundUnited KingdomUnited States of AmericaValue-added taxWest Coast Leisure (Pty) Limited (which operates Mykonos Casino)Gold Reef ’s fi nancial year under review ended 31 December 2009
NOTES TO THE PROVISIONAL FINANCIAL STATEMENTS
Balance at 1 January 2008 1 767 (116) 718 2 369 32 2 401 Total comprehensive income for
the year ended 31 Dec 2008 – (67) 358 291 17 308
Attributable profi t for the year – – 358 358 17 375
Fair value loss on interest rate
hedge, net of tax – (67) – (67) – (67)Net movement between share
scheme and participants 28 (5) – 23 – 23
Recognition of share-based
payments – 5 – 5 – 5
Dividends paid – – (277) (277) – (277)Dividends paid to minorities
by subsidiaries – – – – (6) (6)
Balance at 31 December 2008 1 795 (183) 799 2 411 43 2 454
Total comprehensive income for
the year ended 31 Dec 2009 – 15 360 375 13 388
Attributable profi t for the year – – 360 360 13 373
Fair value gain on interest rate
hedge, net of tax – 15 – 15 – 15
Fair value loss on foreign exchange
hedge, net of tax – * – * – *
Net movement between share
scheme and participants 13 6 – 19 – 19
Recognition of share-based
payments – 6 – 6 – 6
Dividends paid – – (180) (180) – (180)Dividends paid to minorities
by subsidiaries – – – – (11) (11)
Balance at 31 December 2009 1 808 (156) 979 2 631 45 2 676
~“Reserves” comprise of “Share-based payment reserve” and “Other reserves”. These reserves are
disclosed separately on the balance sheet.
CONDENSED CONSOLIDATEDSTATEMENT OF CHANGES IN EQUITY
TOTAL SHARE ATTRIBUTABLE CAPITAL TO EQUITY NET OF HOLDERS TREASURY ~ RETAINED OF GOLD MINORITY TOTAL SHARES RESERVES EARNINGS REEF INTEREST EQUITY Rm Rm Rm Rm Rm Rm
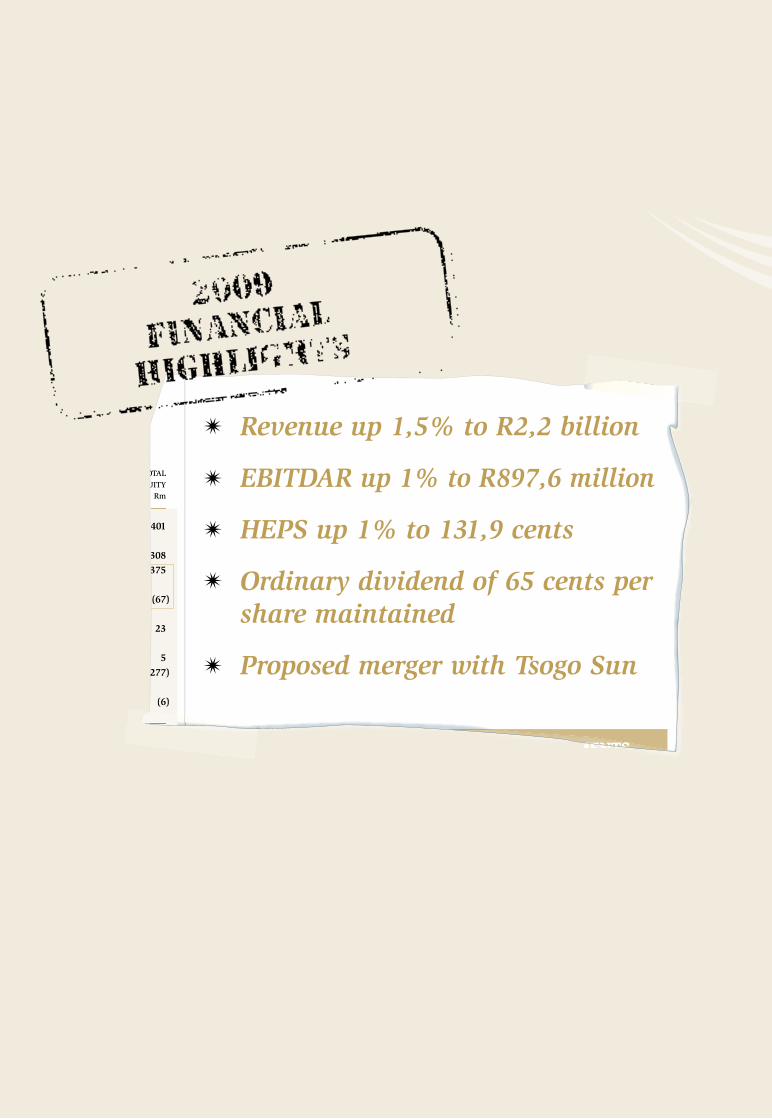
Revenue up 1,5% to R2,2 billion
EBITDAR up 1% to R897,6 million
HEPS up 1% to 131,9 cents
Ordinary dividend of 65 cents per share maintained
Proposed merger with Tsogo Sun
NOTES TO THE PROVISIONAL FINANCIAL STATEMENTS NOTES TO THE PROVISIONAL FINANCIAL STATEMENTS
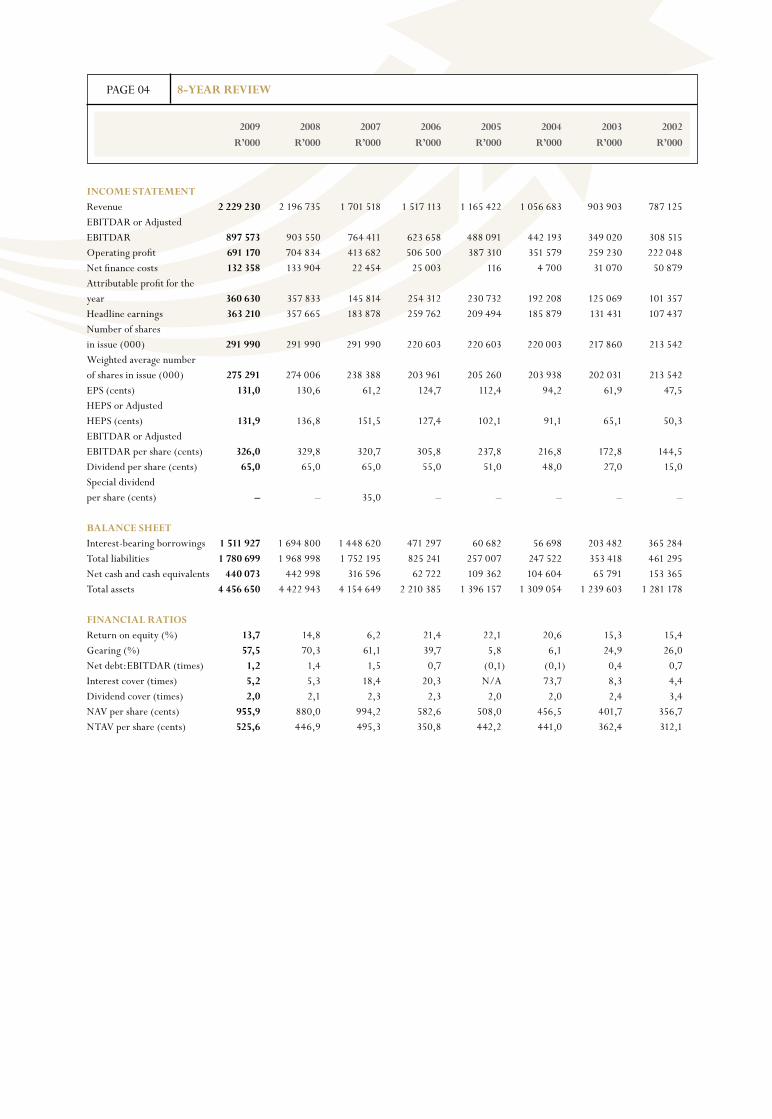
PAGE 04 8-YEAR REVIEW
2009 2008 2007 2006 2005 2004 2003 2002
R’000 R’000 R’000 R’000 R’000 R’000 R’000 R’000
INCOME STATEMENTRevenue 2 229 230 2 196 735 1 701 518 1 517 113 1 165 422 1 056 683 903 903 787 125 EBITDAR or Adjusted EBITDAR 897 573 903 550 764 411 623 658 488 091 442 193 349 020 308 515 Operating profit 691 170 704 834 413 682 506 500 387 310 351 579 259 230 222 048 Net finance costs 132 358 133 904 22 454 25 003 116 4 700 31 070 50 879 Attributable profit for the year 360 630 357 833 145 814 254 312 230 732 192 208 125 069 101 357 Headline earnings 363 210 357 665 183 878 259 762 209 494 185 879 131 431 107 437 Number of shares in issue (000) 291 990 291 990 291 990 220 603 220 603 220 003 217 860 213 542 Weighted average number of shares in issue (000) 275 291 274 006 238 388 203 961 205 260 203 938 202 031 213 542 EPS (cents) 131,0 130,6 61,2 124,7 112,4 94,2 61,9 47,5 HEPS or Adjusted HEPS (cents) 131,9 136,8 151,5 127,4 102,1 91,1 65,1 50,3 EBITDAR or Adjusted EBITDAR per share (cents) 326,0 329,8 320,7 305,8 237,8 216,8 172,8 144,5 Dividend per share (cents) 65,0 65,0 65,0 55,0 51,0 48,0 27,0 15,0 Special dividend per share (cents) – – 35,0 – – – – – BAlANCE ShEET Interest-bearing borrowings 1 511 927 1 694 800 1 448 620 471 297 60 682 56 698 203 482 365 284 Total liabilities 1 780 699 1 968 998 1 752 195 825 241 257 007 247 522 353 418 461 295 Net cash and cash equivalents 440 073 442 998 316 596 62 722 109 362 104 604 65 791 153 365 Total assets 4 456 650 4 422 943 4 154 649 2 210 385 1 396 157 1 309 054 1 239 603 1 281 178 FINANCIAl RATIOS Return on equity (%) 13,7 14,8 6,2 21,4 22,1 20,6 15,3 15,4 Gearing (%) 57,5 70,3 61,1 39,7 5,8 6,1 24,9 26,0 Net debt:EBITDAR (times) 1,2 1,4 1,5 0,7 (0,1) (0,1) 0,4 0,7Interest cover (times) 5,2 5,3 18,4 20,3 N/A 73,7 8,3 4,4 Dividend cover (times) 2,0 2,1 2,3 2,3 2,0 2,0 2,4 3,4 NAV per share (cents) 955,9 880,0 994,2 582,6 508,0 456,5 401,7 356,7 NTAV per share (cents) 525,6 446,9 495,3 350,8 442,2 441,0 362,4 312,1

Gold Reef CityJohannesburg, Gauteng
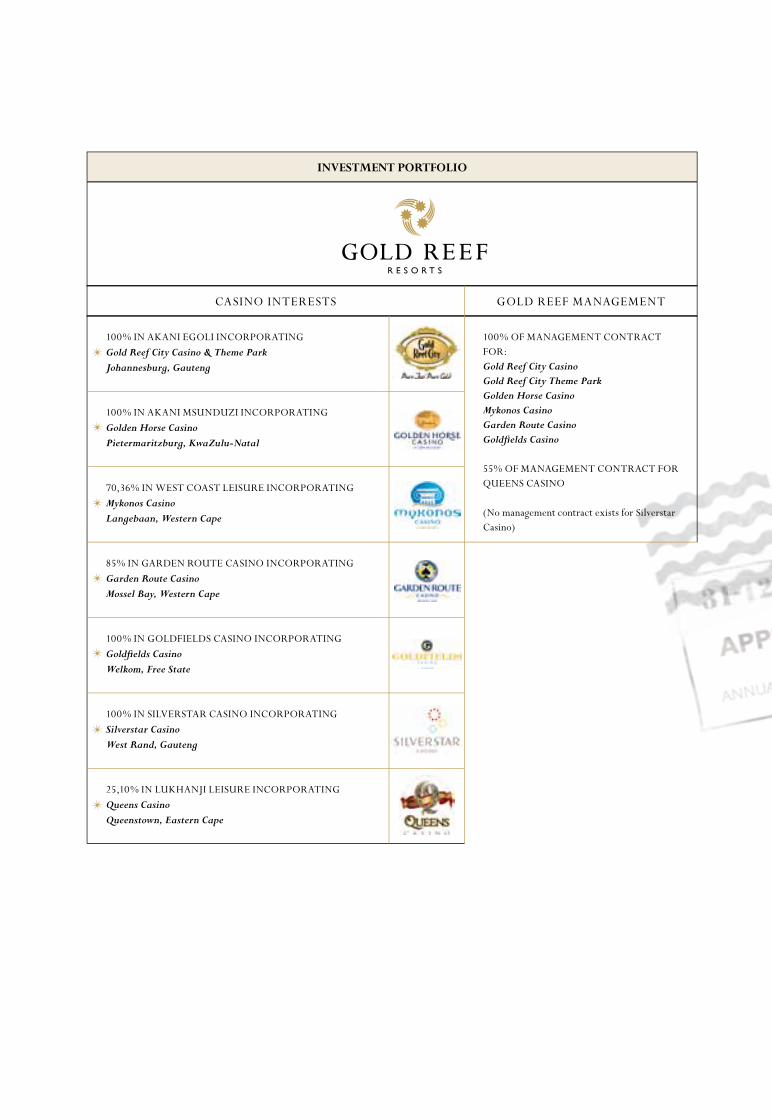
CASINO INTERESTS GOLD REEF MANAGEMENT
100% IN AKANI EGOLI INCORPORATINGGold Reef City Casino & Theme ParkJohannesburg, Gauteng
100% IN AKANI MSUNDUZI INCORPORATINGGolden Horse CasinoPietermaritzburg, KwaZulu-Natal
70,36% IN WEST COAST LEISURE INCORPORATINGMykonos CasinoLangebaan, Western Cape
85% IN GARDEN ROUTE CASINO INCORPORATINGGarden Route CasinoMossel Bay, Western Cape
100% IN GOLDFIELDS CASINO INCORPORATINGGoldfi elds CasinoWelkom, Free State
100% IN SILVERSTAR CASINO INCORPORATINGSilverstar CasinoWest Rand, Gauteng
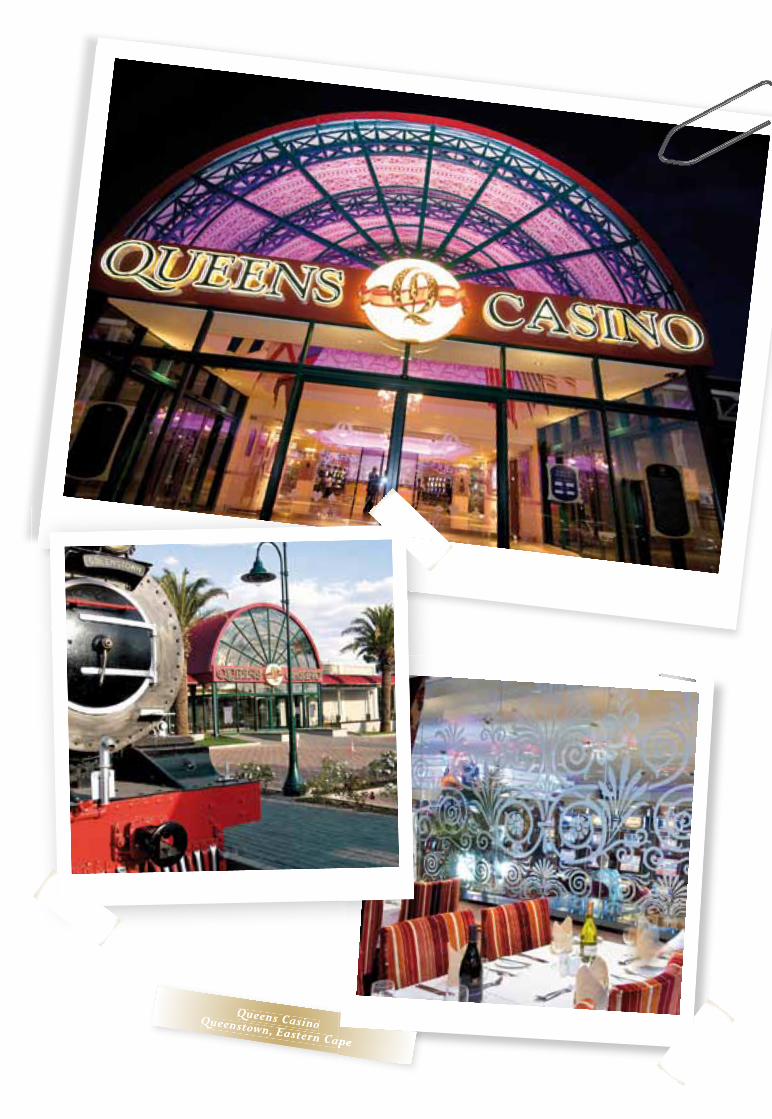
25,10% IN LUKHANJI LEISURE INCORPORATINGQueens CasinoQueenstown, Eastern Cape
100% OF MANAGEMENT CONTRACT FOR:Gold Reef City CasinoGold Reef City Theme ParkGolden Horse CasinoMykonos CasinoGarden Route CasinoGoldfi elds Casino
55% OF MANAGEMENT CONTRACT FOR QUEENS CASINO
(No management contract exists for Silverstar Casino)
INVESTMENT PORTFOlIO

PAGE 07DIRECTORATE AND MANAGEMENT
SB JOFFE (39)ChIEF EXECUTIVE OFFICERB Com (hons Taxation) h Dip (Company law) CA(SA)Has over 14 years’ experience in the gaming industry and was appointed as Chief Executive Offi cer of Gold Reef in 2000.
PCM SEPTEMBER (67)BSc (hons) MScHas eight years’ experience in the gaming industry after becoming Chairman of Akani Msunduzi in 2001. Holds non-executive directorships in a number of private companies and is chairperson of Business Against Crime in KwaZulu-Natal.
JS FRIEDMAN (37) FINANCIAl DIRECTORCA(SA)Has ten years’ experience in the gaming industry having joined Gold Reef in 2000.
P VAllET (63) BA llBChief Executive Offi cer of Fluxmans Attorneys and Chairman of Super Group Limited. He is also a director of Caxton and CTP Printing & Publishing Limited. Phillip is cited in Chambers Global (The World’s Leading Lawyers for Business – Client’s Guide) as “one of the leading commercial lawyers in SA”.
C NEUBERGER” (44) ChIEF OPERATING OFFICERMBA (Vienna)Has 19 years’ experience in gaming with Gold Reef and its former international partner, Casinos Austria.
TM SADIKI (40) hR DIRECTORB JurisPreviously Industrial Relations Manager at DeBeers Consolidated Mining, he joined Gold Reef City Casino in October 2000 as HR Manager and was subsequently promoted to Operations Manager in January 2007 before being appointed as Gold Reef’s HR Director on 26 November 2008.
”Austrian Citizen
EXECUTIVE DIRECTORS
NON-EXECUTIVE DIRECTORS
S Krok (80) – Alternate to M Z Krok
SJ hIGhT (49)General Manager
Gold Reef City Casino
J GOOSEN (38)General Manager
Gold Reef City Theme Park
M VERMAAK (48)General ManagerSilverstar Casino
C VAN GROENINGEN (47)General ManagerMykonos Casino
P BENEY (47)General Manager
Golden Horse Casino
RJ SEABROOK (38)General Manager
Garden Route Casino
D DE BEER (41)General ManagerGoldfi elds Casino
W GRIMM (41)General ManagerQueens Casino
AlTERNATE DIRECTORS
SENIOR MANAGEMENT

PAGE 08 DIRECTORATE AND MANAGEMENT
DR EN BANDA (45)ChAIRMANB Acc(hons), JD, llM (Suma cum laude)Has degrees in fi nancial accounting, a doctor of jurisprudence and a post graduate master of laws from universities in the United States of America. He has formal professional specialisation in cross border merger and acquisitions transactions, international project fi nance and the law of treaties. He is admitted as an attorney and counsellor-at-law in the State of New York, USA and as an advocate of the Supreme Court of South Africa. He sits on a limited number of privately held boards.
MG DIlIZA (60)B Com BBA (hons)Joined the Gold Reef Board in March 2008. He is currently Chief Executive Offi cer of The Chamber of Mines of SA and the founding Chairman of Strategic Partners Group.He is also a director of Aurecon, Ansys Limited, Bombela Concession Company, Bombela Operating Company and Growthpoint Properties Limited.
JC FARRANT (69)CA(SA)From 1970 to 1997 he was an audit partner for various local and international companies at Ernst & Young. Since then he has been a self-employed consultant and serves on a number of boards including Jasco Electronics Holdings Limited, Randjes Estate(Section 21 Company), Robson Savage (Proprietary) Limited, Pitsani Game ReserveLimited and is Chairman of the Acumen Group of Pension, Provident and Retirement Umbrella Funds.
MZ KROK (53)Has more than 32 years’ experience in a diversity of business fi elds and currently holds directorships of numerous private companies.
ZJ MATlAlA (46)CA(SA)She is the Group FD of Kagiso Trust Investments. She was previously the Chief Financial Offi cer of the Development Bank of South Africa. She also spent a period of three and a half years in various roles at the Industrial Development Corporation that included Project Finance and Private Equity.
INDEPENDENT NON-EXECUTIVE DIRECTORS
Gold Reef City Theme ParkGold Reef City Theme Park
Johannesburg, GautengJohannesburg, GautengGold Reef City Theme Park
Gold Reef City Theme Park
PAGE 12 ChAIRMAN’S REPORT
I am delighted to present my fi rst report as Chairman of Gold Reef Resorts.
I became Chairman during the apex of the global fi nancial crisis, whose effects on the South African economy have tested even the most well-established companies and management teams in the country. In this backdrop, I have therefore been impressed by the quality of the management of our group, which has over the years developed such high stature in the South African leisure and entertainment industry.In the face of recent tough economic challenges, and the changing social and environmental landscape arising from those challenges, Gold Reef Resorts has remained both committed and loyal to managing its business operations in line with its values of putting people fi rst, both employees and customers. The group has ensured that the most vulnerable members of our society in times of economic instability – the employee – are supported. The group did this by ensuring that there were no wholesale retrenchments of our employees or redundancies.
In the year under review, the group announced a proposed merger with Tsogo. This proposed merger refl ects the group’s considered approach to the advancement and protection of stakeholder interests and relationships, by focusing on what is capable of potentially protecting and increasing shareholder value. The board both recommends and supports the proposed merger, and applauds management’s provision of certainty in what was an unresolved shareholding situation. The merger would create a company of signifi cant scale and diversity, well-positioned to make a positive contribution to our domestic markets and to compete on the world stage. The merger is subject to certain regulatory conditions, which I am confi dent will be successfully met. However, in the event regulators raise issues which prevent the merger, we remain committed to the group’s vision and would continue to pursue available and viable alternatives for growth in the best interests of shareholders.
FINANCIAl hIGhlIGhTSIn 2009 the group performed well, with market share gains in all but one province, strong cash fl ows and a decrease in overall debt. Continued focus on cost controls resulted in an increase in HEPS to 131,9 cents.
In a tough fi nancial year, these solid results are indicative of a sound approach to business management that is to be commended.
STRATEGY AND OPPORTUNITIESThere are two potential outlooks for the group, dependent on the outcome of the proposed merger. Most likely the group will move forward as a partner in the Merged Entity with Tsogo. Our aim therefore is to continue along our current course, maximizing our operations for profi tability, so as to be an effective partner in the proposed Merged Entity.
I am quietly confi dent of the company’s growth prospects and continued successes in the future and we will always act in accordance with the best interests of our shareholders.
RESPONSIBlE GAMBlINGRecent reviews of the National Gaming Act are to be welcomed. I do not, fi rstly, anticipate a negative outcome from the ongoing reviews and, second, any changes that may arise from the reviews should not adversely affect or jeopardize our ongoing operations. I am comfortable that any
review will take into consideration existing issued licence holders’ rights and, any changes to the existing gambling industry regime will be tempered by balancing adverse impacts from such changes and the benefi ts to society arising from the current gaming operations.
To the extent that gambling is legal in South Africa, we must continue to contribute to responsible gambling. This is the touchstone of our operations and we encourage any national government initiatives or measures that support the promotion of responsible gambling. This will ensure that gaming creates employment and contributes signifi cantly to the economy on a number of key indicators, including tax revenues, employment, economic development and social upliftment.
Gold Reef provides an outlet for responsible gambling as merely one aspect of our overall family entertainment offering.
CSIDuring the year the group committed R24,9 million to CSI programmes, which included:• MaAfrika Tikkun – a non-governmental non-profi t organisation
that works toward the transformation of South African communities by caring for vulnerable children and orphans in townships;
• Ithuba Skills College – building and renovating of a college near Heidelberg;
PAGE 13ChAIRMAN’S REPORT CONTINUED
• Olwazini Discovery Centre – a science and cultural centre situated on the Golden Horse Casino premises. The centre was created to act as a resource and learning centre for the more than 600 schools in the area and offers its facilities to the community free of charge;
• Zithuthukise Community Development – Community based project that assists the Mpomleweni community by selling chicks and using the profits to provide for poverty-stricken families as well as offering home-based care to HIV/AIDS families and orphans;
• Garden Route Casino Community Trust – contributed towards the construction of international-standard changing rooms at a Mossel Bay sports field benefiting the community. The Trust also sponsored the restoration of one of South Africa’s premier hiking trails around the coast of Mossel Bay, the St Blaize Hiking Trail;
• SOJO – social responsibility program for the upliftment of communities in the South of Johannesburg.
The continued efforts to support the autonomy of the Apartheid Museum is indicative of our ethos. The management of the company has gone beyond what is technically necessary to comply with the conditions of license, in attempting to procure a long-life unencumbered lease for the Apartheid Museum.
EMPOWERMENTDuring 2009 all of the relevant provincial gambling boards approved the application for the indirect acquisition by Tsogo of the shares of certain empowerment shareholders of Gold Reef. Gold Reef remains committed to ensuring that empowerment is sufficient throughout the group for commercial, strategic and regulatory reasons including complying with all license conditions.
The group has attained a Level 3 Empowerdex BEE rating, exceeding the target of achieving Level 4 status by the end of 2010. In addition, all subsidiaries exceeded their 2009 targets, achieving an Empowerdex BEE rating of between Level 4 and Level 2.
As part of the verification process, areas of improvement have been identified and focus will be placed on these areas in order to ensure that the group continues to comply with CASA guidelines on B-BBEE. These areas include, improving the representation of previously disadvantaged individuals in management with more emphasis placed on black women, creating employment for the disabled, focused allocation of training spend in order to improve skills development and increasing procurement from empowered small businesses. The establishment of the Gold Reef Resorts Training Institute will contribute immensely to most of these areas.
The group will continue its commitment to empowerment and will endeavour to achieve the 2015 B-BBEE Level 2 target as set by the gambling boards and agreed to by CASA. While this does represent certain challenges, the group is well-placed to accomplish this goal.
CORPORATE GOVERNANCECorporate South Africa is entering a new era of corporate reality with the introduction of the new Companies Act. The new Act carries with it many implications including – something of particular interest to our board – the added responsibilities that may apply to holders of board seats in companies. We have taken great care to familiarize
ourselves with our expected responsibilities under the new Act, and will continue to do so once the new regulations are promulgated, to ensure that our continued custodianship is consistent with the letter and spirit of the law.
The King III Governance Report will come into operation in 2010. Corporate engagement will focus on sustainability, particularly with regards to the wider stakeholder environment, as well as integrated reporting and stakeholder relations. The group will continue to focus on reporting on the basis of the triple bottom line and, will ensure that the non-financial aspects of the group’s operations are advanced in a manner similar to our key financial performance indicators.
DIRECTORATEM Krok resigned on 2 July 2009 as chairman and director of Gold Reef. Consequently, I was appointed independent non-executive chairman of Gold Reef.
As a result of Casinos Austria’s disinvestment in Gold Reef, J Leutgeb also resigned as a director of the Company on 2 July 2009. In accordance with the board’s age retirement policy, AJ Aaron retired as a director on 8 July 2009.
On 25 August 2009 P Vallet was appointed as a non-executive director to the Gold Reef board.
L Fick was appointed as Company Secretary with effect from 25 November 2009.
APPRECIATIONMy appreciation is extended to the board for their wealth of experience. Their handling of the proposed merger and resultant issues reflects this seasoned expertise.
I pay tribute to the current executive team. Their performance belies their youth. Under their committed leadership and guidance, they have steered the group favourably through challenging economic times and in the proposed merger, they have presented a genuine opportunity for the protection and advancement of shareholder interests. I single out the CEO of the group, Mr Steven Joffe, for his tireless energy, enthusiasm, guidance and leadership to the management of the group during what has been a challenging operating environment.
DR ENOS BANDA
ChAIRMAN

Golden Horse Casino, Pietermaritzburg, KwaZulu-Natal
Golden Horse Casino, Golden Horse Casino, Pietermaritzburg, KwaZulu-NatalPietermaritzburg, KwaZulu-Natal
Golden Horse Casino, Golden Horse Casino,
PAGE 15ChIEF EXECUTIVE OFFICER’S REPORT
2009 was a very tough year with the South African economy still reeling from the effects of the 2008 global economic crisis and recession. Yet, despite these challenges, Gold Reef produced solid results for its shareholders and remained committed to delivering quality and superior entertainment and gaming choices to its customers.
Although the financial crisis of 2008 showed some signs of recovery last year, the consumer still felt the full force of the recession. This was exacerbated by limited access to credit, an increase in assessment rates and the upward increase in energy prices which impacted considerably on disposable income and discretionary spending.
In these difficult trading conditions, the group remained focused on cutting costs. In the entertainment industry it is vital not to compromise on service levels that come from a fully dedicated and motivated staff. There were no staff redundancies and any staff cost savings were achieved through natural attrition of staff numbers.
In addition to this, the company was able to reduce its debt by about R200 million and continue with its capex programme with over R200 million invested in the upgrade of the casino portfolio. Our focus on the continued investment in our operations contributed to our robust and resilient results in this period. During the year the company also paid dividends of R180 million to its shareholders.
PROPOSED MERGER WITh TSOGO During 2008 Tsogo became an approximate 25% shareholder in the group. As a competitor with extensive experience in the hotel and hospitality industries, this shareholding opened up an opportunity for engagement with Tsogo, in particular in the context of limited opportunities remaining for significant expansion of the business in the foreseeable future in South Africa.
In February 2010 we therefore announced a proposed merger with Tsogo to create a pre-eminent gaming and hotel company in South Africa which would have a significant ranking amongst listed emerging market peers in the Europe, Middle East and Africa region.
For Gold Reef shareholders, the merger offers exposure to Tsogo’s quality gaming and hotel assets and a perfect fit with their established international hotel business. All shareholders will benefit from the geographical and market segment diversification of the Merged Entity. It creates a much larger and stronger group able to pursue attractive growth opportunities in new markets. The merger has also dealt with the inherent weakness of having a 25% shareholder in the same industry.
The proposed merger with Tsogo is subject to the fulfilment or waiver of certain conditions prior to implementation, including inter alia shareholder, gambling board and Competition Authorities approvals.
FINANCIAl REVIEWTrading conditions in 2009 were challenging with the recession in South Africa impacting on the consumer’s disposable income and access to credit and fuelling uncertainties about the future of the job market. Notwithstanding this, Gold Reef produced a solid set of results with increases in revenue and EBITDAR as well as market share gains in all but one province. Both group revenue and EBITDAR increased by 1,5% to R2,2 billion and R897,6 million respectively.
The company continued to focus on its controllable cost base, most notably employee costs which increased by only 4% and was achieved by headcount reductions through natural attrition. As a result of these cost controls, the company was able to maintain the EBITDAR margin achieved in 2008, producing an EBITDAR margin of 40,3%. Following recent significant investments in the group’s properties, either in regard to recently opened casinos or extensive refurbishments at existing properties, depreciation and amortisation increased 15% to R185 million. The increase in other operating expenses of 3% to R336 million was impacted by repairs and maintenance and utility costs which increased by 27% to R85 million.
Net finance costs of R132 million were in line with 2008 owing to the interest rate hedge that is in place over the Silverstar Casino debt balance of R1,2 billion, which effectively results in a fixed interest rate on the majority of the group’s debt balance of R1,5 billion as at 31 December 2009. Four of the company’s interest rate hedges expired during the year with the hedge contract for Silverstar Casino due to expire in October 2011. Group debt (net of cash on hand) was R1,1 billion at year-end which translates to a 1,2 multiple of EBITDAR. HEPS increased 1% to 131,9 cents.
Cash flow of R852 million was generated from operations during the year. Total capex was R206 million in 2009, down from R445 million
PAGE 16
the previous year. Of this, R93 million related to operational capex which increased by R2 million from the prior year. Developmental capex incurred in 2009 of R113 million was considerably less than the R354 million incurred during 2008 because of the completion of Silverstar Casino in 2008. The company continued with the conversion of all remaining properties to smartcard gaming, which was completed in the fi rst quarter of 2010.
OPERATIONSGautengTotal GGR in Gauteng contracted by 1% compared to growth of 8% in 2008 and double digit growth in prior years, clearly refl ecting the current subdued consumer environment. The company’s market share in Gauteng however increased from 24,5% to 25,1%, due mainly to Silverstar Casino’s market share growth.
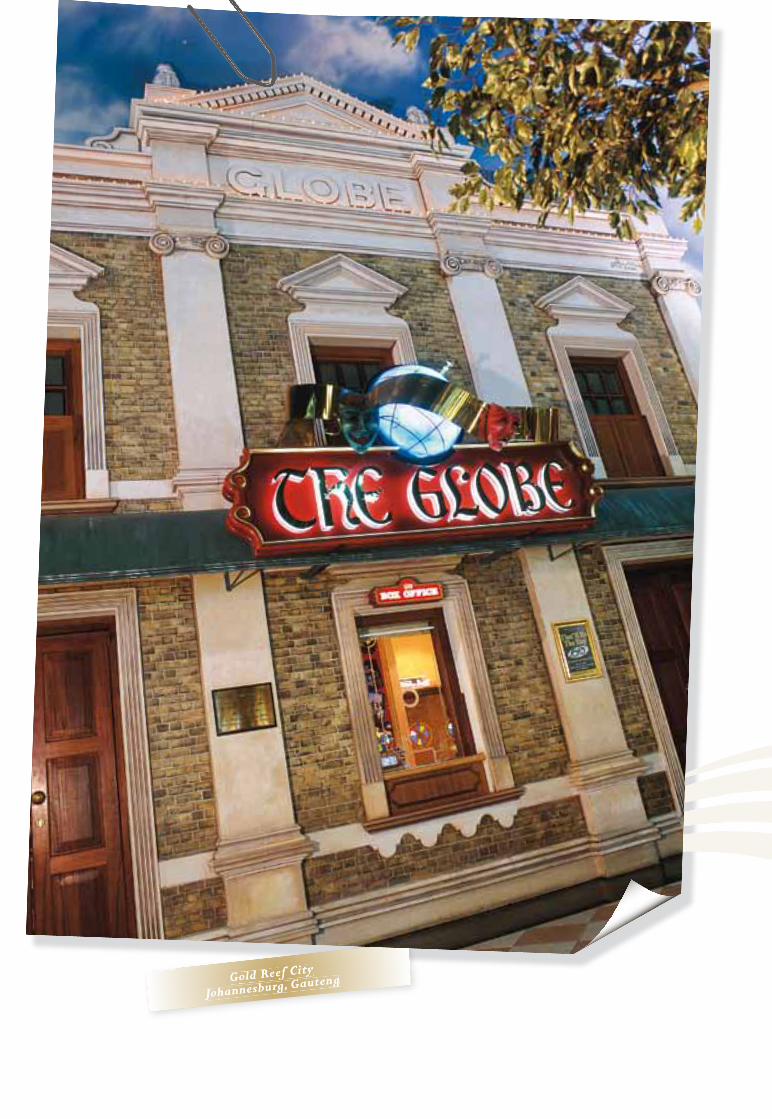
Gold Reef CityTotal revenue at the casino declined by 3% to R960 million as footfall remained unchanged from the previous year. In line with the performance of the Gauteng market, Gold Reef City Casino’s GGR decreased by 1,3%. In spite of the cost control measures in place, the shortfall in revenue resulted in margin erosion with the EBITDAR margin decreasing from 38,0% to 37,8% and EBITDAR down 4% to R362,5 million. Even though theatre revenues fell, losses were signifi cantly reduced from R21 million in 2008 to R12 million following the successful change to the theatre’s production mix. The theatre continues to be a satisfactory driver of footfall to the casino.
At 31 December 2009, total debt at the casino was R189 million in comparison to R247 million in the previous year.
The Theme Park performed well with revenue increasing by 25% to R84 million and EBITDAR increasing from R2 million in 2008 to R7 million in 2009. The EBITDAR margin benefi ted from the effects of operational gearing and a focus on cost control. Ongoing maintenance of the Theme Park’s facilities continued throughout the year and the hotel refurbishment is expected to be completed in the fi rst half of 2010.
Silverstar CasinoSilverstar Casino’s revenue increased by 6,5% to R543 million while EBITDAR increased by 10% from the previous year to R208
ChIEF EXECUTIVE OFFICER’S REPORT CONTINUED
million. Despite recent rate and utility cost increases, the EBITDAR margin increased to 38,3% following improved revenue levels and the implementation of strict cost control measures. The casino’s market share in Gauteng increased from 8,5% to 9,2% while footfall increased by 8% from the previous year. The ability of the casino to capture the additional market share was enhanced by the completion of all facilities during 2008, allowing patrons to experience the full range of entertainment options during 2009.
At 31 December 2009, total debt at the casino was R1,2 billion, down from R1,3 billion refl ected in the previous year.
Kwazulu-NatalGolden Horse CasinoGolden Horse Casino’s revenue increased by 1,5% to R248 million which lagged the provincial growth rate of 5% due to a major refurbishment of the gaming fl oor, food and beverage facilities, conferencing and the hotel during the year. This also impacted on the casino’s market share which fell slightly from 10,6% in 2008 to 10,2% in 2009. The casino phase of the refurbishment has now been completed, well within the budget of R81 million. The casino also successfully introduced smartcard gaming during the year. Further capex has been allocated for the refurbishment of the exterior of the property as well as hotel bedrooms during 2010.
The casino maintained EBITDAR levels, achieving R111 million in 2009. As a result of a focus on containing costs, the casino managed to achieve an EBITDAR margin of 44,7% for the year.
Western CapeThe economic recession impacted on the Western Cape market more than any other province in which Gold Reef operates. The tourism and property sectors in particular were adversely affected and GGR in the province fell by 6% from the previous year.
Mykonos CasinoDespite footfall declining by 9%, revenue at Mykonos Casino increased 2% to R114 million and the casino’s market share increased from 5,0% to 5,5%, a satisfying performance considering tough market conditions. Higher costs resulted in EBITDAR declining by 2% to R47 million, with the EBITDAR margin at 41,3%.
During the year the refurbishment of the casino was completed and smartcard gaming was introduced during the fi rst quarter of 2010.
Gold Reef CityGold Reef City
Johannesburg, GautengJohannesburg, GautengGold Reef City
Gold Reef City

PAGE 18 ChIEF EXECUTIVE OFFICER’S REPORT CONTINUED
Garden Route CasinoRevenue at Garden Route Casino fell by 2% to R160 million for the year, a satisfactory result relative to the decline in GGR in the province as well a decrease in footfall of 8% from 2008 levels. In spite of these challenges, the casino managed to increase its market share slightly to 7,6%.
The shortfall in revenue caused EBITDAR to decline by 10% to R71 million and the EBITDAR margin decreased to 44,7%.
During the second half of the year, the casino successfully completed the refurbishment of the gaming fl oor, adding 36 new slot machines as well as food and beverage facilities. The casino also successfully converted to smartcard gaming, all of which was funded out of cash resources. Further capex of R6 million has been allocated for the addition of a sports bar during 2010.
Free StateGoldfi elds Casino Revenues improved slightly at Goldfi elds Casino during the year, increasing by 1% to R119 million, as the casino grew its market share to 31,0% in 2009. This a relatively good performance given that GGR in the Free State fell by 1%. EBITDAR decreased by 1% to R52 million with the EBITDAR margin falling by 1% to 43,7% in 2009.
Smartcard gaming was introduced at the casino during the fi rst quarter of 2010. Goldfi elds Casino is also expected to benefi t from the completion of a major shopping complex refurbishment adjacent to the casino during 2010.
Eastern CapeQueens Casino Trading at Queens Casino improved notably during 2009 with revenues up 12% to R51 million and EBITDAR up 113% to R12 million, albeit off a low base. Consequently, the EBITDAR margin achieved in 2009 is now at a more acceptable level of 22,7% for a business of this size. The casino also increased its market share slightly in challenging trading conditions which saw GGR in the Eastern Cape fall by 2%.
PROSPECTS Diffi cult trading conditions are expected to continue into 2010. Currently there are limited indications of recovery with the consumer still feeling the effects of last year’s recession.
Gold Reef has a high quality asset portfolio, low gearing and strong cash fl ows. The company is well positioned to benefi t from improvements in the economy as they arise. However, expectations are that the recovery will be slow and growth will be moderate during 2010.
The proposed merger with Tsogo creates a company of signifi cant scale and diversifi cation across geographies and markets. The Merged Entity will look to capitalise on new growth opportunities as a larger and stronger company.
WORD OF ThANKSShould the proposed merger go ahead, I will be stepping down as CEO. In my tenure, I have been proud to open seven casinos and establish a portfolio that is new and exciting for investors. For this I thank Gold Reef’s employees, the management teams and the board for their commitment and support over the years. Their contribution to our success has been invaluable. It’s been a long, rewarding road and in the likelihood of stepping down, I welcome Jabu Mabuza to a company that can only build on its strengths and prospects.
STEVEN JOFFE
ChIEF EXECUTIVE OFFICER

Silverstar CasinoWest Rand, Gauteng
PAGE 22 SUSTAINABlE DEVElOPMENT
ECONOMICThis section outlines the direct and indirect economic impact made by Gold Reef’s operations on its stakeholders, aggregated in most instances to group level. In spite of the economic recession which caused national disposable income in SA to retract, management remains focused on maximizing economic growth for its stakeholders by capturing market share, thereby increasing the group’s market presence.
Gold Reef is a member of several industry bodies, ensuring the group remains abreast of best practice in the gaming sector. These memberships also enable us to participate constructively and responsibly in developments that affect our stakeholders.
CASACASA represents the interests of the country’s legal casino industry as well as the growing public which the industry serves. CASA’s emphasis is on playing a constructive and positive role in developing good public policy and good governance for the casino industry. CASA represents 35 of the 37 casinos in the country, including the Gold Reef group.
In its 2009 Survey of SA casinos, CASA highlighted specifi cally the economic impact which the casino industry has had on the SA economy. Parties benefi ting economically from the casino industry include the government at 29% of industry turnover and the procurement of goods and services at 28% – with over 40% of this procurement favouring BEE companies. Salaries and wages amounted to 14% while CSI stood at just under 0,5%.
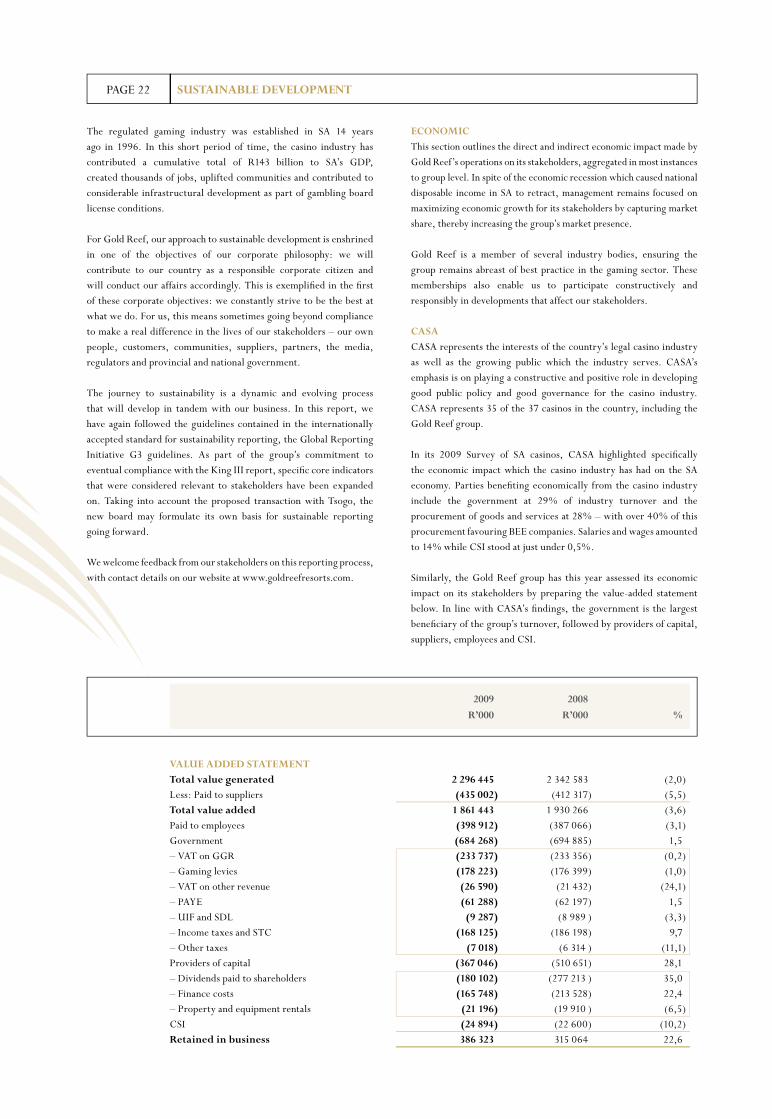
Similarly, the Gold Reef group has this year assessed its economic impact on its stakeholders by preparing the value-added statement below. In line with CASA’s fi ndings, the government is the largest benefi ciary of the group’s turnover, followed by providers of capital, suppliers, employees and CSI.
The regulated gaming industry was established in SA 14 years ago in 1996. In this short period of time, the casino industry has contributed a cumulative total of R143 billion to SA’s GDP, created thousands of jobs, uplifted communities and contributed to considerable infrastructural development as part of gambling board license conditions.
For Gold Reef, our approach to sustainable development is enshrined in one of the objectives of our corporate philosophy: we will contribute to our country as a responsible corporate citizen and will conduct our affairs accordingly. This is exemplifi ed in the fi rst of these corporate objectives: we constantly strive to be the best at what we do. For us, this means sometimes going beyond compliance to make a real difference in the lives of our stakeholders – our own people, customers, communities, suppliers, partners, the media, regulators and provincial and national government.
The journey to sustainability is a dynamic and evolving process that will develop in tandem with our business. In this report, we have again followed the guidelines contained in the internationally accepted standard for sustainability reporting, the Global Reporting Initiative G3 guidelines. As part of the group’s commitment to eventual compliance with the King III report, specifi c core indicators that were considered relevant to stakeholders have been expanded on. Taking into account the proposed transaction with Tsogo, the new board may formulate its own basis for sustainable reporting going forward.
We welcome feedback from our stakeholders on this reporting process, with contact details on our website at www.goldreefresorts.com.
VAlUE ADDED STATEMENT Total value generated 2 296 445 2 342 583 (2,0)Less: Paid to suppliers (435 002) (412 317) (5,5)Total value added 1 861 443 1 930 266 (3,6)Paid to employees (398 912) (387 066) (3,1)Government (684 268) (694 885) 1,5– VAT on GGR (233 737) (233 356) (0,2)– Gaming levies (178 223) (176 399) (1,0)– VAT on other revenue (26 590) (21 432) (24,1)– PAYE (61 288) (62 197) 1,5– UIF and SDL (9 287) (8 989 ) (3,3)– Income taxes and STC (168 125) (186 198) 9,7– Other taxes (7 018) (6 314 ) (11,1)Providers of capital (367 046) (510 651) 28,1– Dividends paid to shareholders (180 102) (277 213 ) 35,0– Finance costs (165 748) (213 528) 22,4– Property and equipment rentals (21 196) (19 910 ) (6,5)CSI (24 894) (22 600) (10,2)Retained in business 386 323 315 064 22,6
2009 2008
R’000 R’000 %

PAGE 23SUSTAINABlE DEVElOPMENT
PREFERENTIAl PROCUREMENT AND ENTERPRISE DEVElOPMENTPreferential ProcurementGold Reef’s policy on preferential procurement is geared to be in line with the DTI Codes on B-BBEE as well as CASA guidelines. The group is committed to affi rmative procurement and formalized minimum procurement targets for goods and services are in place at all operations with an emphasis on supporting empowered businesses that are local to the region concerned. Procurement from BEE fi rms is emphasised for non-casino specialised services as casinos are compelled by regulation to use companies licensed as casino suppliers for casino dedicated goods and services, irrespective of their BEE status.
Each operation’s preferential procurement targets are included in its original bid commitments to the gaming authorities. Progress against
Total BEE procurement as a % of total measured spend 49,68% 48,04% 122,28% 84,17% 75,55% 49,74% 73,38% 53,71%Total BEE procurement from QME’s and EME’s as a % of total measured spend 10,78% 37,47% 19,94% 18,46% 24,63% 17,86% 9,36% 0,11%BEE procurement from black-owned suppliers as a % of total measured spend 3,43% 0,80% 9,89% 11,78% 7,36% 4,54% 0,12% 0,04%BEE procurement from black woman-owned suppliers as a % of total measured spend 3,31% 0,10% 3,41% 4,90% 0,47% 1,59% 0,00% 0,00%
GOlD GOlD REEF CITY SIlVER- GOlDEN GARDEN GOlD- REEF CITY ThEME STAR hORSE MYKONOS ROUTE FIElDS QUEENS CASINO PARK CASINO CASINO CASINO CASINO CASINO CASINO
these targets is closely monitored and qualifi cation requirements regularly reviewed.
In terms of our strategy, the following targets have been set in terms of preferential procurement:• Increase the procurement from BEE suppliers to 50% by
formalising and standardising the procurement processes and procedures throughout the group;
• Increase procurement from QME’s and EME’s;• Improved procurement spend from 50% black-owned companies;• Improved procurement spend from 30% black woman-owned
companies.
The table below details each unit’s performance relating to preferential procurement for the 2009 year:
2009 2008
PAID TO EMPlOYEES
VAT ON GGR
GAMING lEVIES
VAT ON OThER REVENUE
PAYE
UIF AND SDl
INCOME TAXES AND STC
OThER TAXES
DIVIDENDS PAID TO ShAREhOlDERS
FINANCE COSTS
PROPERTY AND EQUIPMENT RENTAlS
CSI
RETAINED IN BUSINESS
PAID TO EMPlOYEES
VAT ON GGR
GAMING lEVIES
VAT ON OThER REVENUE
PAYE
UIF AND SDl
INCOME TAXES AND STC
OThER TAXES
DIVIDENDS PAID TO ShAREhOlDERS
FINANCE COSTS
PROPERTY AND EQUIPMENT RENTAlS
CSI
RETAINED IN BUSINESS
20092009
20,75%
8,90%
9,68%
1,34%1,14%
0,38%
0,5%0,47%0,33%
9,03%9,57%
12,56%
21,43%
3,29% 3,22%1,43% 1,11%
9,14%
9,65%
14,36%
11,06%12,09%
20,05%16,32%
1,03%1,17%
PAGE 24 SUSTAINABlE DEVElOPMENT
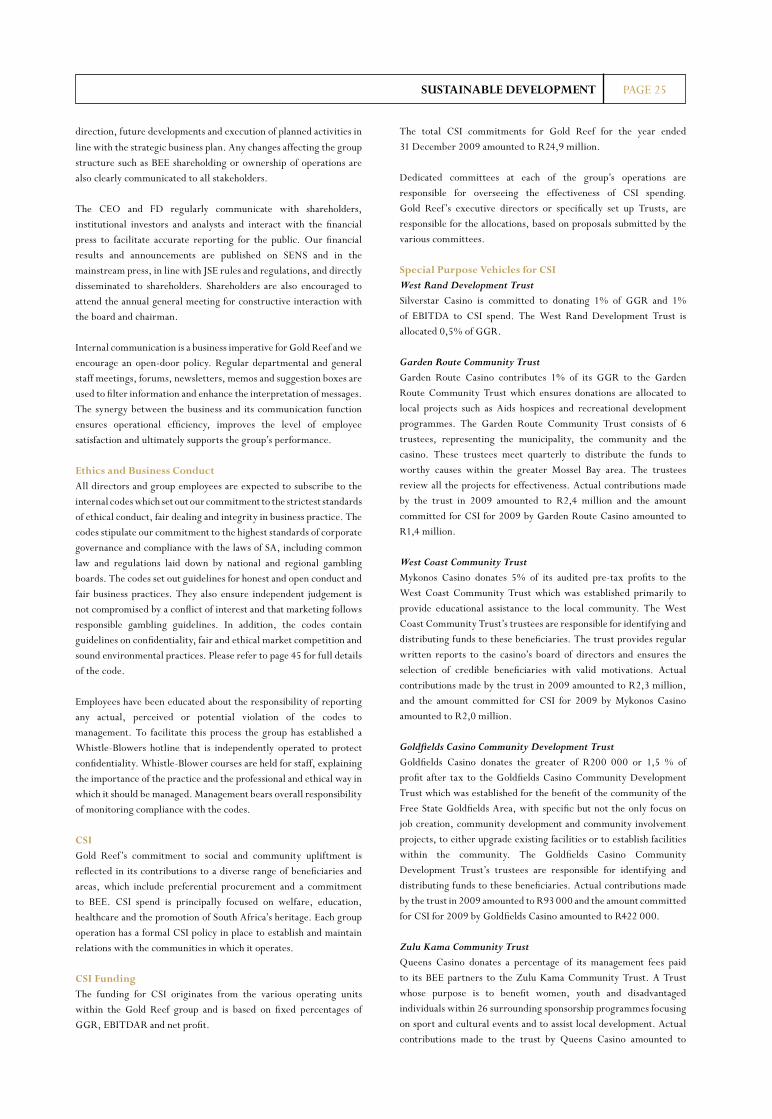
NRGPThe NRGP – a public/private sector initiative – is the only one
of its kind in Africa. It is internationally acknowledged as being
exceptionally well-funded and among the most comprehensive in the
world. The NRGP has several operational components:
• education and prevention;
• treatment and counselling;
• problem gambling counselling line;
• research; and
• training.
The NRGP reports to the SARGT, a public/ private sector partnership
in turn accountable to the SA Advisory Council on Responsible
Gambling. The council was created by the National Gambling Board
in 2001 as a national forum and policy advisory body and comprises
representatives of industry, government and civil society.
The SARGT is a public/private sector partnership between
government regulators and the industry. Gold Reef is an active
participant in the trust which has an extensive public advocacy
campaign to promote responsible gambling, including Africa’s first
education campaign aimed at adolescents and senior citizens.
The NRGP’s 24-hour toll-free counselling line is operated by
dedicated, skilled and experienced treatment professionals. The
helpline offers multilingual counselling and treatment to problem
gamblers or their friends and families across SA.
All Gold Reef’s communication and promotional material carries the
NRGP’s responsible gambling message and toll-free helpline number.
In line with minimum legal-age requirements, no models that are
or appear to be below the age of 18 are featured in this material. All
casinos’ external advertising – including radio, television and print
– complies with relevant gaming legislation and adheres to NRGP
and CASA requirements. The casinos’ below- and above-the-line
advertising campaigns reflect accepted contemporary standards of
good taste and are consistent with principles of dignity and integrity.
Extensive and ongoing staff training takes place at all operations. In
addition, staff members receive copies of the CASA newsletter for
updates on problem gambling. Responsible gaming signage, including
the toll-free helpline number, is prominently displayed at all casinos
and on their websites. In addition, customers can decline to receive
promotional material and can choose to be excluded from loyalty
programmes as well as casino premises.
Group casinos proactively protect children with security officers
allocated to ensure children do not enter the gaming area. These
officers are also specifically trained in appropriate procedures for
dealing with unattended minors. At certain operations employees
have received training in childcare.
Stakeholder communicationGold Reef believes in transparent, two-way communication and
conveying timely, accurate information to all stakeholders and
investors. The role of the group’s stakeholder communication
function is to inform the relevant parties of the company’s strategic
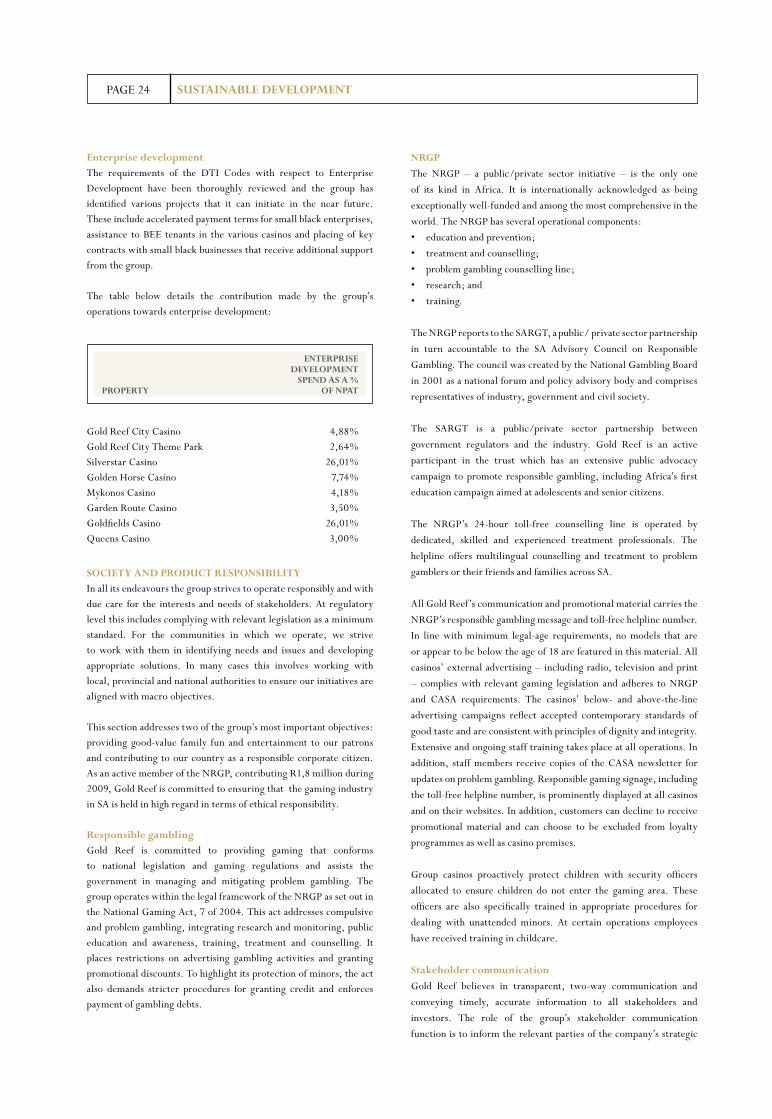
Enterprise developmentThe requirements of the DTI Codes with respect to Enterprise Development have been thoroughly reviewed and the group has identified various projects that it can initiate in the near future. These include accelerated payment terms for small black enterprises, assistance to BEE tenants in the various casinos and placing of key contracts with small black businesses that receive additional support from the group.
The table below details the contribution made by the group’s operations towards enterprise development:
SOCIETY AND PRODUCT RESPONSIBIlITYIn all its endeavours the group strives to operate responsibly and with due care for the interests and needs of stakeholders. At regulatory level this includes complying with relevant legislation as a minimum standard. For the communities in which we operate, we strive to work with them in identifying needs and issues and developing appropriate solutions. In many cases this involves working with local, provincial and national authorities to ensure our initiatives are aligned with macro objectives.
This section addresses two of the group’s most important objectives: providing good-value family fun and entertainment to our patrons and contributing to our country as a responsible corporate citizen. As an active member of the NRGP, contributing R1,8 million during 2009, Gold Reef is committed to ensuring that the gaming industry in SA is held in high regard in terms of ethical responsibility.
Responsible gamblingGold Reef is committed to providing gaming that conforms to national legislation and gaming regulations and assists the government in managing and mitigating problem gambling. The group operates within the legal framework of the NRGP as set out in the National Gaming Act, 7 of 2004. This act addresses compulsive and problem gambling, integrating research and monitoring, public education and awareness, training, treatment and counselling. It places restrictions on advertising gambling activities and granting promotional discounts. To highlight its protection of minors, the act also demands stricter procedures for granting credit and enforces payment of gambling debts.
Gold Reef City Casino 4,88%Gold Reef City Theme Park 2,64%Silverstar Casino 26,01%Golden Horse Casino 7,74%Mykonos Casino 4,18%Garden Route Casino 3,50%Goldfields Casino 26,01%Queens Casino 3,00%
ENTERPRISE DEVElOPMENT SPEND AS A % PROPERTY OF NPAT
PAGE 25
The total CSI commitments for Gold Reef for the year ended 31 December 2009 amounted to R24,9 million.
Dedicated committees at each of the group’s operations are responsible for overseeing the effectiveness of CSI spending. Gold Reef’s executive directors or specifically set up Trusts, are responsible for the allocations, based on proposals submitted by the various committees.
Special Purpose Vehicles for CSIWest Rand Development TrustSilverstar Casino is committed to donating 1% of GGR and 1% of EBITDA to CSI spend. The West Rand Development Trust is allocated 0,5% of GGR.
Garden Route Community TrustGarden Route Casino contributes 1% of its GGR to the Garden Route Community Trust which ensures donations are allocated to local projects such as Aids hospices and recreational development programmes. The Garden Route Community Trust consists of 6 trustees, representing the municipality, the community and the casino. These trustees meet quarterly to distribute the funds to worthy causes within the greater Mossel Bay area. The trustees review all the projects for effectiveness. Actual contributions made by the trust in 2009 amounted to R2,4 million and the amount committed for CSI for 2009 by Garden Route Casino amounted to R1,4 million.
West Coast Community TrustMykonos Casino donates 5% of its audited pre-tax profits to the West Coast Community Trust which was established primarily to provide educational assistance to the local community. The West Coast Community Trust’s trustees are responsible for identifying and distributing funds to these beneficiaries. The trust provides regular written reports to the casino’s board of directors and ensures the selection of credible beneficiaries with valid motivations. Actual contributions made by the trust in 2009 amounted to R2,3 million, and the amount committed for CSI for 2009 by Mykonos Casino amounted to R2,0 million. Goldfields Casino Community Development TrustGoldfields Casino donates the greater of R200 000 or 1,5 % of profit after tax to the Goldfields Casino Community Development Trust which was established for the benefit of the community of the Free State Goldfields Area, with specific but not the only focus on job creation, community development and community involvement projects, to either upgrade existing facilities or to establish facilities within the community. The Goldfields Casino Community Development Trust’s trustees are responsible for identifying and distributing funds to these beneficiaries. Actual contributions made by the trust in 2009 amounted to R93 000 and the amount committed for CSI for 2009 by Goldfields Casino amounted to R422 000.
Zulu Kama Community TrustQueens Casino donates a percentage of its management fees paid to its BEE partners to the Zulu Kama Community Trust. A Trust whose purpose is to benefit women, youth and disadvantaged individuals within 26 surrounding sponsorship programmes focusing on sport and cultural events and to assist local development. Actual contributions made to the trust by Queens Casino amounted to
direction, future developments and execution of planned activities in
line with the strategic business plan. Any changes affecting the group structure such as BEE shareholding or ownership of operations are also clearly communicated to all stakeholders.
The CEO and FD regularly communicate with shareholders, institutional investors and analysts and interact with the financial press to facilitate accurate reporting for the public. Our financial results and announcements are published on SENS and in the mainstream press, in line with JSE rules and regulations, and directly disseminated to shareholders. Shareholders are also encouraged to attend the annual general meeting for constructive interaction with the board and chairman.
Internal communication is a business imperative for Gold Reef and we encourage an open-door policy. Regular departmental and general staff meetings, forums, newsletters, memos and suggestion boxes are used to filter information and enhance the interpretation of messages. The synergy between the business and its communication function ensures operational efficiency, improves the level of employee satisfaction and ultimately supports the group’s performance.
Ethics and Business ConductAll directors and group employees are expected to subscribe to the internal codes which set out our commitment to the strictest standards of ethical conduct, fair dealing and integrity in business practice. The codes stipulate our commitment to the highest standards of corporate governance and compliance with the laws of SA, including common law and regulations laid down by national and regional gambling boards. The codes set out guidelines for honest and open conduct and fair business practices. They also ensure independent judgement is not compromised by a conflict of interest and that marketing follows responsible gambling guidelines. In addition, the codes contain guidelines on confidentiality, fair and ethical market competition and sound environmental practices. Please refer to page 45 for full details of the code.
Employees have been educated about the responsibility of reporting any actual, perceived or potential violation of the codes to management. To facilitate this process the group has established a Whistle-Blowers hotline that is independently operated to protect confidentiality. Whistle-Blower courses are held for staff, explaining the importance of the practice and the professional and ethical way in which it should be managed. Management bears overall responsibility of monitoring compliance with the codes.
CSIGold Reef’s commitment to social and community upliftment is reflected in its contributions to a diverse range of beneficiaries and areas, which include preferential procurement and a commitment to BEE. CSI spend is principally focused on welfare, education, healthcare and the promotion of South Africa’s heritage. Each group operation has a formal CSI policy in place to establish and maintain relations with the communities in which it operates.
CSI FundingThe funding for CSI originates from the various operating units within the Gold Reef group and is based on fixed percentages of GGR, EBITDAR and net profit.
SUSTAINABlE DEVElOPMENT

R169 000 and the amount committed for CSI for 2009 by Queens Casino amounted to R231 000.
Goldfields Casino, Welkom, Free StateGoldfields Casino, Goldfields Casino, Welkom, Free StateWelkom, Free StateGoldfields Casino, Goldfields Casino,

Gold Reef CityGold Reef City
Johannesburg, GautengJohannesburg, GautengGold Reef City
Gold Reef City
PAGE 28 SUSTAINABlE DEVElOPMENT
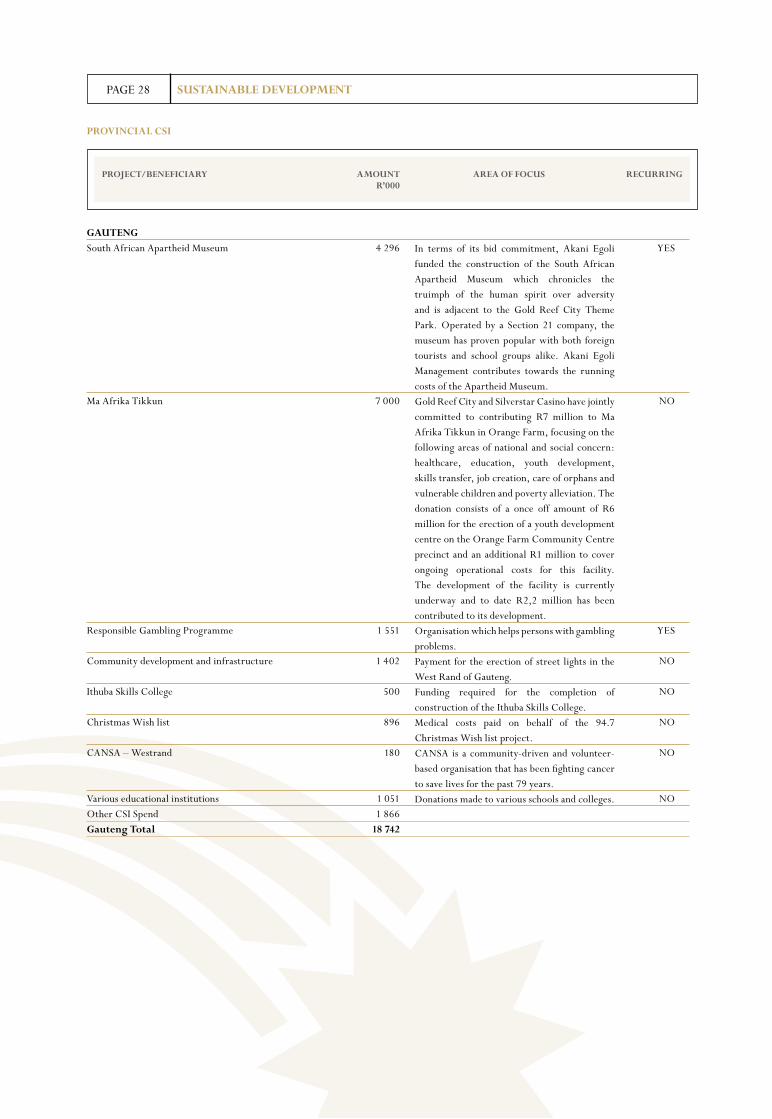
GAUTENGSouth African Apartheid Museum 4 296 YES
Ma Afrika Tikkun 7 000 NO
Responsible Gambling Programme 1 551 YES
Community development and infrastructure 1 402 NO
Ithuba Skills College 500 NO
Christmas Wish list 896 NO
CANSA – Westrand 180 NO
Various educational institutions 1 051 NOOther CSI Spend 1 866 Gauteng Total 18 742
PROJECT/BENEFICIARY AMOUNT AREA OF FOCUS RECURRING R’000
PROVINCIAl CSI
In terms of its bid commitment, Akani Egoli funded the construction of the South African Apartheid Museum which chronicles the truimph of the human spirit over adversity and is adjacent to the Gold Reef City Theme Park. Operated by a Section 21 company, the museum has proven popular with both foreign tourists and school groups alike. Akani Egoli Management contributes towards the running costs of the Apartheid Museum.Gold Reef City and Silverstar Casino have jointly committed to contributing R7 million to Ma Afrika Tikkun in Orange Farm, focusing on the following areas of national and social concern: healthcare, education, youth development, skills transfer, job creation, care of orphans and vulnerable children and poverty alleviation. The donation consists of a once off amount of R6 million for the erection of a youth development centre on the Orange Farm Community Centre precinct and an additional R1 million to cover ongoing operational costs for this facility. The development of the facility is currently underway and to date R2,2 million has been contributed to its development.Organisation which helps persons with gambling problems.Payment for the erection of street lights in the West Rand of Gauteng.Funding required for the completion of construction of the Ithuba Skills College.Medical costs paid on behalf of the 94.7 Christmas Wish list project.CANSA is a community-driven and volunteer-based organisation that has been fighting cancer to save lives for the past 79 years.Donations made to various schools and colleges.
PAGE 29SUSTAINABlE DEVElOPMENT
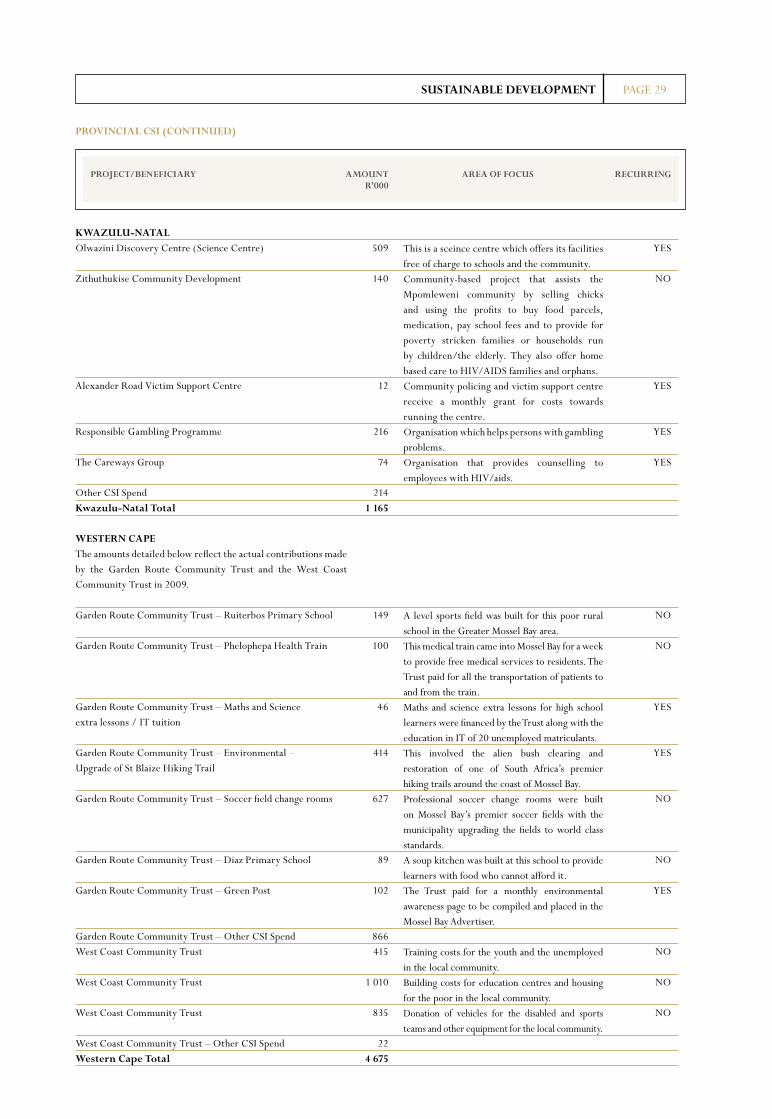
KWAZUlU-NATAlOlwazini Discovery Centre (Science Centre) 509 YES
Zithuthukise Community Development 140 NO
Alexander Road Victim Support Centre 12 YES
Responsible Gambling Programme 216 YES
The Careways Group 74 YES
Other CSI Spend 214 Kwazulu-Natal Total 1 165
WESTERN CAPEThe amounts detailed below reflect the actual contributions made by the Garden Route Community Trust and the West Coast Community Trust in 2009.
Garden Route Community Trust – Ruiterbos Primary School 149 NO
Garden Route Community Trust – Phelophepa Health Train 100 NO
Garden Route Community Trust – Maths and Science 46 YESextra lessons / IT tuition
Garden Route Community Trust – Environmental – 414 YESUpgrade of St Blaize Hiking Trail
Garden Route Community Trust – Soccer field change rooms 627 NO
Garden Route Community Trust – Diaz Primary School 89 NO
Garden Route Community Trust – Green Post 102 YES
Garden Route Community Trust – Other CSI Spend 866West Coast Community Trust 415 NO
West Coast Community Trust 1 010 NO
West Coast Community Trust 835 NO
West Coast Community Trust – Other CSI Spend 22 Western Cape Total 4 675
PROJECT/BENEFICIARY AMOUNT AREA OF FOCUS RECURRING R’000
PROVINCIAl CSI (CONTINUED)
This is a sceince centre which offers its facilities free of charge to schools and the community.Community-based project that assists the Mpomleweni community by selling chicks and using the profits to buy food parcels, medication, pay school fees and to provide for poverty stricken families or households run by children/the elderly. They also offer home based care to HIV/AIDS families and orphans.Community policing and victim support centre receive a monthly grant for costs towards running the centre.Organisation which helps persons with gambling problems.Organisation that provides counselling to employees with HIV/aids.
A level sports field was built for this poor rural school in the Greater Mossel Bay area.This medical train came into Mossel Bay for a week to provide free medical services to residents. The Trust paid for all the transportation of patients to and from the train.Maths and science extra lessons for high school learners were financed by the Trust along with the education in IT of 20 unemployed matriculants.This involved the alien bush clearing and restoration of one of South Africa’s premier hiking trails around the coast of Mossel Bay.Professional soccer change rooms were built on Mossel Bay’s premier soccer fields with the municipality upgrading the fields to world class standards.A soup kitchen was built at this school to provide learners with food who cannot afford it.The Trust paid for a monthly environmental awareness page to be compiled and placed in the Mossel Bay Advertiser.
Training costs for the youth and the unemployed in the local community.Building costs for education centres and housing for the poor in the local community.Donation of vehicles for the disabled and sports teams and other equipment for the local community.
Queens CasinoQueens CasinoQueenstown, Eastern Cape
Queenstown, Eastern Cape
Queenstown, Eastern Cape
Queenstown, Eastern Cape

PAGE 31SUSTAINABlE DEVElOPMENT
FREE STATEThe amounts detailed below reflect the actual contributions made by the Goldfields Casino Community Development Trust, Goldfields Casino has committed to contribute an additional amount of R 329 000 to the trust for 2009.
Goldfields Casino Community Development Trust – House of Joy 44 NOGoldfields Casino Community Development Trust – Rage eye project 43 NOGoldfields Casino Community Development Trust – Other CSI Spend 6 Free State Total 93
EASTERN CAPEZulu Kama Community Trust 169 YESOther CSI Spend 62 Eastern Cape Total 231
PROJECT/BENEFICIARY AMOUNT AREA OF FOCUS RECURRING R’000
PROVINCIAl CSI (CONTINUED)
Donation of furniture and equipment to the House of Joy, a home for children.Free eye tests and spectacles for local community.
Community development and infrastructure.
also sets out our commitment to building a workforce that fairly represents the demographics of the country and of the regions in which we operate.
Each of our operations has an employment equity committee that monitors adherence to targets and provides employees with feedback on progress. Quarterly employment equity reports tabled at the employment equity committee meetings detail progress against targets and recommend corrective actions where required. Employment equity plans from each operation have been submitted to the Department of Labour and each operation is on track to meet its targets. In many cases our targets exceed regulated industry transformation benchmarks.
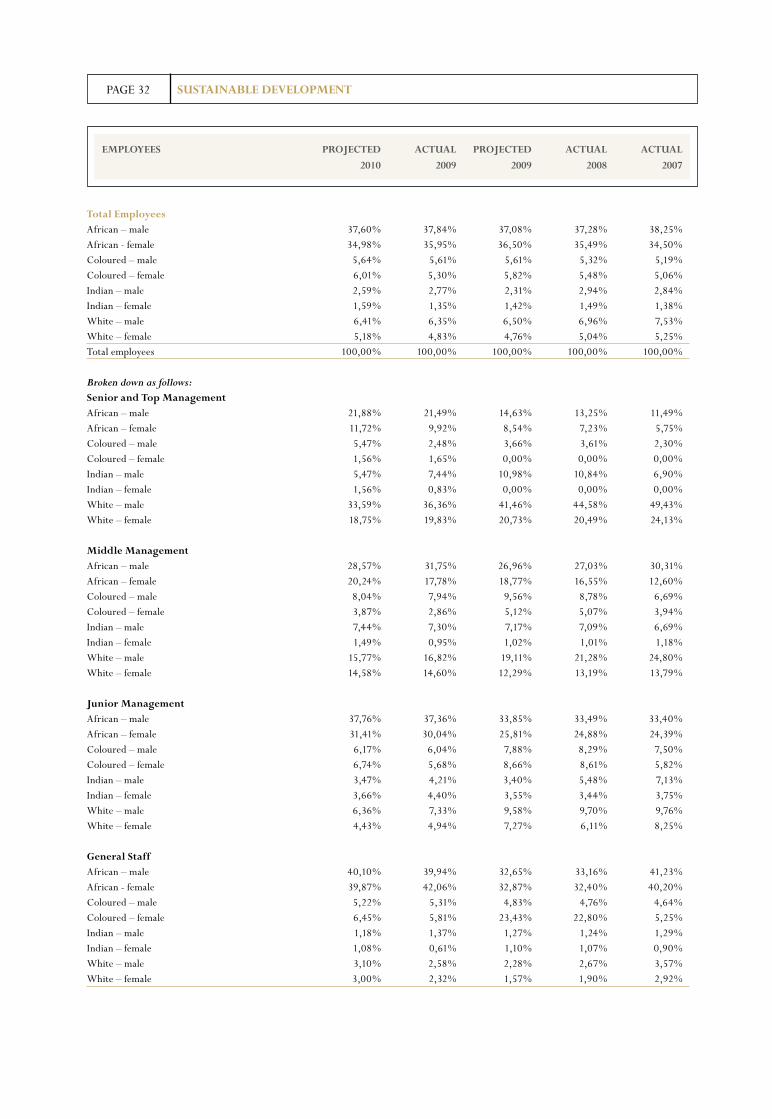
The group is making significant strides towards meeting employment equity targets as shown on the next page:
lABOUR PRACTICESAt Gold Reef, our people are important to us and while we expect our staff to be dedicated to the highest principles of quality, service and integrity, we understand that this can only be achieved through training and development, ensuring equitable practices and building the national pool of skills.
Employment EquityGold Reef is committed to non-discriminatory employment practices that recognise and reward initiative, effort and merit across the board while prioritising the advancement of BEE.
A formal employment equity policy is in place to redress past disadvantages and ensure equitable representation in all occupational categories and levels. Plans are in place to eliminate any previous discriminatory barrier or practice that prevented employees from enjoying the fundamental opportunities, rights, benefits and privileges accorded to any other employee in the group. The policy
PAGE 32 SUSTAINABlE DEVElOPMENT
EMPlOYEES PROJECTED ACTUAl PROJECTED ACTUAl ACTUAl
2010 2009 2009 2008 2007
Total Employees African – male 37,60% 37,84% 37,08% 37,28% 38,25%African - female 34,98% 35,95% 36,50% 35,49% 34,50%Coloured – male 5,64% 5,61% 5,61% 5,32% 5,19%Coloured – female 6,01% 5,30% 5,82% 5,48% 5,06%Indian – male 2,59% 2,77% 2,31% 2,94% 2,84%Indian – female 1,59% 1,35% 1,42% 1,49% 1,38%White – male 6,41% 6,35% 6,50% 6,96% 7,53%White – female 5,18% 4,83% 4,76% 5,04% 5,25%Total employees 100,00% 100,00% 100,00% 100,00% 100,00% Broken down as follows: Senior and Top Management African – male 21,88% 21,49% 14,63% 13,25% 11,49%African – female 11,72% 9,92% 8,54% 7,23% 5,75%Coloured – male 5,47% 2,48% 3,66% 3,61% 2,30%Coloured – female 1,56% 1,65% 0,00% 0,00% 0,00%Indian – male 5,47% 7,44% 10,98% 10,84% 6,90%Indian – female 1,56% 0,83% 0,00% 0,00% 0,00%White – male 33,59% 36,36% 41,46% 44,58% 49,43%White – female 18,75% 19,83% 20,73% 20,49% 24,13% Middle Management African – male 28,57% 31,75% 26,96% 27,03% 30,31%African – female 20,24% 17,78% 18,77% 16,55% 12,60%Coloured – male 8,04% 7,94% 9,56% 8,78% 6,69%Coloured – female 3,87% 2,86% 5,12% 5,07% 3,94%Indian – male 7,44% 7,30% 7,17% 7,09% 6,69%Indian – female 1,49% 0,95% 1,02% 1,01% 1,18%White – male 15,77% 16,82% 19,11% 21,28% 24,80%White – female 14,58% 14,60% 12,29% 13,19% 13,79% Junior Management African – male 37,76% 37,36% 33,85% 33,49% 33,40%African – female 31,41% 30,04% 25,81% 24,88% 24,39%Coloured – male 6,17% 6,04% 7,88% 8,29% 7,50%Coloured – female 6,74% 5,68% 8,66% 8,61% 5,82%Indian – male 3,47% 4,21% 3,40% 5,48% 7,13%Indian – female 3,66% 4,40% 3,55% 3,44% 3,75%White – male 6,36% 7,33% 9,58% 9,70% 9,76%White – female 4,43% 4,94% 7,27% 6,11% 8,25% General Staff African – male 40,10% 39,94% 32,65% 33,16% 41,23%African - female 39,87% 42,06% 32,87% 32,40% 40,20%Coloured – male 5,22% 5,31% 4,83% 4,76% 4,64%Coloured – female 6,45% 5,81% 23,43% 22,80% 5,25%Indian – male 1,18% 1,37% 1,27% 1,24% 1,29%Indian – female 1,08% 0,61% 1,10% 1,07% 0,90%White – male 3,10% 2,58% 2,28% 2,67% 3,57%White – female 3,00% 2,32% 1,57% 1,90% 2,92%

Goldfields Casino, Goldfields Casino,
Welkom, Free StateWelkom, Free StateGoldfields Casino, Goldfields Casino,
PAGE 34 SUSTAINABlE DEVElOPMENT
Wherever possible, the group recruits and promotes internally. Appropriate training is provided to help identify and fast-track suitable BEE candidates.
All external recruitment advertisements state the group’s employment equity policy and that preference is given to South African BEE candidates who meet the relevant requirements. Where applicable, recruitment drives are aimed at specific designated groups in terms of the individual casino’s employment equity policies and as required by the relevant gambling boards.
Training is provided to unskilled employees from designated groups to develop their potential. Employees are kept informed of employment equity developments through departmental and general staff meetings, workplace forums, notice boards, e-mail and monthly educational road shows. Some operations also conduct diversity training programmes as part of their induction to deepen the understanding of employment equity and policies. All operations continuously identify positions that can be filled by employees with disabilities. Good progress is being made in attracting and retaining people with disabilities to our workforce.
SKIllS DEVElOPMENT AND TRAININGOngoing training and development to enhance our skills base and facilitate individual advancement, particularly for BEE employees, is a cornerstone of our business. Accordingly, the company established the Gold Reef Resorts Training Institute during 2009.
Gold Reef Resorts Training InstituteBackgroundThe Skills Development Act No. 97 of 1998 requires that companies contribute 1% of total payroll towards skills development. Equally, the skills development element of B-BBEE expects businesses to invest 3% of their annual leviable amount towards the development of core, critical and scarce skills among black employees. The emphasis in developing core technical skills and competencies among blacks is necessary to ensure that training and skills development initiatives ultimately assist businesses to easily find candidates to fill key strategic leadership and operational positions.
During the Training Institute’s start-up phase, an audit was performed on the group’s internal skills development processes, the results of which brought into light various training gaps thereby reinforcing the need to synchronize training for impact throughout the group’s business units.
Internal training gaps:• Lack of uniformity with regards to training and development
processes; • Lack of clarity with regards to roles and responsibilities;• Processes not adequately documented;• Limited quality assessments/monitoring of training interventions;• Minimal ownership of training process by line managers –
mentoring and coaching unstructured; • Skills audits not conducted; • Training teams’ capacities differ;• Duplication of programmes/training manuals;• End-to-end training process not followed – quality of training
outcomes are compromised;• No assessment of training impact; and
• Lack of set of criteria in identifying suitable external providers.
Consequently, the aim of the Training Institute is not only to coordinate training but to bring about strategic interventions that address transformational imperatives key to our skills development objectives.
The Training Institute’s vision is to become the leading learning institution in the gaming industry and to facilitate capacity and human capital development to drive business performance.
Across the group the percentage of total annual payroll spent on training and development was 2,3%. The group has budgeted to achieve a training spend of 3% of total annual payroll for the 2010 financial year. To maintain service excellence and keep pace with changing industry requirements and practices, professional skills are continually enhanced by compliance courses dealing with money laundering (FICA regulations), table dealing and responsible gambling. In addition to core business skills training such as information technology and management development, group employees also received training in childcare, first aid and fire-fighting, occupational health and security procedures, including dealing with armed robbery and trauma.
At most group operations well over 70% of course participants were BEE candidates. Gold Reef City Casino achieved BEE participation of 92% while Golden Horse Casino and Mykonos Casino achieved 94% and 87% respectively. All operations provide study assistance to employees, particularly those from designated groups.
Succession PlanningGold Reef is committed to constructive succession planning and has various development programmes in place. Potential employees with a record of exceptional performance are selected from the group’s operations. In addition, training courses and career development assessments are used to identify suitable succession candidates. Through a combination of internal training, mentoring and management courses run in conjunction with leading tertiary institutions, leadership skills are enhanced and candidates are equipped with the expertise required at senior management level. Specific emphasis is placed on facilitating the advancement of BEE candidates to management level.
hEAlTh AND SAFETYThe group’s health and safety principles are integrated into its broader business processes. Procedures are in place at all operations to mitigate risks identified during normal risk management processes or internal audits. As a result of training courses and established safety and control measures, only minor safety incidents were reported by all casinos. To prevent similar incidents immediate action was taken and appropriate training conducted where necessary. Given the nature of our business, employees receive training in fire-fighting, first aid and evacuation procedures. At casinos where construction work took place, additional safety measures were implemented.
All casinos have health and safety committees in place and conduct regular health and safety risk assessments. Existing procedures are regularly reviewed and refined where necessary. At the Gold Reef City Theme Park a risk analysis team had been formed to oversee risk factors and implement recommendations and an occupational
PAGE 35SUSTAINABlE DEVElOPMENT
health and safety inspection schedule has been formulated and implemented. Internationally, the safety of visitors to theme parks is crucial. The Gold Reef City Theme Park subscribes to ADIPS, the internationally accredited safety standard. This inspection regime has been incorporated into legislation in the UK and in parts of Europe. Authorised representatives from the UK visited the Theme Park six times during the year to conduct structural and mechanical inspections, among others, on the Theme Park’s rides and equipment. All proposed improvements are scrutinized on subsequent inspections to ensure that adequate measures have been introduced. In addition, all the Theme Park’s rides are regulated by the relevant local government departments, whose reports also affi rm the safety of the rides.
At Gold Reef City Casino hazard identifi cation risk assessments (HIRAs) were conducted, and baseline risk assessments were conducted across all departments, including concessionaires. A Safety, Health and Environmental awareness programme was introduced in 2009, covering the entire casino workforce, to ensure that staff members are aware of their environment and the hazards to which they are exposed. Silverstar Casino runs the OSHAS 18001 health and safety management system to ensure compliance with all relevant legislation, internal policies and procedures and all by-laws. This is a recognised standard against which a company can be certifi ed and assessed as effi ciently meeting its health and safety obligations. On-site clinics, where available, attend to the medical needs of staff and patrons.
hIV/AIDSAt an operational level, response to this pandemic is grounded in formal HIV/Aids policies that protect the rights of infected employees and codify procedures for the management of ill health. All operations have programmes for workplace awareness and employee assistance. Employees are educated on HIV/Aids-related issues such as transmission and prevention and ongoing opportunities
for confi dential voluntary testing and counselling are provided at a number of operations. In addition, wellness programmes to ensure ongoing support and monitoring are provided at a number of operations. Many of these are operated by experienced external consultants. Other initiatives included establishing teams of peer educators to advise and provide support to people infected and affected by the virus.
Antiretrovirals are provided to staff via the group’s medical aid schemes subject to confi dential disclosure requirements.
DIVERSITY AND EQUAl OPPORTUNITYBEEThe group supports the principles of B-BBEE and each operation is empowered at shareholder, employee and procurement levels. The group has attained a Level 3 BEE rating, exceeding the target of achieving Level 4 status by the end of 2010. In addition, all subsidiaries exceeded their 2009 targets, achieving a BEE rating of between Level 4 and Level 2.
As part of the verifi cation process, areas of improvement have been identifi ed and focus will be placed on these areas in order to ensure that the group continues to comply with CASA guidelines on B-BBEE. These areas include, improving the representation of previously disadvantaged individuals in management with more emphasis placed on black women, creating employment for the disabled, focused allocation of training spend in order to improve skills development and increasing procurement from empowered small businesses. The establishment of the Gold Reef Resorts Training Institute will contribute immensely to most of these areas.
The group will continue its commitment to empowerment and will endeavour to achieve the 2015 B-BBEE Level 2 target as set by the gambling boards and agreed to by CASA. While this does present certain challenges, the group is well-placed to accomplish this goal.
An overview of Gold Reef’s progress in complying with the DTI Codes is outlined on the next page:
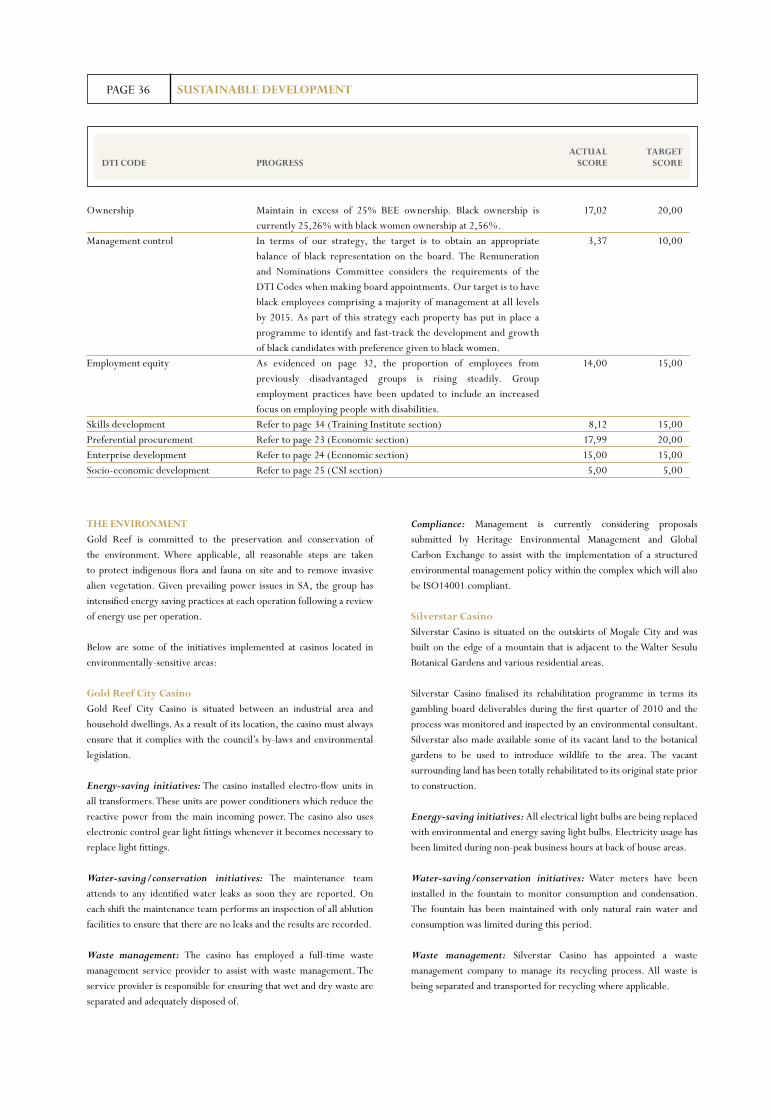
PAGE 36 SUSTAINABlE DEVElOPMENT
Compliance: Management is currently considering proposals submitted by Heritage Environmental Management and Global Carbon Exchange to assist with the implementation of a structured environmental management policy within the complex which will also be ISO14001 compliant.
Silverstar CasinoSilverstar Casino is situated on the outskirts of Mogale City and was built on the edge of a mountain that is adjacent to the Walter Sesulu Botanical Gardens and various residential areas.
Silverstar Casino finalised its rehabilitation programme in terms its gambling board deliverables during the first quarter of 2010 and the process was monitored and inspected by an environmental consultant. Silverstar also made available some of its vacant land to the botanical gardens to be used to introduce wildlife to the area. The vacant surrounding land has been totally rehabilitated to its original state prior to construction.
Energy-saving initiatives: All electrical light bulbs are being replaced with environmental and energy saving light bulbs. Electricity usage has been limited during non-peak business hours at back of house areas.
Water-saving/conservation initiatives: Water meters have been installed in the fountain to monitor consumption and condensation. The fountain has been maintained with only natural rain water and consumption was limited during this period.
Waste management: Silverstar Casino has appointed a waste management company to manage its recycling process. All waste is being separated and transported for recycling where applicable.
ThE ENVIRONMENTGold Reef is committed to the preservation and conservation of the environment. Where applicable, all reasonable steps are taken to protect indigenous flora and fauna on site and to remove invasive alien vegetation. Given prevailing power issues in SA, the group has intensified energy saving practices at each operation following a review of energy use per operation.
Below are some of the initiatives implemented at casinos located in environmentally-sensitive areas:
Gold Reef City CasinoGold Reef City Casino is situated between an industrial area and household dwellings. As a result of its location, the casino must always ensure that it complies with the council’s by-laws and environmental legislation.
Energy-saving initiatives: The casino installed electro-flow units in all transformers. These units are power conditioners which reduce the reactive power from the main incoming power. The casino also uses electronic control gear light fittings whenever it becomes necessary to replace light fittings.
Water-saving/conservation initiatives: The maintenance team attends to any identified water leaks as soon they are reported. On each shift the maintenance team performs an inspection of all ablution facilities to ensure that there are no leaks and the results are recorded.
Waste management: The casino has employed a full-time waste management service provider to assist with waste management. The service provider is responsible for ensuring that wet and dry waste are separated and adequately disposed of.
Ownership 17,02 20,00
Management control 3,37 10,00
Employment equity 14,00 15,00
Skills development 8,12 15,00Preferential procurement 17,99 20,00Enterprise development 15,00 15,00Socio-economic development 5,00 5,00
ACTUAl TARGET DTI CODE PROGRESS SCORE SCORE
Maintain in excess of 25% BEE ownership. Black ownership is currently 25,26% with black women ownership at 2,56%.In terms of our strategy, the target is to obtain an appropriate balance of black representation on the board. The Remuneration and Nominations Committee considers the requirements of the DTI Codes when making board appointments. Our target is to have black employees comprising a majority of management at all levels by 2015. As part of this strategy each property has put in place a programme to identify and fast-track the development and growth of black candidates with preference given to black women.As evidenced on page 32, the proportion of employees from previously disadvantaged groups is rising steadily. Group employment practices have been updated to include an increased focus on employing people with disabilities. Refer to page 34 (Training Institute section)Refer to page 23 (Economic section)Refer to page 24 (Economic section)Refer to page 25 (CSI section)
PAGE 37
Compliance: The casino is continually looking for new energy-saving and water-saving techniques and will implement these where necessary to ensure compliance with environmental practices. From a regulatory perspective, the casino is bound by the terms imposed on it by the Department of Environmental Affairs through the Record of Decision.
Goldfi elds Casino:Energy-saving initiatives: The casino has made it a priority to attempt to save energy in all forms and to avoid wastage. Monthly expenses are monitored and the casino installed electro-fl ow units in December 2009.
Golden horse CasinoThe casino is situated outside the Pietermaritzburg CBD. Within the surrounding area is a school, parks and open fi elds. Within the casino precinct is a bird sanctuary and a pond.
Energy-saving initiatives: The casino has made it a priority to attempt to save energy in all forms and to avoid wastage. The monthly expenses are monitored and security management do after-hour checks to ensure no wastage occurs. The casino also installed electro-fl ow units in April 2010.
Water-saving/conservation initiatives: The casino has installed state-of-the-art water systems to avoid wastage. The water saving campaign has made staff members aware of the problem of wastage.
Waste management: The casino has implemented a waste management system co-ordinated by an external service provider. The system involves recycling and controlling all refuse matter in order to reduce the impact the casino has. The service provider also removes and destroys/neutralises all potential pollutants (e.g. tube lights) in an environmentally safe manner.
Transport: The casino is working towards an environmentally friendly transport system. The casino collects patrons from the airport using a refi ned cart. The use of this cart reduces transport costs and reduces the casino’s carbon footprint immensely.
Garden Route CasinoGarden Route Casino is situated in an area that is governed by a Record of Decision issued by the Department of Environmental Affairs which stipulates the boundaries of environmentally-safe operation for businesses in the area. The casino has an internal Environmental Management Plan in place which is monitored by the Environmental Liaison Committee for the property and its surrounds.
The Environmental Liaison Committee was formed on the casino’s inception. It inspects the environmental impact of the casino and the adjacent golf estate and provides proactive measures and advice on how to effectively manage the sensitive environment upon which the casino and the adjacent golf estate reside.
Energy-saving initiatives: The casino is in the process of acquiring energy-saving equipment that will reduce the consumption of energy on the entire premises. This will not only save costs but will also reduce the maximum demand that we require from the national grid. Energy saving globes have been installed where possible. All air conditioners are run on timers and are switched off during non-active periods.
Water-saving/conservation initiatives: The entire casino garden consists of indigenous plants and fynbos that require a lot less water to survive. The entire sprinkler system is currently switched off due to a severe drought and water restrictions. Spot checks are performed to ensure alien plant species are removed. Grids were installed on storm water inlets to ensure no pollution takes place.
Waste management: All paper, cardboard boxes and plastic are separated and collected by a local recycling company on a weekly basis. The casino is in the process of setting up a system to effectively manage the restaurant waste.
SUSTAINABlE DEVElOPMENT
PAGE 40 CORPORATE GOVERNANCE REPORT
of the group are appropriately supervised and controlled. Executive directors assist the CEO and are responsible for implementing strategy and operational decisions in respect of the company’s day-to-day operations. The non-executive directors are high merit individuals who contribute a wide range of skills, knowledge and experience to the board’s decision-making process and are not involved in the daily operations of the group.
M Krok resigned on 2 July 2009 as chairman and director of Gold Reef. On 25 August 2009 P Vallet was appointed as a non-executive director to the Gold Reef board. Two non-executive directors, AJ Aaron and J Leutgeb and two alternates, A Krok and R Vierziger, resigned during 2009.
The board meets at least quarterly with additional meetings convened when necessary. Directors are comprehensively briefed in advance of board meetings and are provided with all necessary information to enable them to discharge their responsibilities. A table of directors’ attendance at board meetings is set out in the Directors’ Report.
In terms of the Articles of Association, directors are subject to retirement by rotation and re-election at least once every three years. Details of directors retiring and offering themselves for re-election at the upcoming annual general meeting are set out in the Directors’ Report.
Directors’ remuneration is disclosed in detail in the Remuneration Report and in Note 31 to the group annual fi nancial statements. All directors have unrestricted access to the advice and services of the Company Secretary and to company records, information, documents and property. Non-executive directors also have unfettered access to management at any time. All directors are entitled, at Gold Reef’s expense, to seek independent professional advice on any matters pertaining to the group where they deem this to be necessary.
BOARD PROCESSESNew appointmentsNew board appointments are considered by the board as a whole, taking into account a blend of skills and experience as well as concerns such as diversity. In terms of Gold Reef’s Articles of Association new directors hold offi ce until the next annual general meeting at which their appointment must be confi rmed/ratifi ed by shareholders. An informal induction programme is in place which includes introductions to key senior management and site visits. New appointees receive copies of the latest interim announcements and annual fi nancial statements and are introduced to the company’s policies and procedures. The Company Secretary is responsible for implementing this induction programme which also sets out the new directors’ responsibilities and fi duciary duties, as well as ongoing guidance on the relevant statutory and regulatory framework.
Ongoing corporate governance educationThe Company Secretary is responsible for informing directors on an ongoing basis of major regulatory and legislative developments in order to keep the board abreast of current requirements. The company involves its sponsor and other relevant experts where necessary to ensure that the level of information is adequate to enable the board to fulfi ll its duties.
The directors remain committed to best-practice corporate governance and the principles contained in the Code of Corporate Practices and Conduct set out in the King II Report. The board continually monitors compliance to ensure ongoing improvement of operational and corporate practices and that the affairs of the group are conducted with transparency and integrity.
Accordingly, the company has appointed consultants with expertise in the corporate governance fi eld to assist the board in implementing frameworks, processes and procedures to adequately address the requirements of the King III Report, which is effective to companies with fi nancial years beginning on or after 1 March 2010. The board is also in the process of assessing its obligations in terms of compliance with the new Companies Act No. 71 of 2008 (“the New Act”). The New Act has been promulgated but has not yet come into effect. It will come into operation on a date to be proclaimed in the Government Gazette.
Where appropriate, this report addresses areas where the group is already compliant with the King III Report. In light of the proposed transaction with Tsogo, the new board of the Merged Entity may formulate its own strategies, policies and procedures with respect to the implementation of the King III Report as well as the New Act.
ThE BOARD ChARTERThe unitary board is regulated by a formal board charter, which sets out the role of the board and the responsibilities of the directors. In line with this charter, the board is responsible for strategic development which addresses the group’s purpose, values and stakeholders and accordingly, has ensured that the procedures are in place to monitor and evaluate the implementation of its strategies, policies, senior management performance criteria and business plans.
The board maintains full and effective control over Gold Reef and is accountable and responsible for Gold Reef’s performance. The board charter codifi es the board’s composition, appointment, authorities, responsibilities and processes and sets out the fi duciary duties of the directors to the company. The board charter addresses matters relating to board composition, leadership, remuneration and evaluation, review of group processes and procedures, key operational risks and corporate governance compliance. It provides the board with a mandate to exercise leadership, determine the group’s vision and strategy and monitor operational performance.
ThE BOARDIn line with the King III Report, the board now comprises four executive and seven non-executive directors, with the majority being independent non-executive directors. Accordingly, fi ve of the seven non-executive directors on the board hold independent non-executive directorships. There is one alternate non-executive director. In line with best practice, the board appointed Dr. EN Banda as independent Chairman on 2 July 2009. The names and brief curriculum vitae of the directors are set out on pages 7 to 8 of the annual report.
The roles of the independent Chairman and CEO are strictly separated. The Chairman provides leadership to the board and oversees its effi cient operation while the CEO is responsible for proposing, updating, implementing and maintaining the strategic direction of Gold Reef as well as ensuring that the day-to-day affairs
PAGE 41
Conflict of interestsDirectors are required to disclose at each board meeting their shareholding, additional directorships and any potential conflicts of interest to the Chairman and the Company Secretary who, together with the sponsor, ensure that any share dealings and other required information is published on SENS.
Directors’ and officers’ liability insuranceDirectors’ and officers’ liability insurance cover is in place.
Share dealingA group-wide share trading policy is in place whereby all directors and employees who have access to financial results and other price sensitive information are prohibited from dealing in Gold Reef shares during ‘closed periods’ as defined or while the company is operating under cautionary. These employees are expressly informed when the group is entering a ‘closed period’ and that dealing in Gold Reef shares during that period is prohibited. Further, directors are obliged to obtain clearance from the Chairman, or failing him, the Chairman of the Audit and Risk Committee, prior to dealing in the shares of the company and to report any share dealings (including transactions in terms of the Gold Reef Share Scheme) to the Company Secretary who, together with the sponsor, ensures that the information is published on SENS.
Annual evaluationThe board conducts ongoing self-evaluation exercises based on a predetermined checklist.
Annual general meetingAttendance by all directors at the annual general meeting is encouraged. At the July 2009 Gold Reef annual general meeting the Chairman of the Audit and Risk Committee and Chairperson of the Remuneration and Nominations Committee were in attendance, as were the CEO and FD. In addition, one other executive and two other non-executive directors were in attendance at the annual general meeting. The notice for any general meeting of shareholders includes an explanation of the reason for, and the effect of, any proposed special resolution. The company’s transfer secretaries attend each meeting to assist with the recording of shareholders’ attendance and to count the votes. The Chairman confirms with the meeting whether the votes will be counted by way of a show of hands or a poll. The Chairman takes time during the meeting, ensuring that the resolutions have been read and allowing time for questions.
Board CommitteesAll committees have satisfied their responsibilities during the year in compliance with their Charters. The chairpersons of the committees or another committee member nominated by them, attend the company’s annual general meeting.
Audit and Risk CommitteeThe Audit and Risk Committee is chaired by independent non-executive director, JC Farrant and comprises one other independent non-executive director. On 25 November 2009, P Vallet was appointed as an alternate to both members of the Audit and Risk Committee. The committee met three times during the year, which the directors believe is sufficient for the purposes of discharging the committee’s responsibilities. Additional special meetings are
convened as and when required. The CEO, FD, Group Internal Audit Manager and external auditors are invited to attend every meeting and management members attend as required.
As set out in its formal Charter the Audit and Risk Committee is responsible for assisting the board in fulfilling its fiduciary oversight responsibilities for the following:• financial reporting process;• system of risk management;• system of internal controls;• internal audit process;• the annual independent audit of the company’s and group’s
financial statements;• engagement of other external audit firms (e.g. for fair and
reasonable opinions);• the group’s compliance with: – laws and regulations; – its articles of association; – its code of conduct (ethics); – corporate governance; – BEE requirements set by gambling boards and the Department
of Trade and Industry; – its fraud policy; and – Audit Committee and Audit Forum management and reporting
responsibilities.
Additional responsibilities include recommending the appointment of the head of internal audit, recommending the appointment of the external auditors, establishing principles for utilisation of external auditors for non-audit services, assessing the performance and credentials of the FD as well as reviewing the group’s compliance with the Companies Act, the Income Tax Act, the King II and King III Reports, the JSE Listings Requirements and all other relevant statutes.
Subject to overall board responsibility, the committee is further responsible for risk management. It continually assesses the major business and operational risks faced by the group and recommends and monitors appropriate risk management strategies. Key risks are continually monitored and assessed at least annually. The risks are assessed against mitigating factors to produce residual risks. The committee satisfies itself that the residual risk is within its risk tolerance. If the risk tolerance is breached additional steps will be taken to reduce it to within the risk tolerance. The risk, mitigating factor, residual risk and the rationale used in the above is adequately documented. In an attempt to combat fraud a crime hot line has been established and offers the callers anonymity and confidentiality.
Separate audit forums are in place at Akani Egoli, Silverstar Casino, Akani Msunduzi, West Coast Leisure, Garden Route Casino, Goldfields Casino and Queens Casino. These forums comply with the standards and practices set by Gold Reef’s Audit and Risk Committee. The Internal Audit Manager and the external auditors of each of these companies report their findings to the respective audit forums and Gold Reef’s Audit and Risk Committee. The external auditors report to the Audit and Risk Committee to confirm that they have remained independent from Gold Reef and its subsidiaries for the year. The Audit and Risk Committee is satisfied that the auditors have remained independent throughout the year. The committee
CORPORATE GOVERNANCE REPORT

PAGE 42
financial statements and the effective operation of internal controls, remains the responsibility of the directors and management.
The Audit and Risk Committee is responsible for recommending the appointment of the external auditor and overseeing the external audit process. In line with its Charter, the Audit and Risk Commitee has:
• evaluated the independence and effectiveness of the external auditors,
• considered and approved the audit fee payable to the external auditors in respect of the audit for the year ended 31 December 2009 ahead of the annual audit as well as their terms of engagement, taking into consideration factors such as the timing of the audit, the extent of work required and the scope of the audit;
• ensured and satisfied itself that the appointments of the external auditors, the designated auditor and IFRS advisor are in compliance with the Companies Act, The Auditing Profession Act, 2005 and the Listings Requirements of the JSE Limited;
• considered and pre-approved all audit and non-audit services provided by the external auditors exceeding R250 000 for any single engagement, ensuring that the independence of the external auditors is not compromised;
• reviewed and assessed the company’s risk identification, measurement, and control systems and their implementation; and
• reviewed and approved the group accounting policies (refer to page 68).
Internal auditThe group’s internal audit function is housed in Akani Egoli and seconded to Gold Reef, Silverstar Casino, Akani Msunduzi, West Coast Leisure, Garden Route Casino, Goldfields Casino, Queens Casino and Gold Reef City Theme Park on a cost recovery basis. The Group Internal Audit Manager co-ordinates this process and attends all of the meetings. He also reports at Gold Reef Audit and Risk Committee meetings and has direct access to the Chairman of the Audit and Risk Committee. Unrestricted consultation is encouraged between the internal audit function and directors, management and Gold Reef’s external auditors.
The internal audit function evaluates and examines the operations’ activities and resultant business risks. The internal audit plan is based on risk assessments and compliance requirements. The scope of the function includes compliance auditing of specific areas stipulated by the relevant gambling boards as well as assessing the adequacy of internal controls, fraud prevention, risk management and the safeguarding of assets.
The internal audit function is operated in accordance with the terms of reference set out in an Internal Audit Charter. The function is as envisaged in the Standards for the Professional Practice of Internal Auditing, which is fully endorsed by the applicable codes on corporate governance.
Internal Controls and Risk ManagementThe board is responsible for the group’s systems of internal control and risk management. These systems of internal control are designed to provide reasonable but not absolute assurance as to the integrity and reliability of the financial statements and to safeguard and maintain accountability of the group’s assets. These systems provide reasonable
conducts self-evaluation exercises as set out in its Charter. Findings and recommendations are then reported to the board. The exercise did not identify any areas of concern for the year.
COMPANY SECRETARY The role of Company Secretary is seen as pivotal in good corporate governance. The Company Secretary is tasked with providing guidance to directors with regard to discharging their duties. She maintains an open door policy and is a central source of guidance and advice on ethics and good governance.
JS Friedman resigned as company secretary and was replaced by L Fick with effect from 25 November 2009.
Code of EthicsThe group has developed and implemented a Code of Ethics and Conduct which has been communicated to all units throughout the group and, to ensure that the group’s reputation for integrity remains untarnished, a zero tolerance policy has been adopted confirming the board’s commitment to the code. Please refer to page 45 for full details of the code.
ManagementOperational management is appointed by the board based on the appropriate skills and experience necessary to perform the relevant functions. Processes have been formalised to promote interactive dialogue and decision-making between management and executive directors. This also facilitates the disclosure to the directors of any conflict or potential conflict of interest on the part of management. For example, formalised delegation of authority documents are distributed to each unit which clarify the levels of authority given as well as management’s obligations in the following areas:• contracts binding on the company;• disposal of assets;• banking;• appointment and dismissal of senior staff;• organisational structure;• collective bargaining arrangements;• marketing initiatives;• budgets and reports;• appointments of lawyers, auditors and consultants;• legal proceedings;• donations;• conflicts of interest;• travel and accommodation;• policies, procedures and manuals;• operating expenditure;• capital expenditure;• dealing with the press;• health and safety; and• compliance with the law.
The performance of senior managers is independently reviewed by the company’s executive directors.
ACCOUNTING AND AUDITINGExternal auditGold Reef’s external auditors are responsible for providing an independent audit opinion on whether the financial statements are fairly presented in compliance with IFRS. The preparation of the
CORPORATE GOVERNANCE REPORT

Mykonos CasinoLangebaan, Western Cape
PAGE 44 CORPORATE GOVERNANCE REPORT
is therefore designed to manage rather than eliminate risk of failure and opportunity risk.
The internal audit department holds regular risk workshops with the general managers and other relevant senior managers at all of the properties. At these workshops, the results of the previous workshop are reviewed and any new risks are raised and their effect debated. Based on the outcome of these workshops, each property’s risk register is updated and the reports submitted to the Audit and Risk Committee for review. The Audit and Risk Committee reports to the board, which is responsible for assessing the risks that are continually identifi ed through the risk management process. Together with the Audit and Risk Committee, the board monitors the implementation of the appropriate risk management strategies throughout the group. Key risks facing the group include:
but not absolute assurance regarding the safeguarding of assets against unauthorised disposal or use, compliance with statutory laws and regulations and the maintenance of proper accounting records as well as the adequacy and reliability of fi nancial information. The directors have satisfi ed themselves that adequate systems of internal control are in place to mitigate signifi cant risks identifi ed to an acceptable level. Nothing has come to their attention to indicate that a material breakdown in the functioning of these systems within the group has occurred during the year.
The group’s systems of internal control are further designed to detect and minimise signifi cant fraud, potential liability, loss and material misstatement. There are inherent limitations to the effectiveness of any system of internal control, including the possibility of human error and the circumvention or overriding of controls. The system
DISClOSURE STATEMENTThe annual report deals adequately with disclosures pertaining to the annual fi nancial statements, auditors’ responsibility, accounting records, internal controls, risk management, accounting policies, adherence to accounting standards, going concern issues and adherence to codes of governance.
Competition for disposable income
Exchange rate fl uctuationsIncrease in gaming taxes
Legislative and regulatory changes
Penetration of new markets/local gaming market saturation
HIV/AIDS pandemicOrganised crime targeting casinos countrywide
Health and safety
Municipal services
Injury to patrons
Strategic and aggressive marketing campaigns are initiated by group casinos to protect and grow market share.Casino management reviews cost control to manage margin erosion.The activities of direct competitors are monitored.Forward exchange contracts.CASA membership provides Gold Reef with a platform to lobby government on tax changes.CASA membership provides Gold Reef with a platform to lobby government on any impending changes.Part of the rationale behind the proposed transaction between Gold Reef and Tsogo is to enable our shareholders to benefi t from the earnings, geographical and market segment diversifi cation.See HIV/AIDS on page 35.Gold Reef partners with local police in all regions to ensure the protection of casino premises. The group has enhanced security and risk management measures at all casinos.Regular reviews of operations are conducted for compliance with health and safety regulations (see page 34).Gold Reef has suffi cient backup and generator capacity available at all properties.Emergency plans for supply of water.A disaster recovery plan is in place at all properties.Staff members are trained in fi re fi ghting, fi rst aid and evacuation procedures.On-site clinics attend to the medical needs of staff and patrons.Gold Reef City Theme Park has daily inspections of all its rides and subscribes to ADIPS internationally accredited safety standard.The group has public liability insurance in place.
RISK RISK MITIGATIONS
PAGE 45
Gold Reef believes that for a company to run effi ciently and responsibly it is important to have sound governance at all levels of its operations and to have appropriate oversight at executive level. To this end, Gold Reef has designed this code to guide its conduct and that of all its directors, managers and employees. The group is committed to a policy of fair dealing and integrity in the conduct of its business. This commitment, which is actively endorsed by the board of directors, is based on a fundamental belief that business should be conducted using the principles described below. The group expects all executives and employees to share its commitment to high moral, ethical and legal standards.
PRINCIPlES OF EThICAl CONDUCTCorporate governance and transparencyThe group is committed to the highest standards of corporate governance as enshrined in the King II report and, once it becomes effective, the King III Report. In addition, the group believes that being transparent is imperative to the sustainability of its operations. Accordingly, the group commits itself to timely and accurate communication of information about its business to its active stakeholders on a regular basis. All fi nancial and other information will be presented in a manner that at least meets the minimum requirements of the laws of the country in which the group operates.
Compliance with the law We respect and comply with the laws of the country in which we operate. This includes corporate laws, common law as well as specifi c laws, including regulations of all the gambling boards. We will strive to be a good corporate citizen of the country in which we do business.
Competition and marketing We will respect the rights of competitors, patrons and suppliers. The only competitive advantages we seek are those gained through superior and innovative products, services and marketing. In our advertising and other public communications we will avoid not only untruths, but also excessive exaggeration and overstatement that may mislead members of the public.
Our advertising and public statements will comply with the minimum standards set by the advertising authorities and the gambling boards of all the provinces.
Confl ict of interestWe expect all directors, managers and employees to avoid any conduct which might lead to a confl ict with their responsibilities to the company. It is also expected of every director, manager and employee to be infl uenced in all the decisions they make, by the interests of the company and not personal gain.
All directors, managers and employees may not use their positions within the company for personal gain.
It is expected of every director to regularly declare their business interests and directorships to the board.
Payments to government personnelWe do not make illegal payments or give gifts of substantial value to government offi cials of any country with a view to infl uencing them to make decisions or judgements that are favourable to our company.
Kickbacks and gratuitiesWe do not offer or accept kickbacks or bribes. We do not accept or offer gifts of substantial value unless this is declared in terms of the company’s policies. Political contributions and activitiesThe group does not, directly or indirectly, participate in political activities nor does the group provide substantial support to any political parties or individuals. However, recognising the history of our country and the need to foster the principles of democracy both in our country and the African continent, the group may make political donations to identifi ed political parties. Any decision to donate substantial cash to a political party shall require the board’s approval.
Employment practicesThe group’s policy is not only to comply with the employment laws of our country but to uphold international best practices in people management. We believe that the sustainable growth of our company depends as much on our people as it does on our operational expertise. To this end our employment policies are designed to empower employees, develop them and create an environment in which each employee can perform and grow to his or her fullest potential regardless of race, gender or disability. We also strive to attract and retain the highest calibre staff while at the same time redressing historic imbalances, where they exist.
Responsibilities to local communitiesThe group is committed to the upliftment and development of local communities. To this end the group sets aside a portion of its profi ts for initiatives aimed at improving and developing the communities within which it operates. In certain circumstances, community trusts have been established for this purpose.
CODE OF EThICS AND CONDUCT
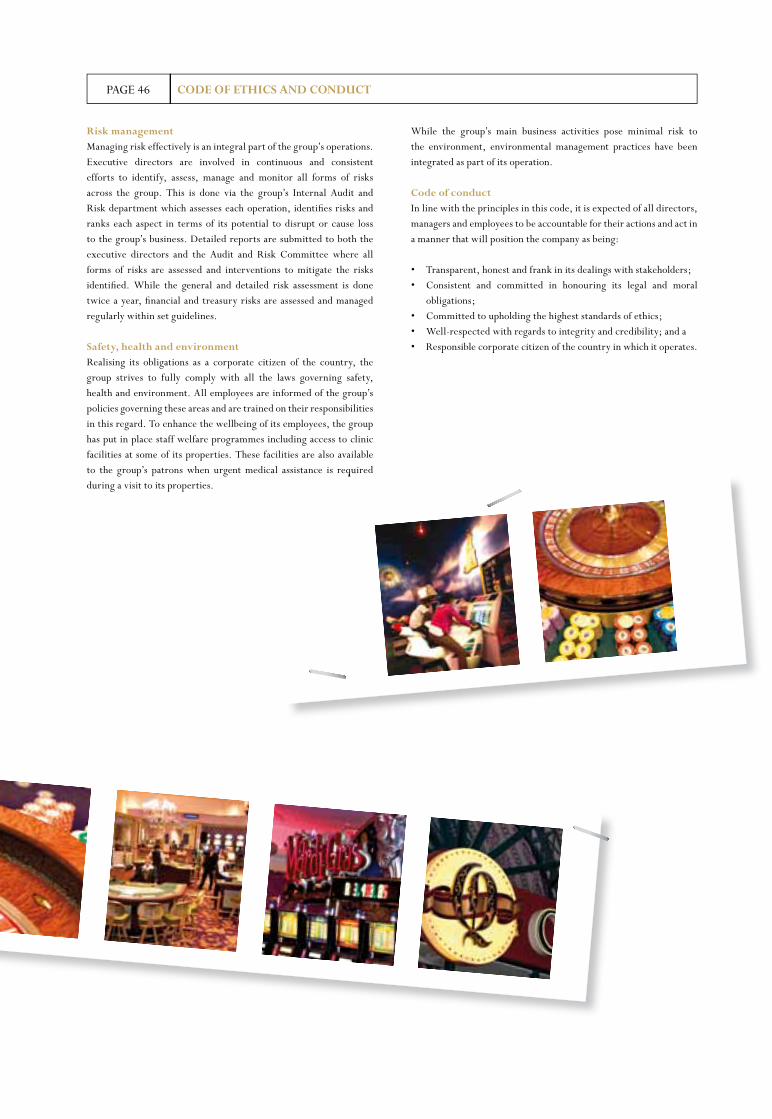
PAGE 46
Risk managementManaging risk effectively is an integral part of the group’s operations. Executive directors are involved in continuous and consistent efforts to identify, assess, manage and monitor all forms of risks across the group. This is done via the group’s Internal Audit and Risk department which assesses each operation, identifi es risks and ranks each aspect in terms of its potential to disrupt or cause loss to the group’s business. Detailed reports are submitted to both the executive directors and the Audit and Risk Committee where all forms of risks are assessed and interventions to mitigate the risks identifi ed. While the general and detailed risk assessment is done twice a year, fi nancial and treasury risks are assessed and managed regularly within set guidelines.
Safety, health and environmentRealising its obligations as a corporate citizen of the country, the group strives to fully comply with all the laws governing safety, health and environment. All employees are informed of the group’s policies governing these areas and are trained on their responsibilities in this regard. To enhance the wellbeing of its employees, the group has put in place staff welfare programmes including access to clinic facilities at some of its properties. These facilities are also available to the group’s patrons when urgent medical assistance is required during a visit to its properties.
While the group’s main business activities pose minimal risk to the environment, environmental management practices have been integrated as part of its operation.
Code of conductIn line with the principles in this code, it is expected of all directors, managers and employees to be accountable for their actions and act in a manner that will position the company as being:
• Transparent, honest and frank in its dealings with stakeholders;• Consistent and committed in honouring its legal and moral
obligations;• Committed to upholding the highest standards of ethics;• Well-respected with regards to integrity and credibility; and a• Responsible corporate citizen of the country in which it operates.
CODE OF EThICS AND CONDUCT
to the group’s patrons when urgent medical assistance is required
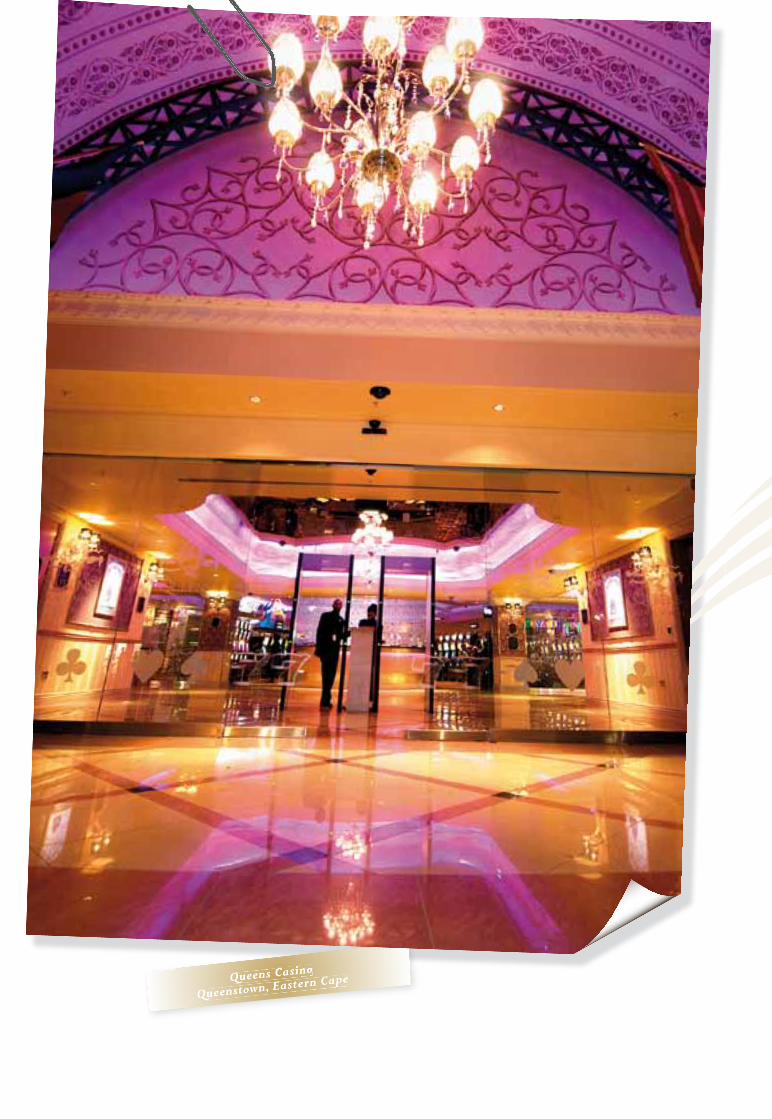
Queens CasinoQueens Casino
Queenstown, Eastern CapeQueenstown, Eastern CapeQueens Casino
Queens Casino
PAGE 50 REMUNERATION REPORT
Gold Reef’s reward philosophy is that remuneration, in the combination of all its forms, is an investment in human capital and is to be structured and geared towards attracting, motivating and retaining key talent in order to drive shareholder value.
ROlE OF ThE REMUNERATION AND NOMINATIONS COMMITTEEThe Remuneration and Nominations Committee is a sub-committee of the board and, in terms of its charter, is responsible for determining the terms of employment and remuneration of the company’s executive directors and senior management, including an assessment of specifi c reward proposals and an evaluation of performance.
Its purpose is to set remuneration packages for executive directors and to determine overall policy for the remuneration of the company’s employees including, but not limited to, basic salary, performance-based short-term and long-term incentives, pensions and other benefi ts and the design and operation of the company’s share-based incentive schemes.
MEMBERShIP OF ThE REMUNERATION AND NOMINATIONS COMMITTEEThe committee comprises three non-executive directors, all of whom, including the Chairperson, are independent. The membership is detailed below:• ZJ Matlala (Chairperson); • JC Farrant; and • Dr. EN Banda (appointed 26 August 2009).
The composition of the committee complies with the King III Report and the board considers the composition of the committee to be appropriate in terms of the necessary blend of knowledge, skill and experience of its members.
The committee met three times during 2009. The CEO and HR Director (where applicable) both attended the meetings by invitation and assisted the committee in its deliberations, except when issues relating to their own compensation were discussed.
No director was involved in deciding his or her own remuneration. In 2009 the committee was advised by the group’s fi nance and human resources functions as well as by independent consultants who provided market benchmark information.
REMUNERATION POlICY AND EXECUTIVE REMUNERATIONRemuneration PolicyGold Reef’s remuneration policy aims to attract and retain high-calibre executives and employees and to motivate and reward them for developing and implementing the company’s strategy in support of consistent and sustainable shareholder value.
The policy has been aligned with best practice standards based on the following principles:• Total rewards are set at levels that are competitive within the
gaming, entertainment and accommodation sectors;• Guaranteed packages are set generally at the median of the market
with key, high performing individuals in key roles positioned at the upper quartile;
• Incentive-based rewards in general are earned through the
achievement of demanding performance conditions consistent with shareholder interests over the short, medium and long term;
• Annual cash incentives, performance measures and targets are structured to reward effective operational performance; and
• Long-term (share-based) incentives are designed to address sustained company performance over time in the interests of shareholders and the retention of key individuals and talent.
Elements of executive remuneration• Base salaries• Benefi ts• Annual cash incentives• Long-term share-based incentives• Gold Reef Share Scheme• Executive share appreciation scheme (once-off)
The committee seeks to ensure an appropriate balance between the fi xed and performance-related elements of executive remuneration and between those aspects of the package linked to short-term fi nancial performance and those linked to longer-term shareholder value creation.
The committee considers each element of remuneration relative to the market and takes into account the performance of the company and the individual executive in determining both quantum and design.
The policy relating to each component of remuneration is summarised below:
Base salariesBase salaries of executives are subject to annual review. Gold Reef’s policy is to be competitive at the median level with reference to market practice in companies comparable in terms of size, market sector, business complexity and international scope. However, base salaries of key individuals and incumbents in key roles are aligned to the upper quartile level of the market. Company performance, individual performance and changes in responsibilities are also taken into consideration when determining increases to base salaries.
Benefi tsBenefi ts for executives include membership of a retirement fund and medical aid, to which contributions are made by the company on a salary sacrifi ce basis. Annual cash incentivesAll executives are eligible to participate in the Gold Reef bonus plan in which performance against targets set in terms of comparative and absolute metrics is rewarded.
Target bonus percentages are set in terms of Gold Reef’s overall reward strategy but the bonus payable at year-end depends on actual company, subsidiary as well as the individual’s performance against the following parameters:
Executive directors:Bonuses are linked to HEPS growth in relation to CPIX.
PAGE 51REMUNERATION REPORT
Performance unitsAnnual conditional awards of performance units will be made to executives and selected managers. The performance units will vest after a three-year period subject to the company’s achievement against selected performance measures over the intervening period. Settlement will be in cash, the value of which will be the product of the number of performance units vesting and the value of a Gold Reef share at the time of vesting.
• The board will set and communicate the performance criteria at the time of each award. Currently, the vesting of the performance units is defined in terms of the company’s CAGR in HEPS over the three year period from the award date to the vesting date. HEPS growth has been chosen as the preferred metric, rather than any share-oriented metric, as it is considered that sustained earnings growth will continue to be the major value driver in the foreseeable future as the industry matures and the economy.
No retesting against the performance criteria will be allowed. Any performance units which do not vest at the end of the three year period will lapse.
Awards of performance units closely align the interests of shareholders and participants by rewarding superior shareholder and financial performance in the future.
Bonus UnitsAnnually, executives will receive a grant of bonus units that match, according to a specified ratio, a portion of the annual cash incentive accruing to the participant. These bonus units will be settled to participants after three years, conditional on continued employment. Settlement will be in cash, the value of which will be the product of the number of bonus units originally granted and the value of a Gold Reef share at the time of vesting.
Grants of bonus units provide for share-based retention to those executives who, through their performance on an annual basis, have demonstrated their value to the company.
Senior management:Bonuses are linked to the performance of the individual as well as to the performance of the entity. In terms of individual performance pre-determined, measurable performance criteria are established linked to KPI’s. Entity-specific performance considerations include meeting and exceeding the entity’s budgets for the year, limited to the level which management can directly control. Thresholds and targets are set that challenge company and individual performance. The committee reviews measures annually to ensure that these, and the targets set, are appropriate given the economic context and the performance expectations for the company.
Long-term share-based incentivesThe LTIP is a phantom share scheme with cash settlement and aligns Gold Reef with best international practice in this field and provides for the inclusion of a number of performance conditions, designed to align the interests of participants with those of the company’s shareholders and to reward for company performance more so than the performance of the economy or sector in which it operates.
The essential elements of the new scheme are summarised in the paragraphs below. Note that the use of the word unit throughout recognises that the plan is essentially a “phantom” version of a share scheme. Each unit (whether an appreciation unit, performance unit or a bonus unit) is in effect linked to an underlying share in Gold Reef.
The combined, weighted implementation of the three elements described below allow Gold Reef to remain competitive in annual and share-based incentives, rewarding long-term sustainable company performance, acting as a retention tool, and ensuring that executives and key talent share a significant level of personal risk/reward with the company’s shareholders.
Appreciation units Annual allocations of appreciation units are made to executives and selected managers. They are available to be settled in equal thirds on the 3rd, 4th and 5th anniversaries of their allocation but need not be exercised until the 6th anniversary, at which time they must be exercised or they will lapse.
On settlement, the value accruing to participants will be the full appreciation of Gold Reef’s share price, which value will be settled in cash.
Appreciation units align the interests of shareholders and participants by rewarding for positive appreciation in the share price over time. As such they offer the same reward characteristics as a vanilla share option scheme and will be similarly impacted by external, uncontrollable factors. However, it is the company’s intention to offer them as only one part of a mix of share-based elements.
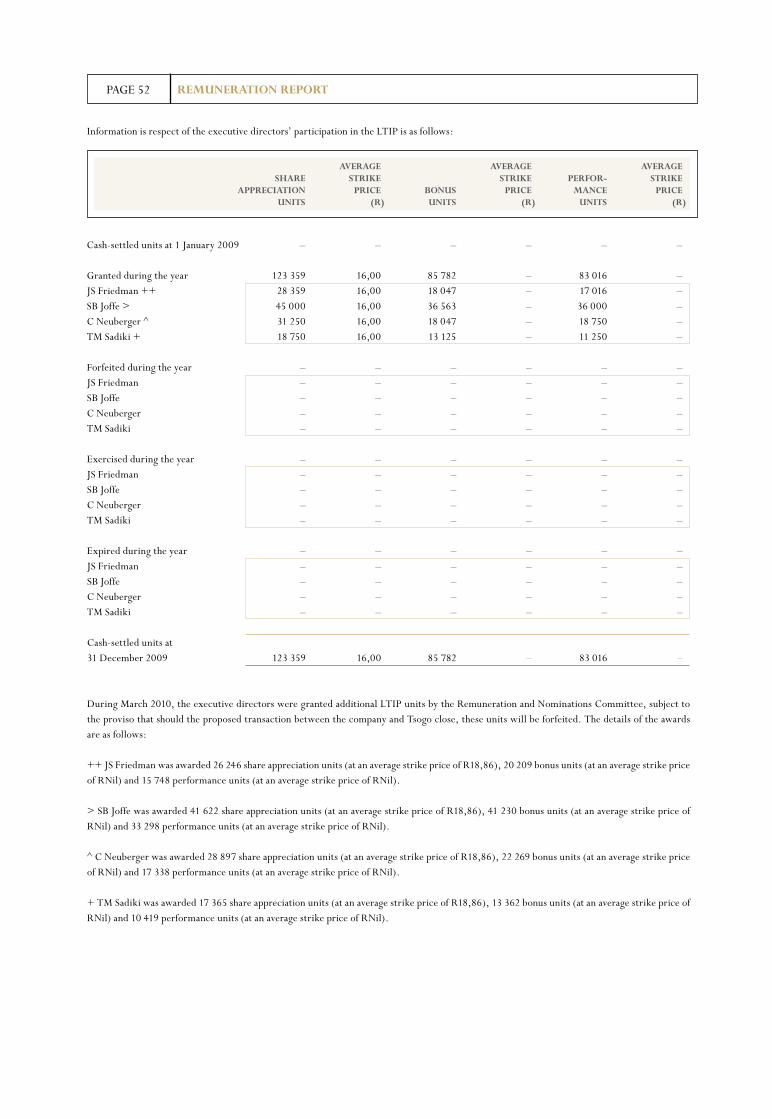
PAGE 52 REMUNERATION REPORT
AVERAGE AVERAGE AVERAGE ShARE STRIKE STRIKE PERFOR- STRIKE APPRECIATION PRICE BONUS PRICE MANCE PRICE UNITS (R) UNITS (R) UNITS (R)
Cash-settled units at 1 January 2009 – – – – – – Granted during the year 123 359 16,00 85 782 – 83 016 –JS Friedman ++ 28 359 16,00 18 047 – 17 016 –SB Joffe > 45 000 16,00 36 563 – 36 000 –C Neuberger ^ 31 250 16,00 18 047 – 18 750 –TM Sadiki + 18 750 16,00 13 125 – 11 250 – Forfeited during the year – – – – – –JS Friedman – – – – – –SB Joffe – – – – – –C Neuberger – – – – – –TM Sadiki – – – – – – Exercised during the year – – – – – –JS Friedman – – – – – –SB Joffe – – – – – –C Neuberger – – – – – –TM Sadiki – – – – – – Expired during the year – – – – – –JS Friedman – – – – – –SB Joffe – – – – – –C Neuberger – – – – – –TM Sadiki – – – – – – Cash-settled units at 31 December 2009 123 359 16,00 85 782 – 83 016 –
During March 2010, the executive directors were granted additional LTIP units by the Remuneration and Nominations Committee, subject to the proviso that should the proposed transaction between the company and Tsogo close, these units will be forfeited. The details of the awards are as follows:
++ JS Friedman was awarded 26 246 share appreciation units (at an average strike price of R18,86), 20 209 bonus units (at an average strike price of RNil) and 15 748 performance units (at an average strike price of RNil).
> SB Joffe was awarded 41 622 share appreciation units (at an average strike price of R18,86), 41 230 bonus units (at an average strike price of RNil) and 33 298 performance units (at an average strike price of RNil).
^ C Neuberger was awarded 28 897 share appreciation units (at an average strike price of R18,86), 22 269 bonus units (at an average strike price of RNil) and 17 338 performance units (at an average strike price of RNil).
+ TM Sadiki was awarded 17 365 share appreciation units (at an average strike price of R18,86), 13 362 bonus units (at an average strike price of RNil) and 10 419 performance units (at an average strike price of RNil).
Information is respect of the executive directors’ participation in the LTIP is as follows:
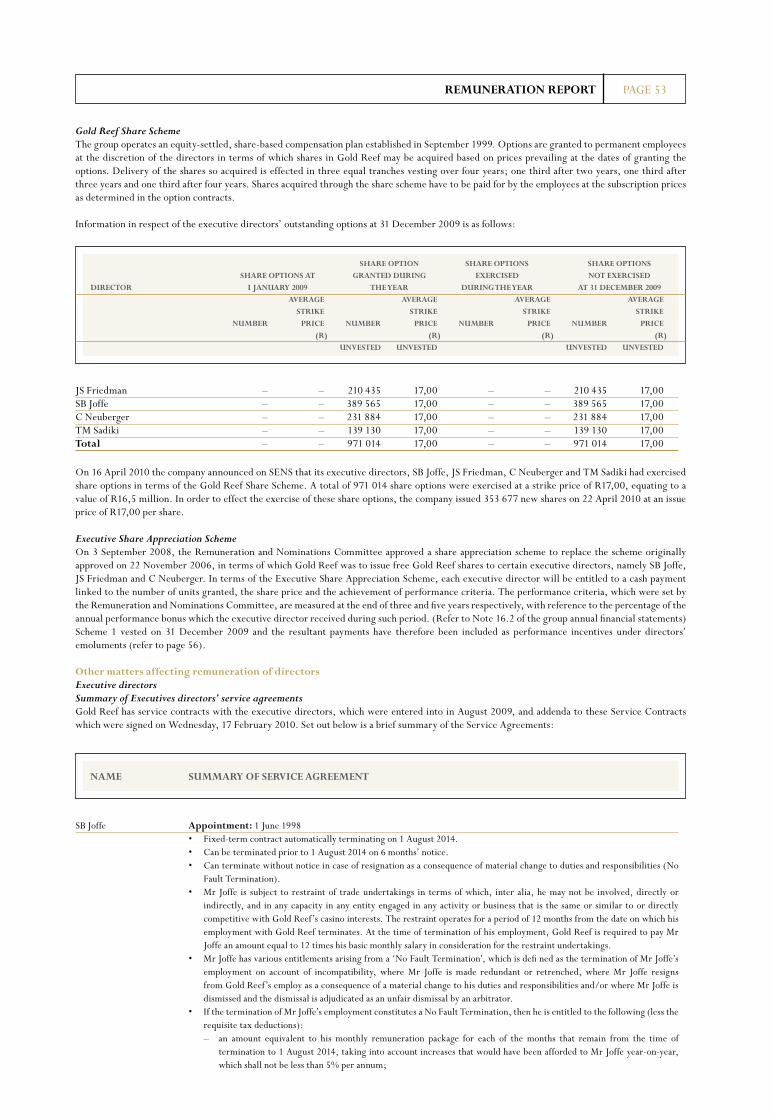
PAGE 53REMUNERATION REPORT
ShARE OPTION ShARE OPTIONS ShARE OPTIONS ShARE OPTIONS AT GRANTED DURING EXERCISED NOT EXERCISED DIRECTOR I JANUARY 2009 ThE YEAR DURING ThE YEAR AT 31 DECEMBER 2009 AVERAGE AVERAGE AVERAGE AVERAGE STRIKE STRIKE STRIKE STRIKE NUMBER PRICE NUMBER PRICE NUMBER PRICE NUMBER PRICE (R) (R) (R) (R) UNVESTED UNVESTED UNVESTED UNVESTED
JS Friedman – – 210 435 17,00 – – 210 435 17,00 SB Joffe – – 389 565 17,00 – – 389 565 17,00 C Neuberger – – 231 884 17,00 – – 231 884 17,00 TM Sadiki – – 139 130 17,00 – – 139 130 17,00 Total – – 971 014 17,00 – – 971 014 17,00
Gold Reef Share SchemeThe group operates an equity-settled, share-based compensation plan established in September 1999. Options are granted to permanent employees at the discretion of the directors in terms of which shares in Gold Reef may be acquired based on prices prevailing at the dates of granting the options. Delivery of the shares so acquired is effected in three equal tranches vesting over four years; one third after two years, one third after three years and one third after four years. Shares acquired through the share scheme have to be paid for by the employees at the subscription prices as determined in the option contracts.
Information in respect of the executive directors’ outstanding options at 31 December 2009 is as follows:
On 16 April 2010 the company announced on SENS that its executive directors, SB Joffe, JS Friedman, C Neuberger and TM Sadiki had exercised share options in terms of the Gold Reef Share Scheme. A total of 971 014 share options were exercised at a strike price of R17,00, equating to a value of R16,5 million. In order to effect the exercise of these share options, the company issued 353 677 new shares on 22 April 2010 at an issue price of R17,00 per share.
Executive Share Appreciation SchemeOn 3 September 2008, the Remuneration and Nominations Committee approved a share appreciation scheme to replace the scheme originally approved on 22 November 2006, in terms of which Gold Reef was to issue free Gold Reef shares to certain executive directors, namely SB Joffe, JS Friedman and C Neuberger. In terms of the Executive Share Appreciation Scheme, each executive director will be entitled to a cash payment linked to the number of units granted, the share price and the achievement of performance criteria. The performance criteria, which were set by the Remuneration and Nominations Committee, are measured at the end of three and five years respectively, with reference to the percentage of the annual performance bonus which the executive director received during such period. (Refer to Note 16.2 of the group annual financial statements) Scheme 1 vested on 31 December 2009 and the resultant payments have therefore been included as performance incentives under directors’ emoluments (refer to page 56).
Other matters affecting remuneration of directorsExecutive directorsSummary of Executives directors’ service agreementsGold Reef has service contracts with the executive directors, which were entered into in August 2009, and addenda to these Service Contracts which were signed on Wednesday, 17 February 2010. Set out below is a brief summary of the Service Agreements:
NAME SUMMARY OF SERVICE AGREEMENT
SB Joffe Appointment: 1 June 1998 • Fixed-term contract automatically terminating on 1 August 2014. • Can be terminated prior to 1 August 2014 on 6 months’ notice. • Can terminate without notice in case of resignation as a consequence of material change to duties and responsibilities (No
Fault Termination). • Mr Joffe is subject to restraint of trade undertakings in terms of which, inter alia, he may not be involved, directly or
indirectly, and in any capacity in any entity engaged in any activity or business that is the same or similar to or directly competitive with Gold Reef’s casino interests. The restraint operates for a period of 12 months from the date on which his employment with Gold Reef terminates. At the time of termination of his employment, Gold Reef is required to pay Mr Joffe an amount equal to 12 times his basic monthly salary in consideration for the restraint undertakings.
• Mr Joffe has various entitlements arising from a ‘No Fault Termination’, which is defi ned as the termination of Mr Joffe’s employment on account of incompatibility, where Mr Joffe is made redundant or retrenched, where Mr Joffe resigns from Gold Reef’s employ as a consequence of a material change to his duties and responsibilities and/or where Mr Joffe is dismissed and the dismissal is adjudicated as an unfair dismissal by an arbitrator.
• If the termination of Mr Joffe’s employment constitutes a No Fault Termination, then he is entitled to the following (less the requisite tax deductions):
– an amount equivalent to his monthly remuneration package for each of the months that remain from the time of termination to 1 August 2014, taking into account increases that would have been afforded to Mr Joffe year-on-year, which shall not be less than 5% per annum;
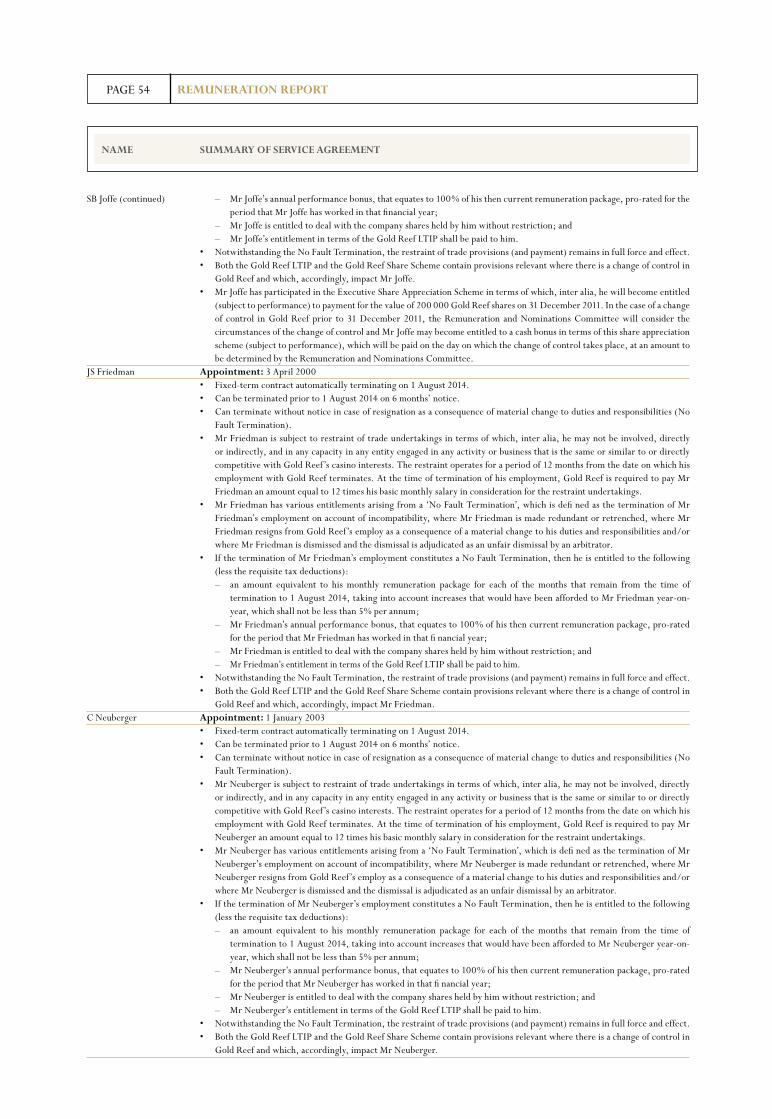
PAGE 54 REMUNERATION REPORT
NAME SUMMARY OF SERVICE AGREEMENT
SB Joffe (continued) – Mr Joffe’s annual performance bonus, that equates to 100% of his then current remuneration package, pro-rated for the period that Mr Joffe has worked in that financial year;
– Mr Joffe is entitled to deal with the company shares held by him without restriction; and – Mr Joffe’s entitlement in terms of the Gold Reef LTIP shall be paid to him. • Notwithstanding the No Fault Termination, the restraint of trade provisions (and payment) remains in full force and effect. • Both the Gold Reef LTIP and the Gold Reef Share Scheme contain provisions relevant where there is a change of control in
Gold Reef and which, accordingly, impact Mr Joffe. • Mr Joffe has participated in the Executive Share Appreciation Scheme in terms of which, inter alia, he will become entitled
(subject to performance) to payment for the value of 200 000 Gold Reef shares on 31 December 2011. In the case of a change of control in Gold Reef prior to 31 December 2011, the Remuneration and Nominations Committee will consider the circumstances of the change of control and Mr Joffe may become entitled to a cash bonus in terms of this share appreciation scheme (subject to performance), which will be paid on the day on which the change of control takes place, at an amount to be determined by the Remuneration and Nominations Committee.
JS Friedman Appointment: 3 April 2000 • Fixed-term contract automatically terminating on 1 August 2014. • Can be terminated prior to 1 August 2014 on 6 months’ notice. • Can terminate without notice in case of resignation as a consequence of material change to duties and responsibilities (No
Fault Termination). • Mr Friedman is subject to restraint of trade undertakings in terms of which, inter alia, he may not be involved, directly
or indirectly, and in any capacity in any entity engaged in any activity or business that is the same or similar to or directly competitive with Gold Reef’s casino interests. The restraint operates for a period of 12 months from the date on which his employment with Gold Reef terminates. At the time of termination of his employment, Gold Reef is required to pay Mr Friedman an amount equal to 12 times his basic monthly salary in consideration for the restraint undertakings.
• Mr Friedman has various entitlements arising from a ‘No Fault Termination’, which is defi ned as the termination of Mr Friedman’s employment on account of incompatibility, where Mr Friedman is made redundant or retrenched, where Mr Friedman resigns from Gold Reef’s employ as a consequence of a material change to his duties and responsibilities and/or where Mr Friedman is dismissed and the dismissal is adjudicated as an unfair dismissal by an arbitrator.
• If the termination of Mr Friedman’s employment constitutes a No Fault Termination, then he is entitled to the following (less the requisite tax deductions):
– an amount equivalent to his monthly remuneration package for each of the months that remain from the time of termination to 1 August 2014, taking into account increases that would have been afforded to Mr Friedman year-on-year, which shall not be less than 5% per annum;
– Mr Friedman’s annual performance bonus, that equates to 100% of his then current remuneration package, pro-rated for the period that Mr Friedman has worked in that fi nancial year;
– Mr Friedman is entitled to deal with the company shares held by him without restriction; and – Mr Friedman’s entitlement in terms of the Gold Reef LTIP shall be paid to him. • Notwithstanding the No Fault Termination, the restraint of trade provisions (and payment) remains in full force and effect. • Both the Gold Reef LTIP and the Gold Reef Share Scheme contain provisions relevant where there is a change of control in
Gold Reef and which, accordingly, impact Mr Friedman.C Neuberger Appointment: 1 January 2003 • Fixed-term contract automatically terminating on 1 August 2014. • Can be terminated prior to 1 August 2014 on 6 months’ notice. • Can terminate without notice in case of resignation as a consequence of material change to duties and responsibilities (No
Fault Termination). • Mr Neuberger is subject to restraint of trade undertakings in terms of which, inter alia, he may not be involved, directly
or indirectly, and in any capacity in any entity engaged in any activity or business that is the same or similar to or directly competitive with Gold Reef’s casino interests. The restraint operates for a period of 12 months from the date on which his employment with Gold Reef terminates. At the time of termination of his employment, Gold Reef is required to pay Mr Neuberger an amount equal to 12 times his basic monthly salary in consideration for the restraint undertakings.
• Mr Neuberger has various entitlements arising from a ‘No Fault Termination’, which is defi ned as the termination of Mr Neuberger’s employment on account of incompatibility, where Mr Neuberger is made redundant or retrenched, where Mr Neuberger resigns from Gold Reef’s employ as a consequence of a material change to his duties and responsibilities and/or where Mr Neuberger is dismissed and the dismissal is adjudicated as an unfair dismissal by an arbitrator.
• If the termination of Mr Neuberger’s employment constitutes a No Fault Termination, then he is entitled to the following (less the requisite tax deductions):
– an amount equivalent to his monthly remuneration package for each of the months that remain from the time of termination to 1 August 2014, taking into account increases that would have been afforded to Mr Neuberger year-on-year, which shall not be less than 5% per annum;
– Mr Neuberger’s annual performance bonus, that equates to 100% of his then current remuneration package, pro-rated for the period that Mr Neuberger has worked in that fi nancial year;
– Mr Neuberger is entitled to deal with the company shares held by him without restriction; and – Mr Neuberger’s entitlement in terms of the Gold Reef LTIP shall be paid to him. • Notwithstanding the No Fault Termination, the restraint of trade provisions (and payment) remains in full force and effect. • Both the Gold Reef LTIP and the Gold Reef Share Scheme contain provisions relevant where there is a change of control in
Gold Reef and which, accordingly, impact Mr Neuberger.
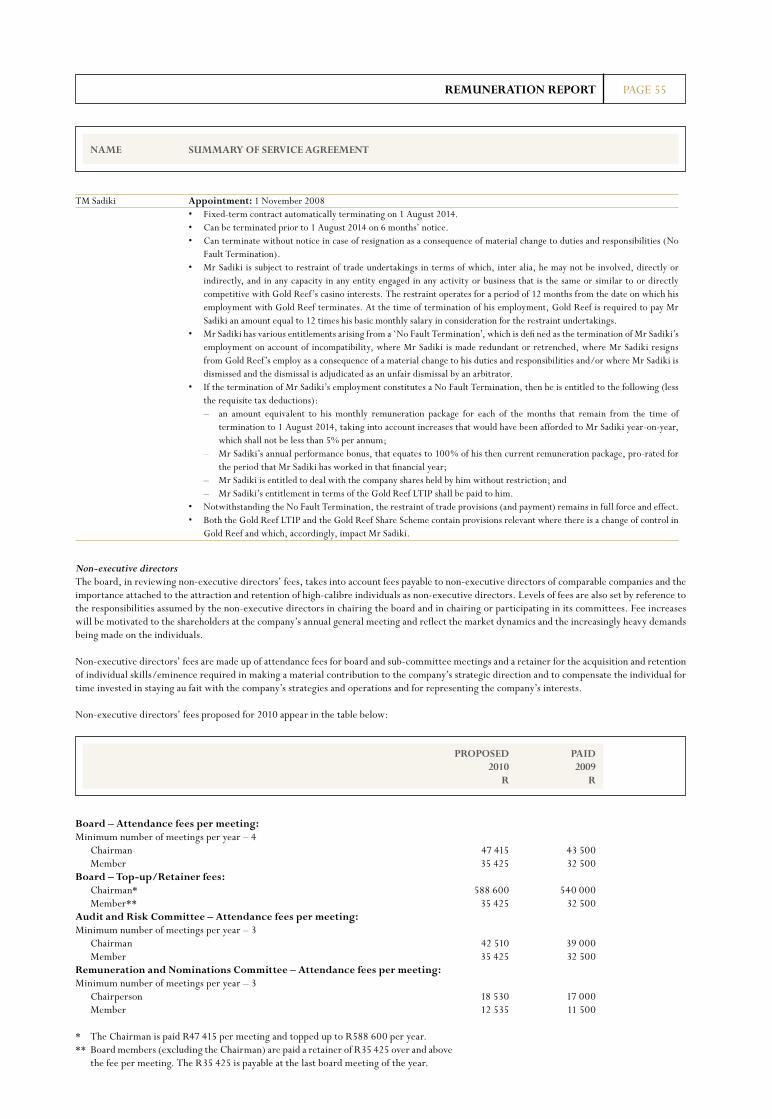
PAGE 55REMUNERATION REPORT
Non-executive directorsThe board, in reviewing non-executive directors’ fees, takes into account fees payable to non-executive directors of comparable companies and the importance attached to the attraction and retention of high-calibre individuals as non-executive directors. Levels of fees are also set by reference to the responsibilities assumed by the non-executive directors in chairing the board and in chairing or participating in its committees. Fee increases will be motivated to the shareholders at the company’s annual general meeting and reflect the market dynamics and the increasingly heavy demands being made on the individuals.
Non-executive directors’ fees are made up of attendance fees for board and sub-committee meetings and a retainer for the acquisition and retention of individual skills/eminence required in making a material contribution to the company’s strategic direction and to compensate the individual for time invested in staying au fait with the company’s strategies and operations and for representing the company’s interests. Non-executive directors’ fees proposed for 2010 appear in the table below:
Board – Attendance fees per meeting: Minimum number of meetings per year – 4 Chairman 47 415 43 500 Member 35 425 32 500 Board – Top-up/Retainer fees: Chairman* 588 600 540 000 Member** 35 425 32 500 Audit and Risk Committee – Attendance fees per meeting: Minimum number of meetings per year – 3 Chairman 42 510 39 000 Member 35 425 32 500 Remuneration and Nominations Committee – Attendance fees per meeting: Minimum number of meetings per year – 3 Chairperson 18 530 17 000 Member 12 535 11 500 * The Chairman is paid R47 415 per meeting and topped up to R588 600 per year. ** Board members (excluding the Chairman) are paid a retainer of R35 425 over and above
the fee per meeting. The R35 425 is payable at the last board meeting of the year.
PROPOSED PAID 2010 2009 R R
NAME SUMMARY OF SERVICE AGREEMENT
TM Sadiki Appointment: 1 November 2008 • Fixed-term contract automatically terminating on 1 August 2014. • Can be terminated prior to 1 August 2014 on 6 months’ notice. • Can terminate without notice in case of resignation as a consequence of material change to duties and responsibilities (No
Fault Termination). • Mr Sadiki is subject to restraint of trade undertakings in terms of which, inter alia, he may not be involved, directly or
indirectly, and in any capacity in any entity engaged in any activity or business that is the same or similar to or directly competitive with Gold Reef’s casino interests. The restraint operates for a period of 12 months from the date on which his employment with Gold Reef terminates. At the time of termination of his employment, Gold Reef is required to pay Mr Sadiki an amount equal to 12 times his basic monthly salary in consideration for the restraint undertakings.
• Mr Sadiki has various entitlements arising from a ‘No Fault Termination’, which is defi ned as the termination of Mr Sadiki’s employment on account of incompatibility, where Mr Sadiki is made redundant or retrenched, where Mr Sadiki resigns from Gold Reef’s employ as a consequence of a material change to his duties and responsibilities and/or where Mr Sadiki is dismissed and the dismissal is adjudicated as an unfair dismissal by an arbitrator.
• If the termination of Mr Sadiki’s employment constitutes a No Fault Termination, then he is entitled to the following (less the requisite tax deductions):
– an amount equivalent to his monthly remuneration package for each of the months that remain from the time of termination to 1 August 2014, taking into account increases that would have been afforded to Mr Sadiki year-on-year, which shall not be less than 5% per annum;
– Mr Sadiki’s annual performance bonus, that equates to 100% of his then current remuneration package, pro-rated for the period that Mr Sadiki has worked in that financial year;
– Mr Sadiki is entitled to deal with the company shares held by him without restriction; and – Mr Sadiki’s entitlement in terms of the Gold Reef LTIP shall be paid to him. • Notwithstanding the No Fault Termination, the restraint of trade provisions (and payment) remains in full force and effect. • Both the Gold Reef LTIP and the Gold Reef Share Scheme contain provisions relevant where there is a change of control in
Gold Reef and which, accordingly, impact Mr Sadiki.
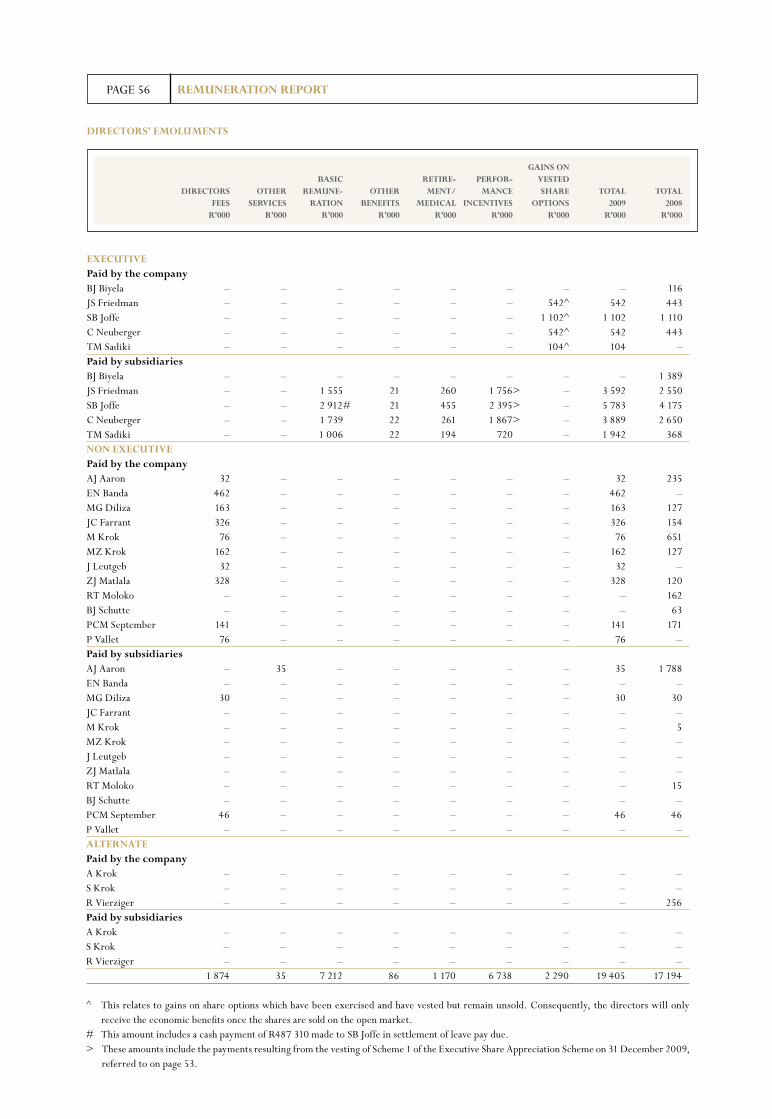
PAGE 56 REMUNERATION REPORT
GAINS ON BASIC RETIRE- PERFOR- VESTED DIRECTORS OThER REMUNE- OThER MENT/ MANCE ShARE TOTAl TOTAl FEES SERVICES RATION BENEFITS MEDICAl INCENTIVES OPTIONS 2009 2008 R’000 R’000 R’000 R’000 R’000 R’000 R’000 R’000 R’000
EXECUTIVE Paid by the company BJ Biyela – – – – – – – – 116JS Friedman – – – – – – 542^ 542 443SB Joffe – – – – – – 1 102^ 1 102 1 110C Neuberger – – – – – – 542^ 542 443TM Sadiki – – – – – – 104^ 104 –Paid by subsidiaries BJ Biyela – – – – – – – – 1 389JS Friedman – – 1 555 21 260 1 756> – 3 592 2 550SB Joffe – – 2 912# 21 455 2 395> – 5 783 4 175C Neuberger – – 1 739 22 261 1 867> – 3 889 2 650TM Sadiki – – 1 006 22 194 720 – 1 942 368NON EXECUTIVEPaid by the company AJ Aaron 32 – – – – – – 32 235EN Banda 462 – – – – – – 462 –MG Diliza 163 – – – – – – 163 127JC Farrant 326 – – – – – – 326 154M Krok 76 – – – – – – 76 651MZ Krok 162 – – – – – – 162 127J Leutgeb 32 – – – – – – 32 –ZJ Matlala 328 – – – – – – 328 120RT Moloko – – – – – – – – 162BJ Schutte – – – – – – – – 63PCM September 141 – – – – – – 141 171P Vallet 76 – – – – – – 76 –Paid by subsidiaries AJ Aaron – 35 – – – – – 35 1 788EN Banda – – – – – – – – –MG Diliza 30 – – – – – – 30 30JC Farrant – – – – – – – – –M Krok – – – – – – – – 5MZ Krok – – – – – – – – –J Leutgeb – – – – – – – – –ZJ Matlala – – – – – – – – –RT Moloko – – – – – – – – 15BJ Schutte – – – – – – – – –PCM September 46 – – – – – – 46 46P Vallet – – – – – – – – –AlTERNATE Paid by the company A Krok – – – – – – – – –S Krok – – – – – – – – –R Vierziger – – – – – – – – 256Paid by subsidiaries A Krok – – – – – – – – –S Krok – – – – – – – – –R Vierziger – – – – – – – – – 1 874 35 7 212 86 1 170 6 738 2 290 19 405 17 194
^ This relates to gains on share options which have been exercised and have vested but remain unsold. Consequently, the directors will only receive the economic benefits once the shares are sold on the open market.
# This amount includes a cash payment of R487 310 made to SB Joffe in settlement of leave pay due.> These amounts include the payments resulting from the vesting of Scheme 1 of the Executive Share Appreciation Scheme on 31 December 2009,
referred to on page 53.
DIRECTORS’ EMOlUMENTS

Garden Route CasinoMossel Bay, Western Cape

ANNUAl FINANCIAl STATEMENTS
61 ...Directors’ Statement of Responsibility
61 ...Declaration by the Company Secretary
62 ...Report of the Audit Committee
63 ...Report of the Independent Auditors
64 ...Directors’ Report
68 ...Accounting Policies
85 ...Group Income Statement
86 ...Group Statement of Comprehensive Income
87 ...Group Balance Sheet
88 ...Group Statement of Changes in Equity
89 ...Group Cash Flow Statement
90 ...Group Additional Information
91 ...Group Segmental Analysis
93 ...Notes to the Group Financial Statements
122 ..Company Statement of Comprehensive Income
123 ..Company Balance Sheet
124 ..Company Statement of Changes in Equity
125 ..Company Cash Flow Statement
126 ..Notes to the Company Financial Statements
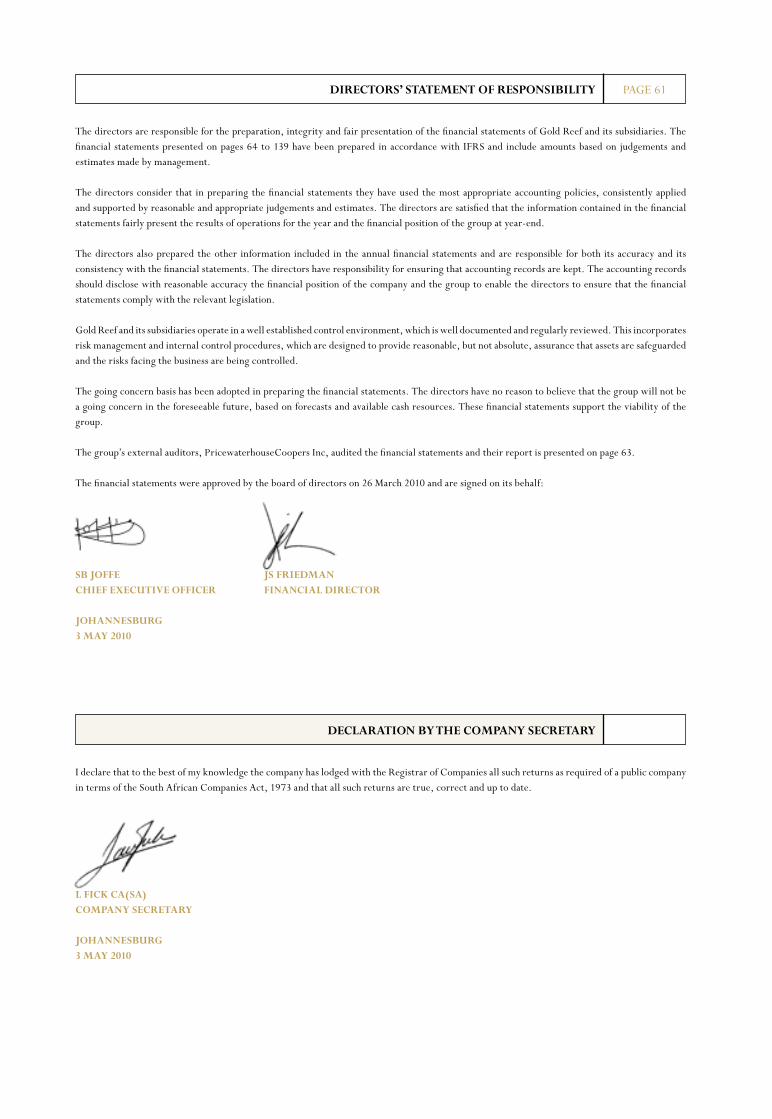
PAGE 61DIRECTORS’ STATEMENT OF RESPONSIBIlITY
DEClARATION BY ThE COMPANY SECRETARY
The directors are responsible for the preparation, integrity and fair presentation of the financial statements of Gold Reef and its subsidiaries. The financial statements presented on pages 64 to 139 have been prepared in accordance with IFRS and include amounts based on judgements and estimates made by management.
The directors consider that in preparing the financial statements they have used the most appropriate accounting policies, consistently applied and supported by reasonable and appropriate judgements and estimates. The directors are satisfied that the information contained in the financial statements fairly present the results of operations for the year and the financial position of the group at year-end.
The directors also prepared the other information included in the annual financial statements and are responsible for both its accuracy and its consistency with the financial statements. The directors have responsibility for ensuring that accounting records are kept. The accounting records should disclose with reasonable accuracy the financial position of the company and the group to enable the directors to ensure that the financial statements comply with the relevant legislation.
Gold Reef and its subsidiaries operate in a well established control environment, which is well documented and regularly reviewed. This incorporates risk management and internal control procedures, which are designed to provide reasonable, but not absolute, assurance that assets are safeguarded and the risks facing the business are being controlled.
The going concern basis has been adopted in preparing the financial statements. The directors have no reason to believe that the group will not be a going concern in the foreseeable future, based on forecasts and available cash resources. These financial statements support the viability of the group.
The group’s external auditors, PricewaterhouseCoopers Inc, audited the financial statements and their report is presented on page 63.
The financial statements were approved by the board of directors on 26 March 2010 and are signed on its behalf:
SB JOFFE JS FRIEDMANChIEF EXECUTIVE OFFICER FINANCIAl DIRECTOR
JOhANNESBURG3 MAY 2010
I declare that to the best of my knowledge the company has lodged with the Registrar of Companies all such returns as required of a public company in terms of the South African Companies Act, 1973 and that all such returns are true, correct and up to date.
l FICK CA(SA)COMPANY SECRETARY
JOhANNESBURG3 MAY 2010
PAGE 62
The audit committee, appointed by the board in respect of the fi nancial year ended 31 December 2009, comprised JC Farrant (Chairman) and ZJ Matlala, both of whom are independent non-executive directors of the company. On 25 November 2009, P Vallet was appointed as an alternate to both members of the Audit and Risk Committee. The committee is satisfi ed that in respect of the fi nancial year it has performed all the functions required by law to be performed by an audit committee, including as set out by section 270A (1) (a) to (h) of the Companies Act and in terms of the committee’s terms of reference and as more fully set out in the corporate governance report. In this connection the committee has:
• evaluated the independence and effectiveness of the external auditors, PricewaterhouseCoopers Inc, and is satisfi ed that the external auditors are independent of the company, having given due consideration to the parameters enumerated under section 270A (5) (a) to (d) of the Companies Act. The committee accordingly nominates PricewaterhouseCoopers Inc as independent auditors to continue in offi ce until the conclusion of the 2010 annual general meeting, noting that NL Forster is the individual registered auditor and member of the aforegoing fi rm who undertakes the audit;
• considered and approved the audit fee payable to the external auditors in respect of the audit for the year ended 31 December 2009 ahead of the annual audit as well as their terms of engagement, taking into consideration factors such as the timing of the audit, the extent of work required and the scope of the audit;
• ensured and satisfi ed itself that the appointments of the external auditors, the designated auditor and IFRS advisor are in compliance with the Companies Act, The Auditing Profession Act, 2005 and the Listings Requirements of the JSE Limited;
• considered and pre-approved all audit and non-audit services provided by the external auditors exceeding R250 000 for any single engagement, ensuring that the independence of the external auditors is not compromised;
• reviewed and assessed the company’s risk identifi cation, measurement, and control systems and their implementation; and
• reviewed and approved the group accounting policies (refer to page 68).
The committee has also considered and satisfi ed itself of the appropriateness of the expertise and experience of the Financial Director.
JC FARRANTChAIRMANGOlD REEF AUDIT COMMITTEE
JOhANNESBURG3 MAY 2010
REPORT OF ThE AUDIT COMMITTEE FOR THE YEAR ENDED 31 DECEMBER 2009
PAGE 63
INDEPENDENT AUDITOR’S REPORT TO ThE MEMBERS OF GOlD REEF We have audited the group annual financial statements and annual financial statements of Gold Reef and its subsidiaries, which comprise the consolidated and separate balance sheets as at 31 December 2009 and the consolidated and separate income statements, the consolidated and separate statements of comprehensive income, the consolidated and separate statements of changes in equity and consolidated and separate cash flow statements for the year then ended and a summary of significant accounting policies and other explanatory notes, and the directors’report, as set out on pages 64 to 139.
Directors’ Responsibility for the Financial Statements The company’s directors are responsible for the preparation and fair presentation of these financial statements in accordance with IFRS and in the manner required by the Companies Act of South Africa. This responsibility includes: designing, implementing and maintaining internal controls relevant to the preparation and fair presentation of financial statements that are free from material misstatement, whether due to fraud or error; selecting and applying appropriate accounting policies; and making accounting estimates that are reasonable in the circumstances.
Auditor’s ResponsibilityOur responsibility is to express an opinion on these financial statements based on our audit. We conducted our audit in accordance with International Standards on Auditing. Those standards require that we comply with ethical requirements and plan and perform the audit to obtain reasonable assurance whether the financial statements are free from material misstatement.
An audit involves performing procedures to obtain audit evidence about the amounts and disclosures in the financial statements. The procedures selected depend on the auditor’s judgement, including the assessment of the risks of material misstatement of the financial statements, whether due to fraud or error. In making those risk assessments, the auditor considers internal controls relevant to the entity’s preparation and fair presentation of the financial statements in order to design audit procedures that are appropriate in the circumstances, but not for the purpose of expressing an opinion on the effectiveness of the entity’s internal controls. An audit also includes evaluating the appropriateness of accounting policies used and the reasonableness of accounting estimates made by management, as well as evaluating the overall presentation of the financial statements.
We believe that the audit evidence we have obtained is sufficient and appropriate to provide a basis for our audit opinion. OpinionIn our opinion, the financial statements present fairly, in all material respects, the consolidated and separate financial position of Gold Reef and its subsidiaries as at 31 December 2009, and its consolidated and separate financial performance and its consolidated and separate cash flows for the year then ended in accordance with IFRS and in the manner required by the Companies Act of South Africa.
PRICEWATERhOUSECOOPERS INC DIRECTOR: Nl FORSTERREGISTERED AUDITOR
JOhANNESBURG3 MAY 2010
REPORT OF ThE INDEPENDENT AUDITORS
PAGE 64
NATURE OF BUSINESSGold Reef is a gaming and entertainment company incorporated in SA. Its interests incorporate Akani Egoli which operates Gold Reef City Casino and Theme Park, Silverstar Casino which operates the Silverstar Casino, Akani Msunduzi which operates Golden Horse Casino, West Coast Leisure which operates Mykonos Casino, Garden Route Casino which operates Garden Route Casino, Goldfields Casino which operates Goldfields Casino and Lukhanji Leisure which operates Queens Casino.
Gold Reef also owns Gold Reef Management which currently provides management services to the group’s own properties with the aim of targeting independent operations in the future.
FINANCIAl RESUlTS AND DIVIDENDThe annual financial results of the company and group for the year are set out in the annual financial statements and accompanying notes.
The board has declared a dividend of 65,0 cents per share covered 2,0 times by HEPS. From time to time the board will reconsider dividend cover based on the group’s cash flow, gearing and capital requirements. Dividends are financed out of Gold Reef’s cash resources after servicing the debt of the group’s underlying operations.
ShARE CAPITAlOn 1 January 2009 the authorised share capital of the company comprised 590 000 000 ordinary shares of which 291 990 220 were issued. During the year the group issued no further ordinary shares. At 31 December 2009 the aggregate number of ordinary shares in issue was accordingly 291 990 220.
The company’s authorised but unissued shares have been placed under the control of the directors until the forthcoming annual general meeting with the authority to allot and issue only those shares required to be issued for the purpose of carrying out the terms of the Gold Reef Share Scheme, limited to a maximum of 3 million shares, in their discretion, subject to Sections 221 and 222 of the Companies Act, 61 of 1973, as amended, and the JSE Listings Requirements.
Treasury shares held by the group on 1 January 2009 numbered 14 427 602 (1 January 2008: 14 427 602). During the year the group did not purchase any further treasury shares (2008: Nil). At year-end treasury shares held by the group numbered 14 427 602 (year-end 2008: 14 427 602).
Gold Reef shares held by the Gold Reef Share Scheme on 1 January 2009 numbered 483 001 (1 January 2008:350 000). In addition, there were 2 171 556 (2008: 3 498 113) unvested, exercised options outstanding, which are also treated as treasury shares. Of these treasury shares, 1 423 221 vested in August 2009 (August 2008: 1 326 557) and were transferred to employees. The share scheme repurchased 134 336 (2008: 133 001) Gold Reef shares during the year. At year-end Gold Reef shares held by the Gold Reef Share Scheme numbered 617 337 (2008: 483 001). Unvested, exercised options outstanding at year-end numbered 748 335 (2008: 2 171 556).
DIRECTORATEThe directors of the company at year-end are set out on the following page. The number of board and committee meetings attended by each of the directors during the year 1 January 2009 to 31 December 2009 is indicated there, with the number in brackets reflecting the total number of meetings held during this period.
DIRECTORS’ REPORT FOR THE YEAR ENDED 31 DECEMBER 2009
PAGE 65
AJ Aaron* (resigned 8 July 2009) 1(2) – – –EN Banda> º (Chairman) (appointed 13 March 2009) 3(3) – – 1(1)MG Diliza> 4(4) – – –JC Farrant >++º 4(4) – 3(3) 3(3)JS Friedman (FD) 4(4) – – –SB Joffe (CEO) 4(4) – – –A Krok** (resigned 2 July 2009) – – – –M Krok* (resigned 2 July 2009) 2(2) – – –MZ Krok> 4(4) – – –S Krok** – – – –J Leutgeb*” (resigned 2 July 2009) 1(1) – – –ZJ Matlala >+ºº 4(4) – 3(3) 3(3)C Neuberger” (COO) 4(4) – – –TM Sadiki (HR Director) 3(4) – – –PCM September* 3(4) – – –P Vallet*+++ (appointed 25 August 2009) 2(2) – – – R Vierziger**” (resigned 2 July 2009) – – – –
* Non-executive > Independent ** Alternate ”Austrian Citizen + Audit and Risk Committee ++ Audit and Risk Committee Chairman +++ Audit and Risk Committee Alternate º Remuneration and Nominations Committee ºº Remuneration and Nominations Committee Chairperson
In terms of the Articles of Association MG Diliza, PCM September and P Vallet will retire at the forthcoming annual general meeting and being eligible, offer themselves for re-election.
M Krok resigned on 2 July 2009 as chairman and director of Gold Reef. Consequently, Dr EN Banda was appointed independent non-executive chairman of Gold Reef.
On 25 August 2009 P Vallet was appointed as a non-executive director to the Gold Reef board.
Two non-executive directors, AJ Aaron and J Leutgeb and two alternates, A Krok and R Vierziger, resigned during 2009.
SUBSIDIARIES, ASSOCIATES AND OThER INVESTMENTSInformation relating to the company’s financial interests in its subsidiaries, associates and other investments is set out in Note 22 to the company financial statements.
COMPANY SECRETARYJS Friedman resigned as company secretary and was replaced by L Fick with effect from 25 November 2009. L Fick’s business and postal addresses, which are also the company’s registered addresses, are set out on page 144 of this annual report.
AUDITORSPricewaterhouseCoopers Inc. will continue in office in accordance with section 270(2) of the South African Companies Act, 1973 subject to the approval of shareholders at the forthcoming annual general meeting.
DIRECTORS’ REPORT FOR THE YEAR ENDED 31 DECEMBER 2009
AUDIT REMUNERATION QUARTERlY SPECIAl AND RISK AND NOMINATIONS DIRECTOR MEETINGS MEETINGS COMMITTEE COMMITTEE
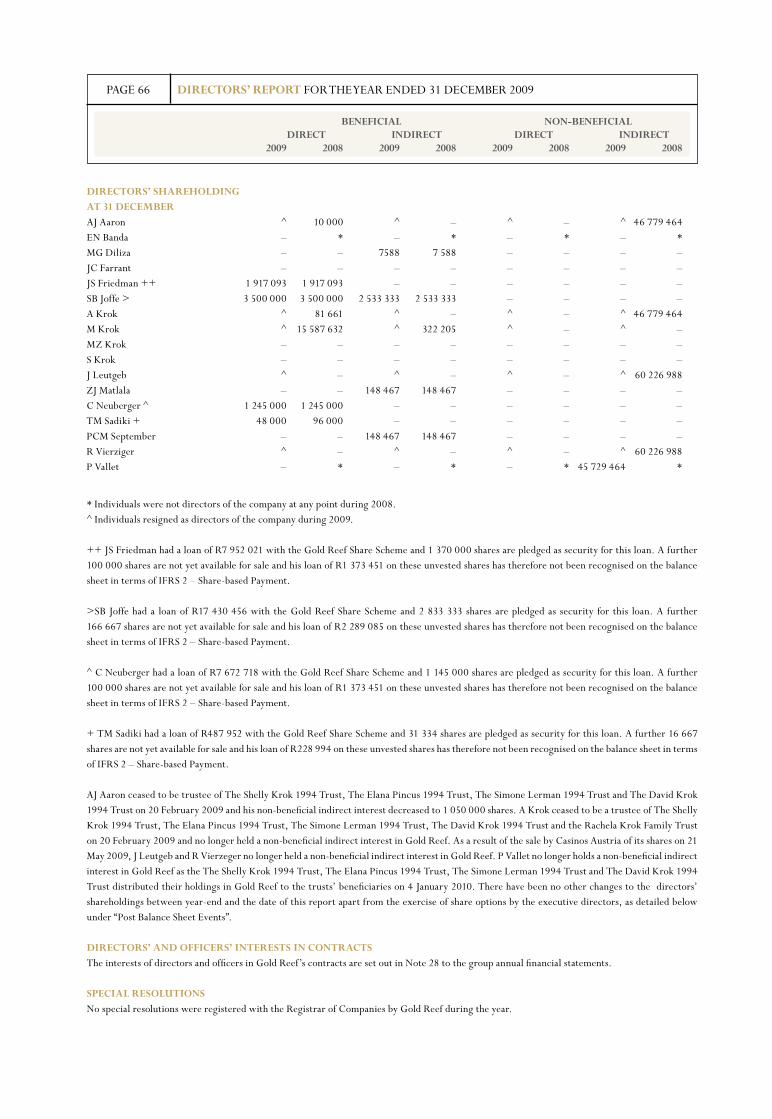
PAGE 66
DIRECTORS’ ShAREhOlDING AT 31 DECEMBERAJ Aaron ^ 10 000 ^ – ^ – ^ 46 779 464EN Banda – * – * – * – *MG Diliza – – 7588 7 588 – – – –JC Farrant – – – – – – – –JS Friedman ++ 1 917 093 1 917 093 – – – – – –SB Joffe > 3 500 000 3 500 000 2 533 333 2 533 333 – – – –A Krok ^ 81 661 ^ – ^ – ^ 46 779 464M Krok ^ 15 587 632 ^ 322 205 ^ – ^ –MZ Krok – – – – – – – –S Krok – – – – – – – –J Leutgeb ^ – ^ – ^ – ^ 60 226 988ZJ Matlala – – 148 467 148 467 – – – –C Neuberger ^ 1 245 000 1 245 000 – – – – – –TM Sadiki + 48 000 96 000 – – – – – –PCM September – – 148 467 148 467 – – – –R Vierziger ^ – ^ – ^ – ^ 60 226 988P Vallet – * – * – * 45 729 464 *
BENEFICIAl NON-BENEFICIAl DIRECT INDIRECT DIRECT INDIRECT 2009 2008 2009 2008 2009 2008 2009 2008
DIRECTORS’ REPORT FOR THE YEAR ENDED 31 DECEMBER 2009
* Individuals were not directors of the company at any point during 2008.^ Individuals resigned as directors of the company during 2009.
++ JS Friedman had a loan of R7 952 021 with the Gold Reef Share Scheme and 1 370 000 shares are pledged as security for this loan. A further 100 000 shares are not yet available for sale and his loan of R1 373 451 on these unvested shares has therefore not been recognised on the balance sheet in terms of IFRS 2 – Share-based Payment.
>SB Joffe had a loan of R17 430 456 with the Gold Reef Share Scheme and 2 833 333 shares are pledged as security for this loan. A further 166 667 shares are not yet available for sale and his loan of R2 289 085 on these unvested shares has therefore not been recognised on the balance sheet in terms of IFRS 2 – Share-based Payment.
^ C Neuberger had a loan of R7 672 718 with the Gold Reef Share Scheme and 1 145 000 shares are pledged as security for this loan. A further 100 000 shares are not yet available for sale and his loan of R1 373 451 on these unvested shares has therefore not been recognised on the balance sheet in terms of IFRS 2 – Share-based Payment.
+ TM Sadiki had a loan of R487 952 with the Gold Reef Share Scheme and 31 334 shares are pledged as security for this loan. A further 16 667 shares are not yet available for sale and his loan of R228 994 on these unvested shares has therefore not been recognised on the balance sheet in terms of IFRS 2 – Share-based Payment.
AJ Aaron ceased to be trustee of The Shelly Krok 1994 Trust, The Elana Pincus 1994 Trust, The Simone Lerman 1994 Trust and The David Krok 1994 Trust on 20 February 2009 and his non-beneficial indirect interest decreased to 1 050 000 shares. A Krok ceased to be a trustee of The Shelly Krok 1994 Trust, The Elana Pincus 1994 Trust, The Simone Lerman 1994 Trust, The David Krok 1994 Trust and the Rachela Krok Family Trust on 20 February 2009 and no longer held a non-beneficial indirect interest in Gold Reef. As a result of the sale by Casinos Austria of its shares on 21 May 2009, J Leutgeb and R Vierzeger no longer held a non-beneficial indirect interest in Gold Reef. P Vallet no longer holds a non-beneficial indirect interest in Gold Reef as the The Shelly Krok 1994 Trust, The Elana Pincus 1994 Trust, The Simone Lerman 1994 Trust and The David Krok 1994 Trust distributed their holdings in Gold Reef to the trusts’ beneficiaries on 4 January 2010. There have been no other changes to the directors’ shareholdings between year-end and the date of this report apart from the exercise of share options by the executive directors, as detailed below under “Post Balance Sheet Events”.
DIRECTORS’ AND OFFICERS’ INTERESTS IN CONTRACTSThe interests of directors and officers in Gold Reef’s contracts are set out in Note 28 to the group annual financial statements.
SPECIAl RESOlUTIONSNo special resolutions were registered with the Registrar of Companies by Gold Reef during the year.
PAGE 67DIRECTORS’ REPORT FOR THE YEAR ENDED 31 DECEMBER 2009
POST BAlANCE ShEET EVENTSCorporate Activity – Merger with TsogoBy way of the SENS announcement on 18 February 2010, Gold Reef shareholders were advised that Gold Reef and Tsogo have entered into the Exchange Agreement regarding the potential merger of the respective businesses of Gold Reef and Tsogo.
The proposed transaction, if implemented, will result in Gold Reef acquiring the entire issued share capital of Tsogo from Tsogo Investment Holding Company (Pty) Ltd and SABSA Holdings (Pty) Ltd in consideration for the allotment and issue of a minimum of 888 261 028 Gold Reef shares (subject to the Gold Reef Consideration Shares Formula contained in the Exchange Agreement).
The company will be restructured to house the enlarged business with the intention that processes will be put in place to rename the company from “Gold Reef Resorts Limited” to “Tsogo Sun Holdings Limited” post implementation of the proposed transaction. Existing Gold Reef shareholders’ interest (excluding Tsogo Sun Expansion) in the enlarged issued share capital of the Merged Entity will represent a 19% shareholding, with the existing Tsogo shareholders holding the remaining 81%.
Subject to certain conditions (as further detailed in the circular to Gold Reef shareholders dated 3 April 2010), the Merged Entity will maintain its listing on the JSE which will be amended to reflect the enlarged issued ordinary share capital upon implementation of the proposed transaction.
On 26 April 2010, at the general meeting of Gold Reef shareholders convened to consider the proposed transaction, all of the special and ordinary resolutions required to authorise the implementation of the proposed transaction as set out in the notice of the general meeting were duly passed by the requisite majority of votes. The special resolutions have been lodged for registration with CIPRO.
Further announcements will be made in regard to the proposed transaction as and when the various conditions precedent are met. The principal outstanding conditions precedent include those with respect to the Competition Authorities and the relevant gambling boards, as further detailed in the circular to Gold Reef shareholders dated 3 April 2010.
DIRECTORS’ DEAlINGSOn 16 April 2010 the company announced on SENS that its executive directors, SB Joffe, JS Friedman, C Neuberger and TM Sadiki had exercised share options in terms of the Gold Reef Share Scheme. A total of 971 014 share options were exercised at a strike price of R17,00, equating to a value of R16,5 million. In order to effect the exercise of these share options, the company issued 353 677 new shares on 22 April 2010 at an issue price of R17,00 per share.
PAGE 68 ACCOUNTING POlICIES FOR THE YEAR ENDED 31 DECEMBER 2009
1. ACCOUNTING POlICIESSUMMARY OF SIGNIFICANT ACCOUNTING POlICIESThe principal accounting policies applied in the preparation of the consolidated and separate annual financial statements are set out below. These policies are in terms of IFRS and have been consistently applied to all the years presented, unless otherwise stated.
1.1 Basis of preparationThe consolidated and separate annual financial statements have been prepared in accordance with IFRS as well as the AC 500 standards as issued by the Accounting Practices Board. The consolidated and separate financial statements have been prepared under the historical cost convention, as modified by the revaluation of land and financial assets and financial liabilities, including derivative instruments at fair value through profit or loss.
The preparation of financial statements in conformity with IFRS requires the use of certain critical accounting estimates. It also requires management to exercise its judgement in the process of applying the group’s accounting policies. The areas involving a higher degree of judgement or complexity, or areas where assumptions and estimates are significant to the consolidated and separate financial statements are disclosed in Note 3.
The term IFRS includes International Financial Reporting Standards (“IFRSs”), International Accounting Standards (“IASs”) and Interpretations issued by the International Financial Reporting Interpretations Committee (“IFRIC”) or the former Standing Interpretations Committee (“SIC”). The standards referred to are set by the International Accounting Standards Board (“IASB”).
1.2.1 Standards, amendments and interpretations effective in 2009The following standards, amendments and interpretations are mandatory for accounting periods beginning on or after 1 January 2009:
• IFRS 8, ‘Operating segments’ (effective from 1 January 2009). IFRS 8 replaces IAS 14, ‘Segment reporting’ and aligns segment reporting with the requirements of the US standard SFAS 131, ‘Disclosures about segments of an enterprise and related information’. The new standard requires a ‘management approach’, under which segment information is presented on the same basis as that used for internal reporting purposes. The group has applied IFRS 8 from 1 January 2009.
• IAS 1 (Revised), ‘Presentation of financial statements’ (effective from 1 January 2009). The revised standard will prohibit the presentation of items of income and expenditure (that is, ‘non-owner changes in equity’) in the statement of changes in equity, requiring non-owner changes in equity to be presented separately from owner changes in equity. All non-owner changes in equity will be required to be shown in a performance statement, but entities can choose whether to present one performance statement (the statement of comprehensive income) or two statements (the income statement and statement of comprehensive income). Where entities restate or reclassify comparative information, they will be required to present a restated balance sheet as at the beginning of the comparative period in addition to the current requirement to present balance sheets at the end of the current period and at the end of the comparative period. The group has elected to present two statements for the group annual financial statements and one statement for the company annual financial statements. The group has applied IAS 1 (Revised) from 1 January 2009.
• IFRS 2 (Amendment), ‘Share-based payment’ (effective from 1 January 2009). The amended standard deals with vesting conditions and cancellations. It clarifies that vesting conditions are service conditions and performance conditions only. Other features of a share-based payment are not vesting conditions. These features would need to be included in the grant date fair value for transactions with employees and others providing similar services; they would not impact the number of awards expected to vest or valuation thereof subsequent to grant date. All cancellations, whether by the entity or by other parties, should receive the same accounting treatment. The group has applied IFRS 2 (Amendment) from 1 January 2009.
• IAS 32 (Amendment), ‘Financial instruments: Presentation’, and IAS 1 (Amendment), ‘Presentation of financial statements’ – ‘Puttable financial instruments and obligations arising on liquidation’ (effective from 1 January 2009). The amended standards require entities to classify puttable financial instruments and instruments, or components of instruments, that impose on the entity an obligation to deliver to another party a pro rata share of the net assets of the entity only on liquidation as equity, provided the financial instruments have particular features and meet specific conditions. The group has applied the IAS 32(Amendment) and IAS 1(Amendment) from 1 January 2009.
• IFRS 1 (Amendment), ‘First time adoption of IFRS’ and IAS 27, ‘Consolidated and separate financial statements’(effective from 1 January
2009). The amended standard allows first-time adopters to use a deemed cost of either fair value or the carrying amount under previous accounting practice to measure the initial cost of investments in subsidiaries, jointly controlled entities and associates in the separate financial statements. The amendment also removes the definition of the cost method from IAS 27 and replaces it with a requirement to present dividends as income in the separate financial statements of the investor. The group has applied IFRS 1 (Amendment) from 1 January 2009. The amendment has not had any impact on the group’s financial statements.
• IAS 28 (Amendment), ‘Investments in associates’ (and consequential amendments to IAS 32, ‘Financial Instruments: Presentation’ and IFRS 7, ‘Financial instruments: Disclosures’) (effective from 1 January 2009). The amendment is part of the IASB’s annual improvements project published in May 2008. An investment in associate is treated as a single asset for the purposes of impairment testing. Any impairment loss is not allocated to specific assets included within the investment, for example goodwill. Reversals of impairment are recorded as an adjustment to
PAGE 69ACCOUNTING POlICIES FOR THE YEAR ENDED 31 DECEMBER 2009
the investment balance to the extent that the recoverable amount of the associate increases. The group has applied the IAS 28 (Amendment) to impairment tests related to investments in associates and any related impairment losses from 1 January 2009.
• IAS 36 (Amendment), ‘Impairment of assets’ (effective from 1 January 2009). The amendment is part of the IASB’s annual improvements project published in May 2008. Where fair value less costs to sell is calculated on the basis of discounted cash flows, disclosures equivalent to those for value-in-use calculations should be made. The group will apply the IAS 28 (Amendment) and provide the required disclosure where applicable for impairment tests where the fair value less costs to sell is calculated using discounted cash flows from 1 January 2009.
• IAS 38 (Amendment), ‘Intangible assets’ (effective from 1 January 2009). The amendment is part of the IASB’s annual improvements project published in May 2008. A prepayment may only be recognised in the event that payment has been made in advance of obtaining right of access to goods or receipt of services. The group has applied the IAS 38 (Amendment) from 1 January 2009.
• IAS 37, ‘Provisions, contingent liabilities and contingent assets’ requires contingent liabilities to be disclosed, not recognised. IAS 19 has been amended to be consistent. The group has applied the IAS 19 (Amendment) from 1 January 2009.
• IAS 39 (Amendment), ‘Financial instruments: Recognition and measurement’ (effective from 1 January 2009). The amendment is part of the IASB’s annual improvements project published in May 2008. This amendment clarifies that it is possible for there to be movements into and out of the fair value through profit or loss category where a derivative commences or ceases to qualify as a hedging instrument in a cash flow or net investment hedge.
The definition of financial asset or financial liability at fair value through profit or loss as it relates to items that are held for trading is also amended. This clarifies that a financial asset or liability that is part of a portfolio of financial instruments managed together with evidence of an actual recent pattern of short-term profit-taking is included in such a portfolio on initial recognition.
The current guidance on designating and documenting hedges states that a hedging instrument needs to involve a party external to the reporting entity and cites a segment as an example of a reporting entity. This means that in order for hedge accounting to be applied at segment level, the requirements for hedge accounting are currently required to be met by the applicable segment. The amendment removes the example of a segment so that the guidance is consistent with IFRS 8, ‘Operating segments’, which requires disclosure for segments to be based on information reported to the chief operating decision-maker. Currently, for segment reporting purposes, each subsidiary designates contracts with group treasury as fair value or cash flow hedges so that the hedges are reported in the segment to which the hedged items relate. This is consistent with the information viewed by the chief operating decision-maker. See Note 15 of the group annual financial statements for further details. After the amendment is effective, the hedge will continue to be reflected in the segment to which the hedged items relate (and information provided to the chief operating decision-maker), but the group will not formally document and test this relationship.
When remeasuring the carrying amount of a debt instrument on cessation of fair value hedge accounting, the amendment clarifies that a revised effective interest rate (calculated at the date fair value hedge accounting ceases) is used. The group has applied the IAS 39 (Amendment) from 1 January 2009. It has not had an impact on the group’s financial statements.
• IAS 1 (Amendment), ‘Presentation of financial statements’ (effective from 1 January 2009). The amendment is part of the IASB’s annual improvements project published in May 2008. The amendment clarifies that some rather than all financial assets and liabilities classified as held for trading in accordance with IAS 39, ‘Financial instruments: Recognition and measurement’ are examples of current assets and liabilities respectively. The group has applied the IAS 39 (Amendment) from 1 January 2009.
• IFRS 7, ‘Financial instruments – Disclosures’ (Amendment) (effective 1 January 2009). The amendment requires enhanced disclosures about fair value measurement and liquidity risk. In particular, the amendment requires disclosure of fair value measurements by level of a fair value measurement hierarchy. The amendment only results in additional disclosures in the group and company annual financial statements. The group has applied the IFRS 7 (Amendment) from 1 January 2009.
1.2.2 Standards, amendments and interpretations effective in 2009 but not relevant to the groupThe following standards, amendments and interpretations are mandatory for accounting periods beginning on or after 1 January 2009 but are not relevant to the group’s operations:• IFRIC 15, ‘Agreements for the Construction of Real Estate’;• IAS 16 (Amendment), ‘Property, plant and equipment’ (and consequential amendment to IAS 7, ‘Statement of cash flows’);• IAS 19 (Amendment), ‘Employee benefits’;• IAS 20 (Amendment), ‘Accounting for government grants and disclosure of government assistance’;• IAS 29 (Amendment), ‘Financial reporting in hyperinflationary economies’;• IAS 40 (Amendment), ‘Investment property’ (and consequential amendments to IAS 16);• IAS 41 (Amendment), ‘Agriculture’.
PAGE 70 ACCOUNTING POlICIES FOR THE YEAR ENDED 31 DECEMBER 2009
1.2.3 Standards, amendments and interpretations that have been early adopted by the group• IFRIC 13, ‘Customer loyalty programmes’ (effective from1 July 2008). IFRIC 13 clarifies that where goods or services are sold together
with a customer loyalty incentive (for example loyalty points or free products), the arrangement is a multiple element arrangement and the consideration receivable from the customer is allocated between the components of the arrangement using fair values. The group now deducts the cost of loyalty points from net gaming revenue rather than including this cost in promotional and marketing costs.
• IAS 23 (Amendment), ‘Borrowing costs’ (effective from 1 January 2009). The amendment requires an entity to capitalise borrowing costs directly attributable to the acquisition, construction or production of a qualifying asset (one that takes a substantial period of time to get ready for use or sale) as part of the cost of that asset. The option of immediately expensing those borrowing costs has been removed. The group has applied IAS 23 (Amendment) to all qualifying assets during the 2009 financial period.
1.2.4 Standards, amendments and interpretations that are not yet effective and have not been early adopted by the groupCertain new standards, amendments and interpretations to existing standards have been published that are mandatory for the group’s accounting periods beginning on or after 1 July 2009 or later periods but which the group has not early adopted. They are as follows:
• IAS 27 (Revised), ‘Consolidated and separate financial statements’ (effective from 1 July 2009). The revised standard requires the effects of all transactions with non-controlling interests to be recorded in equity if there is no change in control and these transactions will no longer result in goodwill or gains and losses. The standard also specifies the accounting when control is lost. Any remaining interest in the entity is re-measured to fair value and a gain or loss is recognised in profit or loss. The group will apply IAS 27 (Revised) prospectively to transactions with non-controlling interests from 1 January 2010.
• IFRS 3 (Revised), ‘Business combinations’ (effective from 1 July 2009). The revised standard continues to apply the acquisition method to business combinations, with some significant changes. For example, all payments to purchase a business are to be recorded at fair value at the acquisition date, with contingent payments classified as debt subsequently re-measured through the income statement. There is a choice on an acquisition-by-acquisition basis to measure the non-controlling interest in the acquiree either at fair vale or at the non-controlling interest’s proportionate share of the acquiree’s net assets. All acquisition-related costs should be expensed. The group will apply IFRS 3 (Revised) prospectively to all business combinations from 1 January 2010.
• IFRS 5 (Amendment), ‘Non-current assets held-for-sale and discontinued operations’ (and consequential amendment to IFRS 1, ‘First-time adoption’) (effective from 1 July 2009). The amendment is part of the IASB’s annual improvements project published in May 2008. The amendment clarifies that all of a subsidiary’s assets and liabilities are classified as held for sale if a partial disposal sale plan results in loss of control. Relevant disclosure should be made for this subsidiary if the definition of a discontinued operation is met. A consequential amendment to IFRS 1 states that these amendments are applied prospectively from the date of transition to IFRS. The group will apply the IFRS 5 (Amendment) prospectively to all partial disposals of subsidiaries from 1 January 2010.
• IFRIC 17, ‘Distribution of non-cash assets to owners’ (effective from 1 July 2009). This interpretation provides guidance on accounting for arrangements whereby an entity distributes non-cash assets to shareholders either as a distribution of reserves or as dividends. IFRS 5 has also been amended to require that assets are classified as held for distribution only when they are available for distribution in their present condition and the distribution is highly probable. The group will apply this IFRIC 17 prospectively to all distributions of non-cash assets to shareholders from 1 January 2010.
1.2.5 Standards, amendments and interpretations that are not yet effective and not relevant to the group• IFRIC 9 (Amendment), ‘Reassessment of Embedded Derivatives’;• IFRIC 14, IAS 19 – ‘The Limit on a Defined Benefit Asset, Minimum Funding Requirements and their Interaction’;• IFRIC 16 (Amendment), ‘Hedges of a Net Investment in a Foreign Operation’;• IFRIC 18, ‘Transfer of Assets to Customers’; and• IFRIC 19, ‘Extinguishing Financial Liabilities with Equity Instruments’.
1.2.6 Annual Improvements ProjectsThe IASB initiated annual improvement projects during 2008 and 2009 as a method of making necessary but non-urgent amendments to IFRS. These changes will not be included as part of another major project.
The following amendments are effective for annual periods beginning on or after 1 January 2009, although entities are permitted to adopt them earlier.
• IFRS 7 “Financial Instruments: Disclosures”. Details of amendment is related to presentation of finance costs and amendment dealing with improving disclosures relating to Financial Instruments.
• IAS 1 “Presentation of Financial Statements”. Amendment relates to current/non-current classification of derivatives.
PAGE 71ACCOUNTING POlICIES FOR THE YEAR ENDED 31 DECEMBER 2009
• IAS 8 “Accounting Policies, Changes in Accounting Estimates and Errors”. The amendment relates to the status of implementation guidance.
• IAS 10 “Events after the Reporting Period”. Amendment affects dividends declared after the end of the reporting period.
• IAS 16 “Property, Plant and Equipment”. The recoverable amount and sale of assets held for rental is amended.
• IAS 18 “Revenue”. The costs of originating a loan are addressed.
• IAS 19 “Employee Benefits”. The amendment affects the curtailments and negative past service cost, Plan administration costs, Replacement of term “fall due” and guidance on contingent liabilities.
• IAS 20 “Accounting for Government Grants and Disclosure of Government Assistance”. This amendment deals with Government loans with a below-market rate of interest as well as the consistency of terminology with other IFRSs.
• IAS 23 “Borrowing Costs”. The components of borrowing costs are amended.
• IAS 28 “Investments in Associates”. Required disclosures when investments in associates are accounted for at fair value through profit or loss and the impairment of investment in associate.
• IAS 29 “Financial Reporting in Hyperinflationary Economies”. The amendment describes the measurement basis in the financial statements as well using consistent terminology with other IFRSs.
• IAS 31 “Interests in Joint Ventures”. Certain disclosures are required when interests in jointly controlled entities are accounted for at fair value through profit or loss.
• IAS 34 “Interim Financial Reporting”. Disclosures of earnings per share in interim financial reports are amended.
• IAS 36 “Impairment of Assets”. Disclosure of estimates used to determine the recoverable amount.
• IAS 38 “Intangible Assets”. Amendments relate to Advertising and promotional activities and the unit of production method of amortization.
• IAS 39 “Financial Instruments: Recognition and Measurement”. The following amendments were made: – Reclassification of derivatives into or out of the classification of at fair value through profit or loss; – Designating and documenting hedges at the segment level and applicable effective interest rate on cessation of fair value hedge accounting.
• IAS 40 “Investment property”. The amendment promotes the consistent use of the same terminology as IAS 8. The property under contruction or development for future use as investment property and investment property held under lease are also amended.
• IAS 41 “Agriculture”. This is not applicable to the group. Amendments were made to: discount rate for fair value calculations; Additional biological transformation; Examples of agricultural produce and products; and Point-of-sale costs.
The following amendments are effective for annual periods beginning on or after 1 July 2009, although entities are permitted to adopt them earlier.
• IFRS 2 “Share Based Payments”. The scope of IFRS 2 and IFRS 3 revised was clarified.
• IFRS 5 “ Non-current Assets Held for Sale and Discontinued Operations”. Details of the amendment relates to a plan to sell the controlling interest in a subsidiary.
• IAS 10 “Events after the Reporting Period”. Amendment resulted from the issue of IFRIC 17.
• IAS 27 “Consolidated and Seperate Financial Statements”. The measurement of subsidiary held for sale in seperate financial statements is addressed.
• IAS 38 “Intangible Assets”. Additional consequential amendments arising from revised IFRS 3 and the measurement of the fair value of an intangible asset acquired in a business combination.
The following amendments are effective for annual periods beginning on or after 1 January 2010, although entities are permitted to adopt them earlier.
• IFRS 5 “ Non-current Assets Held for Sale and Discontinued Operations”. Amendment affected the disclosures of non-current assets (or disposal groups) classified as held for sale or discontinued operations.
PAGE 72 ACCOUNTING POlICIES FOR THE YEAR ENDED 31 DECEMBER 2009
• IFRS 8 “Operating Segments”. The disclosure of information about segment assets was amended.
• IAS 1 “Presentation of Financial Statements”. The amendment deals with the classification of the current/non-current portion of convertible instruments.
• IAS 7 “Statement of Cash Flows”. Classification of expenditures on unrecognised assets is amended.
• IAS 17 “Leases”. The amendment deals with the classification of leases of land and buildings.
• IAS 36 “Impairment of Assets”. The unit of accounting for goodwill impairment testing was addressed.
• IAS 39 “Financial Instruments: Recognition and Measurement”. The amendment affects the following: Treating loan prepayment penalties as closely related embedded derivatives; Scope exemption for business combination contracts; and Cash flow hedge accounting.
The group has assessed the significance of these new standards, amendments to standards and new interpretations, which are applicable from 1 January 2009 and subsequent dates and has concluded that they will not have a material financial impact. IAS 29 and IAS 41 are not applicable to the operations of the group.
IAS 27 and IFRS 3 will have an impact on the financial reporting of new acquisitions and disposals.
1.3 CONSOlIDATIONThe group recognises investments in subsidiaries, associates and joint ventures as per the accounting policies detailed below. The company recognises these categories of investment at historical cost. The cost of an acquisition is measured as the fair value of the assets given, equity instruments issued and liabilities incurred or assumed at the date of exchange, plus costs directly attributable to the acquisition.
1.3.1 SubsidiariesSubsidiaries are all entities (including special purpose entities) over which Gold Reef has the power to govern the financial and operating policies generally accompanying a shareholding of more than one half of the voting rights. The existence and effect of potential voting rights that are currently exercisable or convertible are considered when assessing whether the group controls another entity. The results of subsidiaries acquired or disposed of during the year are included in the consolidated income statement from the effective date of acquisition or up to the effective date of disposal, as appropriate.
Minority interests in the net assets of consolidated subsidiaries are identified separately from the group’s equity therein. Minority interests consist of the amount of those interests at the date of the original business combination and the minority’s share of changes in equity since the date of the combination. Losses applicable to the minority in excess of the minority’s interest in the subsidiary’s equity are allocated against the interests of the group.
The purchase method of accounting is used to account for the acquisition of subsidiaries by the group. The acquiree’s identifiable assets, liabilities and contingent assets and liabilities that meet the conditions for recognition under IFRS 3 are recognised at their fair values at the acquisition date, except for non-current assets (or disposal groups) that are classified as held-for-sale in accordance with IFRS 5, which are recognised and measured at fair value less costs to sell.
If, after reassessment, the group’s interest in the net fair value of the acquiree’s identifiable assets, liabilities and contingent assets and liabilities exceeds the cost of the business combination, the excess is recognised immediately in profit or loss.
The interest of minority shareholders in the acquiree is initially measured at the minority’s proportion of the net fair value of the assets, liabilities and contingent assets and liabilities recognised.
The group applies a policy of treating transactions with minority interests as transactions with equity owners of the group. For purchases from minority interests, the difference between the consideration paid and the relevant share acquired of the carrying value of net assets of the subsidiary is deducted from equity. Gains or losses on disposals to minority interests are also recorded in equity. For disposals to minority interests, differences between any proceeds received and the relevant share of minority interests are also recorded in equity.
Inter-company transactions, balances and unrealised gains on transactions between group companies are eliminated. Unrealised losses are also eliminated unless the transaction provides evidence of an impairment of the asset transferred.
1.3.2 AssociatesAn associate is an entity over which Gold Reef has significant influence and that is neither a subsidiary nor an interest in a joint venture. Significant influence is the power to participate in the financial and operating policy decisions of the investee but is not control or joint control over those policies.
PAGE 73ACCOUNTING POlICIES FOR THE YEAR ENDED 31 DECEMBER 2009
Any excess of the cost of acquisition over the group’s share of the net fair value of the identifiable assets, liabilities and contingent assets and liabilities of the associate recognised at the date of acquisition is recognised as goodwill. The goodwill is included within the carrying amount of the investment and is assessed for impairment as part of the investment. Any excess of the group’s share of the net fair value of the identifiable assets, liabilities and contingent liabilities over the cost of acquisition, after reassessment, is recognised immediately in profit or loss.
The group’s share of its associates’ post-acquisition profits or losses is recognised in the income statement and its share of post-acquisition movements in reserves is recognised in reserves. The cumulative post-acquisition movements are adjusted against the carrying amount of the investment. When the group’s share of losses in an associate equals or exceeds its interest in the associate, including any other unsecured receivables which are not expected to be recovered in the forseeable future, the group does not recognise further losses unless it has incurred obligations or made payments on behalf of the associate.
Unrealised gains on transactions between the group and its associates are eliminated to the extent of the group’s interest in the associates. Unrealised losses are also eliminated unless the transaction provides evidence of an impairment of the asset transferred.
1.4 PROPERTY, PlANT AND EQUIPMENTLand and buildings comprise mainly casino buildings and offices. Property, plant and equipment are shown at historical cost, less depreciation and impairment. Historical cost includes expenditure that is directly attributable to the acquisition of the items. Cost may also include transfers from equity of any gains/losses on qualifying cash flow hedges of foreign currency purchases of property, plant and equipment.
Subsequent costs are included in the asset’s carrying amount or recognised as a separate asset, as appropriate, only when it is probable that future economic benefits associated with the item will flow to the group and the cost of the item can be measured reliably. All other repairs and maintenance are charged to the income statement during the financial period in which they are incurred.
Land is not depreciated. Depreciation on other assets is calculated using the straight-line method to allocate their cost to their residual values over their estimated useful lives.
All significant assets’ residual values and remaining useful lives are reviewed annually and estimated useful lives are adjusted if appropriate, at each balance sheet date. The following estimated useful lives were used in the preparation of these accounts:• Buildings .......................................................................... 50 years• Plant and machinery ............................................................ 5-15 years• Casino equipment ............................................................... 5-6 years• Theme Park rides ................................................................ 6-26 years• Vehicles ............................................................................ 5 years• Furniture, fittings and other equipment .................................... 5-10 years• Computer equipment and software .......................................... 2-6 years• Computer mainframes and servers .......................................... 5 years
At each balance sheet date, these buildings’ residual values are compared to market values of 50 year old properties and adjusted accordingly.
An asset’s carrying amount is written down immediately to its recoverable amount if the asset’s carrying amount is greater than its estimated recoverable amount and the reduction is charged as an expense in the income statement.
Leasehold improvements are depreciated using the straight-line method over the period of the lease, adjusted for any decommissioning costs to be incurred at the end of the lease period.
Where items of property, plant and equipment cannot operate without software, that software is recognised as a component of property, plant and equipment.
Gains and losses on disposals are determined by comparing the proceeds with the carrying amount and are recognised within operating profit in the income statement.
1.5 BORROWING COSTSBorrowing costs directly attributable to the acquisition, construction or production of qualifying assets, which are assets that necessarily take a substantial period of time to get ready for their intended use or sale, are added to the cost of those assets, until such time as the assets are substantially ready for their intended use or sale. Investment income earned on the temporary investment of specific borrowings pending their expenditure on qualifying assets is deducted from the borrowing costs eligible for capitalisation.
Borrowing costs incurred for the construction of any qualifying asset are capitalised during the period of time that is required to complete and prepare the asset for its intended use.
All other borrowing costs are recognised in profit or loss in the period in which they are incurred.
PAGE 74 ACCOUNTING POlICIES FOR THE YEAR ENDED 31 DECEMBER 2009
1.6. INTANGIBlE ASSETS1.6.1 GoodwillGoodwill represents the excess of the cost of an acquisition over the net fair value of the group’s share of the identifiable assets, liabilities and contingent assets and liabilities of the acquired subsidiary, associate or jointly controlled entity recognised at the date of acquisition. Goodwill on acquisitions of subsidiaries and jointly controlled entities is included in intangible assets. Goodwill on acquisitions of associates is included in investments in associates. Goodwill is tested annually for impairment and carried at cost less accumulated impairment losses. Gains and losses on the disposal of an entity include the carrying amount of goodwill relating to the entity sold.
For the purpose of impairment testing, goodwill is allocated to each of Gold Reef’s cash-generating units or groups of cash generating units that are expected to benefit from the business combination in which the goodwill arose, identified according to operating segment. A cash-generating unit is the smallest identifiable group of assets that generates cash inflows that are largely independent of the cash inflows from other assets or groups of assets. The group considers each existing business operation to be a cash-generating unit. Cash-generating units to which goodwill has been allocated are tested for impairment annually, or more frequently when there is an indication that the unit may be impaired. If the recoverable amount of the cash-generating unit is less than the carrying amount of the unit, the impairment loss is allocated first to reduce the carrying amount of any goodwill allocated to the unit and then to the other assets of the unit pro-rata on the basis of the carrying amount of each asset in the unit. An impairment loss recognised for goodwill is not reversed in a subsequent period.
1.6.2 Trademarks Acquired trademarks are recognised at cost. Trademarks have a definite useful life and are carried at historical cost less accumulated amortisation. Amortisation is calculated using the straight-line method to allocate the cost of trademarks over their estimated useful lives. The estimated useful lives of the group’s trademarks are between 3 and 10 years.
1.6.3 Bid costs and casino licencesBid costs and casino licences are shown at historical cost less accumulated amortisation. Capitalised bid costs that relate to the exclusivity period of the casino licence are amortised over the exclusivity period.
Bid costs incurred that relate to the casino licence are amortised over the period of the license, or over 50 years for permanent licenses.
1.7 IMPAIRMENT OF TANGIBlE AND FINITE-lIVED INTANGIBlE ASSETS EXClUDING GOODWIllAt each balance sheet date the group reviews the carrying amounts of its tangible and intangible assets to determine whether there is any indication that those assets have suffered an impairment loss. If any such indication exists, the recoverable amount of the asset is estimated in order to determine the extent of the impairment loss (if any). Where it is not possible to estimate the recoverable amount of an individual asset, the group estimates the recoverable amount of the cash-generating unit to which the asset belongs.
Recoverable amount is the higher of fair value less costs to sell and value in use. In assessing value in use, the estimated future cash flows are discounted to their present value using a pre-tax discount rate that reflects current market assessments of the time value of money and the risks specific to the asset. For the purposes of assessing impairment, assets are grouped at the lowest levels for which there are separately identifiable cash flows (cash generating units). If the recoverable amount of a cash-generating unit is estimated to be less than its carrying amount, the carrying amount of the cash-generating unit is reduced to its recoverable amount. An impairment loss is recognised immediately in profit or loss, unless the relevant asset is carried at a revalued amount, in which case the impairment loss is treated as a revaluation decrease.
1.8 FINANCIAl ASSETSThe group classifies its investments in the following categories: at fair value through profit or loss and loans and receivables. The classification depends on the purpose for which the investments were acquired. Management determines the classification of its financial assets upon initial recognition.
1.8.1 Financial assets at fair value through profit or lossFinancial assets at fair value through profit or loss are financial assets held for trading. A financial asset is classified in this category if acquired principally for the purpose of selling in the short-term. Derivatives are also categorised as held for trading unless they are designated as hedging instruments. Assets in this category are classified as current assets.
Gains or losses arising from changes in the fair value of the ‘financial assets at fair value through profit or loss’ category are presented in the income statement within finance income/(costs) in the period in which they arise. Dividend income from financial assets at fair value through profit or loss is recognised in the income statement as part of other income when the group’s right to receive payment is established.
1.8.2 loans and receivablesLoans and receivables are non-derivative financial assets with fixed or determinable payments that are not quoted in an active market. They are included in current assets, except for maturities greater than 12 months after the balance sheet date. These are classified as non-current assets. The group’s loans and receivables are contained in ‘trade and other receivables’ and cash and cash equivalents in the balance sheet and are disclosed net of impairment losses.
PAGE 75ACCOUNTING POlICIES FOR THE YEAR ENDED 31 DECEMBER 2009
1.9 INVENTORIESInventories are stated at the lower of cost and net realisable value. Cost comprises direct materials and related costs that have been incurred in bringing the inventories to their present location and condition. Cost is determined using the first-in first-out (FIFO) method. Net realisable value is the estimated selling price in the ordinary course of business, less applicable variable marketing, selling and distribution expenses.
1.10 TRADE RECEIVABlESTrade receivables are recognised initially at fair value and subsequently measured at amortised cost using the effective interest method, less provision for impairment. A provision for impairment of trade receivables is established when there is objective evidence that the group will not be able to collect all amounts due according to the original terms of the receivables. Significant financial difficulties of the debtor, probability that the debtor will enter bankruptcy or financial reorganisation, and default or delinquency in payments (more than 30 days overdue) are considered indicators that the trade receivable is impaired. The amount of the provision is the difference between the asset’s carrying amount and the present value of estimated future cash flows, discounted at the original effective interest rate. The carrying amount of the asset is reduced through the use of an allowance account, and the amount of the loss is recognised in the income statement within “other operating expenses”. When a trade receivable is uncollectible, it is written off against the allowance account for trade receivables. Subsequent recoveries of amounts previously written off are credited against “other operating expenses” in the income statement.
1.11 CASh AND CASh EQUIVAlENTSCash and cash equivalents includes cash in hand, deposits held at call with banks and other short-term highly liquid investments with original maturities of three months or less that are readily convertible into cash and which are subject to an insignificant risk of changes in value. Bank overdrafts are disclosed separately under current liabilities.
1.12 ShARE CAPITAlOrdinary shares are classified as equity.
Where any group company purchases the company’s equity share capital (treasury shares), the consideration paid is deducted from equity attributable to the company’s equity holders until the shares are cancelled, re-issued or disposed of. Where such shares are subsequently sold or re-issued, any consideration received is included in equity attributable to the company’s equity holders. Company shares consolidated into the group as part of the Gold Reef Share Scheme are accounted for as treasury shares.
1.13 BORROWINGSBorrowings are recognised initially at fair value, net of transaction costs incurred. Borrowings are subsequently stated at amortised cost. Any difference between the proceeds (net of transaction costs) and the redemption value is recognised in the income statement over the period of the borrowings using the effective interest rate method.
Borrowings are classified as current liabilities unless the group has an unconditional right to defer settlement of the liability for at least 12 months after the balance sheet date.
1.14 TAXATIONThe SA normal tax currently payable is based on taxable profit for the year. Taxable profit differs from profit as reported in the income statement because it excludes items of income or expenditure that are taxable or deductible in other years and it further excludes items that are never taxable or deductible. The group’s liability for current tax is calculated using tax rates that have been enacted or substantively enacted by the balance sheet date.
STC is calculated in respect of dividend payments net of dividends received. Income tax expense represents the sum of SA normal tax, STC and deferred tax.
Deferred tax is recognised on temporary differences between the carrying amounts of assets and liabilities in the financial statements and the corresponding tax bases used in the computation of taxable profit and is accounted for using the balance sheet liability method. Deferred tax liabilities are generally recognised for all taxable temporary differences and deferred tax assets are recognised to the extent that it is probable that taxable profits will be available against which deductible temporary differences can be utilised. Such assets and liabilities are not recognised if the temporary difference arises from goodwill or from the initial recognition (other than in a business combination) of other assets and liabilities in a transaction that affects neither the taxable profit nor the accounting profit. Deferred tax liabilities are recognised for taxable temporary differences arising on investments in subsidiaries and associates and interests in joint ventures, except where the group is able to control the reversal of the temporary difference and it is probable that the temporary difference will not reverse in the foreseeable future.
Deferred tax is calculated at tax rates enacted or substantially enacted in the period when the liability is settled or the asset realised. Deferred tax is charged or credited to profit or loss, except when it relates to items charged or credited directly to equity, in which case the deferred tax is also dealt with in equity. Deferred tax assets and liabilities are offset when there is a legally enforceable right to set off current tax assets against current tax liabilities and when they relate to income taxes levied by the same taxation authority and the group intends to settle its current tax assets and liabilities on a net basis.
PAGE 76 ACCOUNTING POlICIES FOR THE YEAR ENDED 31 DECEMBER 2009
The carrying amount of deferred tax assets is reviewed at each balance sheet date and reduced to the extent that it is no longer probable that sufficient taxable profits will be available to allow all or part of the asset to be recovered.
The normal SA tax rate used for the year ending 31 December 2009 was 28% (2008: 28%). Deferred tax assets and liabilities at 31 December 2009 have been calculated using this rate as this is the rate that the group expects to apply to the period when the assets are realised or the liabilities are settled. STC is calculated at the prevailing rate of 10%. CGT is calculated at 50% of the company tax rate.
1.15 EMPlOYEE BENEFITS1.15.1 Share-based payments – Gold Reef Share SchemeThe group operates an equity-settled, share-based compensation plan. Options are granted to permanent employees at the discretion of the directors in terms of which shares in Gold Reef may be acquired based on prices prevailing at the dates of granting the options. Delivery of the shares so acquired is effected in 3 equal tranches vesting over 4 years; one third after 2 years, one third after 3 years and one third after 4 years. Shares acquired through the share incentive scheme have to be paid for by the employees at the subscription prices as determined in the option contracts.
On a group level the Gold Reef Share Scheme is consolidated. Upon exercise of the options the subscription value is credited to share capital (nominal value) and share premium and debited to a non-current asset. The non-current asset is considered payable when the employees exercise the options.
The fair value of the employee services received by the company and/or its subsidiaries in exchange for the grant of the options is recognised as an expense. The fair value of the employee services received by the company’s associates in exchange for the grant of the options is recognised as an increase in the investment in associate. The fair value of the employee services received by the company’s joint ventures in exchange for the grant of the options is recognised as an expense to the extent that the venture is consolidated, any remaining portion is included in the investment in joint venture.
The total amount to be recognised over the vesting period is determined by reference to the fair value of the options granted, excluding the impact of any non-market vesting conditions (for example profitability and sales growth targets). Non-market vesting conditions are included in assumptions about the number of options that are expected to become exercisable. At each balance sheet date the entity revises its estimates of the number of options that are expected to become exercisable. It recognises the impact of the revision of original estimates, if any, in the income statement and a corresponding adjustment to equity over the vesting period. This equity account is included in the share-based payment reserve of the company.
Fair value is measured using a modified Binomial pricing model. The expected life used in the model has been adjusted, based on management’s best estimate, for the effects of non-transferability, exercise restrictions and behavioural considerations.
1.15.2 Goods or services settled in cashGoods or services, including employee services received in exchange for cash-settled share based payments, are recognised at the fair value of the liability incurred and are expensed when consumed or capitalised as assets, which are depreciated or amortised. The liability is re-measured at each balance sheet date to its fair value, with all changes recognised immediately in profit or loss.
The fair value of the executive share appreciation scheme is determined at each balance sheet date by independent actuaries, using a Monte Carlo valuation model. These are adjusted for management’s best estimate of the appreciation units expected to vest and management’s best estimate of the performance criteria assumption. The fair value of the long-term incentive plan liability is determined at each balance sheet date by independent actuaries, using a modified binomial tree valuation model, which takes into account the American nature of the appreciation units post vesting as well as incorporating employee exercise behaviour when applicable. These are adjusted for management’s best estimates of the appreciation, bonus and performance units expected to vest and management’s best estimate of the performance criteria assumption on the performance units. The liability is included in current liabilities, except for maturities greater than 12 months after the balance sheet date. These are classified as non-current liabilities.
1.15.3 Bonus plansThe group recognises a liability and an expense for bonuses, based on a formula that takes into consideration the profit attributable to the company’s shareholders after certain adjustments. The group recognises the liability where a reliable estimate can be made of the amount to be paid and it is contractually obliged to do so or there is a past practice that has created a constructive obligation and the directors are of the opinion that it is probable that such bonuses will be paid.
PAGE 77ACCOUNTING POlICIES FOR THE YEAR ENDED 31 DECEMBER 2009
1.15.4 Retirement benefit costsThe group operates a defined contribution plan. The group’s contribution to the defined contribution provident plan is charged to the income statement in the period to which the contribution relates. Under the scheme the group pays contributions into a separate entity and will have no legal or constructive obligations to pay further contributions if the fund does not hold sufficient assets to pay all employee benefits relating to employee service in the current or prior periods.
1.15.5 Employee leave entitlementEmployee entitlements to annual leave are recognised when they accrue to employees. An accrual is made for the estimated liability to the employees for annual leave up to the balance sheet date. This liability has been included in the accruals balance in the balance sheet.
1.16 TRADE AND OThER PAYABlESTrade and other payables are recognised initially at fair value and subsequently measured at amortised cost using the effective interest rate method. They are included in current liabilities, except for maturities greater than 12 months after the balance sheet date. These are classified as non-current liabilities.
1.17 PROVISIONSProvisions are recognised when the group has a present legal or constructive obligation as a result of past events, it is more likely than not that an outflow of resources will be required to settle the obligation and the amount has been reliably estimated. Restructuring provisions comprise lease termination penalties and employee termination payments. Provisions are not recognised for future operating losses.
Where there are a number of similar obligations, the likelihood that an outflow will be required in settlement is determined by considering the class of obligations as a whole. A provision is recognised even if the likelihood of an outflow with respect to any one item included in the same class of obligations may be small.
Provisions are measured at the present value of the expenditures expected to be required to settle the obligation using a pre-tax rate that reflects current market assessments of the time value of money and the risks specific to the obligation. The increase in the provision due to passage of time is recognised as an interest expense.
1.18 REVENUE RECOGNITIONGaming revenue comprises the net gaming win generated by casino operations. In terms of accounting standards, contracts concluded under gaming operations meet the definition of derivatives and therefore income from gaming operations represents the net position arising from financial instruments. Net gaming win is measured as the net cash received from casino operations. Due to the short-term nature of the group’s casino operations, all income is recognised in profit and loss immediately, at fair value.
Promotional allowances for complimentary beverages, meals and/or accommodation are eliminated against the corresponding promotional costs recognised in gaming expenses. (Refer to Note 4 of the group annual financial statements).
IFRIC 13 clarifies that where goods or services are sold together with a customer loyalty incentive (for example loyalty points or free products), the arrangement is a multiple element arrangement and the consideration receivable from the customer is allocated between the components of the arrangement using fair values. The group deducts the cost of loyalty points from net gaming revenue rather than including this cost in promotional and marketing costs. (Refer to Group Additional Information on page 90).
Revenue arising from entrance fees, theatre revenue, hotel revenue, parking revenue, rental income, management fees and commissions and food and beverage revenue are recorded on the accrual basis when the amount of revenue can be measured reliably and it is probable that future economic benefits will flow to the group.
VAT and other taxes levied on casino winnings are included in net gaming win and are treated as direct costs as these are borne by the group and not customers. VAT on all other revenue transactions is excluded from revenue as this is considered to be a tax collected as an agent on behalf of SARS.
Other revenue earned by the group is recognised on the following bases:• royalty income: on an accrual basis in accordance with the substance of the relevant agreement;• interest income: as it accrues (taking into account the effective yield on the assets) unless collectability is in doubt; and• dividend income: when the shareholders’ right to receive payment is established.
1.19 lEASESLeases in which a significant portion of the risks and rewards of ownership are retained by the lessor are classified as operating leases. Payments made under operating leases (net of any incentives received from the lessor) are charged to the income statement on a straight-line basis over the period of the lease.
PAGE 78 ACCOUNTING POlICIES FOR THE YEAR ENDED 31 DECEMBER 2009
Leases of property, plant and equipment where the group assumes substantially all the benefits and risks of ownership are classified as finance leases. Finance leases are capitalised at the lower of the fair value of the leased property and the estimated present value of the underlying lease payments. Each lease payment is allocated between the liability and finance charge so as to achieve a constant rate on the finance balance outstanding. The corresponding rental obligations, net of finance charges, are included in interest-bearing borrowings. The interest element of the finance charge is charged to the income statement over the lease period. The property, plant and equipment acquired under finance leasing contracts are depreciated over the useful life of the assets.
Assets leased to third parties under operating leases are included in property, plant and equipment in the balance sheet. They are depreciated over their expected useful lives on a basis consistent with similar owned property, plant and equipment. Rental income arising from the letting of premises to concessionaires (net of any incentives given to lessees) is recognised on a straight-line basis over the lease term.
1.20 FINANCIAl GUARANTEE CONTRACTSFinancial guarantee contracts are initially measured at fair value and subsequently measured at the higher of (a) the best estimate of the obligation and (b) the amount initially recognised less cumulative amortisation released on a systematic basis as a function of the passing of time and the repayment of capital.
The fair value of financial guarantee contracts entered into on behalf of subsidiary companies are capitalised to the carrying value of the investment in subsidiary. The fair value of financial guarantee contracts entered into on behalf of associate companies are expensed. The amortisation of all financial guarantee contracts is accounted for in ‘other income’ in the income statement.
1.21 DIVIDEND DISTRIBUTIONDividend distributions to the company’s shareholders are recognised as a liability in the group’s financial statements in the period in which the dividends are approved by the company’s board of directors.
1.22 SEGMENTAl REPORTINGThe standard requires a ‘management approach’ under which segment information is presented on the same basis as that used for internal reporting purposes. This has resulted in an increase in the number of reportable segments presented, as previously the company only reported one business segment, being casino operations. Operating segments are reported in a manner consistent with the internal reporting provided to the chief operating decision-maker. The chief operating decision-maker has been identified as the group executive directors who are responsible for making strategic decisions.
2. RISK MANAGEMENT2.1 FINANCIAl RISK MANAGEMENTThe group’s activities expose it to a variety of financial risks: market risk (including currency risk and cash-flow and fair value interest risk), credit risk and liquidity risk. The group’s overall risk management process focuses on the unpredictability of financial markets and seeks to minimise potential adverse effects on the group’s financial performance. The group uses derivative financial instruments to hedge certain risk exposures.
2.1.1 Market riska) Currency RiskForeign exchange risk arises when future commercial transactions (mainly import transactions) which are recognised as assets or liabilities, are denominated in a currency that is not the entity’s functional currency. To manage its foreign exchange risk arising from future commercial transactions, which result in the company recognising assets and liabilities, the company uses forward contracts and supplier agreements denominated in Rands. A sensitivity analysis is disclosed in Note 15 of the group annual financial statements in relation to currency risk.
b) Cash flow interest rate riskThe group’s interest rate risk arises from long-term borrowings issued at variable rates which expose the group to cash flow interest rate risk.
The group manages its cash flow interest rate risk by using floating-to-fixed interest rate swaps. Such interest rate swaps have the economic effect of converting borrowings from floating rates to fixed rates. Generally, the group raises long-term borrowings at floating rates and swaps them into fixed rates that are lower than those available if the group borrowed at fixed rates directly. Under the interest rate swaps, the group agrees with other parties to exchange, at specified intervals (primarily monthly), the difference between fixed contract rates and floating-rate interest amounts calculated by reference to the agreed notional amounts.
If JIBAR were to increase by 1%, finance costs would have increased by R16,1 million per annum. If JIBAR were to decrease by 1%, finance costs would have decreased by R16,1 million per annum.
At 31 December 2009, the fair value of the liabilities would have been R14,8 million lower if JIBAR had been 1% higher, while the fair value adjustment recognised in the income statement and the fair value adjustment recognised in the hedging reserve would have been RNil and R14,8 million higher, respectively. The fair value of the liabilities would have been R14,8 million higher if JIBAR had been 1% lower, while the fair value adjustment recognised in the income statement and the fair value adjustment recognised in the hedging reserve would have been RNil and R14,8 million lower, respectively.
c) Fair value interest rate riskThe group’s exposure to fair value interest rate risk arises from the fixed interest rate swap derivatives used to mitigate the cash flow interest rate risk on the group’s long-term borrowings. The group manages its fair value interest rate risk by designating these fixed interest rate swaps as hedging instruments in a cash flow hedge relationship. The effective portion of changes in the fair value of derivatives that are designated and qualify as cash flow hedges is recognised in other comprehensive income. The amounts accumulated in other comprehensive income are recycled in the income statement in the periods when the hedged item affects profit or loss. Refer to Note 15 of the group annual financial statements for the interest rate sensitivity analysis.
2.1.2 Credit riskCredit risk arises from loans and receivables, accounts receivable (excluding prepayments and VAT) and cash and cash equivalents. The group has no significant concentrations of credit risk. It has policies in place to ensure that the granting of credit to customers is adequately controlled. Cash investments are only placed with reputable, high quality commercial banking institutions.
The maximum exposure to credit risk is represented by the carrying amount of each financial asset in the balance sheet (net of impairment losses where relevant). Refer to Note 18 of the group annual financial statements for the ageing of trade receivable balances.
2.1.3 liquidity riskThe group makes use of a mix of external borrowings and existing resources to fund its operations and expansions. Primary borrowings are from Nedbank and ABSA in the form of long term interest-bearing borrowings (see Note 23 of the group annual financial statements). The group manages liquidity risk by monitoring cash levels, undrawn facilities, loan balances and existing guarantees (see Note 23 of the group annual financial statements) on a weekly basis and by updating key ratios and forecasts on a monthly basis. Key ratios include debt:equity, debt:EBITDAR, interest cover and debt servicibility ratios. The company, together with its bankers, monitors default levels and events to ensure that funds are available as intended per forecast estimates.
The table on the following page analyses the group’s financial liabilities and net-settled derivative financial liabilities into relevant maturity groupings based on the remaining period at the balance sheet date to the contractual maturity date. The amounts disclosed in the table are the contractual undiscounted cashflows. Balances due within 12 months equal their carrying balances as the impact of discounting in not significant.
PAGE 79ACCOUNTING POlICIES FOR THE YEAR ENDED 31 DECEMBER 2009
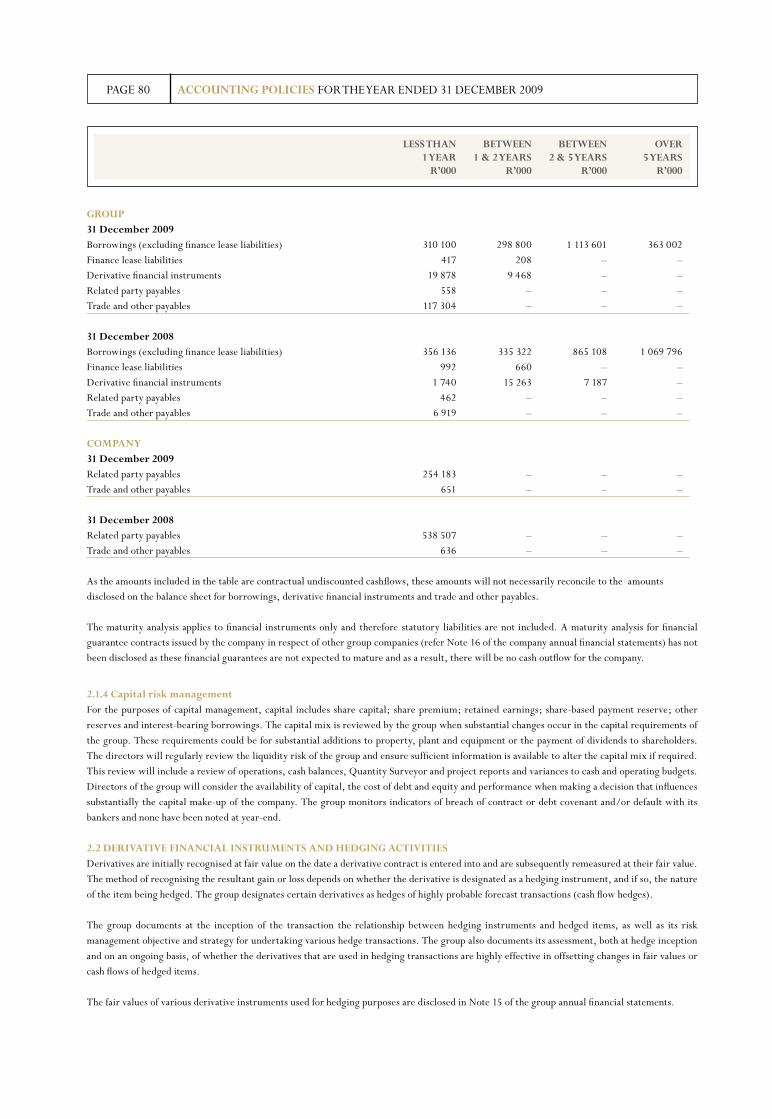
PAGE 80 ACCOUNTING POlICIES FOR THE YEAR ENDED 31 DECEMBER 2009
2.1.4 Capital risk managementFor the purposes of capital management, capital includes share capital; share premium; retained earnings; share-based payment reserve; other reserves and interest-bearing borrowings. The capital mix is reviewed by the group when substantial changes occur in the capital requirements of the group. These requirements could be for substantial additions to property, plant and equipment or the payment of dividends to shareholders. The directors will regularly review the liquidity risk of the group and ensure sufficient information is available to alter the capital mix if required. This review will include a review of operations, cash balances, Quantity Surveyor and project reports and variances to cash and operating budgets. Directors of the group will consider the availability of capital, the cost of debt and equity and performance when making a decision that influences substantially the capital make-up of the company. The group monitors indicators of breach of contract or debt covenant and/or default with its bankers and none have been noted at year-end.
2.2 DERIVATIVE FINANCIAl INSTRUMENTS AND hEDGING ACTIVITIESDerivatives are initially recognised at fair value on the date a derivative contract is entered into and are subsequently remeasured at their fair value. The method of recognising the resultant gain or loss depends on whether the derivative is designated as a hedging instrument, and if so, the nature of the item being hedged. The group designates certain derivatives as hedges of highly probable forecast transactions (cash flow hedges).
The group documents at the inception of the transaction the relationship between hedging instruments and hedged items, as well as its risk management objective and strategy for undertaking various hedge transactions. The group also documents its assessment, both at hedge inception and on an ongoing basis, of whether the derivatives that are used in hedging transactions are highly effective in offsetting changes in fair values or cash flows of hedged items.
The fair values of various derivative instruments used for hedging purposes are disclosed in Note 15 of the group annual financial statements.
lESS ThAN BETWEEN BETWEEN OVER 1 YEAR 1 & 2 YEARS 2 & 5 YEARS 5 YEARS R’000 R’000 R’000 R’000
GROUP31 December 2009Borrowings (excluding finance lease liabilities) 310 100 298 800 1 113 601 363 002Finance lease liabilities 417 208 – –Derivative financial instruments 19 878 9 468 – –Related party payables 558 – – –Trade and other payables 117 304 – – –
31 December 2008Borrowings (excluding finance lease liabilities) 356 136 335 322 865 108 1 069 796Finance lease liabilities 992 660 – –Derivative financial instruments 1 740 15 263 7 187 –Related party payables 462 – – –Trade and other payables 6 919 – – – COMPANY 31 December 2009Related party payables 254 183 – – –Trade and other payables 651 – – – 31 December 2008Related party payables 538 507 – – –Trade and other payables 636 – – – As the amounts included in the table are contractual undiscounted cashflows, these amounts will not necessarily reconcile to the amounts disclosed on the balance sheet for borrowings, derivative financial instruments and trade and other payables. The maturity analysis applies to financial instruments only and therefore statutory liabilities are not included. A maturity analysis for financial guarantee contracts issued by the company in respect of other group companies (refer Note 16 of the company annual financial statements) has not been disclosed as these financial guarantees are not expected to mature and as a result, there will be no cash outflow for the company.
Movements on the hedging reserve in shareholders’ equity are shown in Note 21 of the group annual financial statements. The full fair value of a hedging derivative is split between the current and non-current portions on the face of the balance sheet for the 2009 financial year. Comparative figures have been restated.
2.2.1 Cash flow hedgeThe effective portion of changes in the fair value of derivatives that are designated and qualify as cash flow hedges is recognised in other comprehensive income. The gain or loss relating to the ineffective portion is recognised immediately in the income statement.
Amounts accumulated in other comprehensive income are recycled in the income statement in the periods when the hedged item affects profit or loss . The gain or loss relating to the effective portion of interest rate swaps hedging variable rate borrowings is recognised in the income statement within ‘finance costs’. The gain or loss relating to the ineffective portion is recognised in the income statement. However, when the forecast transaction that is hedged results in the recognition of a non-financial asset the gains and losses previously deferred in other comprehensive income are transferred from other comprehensive income and included in the initial measurement of the cost of the asset. The deferred amounts are ultimately recognised in cost of goods sold in the case of inventory or in depreciation in the case of fixed assets.
When a hedging instrument expires or is sold, or when a hedge no longer meets the criteria for hedge accounting, any cumulative gain or loss existing in other comprehensive income at that time remains in other comprehensive income and is recognised when the forecast transaction is ultimately recognised in the income statement. When a forecast transaction is no longer expected to occur, the cumulative gain or loss that was reported in other comprehensive income is immediately transferred to the income statement.
2.2.2 Derivatives that do not qualify for hedge accountingCertain derivative instruments do not qualify for hedge accounting. Changes in the fair value of any derivative instruments that do not qualify for hedge accounting are recognised immediately in the income statement.
2.3 FAIR VAlUE ESTIMATIONEffective 1 January 2009, the group adopted the amendment to IFRS 7 for financial instruments that are measured on the balance sheet at fair value. This requires disclosure of fair value measurements by level of the following fair value measurement hierarchy:• Quoted prices (unadjusted) in active markets for identical assets or liabilities (level 1).• Inputs other than quoted prices included within level 1 that are observable for the asset or liability, either directly (that is, as prices) or indirectly
(that is, derived from prices) (level 2).• Inputs for the asset or liability that are not based on observable market data (that is, unobservable inputs) (level 3).
PAGE 81ACCOUNTING POlICIES FOR THE YEAR ENDED 31 DECEMBER 2009
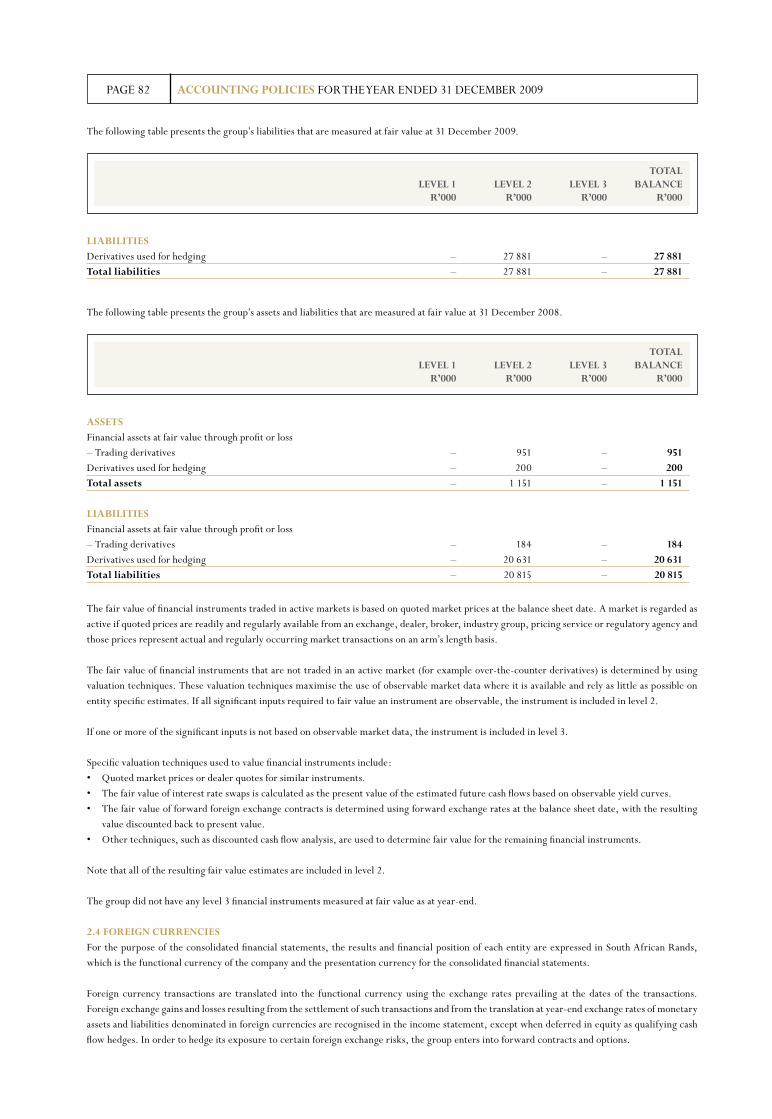
PAGE 82 ACCOUNTING POlICIES FOR THE YEAR ENDED 31 DECEMBER 2009
The fair value of financial instruments traded in active markets is based on quoted market prices at the balance sheet date. A market is regarded as active if quoted prices are readily and regularly available from an exchange, dealer, broker, industry group, pricing service or regulatory agency and those prices represent actual and regularly occurring market transactions on an arm’s length basis.
The fair value of financial instruments that are not traded in an active market (for example over-the-counter derivatives) is determined by using valuation techniques. These valuation techniques maximise the use of observable market data where it is available and rely as little as possible on entity specific estimates. If all significant inputs required to fair value an instrument are observable, the instrument is included in level 2.
If one or more of the significant inputs is not based on observable market data, the instrument is included in level 3.
Specific valuation techniques used to value financial instruments include:• Quoted market prices or dealer quotes for similar instruments.• The fair value of interest rate swaps is calculated as the present value of the estimated future cash flows based on observable yield curves.• The fair value of forward foreign exchange contracts is determined using forward exchange rates at the balance sheet date, with the resulting
value discounted back to present value.• Other techniques, such as discounted cash flow analysis, are used to determine fair value for the remaining financial instruments.
Note that all of the resulting fair value estimates are included in level 2.
The group did not have any level 3 financial instruments measured at fair value as at year-end.
2.4 FOREIGN CURRENCIESFor the purpose of the consolidated financial statements, the results and financial position of each entity are expressed in South African Rands, which is the functional currency of the company and the presentation currency for the consolidated financial statements.
Foreign currency transactions are translated into the functional currency using the exchange rates prevailing at the dates of the transactions. Foreign exchange gains and losses resulting from the settlement of such transactions and from the translation at year-end exchange rates of monetary assets and liabilities denominated in foreign currencies are recognised in the income statement, except when deferred in equity as qualifying cash flow hedges. In order to hedge its exposure to certain foreign exchange risks, the group enters into forward contracts and options.
The following table presents the group’s assets and liabilities that are measured at fair value at 31 December 2008.
The following table presents the group’s liabilities that are measured at fair value at 31 December 2009.
TOTAl lEVEl 1 lEVEl 2 lEVEl 3 BAlANCE R’000 R’000 R’000 R’000
lIABIlITIES Derivatives used for hedging – 27 881 – 27 881Total liabilities – 27 881 – 27 881
TOTAl lEVEl 1 lEVEl 2 lEVEl 3 BAlANCE R’000 R’000 R’000 R’000
ASSETS Financial assets at fair value through profit or loss – Trading derivatives – 951 – 951Derivatives used for hedging – 200 – 200Total assets – 1 151 – 1 151 lIABIlITIES Financial assets at fair value through profit or loss – Trading derivatives – 184 – 184Derivatives used for hedging – 20 631 – 20 631Total liabilities – 20 815 – 20 815
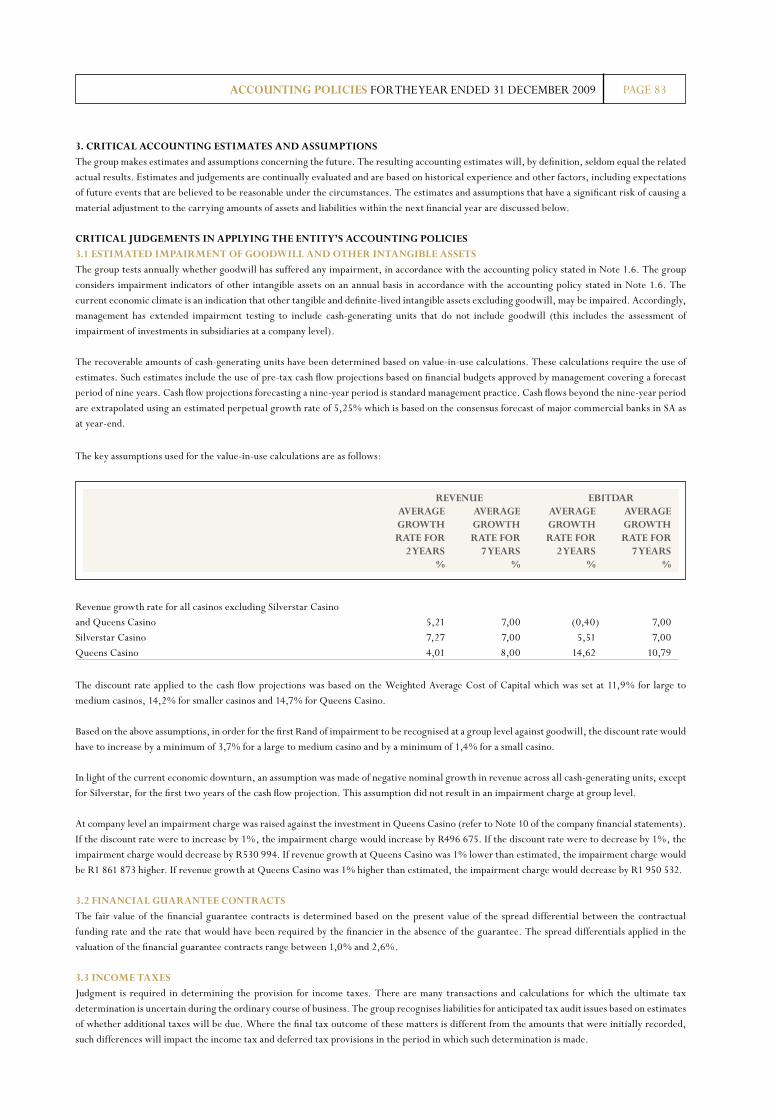
3. CRITICAl ACCOUNTING ESTIMATES AND ASSUMPTIONSThe group makes estimates and assumptions concerning the future. The resulting accounting estimates will, by definition, seldom equal the related actual results. Estimates and judgements are continually evaluated and are based on historical experience and other factors, including expectations of future events that are believed to be reasonable under the circumstances. The estimates and assumptions that have a significant risk of causing a material adjustment to the carrying amounts of assets and liabilities within the next financial year are discussed below.
CRITICAl JUDGEMENTS IN APPlYING ThE ENTITY’S ACCOUNTING POlICIES3.1 ESTIMATED IMPAIRMENT OF GOODWIll AND OThER INTANGIBlE ASSETSThe group tests annually whether goodwill has suffered any impairment, in accordance with the accounting policy stated in Note 1.6. The group considers impairment indicators of other intangible assets on an annual basis in accordance with the accounting policy stated in Note 1.6. The current economic climate is an indication that other tangible and definite-lived intangible assets excluding goodwill, may be impaired. Accordingly, management has extended impairment testing to include cash-generating units that do not include goodwill (this includes the assessment of impairment of investments in subsidiaries at a company level).
The recoverable amounts of cash-generating units have been determined based on value-in-use calculations. These calculations require the use of estimates. Such estimates include the use of pre-tax cash flow projections based on financial budgets approved by management covering a forecast period of nine years. Cash flow projections forecasting a nine-year period is standard management practice. Cash flows beyond the nine-year period are extrapolated using an estimated perpetual growth rate of 5,25% which is based on the consensus forecast of major commercial banks in SA as at year-end.
The discount rate applied to the cash flow projections was based on the Weighted Average Cost of Capital which was set at 11,9% for large to medium casinos, 14,2% for smaller casinos and 14,7% for Queens Casino.
Based on the above assumptions, in order for the first Rand of impairment to be recognised at a group level against goodwill, the discount rate would have to increase by a minimum of 3,7% for a large to medium casino and by a minimum of 1,4% for a small casino.
In light of the current economic downturn, an assumption was made of negative nominal growth in revenue across all cash-generating units, except for Silverstar, for the first two years of the cash flow projection. This assumption did not result in an impairment charge at group level.
At company level an impairment charge was raised against the investment in Queens Casino (refer to Note 10 of the company financial statements). If the discount rate were to increase by 1%, the impairment charge would increase by R496 675. If the discount rate were to decrease by 1%, the impairment charge would decrease by R530 994. If revenue growth at Queens Casino was 1% lower than estimated, the impairment charge would be R1 861 873 higher. If revenue growth at Queens Casino was 1% higher than estimated, the impairment charge would decrease by R1 950 532.
3.2 FINANCIAl GUARANTEE CONTRACTSThe fair value of the financial guarantee contracts is determined based on the present value of the spread differential between the contractual funding rate and the rate that would have been required by the financier in the absence of the guarantee. The spread differentials applied in the valuation of the financial guarantee contracts range between 1,0% and 2,6%.
3.3 INCOME TAXESJudgment is required in determining the provision for income taxes. There are many transactions and calculations for which the ultimate tax determination is uncertain during the ordinary course of business. The group recognises liabilities for anticipated tax audit issues based on estimates of whether additional taxes will be due. Where the final tax outcome of these matters is different from the amounts that were initially recorded, such differences will impact the income tax and deferred tax provisions in the period in which such determination is made.
PAGE 83ACCOUNTING POlICIES FOR THE YEAR ENDED 31 DECEMBER 2009
The key assumptions used for the value-in-use calculations are as follows:
REVENUE EBITDAR AVERAGE AVERAGE AVERAGE AVERAGE GROWTh GROWTh GROWTh GROWTh RATE FOR RATE FOR RATE FOR RATE FOR 2 YEARS 7 YEARS 2 YEARS 7 YEARS % % % %
Revenue growth rate for all casinos excluding Silverstar Casino and Queens Casino 5,21 7,00 (0,40) 7,00Silverstar Casino 7,27 7,00 5,51 7,00Queens Casino 4,01 8,00 14,62 10,79

PAGE 84 ACCOUNTING POlICIES FOR THE YEAR ENDED 31 DECEMBER 2009
3.4 ESTIMATES OF RESIDUAl VAlUES AND USEFUl lIVES OF PROPERTY, PlANT AND EQUIPMENTThe group reassesses annually the residual values and remaining useful lives of significant assets. The residual values of these assets have been estimated as the amount that the group would currently obtain from disposal of each significant asset, in its current location, if the asset were already of the age and in the condition expected at the end of its useful life. The useful life is estimated as the period over which an asset is expected to be available for use by the group.
3.5 GAMING PROVISIONSGaming provisions consist of expected future obligations to customers. The timing of the payments required to settle these obligations is uncertain, as is the eventual recipient of the payment. The group however assumes that these amounts will be paid out in the ongoing operations of the relevant gaming subsidiaries during the next 12 months.
3.6 NET GAMING WINThe group regards the national VAT levied on net gaming win to be comparable with the gaming levies which are paid to provincial gaming boards. These are seen as direct costs of the group as they are borne entirely by the group and have no effect on casino activities from the customer’s perspective. In the casino industry the nature of betting transactions makes it difficult to separate bets placed by customers and winnings paid to customers. It therefore follows that casinos experience practical difficulties reflecting output tax separately from input tax. Accordingly, SARS allows casinos to account for VAT by applying the tax fraction to the net betting transaction. Provincial gaming levies are calculated on a similar basis by applying the tax fraction to the net betting transaction. Any change in either the VAT rate or the provincial gaming levies would be absorbed by the group and would not be recouped from the customer. The group thus treats VAT and other taxes levied on casino winnings as direct costs. These costs are included in net gaming win and are disclosed separately from other expense items on the face of the income statement.
3.7 FAIR VAlUE OF DERIVATIVES AND OThER FINANCIAl INSTRUMENTSThe fair value of derivatives that are not traded in an active market (for example over-the-counter derivatives) is determined by using valuation techniques. The group uses its judgment to select a variety of methods and make assumptions that are mainly based on market conditions existing at each balance sheet date. The group has used discounted cash flow analysis for various available-for-sale financial assets that are not traded in active markets.
3.8 CASh-SETTlED lONG-TERM INCENTIVE PlAN AND EXECUTIVE ShARE APPRECIATION SChEMEThe fair value of the liabilities relating to the cash-settled LTIP and executive share appreciation scheme is determined using valuation techniques performed by independent actuaries that are based on market conditions existing at each balance sheet date. The fair value of the liabilities are also dependent on management assumptions relating to the non-market conditions on the number of units that will ultimately be paid and management’s best estimate of the performance criteria assumptions. (Refer to Note 16 of the group annual financial statements for key assumptions applied.)
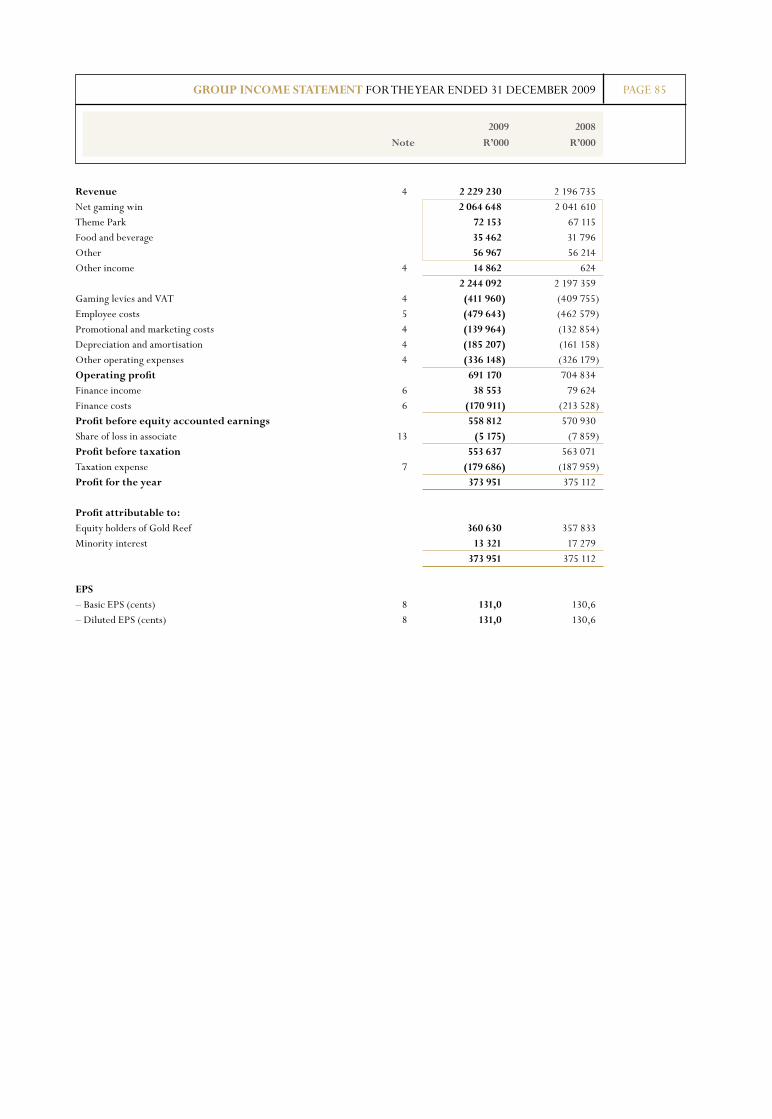
PAGE 85GROUP INCOME STATEMENT FOR THE YEAR ENDED 31 DECEMBER 2009
2009 2008
Note R’000 R’000
Revenue 4 2 229 230 2 196 735 Net gaming win 2 064 648 2 041 610 Theme Park 72 153 67 115 Food and beverage 35 462 31 796 Other 56 967 56 214 Other income 4 14 862 624 2 244 092 2 197 359 Gaming levies and VAT 4 (411 960) (409 755)Employee costs 5 (479 643) (462 579)Promotional and marketing costs 4 (139 964) (132 854)Depreciation and amortisation 4 (185 207) (161 158)Other operating expenses 4 (336 148) (326 179)Operating profit 691 170 704 834 Finance income 6 38 553 79 624 Finance costs 6 (170 911) (213 528)Profit before equity accounted earnings 558 812 570 930 Share of loss in associate 13 (5 175) (7 859)Profit before taxation 553 637 563 071 Taxation expense 7 (179 686) (187 959)Profit for the year 373 951 375 112 Profit attributable to: Equity holders of Gold Reef 360 630 357 833 Minority interest 13 321 17 279 373 951 375 112 EPS – Basic EPS (cents) 8 131,0 130,6 – Diluted EPS (cents) 8 131,0 130,6
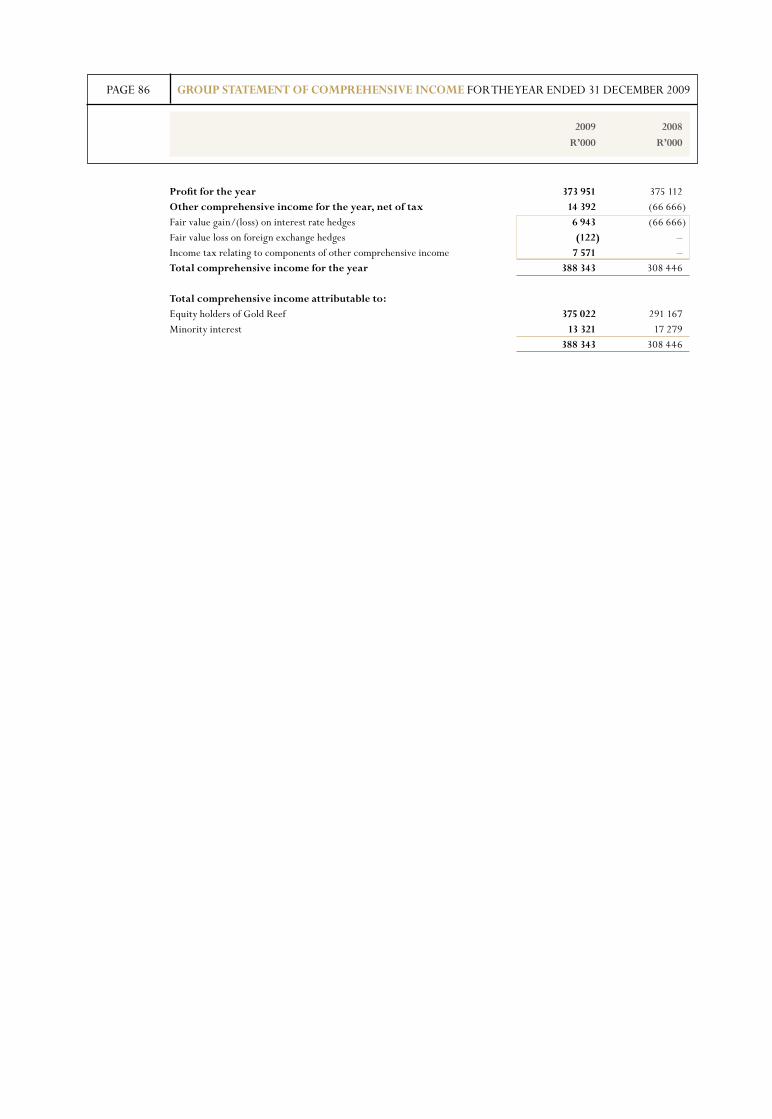
PAGE 86 GROUP STATEMENT OF COMPREhENSIVE INCOME FOR THE YEAR ENDED 31 DECEMBER 2009
2009 2008
R’000 R’000
Profit for the year 373 951 375 112 Other comprehensive income for the year, net of tax 14 392 (66 666)Fair value gain/(loss) on interest rate hedges 6 943 (66 666)Fair value loss on foreign exchange hedges (122) – Income tax relating to components of other comprehensive income 7 571 – Total comprehensive income for the year 388 343 308 446 Total comprehensive income attributable to: Equity holders of Gold Reef 375 022 291 167 Minority interest 13 321 17 279 388 343 308 446

PAGE 87
2009 2008
Note R’000 R’000
GROUP BAlANCE ShEET AS AT 31 DECEMBER 2009
ASSETS Non-current assets Property, plant and equipment 10 2 547 199 2 544 756 Leasehold improvements 11 138 464 122 846 Intangible assets 12 1 184 630 1 186 891 Deferred income tax assets 24 12 510 5 095 Investment in associate 13 22 791 31 332 Share scheme 16.1 47 125 32 949 3 952 719 3 923 869 Current assets Inventories 17 19 250 19 351 Trade and other receivables 18 42 208 29 517 Current tax assets 2 225 6 655 Amounts owing by related parties 28 73 497 Cash and cash equivalents 19 440 175 443 054 503 931 499 074 Total assets 4 456 650 4 422 943 EQUITY AND lIABIlITIES Capital and reserves Share capital 20 5 840 5 840 Share premium 20 1 860 132 1 860 132 Treasury shares 20 (57 825) (70 934) 1 808 147 1 795 038 Share-based payment reserve 388 700 382 445 Other reserves 21 (544 808) (565 066)Retained earnings 979 386 798 858 2 631 425 2 411 275 Minority interest 22 44 526 42 670 Total equity 2 675 951 2 453 945 Non-current liabilities Interest-bearing borrowings 23 1 324 990 1 506 313 Deferred income tax liabilities 24 64 480 53 940 Derivative financial instruments 15 8 616 20 815 Cash-settled share incentive scheme liability 16.3 3 901 – 1 401 987 1 581 068 Current liabilities Trade and other payables 25 153 299 134 830 Provisions 26 33 827 56 541 Current portion of interest-bearing borrowings 23 186 937 188 487 Current income tax liabilities 3 989 7 554 Amounts owing to related parties 28 558 462 Bank overdraft 19 102 56 378 712 387 930 Total equity and liabilities 4 456 650 4 422 943
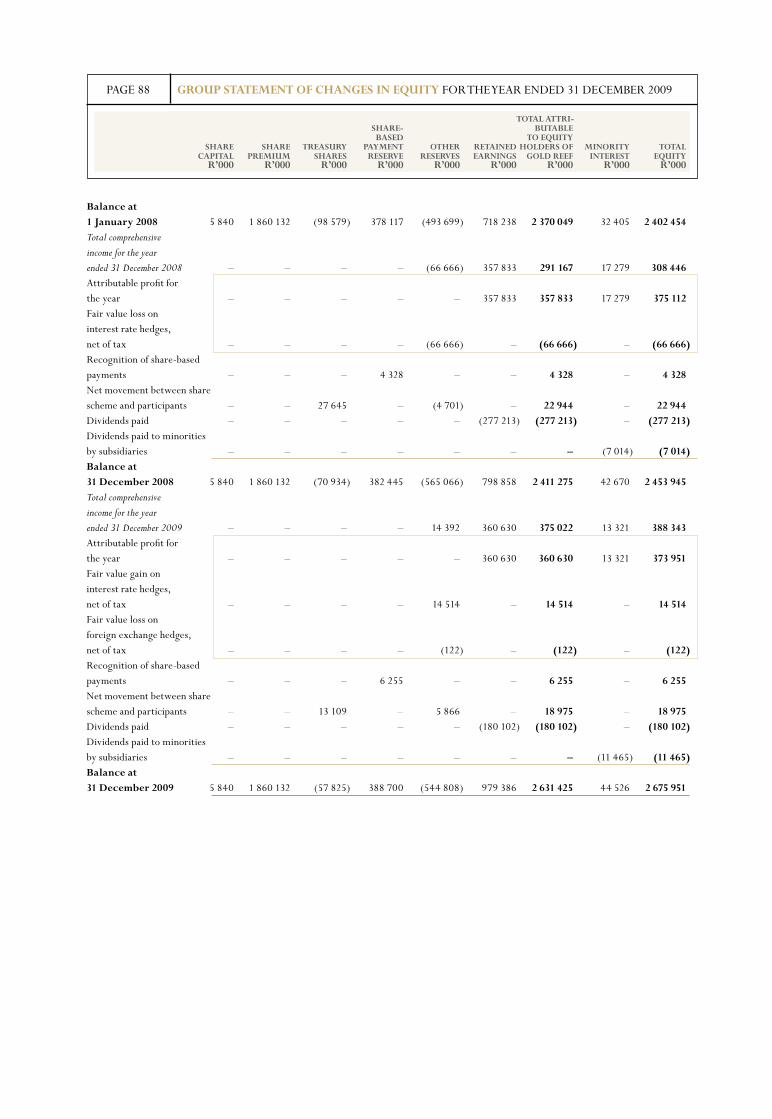
PAGE 88
2009 2008
Note R’000 R’000
GROUP STATEMENT OF ChANGES IN EQUITY FOR THE YEAR ENDED 31 DECEMBER 2009
TOTAl ATTRI- ShARE- BUTABlE BASED TO EQUITY ShARE ShARE TREASURY PAYMENT OThER RETAINED hOlDERS OF MINORITY TOTAl CAPITAl PREMIUM ShARES RESERVE RESERVES EARNINGS GOlD REEF INTEREST EQUITY R’000 R’000 R’000 R’000 R’000 R’000 R’000 R’000 R’000
Balance at 1 January 2008 5 840 1 860 132 (98 579) 378 117 (493 699) 718 238 2 370 049 32 405 2 402 454 Total comprehensive
income for the year
ended 31 December 2008 – – – – (66 666) 357 833 291 167 17 279 308 446 Attributable profit for the year – – – – – 357 833 357 833 17 279 375 112 Fair value loss on interest rate hedges, net of tax – – – – (66 666) – (66 666) – (66 666)Recognition of share-based payments – – – 4 328 – – 4 328 – 4 328 Net movement between share scheme and participants – – 27 645 – (4 701) – 22 944 – 22 944 Dividends paid – – – – – (277 213) (277 213) – (277 213)Dividends paid to minorities by subsidiaries – – – – – – – (7 014) (7 014)Balance at 31 December 2008 5 840 1 860 132 (70 934) 382 445 (565 066) 798 858 2 411 275 42 670 2 453 945 Total comprehensive
income for the year
ended 31 December 2009 – – – – 14 392 360 630 375 022 13 321 388 343 Attributable profit for the year – – – – – 360 630 360 630 13 321 373 951 Fair value gain on interest rate hedges, net of tax – – – – 14 514 – 14 514 – 14 514 Fair value loss onforeign exchange hedges, net of tax – – – – (122) – (122) – (122)Recognition of share-based payments – – – 6 255 – – 6 255 – 6 255 Net movement between share scheme and participants – – 13 109 – 5 866 – 18 975 – 18 975 Dividends paid – – – – – (180 102) (180 102) – (180 102)Dividends paid to minorities by subsidiaries – – – – – – – (11 465) (11 465)Balance at 31 December 2009 5 840 1 860 132 (57 825) 388 700 (544 808) 979 386 2 631 425 44 526 2 675 951
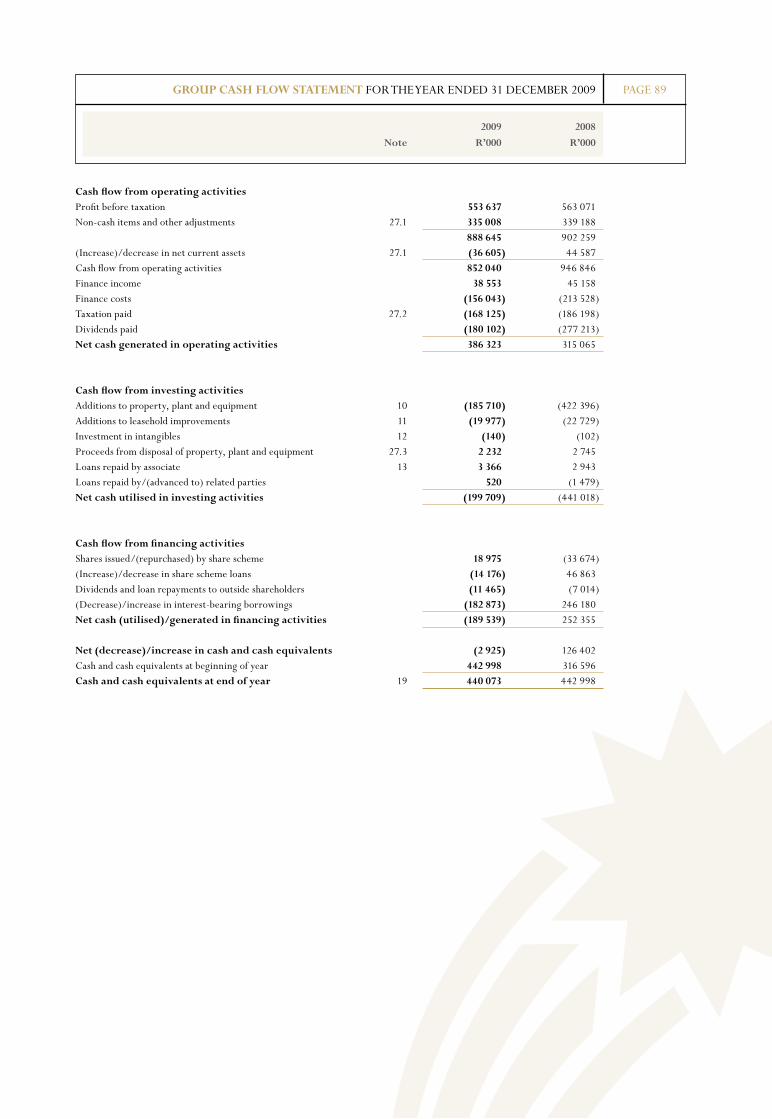
PAGE 89
2009 2008
Note R’000 R’000
GROUP CASh FlOW STATEMENT FOR THE YEAR ENDED 31 DECEMBER 2009
Cash flow from operating activities Profit before taxation 553 637 563 071 Non-cash items and other adjustments 27.1 335 008 339 188 888 645 902 259 (Increase)/decrease in net current assets 27.1 (36 605) 44 587 Cash flow from operating activities 852 040 946 846 Finance income 38 553 45 158 Finance costs (156 043) (213 528)Taxation paid 27.2 (168 125) (186 198)Dividends paid (180 102) (277 213)Net cash generated in operating activities 386 323 315 065 Cash flow from investing activities Additions to property, plant and equipment 10 (185 710) (422 396)Additions to leasehold improvements 11 (19 977) (22 729)Investment in intangibles 12 (140) (102)Proceeds from disposal of property, plant and equipment 27.3 2 232 2 745 Loans repaid by associate 13 3 366 2 943 Loans repaid by/(advanced to) related parties 520 (1 479)Net cash utilised in investing activities (199 709) (441 018) Cash flow from financing activities Shares issued/(repurchased) by share scheme 18 975 (33 674)(Increase)/decrease in share scheme loans (14 176) 46 863 Dividends and loan repayments to outside shareholders (11 465) (7 014)(Decrease)/increase in interest-bearing borrowings (182 873) 246 180 Net cash (utilised)/generated in financing activities (189 539) 252 355 Net (decrease)/increase in cash and cash equivalents (2 925) 126 402 Cash and cash equivalents at beginning of year 442 998 316 596 Cash and cash equivalents at end of year 19 440 073 442 998
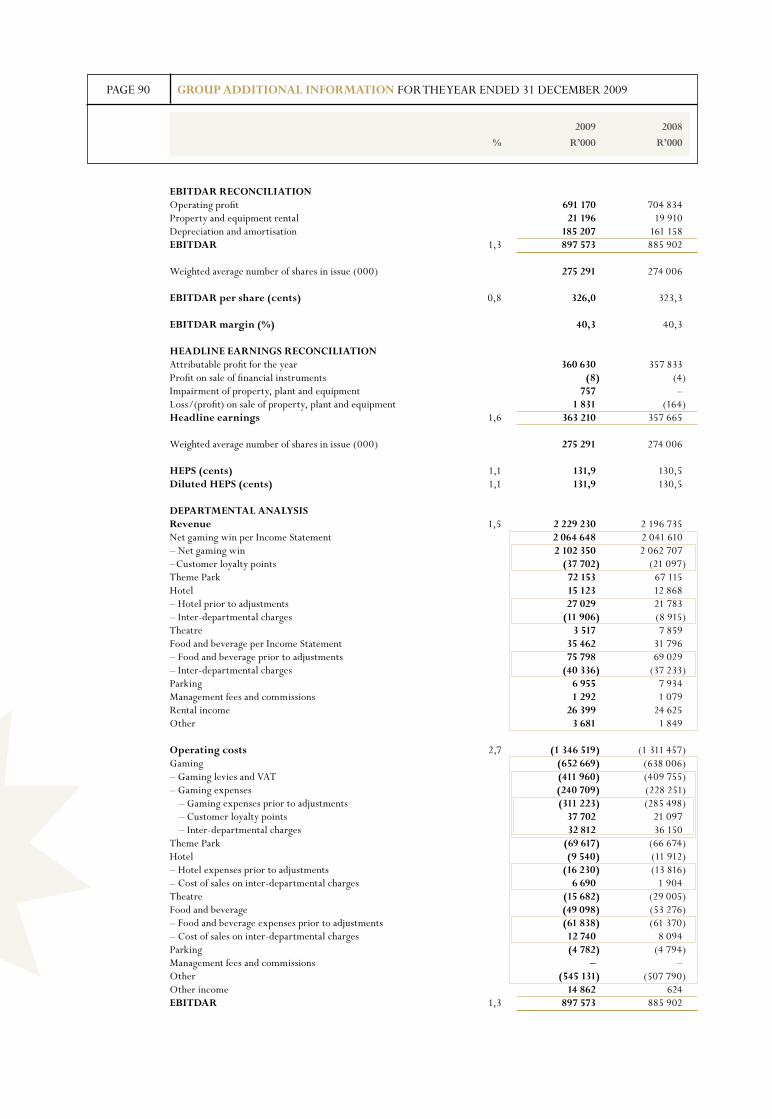
EBITDAR RECONCIlIATION Operating profit 691 170 704 834 Property and equipment rental 21 196 19 910 Depreciation and amortisation 185 207 161 158 EBITDAR 1,3 897 573 885 902
Weighted average number of shares in issue (000) 275 291 274 006 EBITDAR per share (cents) 0,8 326,0 323,3
EBITDAR margin (%) 40,3 40,3
hEADlINE EARNINGS RECONCIlIATION Attributable profit for the year 360 630 357 833 Profit on sale of financial instruments (8) (4)Impairment of property, plant and equipment 757 – Loss/(profit) on sale of property, plant and equipment 1 831 (164)headline earnings 1,6 363 210 357 665
Weighted average number of shares in issue (000) 275 291 274 006
hEPS (cents) 1,1 131,9 130,5 Diluted hEPS (cents) 1,1 131,9 130,5
DEPARTMENTAl ANAlYSIS Revenue 1,5 2 229 230 2 196 735 Net gaming win per Income Statement 2 064 648 2 041 610 – Net gaming win 2 102 350 2 062 707 –Customer loyalty points (37 702) (21 097)Theme Park 72 153 67 115 Hotel 15 123 12 868 – Hotel prior to adjustments 27 029 21 783 – Inter-departmental charges (11 906) (8 915)Theatre 3 517 7 859 Food and beverage per Income Statement 35 462 31 796 – Food and beverage prior to adjustments 75 798 69 029 – Inter-departmental charges (40 336) (37 233)Parking 6 955 7 934 Management fees and commissions 1 292 1 079 Rental income 26 399 24 625 Other 3 681 1 849
Operating costs 2,7 (1 346 519) (1 311 457)Gaming (652 669) (638 006)– Gaming levies and VAT (411 960) (409 755)– Gaming expenses (240 709) (228 251) – Gaming expenses prior to adjustments (311 223) (285 498) – Customer loyalty points 37 702 21 097 – Inter-departmental charges 32 812 36 150Theme Park (69 617) (66 674)Hotel (9 540) (11 912)– Hotel expenses prior to adjustments (16 230) (13 816)– Cost of sales on inter-departmental charges 6 690 1 904 Theatre (15 682) (29 005)Food and beverage (49 098) (53 276)– Food and beverage expenses prior to adjustments (61 838) (61 370)– Cost of sales on inter-departmental charges 12 740 8 094 Parking (4 782) (4 794)Management fees and commissions – – Other (545 131) (507 790)Other income 14 862 624 EBITDAR 1,3 897 573 885 902
PAGE 90
2009 2008
% R’000 R’000
GROUP ADDITIONAl INFORMATION FOR THE YEAR ENDED 31 DECEMBER 2009
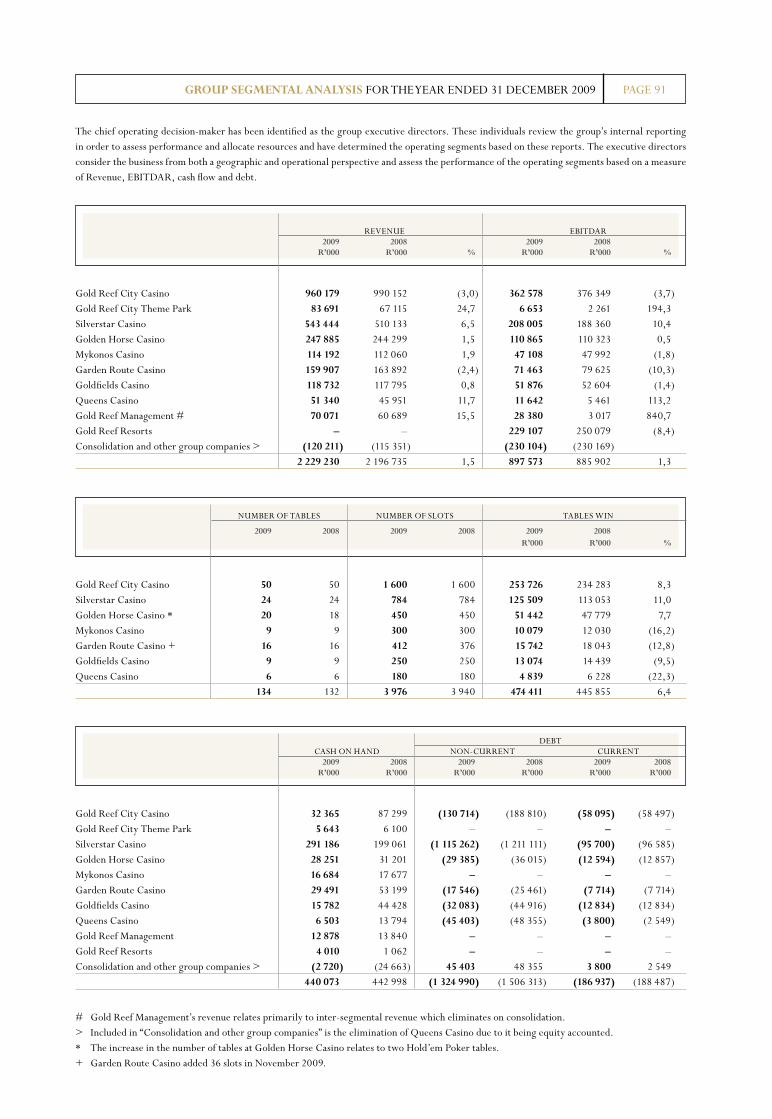
PAGE 91GROUP SEGMENTAl ANAlYSIS FOR THE YEAR ENDED 31 DECEMBER 2009
REVENUE EBITDAR 2009 2008 2009 2008 R’000 R’000 % R’000 R’000 %
NUMBER OF TABLES NUMBER OF SLOTS TABLES WIN
2009 2008 2009 2008 2009 2008 R’000 R’000 %
DEBT CASH ON HAND NON-CURRENT CURRENT 2009 2008 2009 2008 2009 2008 R’000 R’000 R’000 R’000 R’000 R’000
Gold Reef City Casino 960 179 990 152 (3,0) 362 578 376 349 (3,7) Gold Reef City Theme Park 83 691 67 115 24,7 6 653 2 261 194,3 Silverstar Casino 543 444 510 133 6,5 208 005 188 360 10,4 Golden Horse Casino 247 885 244 299 1,5 110 865 110 323 0,5 Mykonos Casino 114 192 112 060 1,9 47 108 47 992 (1,8) Garden Route Casino 159 907 163 892 (2,4) 71 463 79 625 (10,3) Goldfields Casino 118 732 117 795 0,8 51 876 52 604 (1,4) Queens Casino 51 340 45 951 11,7 11 642 5 461 113,2 Gold Reef Management # 70 071 60 689 15,5 28 380 3 017 840,7 Gold Reef Resorts – – 229 107 250 079 (8,4) Consolidation and other group companies > (120 211) (115 351) (230 104) (230 169) 2 229 230 2 196 735 1,5 897 573 885 902 1,3
Gold Reef City Casino 50 50 1 600 1 600 253 726 234 283 8,3 Silverstar Casino 24 24 784 784 125 509 113 053 11,0 Golden Horse Casino * 20 18 450 450 51 442 47 779 7,7 Mykonos Casino 9 9 300 300 10 079 12 030 (16,2)Garden Route Casino + 16 16 412 376 15 742 18 043 (12,8)Goldfields Casino 9 9 250 250 13 074 14 439 (9,5)Queens Casino 6 6 180 180 4 839 6 228 (22,3) 134 132 3 976 3 940 474 411 445 855 6,4
Gold Reef City Casino 32 365 87 299 (130 714) (188 810) (58 095) (58 497)Gold Reef City Theme Park 5 643 6 100 – – – – Silverstar Casino 291 186 199 061 (1 115 262) (1 211 111) (95 700) (96 585)Golden Horse Casino 28 251 31 201 (29 385) (36 015) (12 594) (12 857)Mykonos Casino 16 684 17 677 – – – – Garden Route Casino 29 491 53 199 (17 546) (25 461) (7 714) (7 714)Goldfields Casino 15 782 44 428 (32 083) (44 916) (12 834) (12 834)Queens Casino 6 503 13 794 (45 403) (48 355) (3 800) (2 549)Gold Reef Management 12 878 13 840 – – – – Gold Reef Resorts 4 010 1 062 – – – – Consolidation and other group companies > (2 720) (24 663) 45 403 48 355 3 800 2 549 440 073 442 998 (1 324 990) (1 506 313) (186 937) (188 487)
The chief operating decision-maker has been identified as the group executive directors. These individuals review the group’s internal reporting in order to assess performance and allocate resources and have determined the operating segments based on these reports. The executive directors consider the business from both a geographic and operational perspective and assess the performance of the operating segments based on a measure of Revenue, EBITDAR, cash flow and debt.
# Gold Reef Management’s revenue relates primarily to inter-segmental revenue which eliminates on consolidation.> Included in “Consolidation and other group companies” is the elimination of Queens Casino due to it being equity accounted.* The increase in the number of tables at Golden Horse Casino relates to two Hold’em Poker tables. + Garden Route Casino added 36 slots in November 2009.
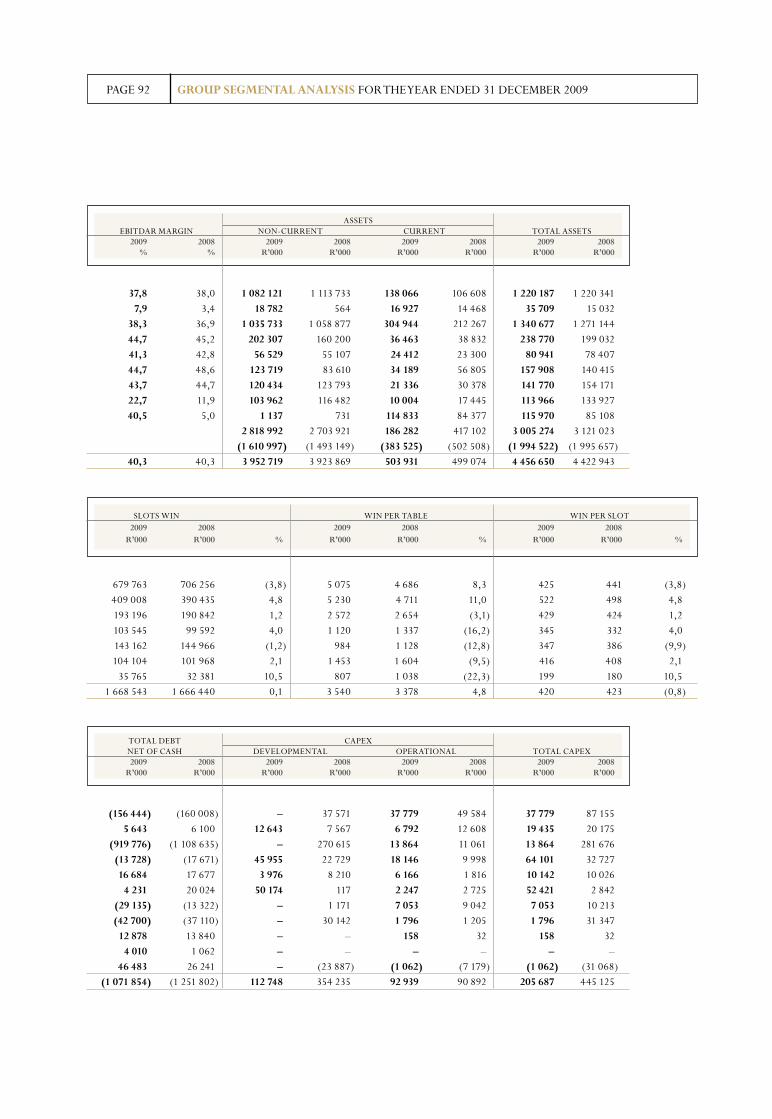
PAGE 92
ASSETS EBITDAR MARGIN NON-CURRENT CURRENT TOTAL ASSETS 2009 2008 2009 2008 2009 2008 2009 2008 % % R’000 R’000 R’000 R’000 R’000 R’000
SLOTS WIN WIN PER TABLE WIN PER SLOT 2009 2008 2009 2008 2009 2008 R’000 R’000 % R’000 R’000 % R’000 R’000 %
TOTAL DEBT CAPEX NET OF CASH DEVELOPMENTAL OPERATIONAL TOTAL CAPEX 2009 2008 2009 2008 2009 2008 2009 2008 R’000 R’000 R’000 R’000 R’000 R’000 R’000 R’000
GROUP SEGMENTAl ANAlYSIS FOR THE YEAR ENDED 31 DECEMBER 2009
37,8 38,0 1 082 121 1 113 733 138 066 106 608 1 220 187 1 220 341 7,9 3,4 18 782 564 16 927 14 468 35 709 15 032 38,3 36,9 1 035 733 1 058 877 304 944 212 267 1 340 677 1 271 144 44,7 45,2 202 307 160 200 36 463 38 832 238 770 199 032 41,3 42,8 56 529 55 107 24 412 23 300 80 941 78 407 44,7 48,6 123 719 83 610 34 189 56 805 157 908 140 415 43,7 44,7 120 434 123 793 21 336 30 378 141 770 154 171 22,7 11,9 103 962 116 482 10 004 17 445 113 966 133 927 40,5 5,0 1 137 731 114 833 84 377 115 970 85 108 2 818 992 2 703 921 186 282 417 102 3 005 274 3 121 023 (1 610 997) (1 493 149) (383 525) (502 508) (1 994 522) (1 995 657) 40,3 40,3 3 952 719 3 923 869 503 931 499 074 4 456 650 4 422 943
679 763 706 256 (3,8) 5 075 4 686 8,3 425 441 (3,8) 409 008 390 435 4,8 5 230 4 711 11,0 522 498 4,8 193 196 190 842 1,2 2 572 2 654 (3,1) 429 424 1,2 103 545 99 592 4,0 1 120 1 337 (16,2) 345 332 4,0 143 162 144 966 (1,2) 984 1 128 (12,8) 347 386 (9,9) 104 104 101 968 2,1 1 453 1 604 (9,5) 416 408 2,1 35 765 32 381 10,5 807 1 038 (22,3) 199 180 10,5 1 668 543 1 666 440 0,1 3 540 3 378 4,8 420 423 (0,8)
(156 444) (160 008) – 37 571 37 779 49 584 37 779 87 155 5 643 6 100 12 643 7 567 6 792 12 608 19 435 20 175 (919 776) (1 108 635) – 270 615 13 864 11 061 13 864 281 676 (13 728) (17 671) 45 955 22 729 18 146 9 998 64 101 32 727 16 684 17 677 3 976 8 210 6 166 1 816 10 142 10 026 4 231 20 024 50 174 117 2 247 2 725 52 421 2 842 (29 135) (13 322) – 1 171 7 053 9 042 7 053 10 213 (42 700) (37 110) – 30 142 1 796 1 205 1 796 31 347 12 878 13 840 – – 158 32 158 32 4 010 1 062 – – – – – – 46 483 26 241 – (23 887) (1 062) (7 179) (1 062) (31 068) (1 071 854) (1 251 802) 112 748 354 235 92 939 90 892 205 687 445 125
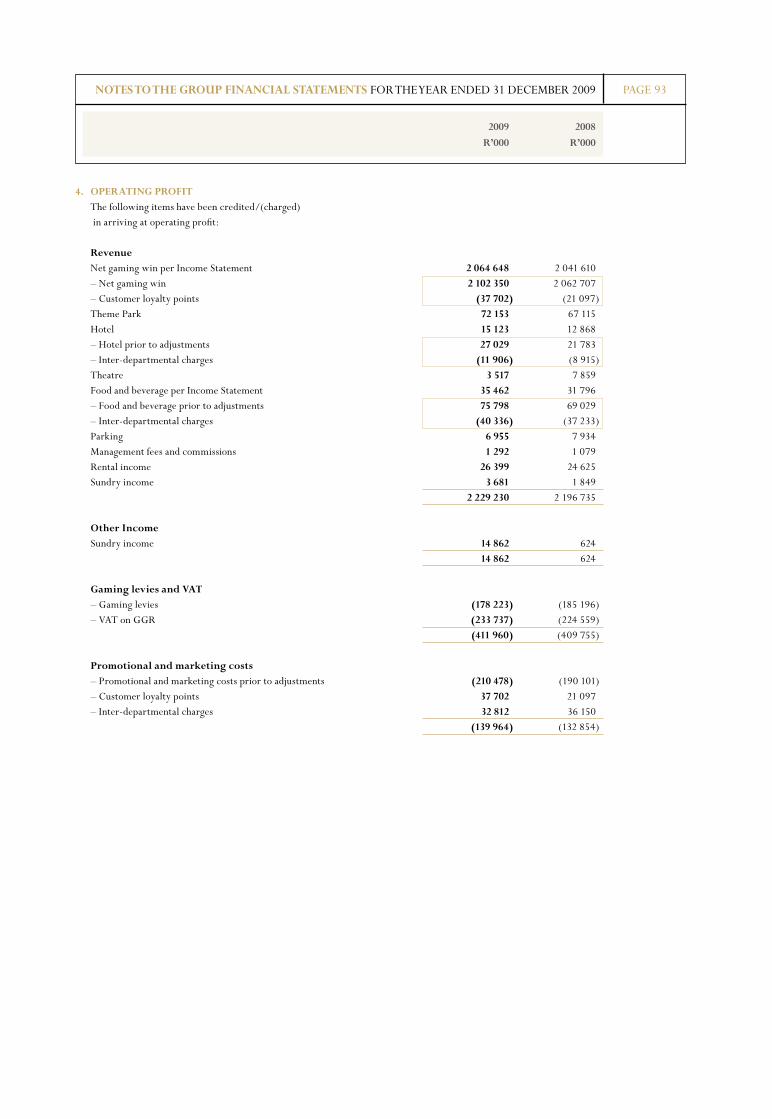
PAGE 93NOTES TO ThE GROUP FINANCIAl STATEMENTS FOR THE YEAR ENDED 31 DECEMBER 2009
2009 2008
R’000 R’000
4. OPERATING PROFIT The following items have been credited/(charged) in arriving at operating profit:
Revenue Net gaming win per Income Statement 2 064 648 2 041 610 – Net gaming win 2 102 350 2 062 707 – Customer loyalty points (37 702) (21 097) Theme Park 72 153 67 115 Hotel 15 123 12 868 – Hotel prior to adjustments 27 029 21 783 – Inter-departmental charges (11 906) (8 915) Theatre 3 517 7 859 Food and beverage per Income Statement 35 462 31 796 – Food and beverage prior to adjustments 75 798 69 029 – Inter-departmental charges (40 336) (37 233) Parking 6 955 7 934 Management fees and commissions 1 292 1 079 Rental income 26 399 24 625 Sundry income 3 681 1 849 2 229 230 2 196 735 Other Income Sundry income 14 862 624 14 862 624 Gaming levies and VAT – Gaming levies (178 223) (185 196) – VAT on GGR (233 737) (224 559) (411 960) (409 755) Promotional and marketing costs – Promotional and marketing costs prior to adjustments (210 478) (190 101) – Customer loyalty points 37 702 21 097 – Inter-departmental charges 32 812 36 150 (139 964) (132 854)
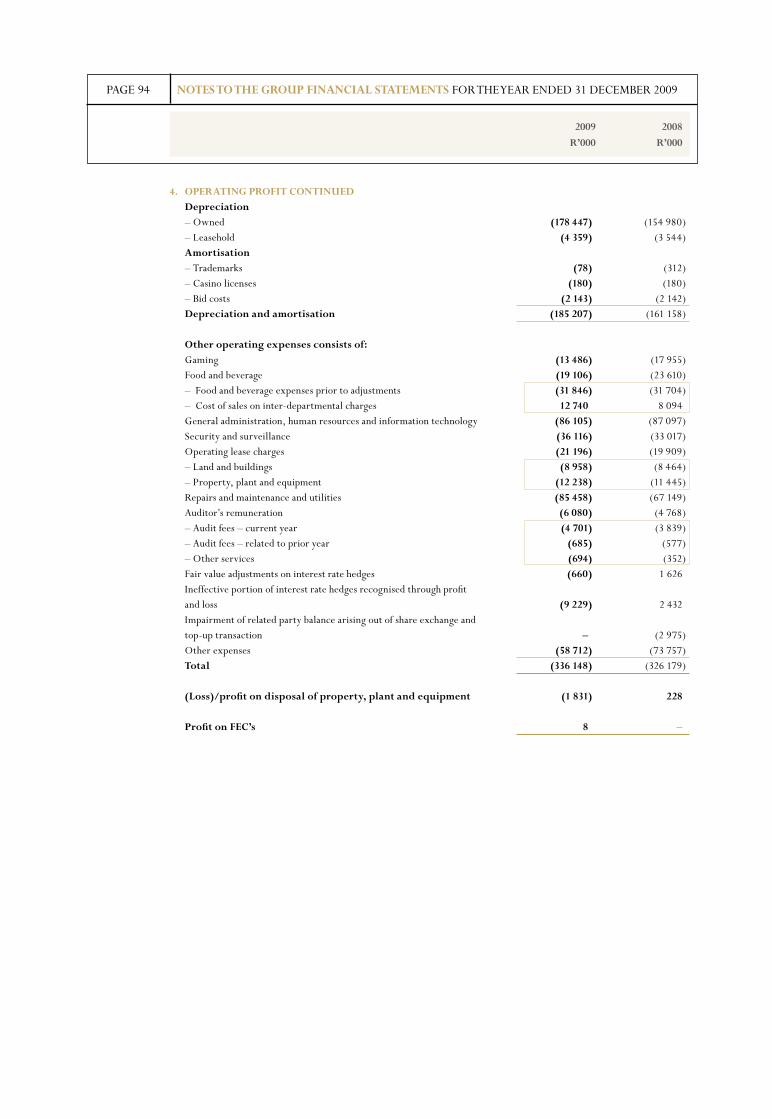
PAGE 94 NOTES TO ThE GROUP FINANCIAl STATEMENTS FOR THE YEAR ENDED 31 DECEMBER 2009
2009 2008
R’000 R’000
4. OPERATING PROFIT CONTINUED Depreciation – Owned (178 447) (154 980) – Leasehold (4 359) (3 544) Amortisation – Trademarks (78) (312) – Casino licenses (180) (180) – Bid costs (2 143) (2 142) Depreciation and amortisation (185 207) (161 158) Other operating expenses consists of: Gaming (13 486) (17 955) Food and beverage (19 106) (23 610) – Food and beverage expenses prior to adjustments (31 846) (31 704) – Cost of sales on inter-departmental charges 12 740 8 094 General administration, human resources and information technology (86 105) (87 097) Security and surveillance (36 116) (33 017) Operating lease charges (21 196) (19 909) – Land and buildings (8 958) (8 464) – Property, plant and equipment (12 238) (11 445) Repairs and maintenance and utilities (85 458) (67 149) Auditor’s remuneration (6 080) (4 768) – Audit fees – current year (4 701) (3 839) – Audit fees – related to prior year (685) (577) – Other services (694) (352) Fair value adjustments on interest rate hedges (660) 1 626 Ineffective portion of interest rate hedges recognised through profit and loss (9 229) 2 432 Impairment of related party balance arising out of share exchange and top-up transaction – (2 975) Other expenses (58 712) (73 757) Total (336 148) (326 179) (loss)/profit on disposal of property, plant and equipment (1 831) 228 Profit on FEC’s 8 –
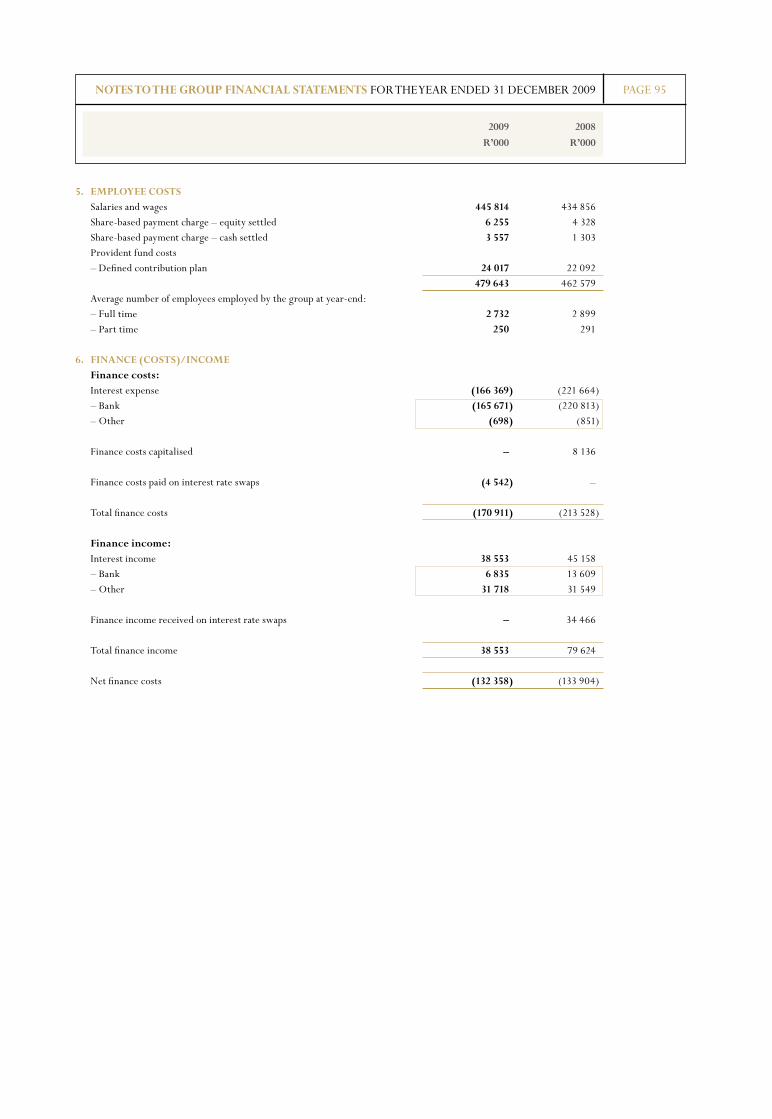
PAGE 95
2009 2008
R’000 R’000
NOTES TO ThE GROUP FINANCIAl STATEMENTS FOR THE YEAR ENDED 31 DECEMBER 2009
5. EMPlOYEE COSTS Salaries and wages 445 814 434 856 Share-based payment charge – equity settled 6 255 4 328 Share-based payment charge – cash settled 3 557 1 303 Provident fund costs – Defined contribution plan 24 017 22 092 479 643 462 579 Average number of employees employed by the group at year-end: – Full time 2 732 2 899 – Part time 250 291 6. FINANCE (COSTS)/INCOME Finance costs: Interest expense (166 369) (221 664) – Bank (165 671) (220 813) – Other (698) (851) Finance costs capitalised – 8 136 Finance costs paid on interest rate swaps (4 542) – Total finance costs (170 911) (213 528)
Finance income: Interest income 38 553 45 158 – Bank 6 835 13 609 – Other 31 718 31 549 Finance income received on interest rate swaps – 34 466 Total finance income 38 553 79 624
Net finance costs (132 358) (133 904)
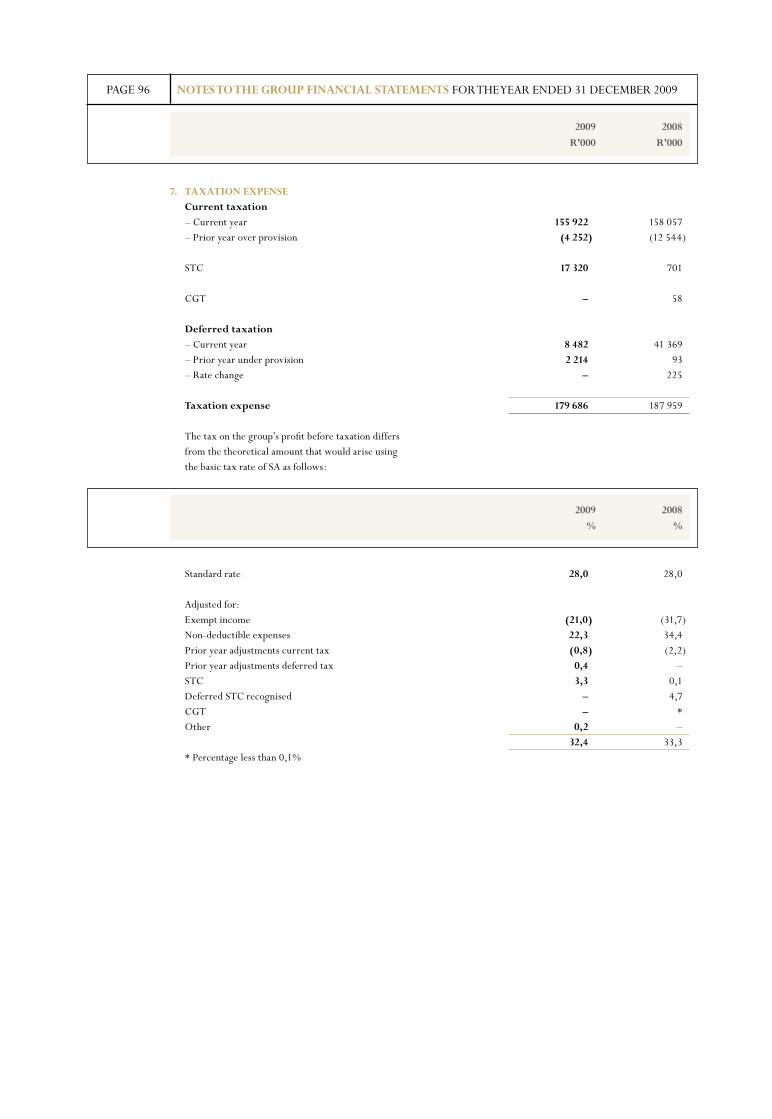
PAGE 96
2009 2008
R’000 R’000
NOTES TO ThE GROUP FINANCIAl STATEMENTS FOR THE YEAR ENDED 31 DECEMBER 2009
7. TAXATION EXPENSE Current taxation – Current year 155 922 158 057 – Prior year over provision (4 252) (12 544) STC 17 320 701 CGT – 58 Deferred taxation – Current year 8 482 41 369 – Prior year under provision 2 214 93 – Rate change – 225 Taxation expense 179 686 187 959 The tax on the group’s profit before taxation differs from the theoretical amount that would arise using the basic tax rate of SA as follows:
Standard rate 28,0 28,0 Adjusted for: Exempt income (21,0) (31,7) Non-deductible expenses 22,3 34,4 Prior year adjustments current tax (0,8) (2,2) Prior year adjustments deferred tax 0,4 – STC 3,3 0,1 Deferred STC recognised – 4,7 CGT – * Other 0,2 – 32,4 33,3 * Percentage less than 0,1%
2009 2008
% %
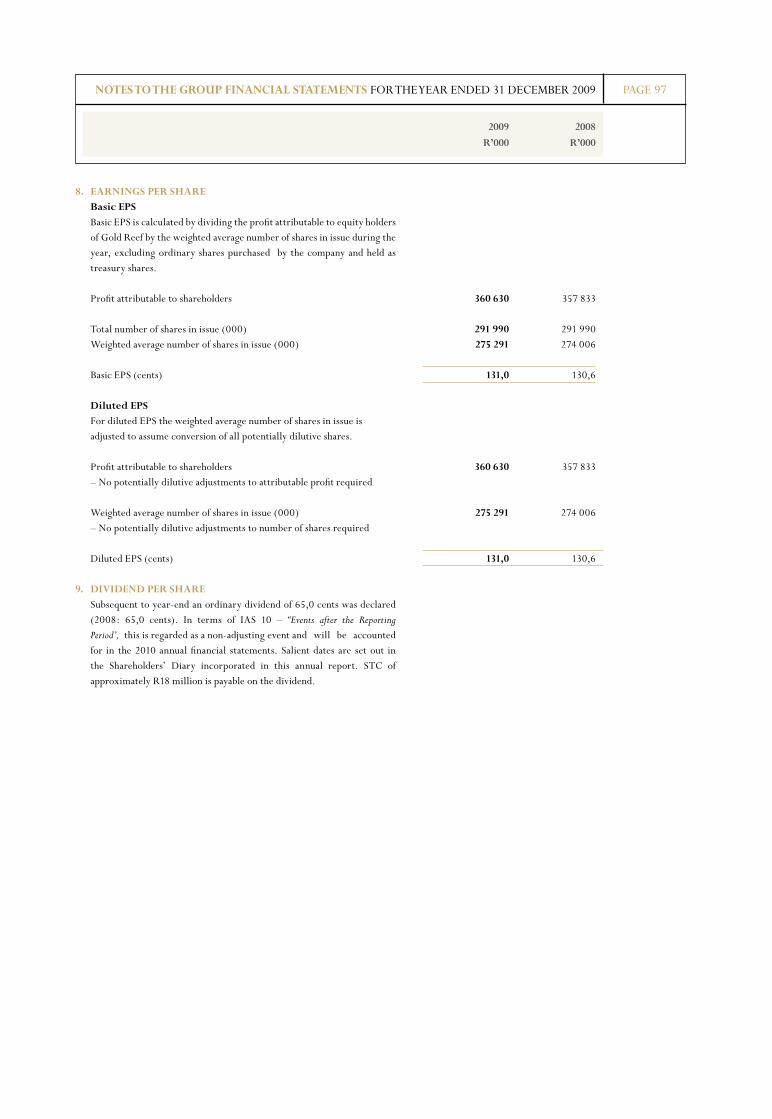
8. EARNINGS PER ShARE Basic EPS Basic EPS is calculated by dividing the profit attributable to equity holders
of Gold Reef by the weighted average number of shares in issue during the year, excluding ordinary shares purchased by the company and held as treasury shares.
Profit attributable to shareholders 360 630 357 833 Total number of shares in issue (000) 291 990 291 990 Weighted average number of shares in issue (000) 275 291 274 006 Basic EPS (cents) 131,0 130,6 Diluted EPS For diluted EPS the weighted average number of shares in issue is
adjusted to assume conversion of all potentially dilutive shares. Profit attributable to shareholders 360 630 357 833 – No potentially dilutive adjustments to attributable profit required Weighted average number of shares in issue (000) 275 291 274 006 – No potentially dilutive adjustments to number of shares required Diluted EPS (cents) 131,0 130,6
9. DIVIDEND PER ShARE Subsequent to year-end an ordinary dividend of 65,0 cents was declared
(2008: 65,0 cents). In terms of IAS 10 – “Events after the Reporting
Period’, this is regarded as a non-adjusting event and will be accounted for in the 2010 annual financial statements. Salient dates are set out in the Shareholders’ Diary incorporated in this annual report. STC of approximately R18 million is payable on the dividend.
PAGE 97NOTES TO ThE GROUP FINANCIAl STATEMENTS FOR THE YEAR ENDED 31 DECEMBER 2009
2009 2008
R’000 R’000

PAGE 98
FURNITURE, FITTINGS PlANT AND CAPITAl ThEME CASINO AND OThER COMPUTER WORK IN lAND AND PARK EQUIPMENT MAChINERY EQUIPMENT EQUIPMENT PROGRESS BUIlDINGS RIDES TOTAl R’000 R’000 R’000 R’000 R’000 R’000 R’000 R’000
10. PROPERTY, PlANT AND EQUIPMENT For the year ended 31 December 2009 At beginning of year 267 486 175 192 73 255 43 189 19 993 1 890 169 75 472 2 544 756 Additions 68 222 38 078 26 804 14 649 – 22 142 15 815 185 710 Transfers in/(out) (4 042) 13 691 44 591 4 076 (19 993) (29 519) (8 804) – Disposals (1 697) (92) (2 209) (45) – (20) – (4 063) Write-offs – – (52) – – – (705) (757) Depreciation (84 606) (29 583) (30 250) (21 367) – (8 712) (3 929) (178 447) At end of year 245 363 197 286 112 139 40 502 – 1 874 060 77 849 2 547 199 At 31 December 2009 Cost 622 488 353 903 240 629 142 253 – 1 954 187 97 421 3 410 881 Accumulated depreciation (377 125) (156 617) (128 490) (101 751) – (80 127) (19 572) (863 682) Closing carrying value 245 363 197 286 112 139 40 502 – 1 874 060 77 849 2 547 199 For the year ended 31 December 2008 At beginning of year 260 833 38 000 82 004 46 045 486 992 1 285 923 80 399 2 280 196 Additions and finance costs capitalised 91 273 20 999 24 647 13 122 208 995 51 720 11 640 422 396 Transfers in/(out) – 136 697 (13 843) – (672 861) 563 635 (13 628) – Disposals (1 407) – (151) (17) – (942) – (2 517) Write-offs (339) – – – – – – (339) Depreciation (82 874) (20 504) (19 402) (15 961) (3 133) (10 167) (2 939) (154 980) At end of year 267 486 175 192 73 255 43 189 19 993 1 890 169 75 472 2 544 756 At 31 December 2008 Cost 582 454 303 444 176 923 124 028 23 165 1 961 584 91 115 3 262 713 Accumulated depreciation (314 968) (128 252) (103 668) (80 839) (3 172) (71 415) (15 643) (717 957) Closing carrying value 267 486 175 192 73 255 43 189 19 993 1 890 169 75 472 2 544 756 At 1 January 2008 Cost 519 598 145 751 173 978 113 456 487 031 1 347 171 93 103 2 880 088 Accumulated depreciation (258 765) (107 751) (91 974) (67 411) (39) (61 248) (12 704) (599 892) Closing carrying value 260 833 38 000 82 004 46 045 486 992 1 285 923 80 399 2 280 196 Borrowing costs of RNil (2008: R8,1 million) arising on financing specifically entered into for the construction of new casinos were
capitalised during the year and are included in ‘additions and finance costs capitalised’ in land and buildings. Finance costs capitalised are matched with the net borrowing cost of the loan used to finance a specific area of construction prior to completion.
Net carrying value of property, plant and equipment held under finance leases is R0,5 million (2008: R1,6 million).
A register of land and buildings is available for inspection at Gold Reef’s offices.
NOTES TO ThE GROUP FINANCIAl STATEMENTS FOR THE YEAR ENDED 31 DECEMBER 2009
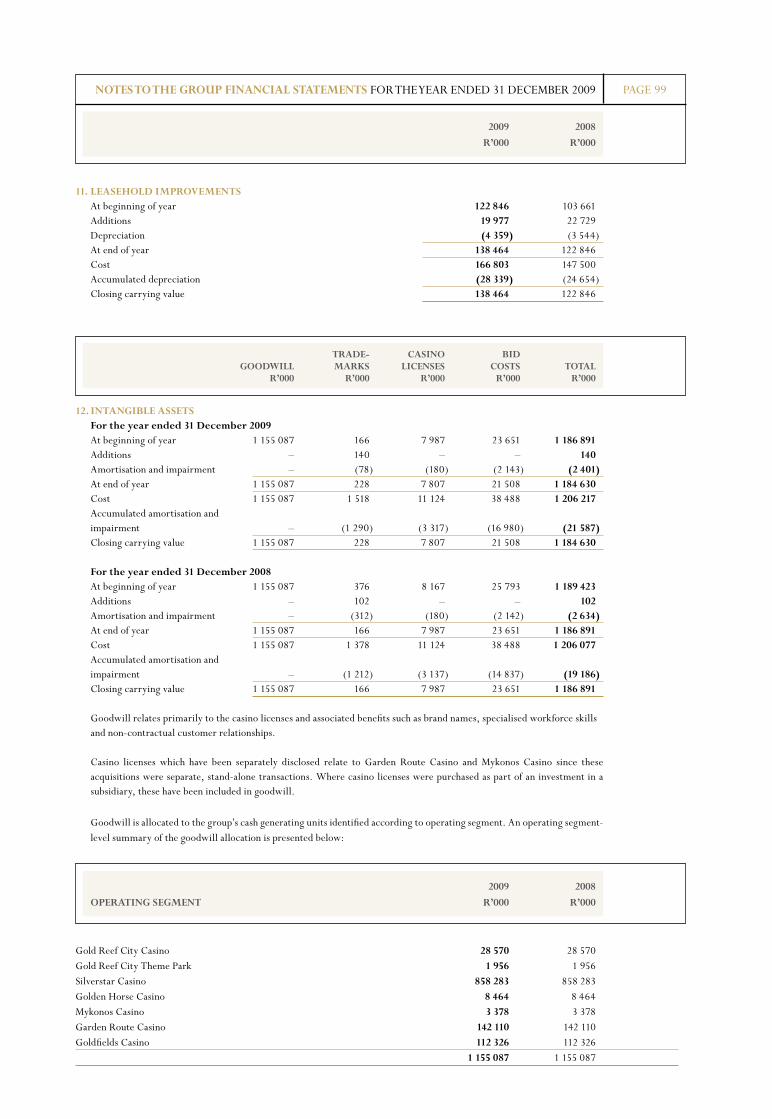
PAGE 99
2009 2008
R’000 R’000
11. lEASEhOlD IMPROVEMENTS At beginning of year 122 846 103 661 Additions 19 977 22 729 Depreciation (4 359) (3 544) At end of year 138 464 122 846 Cost 166 803 147 500 Accumulated depreciation (28 339) (24 654) Closing carrying value 138 464 122 846
12. INTANGIBlE ASSETS For the year ended 31 December 2009 At beginning of year 1 155 087 166 7 987 23 651 1 186 891 Additions – 140 – – 140 Amortisation and impairment – (78) (180) (2 143) (2 401) At end of year 1 155 087 228 7 807 21 508 1 184 630 Cost 1 155 087 1 518 11 124 38 488 1 206 217 Accumulated amortisation and impairment – (1 290) (3 317) (16 980) (21 587) Closing carrying value 1 155 087 228 7 807 21 508 1 184 630 For the year ended 31 December 2008 At beginning of year 1 155 087 376 8 167 25 793 1 189 423 Additions – 102 – – 102 Amortisation and impairment – (312) (180) (2 142) (2 634) At end of year 1 155 087 166 7 987 23 651 1 186 891 Cost 1 155 087 1 378 11 124 38 488 1 206 077 Accumulated amortisation and impairment – (1 212) (3 137) (14 837) (19 186) Closing carrying value 1 155 087 166 7 987 23 651 1 186 891 Goodwill relates primarily to the casino licenses and associated benefits such as brand names, specialised workforce skills
and non-contractual customer relationships. Casino licenses which have been separately disclosed relate to Garden Route Casino and Mykonos Casino since these
acquisitions were separate, stand-alone transactions. Where casino licenses were purchased as part of an investment in a subsidiary, these have been included in goodwill.
NOTES TO ThE GROUP FINANCIAl STATEMENTS FOR THE YEAR ENDED 31 DECEMBER 2009
TRADE- CASINO BID GOODWIll MARKS lICENSES COSTS TOTAl R’000 R’000 R’000 R’000 R’000
Goodwill is allocated to the group’s cash generating units identified according to operating segment. An operating segment-level summary of the goodwill allocation is presented below:
2009 2008
OPERATING SEGMENT R’000 R’000
Gold Reef City Casino 28 570 28 570 Gold Reef City Theme Park 1 956 1 956 Silverstar Casino 858 283 858 283 Golden Horse Casino 8 464 8 464 Mykonos Casino 3 378 3 378 Garden Route Casino 142 110 142 110 Goldfields Casino 112 326 112 326 1 155 087 1 155 087
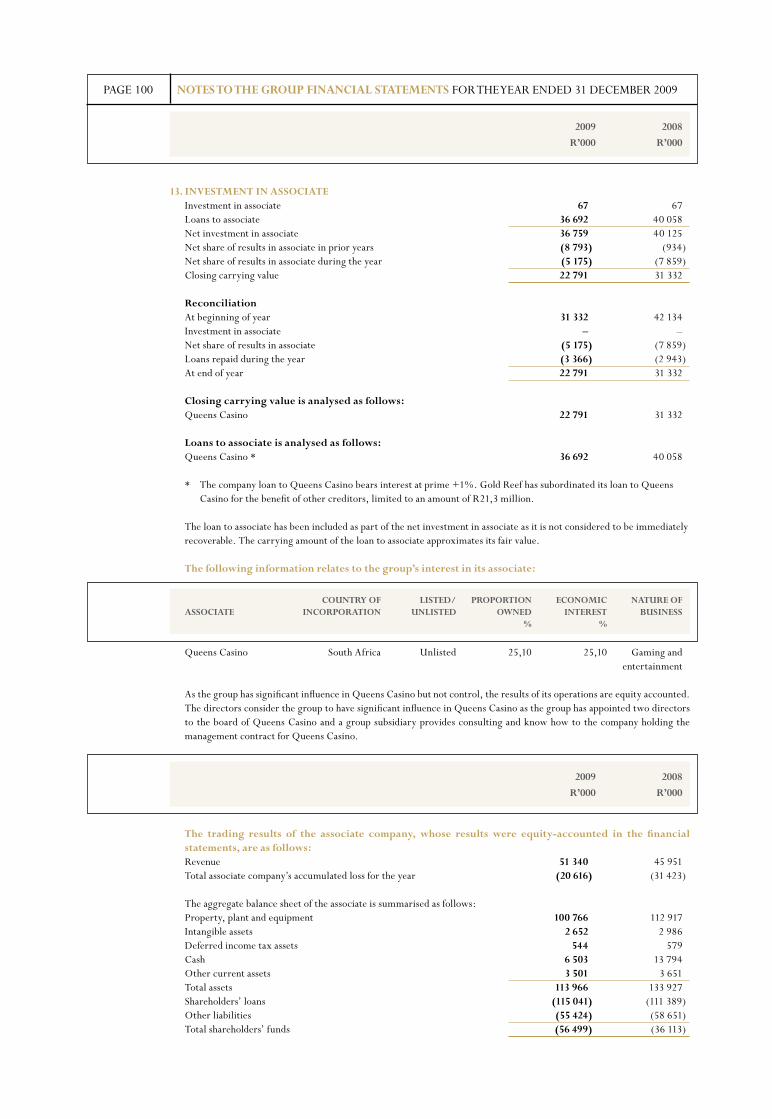
PAGE 100
2009 2008
R’000 R’000
13. INVESTMENT IN ASSOCIATE Investment in associate 67 67 Loans to associate 36 692 40 058 Net investment in associate 36 759 40 125 Net share of results in associate in prior years (8 793) (934) Net share of results in associate during the year (5 175) (7 859) Closing carrying value 22 791 31 332
Reconciliation At beginning of year 31 332 42 134 Investment in associate – – Net share of results in associate (5 175) (7 859) Loans repaid during the year (3 366) (2 943) At end of year 22 791 31 332 Closing carrying value is analysed as follows: Queens Casino 22 791 31 332 loans to associate is analysed as follows: Queens Casino * 36 692 40 058 * The company loan to Queens Casino bears interest at prime +1%. Gold Reef has subordinated its loan to Queens
Casino for the benefit of other creditors, limited to an amount of R21,3 million.
The loan to associate has been included as part of the net investment in associate as it is not considered to be immediately recoverable. The carrying amount of the loan to associate approximates its fair value.
The following information relates to the group’s interest in its associate:
Queens Casino South Africa Unlisted 25,10 25,10 Gaming and entertainment As the group has significant influence in Queens Casino but not control, the results of its operations are equity accounted.
The directors consider the group to have significant influence in Queens Casino as the group has appointed two directors to the board of Queens Casino and a group subsidiary provides consulting and know how to the company holding the management contract for Queens Casino.
The trading results of the associate company, whose results were equity-accounted in the financial statements, are as follows:
Revenue 51 340 45 951 Total associate company’s accumulated loss for the year (20 616) (31 423) The aggregate balance sheet of the associate is summarised as follows: Property, plant and equipment 100 766 112 917 Intangible assets 2 652 2 986 Deferred income tax assets 544 579 Cash 6 503 13 794 Other current assets 3 501 3 651 Total assets 113 966 133 927 Shareholders’ loans (115 041) (111 389) Other liabilities (55 424) (58 651) Total shareholders’ funds (56 499) (36 113)
NOTES TO ThE GROUP FINANCIAl STATEMENTS FOR THE YEAR ENDED 31 DECEMBER 2009
COUNTRY OF lISTED/ PROPORTION ECONOMIC NATURE OF ASSOCIATE INCORPORATION UNlISTED OWNED INTEREST BUSINESS % %
2009 2008
R’000 R’000
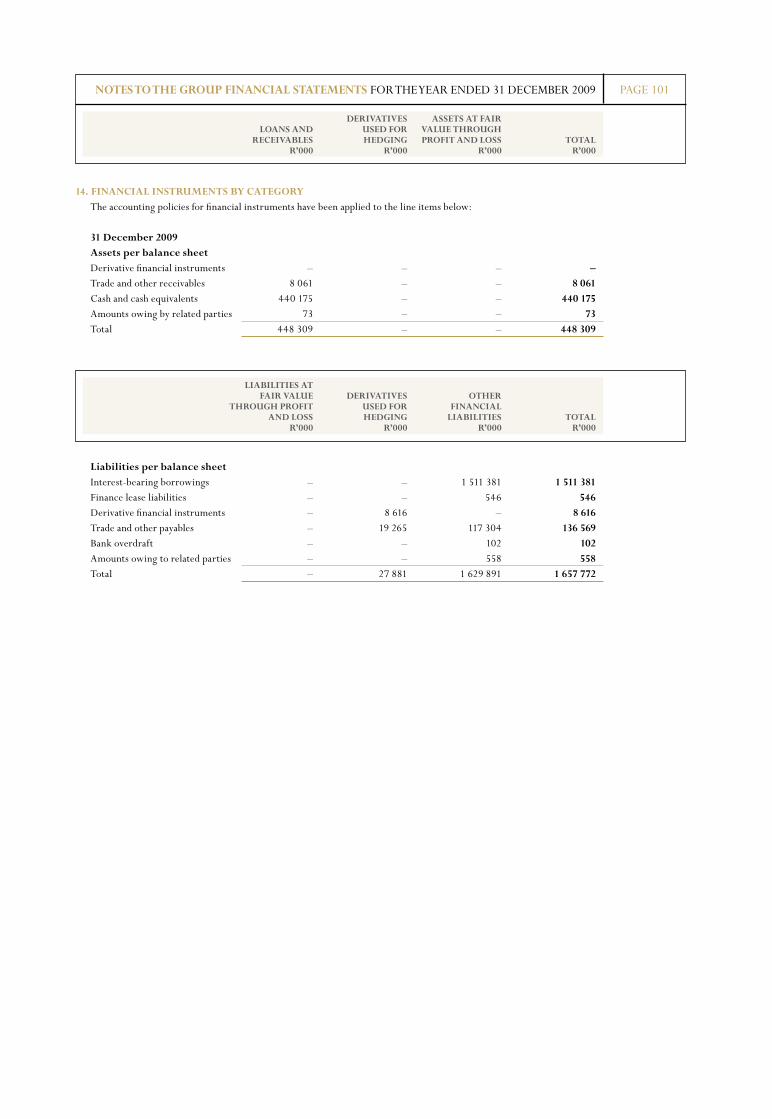
PAGE 101
DERIVATIVES ASSETS AT FAIR lOANS AND USED FOR VAlUE ThROUGh RECEIVABlES hEDGING PROFIT AND lOSS TOTAl R’000 R’000 R’000 R’000
14. FINANCIAl INSTRUMENTS BY CATEGORY The accounting policies for financial instruments have been applied to the line items below:
31 December 2009 Assets per balance sheet Derivative financial instruments – – – – Trade and other receivables 8 061 – – 8 061 Cash and cash equivalents 440 175 – – 440 175 Amounts owing by related parties 73 – – 73 Total 448 309 – – 448 309
liabilities per balance sheet Interest-bearing borrowings – – 1 511 381 1 511 381 Finance lease liabilities – – 546 546 Derivative financial instruments – 8 616 – 8 616 Trade and other payables – 19 265 117 304 136 569 Bank overdraft – – 102 102 Amounts owing to related parties – – 558 558 Total – 27 881 1 629 891 1 657 772
NOTES TO ThE GROUP FINANCIAl STATEMENTS FOR THE YEAR ENDED 31 DECEMBER 2009
lIABIlITIES AT FAIR VAlUE DERIVATIVES OThER ThROUGh PROFIT USED FOR FINANCIAl AND lOSS hEDGING lIABIlITIES TOTAl R’000 R’000 R’000 R’000
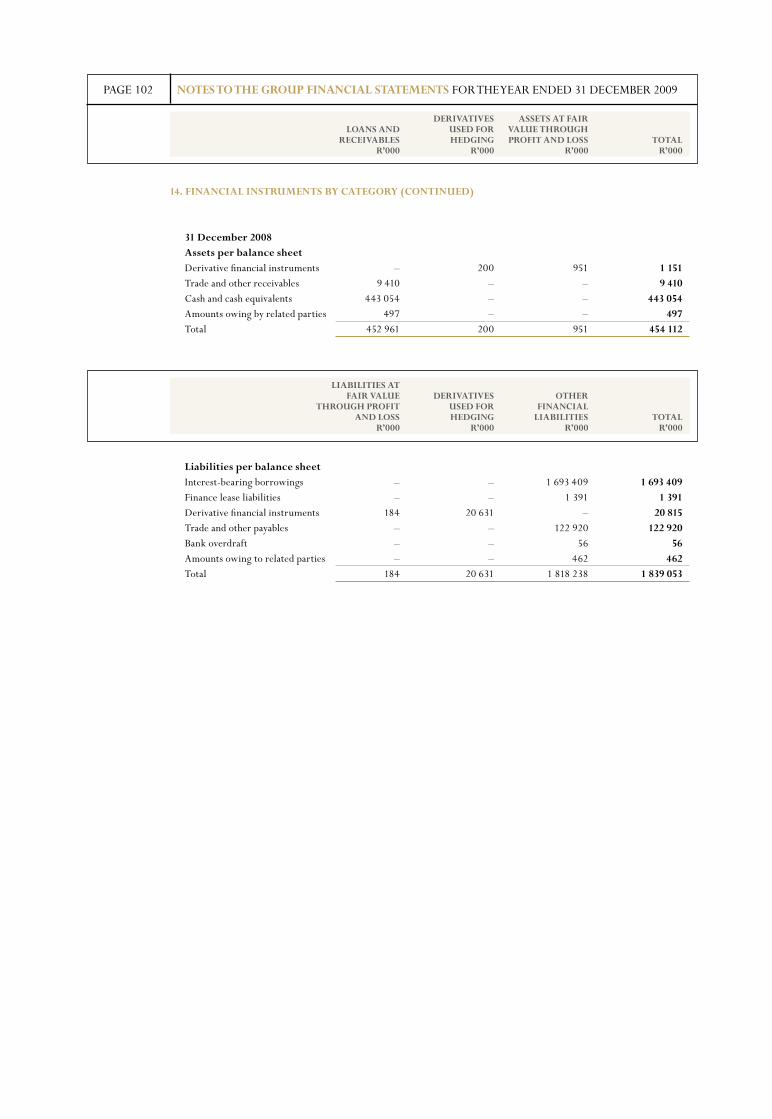
PAGE 102
14. FINANCIAl INSTRUMENTS BY CATEGORY (CONTINUED)
31 December 2008 Assets per balance sheet Derivative financial instruments – 200 951 1 151 Trade and other receivables 9 410 – – 9 410 Cash and cash equivalents 443 054 – – 443 054 Amounts owing by related parties 497 – – 497 Total 452 961 200 951 454 112
liabilities per balance sheet Interest-bearing borrowings – – 1 693 409 1 693 409 Finance lease liabilities – – 1 391 1 391 Derivative financial instruments 184 20 631 – 20 815 Trade and other payables – – 122 920 122 920 Bank overdraft – – 56 56 Amounts owing to related parties – – 462 462 Total 184 20 631 1 818 238 1 839 053
DERIVATIVES ASSETS AT FAIR lOANS AND USED FOR VAlUE ThROUGh RECEIVABlES hEDGING PROFIT AND lOSS TOTAl R’000 R’000 R’000 R’000
NOTES TO ThE GROUP FINANCIAl STATEMENTS FOR THE YEAR ENDED 31 DECEMBER 2009
lIABIlITIES AT FAIR VAlUE DERIVATIVES OThER ThROUGh PROFIT USED FOR FINANCIAl AND lOSS hEDGING lIABIlITIES TOTAl R’000 R’000 R’000 R’000
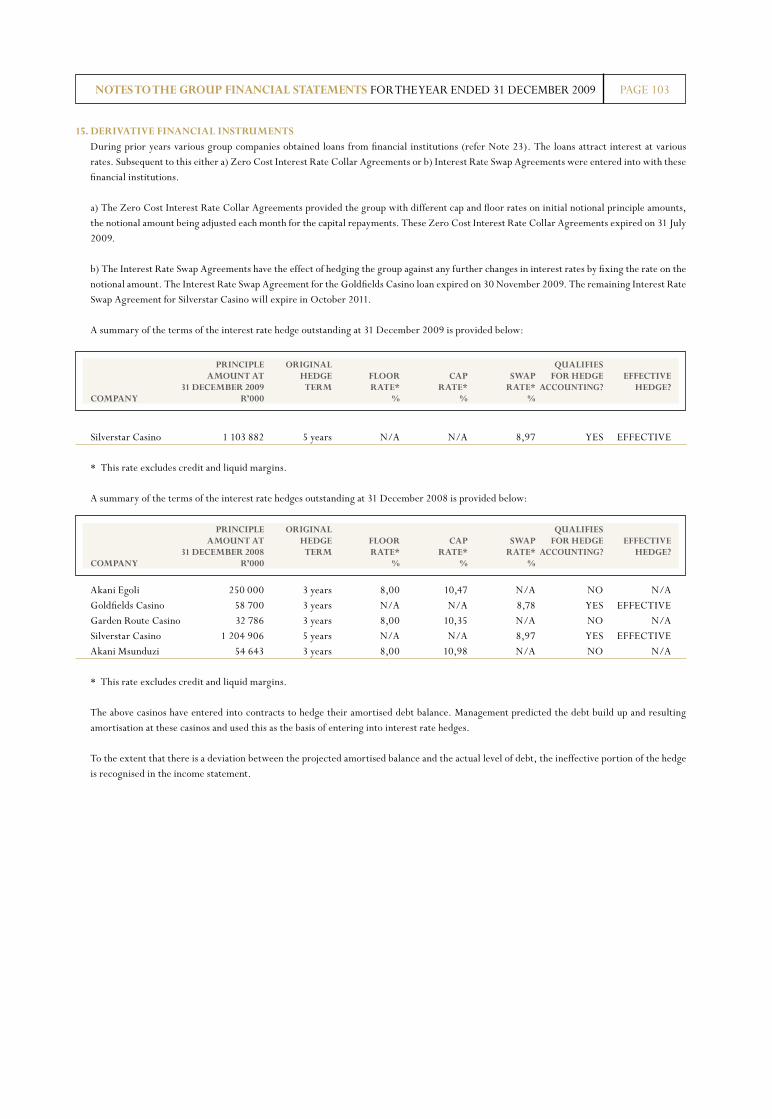
PAGE 103
15. DERIVATIVE FINANCIAl INSTRUMENTS During prior years various group companies obtained loans from financial institutions (refer Note 23). The loans attract interest at various
rates. Subsequent to this either a) Zero Cost Interest Rate Collar Agreements or b) Interest Rate Swap Agreements were entered into with these financial institutions.
a) The Zero Cost Interest Rate Collar Agreements provided the group with different cap and floor rates on initial notional principle amounts, the notional amount being adjusted each month for the capital repayments. These Zero Cost Interest Rate Collar Agreements expired on 31 July 2009.
b) The Interest Rate Swap Agreements have the effect of hedging the group against any further changes in interest rates by fixing the rate on the notional amount. The Interest Rate Swap Agreement for the Goldfields Casino loan expired on 30 November 2009. The remaining Interest Rate Swap Agreement for Silverstar Casino will expire in October 2011.
A summary of the terms of the interest rate hedge outstanding at 31 December 2009 is provided below:
Silverstar Casino 1 103 882 5 years N/A N/A 8,97 YES EFFECTIVE
* This rate excludes credit and liquid margins. A summary of the terms of the interest rate hedges outstanding at 31 December 2008 is provided below:
Akani Egoli 250 000 3 years 8,00 10,47 N/A NO N/A Goldfields Casino 58 700 3 years N/A N/A 8,78 YES EFFECTIVE Garden Route Casino 32 786 3 years 8,00 10,35 N/A NO N/A Silverstar Casino 1 204 906 5 years N/A N/A 8,97 YES EFFECTIVE Akani Msunduzi 54 643 3 years 8,00 10,98 N/A NO N/A * This rate excludes credit and liquid margins.
The above casinos have entered into contracts to hedge their amortised debt balance. Management predicted the debt build up and resulting amortisation at these casinos and used this as the basis of entering into interest rate hedges.
To the extent that there is a deviation between the projected amortised balance and the actual level of debt, the ineffective portion of the hedge is recognised in the income statement.
NOTES TO ThE GROUP FINANCIAl STATEMENTS FOR THE YEAR ENDED 31 DECEMBER 2009
PRINCIPlE ORIGINAl QUAlIFIES AMOUNT AT hEDGE FlOOR CAP SWAP FOR hEDGE EFFECTIVE 31 DECEMBER 2009 TERM RATE* RATE* RATE* ACCOUNTING? hEDGE? COMPANY R’000 % % %
PRINCIPlE ORIGINAl QUAlIFIES AMOUNT AT hEDGE FlOOR CAP SWAP FOR hEDGE EFFECTIVE 31 DECEMBER 2008 TERM RATE* RATE* RATE* ACCOUNTING? hEDGE? COMPANY R’000 % % %

PAGE 104
15. DERIVATIVE FINANCIAl INSTRUMENTS (CONTINUED) The fair values of the cash flow hedges are represented below:
2009 Silverstar Casino – – – (27 881) (19 265) (8 616) 25 110 – – – (27 881) (19 265) (8 616) 25 110 2008 Akani Egoli 746 746 – (131) – (131) – Goldfields Casino 200 200 – – – – (13) Garden Route Casino 105 105 – (15) – (15) – Silverstar Casino – – – (20 631) 1 819 (22 450) 39 637 Akani Msunduzi 100 100 – (38) – (38) – 1 151 1 151 – (20 815) 1 819 (22 634) 39 624 The ineffective portion recognized in the income statement from cash flow hedges for the year amounted to R9,2 million (2008: R2,4 million).
The fair value adjustment released from the hedge reserve (see Note 21) for the interest rate derivatives during the year amounted to
R14,5 million (recognised in 2008: R66,7 million).
The maximum exposure to liquidity risk at the balance sheet date is the fair value of the derivative financial liabilities on the balance sheet.
During the current year derivatives were reclassified between current and non-current assets and liabilties in accordance with their relevant maturity.
Interest rate risk At 31 December 2009, the fair value of the liabilities would have been R14,8 million lower if JIBAR had been 1% higher, while the fair value
adjustment recognised in the income statement and the fair value adjustment recognised in the hedging reserve would have been RNil and R14,8 million higher, respectively.
The fair value of the liabilities would have been R14,8 million higher if JIBAR had been 1% lower, while the fair value adjustment recognised in the income statement and the fair value adjustment recognised in the hedging reserve would have been RNil and R14,8 million lower, respectively.
Foreign currency futures contracts During the year the company took on positions in foreign currency futures contracts denominated in Euro’s and US Dollars to hedge the foreign
currency risk on foreign currency denominated purchases.
The financial instrument is an effective hedge and is measured at its mark-to-market value through equity.
The notional principal amount of open foreign currency futures contracts at year end was R1,4 million (2008: RNil)
Fair value of derivative financial liability - Foreign currency futures (cash flow hedge) – – 122
The cumulative loss on the derivative has been offset against the margin deposit as the profits/losses are settled daily against the margin deposit and there is a legally enforceable right and an intention to settle on a net basis.
The balance on the margin deposit at year end was R 0,2 million, which is included in sundry debtors in trade and other receivables.
The ineffective portion of the hedge recognised in the income statement from the cash flow hedge amounted to R14 000.
If the Euro/USD exchange rates were to increase by 1% the effect would be an increase in the margin account of R14 000, a decrease in the hedging reserve of R11 000 and a gain to the income statement of R3 000.
If the Euro/USD exchange rates were to decrease by 1% the effect would be a decrease in the margin account of R14 000, an increase in the hedging reserve of R11 000 and a loss to the income statement of R3 000.
NOTES TO ThE GROUP FINANCIAl STATEMENTS FOR THE YEAR ENDED 31 DECEMBER 2009
CURRENT NON-CURRENT CURRENT NON-CURRENT PORTION OF PORTION OF PORTION OF PORTION OF hEDGE DERIVATIVE DERIVATIVE DERIVATIVE DERIVATIVE DERIVATIVE DERIVATIVE RESERVE AT ASSET ASSET ASSET lIABIlITY lIABIlITY lIABIlITY 31 DECEMBER R’000 R’000 R’000 R’000 R’000 R’000 R’000
hEDGE RESERVE AT 2009 2008 31 DECEMBER 2009 R’000 R’000 R’000
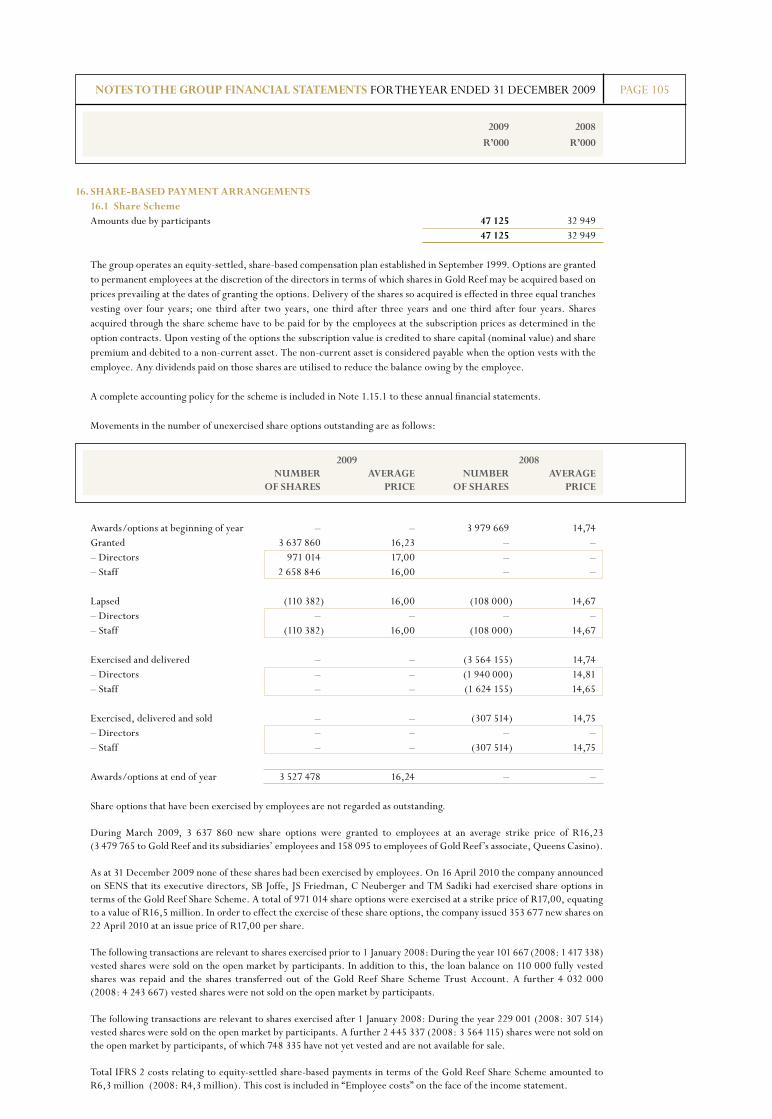
PAGE 105
2009 2008
R’000 R’000
16. ShARE-BASED PAYMENT ARRANGEMENTS 16.1 Share Scheme Amounts due by participants 47 125 32 949 47 125 32 949
The group operates an equity-settled, share-based compensation plan established in September 1999. Options are granted to permanent employees at the discretion of the directors in terms of which shares in Gold Reef may be acquired based on prices prevailing at the dates of granting the options. Delivery of the shares so acquired is effected in three equal tranches vesting over four years; one third after two years, one third after three years and one third after four years. Shares acquired through the share scheme have to be paid for by the employees at the subscription prices as determined in the option contracts. Upon vesting of the options the subscription value is credited to share capital (nominal value) and share premium and debited to a non-current asset. The non-current asset is considered payable when the option vests with the employee. Any dividends paid on those shares are utilised to reduce the balance owing by the employee.
A complete accounting policy for the scheme is included in Note 1.15.1 to these annual financial statements.
Movements in the number of unexercised share options outstanding are as follows:
Awards/options at beginning of year – – 3 979 669 14,74 Granted 3 637 860 16,23 – – – Directors 971 014 17,00 – – – Staff 2 658 846 16,00 – –
Lapsed (110 382) 16,00 (108 000) 14,67 – Directors – – – – – Staff (110 382) 16,00 (108 000) 14,67
Exercised and delivered – – (3 564 155) 14,74 – Directors – – (1 940 000) 14,81 – Staff – – (1 624 155) 14,65
Exercised, delivered and sold – – (307 514) 14,75 – Directors – – – – – Staff – – (307 514) 14,75
Awards/options at end of year 3 527 478 16,24 – –
Share options that have been exercised by employees are not regarded as outstanding.
During March 2009, 3 637 860 new share options were granted to employees at an average strike price of R16,23 (3 479 765 to Gold Reef and its subsidiaries’ employees and 158 095 to employees of Gold Reef’s associate, Queens Casino).
As at 31 December 2009 none of these shares had been exercised by employees. On 16 April 2010 the company announced on SENS that its executive directors, SB Joffe, JS Friedman, C Neuberger and TM Sadiki had exercised share options in terms of the Gold Reef Share Scheme. A total of 971 014 share options were exercised at a strike price of R17,00, equating to a value of R16,5 million. In order to effect the exercise of these share options, the company issued 353 677 new shares on 22 April 2010 at an issue price of R17,00 per share.
The following transactions are relevant to shares exercised prior to 1 January 2008: During the year 101 667 (2008: 1 417 338) vested shares were sold on the open market by participants. In addition to this, the loan balance on 110 000 fully vested shares was repaid and the shares transferred out of the Gold Reef Share Scheme Trust Account. A further 4 032 000 (2008: 4 243 667) vested shares were not sold on the open market by participants.
The following transactions are relevant to shares exercised after 1 January 2008: During the year 229 001 (2008: 307 514) vested shares were sold on the open market by participants. A further 2 445 337 (2008: 3 564 115) shares were not sold on the open market by participants, of which 748 335 have not yet vested and are not available for sale.
Total IFRS 2 costs relating to equity-settled share-based payments in terms of the Gold Reef Share Scheme amounted to
R6,3 million (2008: R4,3 million). This cost is included in “Employee costs” on the face of the income statement.
NOTES TO ThE GROUP FINANCIAl STATEMENTS FOR THE YEAR ENDED 31 DECEMBER 2009
2009 2008 NUMBER AVERAGE NUMBER AVERAGE OF ShARES PRICE OF ShARES PRICE
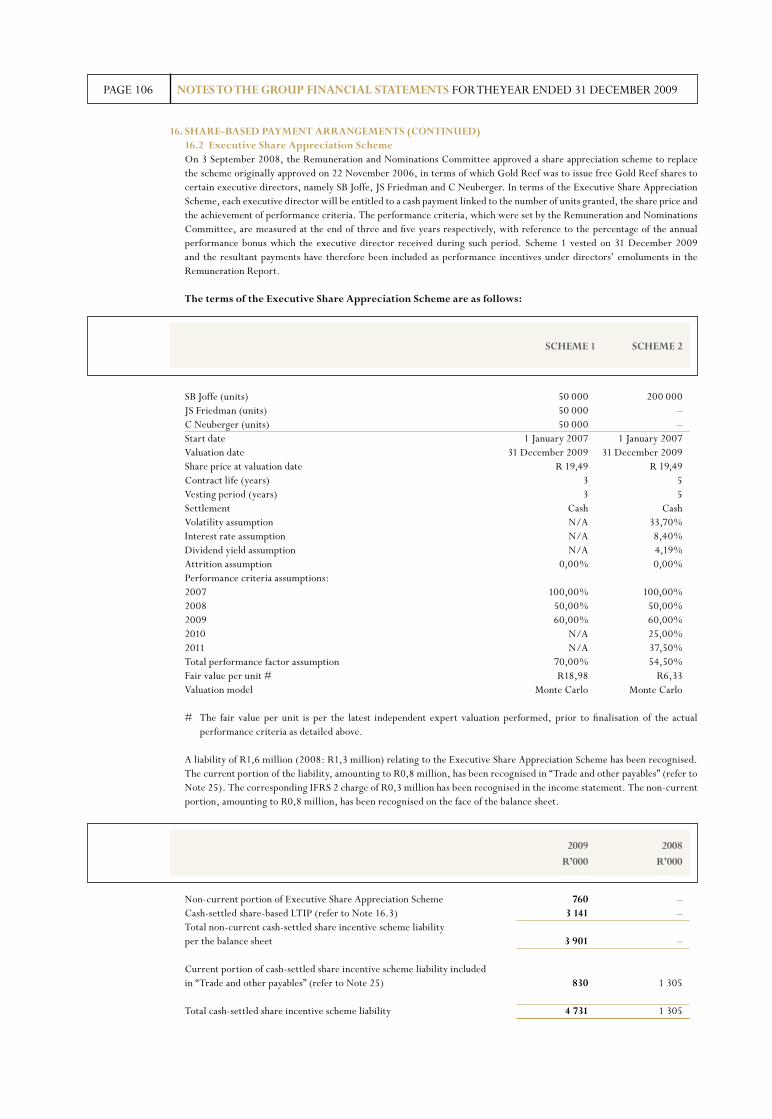
PAGE 106
16. ShARE-BASED PAYMENT ARRANGEMENTS (CONTINUED) 16.2 Executive Share Appreciation Scheme On 3 September 2008, the Remuneration and Nominations Committee approved a share appreciation scheme to replace
the scheme originally approved on 22 November 2006, in terms of which Gold Reef was to issue free Gold Reef shares to certain executive directors, namely SB Joffe, JS Friedman and C Neuberger. In terms of the Executive Share Appreciation Scheme, each executive director will be entitled to a cash payment linked to the number of units granted, the share price and the achievement of performance criteria. The performance criteria, which were set by the Remuneration and Nominations Committee, are measured at the end of three and five years respectively, with reference to the percentage of the annual performance bonus which the executive director received during such period. Scheme 1 vested on 31 December 2009 and the resultant payments have therefore been included as performance incentives under directors’ emoluments in the Remuneration Report.
The terms of the Executive Share Appreciation Scheme are as follows:
SB Joffe (units) 50 000 200 000 JS Friedman (units) 50 000 – C Neuberger (units) 50 000 – Start date 1 January 2007 1 January 2007 Valuation date 31 December 2009 31 December 2009 Share price at valuation date R 19,49 R 19,49 Contract life (years) 3 5 Vesting period (years) 3 5 Settlement Cash Cash Volatility assumption N/A 33,70% Interest rate assumption N/A 8,40% Dividend yield assumption N/A 4,19% Attrition assumption 0,00% 0,00% Performance criteria assumptions: 2007 100,00% 100,00% 2008 50,00% 50,00% 2009 60,00% 60,00% 2010 N/A 25,00% 2011 N/A 37,50% Total performance factor assumption 70,00% 54,50% Fair value per unit # R18,98 R6,33 Valuation model Monte Carlo Monte Carlo # The fair value per unit is per the latest independent expert valuation performed, prior to finalisation of the actual
performance criteria as detailed above.
A liability of R1,6 million (2008: R1,3 million) relating to the Executive Share Appreciation Scheme has been recognised. The current portion of the liability, amounting to R0,8 million, has been recognised in “Trade and other payables” (refer to Note 25). The corresponding IFRS 2 charge of R0,3 million has been recognised in the income statement. The non-current portion, amounting to R0,8 million, has been recognised on the face of the balance sheet.
Non-current portion of Executive Share Appreciation Scheme 760 – Cash-settled share-based LTIP (refer to Note 16.3) 3 141 – Total non-current cash-settled share incentive scheme liability per the balance sheet 3 901 –
Current portion of cash-settled share incentive scheme liability included in “Trade and other payables” (refer to Note 25) 830 1 305
Total cash-settled share incentive scheme liability 4 731 1 305
NOTES TO ThE GROUP FINANCIAl STATEMENTS FOR THE YEAR ENDED 31 DECEMBER 2009
SChEME 1 SChEME 2
2009 2008
R’000 R’000
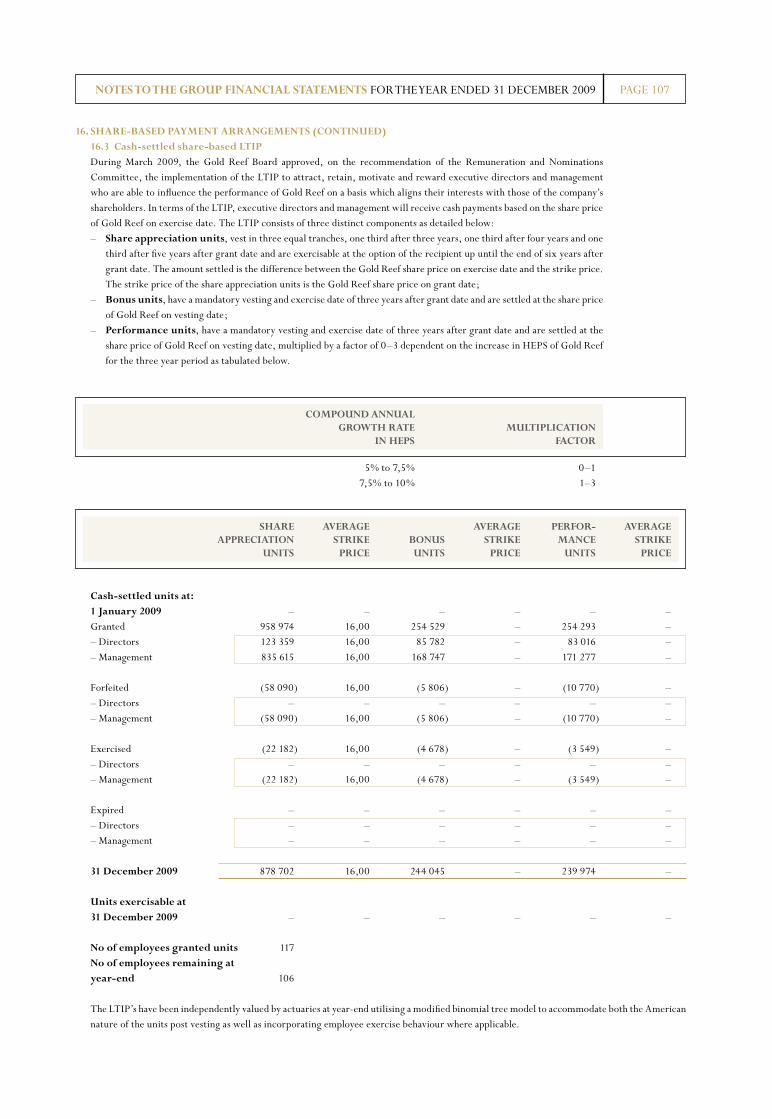
PAGE 107
16. ShARE-BASED PAYMENT ARRANGEMENTS (CONTINUED) 16.3 Cash-settled share-based lTIP During March 2009, the Gold Reef Board approved, on the recommendation of the Remuneration and Nominations
Committee, the implementation of the LTIP to attract, retain, motivate and reward executive directors and management who are able to influence the performance of Gold Reef on a basis which aligns their interests with those of the company’s shareholders. In terms of the LTIP, executive directors and management will receive cash payments based on the share price of Gold Reef on exercise date. The LTIP consists of three distinct components as detailed below:
– Share appreciation units, vest in three equal tranches, one third after three years, one third after four years and one third after five years after grant date and are exercisable at the option of the recipient up until the end of six years after grant date. The amount settled is the difference between the Gold Reef share price on exercise date and the strike price. The strike price of the share appreciation units is the Gold Reef share price on grant date;
– Bonus units, have a mandatory vesting and exercise date of three years after grant date and are settled at the share price of Gold Reef on vesting date;
– Performance units, have a mandatory vesting and exercise date of three years after grant date and are settled at the share price of Gold Reef on vesting date, multiplied by a factor of 0–3 dependent on the increase in HEPS of Gold Reef for the three year period as tabulated below.
5% to 7,5% 0–1 7,5% to 10% 1–3
Cash-settled units at: 1 January 2009 – – – – – – Granted 958 974 16,00 254 529 – 254 293 – – Directors 123 359 16,00 85 782 – 83 016 – – Management 835 615 16,00 168 747 – 171 277 –
Forfeited (58 090) 16,00 (5 806) – (10 770) – – Directors – – – – – – – Management (58 090) 16,00 (5 806) – (10 770) –
Exercised (22 182) 16,00 (4 678) – (3 549) – – Directors – – – – – – – Management (22 182) 16,00 (4 678) – (3 549) –
Expired – – – – – – – Directors – – – – – – – Management – – – – – –
31 December 2009 878 702 16,00 244 045 – 239 974 –
Units exercisable at 31 December 2009 – – – – – –
No of employees granted units 117 No of employees remaining at year-end 106
The LTIP’s have been independently valued by actuaries at year-end utilising a modified binomial tree model to accommodate both the American nature of the units post vesting as well as incorporating employee exercise behaviour where applicable.
NOTES TO ThE GROUP FINANCIAl STATEMENTS FOR THE YEAR ENDED 31 DECEMBER 2009
COMPOUND ANNUAl GROWTh RATE MUlTIPlICATION IN hEPS FACTOR
ShARE AVERAGE AVERAGE PERFOR- AVERAGE APPRECIATION STRIKE BONUS STRIKE MANCE STRIKE UNITS PRICE UNITS PRICE UNITS PRICE
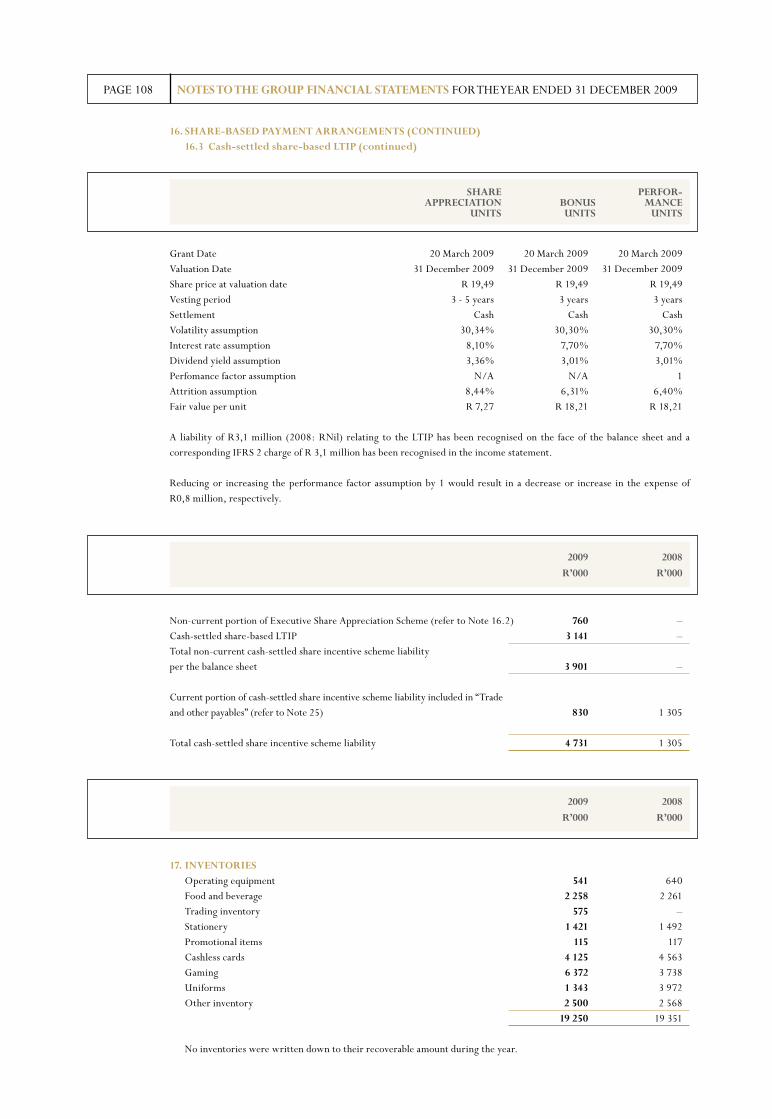
PAGE 108
16. ShARE-BASED PAYMENT ARRANGEMENTS (CONTINUED) 16.3 Cash-settled share-based lTIP (continued)
Grant Date 20 March 2009 20 March 2009 20 March 2009 Valuation Date 31 December 2009 31 December 2009 31 December 2009 Share price at valuation date R 19,49 R 19,49 R 19,49Vesting period 3 - 5 years 3 years 3 yearsSettlement Cash Cash CashVolatility assumption 30,34% 30,30% 30,30%Interest rate assumption 8,10% 7,70% 7,70%Dividend yield assumption 3,36% 3,01% 3,01%Perfomance factor assumption N/A N/A 1Attrition assumption 8,44% 6,31% 6,40%Fair value per unit R 7,27 R 18,21 R 18,21
A liability of R3,1 million (2008: RNil) relating to the LTIP has been recognised on the face of the balance sheet and a corresponding IFRS 2 charge of R 3,1 million has been recognised in the income statement.
Reducing or increasing the performance factor assumption by 1 would result in a decrease or increase in the expense of R0,8 million, respectively.
Non-current portion of Executive Share Appreciation Scheme (refer to Note 16.2) 760 – Cash-settled share-based LTIP 3 141 –Total non-current cash-settled share incentive scheme liability per the balance sheet 3 901 –
Current portion of cash-settled share incentive scheme liability included in “Trade and other payables” (refer to Note 25) 830 1 305
Total cash-settled share incentive scheme liability 4 731 1 305
17. INVENTORIES Operating equipment 541 640 Food and beverage 2 258 2 261 Trading inventory 575 – Stationery 1 421 1 492 Promotional items 115 117 Cashless cards 4 125 4 563 Gaming 6 372 3 738 Uniforms 1 343 3 972 Other inventory 2 500 2 568 19 250 19 351 No inventories were written down to their recoverable amount during the year.
NOTES TO ThE GROUP FINANCIAl STATEMENTS FOR THE YEAR ENDED 31 DECEMBER 2009
ShARE PERFOR- APPRECIATION BONUS MANCE UNITS UNITS UNITS
2009 2008
R’000 R’000
2009 2008
R’000 R’000
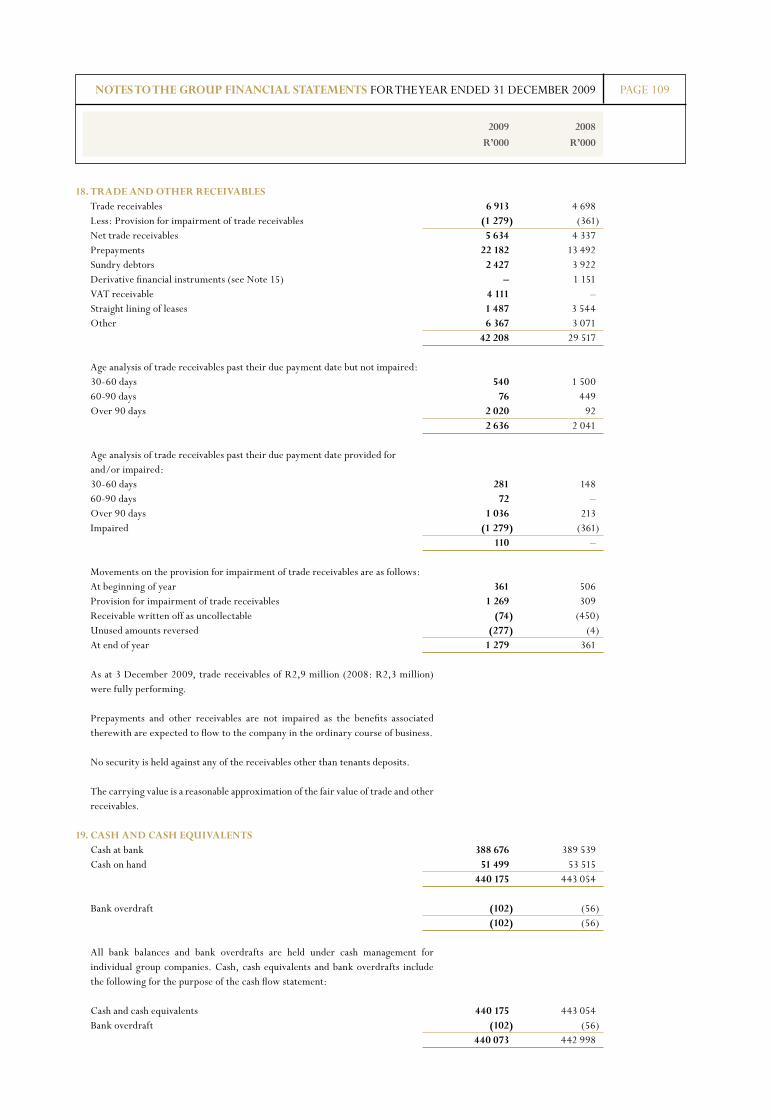
PAGE 109
2009 2008
R’000 R’000
18. TRADE AND OThER RECEIVABlES Trade receivables 6 913 4 698 Less: Provision for impairment of trade receivables (1 279) (361) Net trade receivables 5 634 4 337 Prepayments 22 182 13 492 Sundry debtors 2 427 3 922 Derivative financial instruments (see Note 15) – 1 151 VAT receivable 4 111 – Straight lining of leases 1 487 3 544 Other 6 367 3 071 42 208 29 517
Age analysis of trade receivables past their due payment date but not impaired: 30-60 days 540 1 500 60-90 days 76 449 Over 90 days 2 020 92 2 636 2 041
Age analysis of trade receivables past their due payment date provided for and/or impaired: 30-60 days 281 148 60-90 days 72 – Over 90 days 1 036 213 Impaired (1 279) (361) 110 –
Movements on the provision for impairment of trade receivables are as follows: At beginning of year 361 506 Provision for impairment of trade receivables 1 269 309 Receivable written off as uncollectable (74) (450) Unused amounts reversed (277) (4) At end of year 1 279 361
As at 3 December 2009, trade receivables of R2,9 million (2008: R2,3 million) were fully performing.
Prepayments and other receivables are not impaired as the benefits associated therewith are expected to flow to the company in the ordinary course of business.
No security is held against any of the receivables other than tenants deposits.
The carrying value is a reasonable approximation of the fair value of trade and other receivables.
19. CASh AND CASh EQUIVAlENTS Cash at bank 388 676 389 539 Cash on hand 51 499 53 515 440 175 443 054
Bank overdraft (102) (56) (102) (56)
All bank balances and bank overdrafts are held under cash management for individual group companies. Cash, cash equivalents and bank overdrafts include the following for the purpose of the cash flow statement:
Cash and cash equivalents 440 175 443 054 Bank overdraft (102) (56) 440 073 442 998
NOTES TO ThE GROUP FINANCIAl STATEMENTS FOR THE YEAR ENDED 31 DECEMBER 2009

PAGE 110
20. ShARE CAPITAl Balance at 1 January 2008 291 990 (18 275) 273 715 5 840 1 860 132 (98 579) 1 767 393 Transfer of vested shares to employees from share scheme – 1 326 1 326 – – 29 625 29 625 Shares repurchased by share scheme – (133) (133) – – (1 980) (1 980) Balance at 31 December 2008 291 990 (17 082) 274 908 5 840 1 860 132 (70 934) 1 795 038 Transfer of vested shares to employees from share scheme – 1 676 1 676 – – 15 059 15 059 Shares repurchased by share scheme – (483) (483) – – (1 950) (1 950) Balance at 31 December 2009 291 990 (15 889) 276 101 5 840 1 860 132 (57 825) 1 808 147
The total authorised number of ordinary shares is 590 000 000 (2008: 590 000 000) with a par value of 2 cents per share (2008: 2 cents per share). All issued shares, other than those related to the Gold Reef Share Scheme, are fully paid up.
21. OThER RESERVES Balance at 1 January 2008 27 519 27 042 (548 260) – (493 699) Loss on sale of shares by share scheme – – – (4 701) (4 701) Fair value loss on interest rate hedges (refer to Note 15) – (66 666) – – (66 666) Balance at 31 December 2008 27 519 (39 624) (548 260) (4 701) (565 066) Profit on sale of shares by share scheme – – – 5 866 5 866 Fair value gain on interest rate hedges (refer to Note 15) – 14 514 – – 14 514 Fair value loss on foreign exchange hedges (refer to Note 15) – (122) – – (122) Balance at 31 December 2009 27 519 (25 232) (548 260) 1 165 (544 808) * This reserve arose in terms of IFRS3 – Business Combinations as a result of the share exchange and top-up transaction effective 1 July 2007.
NUMBER OF NUMBER OF NET ORDINARY ORDINARY TREASURY NUMBER ShARE ShARE TREASURY ShARES ShARES OF ShARES CAPITAl PREMIUM ShARES TOTAl (000) (000) (000) R’000 R’000 R’000 R’000
TRANS- NON- ACTIONS DISTRIBU- lAND hEDGE WITh TABlE REVAlUATION RESERVE MINORITIES* RESERVES TOTAl R’000 R’000 R’000 R’000 R’000
NOTES TO ThE GROUP FINANCIAl STATEMENTS FOR THE YEAR ENDED 31 DECEMBER 2009
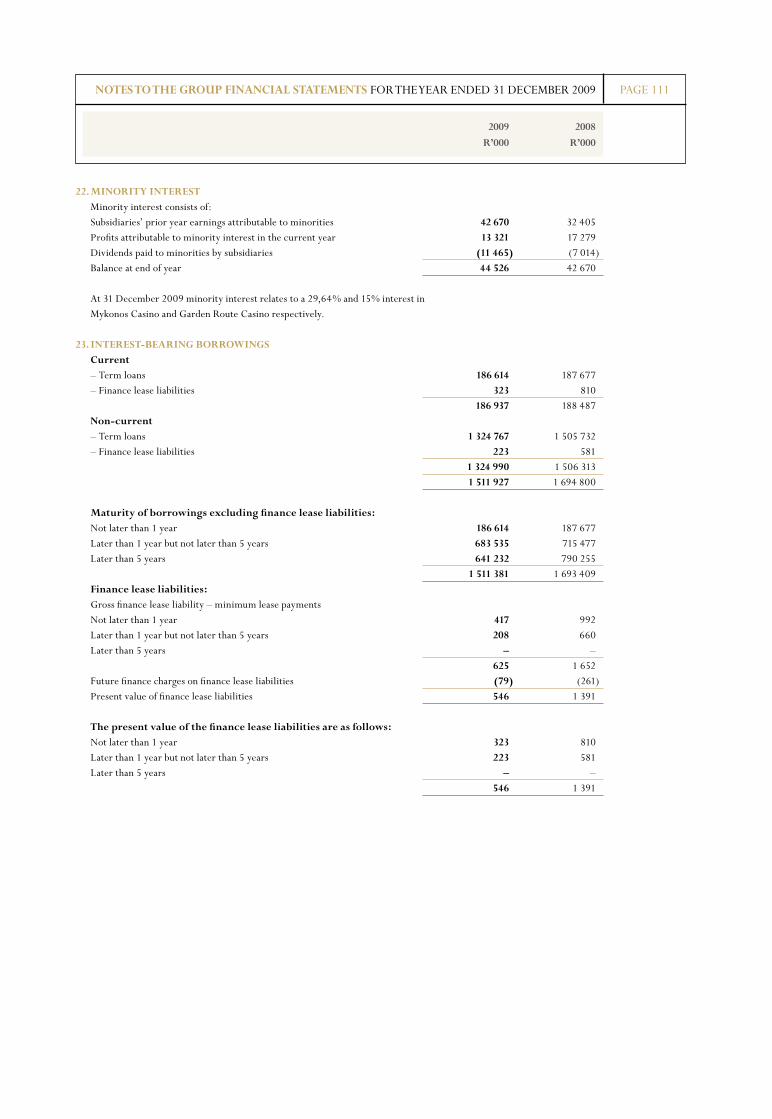
PAGE 111
2009 2008
R’000 R’000
NOTES TO ThE GROUP FINANCIAl STATEMENTS FOR THE YEAR ENDED 31 DECEMBER 2009
22. MINORITY INTEREST Minority interest consists of: Subsidiaries’ prior year earnings attributable to minorities 42 670 32 405 Profits attributable to minority interest in the current year 13 321 17 279 Dividends paid to minorities by subsidiaries (11 465) (7 014) Balance at end of year 44 526 42 670 At 31 December 2009 minority interest relates to a 29,64% and 15% interest in Mykonos Casino and Garden Route Casino respectively.
23. INTEREST-BEARING BORROWINGS Current – Term loans 186 614 187 677 – Finance lease liabilities 323 810 186 937 188 487 Non-current – Term loans 1 324 767 1 505 732 – Finance lease liabilities 223 581 1 324 990 1 506 313 1 511 927 1 694 800 Maturity of borrowings excluding finance lease liabilities: Not later than 1 year 186 614 187 677 Later than 1 year but not later than 5 years 683 535 715 477 Later than 5 years 641 232 790 255 1 511 381 1 693 409 Finance lease liabilities: Gross finance lease liability – minimum lease payments Not later than 1 year 417 992 Later than 1 year but not later than 5 years 208 660 Later than 5 years – – 625 1 652 Future finance charges on finance lease liabilities (79) (261) Present value of finance lease liabilities 546 1 391 The present value of the finance lease liabilities are as follows: Not later than 1 year 323 810 Later than 1 year but not later than 5 years 223 581 Later than 5 years – – 546 1 391
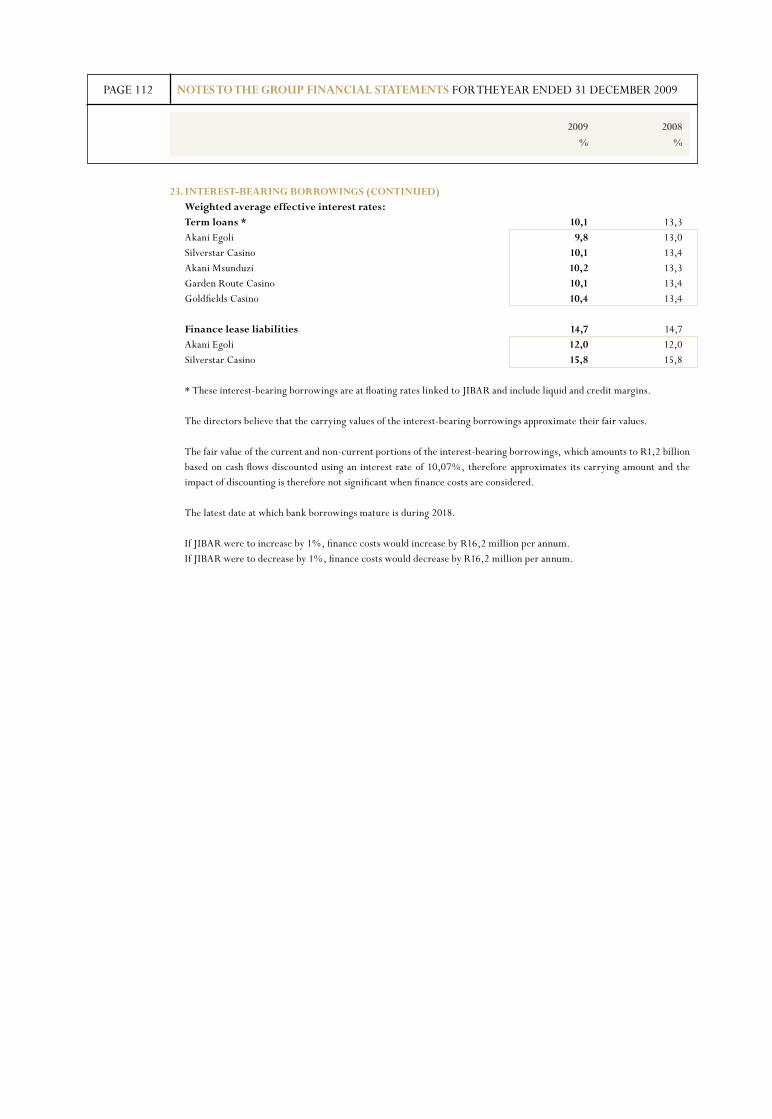
PAGE 112
2009 2008
% %
23. INTEREST-BEARING BORROWINGS (CONTINUED) Weighted average effective interest rates: Term loans * 10,1 13,3 Akani Egoli 9,8 13,0 Silverstar Casino 10,1 13,4 Akani Msunduzi 10,2 13,3 Garden Route Casino 10,1 13,4 Goldfields Casino 10,4 13,4 Finance lease liabilities 14,7 14,7 Akani Egoli 12,0 12,0 Silverstar Casino 15,8 15,8
* These interest-bearing borrowings are at floating rates linked to JIBAR and include liquid and credit margins.
The directors believe that the carrying values of the interest-bearing borrowings approximate their fair values.
The fair value of the current and non-current portions of the interest-bearing borrowings, which amounts to R1,2 billion based on cash flows discounted using an interest rate of 10,07%, therefore approximates its carrying amount and the impact of discounting is therefore not significant when finance costs are considered.
The latest date at which bank borrowings mature is during 2018.
If JIBAR were to increase by 1%, finance costs would increase by R16,2 million per annum. If JIBAR were to decrease by 1%, finance costs would decrease by R16,2 million per annum.
NOTES TO ThE GROUP FINANCIAl STATEMENTS FOR THE YEAR ENDED 31 DECEMBER 2009
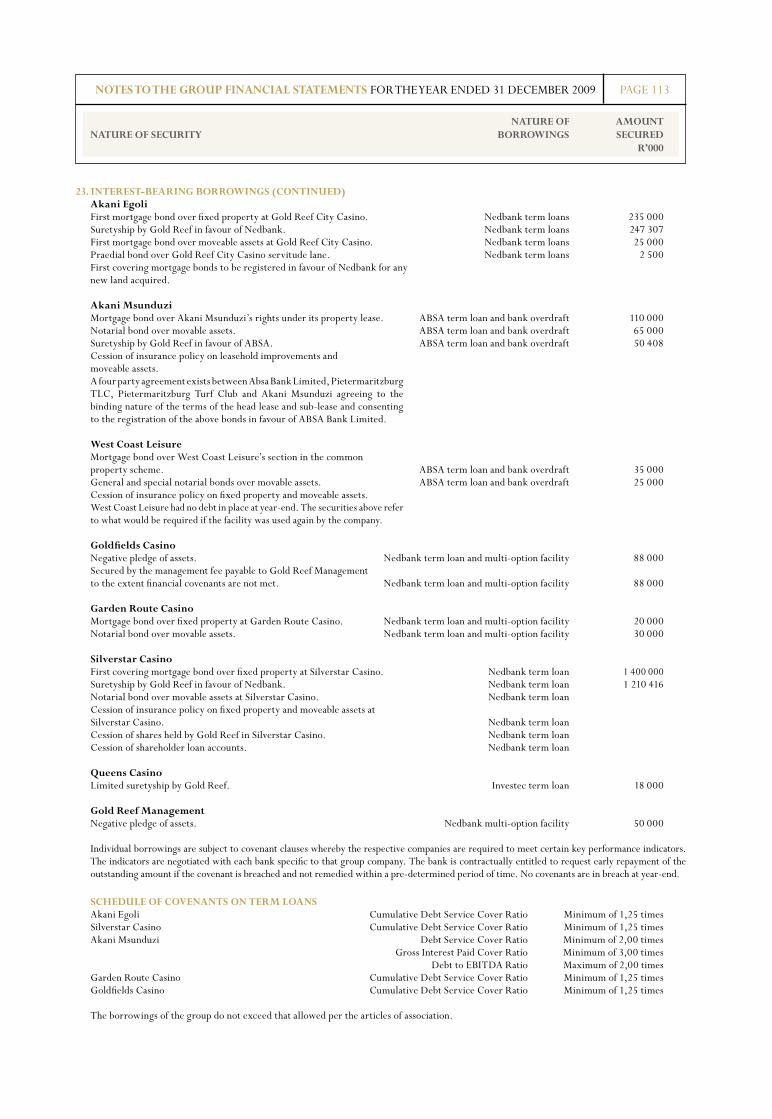
PAGE 113
23. INTEREST-BEARING BORROWINGS (CONTINUED) Akani Egoli First mortgage bond over fixed property at Gold Reef City Casino. Nedbank term loans 235 000 Suretyship by Gold Reef in favour of Nedbank. Nedbank term loans 247 307 First mortgage bond over moveable assets at Gold Reef City Casino. Nedbank term loans 25 000 Praedial bond over Gold Reef City Casino servitude lane. Nedbank term loans 2 500 First covering mortgage bonds to be registered in favour of Nedbank for any new land acquired. Akani Msunduzi Mortgage bond over Akani Msunduzi’s rights under its property lease. ABSA term loan and bank overdraft 110 000 Notarial bond over movable assets. ABSA term loan and bank overdraft 65 000 Suretyship by Gold Reef in favour of ABSA. ABSA term loan and bank overdraft 50 408 Cession of insurance policy on leasehold improvements and moveable assets. A four party agreement exists between Absa Bank Limited, Pietermaritzburg
TLC, Pietermaritzburg Turf Club and Akani Msunduzi agreeing to the binding nature of the terms of the head lease and sub-lease and consenting to the registration of the above bonds in favour of ABSA Bank Limited.
West Coast leisure Mortgage bond over West Coast Leisure’s section in the common property scheme. ABSA term loan and bank overdraft 35 000 General and special notarial bonds over movable assets. ABSA term loan and bank overdraft 25 000 Cession of insurance policy on fixed property and moveable assets. West Coast Leisure had no debt in place at year-end. The securities above refer
to what would be required if the facility was used again by the company.
Goldfields Casino Negative pledge of assets. Nedbank term loan and multi-option facility 88 000 Secured by the management fee payable to Gold Reef Management to the extent financial covenants are not met. Nedbank term loan and multi-option facility 88 000
Garden Route Casino Mortgage bond over fixed property at Garden Route Casino. Nedbank term loan and multi-option facility 20 000 Notarial bond over movable assets. Nedbank term loan and multi-option facility 30 000 Silverstar Casino First covering mortgage bond over fixed property at Silverstar Casino. Nedbank term loan 1 400 000 Suretyship by Gold Reef in favour of Nedbank. Nedbank term loan 1 210 416 Notarial bond over movable assets at Silverstar Casino. Nedbank term loan Cession of insurance policy on fixed property and moveable assets at Silverstar Casino. Nedbank term loan Cession of shares held by Gold Reef in Silverstar Casino. Nedbank term loan Cession of shareholder loan accounts. Nedbank term loan Queens Casino Limited suretyship by Gold Reef. Investec term loan 18 000 Gold Reef Management Negative pledge of assets. Nedbank multi-option facility 50 000
Individual borrowings are subject to covenant clauses whereby the respective companies are required to meet certain key performance indicators.The indicators are negotiated with each bank specific to that group company. The bank is contractually entitled to request early repayment of the outstanding amount if the covenant is breached and not remedied within a pre-determined period of time. No covenants are in breach at year-end.
SChEDUlE OF COVENANTS ON TERM lOANS Akani Egoli Cumulative Debt Service Cover Ratio Minimum of 1,25 times Silverstar Casino Cumulative Debt Service Cover Ratio Minimum of 1,25 times Akani Msunduzi Debt Service Cover Ratio Minimum of 2,00 times Gross Interest Paid Cover Ratio Minimum of 3,00 times Debt to EBITDA Ratio Maximum of 2,00 times Garden Route Casino Cumulative Debt Service Cover Ratio Minimum of 1,25 times Goldfields Casino Cumulative Debt Service Cover Ratio Minimum of 1,25 times
The borrowings of the group do not exceed that allowed per the articles of association.
NATURE OF AMOUNT NATURE OF SECURITY BORROWINGS SECURED R’000
NOTES TO ThE GROUP FINANCIAl STATEMENTS FOR THE YEAR ENDED 31 DECEMBER 2009
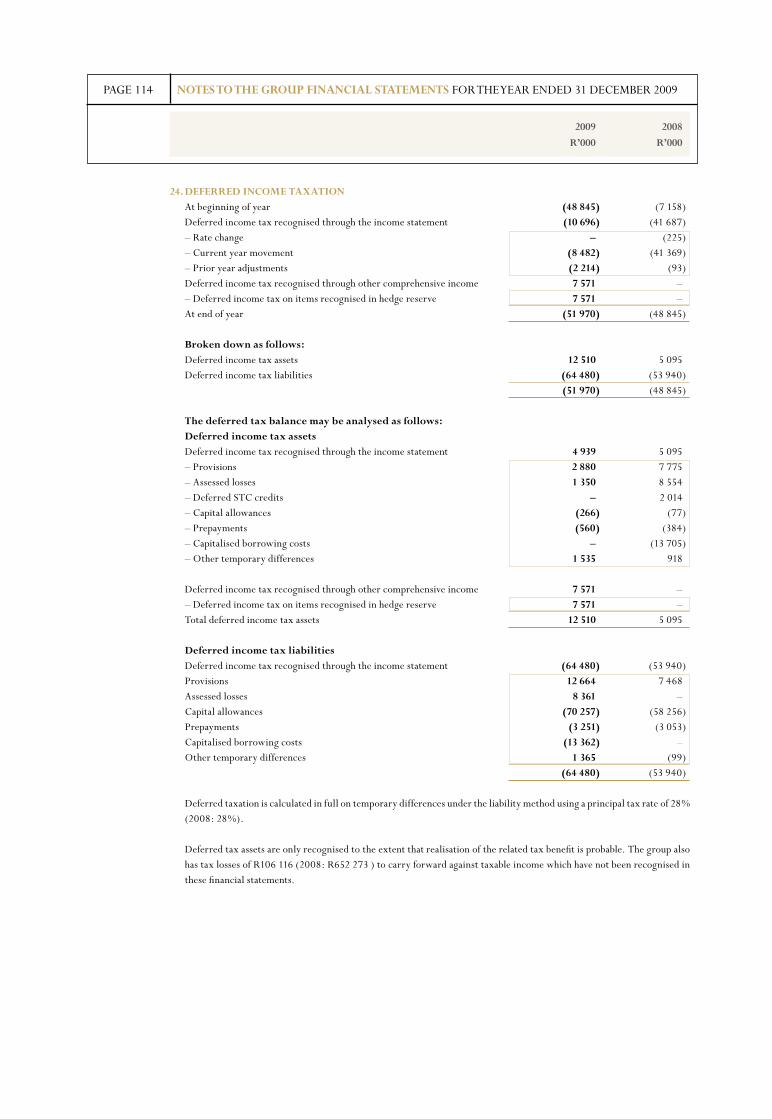
PAGE 114
2009 2008
R’000 R’000
NOTES TO ThE GROUP FINANCIAl STATEMENTS FOR THE YEAR ENDED 31 DECEMBER 2009
24. DEFERRED INCOME TAXATION At beginning of year (48 845) (7 158) Deferred income tax recognised through the income statement (10 696) (41 687) – Rate change – (225) – Current year movement (8 482) (41 369) – Prior year adjustments (2 214) (93) Deferred income tax recognised through other comprehensive income 7 571 – – Deferred income tax on items recognised in hedge reserve 7 571 – At end of year (51 970) (48 845)
Broken down as follows: Deferred income tax assets 12 510 5 095 Deferred income tax liabilities (64 480) (53 940) (51 970) (48 845)
The deferred tax balance may be analysed as follows: Deferred income tax assets Deferred income tax recognised through the income statement 4 939 5 095 – Provisions 2 880 7 775 – Assessed losses 1 350 8 554 – Deferred STC credits – 2 014 – Capital allowances (266) (77) – Prepayments (560) (384) – Capitalised borrowing costs – (13 705) – Other temporary differences 1 535 918
Deferred income tax recognised through other comprehensive income 7 571 – – Deferred income tax on items recognised in hedge reserve 7 571 – Total deferred income tax assets 12 510 5 095
Deferred income tax liabilities Deferred income tax recognised through the income statement (64 480) (53 940) Provisions 12 664 7 468 Assessed losses 8 361 – Capital allowances (70 257) (58 256) Prepayments (3 251) (3 053) Capitalised borrowing costs (13 362) – Other temporary differences 1 365 (99) (64 480) (53 940)
Deferred taxation is calculated in full on temporary differences under the liability method using a principal tax rate of 28% (2008: 28%).
Deferred tax assets are only recognised to the extent that realisation of the related tax benefit is probable. The group also has tax losses of R106 116 (2008: R652 273 ) to carry forward against taxable income which have not been recognised in these financial statements.
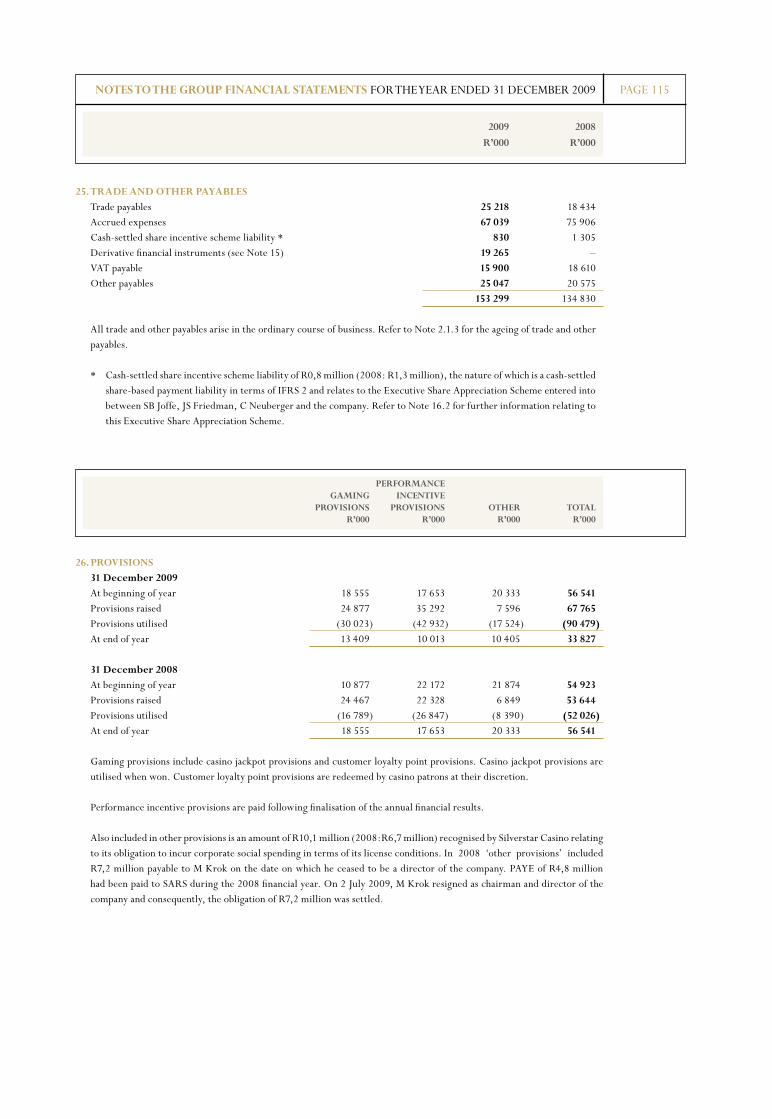
PAGE 115
2009 2008
R’000 R’000
25. TRADE AND OThER PAYABlES Trade payables 25 218 18 434 Accrued expenses 67 039 75 906 Cash-settled share incentive scheme liability * 830 1 305 Derivative financial instruments (see Note 15) 19 265 – VAT payable 15 900 18 610 Other payables 25 047 20 575 153 299 134 830
All trade and other payables arise in the ordinary course of business. Refer to Note 2.1.3 for the ageing of trade and other payables.
* Cash-settled share incentive scheme liability of R0,8 million (2008: R1,3 million), the nature of which is a cash-settled share-based payment liability in terms of IFRS 2 and relates to the Executive Share Appreciation Scheme entered into between SB Joffe, JS Friedman, C Neuberger and the company. Refer to Note 16.2 for further information relating to this Executive Share Appreciation Scheme.
26. PROVISIONS 31 December 2009 At beginning of year 18 555 17 653 20 333 56 541 Provisions raised 24 877 35 292 7 596 67 765 Provisions utilised (30 023) (42 932) (17 524) (90 479) At end of year 13 409 10 013 10 405 33 827
31 December 2008 At beginning of year 10 877 22 172 21 874 54 923 Provisions raised 24 467 22 328 6 849 53 644 Provisions utilised (16 789) (26 847) (8 390) (52 026) At end of year 18 555 17 653 20 333 56 541
Gaming provisions include casino jackpot provisions and customer loyalty point provisions. Casino jackpot provisions are utilised when won. Customer loyalty point provisions are redeemed by casino patrons at their discretion.
Performance incentive provisions are paid following finalisation of the annual financial results.
Also included in other provisions is an amount of R10,1 million (2008:R6,7 million) recognised by Silverstar Casino relating to its obligation to incur corporate social spending in terms of its license conditions. In 2008 ‘other provisions’ included R7,2 million payable to M Krok on the date on which he ceased to be a director of the company. PAYE of R4,8 million had been paid to SARS during the 2008 financial year. On 2 July 2009, M Krok resigned as chairman and director of the company and consequently, the obligation of R7,2 million was settled.
NOTES TO ThE GROUP FINANCIAl STATEMENTS FOR THE YEAR ENDED 31 DECEMBER 2009
PERFORMANCE GAMING INCENTIVE PROVISIONS PROVISIONS OThER TOTAl R’000 R’000 R’000 R’000
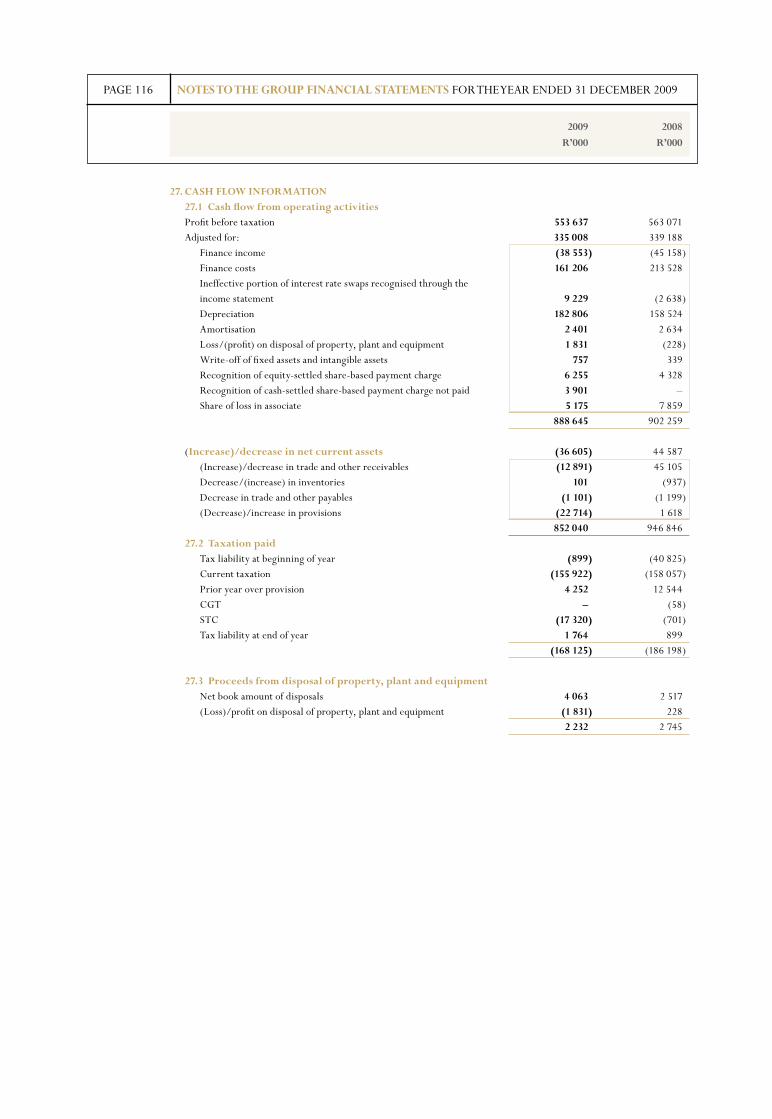
PAGE 116
2009 2008
R’000 R’000
27. CASh FlOW INFORMATION 27.1 Cash flow from operating activities Profit before taxation 553 637 563 071 Adjusted for: 335 008 339 188 Finance income (38 553) (45 158) Finance costs 161 206 213 528 Ineffective portion of interest rate swaps recognised through the income statement 9 229 (2 638) Depreciation 182 806 158 524 Amortisation 2 401 2 634 Loss/(profit) on disposal of property, plant and equipment 1 831 (228) Write-off of fixed assets and intangible assets 757 339 Recognition of equity-settled share-based payment charge 6 255 4 328 Recognition of cash-settled share-based payment charge not paid 3 901 – Share of loss in associate 5 175 7 859 888 645 902 259 (Increase)/decrease in net current assets (36 605) 44 587 (Increase)/decrease in trade and other receivables (12 891) 45 105 Decrease/(increase) in inventories 101 (937) Decrease in trade and other payables (1 101) (1 199) (Decrease)/increase in provisions (22 714) 1 618 852 040 946 846 27.2 Taxation paid Tax liability at beginning of year (899) (40 825) Current taxation (155 922) (158 057) Prior year over provision 4 252 12 544 CGT – (58) STC (17 320) (701) Tax liability at end of year 1 764 899 (168 125) (186 198)
27.3 Proceeds from disposal of property, plant and equipment Net book amount of disposals 4 063 2 517 (Loss)/profit on disposal of property, plant and equipment (1 831) 228 2 232 2 745
NOTES TO ThE GROUP FINANCIAl STATEMENTS FOR THE YEAR ENDED 31 DECEMBER 2009
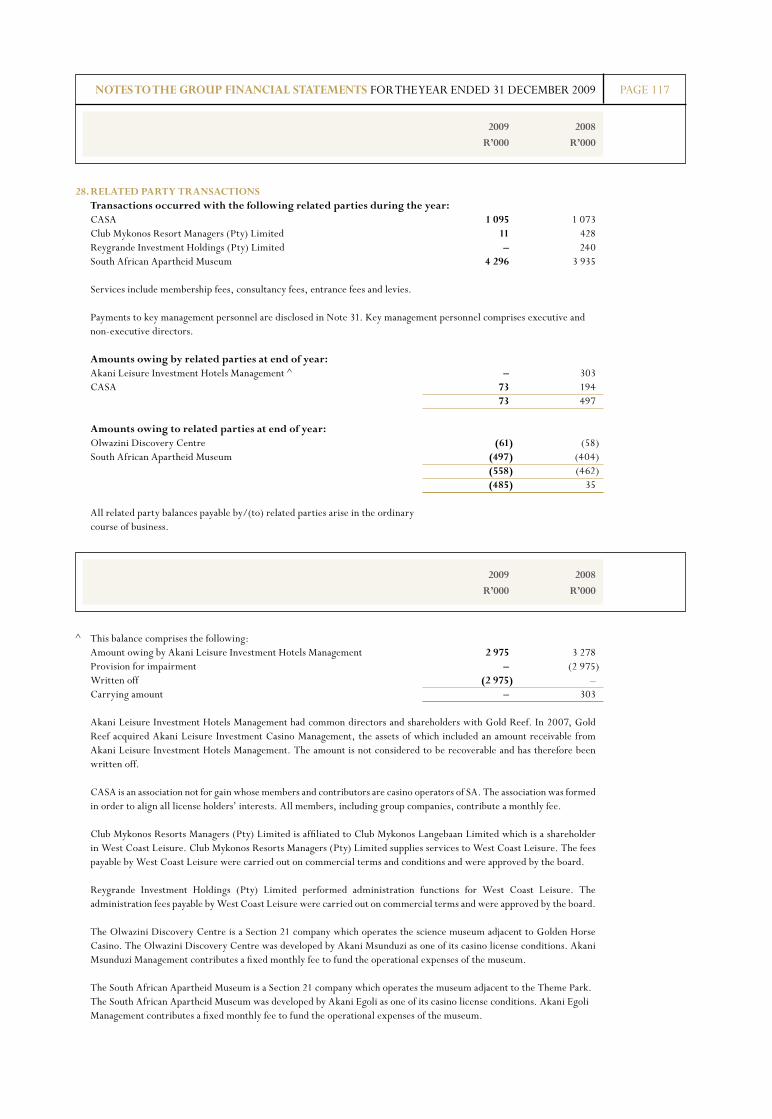
PAGE 117
2009 2008
R’000 R’000
28. RElATED PARTY TRANSACTIONS Transactions occurred with the following related parties during the year: CASA 1 095 1 073 Club Mykonos Resort Managers (Pty) Limited 11 428 Reygrande Investment Holdings (Pty) Limited – 240 South African Apartheid Museum 4 296 3 935
Services include membership fees, consultancy fees, entrance fees and levies.
Payments to key management personnel are disclosed in Note 31. Key management personnel comprises executive and non-executive directors.
Amounts owing by related parties at end of year: Akani Leisure Investment Hotels Management ^ – 303 CASA 73 194 73 497 Amounts owing to related parties at end of year: Olwazini Discovery Centre (61) (58) South African Apartheid Museum (497) (404) (558) (462) (485) 35
All related party balances payable by/(to) related parties arise in the ordinary course of business.
^ This balance comprises the following: Amount owing by Akani Leisure Investment Hotels Management 2 975 3 278 Provision for impairment – (2 975) Written off (2 975) – Carrying amount – 303 Akani Leisure Investment Hotels Management had common directors and shareholders with Gold Reef. In 2007, Gold
Reef acquired Akani Leisure Investment Casino Management, the assets of which included an amount receivable from Akani Leisure Investment Hotels Management. The amount is not considered to be recoverable and has therefore been written off.
CASA is an association not for gain whose members and contributors are casino operators of SA. The association was formed in order to align all license holders’ interests. All members, including group companies, contribute a monthly fee.
Club Mykonos Resorts Managers (Pty) Limited is affiliated to Club Mykonos Langebaan Limited which is a shareholder in West Coast Leisure. Club Mykonos Resorts Managers (Pty) Limited supplies services to West Coast Leisure. The fees payable by West Coast Leisure were carried out on commercial terms and conditions and were approved by the board.
Reygrande Investment Holdings (Pty) Limited performed administration functions for West Coast Leisure. The administration fees payable by West Coast Leisure were carried out on commercial terms and were approved by the board.
The Olwazini Discovery Centre is a Section 21 company which operates the science museum adjacent to Golden Horse Casino. The Olwazini Discovery Centre was developed by Akani Msunduzi as one of its casino license conditions. Akani Msunduzi Management contributes a fixed monthly fee to fund the operational expenses of the museum.
The South African Apartheid Museum is a Section 21 company which operates the museum adjacent to the Theme Park. The South African Apartheid Museum was developed by Akani Egoli as one of its casino license conditions. Akani Egoli Management contributes a fixed monthly fee to fund the operational expenses of the museum.
NOTES TO ThE GROUP FINANCIAl STATEMENTS FOR THE YEAR ENDED 31 DECEMBER 2009
2009 2008
R’000 R’000
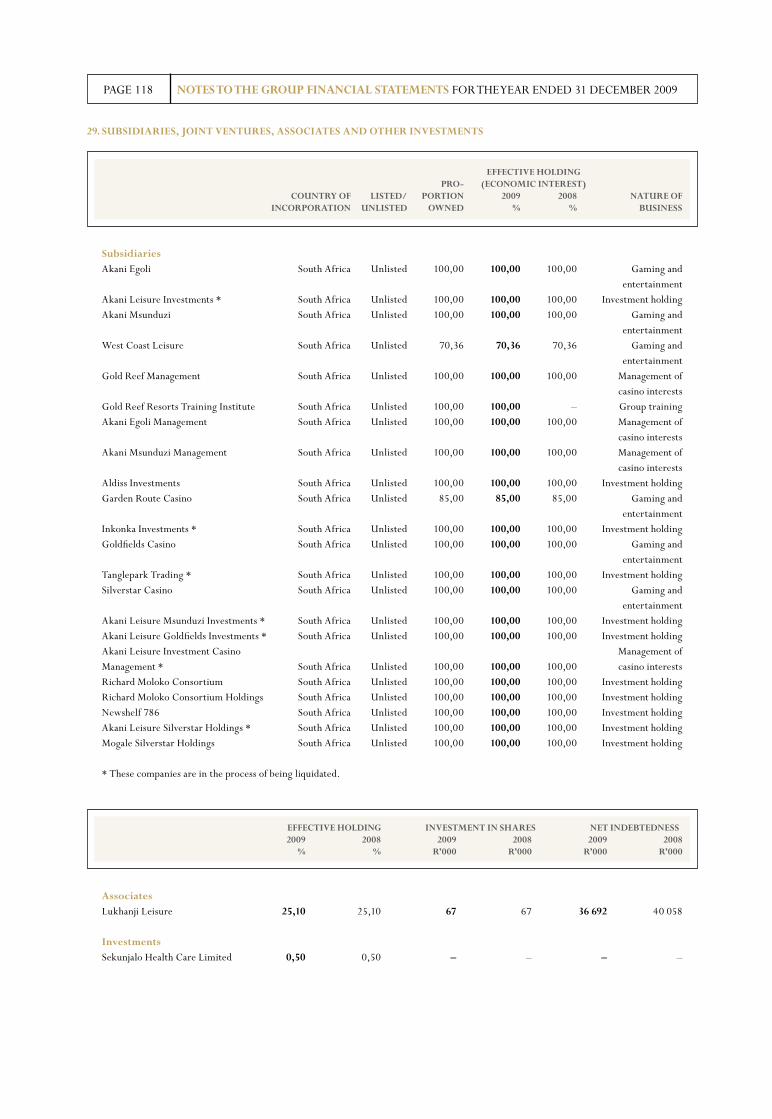
PAGE 118
29. SUBSIDIARIES, JOINT VENTURES, ASSOCIATES AND OThER INVESTMENTS
Subsidiaries Akani Egoli South Africa Unlisted 100,00 100,00 100,00 Gaming and entertainment Akani Leisure Investments * South Africa Unlisted 100,00 100,00 100,00 Investment holding Akani Msunduzi South Africa Unlisted 100,00 100,00 100,00 Gaming and entertainment West Coast Leisure South Africa Unlisted 70,36 70,36 70,36 Gaming and entertainment Gold Reef Management South Africa Unlisted 100,00 100,00 100,00 Management of casino interests Gold Reef Resorts Training Institute South Africa Unlisted 100,00 100,00 – Group training Akani Egoli Management South Africa Unlisted 100,00 100,00 100,00 Management of casino interests Akani Msunduzi Management South Africa Unlisted 100,00 100,00 100,00 Management of casino interests Aldiss Investments South Africa Unlisted 100,00 100,00 100,00 Investment holding Garden Route Casino South Africa Unlisted 85,00 85,00 85,00 Gaming and entertainment Inkonka Investments * South Africa Unlisted 100,00 100,00 100,00 Investment holding Goldfields Casino South Africa Unlisted 100,00 100,00 100,00 Gaming and entertainment Tanglepark Trading * South Africa Unlisted 100,00 100,00 100,00 Investment holding Silverstar Casino South Africa Unlisted 100,00 100,00 100,00 Gaming and entertainment Akani Leisure Msunduzi Investments * South Africa Unlisted 100,00 100,00 100,00 Investment holding Akani Leisure Goldfields Investments * South Africa Unlisted 100,00 100,00 100,00 Investment holding Akani Leisure Investment Casino Management of Management * South Africa Unlisted 100,00 100,00 100,00 casino interests Richard Moloko Consortium South Africa Unlisted 100,00 100,00 100,00 Investment holding Richard Moloko Consortium Holdings South Africa Unlisted 100,00 100,00 100,00 Investment holding Newshelf 786 South Africa Unlisted 100,00 100,00 100,00 Investment holding Akani Leisure Silverstar Holdings * South Africa Unlisted 100,00 100,00 100,00 Investment holding Mogale Silverstar Holdings South Africa Unlisted 100,00 100,00 100,00 Investment holding
* These companies are in the process of being liquidated.
Associates Lukhanji Leisure 25,10 25,10 67 67 36 692 40 058
Investments Sekunjalo Health Care Limited 0,50 0,50 – – – –
NOTES TO ThE GROUP FINANCIAl STATEMENTS FOR THE YEAR ENDED 31 DECEMBER 2009
EFFECTIVE hOlDING PRO- (ECONOMIC INTEREST) COUNTRY OF lISTED/ PORTION 2009 2008 NATURE OF INCORPORATION UNlISTED OWNED % % BUSINESS
EFFECTIVE hOlDING INVESTMENT IN ShARES NET INDEBTEDNESS 2009 2008 2009 2008 2009 2008 % % R’000 R’000 R’000 R’000

PAGE 119
2009 2008
R’000 R’000
30. CONTINGENCIES, COMMITMENTS AND GUARANTEES At 31 December 2009 the group had contingent liabilities in respect of bank
and other guarantees as well as other matters arising in the ordinary course of business from which it is anticipated that no material liabilities will arise.
The details are as follows: Guarantees 1 530 903 1 689 356 Litigation 5 000 7 500 Transaction costs relating to proposed transaction 33 856 – Capital expenditure committed or approved 43 520 74 152 1 613 279 1 771 008
Gold Reef has entered into an agreement with Nedbank and the Eastern Cape Gambling and Betting Board whereby the bank has guaranteed an agreed capital amount not exceeding R3 935 542 (2008: R3 935 542) for the completion of the construction of the proposals contained in Queens Casino’s bid application.
Akani Egoli has entered into an agreement with Nedbank and the Gauteng Gambling Board whereby the bank has guaranteed an agreed capital amount not exceeding R38 271 389 (2008: R38 271 389) for gambling board taxes and working capital. Akani Egoli has provided guarantees to various food and beverage suppliers for R150 000 (2008:RNil). Akani Egoli has provided a guarantee to Nedbank for Gold Reef City Theme Park’s banking facility of R2 507 000 (2008: R2 507 000).
Gold Reef City Theme Park has provided a guarantee to Eskom for R507 000 (2008:R507 000). Subsequent to year-end, the guarantee increased to R782 700.
Akani Msunduzi has entered into an agreement with ABSA and the KwaZulu-Natal Gambling Board whereby the bank has guaranteed an agreed capital amount not exceeding R5 260 000 (2008: R5 260 000) for gambling board taxes and working capital. ABSA has also issued a guarantee to the Msunduzi Municipality for R708 000 (2008: R708 000) on behalf of Akani Msunduzi.
Goldfields Casino has entered into an agreement with Nedbank and the Free State Gambling and Racing Board whereby the bank has guaranteed an agreed capital amount not exceeding R1 000 000 (2008: R1 000 000) for gambling board taxes and working capital.
West Coast Leisure has entered into an agreement with ABSA and the Western Cape Gambling and Racing Board whereby the bank has guaranteed an agreed capital amount not exceeding R250 000 (2008: R250 000) for gambling board taxes and working capital. In terms of the license conditions for the casino operator license, issued by the Western Cape Gambling and Racing Board, West Coast Leisure has placed on deposit an amount of R1 500 000 which funding, when required, will be used to partly finance the construction of the new main road to replace the existing Minor Road 44 link between Mykonos and Main Road 233 or an alternative project to be agreed with the Western Cape Gambling and Racing Board.
Silverstar Casino has entered into an agreement with Nedbank and the Gauteng Gambling Board whereby the bank has guaranteed an agreed capital amount not exceeding R20 941 670 (2008:R20 941 670) for gambling board taxes and working capital. Silverstar Casino has also provided a guarantee to Mogale City Municipal Council for R650 000 (2008:R650 000).
Garden Route Casino has entered into an agreement with Nedbank and the Western Cape Gambling and Racing Board whereby the bank has guaranteed an agreed capital amount not exceeding R450 000 (2008: R400 000) for gambling board taxes and working capital.
The company has bound itself as surety for Akani Egoli, Silverstar Casino, Akani Msunduzi, West Coast Leisure and Queens Casino to their bankers for 100%, 100%, 100%, 70,33% and 35,72% of their exposure respectively. The contingent liability under these sureties in aggregate amounted to R1 458 779 000 (2008: R1 622 058 000).
Gold Reef has a controlling interest in a casino license application for a casino in the Vaal River/Sasolburg region and a 50% interest in a casino license application in Botswana.
Litigation comprises a general contingency for litigation and related costs throughout all group companies.
NOTES TO ThE GROUP FINANCIAl STATEMENTS FOR THE YEAR ENDED 31 DECEMBER 2009
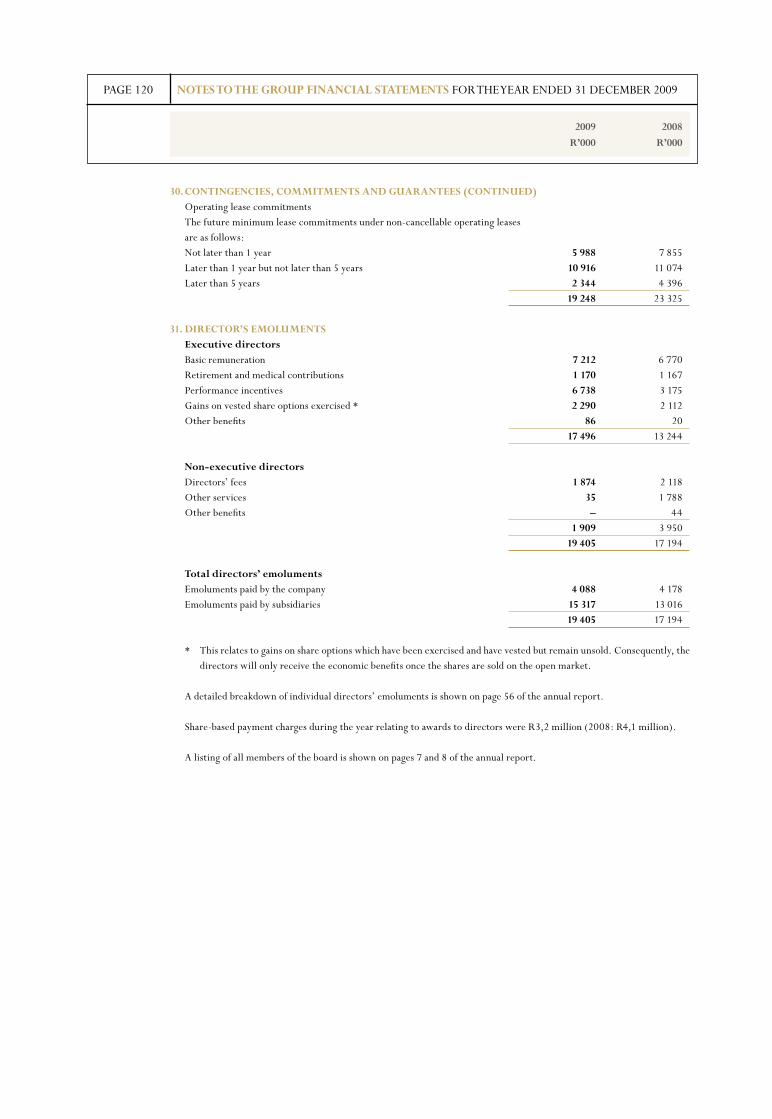
PAGE 120
2009 2008
R’000 R’000
30. CONTINGENCIES, COMMITMENTS AND GUARANTEES (CONTINUED) Operating lease commitments The future minimum lease commitments under non-cancellable operating leases are as follows: Not later than 1 year 5 988 7 855 Later than 1 year but not later than 5 years 10 916 11 074 Later than 5 years 2 344 4 396 19 248 23 325
31. DIRECTOR’S EMOlUMENTS Executive directors Basic remuneration 7 212 6 770 Retirement and medical contributions 1 170 1 167 Performance incentives 6 738 3 175 Gains on vested share options exercised * 2 290 2 112 Other benefits 86 20 17 496 13 244
Non-executive directors Directors’ fees 1 874 2 118 Other services 35 1 788 Other benefits – 44 1 909 3 950 19 405 17 194
Total directors’ emoluments Emoluments paid by the company 4 088 4 178 Emoluments paid by subsidiaries 15 317 13 016 19 405 17 194
* This relates to gains on share options which have been exercised and have vested but remain unsold. Consequently, the directors will only receive the economic benefits once the shares are sold on the open market.
A detailed breakdown of individual directors’ emoluments is shown on page 56 of the annual report.
Share-based payment charges during the year relating to awards to directors were R3,2 million (2008: R4,1 million).
A listing of all members of the board is shown on pages 7 and 8 of the annual report.
NOTES TO ThE GROUP FINANCIAl STATEMENTS FOR THE YEAR ENDED 31 DECEMBER 2009
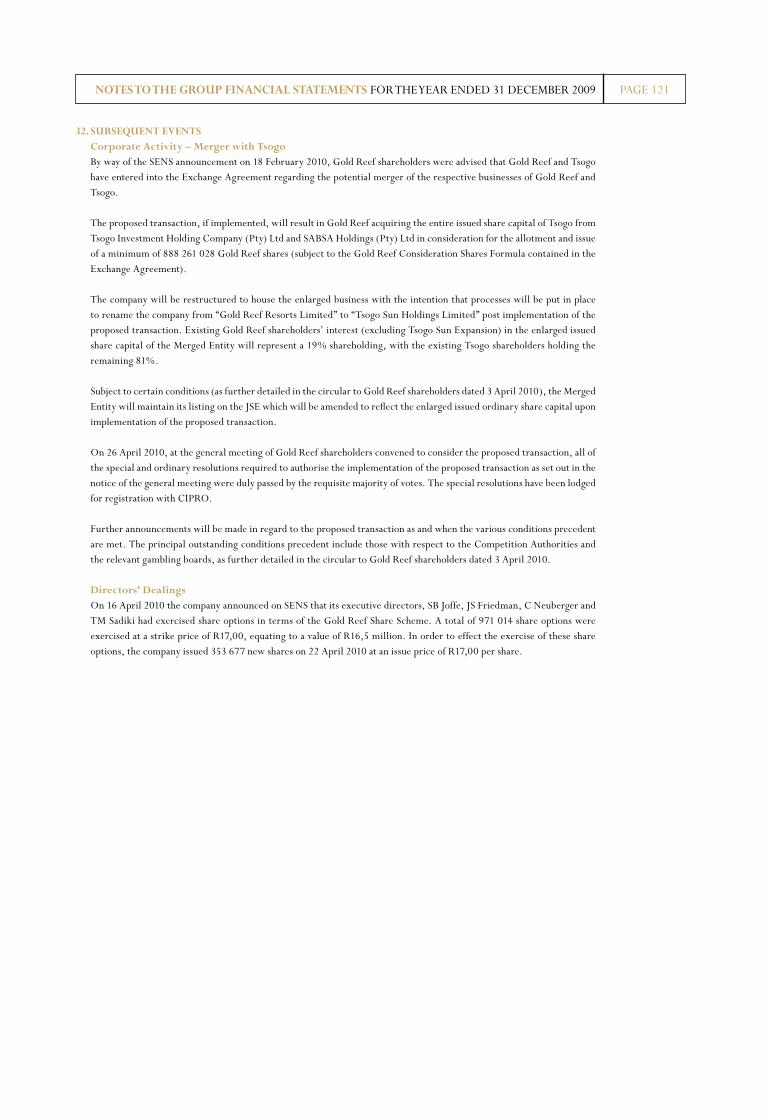
PAGE 121
32. SUBSEQUENT EVENTS Corporate Activity – Merger with Tsogo By way of the SENS announcement on 18 February 2010, Gold Reef shareholders were advised that Gold Reef and Tsogo
have entered into the Exchange Agreement regarding the potential merger of the respective businesses of Gold Reef and Tsogo.
The proposed transaction, if implemented, will result in Gold Reef acquiring the entire issued share capital of Tsogo from Tsogo Investment Holding Company (Pty) Ltd and SABSA Holdings (Pty) Ltd in consideration for the allotment and issue of a minimum of 888 261 028 Gold Reef shares (subject to the Gold Reef Consideration Shares Formula contained in the Exchange Agreement).
The company will be restructured to house the enlarged business with the intention that processes will be put in place to rename the company from “Gold Reef Resorts Limited” to “Tsogo Sun Holdings Limited” post implementation of the proposed transaction. Existing Gold Reef shareholders’ interest (excluding Tsogo Sun Expansion) in the enlarged issued share capital of the Merged Entity will represent a 19% shareholding, with the existing Tsogo shareholders holding the remaining 81%.
Subject to certain conditions (as further detailed in the circular to Gold Reef shareholders dated 3 April 2010), the Merged Entity will maintain its listing on the JSE which will be amended to reflect the enlarged issued ordinary share capital upon implementation of the proposed transaction.
On 26 April 2010, at the general meeting of Gold Reef shareholders convened to consider the proposed transaction, all of the special and ordinary resolutions required to authorise the implementation of the proposed transaction as set out in the notice of the general meeting were duly passed by the requisite majority of votes. The special resolutions have been lodged for registration with CIPRO.
Further announcements will be made in regard to the proposed transaction as and when the various conditions precedent are met. The principal outstanding conditions precedent include those with respect to the Competition Authorities and the relevant gambling boards, as further detailed in the circular to Gold Reef shareholders dated 3 April 2010.
Directors’ Dealings On 16 April 2010 the company announced on SENS that its executive directors, SB Joffe, JS Friedman, C Neuberger and
TM Sadiki had exercised share options in terms of the Gold Reef Share Scheme. A total of 971 014 share options were exercised at a strike price of R17,00, equating to a value of R16,5 million. In order to effect the exercise of these share options, the company issued 353 677 new shares on 22 April 2010 at an issue price of R17,00 per share.
NOTES TO ThE GROUP FINANCIAl STATEMENTS FOR THE YEAR ENDED 31 DECEMBER 2009
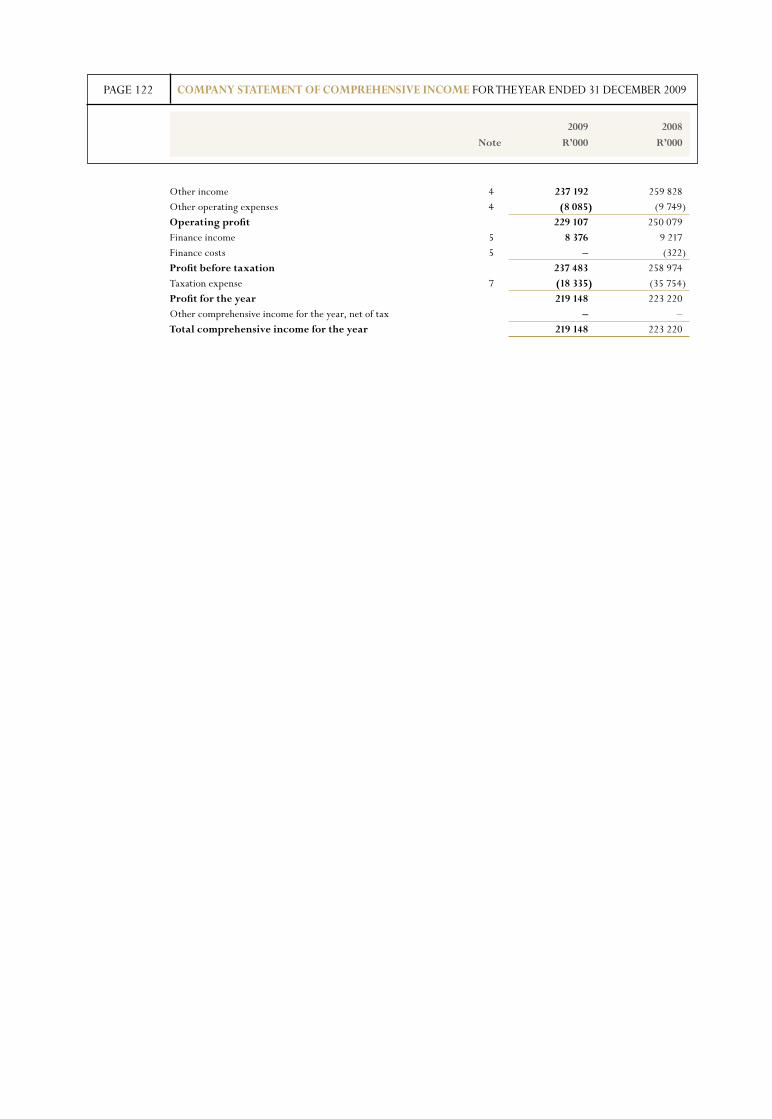
PAGE 122
2009 2008
Note R’000 R’000
COMPANY STATEMENT OF COMPREhENSIVE INCOME FOR THE YEAR ENDED 31 DECEMBER 2009
Other income 4 237 192 259 828 Other operating expenses 4 (8 085) (9 749)Operating profit 229 107 250 079 Finance income 5 8 376 9 217 Finance costs 5 – (322)Profit before taxation 237 483 258 974 Taxation expense 7 (18 335) (35 754)Profit for the year 219 148 223 220 Other comprehensive income for the year, net of tax – – Total comprehensive income for the year 219 148 223 220
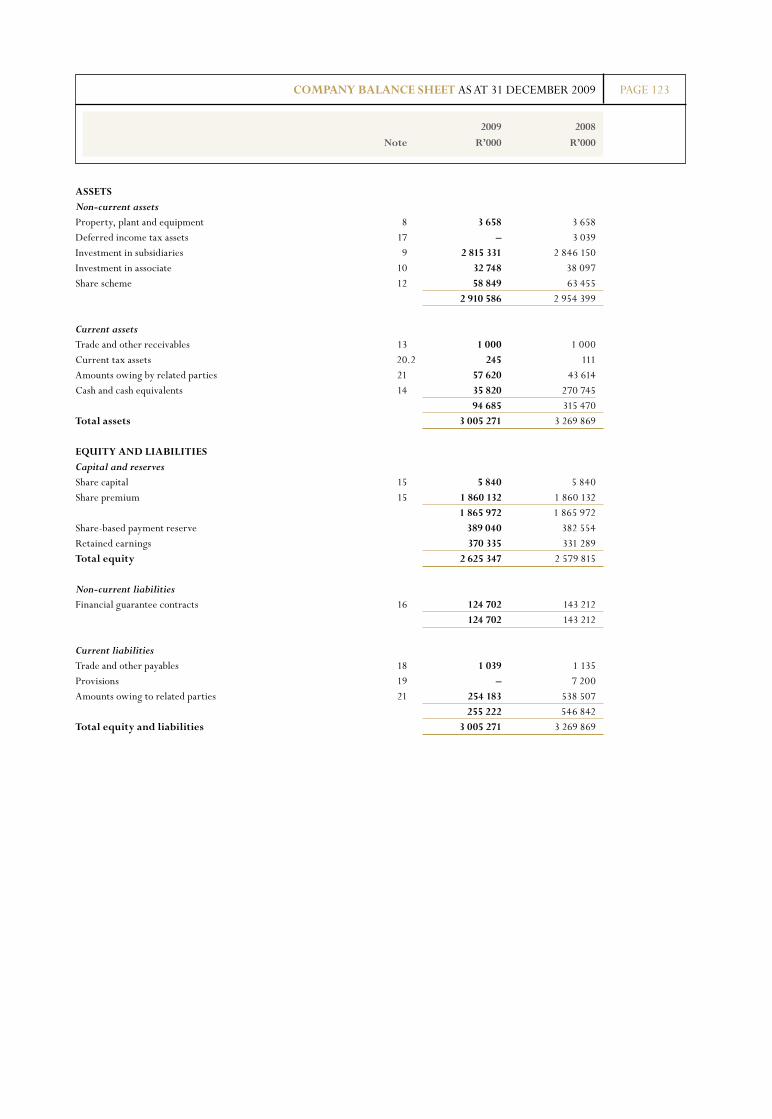
PAGE 123COMPANY BAlANCE ShEET AS AT 31 DECEMBER 2009
2009 2008
Note R’000 R’000
ASSETS Non-current assets Property, plant and equipment 8 3 658 3 658 Deferred income tax assets 17 – 3 039 Investment in subsidiaries 9 2 815 331 2 846 150 Investment in associate 10 32 748 38 097 Share scheme 12 58 849 63 455 2 910 586 2 954 399 Current assets Trade and other receivables 13 1 000 1 000 Current tax assets 20.2 245 111 Amounts owing by related parties 21 57 620 43 614 Cash and cash equivalents 14 35 820 270 745 94 685 315 470 Total assets 3 005 271 3 269 869 EQUITY AND lIABIlITIES Capital and reserves Share capital 15 5 840 5 840 Share premium 15 1 860 132 1 860 132 1 865 972 1 865 972 Share-based payment reserve 389 040 382 554 Retained earnings 370 335 331 289 Total equity 2 625 347 2 579 815 Non-current liabilities Financial guarantee contracts 16 124 702 143 212 124 702 143 212 Current liabilities Trade and other payables 18 1 039 1 135 Provisions 19 – 7 200 Amounts owing to related parties 21 254 183 538 507 255 222 546 842 Total equity and liabilities 3 005 271 3 269 869
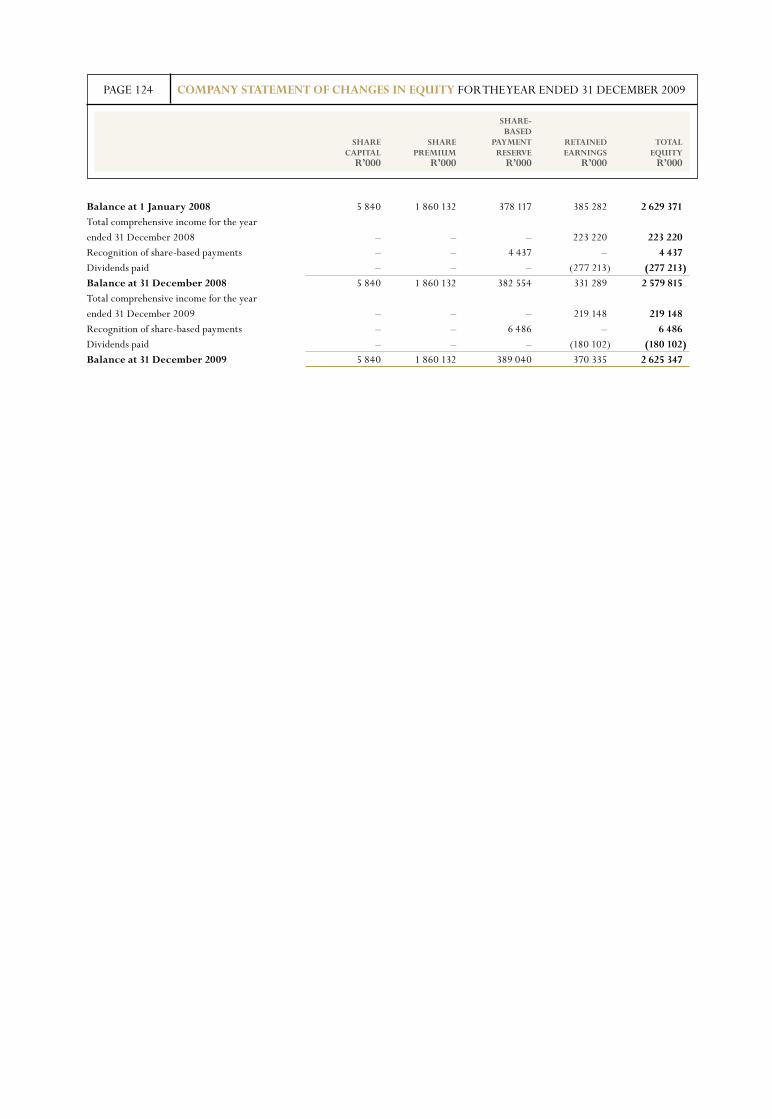
ShARE- BASED ShARE ShARE PAYMENT RETAINED TOTAl CAPITAl PREMIUM RESERVE EARNINGS EQUITY R’000 R’000 R’000 R’000 R’000
Balance at 1 January 2008 5 840 1 860 132 378 117 385 282 2 629 371 Total comprehensive income for the year ended 31 December 2008 – – – 223 220 223 220Recognition of share-based payments – – 4 437 – 4 437 Dividends paid – – – (277 213) (277 213) Balance at 31 December 2008 5 840 1 860 132 382 554 331 289 2 579 815 Total comprehensive income for the year ended 31 December 2009 – – – 219 148 219 148 Recognition of share-based payments – – 6 486 – 6 486 Dividends paid – – – (180 102) (180 102) Balance at 31 December 2009 5 840 1 860 132 389 040 370 335 2 625 347
PAGE 124 COMPANY STATEMENT OF ChANGES IN EQUITY FOR THE YEAR ENDED 31 DECEMBER 2009
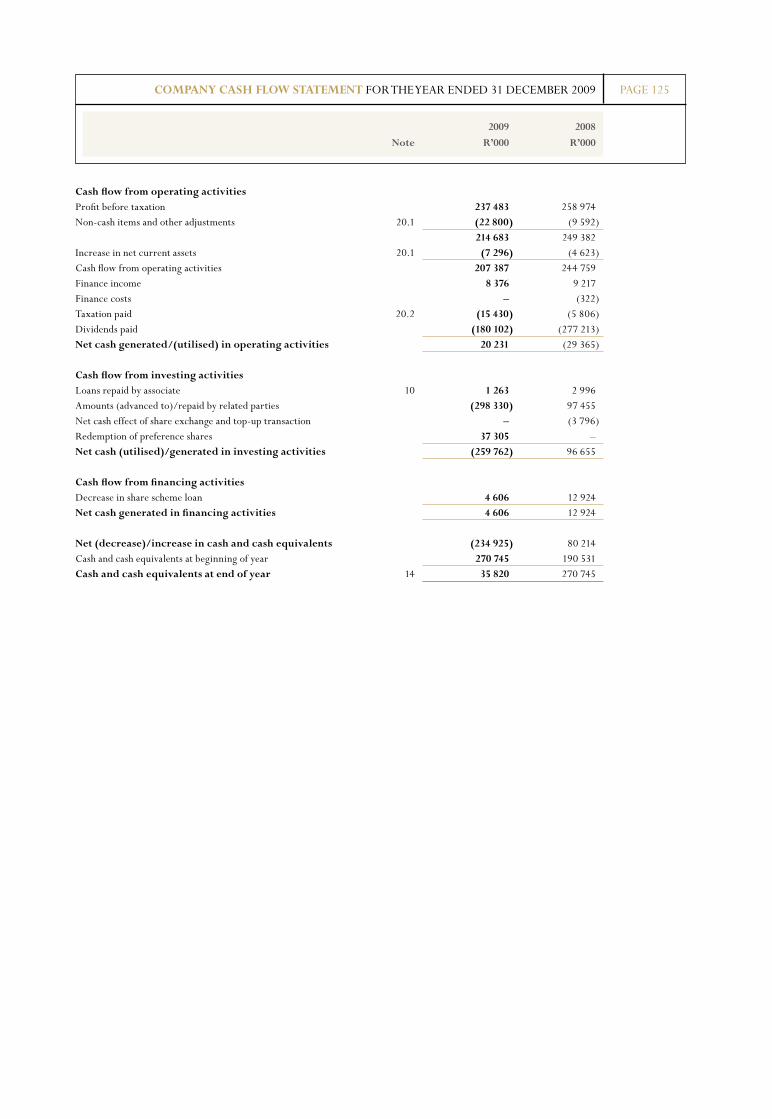
PAGE 125
2009 2008
Note R’000 R’000
COMPANY CASh FlOW STATEMENT FOR THE YEAR ENDED 31 DECEMBER 2009
Cash flow from operating activities Profit before taxation 237 483 258 974 Non-cash items and other adjustments 20.1 (22 800) (9 592) 214 683 249 382 Increase in net current assets 20.1 (7 296) (4 623)Cash flow from operating activities 207 387 244 759 Finance income 8 376 9 217 Finance costs – (322)Taxation paid 20.2 (15 430) (5 806)Dividends paid (180 102) (277 213)Net cash generated/(utilised) in operating activities 20 231 (29 365) Cash flow from investing activities Loans repaid by associate 10 1 263 2 996 Amounts (advanced to)/repaid by related parties (298 330) 97 455 Net cash effect of share exchange and top-up transaction – (3 796)Redemption of preference shares 37 305 –Net cash (utilised)/generated in investing activities (259 762) 96 655 Cash flow from financing activities Decrease in share scheme loan 4 606 12 924 Net cash generated in financing activities 4 606 12 924 Net (decrease)/increase in cash and cash equivalents (234 925) 80 214 Cash and cash equivalents at beginning of year 270 745 190 531 Cash and cash equivalents at end of year 14 35 820 270 745

PAGE 126
2009 2008
R’000 R’000
4. OPERATING PROFIT The following items have been credited/(charged) in arriving at operating profit: Other income Dividends received 197 799 229 784 Royalty fees 16 084 16 114 Amortisation of financial guarantee contracts 18 510 6 075 Other 4 799 7 855 237 192 259 828
Other operating expenses Auditor’s remuneration (1 087) (1 008) – Audit fees – current year (1 087) (1 008) – Audit fees – prior year – – – Other services – – Impairment of investment in associate (4 086) (1 924) Financial guarantee contract relating to associate expensed on initial recognition – (3 454) Other expenses (2 912) (3 363) (8 085) (9 749)
5. FINANCE (COSTS)/INCOME Finance costs: Interest expense – Bank – (322) Total finance costs – (322) Finance income: Interest income – Bank 748 1 237 – Other 7 628 7 980 Total finance income 8 376 9 217 Net finance income 8 376 8 895
6. DIVIDEND PER ShARE Subsequent to year-end an ordinary dividend of 65,0 cents was declared (2008: 65,0 cents). In terms of IAS 10 – ‘Events
after the Reporting Period’, this is regarded as a non-adjusting event and will be accounted for in the 2010 annual financial statements. Salient dates are set out in the Shareholders’ Diary incorporated in this annual report. STC of approximately R18 million is payable on the dividend.
NOTES TO ThE COMPANY FINANCIAl STATEMENTS FOR THE YEAR ENDED 31 DECEMBER 2009
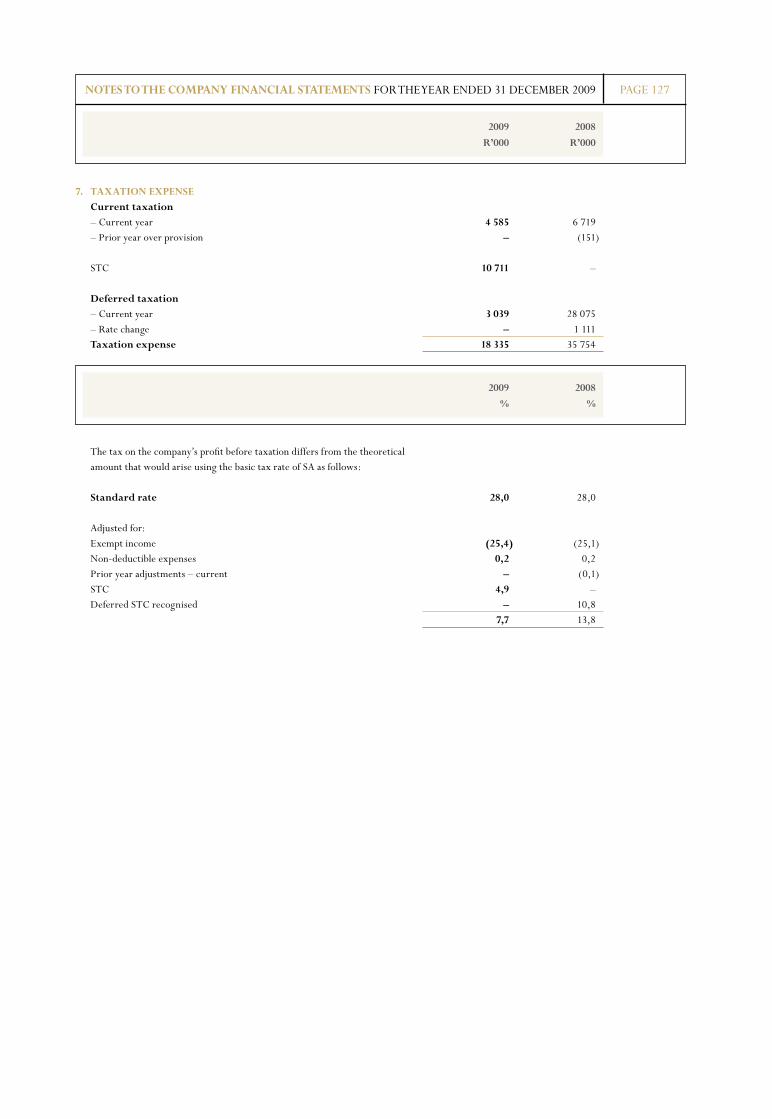
PAGE 127
2009 2008
R’000 R’000
7. TAXATION EXPENSE Current taxation – Current year 4 585 6 719 – Prior year over provision – (151) STC 10 711 – Deferred taxation – Current year 3 039 28 075 – Rate change – 1 111 Taxation expense 18 335 35 754
The tax on the company’s profit before taxation differs from the theoretical amount that would arise using the basic tax rate of SA as follows: Standard rate 28,0 28,0 Adjusted for: Exempt income (25,4) (25,1) Non-deductible expenses 0,2 0,2 Prior year adjustments – current – (0,1) STC 4,9 – Deferred STC recognised – 10,8 7,7 13,8
NOTES TO ThE COMPANY FINANCIAl STATEMENTS FOR THE YEAR ENDED 31 DECEMBER 2009
2009 2008
% %
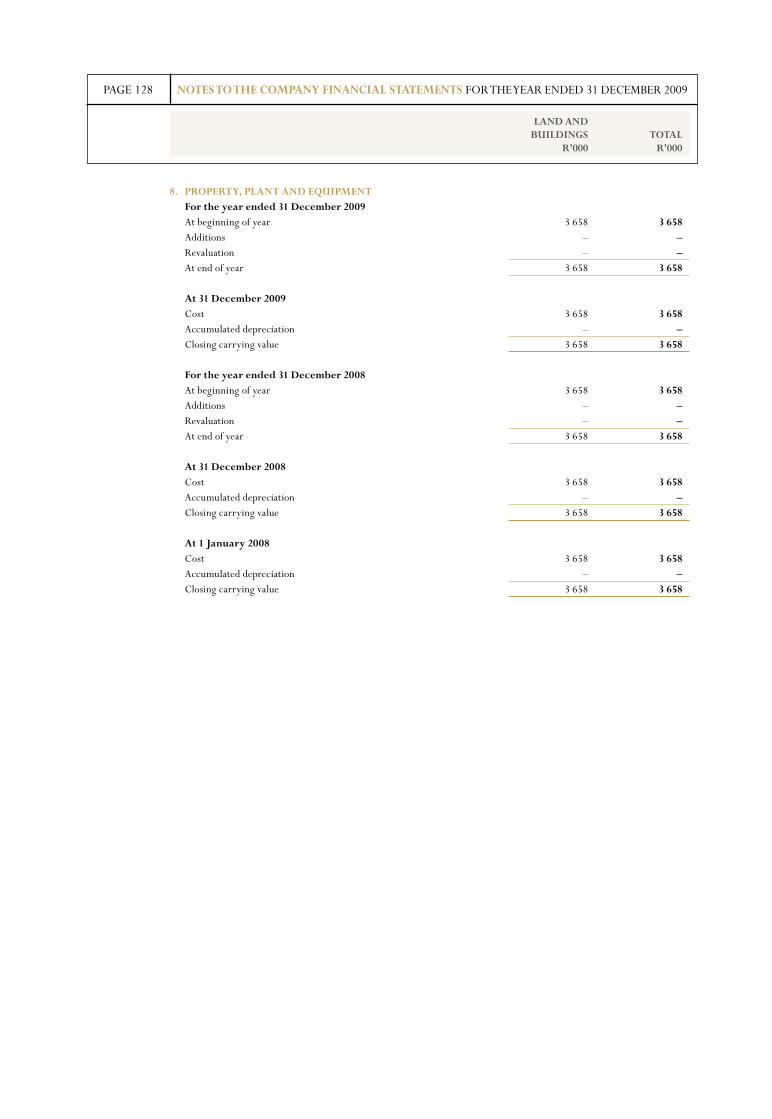
PAGE 128
lAND AND BUIlDINGS TOTAl R’000 R’000
8. PROPERTY, PlANT AND EQUIPMENT For the year ended 31 December 2009 At beginning of year 3 658 3 658 Additions – – Revaluation – – At end of year 3 658 3 658 At 31 December 2009 Cost 3 658 3 658 Accumulated depreciation – – Closing carrying value 3 658 3 658 For the year ended 31 December 2008 At beginning of year 3 658 3 658 Additions – – Revaluation – – At end of year 3 658 3 658 At 31 December 2008 Cost 3 658 3 658 Accumulated depreciation – – Closing carrying value 3 658 3 658 At 1 January 2008 Cost 3 658 3 658 Accumulated depreciation – – Closing carrying value 3 658 3 658
NOTES TO ThE COMPANY FINANCIAl STATEMENTS FOR THE YEAR ENDED 31 DECEMBER 2009
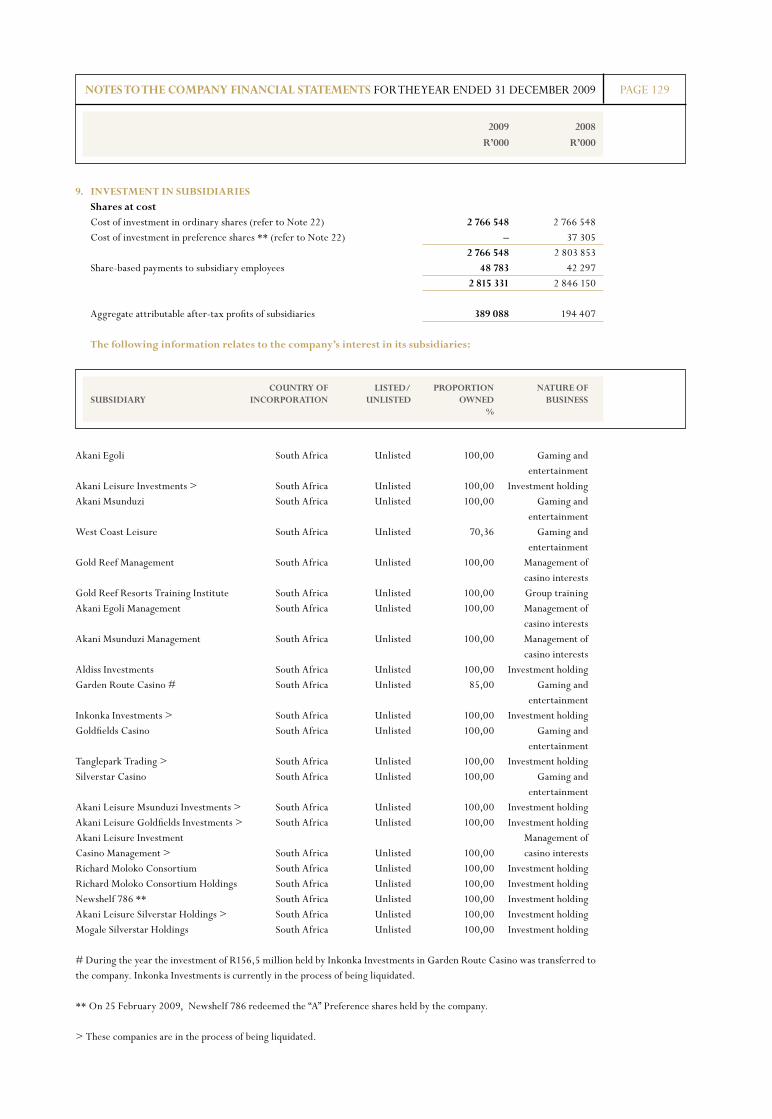
PAGE 129
2009 2008
R’000 R’000
9. INVESTMENT IN SUBSIDIARIES Shares at cost Cost of investment in ordinary shares (refer to Note 22) 2 766 548 2 766 548 Cost of investment in preference shares ** (refer to Note 22) – 37 305 2 766 548 2 803 853 Share-based payments to subsidiary employees 48 783 42 297 2 815 331 2 846 150
Aggregate attributable after-tax profits of subsidiaries 389 088 194 407 The following information relates to the company’s interest in its subsidiaries:
Akani Egoli South Africa Unlisted 100,00 Gaming and entertainmentAkani Leisure Investments > South Africa Unlisted 100,00 Investment holdingAkani Msunduzi South Africa Unlisted 100,00 Gaming and entertainmentWest Coast Leisure South Africa Unlisted 70,36 Gaming and entertainmentGold Reef Management South Africa Unlisted 100,00 Management of casino interestsGold Reef Resorts Training Institute South Africa Unlisted 100,00 Group training Akani Egoli Management South Africa Unlisted 100,00 Management of casino interestsAkani Msunduzi Management South Africa Unlisted 100,00 Management of casino interestsAldiss Investments South Africa Unlisted 100,00 Investment holdingGarden Route Casino # South Africa Unlisted 85,00 Gaming and entertainmentInkonka Investments > South Africa Unlisted 100,00 Investment holdingGoldfields Casino South Africa Unlisted 100,00 Gaming and entertainmentTanglepark Trading > South Africa Unlisted 100,00 Investment holdingSilverstar Casino South Africa Unlisted 100,00 Gaming and entertainmentAkani Leisure Msunduzi Investments > South Africa Unlisted 100,00 Investment holdingAkani Leisure Goldfields Investments > South Africa Unlisted 100,00 Investment holdingAkani Leisure Investment Management ofCasino Management > South Africa Unlisted 100,00 casino interestsRichard Moloko Consortium South Africa Unlisted 100,00 Investment holdingRichard Moloko Consortium Holdings South Africa Unlisted 100,00 Investment holdingNewshelf 786 ** South Africa Unlisted 100,00 Investment holdingAkani Leisure Silverstar Holdings > South Africa Unlisted 100,00 Investment holdingMogale Silverstar Holdings South Africa Unlisted 100,00 Investment holding
# During the year the investment of R156,5 million held by Inkonka Investments in Garden Route Casino was transferred to the company. Inkonka Investments is currently in the process of being liquidated. ** On 25 February 2009, Newshelf 786 redeemed the “A” Preference shares held by the company. > These companies are in the process of being liquidated.
NOTES TO ThE COMPANY FINANCIAl STATEMENTS FOR THE YEAR ENDED 31 DECEMBER 2009
COUNTRY OF lISTED/ PROPORTION NATURE OF SUBSIDIARY INCORPORATION UNlISTED OWNED BUSINESS %
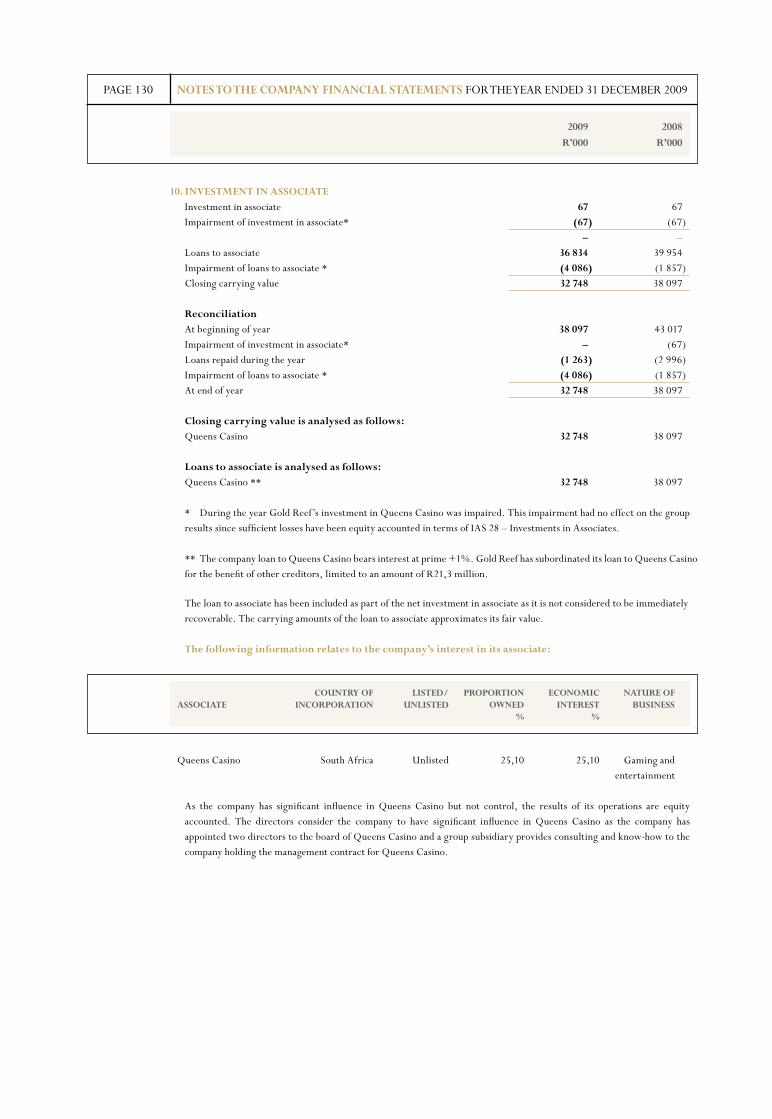
PAGE 130
2009 2008
R’000 R’000
NOTES TO ThE COMPANY FINANCIAl STATEMENTS FOR THE YEAR ENDED 31 DECEMBER 2009
10. INVESTMENT IN ASSOCIATE Investment in associate 67 67 Impairment of investment in associate* (67) (67) – – Loans to associate 36 834 39 954 Impairment of loans to associate * (4 086) (1 857) Closing carrying value 32 748 38 097 Reconciliation At beginning of year 38 097 43 017 Impairment of investment in associate* – (67) Loans repaid during the year (1 263) (2 996) Impairment of loans to associate * (4 086) (1 857) At end of year 32 748 38 097 Closing carrying value is analysed as follows: Queens Casino 32 748 38 097 loans to associate is analysed as follows: Queens Casino ** 32 748 38 097 * During the year Gold Reef’s investment in Queens Casino was impaired. This impairment had no effect on the group
results since sufficient losses have been equity accounted in terms of IAS 28 – Investments in Associates.
** The company loan to Queens Casino bears interest at prime +1%. Gold Reef has subordinated its loan to Queens Casino for the benefit of other creditors, limited to an amount of R21,3 million.
The loan to associate has been included as part of the net investment in associate as it is not considered to be immediately recoverable. The carrying amounts of the loan to associate approximates its fair value.
The following information relates to the company’s interest in its associate:
Queens Casino South Africa Unlisted 25,10 25,10 Gaming and entertainment
As the company has significant influence in Queens Casino but not control, the results of its operations are equity accounted. The directors consider the company to have significant influence in Queens Casino as the company has appointed two directors to the board of Queens Casino and a group subsidiary provides consulting and know-how to the company holding the management contract for Queens Casino.
COUNTRY OF lISTED/ PROPORTION ECONOMIC NATURE OF ASSOCIATE INCORPORATION UNlISTED OWNED INTEREST BUSINESS % %
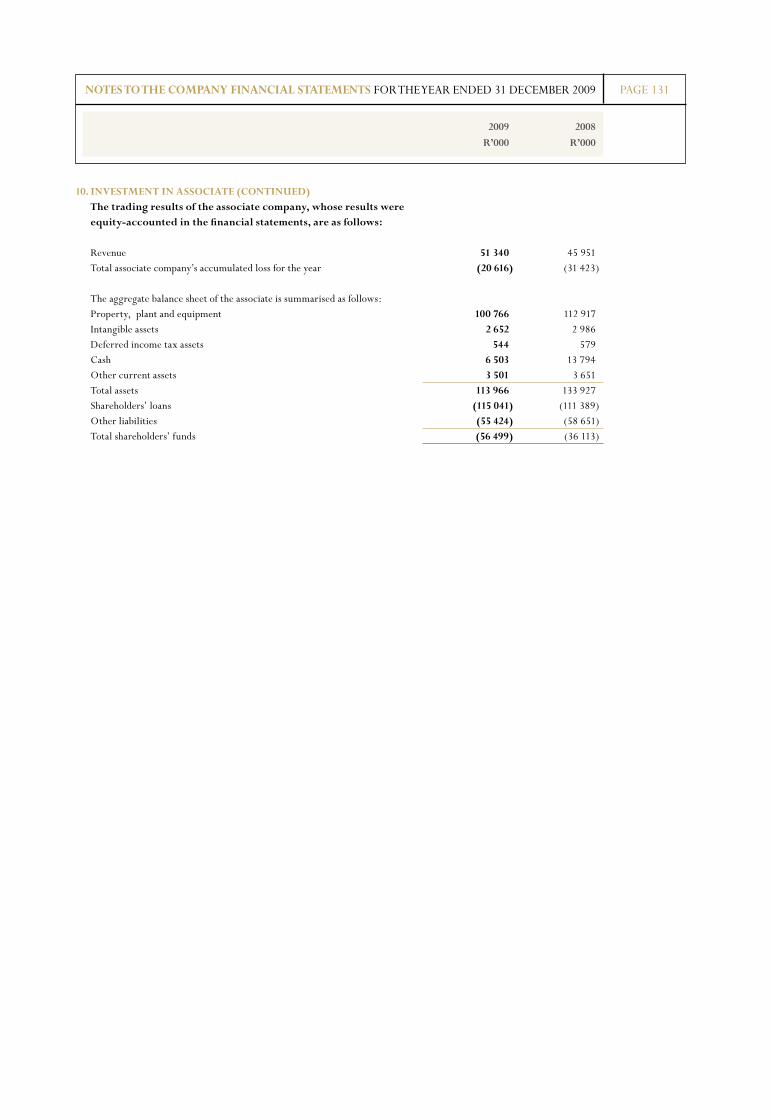
PAGE 131
2009 2008
R’000 R’000
10. INVESTMENT IN ASSOCIATE (CONTINUED) The trading results of the associate company, whose results were equity-accounted in the financial statements, are as follows:
Revenue 51 340 45 951 Total associate company’s accumulated loss for the year (20 616) (31 423)
The aggregate balance sheet of the associate is summarised as follows: Property, plant and equipment 100 766 112 917 Intangible assets 2 652 2 986 Deferred income tax assets 544 579 Cash 6 503 13 794 Other current assets 3 501 3 651 Total assets 113 966 133 927 Shareholders’ loans (115 041) (111 389) Other liabilities (55 424) (58 651) Total shareholders’ funds (56 499) (36 113)
NOTES TO ThE COMPANY FINANCIAl STATEMENTS FOR THE YEAR ENDED 31 DECEMBER 2009
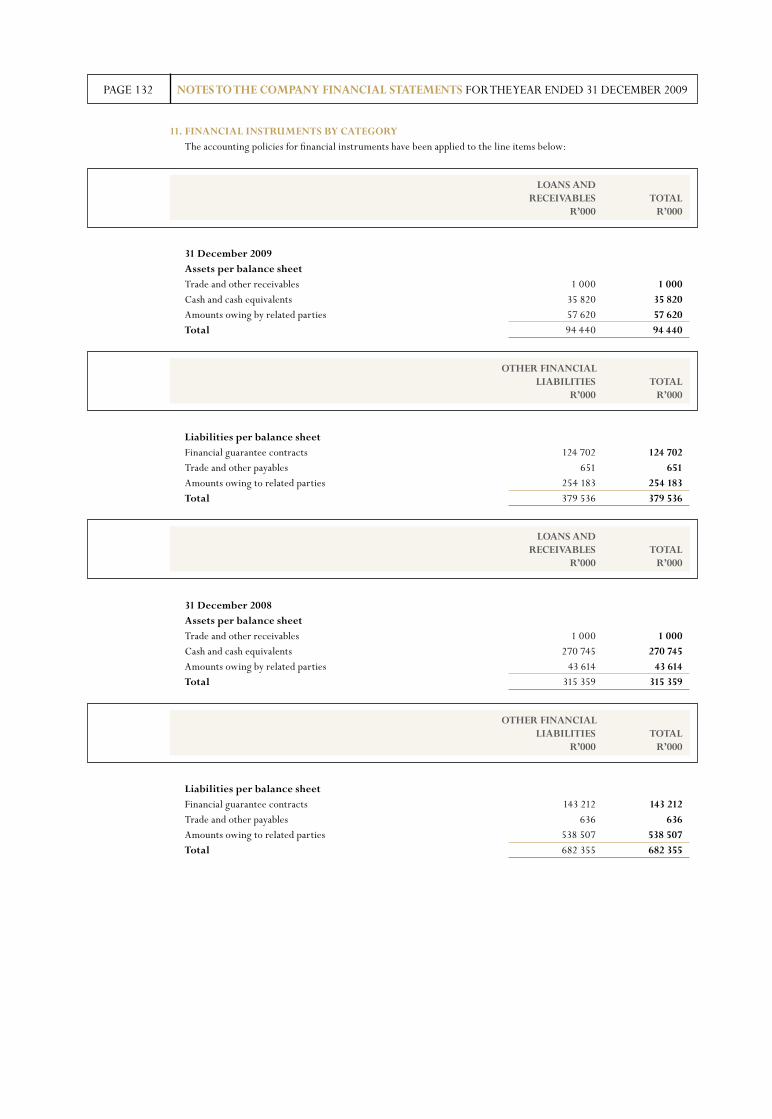
PAGE 132
11. FINANCIAl INSTRUMENTS BY CATEGORY The accounting policies for financial instruments have been applied to the line items below:
31 December 2009 Assets per balance sheet Trade and other receivables 1 000 1 000 Cash and cash equivalents 35 820 35 820 Amounts owing by related parties 57 620 57 620 Total 94 440 94 440
liabilities per balance sheet Financial guarantee contracts 124 702 124 702 Trade and other payables 651 651 Amounts owing to related parties 254 183 254 183 Total 379 536 379 536
31 December 2008 Assets per balance sheet Trade and other receivables 1 000 1 000 Cash and cash equivalents 270 745 270 745 Amounts owing by related parties 43 614 43 614 Total 315 359 315 359
liabilities per balance sheet Financial guarantee contracts 143 212 143 212 Trade and other payables 636 636 Amounts owing to related parties 538 507 538 507 Total 682 355 682 355
NOTES TO ThE COMPANY FINANCIAl STATEMENTS FOR THE YEAR ENDED 31 DECEMBER 2009
lOANS AND RECEIVABlES TOTAl R’000 R’000
lOANS AND RECEIVABlES TOTAl R’000 R’000
OThER FINANCIAl lIABIlITIES TOTAl R’000 R’000
OThER FINANCIAl lIABIlITIES TOTAl R’000 R’000
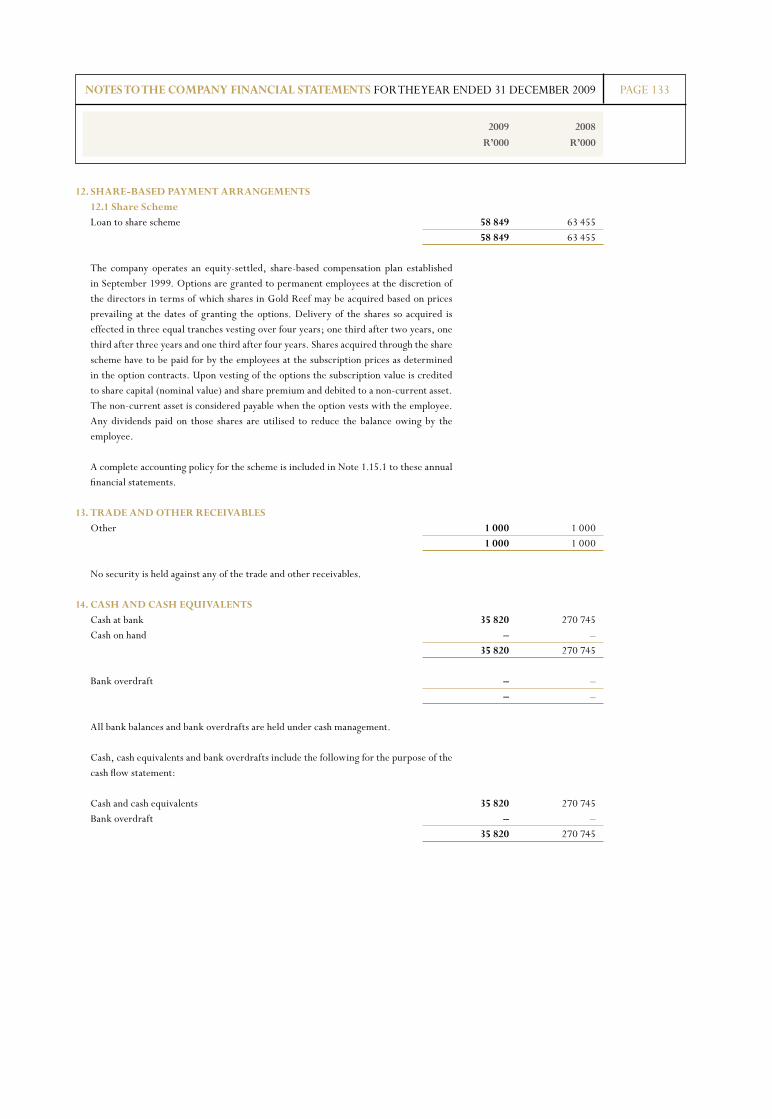
PAGE 133
2009 2008
R’000 R’000
12. ShARE-BASED PAYMENT ARRANGEMENTS 12.1 Share Scheme Loan to share scheme 58 849 63 455 58 849 63 455
The company operates an equity-settled, share-based compensation plan established in September 1999. Options are granted to permanent employees at the discretion of the directors in terms of which shares in Gold Reef may be acquired based on prices prevailing at the dates of granting the options. Delivery of the shares so acquired is effected in three equal tranches vesting over four years; one third after two years, one third after three years and one third after four years. Shares acquired through the share scheme have to be paid for by the employees at the subscription prices as determined in the option contracts. Upon vesting of the options the subscription value is credited to share capital (nominal value) and share premium and debited to a non-current asset. The non-current asset is considered payable when the option vests with the employee. Any dividends paid on those shares are utilised to reduce the balance owing by the employee.
A complete accounting policy for the scheme is included in Note 1.15.1 to these annual financial statements.
13. TRADE AND OThER RECEIVABlES Other 1 000 1 000 1 000 1 000
No security is held against any of the trade and other receivables.
14. CASh AND CASh EQUIVAlENTS Cash at bank 35 820 270 745 Cash on hand – – 35 820 270 745
Bank overdraft – – – –
All bank balances and bank overdrafts are held under cash management.
Cash, cash equivalents and bank overdrafts include the following for the purpose of the cash flow statement:
Cash and cash equivalents 35 820 270 745 Bank overdraft – – 35 820 270 745
NOTES TO ThE COMPANY FINANCIAl STATEMENTS FOR THE YEAR ENDED 31 DECEMBER 2009

PAGE 134
NUMBER OF ORDINARY ORDINARY ShARE ShARE ShARES CAPITAl PREMIUM TOTAl (000) R’000 R’000 R’000
15. ShARE CAPITAl Balance at 1 January 2008 291 990 5 840 1 860 132 1 865 972 Ordinary shares issued in 2008 – – – – Balance at 31 December 2008 291 990 5 840 1 860 132 1 865 972 Ordinary shares issued in 2009 – – – – Balance at 31 December 2009 291 990 5 840 1 860 132 1 865 972 The total authorised number of ordinary shares is 590 000 000 (2008: 590 000 000) with a par value of 2 cents per share
(2008: 2 cents per share). All issued shares, other than those related to the Gold Reef Share Scheme, are fully paid up.
16. FINANCIAl GUARANTEE CONTRACTS At beginning of year 143 212 95 515 Financial guarantee contracts recognised – 50 318 Financial guarantee contracts expensed to the income statement – 3 454 Amortisation (18 510) (6 075) At end of year 124 702 143 212 The financial guarantee contracts relate to suretyships provided by Gold Reef to banks in respect of loans granted to
subsidiaries and associates. The company has bound itself as surety for Akani Egoli, Silverstar Casino and Queens Casino to their bankers for 100%, 100% and 35,72% of their exposure respectively.
As at 31 December 2009, there was no expectation that Gold Reef would be called upon to fulfill it’s obligations in terms of the various suretyship agreements.
NOTES TO ThE COMPANY FINANCIAl STATEMENTS FOR THE YEAR ENDED 31 DECEMBER 2009
2009 2008
R’000 R’000
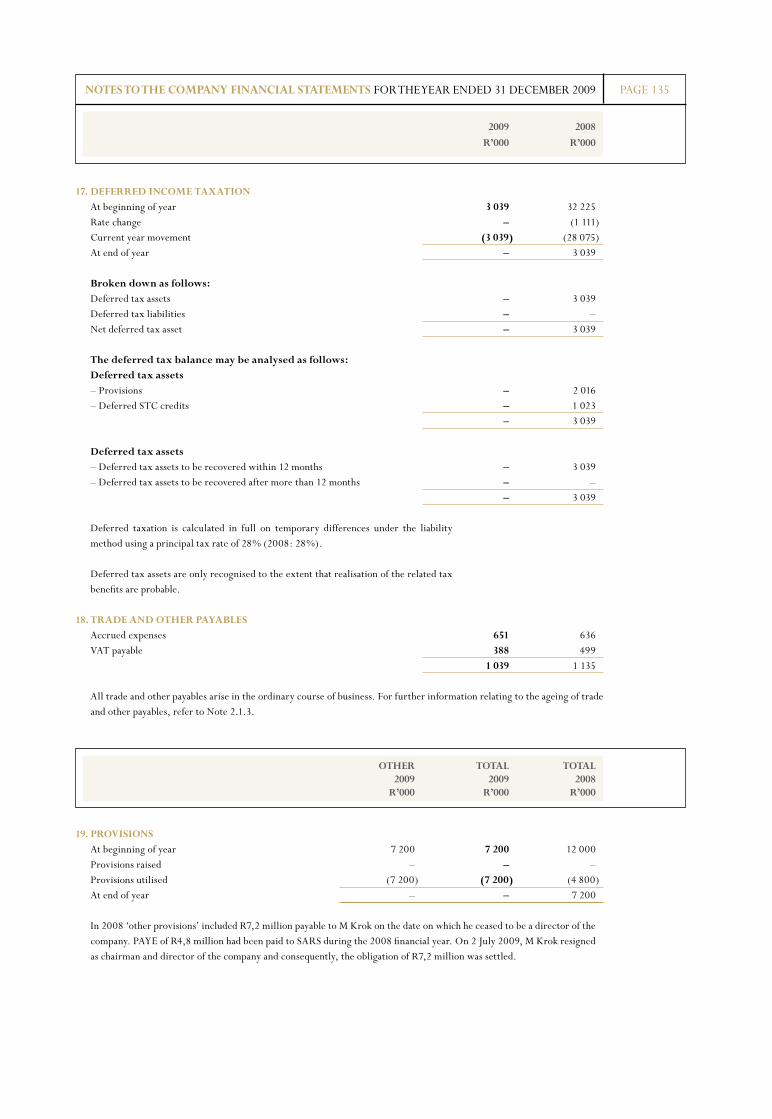
PAGE 135
17. DEFERRED INCOME TAXATION At beginning of year 3 039 32 225 Rate change – (1 111) Current year movement (3 039) (28 075) At end of year – 3 039 Broken down as follows: Deferred tax assets – 3 039 Deferred tax liabilities – – Net deferred tax asset – 3 039 The deferred tax balance may be analysed as follows: Deferred tax assets – Provisions – 2 016 – Deferred STC credits – 1 023 – 3 039 Deferred tax assets – Deferred tax assets to be recovered within 12 months – 3 039 – Deferred tax assets to be recovered after more than 12 months – – – 3 039
Deferred taxation is calculated in full on temporary differences under the liability method using a principal tax rate of 28% (2008: 28%).
Deferred tax assets are only recognised to the extent that realisation of the related tax benefits are probable.
18. TRADE AND OThER PAYABlES Accrued expenses 651 636 VAT payable 388 499 1 039 1 135
All trade and other payables arise in the ordinary course of business. For further information relating to the ageing of trade and other payables, refer to Note 2.1.3.
19. PROVISIONS At beginning of year 7 200 7 200 12 000 Provisions raised – – – Provisions utilised (7 200) (7 200) (4 800) At end of year – – 7 200
In 2008 ‘other provisions’ included R7,2 million payable to M Krok on the date on which he ceased to be a director of the company. PAYE of R4,8 million had been paid to SARS during the 2008 financial year. On 2 July 2009, M Krok resigned as chairman and director of the company and consequently, the obligation of R7,2 million was settled.
2009 2008
R’000 R’000
NOTES TO ThE COMPANY FINANCIAl STATEMENTS FOR THE YEAR ENDED 31 DECEMBER 2009
OThER TOTAl TOTAl 2009 2009 2008 R’000 R’000 R’000
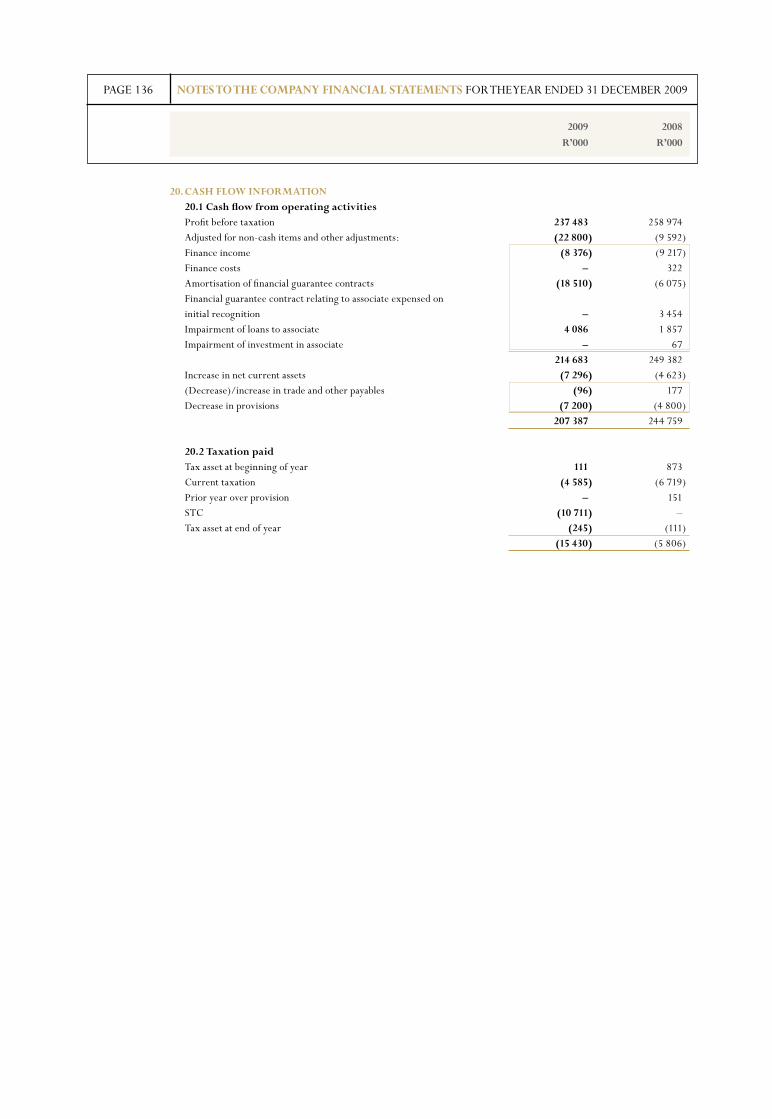
PAGE 136
2009 2008
R’000 R’000
20. CASh FlOW INFORMATION 20.1 Cash flow from operating activities Profit before taxation 237 483 258 974 Adjusted for non-cash items and other adjustments: (22 800) (9 592) Finance income (8 376) (9 217) Finance costs – 322 Amortisation of financial guarantee contracts (18 510) (6 075) Financial guarantee contract relating to associate expensed on initial recognition – 3 454 Impairment of loans to associate 4 086 1 857 Impairment of investment in associate – 67 214 683 249 382 Increase in net current assets (7 296) (4 623) (Decrease)/increase in trade and other payables (96) 177 Decrease in provisions (7 200) (4 800) 207 387 244 759
20.2 Taxation paid Tax asset at beginning of year 111 873 Current taxation (4 585) (6 719) Prior year over provision – 151 STC (10 711) – Tax asset at end of year (245) (111) (15 430) (5 806)
NOTES TO ThE COMPANY FINANCIAl STATEMENTS FOR THE YEAR ENDED 31 DECEMBER 2009
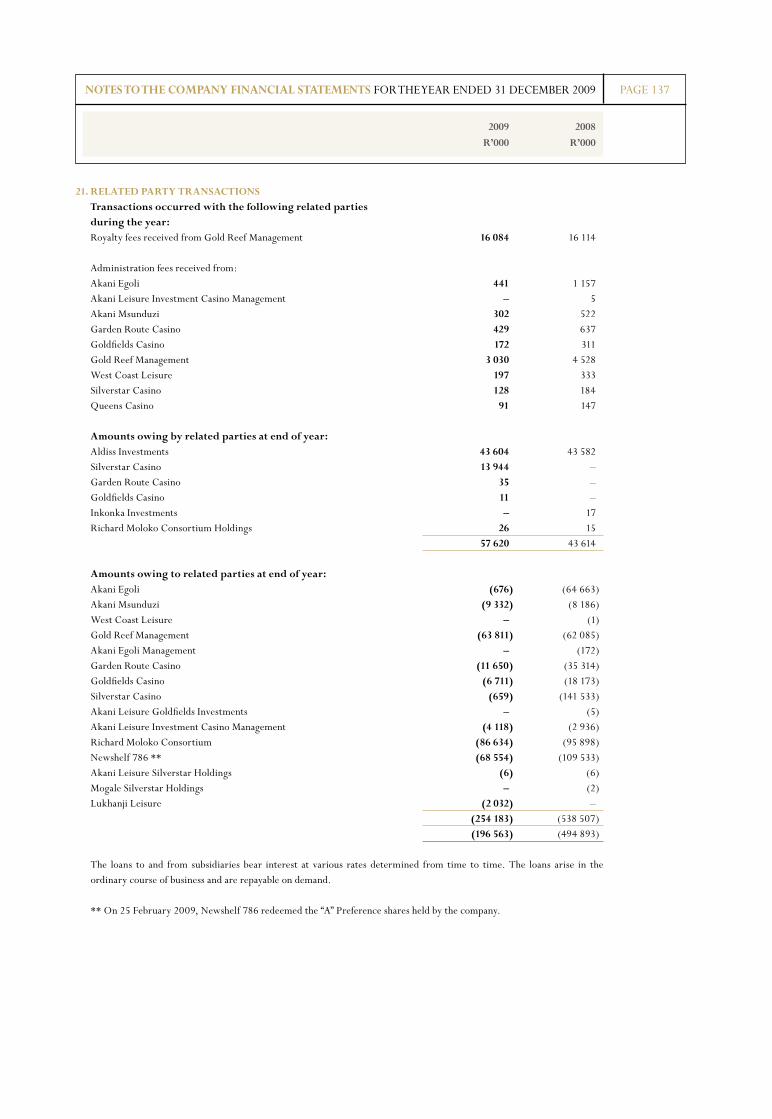
PAGE 137
2009 2008
R’000 R’000
21. RElATED PARTY TRANSACTIONS Transactions occurred with the following related parties during the year: Royalty fees received from Gold Reef Management 16 084 16 114 Administration fees received from: Akani Egoli 441 1 157 Akani Leisure Investment Casino Management – 5 Akani Msunduzi 302 522 Garden Route Casino 429 637 Goldfields Casino 172 311 Gold Reef Management 3 030 4 528 West Coast Leisure 197 333 Silverstar Casino 128 184 Queens Casino 91 147 Amounts owing by related parties at end of year: Aldiss Investments 43 604 43 582 Silverstar Casino 13 944 – Garden Route Casino 35 – Goldfields Casino 11 – Inkonka Investments – 17 Richard Moloko Consortium Holdings 26 15 57 620 43 614 Amounts owing to related parties at end of year: Akani Egoli (676) (64 663) Akani Msunduzi (9 332) (8 186) West Coast Leisure – (1) Gold Reef Management (63 811) (62 085) Akani Egoli Management – (172) Garden Route Casino (11 650) (35 314) Goldfields Casino (6 711) (18 173) Silverstar Casino (659) (141 533) Akani Leisure Goldfields Investments – (5) Akani Leisure Investment Casino Management (4 118) (2 936) Richard Moloko Consortium (86 634) (95 898) Newshelf 786 ** (68 554) (109 533) Akani Leisure Silverstar Holdings (6) (6) Mogale Silverstar Holdings – (2) Lukhanji Leisure (2 032) – (254 183) (538 507) (196 563) (494 893) The loans to and from subsidiaries bear interest at various rates determined from time to time. The loans arise in the
ordinary course of business and are repayable on demand. ** On 25 February 2009, Newshelf 786 redeemed the “A” Preference shares held by the company.
NOTES TO ThE COMPANY FINANCIAl STATEMENTS FOR THE YEAR ENDED 31 DECEMBER 2009
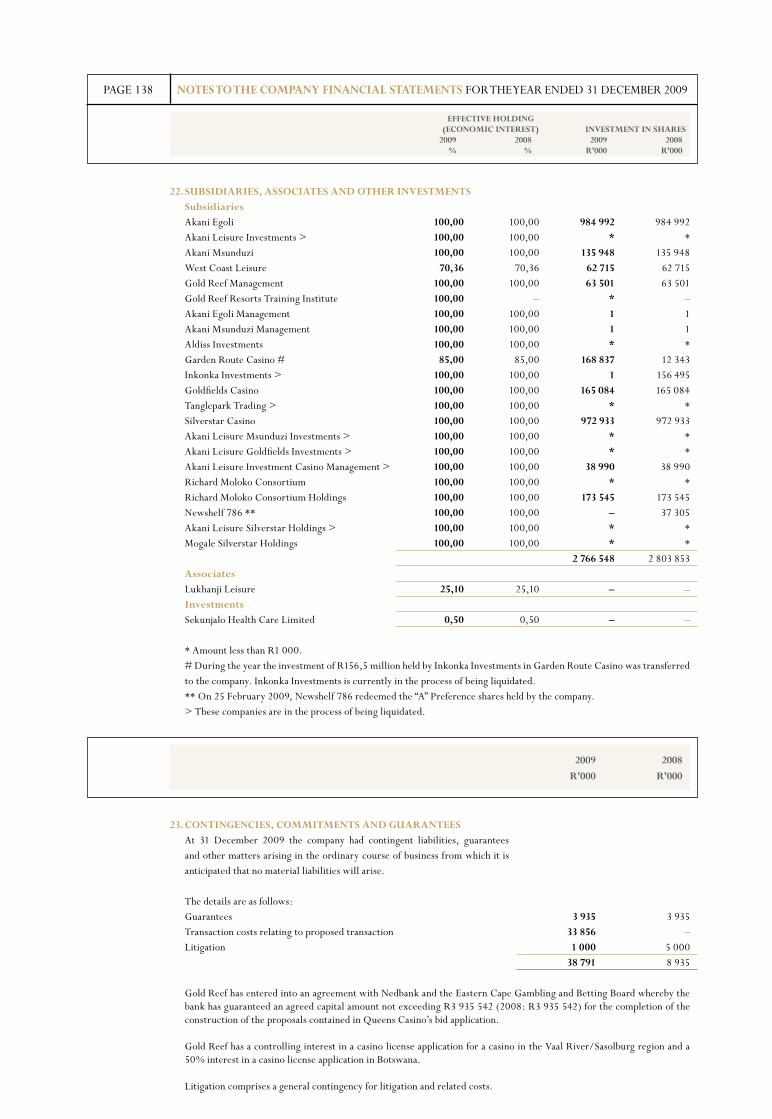
PAGE 138
EFFECTIVE hOlDING (ECONOMIC INTEREST) INVESTMENT IN ShARES 2009 2008 2009 2008 % % R’000 R’000
22. SUBSIDIARIES, ASSOCIATES AND OThER INVESTMENTS Subsidiaries Akani Egoli 100,00 100,00 984 992 984 992 Akani Leisure Investments > 100,00 100,00 * * Akani Msunduzi 100,00 100,00 135 948 135 948 West Coast Leisure 70,36 70,36 62 715 62 715 Gold Reef Management 100,00 100,00 63 501 63 501 Gold Reef Resorts Training Institute 100,00 – * – Akani Egoli Management 100,00 100,00 1 1 Akani Msunduzi Management 100,00 100,00 1 1 Aldiss Investments 100,00 100,00 * * Garden Route Casino # 85,00 85,00 168 837 12 343 Inkonka Investments > 100,00 100,00 1 156 495 Goldfields Casino 100,00 100,00 165 084 165 084 Tanglepark Trading > 100,00 100,00 * * Silverstar Casino 100,00 100,00 972 933 972 933 Akani Leisure Msunduzi Investments > 100,00 100,00 * * Akani Leisure Goldfields Investments > 100,00 100,00 * * Akani Leisure Investment Casino Management > 100,00 100,00 38 990 38 990 Richard Moloko Consortium 100,00 100,00 * * Richard Moloko Consortium Holdings 100,00 100,00 173 545 173 545 Newshelf 786 ** 100,00 100,00 – 37 305 Akani Leisure Silverstar Holdings > 100,00 100,00 * * Mogale Silverstar Holdings 100,00 100,00 * * 2 766 548 2 803 853 Associates Lukhanji Leisure 25,10 25,10 – – Investments Sekunjalo Health Care Limited 0,50 0,50 – –
* Amount less than R1 000. # During the year the investment of R156,5 million held by Inkonka Investments in Garden Route Casino was transferred
to the company. Inkonka Investments is currently in the process of being liquidated. ** On 25 February 2009, Newshelf 786 redeemed the “A” Preference shares held by the company. > These companies are in the process of being liquidated.
NOTES TO ThE COMPANY FINANCIAl STATEMENTS FOR THE YEAR ENDED 31 DECEMBER 2009
2009 2008
R’000 R’000
23. CONTINGENCIES, COMMITMENTS AND GUARANTEES At 31 December 2009 the company had contingent liabilities, guarantees
and other matters arising in the ordinary course of business from which it is anticipated that no material liabilities will arise.
The details are as follows: Guarantees 3 935 3 935 Transaction costs relating to proposed transaction 33 856 – Litigation 1 000 5 000 38 791 8 935
Gold Reef has entered into an agreement with Nedbank and the Eastern Cape Gambling and Betting Board whereby the bank has guaranteed an agreed capital amount not exceeding R3 935 542 (2008: R3 935 542) for the completion of the construction of the proposals contained in Queens Casino’s bid application.
Gold Reef has a controlling interest in a casino license application for a casino in the Vaal River/Sasolburg region and a 50% interest in a casino license application in Botswana.
Litigation comprises a general contingency for litigation and related costs.
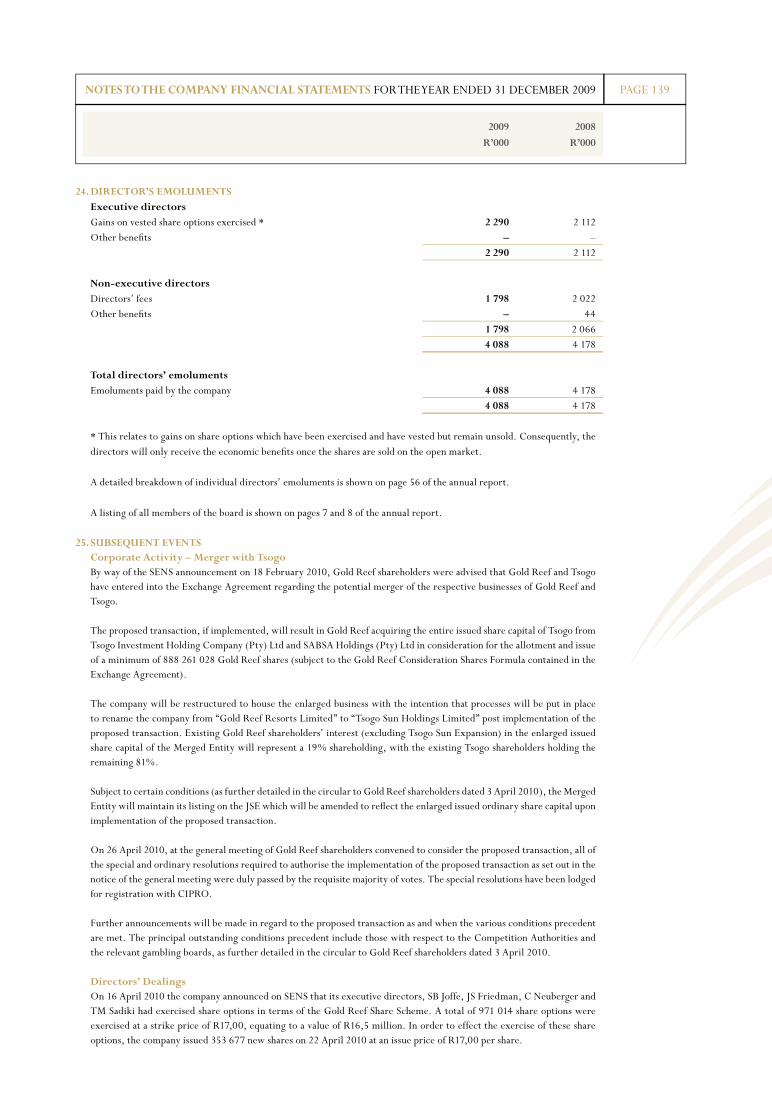
PAGE 139
25. SUBSEQUENT EVENTS Corporate Activity – Merger with Tsogo By way of the SENS announcement on 18 February 2010, Gold Reef shareholders were advised that Gold Reef and Tsogo
have entered into the Exchange Agreement regarding the potential merger of the respective businesses of Gold Reef and Tsogo.
The proposed transaction, if implemented, will result in Gold Reef acquiring the entire issued share capital of Tsogo from Tsogo Investment Holding Company (Pty) Ltd and SABSA Holdings (Pty) Ltd in consideration for the allotment and issue of a minimum of 888 261 028 Gold Reef shares (subject to the Gold Reef Consideration Shares Formula contained in the Exchange Agreement).
The company will be restructured to house the enlarged business with the intention that processes will be put in place to rename the company from “Gold Reef Resorts Limited” to “Tsogo Sun Holdings Limited” post implementation of the proposed transaction. Existing Gold Reef shareholders’ interest (excluding Tsogo Sun Expansion) in the enlarged issued share capital of the Merged Entity will represent a 19% shareholding, with the existing Tsogo shareholders holding the remaining 81%.
Subject to certain conditions (as further detailed in the circular to Gold Reef shareholders dated 3 April 2010), the Merged Entity will maintain its listing on the JSE which will be amended to refl ect the enlarged issued ordinary share capital upon implementation of the proposed transaction.
On 26 April 2010, at the general meeting of Gold Reef shareholders convened to consider the proposed transaction, all of the special and ordinary resolutions required to authorise the implementation of the proposed transaction as set out in the notice of the general meeting were duly passed by the requisite majority of votes. The special resolutions have been lodged for registration with CIPRO.
Further announcements will be made in regard to the proposed transaction as and when the various conditions precedent are met. The principal outstanding conditions precedent include those with respect to the Competition Authorities and the relevant gambling boards, as further detailed in the circular to Gold Reef shareholders dated 3 April 2010.
Directors’ Dealings On 16 April 2010 the company announced on SENS that its executive directors, SB Joffe, JS Friedman, C Neuberger and
TM Sadiki had exercised share options in terms of the Gold Reef Share Scheme. A total of 971 014 share options were exercised at a strike price of R17,00, equating to a value of R16,5 million. In order to effect the exercise of these share options, the company issued 353 677 new shares on 22 April 2010 at an issue price of R17,00 per share.
2009 2008
R’000 R’000
24. DIRECTOR’S EMOlUMENTS Executive directors Gains on vested share options exercised * 2 290 2 112 Other benefi ts – – 2 290 2 112
Non-executive directors Directors’ fees 1 798 2 022 Other benefi ts – 44 1 798 2 066 4 088 4 178
Total directors’ emoluments Emoluments paid by the company 4 088 4 178 4 088 4 178
* This relates to gains on share options which have been exercised and have vested but remain unsold. Consequently, the directors will only receive the economic benefi ts once the shares are sold on the open market.
A detailed breakdown of individual directors’ emoluments is shown on page 56 of the annual report.
A listing of all members of the board is shown on pages 7 and 8 of the annual report.
NOTES TO ThE COMPANY FINANCIAl STATEMENTS FOR THE YEAR ENDED 31 DECEMBER 2009
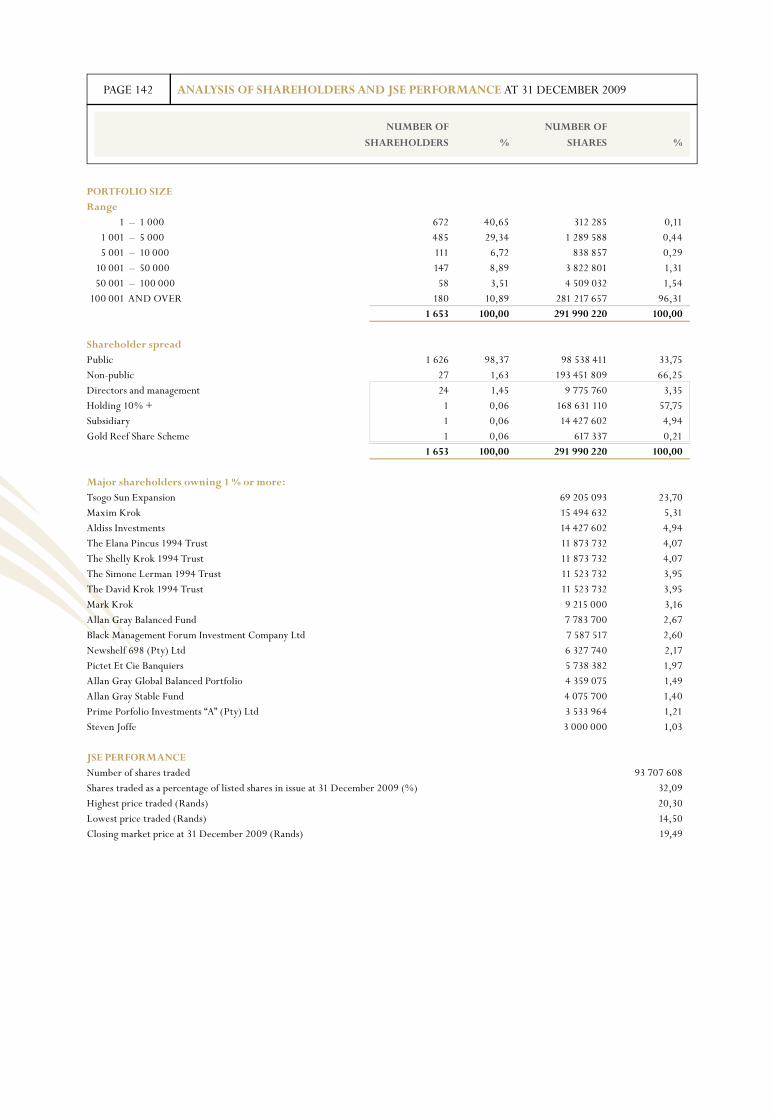
PAGE 142 ANAlYSIS OF ShAREhOlDERS AND JSE PERFORMANCE AT 31 DECEMBER 2009
NUMBER OF NUMBER OF
ShAREhOlDERS % ShARES %
PORTFOlIO SIZE Range 1 – 1 000 672 40,65 312 285 0,11 1 001 – 5 000 485 29,34 1 289 588 0,44 5 001 – 10 000 111 6,72 838 857 0,29 10 001 – 50 000 147 8,89 3 822 801 1,31 50 001 – 100 000 58 3,51 4 509 032 1,54 100 001 AND OVER 180 10,89 281 217 657 96,31 1 653 100,00 291 990 220 100,00
Shareholder spread Public 1 626 98,37 98 538 411 33,75Non-public 27 1,63 193 451 809 66,25Directors and management 24 1,45 9 775 760 3,35Holding 10% + 1 0,06 168 631 110 57,75Subsidiary 1 0,06 14 427 602 4,94Gold Reef Share Scheme 1 0,06 617 337 0,21 1 653 100,00 291 990 220 100,00
Major shareholders owning 1 % or more: Tsogo Sun Expansion 69 205 093 23,70Maxim Krok 15 494 632 5,31Aldiss Investments 14 427 602 4,94The Elana Pincus 1994 Trust 11 873 732 4,07The Shelly Krok 1994 Trust 11 873 732 4,07The Simone Lerman 1994 Trust 11 523 732 3,95The David Krok 1994 Trust 11 523 732 3,95Mark Krok 9 215 000 3,16Allan Gray Balanced Fund 7 783 700 2,67Black Management Forum Investment Company Ltd 7 587 517 2,60Newshelf 698 (Pty) Ltd 6 327 740 2,17Pictet Et Cie Banquiers 5 738 382 1,97Allan Gray Global Balanced Portfolio 4 359 075 1,49Allan Gray Stable Fund 4 075 700 1,40Prime Porfolio Investments “A” (Pty) Ltd 3 533 964 1,21Steven Joffe 3 000 000 1,03
JSE PERFORMANCENumber of shares traded 93 707 608 Shares traded as a percentage of listed shares in issue at 31 December 2009 (%) 32,09Highest price traded (Rands) 20,30 Lowest price traded (Rands) 14,50 Closing market price at 31 December 2009 (Rands) 19,49
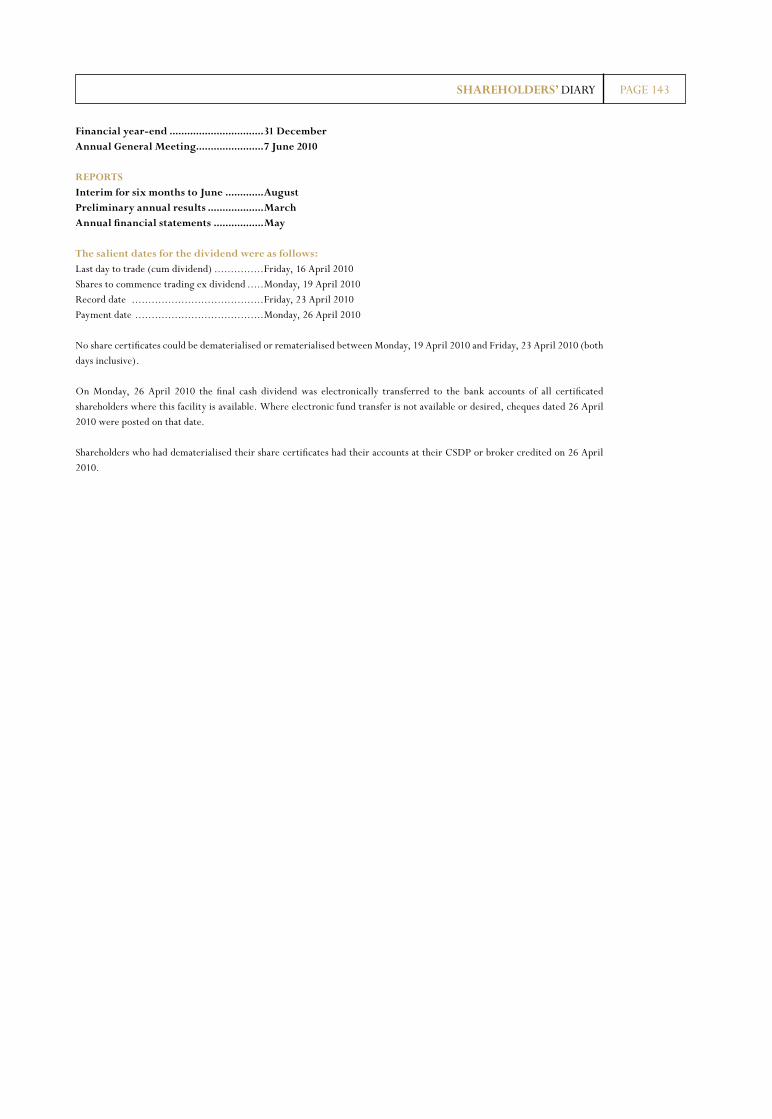
PAGE 143
Financial year-end ................................31 DecemberAnnual General Meeting.......................7 June 2010
REPORTSInterim for six months to June .............AugustPreliminary annual results ...................MarchAnnual financial statements .................May
The salient dates for the dividend were as follows:Last day to trade (cum dividend) ...............Friday, 16 April 2010 Shares to commence trading ex dividend .....Monday, 19 April 2010 Record date ........................................Friday, 23 April 2010 Payment date .......................................Monday, 26 April 2010
No share certificates could be dematerialised or rematerialised between Monday, 19 April 2010 and Friday, 23 April 2010 (both days inclusive).
On Monday, 26 April 2010 the final cash dividend was electronically transferred to the bank accounts of all certificated shareholders where this facility is available. Where electronic fund transfer is not available or desired, cheques dated 26 April 2010 were posted on that date.
Shareholders who had dematerialised their share certificates had their accounts at their CSDP or broker credited on 26 April 2010.
ShAREhOlDERS’ DIARY
CORPORATE INFORMATION FOR THE YEAR ENDED 31 DECEMBER 2009PAGE 144
COMPANY SECRETARY AND REGISTERED OFFICEL FickGold Reef CityGate 4Northern ParkwayOrmondeJohannesburg, 2091(Private Bag X1890, Gold Reef City, 2159)
SPONSORDeutsche Securities (SA) (Proprietary) Limited(A non-bank member of the Deutsche Bank Group)3 Exchange Square, 87 Maude StreetSandton, 2196(Private Bag X9933, Sandton, 2146)
lEGAl ADVISORSEdward Nathan Sonnenbergs Inc.150 West StreetSandownSandton, 2196(PO Box 783347, Sandton, 2146) AUDITORSPricewaterhouseCoopers Inc. Registered Accountants and Auditors 2 Eglin RoadSunninghill, 2157 (Private Bag X36, Sunninghill, 2157)
TRANSFER SECRETARIESLink Market Services South Africa (Proprietary) Limited16th Floor, 11 Diagonal StreetJohannesburg, 2001(PO Box 4844, Johannesburg, 2000)
COMMERCIAl BANKERSNedbank1st FloorCorporate ParkNedcor Sandton135 Rivonia RoadSandown, 2196(PO Box 1144, Johannesburg, 2000)
ABSA Corporate Merchant Bank2nd FloorAbsa Towers North 2W1180 Commissioner StreetJohannesburg, 2000(PO Box 1932, Johannesburg, 2000)
INVESTOR RElATIONSCollege Hill (Proprietary) LimitedFountain Grove5 Second AvanueHyde ParkSandton, 2196(PO Box 413817, Craighall, 2024)
PAGE 145
GOlD REEF RESORTS lIMITED(Registration number 1989/002108/06)(Incorporated in the Republic of South Africa)Share Code: GDF ISIN ZAE000028338(“Gold Reef” or “the company”)
Notice is hereby given that the Annual General Meeting of Gold Reef shareholders will be held at the Gold Reef City Casino Conference Centre, Corner Northern Parkway and Data Crescent, Ormonde, Johannesburg, South Africa on Monday, 7 June 2010 at 10h00 for the purpose of considering, and if deemed fit, passing, with or without modification, the following ordinary resolutions:
1. ORDINARY RESOlUTION NUMBER 1 To receive, consider and adopt the annual financial
statements of the company and the group for the year ended 31 December 2009 together with the audit committees’, independent auditors’ and directors’ reports.
2. ORDINARY RESOlUTION NUMBER 2 To re-elect MG Diliza as an independent non-executive
director of the company, who retires by rotation in terms of the company’s Articles of Association and who, being eligible, offers himself for re-election.
An abbreviated curriculum vitae in respect of MG Diliza is contained on page 8 of the annual report of which this notice forms part.
3. ORDINARY RESOlUTION NUMBER 3 To re-elect PCM September as a non-executive director
of the company, who retires by rotation in terms of the company’s Articles of Association and who, being eligible, offers himself for re-election.
An abbreviated curriculum vitae in respect of PCM September is contained on page 7 of the annual report of which this notice forms part.
4. ORDINARY RESOlUTION NUMBER 4 To confirm the election of P Vallet who was appointed
by the board of directors on 25 August 2009 as a non-executive director.
An abbreviated curriculum vitae in respect of P Vallet is contained on page 7 of the annual report of which this notice forms part.
5. ORDINARY RESOlUTION NUMBER 5 To confirm the appointment of L Fick as Company
Secretary of the company.
6. ORDINARY RESOlUTION NUMBER 6 To re-appoint PricewaterhouseCoopers Inc as
independent auditors of the company and recommend NL Forster as the designated audit partner.
7. ORDINARY RESOlUTION NUMBER 7 To authorise the directors to determine the independent
auditors’ remuneration for the forthcoming financial year.
8. ORDINARY RESOlUTION NUMBER 8 To approve the independent auditors’ remuneration for
the year ended 31 December 2009.
9. ORDINARY RESOlUTION NUMBER 9 To approve the fees payable to non-executive directors
for their services as directors or as members of the board sub-committees in respect of the financial year ending 31 December 2010, as proposed in the remuneration report on page 55.
10. ORDINARY RESOlUTION NUMBER 10 To confirm the appointment of JC Farrant as a member
and Chairman of the Gold Reef Audit and Risk Committee.
An abbreviated curriculum vitae in respect of JC Farrant is contained on page 8 of the annual report of which this notice forms part.
11. ORDINARY RESOlUTION NUMBER 11 To confirm the appointment of ZJ Matlala as a member
of the Gold Reef Audit and Risk Committee.
An abbreviated curriculum vitae in respect of ZJ Matlala is contained on page 8 of the annual report of which this notice forms part.
12. ORDINARY RESOlUTION NUMBER 12 To confirm the appointment of P Vallet as an alternate
member to JC Farrant and ZJ Matlala on the Gold Reef Audit and Risk Committee.
An abbreviated curriculum vitae in respect of P Vallet is contained on page 7 of the annual report of which this notice forms part.
13. ORDINARY RESOlUTION NUMBER 13 To place the authorised but unissued share capital of
the company under the control of the directors until the next Annual General Meeting with the authority to allot and issue any shares required to be issued for the purpose of carrying out the terms of the Gold Reef Share Scheme, limited to a maximum of 3 million shares, in their discretion, subject to Sections 221 and 222 of the Companies Act, 61 of 1973, as amended, and the JSE Limited Listings Requirements.
NOTICE OF ANNUAl GENERAl MEETING FOR GOLD REEF RESORT LIMITED
VOTING AND PROXIESOn a show of hands, every Gold Reef shareholder present in person or represented by proxy at the Annual General Meeting shall have only one vote, irrespective of how many Gold Reef shareholders he/she represents. On a poll every Gold Reef shareholder present in person or represented by proxy shall have one vote for every Gold Reef share held by such Gold Reef shareholder.
A Gold Reef shareholder entitled to attend and vote at the Annual General Meeting may appoint a proxy or proxies to attend and speak and vote in his/her stead. A proxy need not be a member of the company. The completion and lodging of a form of proxy will not preclude a Gold Reef shareholder from attending the Annual General Meeting and speaking and voting thereat to the exclusion of the proxy/ies so appointed.
Registered holders of certificated shares and holders of dematerialised shares in their own name who are unable to attend the Annual General Meeting and who wish to be represented at the Annual General Meeting, must (in order to be effective) complete and return the attached form of proxy in accordance with the instructions contained therein so as to be received by the transfer secretaries, being Link Market Services South Africa (Proprietary) Limited, 16th Floor, 11 Diagonal Street, Johannesburg, 2001 (PO Box 4844, Johannesburg, 2000) by no later than 10h00 on Friday, 4 June 2010.
Gold Reef shareholders who have dematerialised shares, other than holders of dematerialised shares in their own name, must inform their CSDP or broker of their intention to attend the Annual General Meeting and request their CSDP or broker to issue them with the necessary authorisation/letters of representation to attend the Annual General Meeting or to provide their CSDP or broker with their voting instructions should they not wish to attend the Annual General Meeting in person, failing which the CSDP or broker will be obliged to act in terms of the mandate between such Gold Reef shareholders and their CSDP or broker.
In terms of the JSE Limited Listings Requirements, equity securities held by a share trust or scheme will not have their votes at the Annual General Meeting taken into account for the purposes of resolutions proposed thereat.
In terms of section 39.1(a) of the Companies Act No. 61 of 1973, as amended, no voting rights attaching to treasury shares held by Aldiss Investments will be exercised.
By order of the Gold Reef Board
l FICK CA(SA)COMPANY SECRETARY3 MAY 2010 Registered officeGold Reef CityGate 4, Northern Parkway, Ormonde, Johannesburg, 2091(Private Bag X1890, Gold Reef City, 2159)
Transfer secretarieslink Market Services South Africa (Pty) limited 16th Floor, 11 Diagonal Street, Johannesburg, 2001(PO Box 4844, Johannesburg, 2000)
PAGE 146 NOTICE OF ANNUAl GENERAl MEETING FOR GOLD REEF RESORT LIMITED

Golden Horse CasinoGolden Horse Casino
Pietermaritzburg, KwaZulu-Natal
Pietermaritzburg, KwaZulu-NatalGolden Horse CasinoGolden Horse Casino
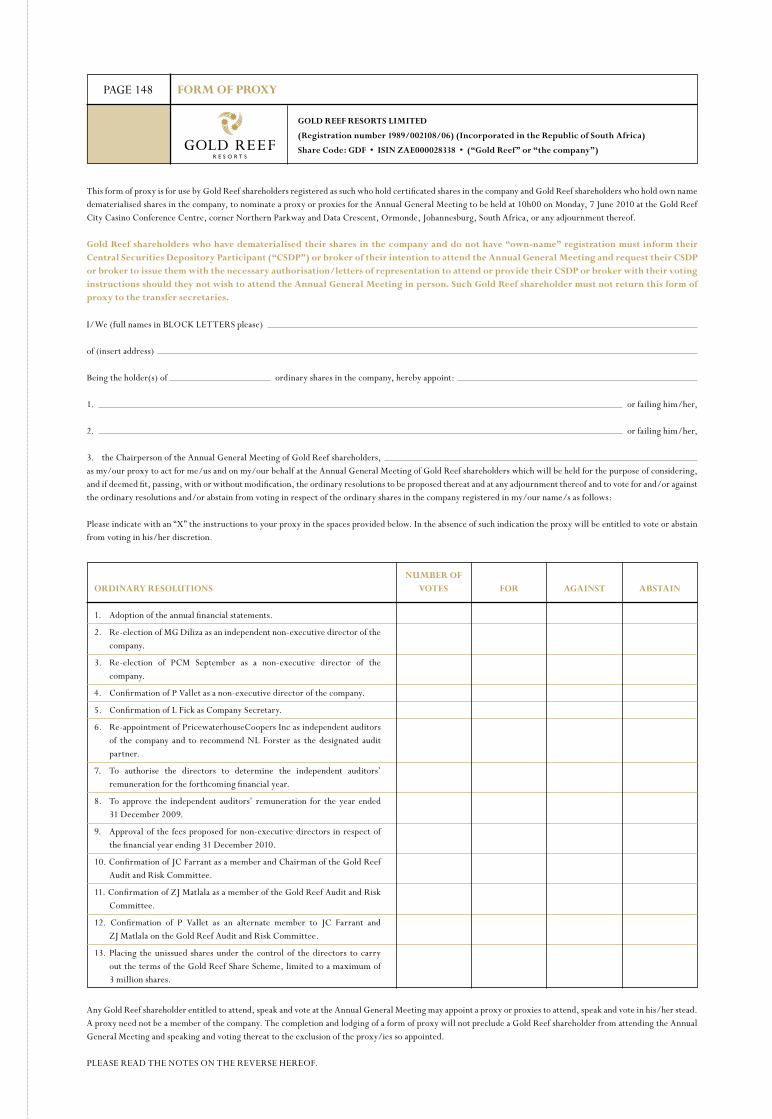
This form of proxy is for use by Gold Reef shareholders registered as such who hold certificated shares in the company and Gold Reef shareholders who hold own name dematerialised shares in the company, to nominate a proxy or proxies for the Annual General Meeting to be held at 10h00 on Monday, 7 June 2010 at the Gold Reef City Casino Conference Centre, corner Northern Parkway and Data Crescent, Ormonde, Johannesburg, South Africa, or any adjournment thereof.
Gold Reef shareholders who have dematerialised their shares in the company and do not have “own-name” registration must inform their Central Securities Depository Participant (“CSDP”) or broker of their intention to attend the Annual General Meeting and request their CSDP or broker to issue them with the necessary authorisation/letters of representation to attend or provide their CSDP or broker with their voting instructions should they not wish to attend the Annual General Meeting in person. Such Gold Reef shareholder must not return this form of proxy to the transfer secretaries.
NUMBER OF ORDINARY RESOlUTIONS VOTES FOR AGAINST ABSTAIN
1. Adoption of the annual financial statements.
2. Re-election of MG Diliza as an independent non-executive director of the company.
3. Re-election of PCM September as a non-executive director of the company.
4. Confirmation of P Vallet as a non-executive director of the company.
5. Confirmation of L Fick as Company Secretary.
6. Re-appointment of PricewaterhouseCoopers Inc as independent auditors of the company and to recommend NL Forster as the designated audit partner.
7. To authorise the directors to determine the independent auditors’ remuneration for the forthcoming financial year.
8. To approve the independent auditors’ remuneration for the year ended 31 December 2009.
9. Approval of the fees proposed for non-executive directors in respect of the financial year ending 31 December 2010.
10. Confirmation of JC Farrant as a member and Chairman of the Gold Reef Audit and Risk Committee.
11. Confirmation of ZJ Matlala as a member of the Gold Reef Audit and Risk Committee.
12. Confirmation of P Vallet as an alternate member to JC Farrant and ZJ Matlala on the Gold Reef Audit and Risk Committee.
13. Placing the unissued shares under the control of the directors to carry out the terms of the Gold Reef Share Scheme, limited to a maximum of 3 million shares.
Any Gold Reef shareholder entitled to attend, speak and vote at the Annual General Meeting may appoint a proxy or proxies to attend, speak and vote in his/her stead. A proxy need not be a member of the company. The completion and lodging of a form of proxy will not preclude a Gold Reef shareholder from attending the Annual General Meeting and speaking and voting thereat to the exclusion of the proxy/ies so appointed.
PLEASE READ THE NOTES ON THE REVERSE HEREOF.
PAGE 148 FORM OF PROXY
GOlD REEF RESORTS lIMITED
(Registration number 1989/002108/06) (Incorporated in the Republic of South Africa)
Share Code: GDF • ISIN ZAE000028338 • (“Gold Reef” or “the company”)
I/We (full names in BLOCK LETTERS please)
of (insert address)
Being the holder(s) of ordinary shares in the company, hereby appoint:
1. or failing him/her,
2. or failing him/her,
3. the Chairperson of the Annual General Meeting of Gold Reef shareholders, as my/our proxy to act for me/us and on my/our behalf at the Annual General Meeting of Gold Reef shareholders which will be held for the purpose of considering, and if deemed fit, passing, with or without modification, the ordinary resolutions to be proposed thereat and at any adjournment thereof and to vote for and/or against the ordinary resolutions and/or abstain from voting in respect of the ordinary shares in the company registered in my/our name/s as follows:
Please indicate with an “X” the instructions to your proxy in the spaces provided below. In the absence of such indication the proxy will be entitled to vote or abstain from voting in his/her discretion.

PAGE 149
1. The form of proxy must only be used by member(s) of the company who hold certificated ordinary shares or member(s) of the company who hold dematerialised ordinary shares with “own-name” registration. All other beneficial owners who have dematerialised their shares through a CSDP or broker and wish to attend the Annual General Meeting must provide the CSDP or broker with their voting instructions in terms of the relevant custody agreement entered into between them and the CSDP or broker concerned.
2. A member of the company entitled to attend and vote at the Annual General Meeting may appoint and insert the name of a proxy or the names of two alternative proxies of the member’s choice in the space provided, with or without deleting “the Chairperson of the Annual General Meeting”. The proxy or proxies need not be member(s) of the company. The person whose name stands first on the form of proxy and who is present at the Annual General Meeting will be entitled to act as proxy to the exclusion of such proxy(ies) whose names follow.
3. A member of the company is entitled to one vote on a show of hands and, on a poll, one vote in respect of each ordinary share held in the company. A member’s instructions to the proxy must be indicated by inserting the relevant number of votes exercisable by the member in the appropriate box(es). If an “X” has been inserted in one of the blocks to a particular resolution, it will indicate the voting of all the shares held by the member concerned. Failure to comply with this will be deemed to authorise the proxy to vote or to abstain from voting at the Annual General Meeting as he/she deems fit in respect of all the member’s votes.
4. A member or the proxy is not obliged to use all the votes exercisable by the member or by the proxy, but the total of the votes cast and in respect of which abstention is recorded may not exceed the total of the votes exercisable by the member or the proxy.
5. A vote given in terms of an instrument of proxy shall be valid in relation to the Annual General Meeting notwithstanding the death, insanity or other legal disability of the person granting it, or the revocation of the proxy, or the transfer of the ordinary shares in respect of which the proxy is given, unless notice as to any of the aforementioned matters shall have been received by the transfer secretaries not less than twenty four hours before the commencement of the Annual General Meeting, or at any adjournment thereof.
6. If a member does not indicate on this form that his/her proxy is to vote in favour of or against any resolution or to abstain from voting, or gives contradictory instructions, or should any further resolution(s) or any amendment(s) which may properly be put before the Annual General Meeting be proposed, such proxy shall be entitled to vote as he/she thinks fit.
7. The Chairperson of the Annual General Meeting may reject or accept any form of proxy which is completed and/or received other than in compliance with these notes.
8. The completion and lodging of this form of proxy will not preclude the relevant member from attending the Annual General Meeting and speaking and voting in person thereat to the exclusion of any proxy appointed in terms hereof, should such member wish to do so.
9. Documentary evidence establishing the authority of a person signing the form of proxy in a representative capacity must be attached to this form of proxy, unless previously recorded by the company or unless this requirement is waived by the Chairperson of the Annual General Meeting.
10. A minor or any other person under legal incapacity must be assisted by his/her parent or guardian, as applicable, unless the relevant documents establishing his/her capacity are produced or have been registered with the company.
11. Where there are joint holders of ordinary shares in the company: • any one holder may sign the form of proxy; • the vote(s) of the senior member of the company (for that purpose seniority will be determined by the order in which the
names of members of the company appear in the company’s register of members) who tenders a vote (whether in person or by proxy) will be accepted to the exclusion of the vote(s) of the other joint member(s).
12. Forms of proxy must, in order to be effective, be lodged with or mailed to the transfer secretaries, Link Market Services South Africa (Proprietary) Limited:
hand deliveries to: Postal deliveries to: Link Market Services South Africa Link Market Services South Africa (Proprietary) Limited (Proprietary) Limited 16th Floor, 11 Diagonal Street, Johannesburg, 2001 PO Box 4844, Johannesburg, 2000 to be received by no later than 10h00 on Friday, 4 June 2010 (or 24 hours before any adjournment of the Annual General
Meeting which date, if necessary, will be notified on SENS).13. Any alteration or correction made to this form of proxy, other than the deletion of alternatives, must be initialled by the
signatory(ies).
NOTES TO FORM OF PROXY