Embed Size (px)
Citation preview

Going electric | A pathway to zero-emission buses | Policy paper June 2021 A
Going electric A pathway to zero-emission buses
Policy paper
June 2021

AcknowledgementsThis policy paper has been prepared by David Leeder and Alok Jain (TIL consultants), Ian Jennings (EBRD Senior Urban Transport Specialist), Xiaolu Wang (EBRD Infrastructure Associate Banker) and Kjetil Tvedt (EBRD Senior Economist).
The European Bank for Reconstruction and Development (EBRD) gratefully acknowledges the support and contributions of its co-publishing partners, The International Association of Public Transport (UITP) (Arno Kerkhof and Aida Abdulah) and Deutsche Gesellschaft für Internationale Zusammenarbeit (GIZ) GmbH (Christian Mettke and Corinna Winter).
The EBRD also acknowledges the contributions of all participants and speakers at the Bank’s Going Electric conference, which took place in London in March 2019 and of those at the GIZ Berlin Transport and Climate Change Week conference, held in March 2020. Staff of Go-Ahead London and Transport for London (TfL) kindly provided assistance and cooperation in arranging site visits during the Going Electric conference.
This policy paper contributes to the Mobilise Your City partnership for sustainable urban mobility, to which the EBRD is a contributing partner.
DisclaimerThe contents of this publication reflect the opinions of the authors and do not necessarily reflect the views of the EBRD. Hyperlinks to non-EBRD websites do not imply any official endorsement of, or responsibility for, the opinions, data or products presented at these locations, or guarantee the validity of the information provided. The sole purpose of links to non-EBRD sites is to indicate that further information is available on related topics.
© European Bank for Reconstruction and Development One Exchange Square London EC2A 2JN United Kingdom
www.ebrd.com
All rights reserved. No part of this publication may be reproduced or transmitted in any form or by any means, including photocopying and recording, without the written permission of the copyright holder. Such written permission must also be obtained before any part of this publication is stored in a retrieval system of any nature.
Terms and names used in this report to refer to geographical or other territories, political and economic groupings and units, do not constitute and should not be construed as constituting an express or implied position, endorsement, acceptance or expression of opinion by the European Bank for Reconstruction and Development or its members concerning the status of any country, territory, grouping and unit, or delimitation of its borders, or sovereignty.

Going electric | A pathway to zero-emission buses | Policy paper June 2021 1
Contents
1. Introduction 31.1. Part of the EBRD policy dialogue series 3
2. Purpose of this report 4
3. Current state of e-bus deployment 53.1. Growth in e-buses is driven by multiple factors 6 3.2. First-wave e-bus adoption 73.3. Subsidies and incentives 8 3.4. Competitiveness 9
4. Setting scheme objectives for e-bus projects 10
5. E-bus technology options 135.1. Charging technologies 15 5.2. Charging strategy: a vital consideration 165.3. Technology selection criteria 175.4. Developing a charging strategy 185.5. Impact of charging and power strategy 19
6. Battery technology 206.1. Battery economics and cost considerations 206.2. Battery technology overview 216.3. Current market leaders 226.4. Managing battery performance 236.5. The circular economy 236.6. Planning and contracts 25
7. Operational and engineering considerations 267.1. Impact on bus depots 267.2. Impact on engineering processes 277.3. Reviewing and updating plans and budgets 28
8. Getting the governance and funding framework right 298.1. Reforms, system funding and contracts 298.2. Governance structure 318.3. Operating contract 32
9. Project development model 339.1. Project development model for typical e-bus scheme 33
10. Risk identification and management 3410.1. Risk identification and control strategies 34

Going electric | A pathway to zero-emission buses | Policy paper 2 June 2021
11. Total cost of ownership analysis: worked example 35 11.1. Concept of total cost of ownership 35 11.2. A preliminary TCO estimate 36 11.3. Strategic evaluation 37 11.4. TCO analysis: UK example 38 11.5. TCO analysis – bus specification and cost assumptions 3911.6. TCO analysis and commentary: sample calculation 4011.7. Analysis of power consumption versus fuel consumption: example 41
12. Procurement and financing 4212.1. Principles of scheme financing and asset procurement 4212.2. Sources and use-of-funds analysis 4212.3. Using appropriate guidance for e-bus procurement tenders 4312.4. Tendering strategies to procure e-bus fleets 4512.5. Extended warranties and/or battery-as-a-service agreements 46
13. Lifetime funding models 4713.1. Key negotiating points for asset funding models 4713.2. Emerging procurement models 4713.3. Risk allocation comparison among the different models 4813.4. Financing model characteristics 49
13.4.1. Standard funding model 4913.4.2. Standard funding model plus extended warranty 5213.4.3. Standard funding model and service agreement 5413.4.4. Battery-as-a-service model 5613.4.5. Utility-funded model 5813.4.6. Joint purchase programmes 58
14. Case studies 5914.1. Battery-as-a-service model case study 5914.2. Extended or lifetime warranty model: TEC Belgium 6114.3. The Netherlands: e-buses in outsourced operations market 6214.4. Autonomous electric (battery and ultra-capacitor) deployment supported by the EBRD 6314.5. Extended range trolleybus supported by the EBRD 6414.6. “Big-bang” e-bus deployment in Santiago de Chile 6414.7. Good practice examples 65
15. Summary 66
16. Links and information resources 67
17. Further information 68References 68Website references 68Glossary 69 Annex 1 70Annex 2 72 Annex 3 74

Going electric | A pathway to zero-emission buses | Policy paper June 2021 3
1. Introduction
Electric mobility is a long-standing technology that is being revolutionised by the rapid improvement of battery technology. Electric mobility was first developed in the 1880s1 and since that time has grown into extensive metro, tram and trolleybus systems all over the world. Such electric mobility systems remain the backbone of many urban transport systems, notably in major cities. The systems are characterised by permanent electric supply with network distribution via an appropriate catenary, ground feeder and substations. Electric traction technology is thus a highly mature market with established technology, supply chains and practices.
However, many cities rely on diesel-powered systems for some or all of their urban transport needs. Diesel buses have dramatically reduced their emissions footprint over the last 20 years.2 The emergence of new battery technologies is now making fully electric buses more competitive as a fleet replacement option.
Recent developments in battery technology have seen the emergence of cheaper, lighter, more efficient power-storage batteries as the key enabler of the growth in electric buses. This change is now assisting the expansion of electric mobility into autonomous transport modes, with urban e-buses at the forefront of this shift.
E-buses now offer reliable technology, a stable operatingenvironment, a practical daily range and ready accessto a variety of proven charging systems either in depotsand/or on-street. Such bus fleets are termed “batteryelectric buses (e-buses)”, with batteries as their soleenergy source.
Opportunities exist in many cities to make better use of the existing transport infrastructure – notably street-running trams and trolleybuses – to optimise available technology solutions and adapt to all terrain and climatic conditions. Such solutions offer the possibility of on-street charging and “in-motion” charging solutions – also referred to as hybrid or battery trolleybuses. Such systems allow routes to be expanded beyond catenary networks and to exploit existing investments in power distribution equipment. This development is especially relevant in countries in Central Asia, eastern Europe and the
Caucasus – where many tram and trolleybus networks are still operational. By offering opportunities for an optimised and expanded street-running electric bus system, through hybrid trolleybuses (in-motion charging), new technologies may thus lead us into a new era of e-mobility development.
The total cost of ownership (TCO) in some markets is gradually approaching parity, on a lifetime basis, to diesel and compressed natural gas (CNG) vehicles,3 but is highly sensitive to the fossil fuel tax regimes, route demand and frequency, assured asset life and reliable service patterns.
It is expected that the cost penalty of e-buses will continue to fall, as manufacturers and operators achieve scale, capital costs fall and operators exploit the potential to reduce engineering and depreciation costs.4
The new e-bus market could transform the supply market, with the emergence of new players in batteries and power supply equipment, new e-bus products from existing builders and new entrant bus builders, and – potentially – the vertical integration of battery, electric drivetrain andbus assembly companies.
Electric mobility is now a key part of the sustainable mobility agenda towards alignment with the Paris agreement on climate change. The EBRD is ready to support cities in implementing electric mobility as part of their Paris alignment strategies, notably within the EBRD Green Cities programme.
1.1. Part of the EBRD policy dialogue series
This paper was produced as an output from policy workshops held in London at EBRD Headquarters and in Berlin (GIZ). The EBRD is committed to improving awareness of emerging good practice and sharing knowledge amongst cities, transport operators and suppliers.
This report reflects the discussions held at the Going Electric conference, sponsored by the EBRD, UITP and GIZ, held in London on 26 and 27 March 2019 and at the GIZ Transport and Climate Change Week conference, held in
1 TIL Giant’s Causeway Railway, Ireland and Volk’s Railway, England 1883.2 TIL – EU diesel engine emission standards Euro I-VI.3 TIL research and analysis for the EBRD – see section on TCO.4 TIL research for the EBRD – see section on TCO.

Going electric | A pathway to zero-emission buses | Policy paper 4 June 2021
Berlin from 2-5 March 2020. It is intended as a guide for scheme sponsors, promoters and financing institutions to guide project development.
Going Electric brought together transport operators, transport authorities, advisers, financiers and energy experts from Europe, the Middle East and Asia to share emerging experience and good practice relating to electric bus deployment. Topics discussed included:• bus operations• engineering
• vehicle and battery technology• charging strategies• economics and operating costs• vehicle, battery and asset financing.
Participants took part in a site visit to the Waterloo depot of Go-Ahead London and to the offices of Transport for London (TfL). The London conference was arranged by TIL for and on behalf of the EBRD and supported by UITP and GIZ. See Annex 1 for the list of speakers.
2. Purpose of this report
This report is intended to facilitate policymaking and the development of electric bus schemes, and to assist project finance. It summarises emerging good practice across a range of important topics and geographies.
E-buses are now being deployed rapidly across awide range of cities, with mass production leading toreductions in unit costs and lower technological risk.Schemes can now be developed that make a materialcontribution towards typical urban transport goals withinrealistic funding budgets. This report aims to show thate-buses have moved beyond the experimental and thatsponsors have a range of technologies and financingoptions at their disposal.
It is aimed primarily at scheme promoters and sponsors, including:• city region policymakers and politicians• transport authority officials• financing entities• cities and/or transport operators seeking
development loan financing.
The report contains:• an overview of the state of emerging technologies• commentary on operational, engineering and
economic considerations and risks• an overview of pathways to scheme implementation• advice on project development• guidance on considerations in relation to TCO• options for possible asset-financing structures• case studies and reference material.

Going electric | A pathway to zero-emission buses | Policy paper June 2021 5
3. Current state of e-bus deployment
Fast growthThe number of e-buses in service has grown quickly since 2015, driven by a shift in transport policy in many city regions toward environmental concerns and rapid advances in bus and battery technology. E-buses are now being deployed in increasing numbers for intensive urban operations across a range of city sizes and types.5
Mainstream technologyIn terms of the current (2021) state of market deployment, today’s clean bus technologies can be split into: • mainstreamed: e-bus, plug-in hybrid, gas, biofuel,
battery trolleybus• emerging: hydrogen fuel cell.
There is a renaissance of plug-in hybrid buses as a transition technology between diesel and zero-emission vehicles. Natural gas has different market penetration, depending on fiscal and policy differences between countries and such fleets have tended to cluster in specific cities and regions.
A forecast exercise performed by the UITP Vehicle Equipment Industry Committee in 20176 in the frame of the ZeEUS project on the expected market share of bus technologies at the international level by 2020, 2025 and 2030, suggests a clear decrease in the use of clean diesel, mainly in favour of battery electric technology as the predominant electric bus technology. It suggests:• stable demand for CNG and plug-in hybrids as transition
technologies between diesel and zero-emission options• a gradual rise in the use of fuel-cell hydrogen
(FCH) powertrains.
Battery life is uncertainWhile e-buses are becoming a more established technology, much of the battery life cycle remains untested, notably the end of life, with few e-buses having yet been retired from service. Therefore, the management of technology risk remains a key issue (notably battery life, battery disposal and the replacement-cost risk of batteries).
These factors are resulting in the emergence of new solutions for battery leasing/service agreements and for extended warranty of batteries and buses. Moreover, clear technology options are emerging for the interrelated topics of battery technology and bus charging.
Integration with renewable generation and grid planning is neededLarge-scale deployment of e-buses will require significant incremental power capacity and given the public policy objectives this is likely to require a corresponding increase in renewable generation capacity. E-buses may also play a useful role in balancing the supply for renewable electricity, by providing off-peak demand for renewable power through overnight charging and by the deployment of partly used batteries removed from buses for energy storage elsewhere in the grid (“battery second life”).
5 UITP analysis.6 UITP ZeEUS project analysis, 2017.
0%
20%
40%
60%
80%
100%
2020 2025 2030
16.2%2.1%
22.1%
11.9%
47.7%
19.2%
7.4%
32.7%
13.5%
27.2%
18.2%
12.5%
45.2%
16.5%
7.5%
Clean diesel Diesel hybrids Electric Electric (fuel cells) Compressed natural gas/biogas
Figure 1. Propulsion systems by year – UITP forecast (European markets)
Source: www.zeeus.eu and © UITP VEI Committee.

Going electric | A pathway to zero-emission buses | Policy paper 6 June 2021
3.1. Growth in e-buses is driven by multiple factorsThe adoption of e-buses is being driven by multiple market, policy and fiscal factors and the balance varies by country and city. The schematic below shows some of the most recurrent and important factors noted in successful schemes.
e-busadoption
Legislation• Paris Agreement• Regional, national,
city and/or region• Formalisation/reform
of bus operators to enable investment
• Access restriction policies (such as low emission zones (LEZ) and ultra LEZ)
Renewable energy• Scale and pace
of renewable energy deployment (notably solar, wind)
• Grid• Energy markets (ability
for net metering, wheeling, and so on)
• Presence of market-based energy providers (especially private utilities)
Technology• Bus
development• Battery
improvements• Availability of
street charging infrastructure (for example, trolleybuses, trams)
Policy priorities• EC Clean
Vehicles Directive
• Reducing local air pollution
• Cutting greenhouse gases
• Reducing noise
Market economics• Market price, availability
and structure of diesel, CNG and electric energy
• Maturity of supply chain industry
• Local skills and industrial base (bus technologies)
Tax policy• Higher taxes
on fossil fuels• Lower taxes
on electricity• Capital subsidies
for zero-emission vehicles
Figure 2. Factors that have promoted e-bus adoption
Source: TIL analysis for the EBRD.Note: Schematic shows motivations and enablers for the use of e-buses, in schemes studied by TIL.
E-bus in the Netherlands, operating on a bus service provided under contract and awarded by open tender, and using “opportunity charging” technology for a line-of-route power top-up

Going electric | A pathway to zero-emission buses | Policy paper June 2021 7
Table 1. Regulations and standards for e-busesRegulatory level EU level
SupranationalUnited States of America Federal
ChinaFederal
National or US state City regionsSubnational
Key regulations Vehicle construction and use
Vehicle construction and use
Vehicle construction and use
Vehicle construction and use
City targets for vehicle standards and zero-emission bus fleets above minima
Rules for subsidies and outsourcing of operations
Capital subsidies to cities Capital and revenue subsidies to operators and cities
Capital and revenue subsidies to operators and cities
City tax and subsidy policyBus regulation policyOutsourcing/insourcing Low emission zones (LEZs)Bus priority and traffic management
Fiscal influences Seeking fiscal powers and Green New Deal programme post-Covid-19
Fiscal policy for fuel and power
Fiscal policy for fuel and power
Fiscal policy for fuel and power
Political initiatives by elected mayors and city region government
Clean Vehicles DirectiveFifty per cent of the minimum target for the share of clean buses has to be fulfilled by procuring zero-emission buses – including fuel cell buses – by 2025-30. Already, 4,775 e-buses and 5,048 trolleybuses are in use (latest own estimation included 2,062 registered e-buses in 2020)
United States Environmental Protection Agency
Capital grants to battery and bus manufacturers and bus operatorsMore than 400,000 e-buses are already in service
Can set standards above Chinese, US or EU federal minimaUnited Kingdom: 2050 zero-carbon targetCalifornia, United States of America: from 2029 all buses purchased must be zero-emissionShenzhen, China: largest all-electric bus fleet
Can set standards above national or regional minimaLEZ or clean air charging zones, for example London, Glasgowand Leeds in the United Kingdom
Emissions standards Euro emissions standard Federal emissions standardsUnited States Environmental Protection Agency
National emissions standards fromMinistry of Environmental Protection
National emissions standardsThe United Kingdom followed EU rules until 31 December 2020
Sometimes have power to set standards above the prevailing national or state minimum
Euro VI diesel from 2021 Directive setting maximum emissions levelsThe Regulation (EU) 2019/1242 setting CO2 emission standards for heavy-duty vehicles entered into force on 14 August 2019
Final rule for Phase 2 Greenhouse gas emissions standards and fuel efficiency standards for medium- and heavy-duty engines and vehicles
Current standardnationwide: China V (similar to Euro V)
US states have a strong role (for instance, the California Air Resources Board)
Regional and local: China VI (similar to Euro VI) in key regions of Beijing and Shanghai applicable to heavy-duty vehicles over 3,500 kg equipped with compression ignition engines or positive ignition natural gas (NG) or liquefied petroleum gas (LPG) engines
Further information ZeEUS eBus Report #2https://zeeus.eu/uploads/publications/documents/zeeus-ebus-report-2.pdf
Regulations for Emissions from Vehicles and Engineshttps://www.epa.gov/regulations-emissions-vehicles-and-engines
3.2. First-wave e-bus adoption The first-wave adoption of e-buses is being driven by regulatory changes. Regulation and standards have emerged at the continental, national and city region level.7
7 TIL analysis for the EBRD.
Source: TIL and UITP research for the EBRD.

Going electric | A pathway to zero-emission buses | Policy paper 8 June 2021
3.3. Subsidies and incentives
Table 2. Capital and operating subsidies and tax incentives have assisted the funding of many projects
Germany United States of America China India
Programme Guidelines for the Promotion of the Purchase of Electric Buses in Public Transport
Low or no-emission (low-no) vehicle programme
National and local support programmes
Faster Adoption and Manufacturing of Electric Vehicles (FAME II)
Incentivised investment
• purchase of e- and hybrid buses
• related infrastructure• equipment and
staff training
• purchase or lease of e-buses and low emission buses
• acquisition, construction and leasing of required supporting facilities
• purchase of new e-buses• annual operation subsidies
• purchase of e-buses manufactured in India
• charging stations
Support offered Grant:• up to 40 per cent price
differential for hybrid buses• up to 80 per cent price
differential for electric buses• up to 40 per cent for
workshop equipment and staff training
Capital grant:• up to 85 per cent for buses• up to 90 per cent for bus-
related equipment and facilities
State subsidies: • to vehicle manufacturers
(will be substantially reduced in 2020)
• to bus operators
State subsidies (based on battery size):• up to 40 per cent for buses • Rs 1,000 crore
(US$ 140 million equivalent) for charging stations
Budget €300 million (2018-22) US$ 85 million (2019)Annual funding rounds
The amount of subsidies for bus purchases is lowered year by year from 2017-20Bus operators can obtain an operation subsidy of RMB 640,000 (€83,858 equivalent) for an e-bus with a length of more than 10 metres
Rs 10,000 crore (US$ 1.4 billion equivalent)
Funding source Federal Ministry for the Environment, Nature Conservation and Nuclear Safety (BMU)
Federal Transit Administration Central government (Ministry of Finance, Ministry of Industry and Information Technology, Ministry of Science and Technology, National Development and Reform Commission and Ministry of Transport)Local governments
Department for Heavy Industries and Public Enterprises
Recipients Public transport operators (including joint projects)
State, local governmental authorities, Native American nations
Vehicle manufacturers, public transport operators
Manufacturers, infrastructure providers of electric vehicles

Going electric | A pathway to zero-emission buses | Policy paper June 2021 9
Figure 3. E-buses are becoming competitive on a range, cost and risk-adjusted basis, depending on local tax and operating cost conditions (UK and EU-based analysis)
3.4. CompetitivenessThe daily range (kilometres driven per bus day) and the kilometres that can be driven between recharging events is growing, while the technological risks are diminishing, as production volumes increase, and upfront capital costs are falling.
Clean diesel or gas DCG Hybrid diesel or gas DH Plug-in hybrid PIH Battery electric bus e-bus Hybrid or battery trolleybus IMC®
Trolleybus T Hydrogen fuel cell HFC
High
Low
Low High
Daily range
Tota
l cos
t of o
wne
rshi
p (T
CO
)
High
Low
Low High
Upfront capital cost
High
Low
Low High
Technological risk
e-bus
DCG
IMC®
PIH
DH
T
HFC
e-bus
DCG
TIMC®
DH PIH
HFC
IMC® T
DH PIHHFC
e-busDCG
Source: TIL analysis for the EBRD.
The schematics above show TIL’s estimation of 2020 TCO versus the key variables of the daily bus range (kilometres travelled, or km), the level of technology risk and the upfront capital costs, based on UK analysis. The reference point is the whole-life cost of a Euro VI diesel or gas bus 12-metre single deck, which is the most common bus type in general use for urban and interurban services in Europe.
TIL’s assessment is that:
• Diesel or gas continue to set the baseline for thewhole-life costs and the upfront capital required.
• However, the residual value (RV) risk is arguablyincreasing for diesel as cities switch to zero-emissionbuses, leading to an increasing cost of capital fordiesel buses over time.
• Trolleybuses and battery buses charged by trolley wires(in-motion charging, or IMC) can be cost-effective if anexisting trolley infrastructure is in place, or can be setup at a low cost.
• HFCs currently have a much higher level oftechnological risk and capital cost, although this isforecast to fall over time.8
• E-buses have a low level of technological risk andtheir TCO is now comparable to diesel,9 but upfrontcapital cost (excluding infrastructure) may be twicethat of diesel.
• E-bus TCO is highly sensitive to local circumstancesregarding fuel and power prices, and taxation e-busesare approaching TCO parity with diesels, in specificlocal circumstances.
8 Bloomberg New Energy Finance. 9 TIL analysis of TCO for the EBRD.

Going electric | A pathway to zero-emission buses | Policy paper 10 June 2021
4. Setting scheme objectivesfor e-bus projects
The public policy objectives for e-bus deployments vary by city, and Table 3 summarises the typical goals. The suite of objectives shown is not comprehensive and each city will have its own issues and priorities. City leaders and policymakers should start with a clear statement of
10 TIL analysis for the EBRD.
Goal
Improve local air quality
Description
Local targets for particulates, GHGs or CO2 above national or regional standards such as Euro VI
Deadlines that are realistic and command consensus should be set for zero-emission vehicles
Reduce noise from transport
Improving the urban realm by reducing noise impacts from buses and improving the comfort and amenity of residents and users of the town or city
Improve public transport access to sensitive urban areas and support LEZ policies
There are strong and long-standing environmental and political pressures to remove polluting transport vehicles from key city centres, including historic areas and shopping streets. This policy has contributed to increased public transport operating costs and reduced revenues
The use of e-buses may allow buses to access sensitive streets, thereby making public transport more attractive and reducing operating costs
Contribute to Paris Alignment goals, through CO2 and GHG reduction targets
National and regional governments may have binding targets for climate improvement and mitigation, including local and national targets for “net zero”
Build energy source diversity and renewable storage capacity
National and city governments may wish to reduce their dependency on imported fossil fuels and improve the diversity of electricity supply, including increased use of electricity generation from renewable local sources
Overnight charging of e-buses allows renewable power to be stored and the power grid “balanced”
Table 3. Objectives for e-bus projects vary, but typically include some or all of those shown below10
(continued on the next page)
their underlying policy objectives and then assess how a zero-emission bus strategy can serve these goals. Cities should consider the trade-offs between objectives, including those around funding and affordability.

Going electric | A pathway to zero-emission buses | Policy paper June 2021 11
Goal
Improve the image of local buses and fleet renewal
Description
Making buses zero-emission at the point of use may allow policymakers to gain broader support for car traffic restraint and other pro-public transport measures intended to decrease the share of private cars
Expand the use of existing trolleybus infrastructure
Some cities have an existing trolleybus power distribution infrastructure, but few systems have universal coverage of all routes. IMC allows existing trolleybus systems to be extended beyond their wiring and existing catenary networks to be used to charge buses for use over a wider area
Improve the public transport market share
Electric buses are unlikely, in themselves, to contribute to significant patronage gains
E-bus schemes should be linked to wider traffic-management measures to improve the relative journey time of buses, including bus lanes, busways and parking policy
Reduce operating costs
Electric buses may be cheaper to operate, depending on trends in capital and operating costs, energy prices and the availability of operating and capital grants
Cities should develop multi-year capital and operating plans and “sources and uses” of funds
Cities should develop clear objectives, including the weighting between objectives, the desired policy deadlines and a realistic statement of achievable capital and operating funding sources.
Many cities will wish to carry out a social cost-benefit analysis (CBA) to measure e-bus performance against wider policy objectives, alongside financial analysis. As part of project development and justification, most cities will wish to carry out a social CBA in parallel to the financial TCO estimation to determine broader policy impacts.
The CBA is likely to take account of impacts and distributional effects in policy areas such as:
• noise from bus fleets• pollution from fuel and energy use• local environmental impacts “at the tailpipe”• contribution towards global climate change and
impact of power generation mix• impact on passenger travel time, congestion and
modal share effects• impact on traffic accidents and passenger safety.
Some countries and cities will have pre-defined protocols for carrying out such analyses.
The CBA should use the same operational assumptions that drive the TCO calculation (bus fleet, bus km, staff hours paid, fuel and power assumptions and so on).
(continued from the previous page)

Going electric | A pathway to zero-emission buses | Policy paper 12 June 2021
Figure 4. Financial and social cost-benefit analyses should be based on a common set of operational and financial assumptions
TCO financial analysis Financial impacts Profit and loss Capital requirements Subsidy requirements and tax impacts By system actor
Fact base – financial and operational Operating cost data Capital cost data System boundaries, bus fleet, kilometres, labour hours Climate and topography Route network Passenger volumes Labour and staffing Power and fuel and so on
Social and environmental impacts Cost-benefit analysis Pollution Travel time Accidents Noise GHG impacts and so on
Financial TCO analysis
Operational and financial assumptions
Cost-benefit economic analysis
Noise Environment
Accidents Delay
OEM
PTA And so on
PTO Funding agencies
Source: TIL analysis for the EBRD.

Going electric | A pathway to zero-emission buses | Policy paper June 2021 13
5. E-bus technology options
Table 4. Technology options
Diesel or clean gas (CNG)
Hybrid diesel or CNG
Plug-in hybrid Battery electric bus
Hybrid or battery trolleybus
Trolleybus Fuel cell hydrogen
Meets latest Euro VI standardsNo electric transmission
Diesel HVO 100 per cent fossil-free diesel
CNG bus as mature alternative technology
Biogas – using recycled or bespoke fuel
On-board diesel generatorbattery pack to allow balancing of engine load
No plug-in capability
Able to operate on battery for substantial period
Can be recharged externally as well as by on-board diesel engine
No on-board generator All power sourcedfrom on-boardbatteries
Battery bus charged by trolley wires
No or limited battery pack
Batteries used for short distance manoeuvring in depots and at terminals only
Electric bus with power generated on board by fuel cell
Unconstrained daily range
More experimental technology
Bus fuelled at depot hydrogen station
Existing sector-standard technology In scope for this report Existing sector-standard technology
Higher-risk emerging technology
Example cities: • TEC Wallonia, Belgium
• Gothenburg, Sweden
• TEC Wallonia, Belgium
• Grudziaz, Poland
• London, United Kingdom
• Harrogate, United Kingdom
• Amsterdam, the Netherlands
• Paris, France• Geneva,
Switzerland• Batumi, Georgia
• Gdynia, Poland• Prague,
Czech Republic• Balti, Moldova• Arnhem Smart
Grid, the Netherlands
• Dushanbe, Tajikistan
• Bishkek, Kyrgyz Republic
• Almaty, Kazakhstan
• Yerevan, Armenia• Belgrade, Serbia• Kyiv, Ukraine• Lyon, France• Arnhem,
the Netherlands
• London and Aberdeen, United Kingdom
Diesel or clean gas (CNG) Hybrid diesel or CNG Plug-in hybrid Battery electric bus
Hybrid or battery trolleybus Trolleybus Fuel cell hydrogen
E-buses are part of a wider range of technology options, including clean diesel, hybrid and gas. Table 4 shows the main e-bus charging technologies that are in widespread use, with technical considerations for each. They should be evaluated as part of the development of the charging strategy for each system.

Going electric | A pathway to zero-emission buses | Policy paper 14 June 2021
The TCO of each competing technology should be estimated according to local conditions, funding and risk appetite.
Diesel and buses are becoming cleaner:• Diesel technology has gradually reduced its
environmental impact.• Gas-powered buses have offered further
environmental advantages, can use biogas fuel andhave been widely deployed in some territories.
• However, many cities and countries are now committedto zero-emissions “at the tailpipe”.
E-buses are gaining market share fast:• The use of e-buses is being rapidly scaled up as a
proven solution where daily kilometres and/or chargingcan be optimised to meet operational demands.
• Large fleets are now being deployed in small andlarge cities, leading to a wider choice of bus types,charging technology and financing options foroperators and cities.
Plug-in hybrids and trolleybus charging are now real options:• Where the kilometres travelled exceed the comfortable
range for e-buses, we are seeing the deployment ofplug-in hybrids, often for longer, inter-urban routes.
• For cities that have retained their tram or trolleybussystems, the trolley wires can be used to charge busbatteries and routes can be extended well beyond thelimits of the trolleybus catenary.
• We are now seeing the creation of new systemsthat use trolley wires on core sections to chargebuses in motion.
HFCs are moving from technical trials to pilot deployment:
• HFC buses have been in intensive trials across Europefor around 10 years.
• These trials are moving towards larger-scaledeployment as the issues of bus technology andhydrogen supply are being resolved, although thistechnology remains more experimental than thevarious electric bus variations.
This chapter places the e-bus options in context and sets out some of the issues around optimisation that cities considering e-buses must take into account.

Going electric | A pathway to zero-emission buses | Policy paper June 2021 15
5.1. Charging technologies
Table 5. E-bus charging technology typologies and considerations
Charging system Plug-in charging (AC or DC) Opportunity charging (DC only) Trolley wire charging (DC only)
Charging locations Charge in depots via cable On-road and/or in depots via pantographs
Charge using trolley wiresSee UITP detailed Knowledge Brief
Batteries High battery capacity Lower battery capacity Lower battery capacity
Higher battery weight Lower battery weight Lower battery weight
No need for fast charge Faster charge rate Faster charge rate using wires
May address heating and ventilation issues
Planning No planning issues around depot chargers
Planning and amenity issues around on-street chargers
Exploits existing trolleybus infrastructure
Requires overhead wires on key route sections
Range Lower range than dieselsUp to 250 km per day
Addresses range issue but requires regular in-service charging
Maximum of 190 km between charges depending on installed battery capacity
Addresses range issue and allows trolleybus systems to be extendedTypically, more than 50 per cent offline running
Batteries High battery capacity Lower battery capacity Lower battery capacity
“Live” cities and towns London >500 buses and risingAberdeen, Brighton, Harrogate, Nottingham, Salisbury
The Netherlands >1,000 buses Gdynia, Poland; Prague, Czech Republic
In Italy, eastern Europe and the Caucasus, and Central Asia, many cities with trolleybuses are looking at this option
Definition AC = alternating current motor and traction packageDC = direct current motor and traction package
Charging at high speed via overhead or below vehicle connectors
Charging via overhead trolley wire catenary while the vehicle is in motion: may be shared with existing tram and/or trolleybus systems
Charging rate 40-80 kW (80 kW assumes two chargers per bus, per BYD)Plug-in charging
Depot 50-150 kW
On-street 300-600 kW
Plug-in or opportunity charging
Capital cost – charger on street Not available €280,000-340,000 (2020 prices)
Capital cost – in depot charger, excluding installation costs
€8,000-13,000 €28,000
Bus manufacturers offering this option include
BYD/ADL Optare VolvoIrizarYutongCaetanoScaniaMercedesHeuliezSolarisBelkommunmash
SORSolaris Belkommunmash
Charging time 3-5 hours per vehicle 3-3.5 minutes per vehicleassuming 100 kW charger
During service operation

Going electric | A pathway to zero-emission buses | Policy paper 16 June 2021
E-bus charging technology choices are an importantstrategic consideration that affects planning approvals,capital costs and daily operating costs. The technologyhas moved beyond the experimental stage and citiesand/or bus operators are able to select from a range ofwell-proven technologies in large-scale use. These shouldbe assessed against the transport policy and operationalcharacteristics of each city, using the optimisation factorsdeveloped in the scoping phase.
Key factors include:• route lengths• kilometres operated per bus per day• timetable and commercial speed• charging time• climate effects• availability of trolleybus catenary networks• economics of AC versus DC charging.
5.2. Charging strategy: a vital consideration
The charging strategy must consider the balance between charging in depots and on-road “opportunity” charging.
Features of on-road or in-depot “opportunity” charging:• overcomes daily range issue• reduces vehicle weight• has a potentially longer battery life• requires DC power.
This type of charging allows:
• the use of smaller batteries and/or longer life – somemanufacturers quoting 12-15 years
• capacity: 12-metre single-decks 90-120 kWh• quicker charging – some manufacturers state
that batteries need balancing with a slow chargeevery 3-4 days, hence some depot infrastructure isrequired (note that slow depot-charged buses cannotbe fast-charged at 300-600 kW due to differentbattery chemistry)
• a better power-to-weight ratio• uses tramway type pantographs to access catenary
(these can be fitted on buses or on the chargingmasts themselves)
• allows pantographs to be deployed in bus depots inplace of plug-in charging, which may also solve somedepot capacity issues
• may be a solution to depots that cannot bereconfigured for plug-in charging
• slow charge buses with large battery packs that cancharge in depot via cable or pantograph
• allows buses to be charged overnight, potentially usinglow-cost energy from renewables
• allows the bus fleet to store excess renewable production• enables discharge of power at high capacity• fast-charge buses with smaller batteries can also
charge on-street or in depots via pantograph only (thiscannot be done via cable as 2020 charging rates over150 kW would overheat a cable)
Opportunity-charging AC bus, the Netherlands

Going electric | A pathway to zero-emission buses | Policy paper June 2021 17
• the expansion of charging points to “on-road” toovercome daily range issue is a complex issuefor bus planning
• only a small number of bus stops would be suitable inoperational terms as charging points (it is envisagedthat this technology would only be used at a terminalpoint where buses have at least three to four minutesto charge); issues to consider include:• “land take”• visual intrusion• conservation areas• frontagers’ objections (light, parking, noise)• risk of vandalism• bus stop capacity• traffic congestion impacts• local power supply capacity• planning approvals for charger and
transformer boxes• health and safety concerns and approvals.
Aspects to take into accountPlanning issues outside of bus depots include:• visual amenity• power connection• operational planning aspects to consider (for example
charging time, timetables and driver working hours)• planning approvals.
Many larger cities are likely to require a mix of depot-charged and opportunity-charged routes, depending on daily kilometres travelled per bus and the relative costs of the charging equipment, batteries and power consumption differences. See UITP TUL policy paper “The impact of electric buses on urban life”.11
Passenger transport authorities (PTAs; see UITP TUL policy paper) or operators (PTOs) must undertake a detailed route analysis to determine the optimum solution for each route.
TfL in London has indicated that while they expect most routes to use depot-charged buses due to the high mileages/length of an operating day – between 10-15 per cent of the network could be opportunity-charged. Therefore, in-depot and on-road charging are likely to be complementary in a city with high numbers of electric vehicles. The authors estimate that a period of at least 12 months will be needed to obtain permissions and install on-road chargers. However, routes with high daily mileages may require this option – we estimate 15 per cent of bus fleet in larger cities, based on UK duty cycles.
5.3. Technology selection criteriaTechnology selection criteria include TCO, daily range, infrastructure feasibility and environmental impact.
Table 6. Propulsion system selection criteria
Technology Type Autonomy (range) Charging/ refuelling infrastructure(investment and effort)
Impact on operation
Impact on urban landscape
Battery electric Zero emission Zero emission High High Moderate (OC) Low (ON)
Plug-in diesel hybrid Clean Limited Low Medium Low
Natural gas Clean Comparable to diesel Moderate Low Low
Fuel cells Zero emission Comparable to diesel High High Low
Battery equipped trolleybus Zero emission
Unlimited (typically more than 50 per cent offline running, subject to battery size)
Moderate (assuming existing catenary network)
Moderate Medium
Source: UITP e-bus training programme.11 See UITP Transport and Urban Life Committee (2019).

Going electric | A pathway to zero-emission buses | Policy paper 18 June 2021
Bus range (which is the distance a bus can travel between recharging or refuelling events) is a key criterion for practical operation. An inadequate bus range increases the bus fleet needed, requires additional staff paid time and may harm service reliability.
Range has rarely been a constraint for diesel buses, as the fuel tank capacity generally exceeds the planned bus km per day. For diesel buses, the range depends on fuel consumption. A standard 12-metre city bus can have a range of up to 700 km and the daily range is rarely an operating constraint.12 To date, diesel buses remain the benchmark, with few restrictions on effective range even for buses operating a high daily km and/or high km per hour.
Plug-in hybrids have a similar range to diesels, but do not eliminate tailpipe pollution and are more complex to maintain than e-buses, since they combine two technologies and two sets of equipment to maintain.
Hydrogen fuel cells have an unconstrained daily range, but remain far more experimental and expensive at present, although capital costs are expected to fall as vehicles enter mass production.
Battery-equipped trolleybuses are normally deployed in cities which already have some trolleybus or tramway catenary that can be used for charging or that can be extended. Entirely new battery trolleybus systems have begun to appear in some cities, such as Prague. Power grid capacity is often an issue and the costs of grid connections vary by location of the depot and/or charging points.
5.4. Developing a charging strategyWithin the e-bus TCO analysis, the charging strategy for buses is a key aspect and should be developed at the project planning stage alongside planning for incremental power supply options.
Figure 5. Considerations in defining a bus charging strategy
Define constraints and objectives
AC or DC traction?
Mix between fast charging and slow charging
Location analysis for charging point
Permissions Approvals Installation Testing
For example:
Bus daily range required
Hilliness
Timetable and commercial speed
Road conditions
Climate
Heating and cooling
Depot capacity
Power consumption requirements
Bus fleet size
Project budget
Renewable capacity
Bus stop network
Cost-benefit analysis:
Cost Weight Range Operational impacts
AC = alternating current DC = direct current
Route types
Route daily mileage
Homogenous or mixed fleet?
Charging location options
Charging hub
Number of bus stops and stations
Local grid capacity
Planning issues
Cost estimation
Shortlisting
Finalisation of charging points
Feasibility
Detailed planning
Planning authority approvals
Grid connections
Civil engineering
Construction and commissioning
Safety testing
Operational testing
Multiple stakeholders must be involved at concept and throughout process
12 TIL analysis for the EBRD.
Understand network constraints
DC traction
AC traction
Slow(depot) charge Grid capacity Approvals Installation
Fast (opportunity)
charge
Potential charging locations
Shortlisting process Approvals Installation
Source: TIL analysis for the EBRD.
Slow (depot) charge Grid capacity Approvals Installation

Going electric | A pathway to zero-emission buses | Policy paper June 2021 19
Energy supply must be explored and planned from the scoping phase and consider:• incremental power demand requirements• renewable contribution• negotiation with energy utility• smart charging policies, such as charging
buses at night and active management of buscharging within depots
• role of bus fleet to balance renewable power capacityby overnight charging
• green grids• on-site storage and net metering• grid connection to charging points• a potential role for the EBRD to assist
planning and analysis.
Cities require a systematic bus-charging strategy that identifies objectives and constraints and determines the AC/DC mix, the split between in-depot and opportunity charging and the practical locations for charging points, and is planned and delivered by an integrated programme involving all relevant stakeholders.
5.5. Impact of charging and power strategy The impact of charging and power strategy on operating costs must be evaluated as inputs to the project plan, budget and TCO analysis.
Table 7. Charging strategy will feed into the TCO and financial evaluation
Number of charging points The number and location of charging points is a key driver of costs
Split between in-depot and on-road charging This will determine:• the capital and operating costs of the different types of charging points• the electricity tariff applicable – for example, the number of buses
charged at night (usually at a lower cost) versus buses charged during the day (when power costs are usually higher)
• the ability to use buses to store excess renewable power via night-time charging
Impact on bus km, spare bus fleet and paid driver hours The charging time and locations should be timetabled. This will determine the impact on:• the number of spare buses required for charging (on top of buses that
can be charged overnight)• any additional bus km that must be run to allow buses to return to
charging points• the staff time paid that is required to resource bus charging, such
as driver time at charging points and to operate “dead” km to/from charging points
Maintenance costs of charging equipment Equipment maintenance costs must be budgeted for
This activity is likely to be undertaken via contracts with the electricity utility and/or equipment original equipment manufacturer (OEM)
Electricity tariff Split between night time and day time tariffs
Capacity of local grid
Cost of upgrade works
Possibility for on-site solar PV generation, net metering and/or storage
Local factors must be taken into account Topography
Temperature range – heating and cooling have a large impact on power consumption
Fiscal and subsidy regimes
Vehicle range required between charging events
Power costs
Cost and availability of high-power electricity feeds for depot and opportunity-charging points
Operational data must be confirmed:• bus km; bus fleet; driver hours; driver pay; maintenance costs; fuel
consumption and power consumption data; parking space; depot modification costs; and so on
The outcomes of the charging strategy should be fed into the financial evaluation model, including impacts on bus km, bus fleet size and paid hours, as well as capex items.
Going electric | A pathway to zero-emission buses | Policy paper 20 June 2021
6. Battery technology
Battery cost accounts for around 30-50 per cent of the initial cost of an e-bus13
Between 2020 and 2025 both NMC and LFP battery costs are projected to fall by around 30 per cent and continue to fall as a result of improved manufacturing techniques, increased energy density within the cells and better pack design.14
Power
High-power currents are not considered optimal for maintaining battery health. While high power charging is compatible with most battery chemistries, some are more optimised for it (LTO). Charging continually using high-powered points will decrease battery life quicker than a lower-current charging regime.
Overview
Operating performance and characteristics of the batteries on-bus and when being charged are key drivers of an investment decision. Key issues are: • battery chemistry • battery degradation • impact of charging • safety (overheating issues) • cost (€/kWh).
Depth of discharge (DOD)/state of charge (SOC)
The DOD indicates the level of energy that has been discharged relative to the overall SOC of the battery on a given cycle. How and when the battery is charged to complete a full cycle will have an impact on the state of health (SOH) of the battery and its ageing process.
LFP is normally considered better than NMC for an overnight charging strategy. LFP accepts a higher depth of discharge and is thus more suited to buses in all day service; NMC prefers shallower depths of discharge which makes it more difficult to meet range requirements without intermediate top-up charging.
Battery chemistry
Battery chemistry is critical to range and charging speed.
NMC offers good overall performance and has a high energy-density performance (Wh/kg). Its active materials, nickel, manganese and cobalt, can be blended to suit energy storage systems that have high cycling requirements.
LFP offers good electrical performance with low resistance. Although it has a lower energy density performance rating than NMC, its key benefits are its high current rating and long life span. With fewer state-of-charge restrictions (compared to NMC), LFP offers advantages in terms of operational flexibility. It is expected that by 2025 batteries will increasingly use cathode chemistries that are less dependent on cobalt. This will lead to an increase in energy density and a decrease in battery costs, in combination with other developments.
Safety-battery management system
The battery management system (BMS) is an electronic system that monitors and regulates the individual cells and battery modules within the battery pack to optimise their output and ensure that the system is working within safe operating conditions. It performs a critical role in safety performance, charging rates and battery ageing.
The BMS is also responsible for ensuring that the maximum efficiency is achieved within the battery pack, making sure the cells are charging and discharging at the same voltage. Even within different chemistry, the form of the battery cell and the configuration of the BMS can heavily determine the battery’s performance.
Battery degradation (state of health)
Battery degradation is a natural process of use. Therefore, as the single most important part of the bus, it is critical that it is monitored and cared for. Managing SOH in its entirety – on vehicle and during charging – at all levels gives a cell level insight to understand and protect the asset.
The key factors that influence battery degradation in electric buses are temperature and power.
Other factors to consider include DOD and SOC.
Impact of charging
The rate at which a battery is charged or discharged will impact on the battery SOH. Controlling the DOD and maintaining an average SOC, rather than operating and charging the e-bus in the extremes of close to 100 per cent or close to 0 per cent SOC, is important.
The charging process moves ions around the battery, expending some of its energy in heat, because rapid charging requires a higher current and more heat is generated, which can affect battery degradation more than when charging at slower speeds.
The process of charging the battery is precisely controlled by the instructions and parameters of the charging and battery control system receiving the charge. In conjunction with a smart charging hardware and software infrastructure solution combined with fleet management data, it is possible to manage and monitor every event and keep the battery operating at its optimal SOC.
Temperature
Maintaining a steady and optimal temperature range in which the battery can operate ensures the chemical reactions that occur within the battery are neither moving too quickly (high temperature) or too slowly (low temperature).
Once a battery’s temperature limits are exceeded, certain chemical reactions may be triggered inside the battery leading to internal short circuit and cell failure, resulting in severe damage, propagation and risk of thermal runaway.
6.1. Battery economics and cost considerations
13 TIL analysis for the EBRD.14 Bloomberg New Energy.
The selection of battery technology and control system must be based on consideration of various operational, technological and economic factors, summarised in the table below.

Going electric | A pathway to zero-emission buses | Policy paper June 2021 21
6.2. Battery technology overviewThree types of Li-ion batteries (LFP, NMC and LTO) are commonly used in e-buses due to their strengths of a long lifespan, high specific power and/or energy density and high thermal and safety performance.
Table 8. Overview of battery chemistry and technology characteristics
LiFePO4 (LFP) LiNiMnCoO2 (NMC) Li4Ti5O12 (LTO)
Term Lithium iron phosphate Lithium nickel manganese cobalt oxide
Lithium titanate oxide
General High life cycle with good power parameters
Longer operating life Can be charged/discharged at very high current rates without affecting life cycle
Thermal stability High Excellent; good cold temperature performance makes them ideal for cold starts
Cost Competitive price due to easy availability of materials
Contains cobalt and thus more expensive than LFP
Expensive technology due to the high price of titanium
Energy density Lower voltage (3.2 V/cell) and lower energy density (90-120 Wh/kg) resulting in bigger and heavier batteries
Better energy density (150-220 Wh/kg), hence a longer driving range or a lighter and smaller battery pack
Low cell voltage (2.40V/cell) results in bigger and heavier battery packs
Safety Low toxicity (safer than NMC, vital for the large batteries of electric buses)
In an accident, massive amounts of toxic, flammable leakage could be produced
Charging rate Normal Normal Ultra-fast charge is possible, substantially reducing the necessary charging time and regenerative braking can be applied without problems, increasing the efficiency of the bus
Charging cycles About 3,500 About 3,500 Can last for tens of thousands of cycles
Others Higher self-discharge (can cause balancing issues with aging and thus shorter lifespan of the battery pack)
Users BYD, Nova bus or Volvo buses Proterra buses Proterra and Vectia buses
Source: See Iclodean et al. (2017) and TIL analysis for the EBRD.

Going electric | A pathway to zero-emission buses | Policy paper 22 June 2021
6.3. Current market leaders
Table 9. Operational characteristics of market-leading battery technologies
Battery type LFP (lithium iron phosphate) NMC (lithium nickel manganese cobalt oxide)
LTO (lithium titanate oxide)
Charging power √ √ √ √ √ √ √
Operational range √ √ √ √ √ √
BOB service life √ √ √ √ √ √
Charging cycles 3,500 3,500 10,000+
Maximum charging rate (C-rate compared to LFP)
1x 1x 5x
Specific energy (Wh/kg) 85-120 150-230 50-80
Typical capacity (kWh) per pack 180 350 60-150
Cost (€/kWh) 380-440 380-440 900-1,100
Comments Lower specific energy (higher weight for given range) and slower charging than NMCNo cobalt content
Good compromise between range and charging rate
Ideal for opportunity charging strategy, with shorter range and fast charging points80 per cent capacity in five minutesGood cold temperature performance
Source: TransConsult Asia analysis for the EBRD.
The battery technology solution is closely integrated in the charging strategy and these must be considered together. For managing the electric vehicle charging technology, a single-objective optimisation is used to determine the optimal size of the charging technology both on-board and off-board and to determine a suitable battery capacity.15
NMC and LFP are the current market leaders. OEMs and specialist financiers may take on battery risk via long-term warranties or rental contracts.
Battery configuration is a key technology choice and is closely connected to the question of bus charging strategy. Table 9 sets out the battery types most commonly in use. The life of a battery can be measured in two ways:• the number of years that a battery can operate• the number of recharge cycles that a
battery can perform.
A battery is typically considered to have reached the end of its life when it has less than 80 per cent of its initial capacity. Many battery warranties now define end-of-life to be reached when the battery’s capacity falls to between 60-80 per cent of its original capacity.
The market offer of batteries is differentiated mainly according to the following parameters: • service life (charging cycles or service years)• maximum charging power (C-rate)
• specific energy (Wh/kg)• energy density (Wh/l)• safety (overheating issues)• cost (€/kWh).
Currently, the market relies on two main battery technologies: LFP and NMC (the Chinese market is dominated by LFP). Lithium iron phosphate (LFP) is safe and has a high life cycle, but it has a low volumetric energy density (Wh/l). NCA (lithium nickel cobalt aluminium oxide) has a higher energy density, requiring less space on the bus for a given pack size (kWh), despite its shorter life cycle.
The “second life” of a battery must be considered:• clean and safe disposal is essential• batteries may be recycled by the battery supplier• sold for use in a commercial battery array• used within the bus or grid system for renewable
energy storage• purchase price – given the falling cost of heavy
duty batteries• level of warranties.
New options are emerging for managing these risks: 1) long-term battery supply contracts on a “cost permonth per mile” basis, where the supply company takesthe risk on battery life and replacement cost (sometimescalled battery-as-a-service), and 2) long-term warrantieson batteries from OEM on a 5-15-year basis.
15 See Brenna et al (2020).

Going electric | A pathway to zero-emission buses | Policy paper June 2021 23
(High) power
High power/current for fast charging is not optimal for batteries, both when charging or discharging the battery. Special batteries are now being developed, which are optimised for high power charging, but charging rates must be respected.
Depth of discharge (DOD)
A full cycle is either going from empty to full to empty or from full to empty to full. Both options are considered full cycles. These different charging cycles have different impacts on the aging of the battery. A tendency is that the lower the cycle height, the better it is for the battery. This means that as a guiding principle it is better to charge from around 30 per cent to 70 per cent instead of from 0 per cent to 100 per cent.
The average state of charge (SOC)
Batteries usually do not like to be stalled and operated close to 100 per cent or close to 0 per cent SOC. As a tendency they like to be operated in a dynamic range of 20-80 per cent, or at a 50 per cent state of charge on average, which can be a problem for opportunity charging.
Temperature
The optimal temperature range for a battery is approximately between 15 to 30 degrees Celsius. Very high or very low temperatures can negatively affect battery health.
Source: TIL for the EBRD.
PTOs will need to acquire battery management skills either in-house, or via support contracts with bus or battery suppliers.
6.5. The circular economyE-buses can form part of the circular economy, with busbatteries integrated into renewable grids and used forload balancing and actively recycled after use on buses.
6.4. Managing battery performanceThe table below sets out key factors affecting the lifetime performance, and hence cost, of the batteries.

Going electric | A pathway to zero-emission buses | Policy paper 24 June 2021
Large bus fleets can be integrated into renewable electricity planning• Buses charged at night to store renewable energy generated at low-demand times of day• Bus batteries help balance the grid by charging at times when renewable capacity is high but demand is low• Close integration is needed with grid operators to plan incremental power upgrades• Power tariffs may be pre-planned to incentivise bus charging at times of low general demand (overnight, for instance)• Large bus fleets may require incremental renewable generation capacity
Batteries removed from buses may be repurposed for use in static battery arrays to balance grid capacity• Bus batteries will degrade to the point where their storage characteristics are inefficient for further use on buses• Such batteries may be repurposed for static use within the bus network (to balance charging capacity)
or elsewhere in the grid• Some battery-as-a-service operators are active in both markets, helping to manage RV risks• Grid operators may also be active in this dual market
“Smart charging” uses technology to manage charging power capacity and cost of grid connections and power price• IT manages:
• the charging rate to minimise power cost• the charging rate of each bus, to maximise battery health
• May use battery arrays within the depot to store power until it is needed• Avoids costly power connection upgrades
Commercial battery finance is an emerging asset category• Specialist battery funds are being set up by banks, infrastructure funds and as publicly listed investment vehicles• They aim to address some or all of the following issues:
• smooth the financing of battery and/or power assets from an up-front capital cost to a monthly, per km or per kWh payment
• take some or all of the assets off the bus operators’ balance sheets• use specialist knowledge and scale to manage risks such as: battery maintenance; battery pricing; RV of batteries after
removal from buses; disposal of batteries; re-purposing batteries for “static” use after removal from vehicles• This is a new asset category, but significant capital is being allocated to this market by mainstream funding institutions
and/or electrical power OEMs
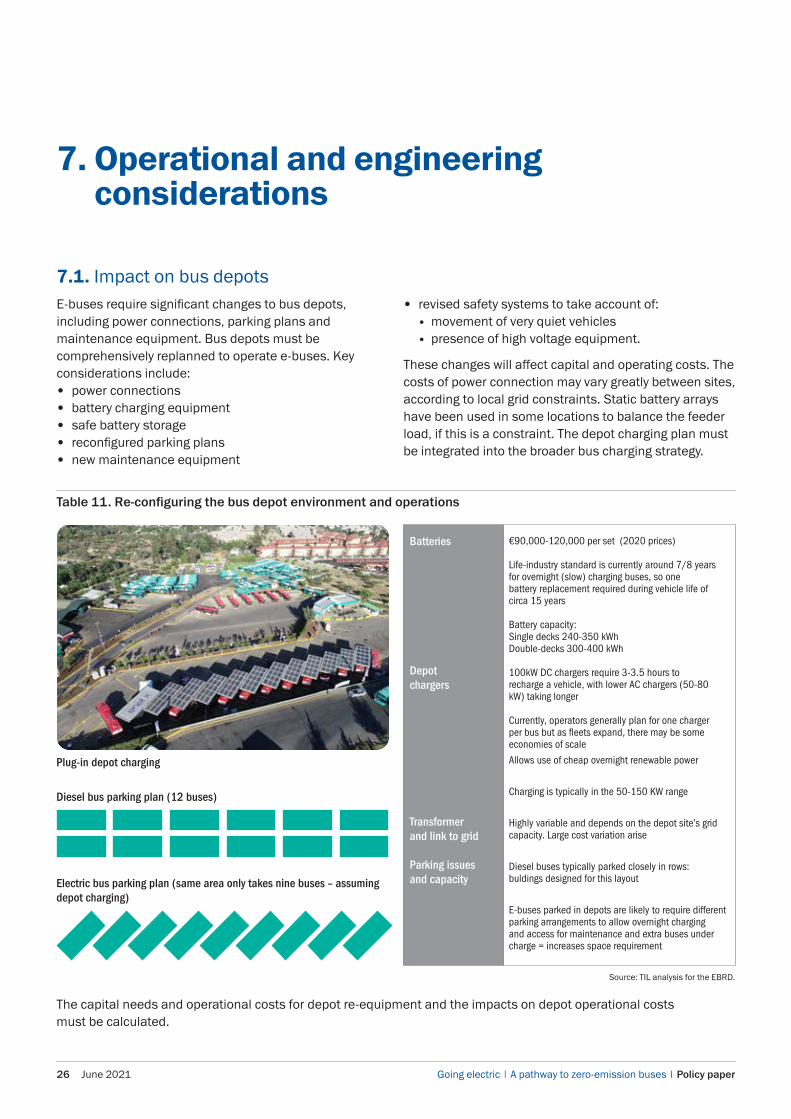
Battery-as-a-service provider
Source: TIL analysis, Bloomberg New Energy, https://assets.bbhub.io/professional/sites/24/2018/05/Electric-Buses-in-Cities-Report-BNEF-C40-Citi.pdf.Note: https://www.sustainable-bus.com/parts/volvo-buses-and-second-life-batteries-a-new-project-in-gothenburg.
Plug-in hybrid, Wallonia

Going electric | A pathway to zero-emission buses | Policy paper June 2021 25
6.6. Planning and contractsPower connections, power supply, electricity pricing and battery economics must be planned and contractualised, as far as possible. Power connections, power price and power consumption rates are substantial parts of the TCO and substantial risks. These issues should be explored
at the scoping stage, with early involvement from the grid utilities and potential equipment suppliers. Contracts that appropriately allocate risks should be developed and project management support may be needed from utilities and/or OEMs to install the equipment.
Table 10. Considerations for grid connection and battery supply
Issue Commentary
Grid connection to charging points
Incremental power needs must be planned and organised with the relevant utility
Incremental renewable generation may be needed
Battery arrays can be planned into the supply to balance demand
“Smart charging” can be used to optimise power consumption and battery life
Battery lifeBattery-as-a-service option
“Power by the hour”
Outright purchase
Purchase with warranty on battery life and/or battery maintenance costs
Specialist companies are emerging that will manage these risks over time
Power consumption risk OEMs should be asked to specify power consumption estimates and assumptions
PTOs should take power consumption risks
Power pricing Promoters should explore tariff options including lower prices for off-peak charging, for example charging the buses at night and storing power in bus batteries to discharge during the day
Required asset life of charging and other equipment
Bus chargers
Power distribution equipment
Warranty periods should be clearly defined and long warranties are desirable
Procurement process should ask suppliers to price variations in the warranty period
Warranty may be split across bus body shell, batteries and major electrical and mechanical units
Residual value guarantees Suppliers should be asked to give RV guarantees and/or asset buy-back options if the proposed operating period is much less than the designed asset life
The PTA may take RV risk if they choose to own the bus assets and the operating period for the PTO is less than the planned asset life
Specialist companies emerging who will manage battery RV and second life deployment
Source: TIL for the EBRD.
Grid connections, installation costs and power pricing must be pre-planned and pre-negotiated as far as possible to avoid capacity constraints and cost overruns.
Going electric | A pathway to zero-emission buses | Policy paper 26 June 2021
7. Operational and engineeringconsiderations
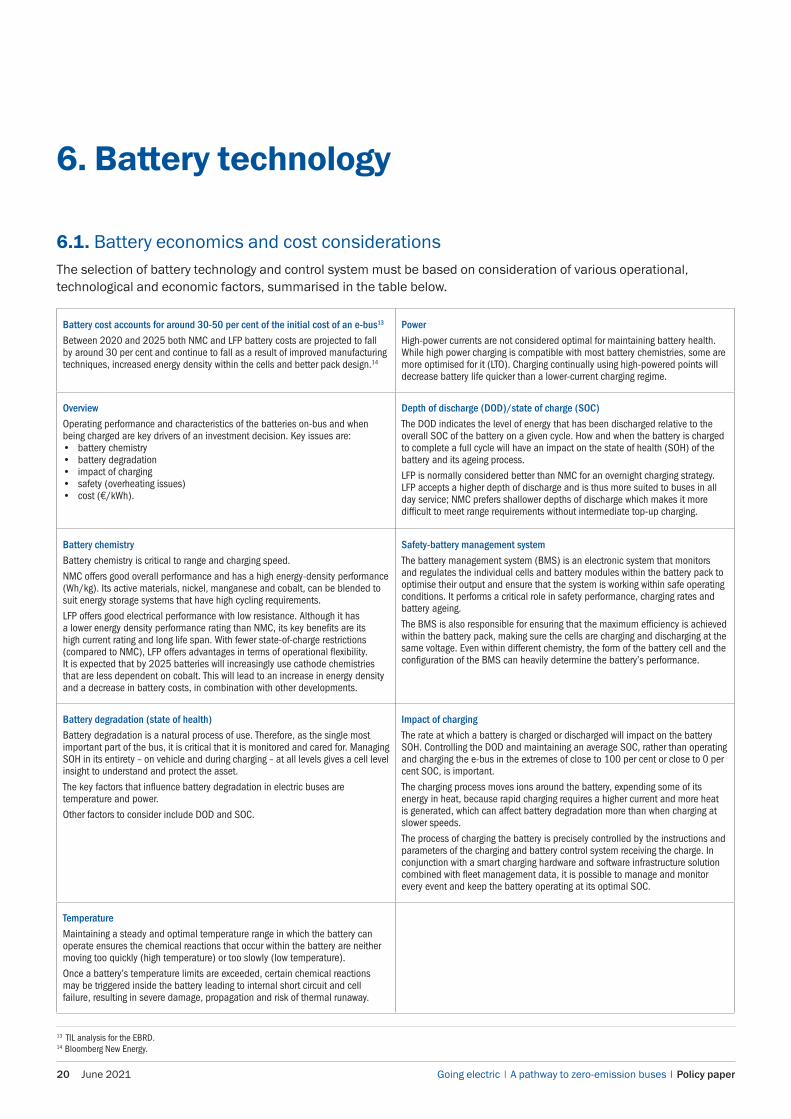
7.1. Impact on bus depots • revised safety systems to take account of:
• movement of very quiet vehicles• presence of high voltage equipment.
These changes will affect capital and operating costs. The costs of power connection may vary greatly between sites, according to local grid constraints. Static battery arrays have been used in some locations to balance the feeder load, if this is a constraint. The depot charging plan must be integrated into the broader bus charging strategy.
E-buses require significant changes to bus depots,including power connections, parking plans andmaintenance equipment. Bus depots must becomprehensively replanned to operate e-buses. Keyconsiderations include:• power connections• battery charging equipment• safe battery storage• reconfigured parking plans• new maintenance equipment
Table 11. Re-configuring the bus depot environment and operations
Batteries
Depot chargers
Transformer and link to grid
Parking issues and capacity
€90,000-120,000 per set (2020 prices)
Life-industry standard is currently around 7/8 yearsfor overnight (slow) charging buses, so one battery replacement required during vehicle life of circa 15 years
Battery capacity:Single decks 240-350 kWhDouble-decks 300-400 kWh
100kW DC chargers require 3-3.5 hours to recharge a vehicle, with lower AC chargers (50-80 kW) taking longer
Currently, operators generally plan for one charger per bus but as fleets expand, there may be some economies of scale
Allows use of cheap overnight renewable power
Charging is typically in the 50-150 KW range
Highly variable and depends on the depot site’s grid capacity. Large cost variation arise
Diesel buses typically parked closely in rows: buldings designed for this layout
E-buses parked in depots are likely to require different parking arrangements to allow overnight charging and access for maintenance and extra buses under charge = increases space requirement
Plug-in depot charging
Diesel bus parking plan (12 buses)
Electric bus parking plan (same area only takes nine buses – assuming depot charging)
Source: TIL analysis for the EBRD.
The capital needs and operational costs for depot re-equipment and the impacts on depot operational costs must be calculated.

Going electric | A pathway to zero-emission buses | Policy paper June 2021 27
7.2. Impact on engineering processesEngineering processes will change and there is likely to be a reduction in overall maintenance costs versus diesels, with the labour hours required reducing and a different skills mix required. Engineering costs represent around 10-12 per cent of typical diesel total costs and are typically split as follows:16
• labour: 50 per cent• parts: 30 per cent• bought in services: 20 per cent (accident repairs,
glass replacement, major overhaul of components,and so on).
Bus operators typically maintain their own buses, with limited use of contractors or OEMs to maintain. The transition to e-buses fundamentally changes engineering activity:• Far less mechanical maintenance is needed.• There are approximately 8x more moving parts in an
internal combustion (IC) bus than an e-bus.• Significant changes will be needed to the skill mix of
maintenance staff, with more electricians needed andfewer “mechanics”.
• Overall, staff numbers are expected to decrease forbus maintenance.
• Electrical work becomes more extensive and specialist,including high voltage power equipment.
• Diesel hybrid and trolleybuses have already givenoperators some experience of maintaining highvoltage systems.
• The power and charging equipment will itself requiremaintenance and this may need to be out-sourced.
• “Fuelling and cleaning” processes in the depotschange to “cleaning and charging” and processesmust be fundamentally re-designed.
• There is an entirely different supply chain formany components.
The asset life of many components is currently unclear – it is “too early to tell”. The maintenance of the charging equipment in most applications has been out-sourced to the supplying OEM, given the specialised nature and lack of in-house electrical skills of most bus operators. For TCO purposes, the authors have assumed a 10 per cent reduction in engineering costs, which they consider to be conservative.
“ Engineering cost assumptions should be updated and there is good reason to assume that a substantial cost reduction of 10-30 per cent may be possible, depending on local assumptions. However, change-management programmes are essential to delivering the potential savings through retraining and headcount reductions.”
16 TIL analysis for the EBRD (UK market reference).
Going electric | A pathway to zero-emission buses | Policy paper 28 June 2021
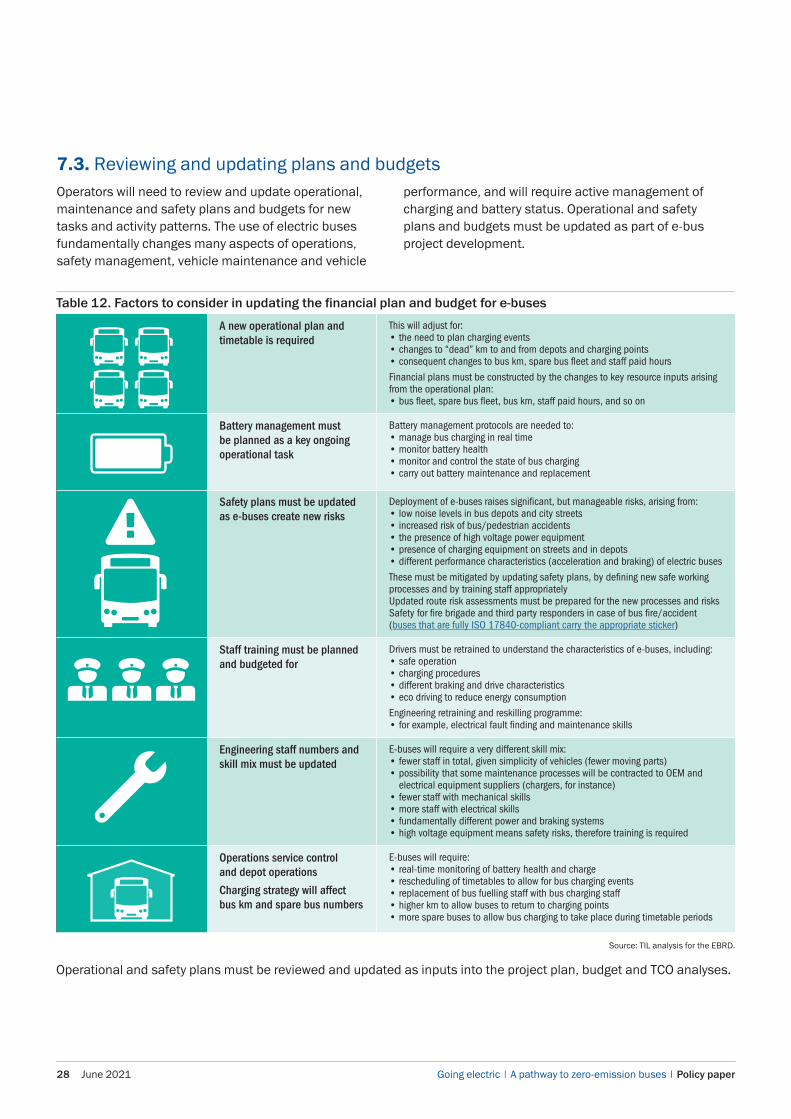
7.3. Reviewing and updating plans and budgetsperformance, and will require active management of charging and battery status. Operational and safety plans and budgets must be updated as part of e-bus project development.
Table 12. Factors to consider in updating the financial plan and budget for e-buses
A new operational plan and timetable is required
This will adjust for:• the need to plan charging events• changes to “dead” km to and from depots and charging points• consequent changes to bus km, spare bus fleet and staff paid hours
Financial plans must be constructed by the changes to key resource inputs arising from the operational plan:• bus fleet, spare bus fleet, bus km, staff paid hours, and so on
Battery management must be planned as a key ongoing operational task
Battery management protocols are needed to:• manage bus charging in real time• monitor battery health• monitor and control the state of bus charging• carry out battery maintenance and replacement
Safety plans must be updated as e-buses create new risks
Deployment of e-buses raises significant, but manageable risks, arising from:• low noise levels in bus depots and city streets• increased risk of bus/pedestrian accidents• the presence of high voltage power equipment• presence of charging equipment on streets and in depots• different performance characteristics (acceleration and braking) of electric buses
These must be mitigated by updating safety plans, by defining new safe working processes and by training staff appropriatelyUpdated route risk assessments must be prepared for the new processes and risksSafety for fire brigade and third party responders in case of bus fire/accident (buses that are fully ISO 17840-compliant carry the appropriate sticker)
Staff training must be planned and budgeted for
Drivers must be retrained to understand the characteristics of e-buses, including:• safe operation• charging procedures• different braking and drive characteristics• eco driving to reduce energy consumption
Engineering retraining and reskilling programme:• for example, electrical fault finding and maintenance skills
Engineering staff numbers and skill mix must be updated
E-buses will require a very different skill mix:• fewer staff in total, given simplicity of vehicles (fewer moving parts)• possibility that some maintenance processes will be contracted to OEM and
electrical equipment suppliers (chargers, for instance)• fewer staff with mechanical skills• more staff with electrical skills• fundamentally different power and braking systems• high voltage equipment means safety risks, therefore training is required
Operations service control and depot operations
Charging strategy will affect bus km and spare bus numbers
E-buses will require:• real-time monitoring of battery health and charge• rescheduling of timetables to allow for bus charging events• replacement of bus fuelling staff with bus charging staff• higher km to allow buses to return to charging points• more spare buses to allow bus charging to take place during timetable periods
Operational and safety plans must be reviewed and updated as inputs into the project plan, budget and TCO analyses.
Source: TIL analysis for the EBRD.
Operators will need to review and update operational, maintenance and safety plans and budgets for new tasks and activity patterns. The use of electric buses fundamentally changes many aspects of operations, safety management, vehicle maintenance and vehicle

Going electric | A pathway to zero-emission buses | Policy paper June 2021 29
8. Getting the governanceand funding framework right
8.1. Reforms, system funding and contractsThe large capital investments and long asset life of e-bus equipment may require a reform of operationalgovernance, system funding and contracts to createa stable and investable structure. E-buses requirehigh levels of upfront capital investment in vehicles,power equipment and an infrastructure with long assetlives. Informal governance structures may deter the
necessary investments, preclude private sector financing, or increase the cost of capital. A thorough review of governance and regulation is therefore a necessary part of e-bus planning. The table below sets out some of the key issues relating to governance and operational contractualisation that should be considered as part of the planning for an e-bus system.
17 GIZ conceptual framework for bus reform.
Figure 6. Moving from an informal network organisation to a contracted framework17
Source: Mettke (2018).
• Highly fragmented, often individualised, industry
• No financial literacy• Not subsidised• No fleet renewal• On-street competition with
small-scale vehicles (for example, minibuses)
• Consolidated industry structure,no individual ownership
• Operational efficiency• Often subsidised • Fleet renewal schemes• Service contracts, fleet consolidation
towards buses
• High operational efficiency and accuracy
• Often subsidised (capital and operational)
• Infrastructure investments• Low-carbon energy supply
Electrified public transport
Focus first
Informal public transport
Focus later
Public transport emissions in developing economies
Majority of countries
and CO2 emissions
Few countries and small
percentage of emissions
Formalised public transport

Going electric | A pathway to zero-emission buses | Policy paper 30 June 2021
Table 13. Factors to consider in defining the organisational framework and financing regime for e-buses
Issue Commentary
Power and charging The deployment of electric buses will require large scale investments in infrastructure for bus charging, power distribution and bus depot reconstruction, as well as new bus fleets. A well-planned, scalable roll out programme, delivered via project management, will be needed and cities should make or act on commitments to transition to e-buses.
Asset life uncertainty Electric buses may have longer economic lives than the diesel buses they replace, as will some power equipment. This life may not be aligned to the operating concession period.
Battery replacement funding Bus batteries will require repeated replacement during the life cycle of the bus and charging assets. (In 2020, battery life was typically 5-8 years and bus life 15+ years.)Given the rapid development of this technology, it is possible that battery life and efficiency will continue to improve significantly in terms of weight, range, life and cost.
Operating transition costs Investment in operating expenditure (opex) will be needed for a smooth transition from diesel, covering staff training, retraining and familiarisation for drivers, bus maintenance teams and other staff.
Governance and funding structure
For all these reasons, it is desirable that any investment in electric buses is undertaken within the context of a strong and contractualised governance structure, with market stakeholders that are capable of delivering policy objectives and ensure the sustainability of the investment.
Strategy
Contractualisation
Funding
This is likely to embrace:• setting defined transport policy and financial objectives for the transport authority• defining operational and contractual obligations of the PTO(s) (which may be a division
of the PTA) and/or private operators• defining the duration of the operating rights, which should be consistent with
the investment proposed in the electric bus fleet and the conversion works that may be funded.
Political framework
Long-term funding
Stable operating regime
The reformed structure is likely to cover topics such as:• exclusive operating rights• regulation of timetables and bus network• vehicles required – number, capacity, emissions standard, average or maximum
age, and so on• asset lives and replacement obligations• subsidies and subventions payable• asset ownership and charging regimes• who holds vehicle and equipment RV and on which balance sheet do they sit.
Contractual models should, therefore, clearly define the responsibilities and roles of each party, allocating risks where handled best and reinforcing cooperation amongst the parties. When possible, early involvement of different parties is strongly recommended.
15 > 20 > 25 years?
15 > 20 > 25 years?
Source: TIL analysis for the EBRD.

Going electric | A pathway to zero-emission buses | Policy paper June 2021 31
8.2. Governance structureThe e-bus governance structure should define clear responsibilities and risk allocation for the e-bus project over the projected asset lives.
City region political level
Passenger transport
authority PTA
Contracted public transport operator
PTO
Maintenance contract
Warranty
On-time performance Parts supply Power supply
Bus maintenance
Driver management
Power equipment
maintenance
Power supply
Power generation
Operations Bus OEM Battery OEM Power utility
Political level• Overall strategy• Democratic consent• Subsidy policy and taxation
Transport policy level — PTA• Network• Strategy• Fares and tariff• Contracts for transport operations with PTOs• May take passenger revenue risk and
some cost risk
Operational level — PTOIn-house operator (PTO) or contracted external operator for day-to-day operations
Technical level and responsabilitiesThe bus operator PTO (or sometimes PTA) will procure buses, batteries, power equipment and electric supply.
Buses are likely to be supplied with long-term warranties and/or pre-negotiated parts supply contracts from bus OEM.
Power will be bought in from the relevant utility operator(s) or generated directly.
Incremental renewable generation capacity may be required.
Battery supply may be via the bus OEM or a separate battery supply and/or supply and maintain contract.
Power equipment is likely to be supplied and maintained by specialist OEMs given highly specialised technology and safety issues.
It is important that there is a “system integrator” that takes care of the different pieces. This may be the OEM, the charger supplier, the PTA, the PTO, and even the energy supplier (for example, Chile).
In-house operator PTO
Taxpayer funding
Passenger fares
Source: TIL analysis for the EBRD.
Figure 7. Typical governance and funding architecture for local bus systems

Going electric | A pathway to zero-emission buses | Policy paper 32 June 2021
In a typical structure, a city PTA:• takes responsibility for strategy and funding• provides both democratic consent and tax funding• is usually also the “planning authority” and responsible
for day-to-day management of highway infrastructure• will need to approve the design and installation of any
on-street infrastructure• may own the PTO or contract with or license one or
more private PTOs for operations.
In some cities the power utility may be owned and/or regulated by the municipal authority.
The PTO is responsible for:• bus operations• bus maintenance• fare collection• system marketing.
Areas for cooperative workingOn-street infrastructure – for example catenary or charging equipment – is likely to be a shared responsibility, with permission to install granted by the city authority,
but installation and maintenance will involve the relevant power utility, as well as the bus operator (PTO). Infrastructure within bus depots is likely to involve the power utility, as well as the depot operator (the PTO) and the planning authority (the city), as well as relevant landowners. Good practice in this area is summarised in the EBRD publication Driving change: reforming urban bus services,18 published in association with UITP and GIZ. Cities should update their governance and contractual arrangements for bus operations before investing in e-buses.
8.3. Operating contractThe e-bus operating contract should reflect the objectives, economics, responsibilities and risks of the e-bus project as finalised after the planning phase.
Given the large capital requirements and high costs of operational transition, the operating contract should be pre-agreed and aligned to the operating and capital risk allocation selected.
18 See https://www.changing-transport.org/wp-content/uploads/EBRD_bus-sector-reforms_Mar2019.pdf
Table 14. Elements needed for the PTO-PTA bus operating contract
Define the capital outputs required
Bus fleetElectrical infrastructureConnection costsChargersOverhead wires (IMCs)
Define the operating outputs Bus operationsElectrical system maintenanceTimetable adherenceMinimum service levelsBus fleet age requirementsConversion programme and deadlinesAsset handover obligations at contract break-points
Align the contract term to capital investment requirements
Should be related to the capital investments demanded and risk allocation selectedContract extension and termination mechanisms should be defined at the startThese may be linked to delivery of milestones and service delivery targetsRV risk allocation – if the PTA takes on more RV risk, and/or owns more assets, the operating contract may be shorter
Allocate risks clearly Passenger revenue Operating performance Maintenance cost Power – unit price Power consumption Labour cost – wage ratesLabour cost – labour hoursMaintenance costRV of e-bus assets
Define the operator remuneration mechanism
Cost indexation regime:• labour costs• power prices• general inflation• taxation adjustmentsRevenue pooling regimesPayment frequency

Going electric | A pathway to zero-emission buses | Policy paper June 2021 33
9. Project development model
9.1. Project development model for typical e-bus schemeSchemes should be developed in a step-by-step process. Each step in Figure 8 relates to a section of this report. After scheme implementation we advocate a post-implementation review process, in which lessons can be learned for subsequent stages of e-bus deployment.
19 See UITP Bus Committee (2019).
Establish public policy objectives• output objectivesfor project
1Consider governance and regulatory framework
2Conduct analysis of technology options
3
Consider sources and uses of funding and determine funding “gap”
6TCO analysis – 1 preliminary
5Identify and manage risk
4
Outline business case• go • no go• refine proposal
7Seek tenders
8Revise TCO
9
Complete funding12
Prepare pre-funding business case• go • no go• refine proposal
11Conduct operational review and project management
10
Implement scheme
13Carry out post- implementation review
14
Source: UITP Bus Fleet Renewal Checklist,19 TIL analysis for the EBRD and GIZ model for bus system funding.
Figure 8. A step-wise model for developing an e-bus project

Going electric | A pathway to zero-emission buses | Policy paper 34 June 2021
10. Risk identification and management
10.1. Risk identification and control strategies out significant risks which the scheme should identify early in the project development. Promoters should consider risk mitigation strategies that are appropriate to local circumstances and which draw on experience from successful schemes elsewhere.
Risk identification and control strategies should be developed at an early stage of project development. The table below sets out some of the risks that will need to be managed in typical e-bus projects. It is not intended to be definitive, nor applicable in every situation but it sets
Table 15. Checklist of typical risks and risk mitigation strategies20
Who could take risk? Risk mitigation strategies
Battery life and battery performance over time
Battery supplier directly or OEM and battery supplier or bus and battery finance fund
• Batteries might be supplied on a “power by hour” contract or long-term contract pre-agreed, with replacement terms and pricing
• Could include maintenance or replacement of batteries• Specialist companies are emerging in some geographies who will finance and manage
conversion and battery risks
Bus maintenance risk OEM or bus operator PTO • OEM – long warranty or full maintenance contract or contracted third party takes maintenance risk
Passenger revenue (“farebox”) risk
PTO or PTA or shared • Revenue risk must be defined at the outset• Clear revenue risk rules are required, for example, variation in fares and timetables
Power equipment maintenance risk
Charging equipment OEM or PTO or power utility
• Equipment should be supplied on a “supply and maintain” arrangement with the OEM• The PTO is unlikely to be well placed to maintain these assets• Utility could maintain some of the equipment
Power consumption risk PTO • Eco driving has a large effect on power consumption and is under operator control• Heating and ventilation is a large variable, depending on local climate conditions and the
intensity and efficiency of equipment• OEM guarantees on power consumption can be sought in supply contract
Power price risk PTO and utility, but PTO should seek protective agreement with power utility to control price volatility
• Operating contract must allocate power price risk appropriately• If the PTA controls the tariff, network and so on, they will most likely have to take the power price
risk through a contract price indexation mechanism linked to a change in electricity pricing
Equipment installation risk OEM and grid operator PTO or PTA • Project management risk installation should be allocated to the OEM and network utility • The PTO could take a project management role• Specialist financiers are emerging who may manage this risk
On-street charging permissions risk
PTA and city planning authorities • Project management risk should be held by the PTA or PTO• Installation should be the responsibility of the OEM and network utility
Bus economic life OEM and bus maintainer • Vehicles should be specified for > 15 year life• The OEM should be asked to price long-term warranties on bus body and major units• E-buses are likely to have a longer life than diesel equivalents
Bus residual value Bus maintainer OEM and/or PTO • Maintenance regime should be in line with OEM guidance• Inspection monitoring regime required• PTA may need to take RV risk if the operating contract period is less than asset life
Battery residual value and second life deployment
Battery or bus OEMSpecialist battery financier
• Bus or battery OEM could contract to guarantee replacement price and terms and move battery into a “second life”
• A new market is emerging of specialist battery financiers who will finance batteries on a per kWh, per km or per month basis and take risks around replacement cost, safe disposal and reuse or recycling
• The city or bus operator must pre-negotiate warranty to allow use of substitute batteries and/or fix terms of battery replacement
Staff labour and operating costs
PTO – volume effectsPTA – general inflation indices
• Primarily the responsibility of the PTO but annual contract price indexation regime should compensate for underlying inflation in labour costs
20 TIL analysis for the EBRD.

Going electric | A pathway to zero-emission buses | Policy paper June 2021 35
11. Total cost of ownership analysis:worked example
11.1. Concept of total cost of ownership
The purpose of a TCO analysis (sometimes called whole-life cost analysis) is to capture all of the operating costs of the service over the asset life. System boundaries may differ from place to place and from country to country and depending on whether externalities are considered. The purpose of the TCO concept is also to have a common defined and shared TCO method (a “common language”) for all stakeholders in the e-bus project.
The time period is usually the economic life of the bus. This is approximately 15 years and depends on national or local accountancy rules.
The asset life of e-buses is uncertain, but there is strong evidence from trolleybus systems that e-buses could
outlast diesel vehicles if ruggedly constructed and well maintained, given their fundamental simplicity and the advantages that arise from eliminating internal combustion engines and consequent vibration.
Running any bus will require both capital investment (capex) and operating costs (opex). In practice, some costs may rise or fall over time, for example, maintenance costs often increase with asset age, while it is probable that battery costs will fall in the near term. In practice, on the network level, the whole logistical operation of an e-bus transition can impact the total number of buses needed. It is therefore necessary to take fleet size into consideration in the overall TCO analysis at “system level”.
Figure 9. Total cost of ownership (TCO) over asset life
First battery cost depreciationSecond battery cost depreciation
Bus capital cost depreciation
Power equipment capital cost depreciation
Cleaning cost
Maintenance cost (parts, labour and contracted services)
Depot costs
Labour cost
Power consumption
Bus life 15 years
Cost
ele
men
ts
Source: TIL.
The schematic below describes the major elements of TCO, across the asset life. We assume that battery costs will fall over time and that capital costs are amortised across the life of each asset.
Expectation that battery costs will fall in medium term

Going electric | A pathway to zero-emission buses | Policy paper 36 June 2021
Capital investments will include factors such as (shown red in Figure 9):• bus body and chassis• batteries• power and charging equipment• cost for depot transformation to zero-emission bus
(ZEB) depot format and extra space costs.
The cash flows will be lumpy, but the capital costs would normally be depreciated over the relevant asset lives. In the medium term, it is probable that the battery cost will fall over time, driven by technological change.
Operating costs include such factors as (shown green in Figure 9):• driver wages• maintenance costs (labour, parts and
contract engineering)• other employment costs – social security, staff
pensions, operations staff, management, and so on• power consumption (e-buses) and fuel (diesel and gas
buses), net of tax• taxes on fuel and power• cleaning costs• depot rental, and so on.
The sum of these costs over the asset life equals the TCO. The TCO is highly sensitive to local factors and
conditions, including:• local fuel and power taxes• capital grants and subsidies• factors which affect power and fuel consumption
(hilliness, heating, ventilation)• local labour rates.
11.2. A preliminary TCO estimate A preliminary TCO estimate should be undertaken to explore the trade-offs that impact e-bus outcomes in each city. Each city must assess the scope for e-buses given its own situation via a preliminary TCO calculation. Critical factors are shown in Figure 10.
Not all cities will have high scores on every criterion. Planning should take into account the factors that can be improved and the opportunity to optimise, including contractual reform of the bus market and achievable increases in renewable capacity. The level and nature of fuel taxes is often a critical factor in TCO.
Some cities may have existing tram and/or trolleybus catenary networks that can be used for in-motion charging of e-buses. The TCO calculation should be updated and refined as the project develops and new information emerges. More details on TCO calculations are shown in section 11.5.
Figure 10. Factors favouring e-bus TCO outcomes
Balance of renewables in energy mix
Low High
Existing tram and/or trolleybus catenary that can be used for e-bus charging
Low or no High
Fuel taxation favours electricity
No incentive High incentive
Bus funding regime is adequate
Low High
Contractual reform of bus system
Informal market Contractualised market
TCO parity achieved
Diesel has lower TCO Electric has lower TCO
Climate and typography suitability
Low High
Source: TIL analysis for the EBRD.
Individual city situation for “typical” city
Arrow indicates a city’s position within the rangeThe further to the right, the more suited to e-buses
The weighting between the factors will vary by city, topography and taxation effects, and so on.

Going electric | A pathway to zero-emission buses | Policy paper June 2021 37
11.3. Strategic evaluationPromoters should construct an outline business case for their projects which can be refined as the projects progress.
Figure 11. Strategic evaluation
Tax regime
Operating subsidy needs
Charging strategy
Renewable sources
Replacement plan
Disposal plan
Staff training and skills
Equipment testing
Battery and power management
Project management
Bus operating contract in place
Bus and equipment procurement
process in place
Capital assets
Operating costs
Buses
Power equipment
Batteries
Depot works
Multi-year plan
Sources and uses of funds available
Define “funding gaps”
Operating costs
Battery and power strategy
Climate change
Local air pollution
Decongestion
Public policy
Define scheme objectives
Finances and funding of capital
and operations
Capital needs
Implementation plan
Transition plan
Operating contract
Funding regime
Inter-operability
Organisational framework and
capacity-building
Source: TIL analysis for the EBRD.

Going electric | A pathway to zero-emission buses | Policy paper 38 June 2021
The outline business case should bring together the preceding analyses to consider whether:• the project adequately meets the scheme objectives• a realistic pathway to funding is possible• e-bus is the appropriate technology solution for
local conditions• an acceptable TCO can be achieved• risks have been identified and adequately mitigated.
Most promoters will wish to refine their proposal through a process of iteration, before proceeding to the next
stage. In some cases, it will be clear that an e-bus is not a viable solution and an alternative technology may be more appropriate. Section 11.4 sets out typical considerations at this stage.
11.4. TCO analysis: UK exampleE-buses are approaching TCO parity with diesel, even withconservative cost assumptions.
Figure 12. Comparison of TCO between Euro VI diesel and e-bus (UK assumptions)21
21 TIL analysis for the EBRD using 2020 anonymised UK data for a city bus network.
Electric power costs are likely to be lower than diesel costs and must be adjusted for fuel taxes and electric vehicle incentives.
Consumption rates will be heavily affected by local topography and heating/cooling requirements.
Maintenance costs for e-buses can be 5-30 per cent lower, depending on local assumptions.
E-bus capital costs are higher for e-buses,because of the higher unit costs of the busesand equipment. These costs reduce if assetlives can be extended.
Labour costs remain the dominant cost element.
These costs are affected by the potential impact of charging time on driver labour costs.
However, they may benefit from reductions in engineering labour hours.
Control systems Opportunity charging Depot charging Property cost Insurance cost Other costs
Source: TIL analysis for the EBRD.
100%
90%
80%
70%
60%
50%
40%
30%
20%
10%
0%Diesel BEB
66%
9%
11%
8%
2%2%2%
65%
11%
10%
4%3%2%2%2%1%
Fuel or power Battery Maintenance cost Capital cost Staff

Going electric | A pathway to zero-emission buses | Policy paper June 2021 39
11.5. TCO analysis – bus specification and cost assumptions
Table 16. Detailed TCO assumptions: TIL UK worked example (urban area)
Diesel BEB
Emission standard EURO X Euro VI n/a
Fleet size buses 110 113
Driven km per year km 7,646,589 7,646,669
Km per bus per year km 69,200 67,970
Staff costs (excl. engineering) € 12,157,216 12,303,390
Length metres 12 12
Seats + standing X + Y 85 85
Weight kg 10,500 12,500
Fuel cost cost per litre 1.2208 0
Electric cost €/kWh 0 11c per kWh depot-charged
Expected life years 15 15
Capital cost bus € 212,800 369,600
Depreciation period years 15 15
Capital cost battery and replacement battery € - 112,000
Depreciation period years 15 15
Total capital cost bus € 212,800 481,600
Peak vehicle requirement (PVR) buses 100 100
Spare buses buses 10 13
Insurance per bus per year 3,000 3,000
Depot charging points number 0 84
Depot charging points cost per unit - 28,000
Depot fixed electrics/grid number 0 84
Depot fixed electrics/grid cost per unit 0 11,200
Depreciation period years 0 15
“Opportunity charging” points number 0 2
“Opportunity charging” points, connection, and so on cost per unit 0 448,000
Depreciation period years 0 15
Refuelling/recharging time minutes 10 210
Range between refuel/recharge km 1,149 250
Parking space per bus m2 34.8 40
Annual property cost per year € 279,816 287,257
Maintenance cost per year [bus fleet] € 2,051,680 1,879,933
Maintenance cost per year [charging, and so on] € - 20,918
Buses per maintenance staff heads 8 8
Drivers per bus heads 2 2
Propulsion Diesel Battery electric
Total cost of ownership (TCO)
Total operating cost per year € 18,345,557 18,936,667
Source: TIL analysis for the EBRD. Note: Worked example that should be updated with applicable local data. Table 16 sets out the assumptions used in the worked example. They are
based on UK urban practice, in GBP. UK tax and e-bus incentives are shown for illustrative purposes only. The exchange rate used in this example is 1 GBP = €1.12 (30 March 2020). Each city should carefully consider the factors and assumptions for their own network and situation.
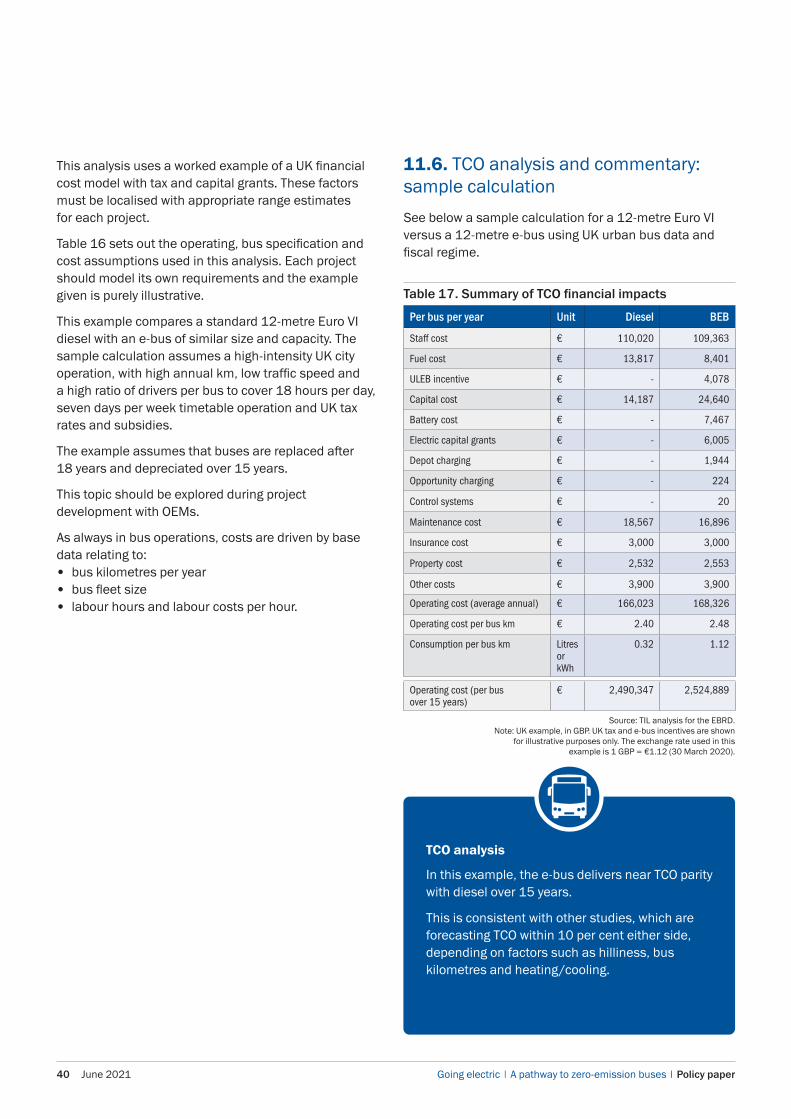
Going electric | A pathway to zero-emission buses | Policy paper 40 June 2021
This analysis uses a worked example of a UK financial cost model with tax and capital grants. These factors must be localised with appropriate range estimates for each project.
Table 16 sets out the operating, bus specification and cost assumptions used in this analysis. Each project should model its own requirements and the example given is purely illustrative.
This example compares a standard 12-metre Euro VI diesel with an e-bus of similar size and capacity. The sample calculation assumes a high-intensity UK city operation, with high annual km, low traffic speed and a high ratio of drivers per bus to cover 18 hours per day, seven days per week timetable operation and UK tax rates and subsidies.
The example assumes that buses are replaced after 18 years and depreciated over 15 years.
This topic should be explored during project development with OEMs.
As always in bus operations, costs are driven by base data relating to:• bus kilometres per year• bus fleet size• labour hours and labour costs per hour.
11.6. TCO analysis and commentary: sample calculation
See below a sample calculation for a 12-metre Euro VI versus a 12-metre e-bus using UK urban bus data and fiscal regime.
Table 17. Summary of TCO financial impacts
Per bus per year Unit Diesel BEB
Staff cost € 110,020 109,363
Fuel cost € 13,817 8,401
ULEB incentive € - 4,078
Capital cost € 14,187 24,640
Battery cost € - 7,467
Electric capital grants € - 6,005
Depot charging € - 1,944
Opportunity charging € - 224
Control systems € - 20
Maintenance cost € 18,567 16,896
Insurance cost € 3,000 3,000
Property cost € 2,532 2,553
Other costs € 3,900 3,900
Operating cost (average annual) € 166,023 168,326
Operating cost per bus km € 2.40 2.48
Consumption per bus km Litres or kWh
0.32 1.12
Operating cost (per bus over 15 years)
€ 2,490,347 2,524,889
Source: TIL analysis for the EBRD. Note: UK example, in GBP. UK tax and e-bus incentives are shown
for illustrative purposes only. The exchange rate used in this example is 1 GBP = €1.12 (30 March 2020).
TCO analysis
In this example, the e-bus delivers near TCO parity with diesel over 15 years.
This is consistent with other studies, which are forecasting TCO within 10 per cent either side, depending on factors such as hilliness, bus kilometres and heating/cooling.

Going electric | A pathway to zero-emission buses | Policy paper June 2021 41
Table 17. Summary of TCO financial impacts
Per bus per year Unit Diesel BEB
Staff cost € 110,020 109,363
Fuel cost € 13,817 8,401
ULEB incentive € - 4,078
Capital cost € 14,187 24,640
Battery cost € - 7,467
Electric capital grants € - 6,005
Depot charging € - 1,944
Opportunity charging € - 224
Control systems € - 20
Maintenance cost € 18,567 16,896
Insurance cost € 3,000 3,000
Property cost € 2,532 2,553
Other costs € 3,900 3,900
Operating cost (average annual) € 166,023 168,326
Operating cost per bus km € 2.40 2.48
Consumption per bus km Litres or kWh
0.32 1.12
Operating cost (per bus over 15 years)
€ 2,490,347 2,524,889
Table 17 shows the authors’ estimate of TCO for a Euro VI diesel 12-metre bus versus an equivalent e-bus for a city operator. The data are based on anonymised, real-world numbers for operational and cost data and were prepared in March 2020. This analysis assumes a 15-year depreciation period for both vehicle types. Asset life is considered to be a key variable in this example. Note that there is no real-world experience of e-buses running for more than 20 years. However, based on experience with trolleybuses and many diesels, a 20-year bus life should be achievable but would require some increase in initial capital cost to extend body life, and a mid-life “refresh” at 6 and 14 years to improve body appearance and amenity.
Battery replacement is assumed to take place every eight years. Body corrosion is often a determinant of bus life. A 20-year bus life is likely to require alloy-based bus bodies,which are already widely used in the UK and by some EUbus builders. OEMs would typically provide warranties ondiesel buses of up to five years, but some longer dealshave been signed. PTOs should seek longer warrantiesfor e-buses, but it is not clear how these would be pricedby the market. The authors have assumed limited changeto engineering costs; much greater savings may beavailable depending on:• the life and unit price of replacement components• the ability to re-think maintenance processes
to remove labour• the possibility of pushing out vehicle inspections, as
confidence builds in the reliability of the technology(a large part of the UK labour need relates to routine –generally monthly in the UK – bus inspections).
The market value of the bus is assumed to be “scrap” – around 2k per bus – at 15 or 20 years. This example assumes no capital subsidies for the e-bus and net power costs benefit from the UK subsidy of six pence per bus kilometre. Cities should prepare their own analyses, using their own network, climatic and topographic conditions, as well as local estimates for utility connection costs and power prices.
11.7. Analysis of power consumption versus fuel consumption: example
Analysis of power consumption versus fuel consumption should be adjusted to reflect prevailing local tax regimes and e-bus incentives, if any. Power and fuel consumption rates are affected by:• topography – the hilliness of bus routes• timetable characteristics = speed, acceleration,
passenger load, and so on
• temperature – cities requiring air conditioning orintensive winter heating will require 20-40 per centmore power on a like-for-like basis depending onheating and cooling needs
• driver behaviour – “eco driving”, in other words,smoother acceleration and braking, can reducepower consumption by 5-10 per cent.
Using sample UK data, the authors have estimated the likely fuel cost savings of converting from a diesel to electric fleet. Conversion from diesel to electric will potentially deliver significant fuel cost savings. The current cost of diesel fuel is around €15,000-€17,000 per bus each year (after deducting UK fuel duty rebate, called BSOG).22
Many countries have similar tax incentives, so calculations must be adjusted to reflect the net cost of diesel fuel after tax. This is expected to reduce to €4,000 to €5,000 per bus per year after transition from diesel to electric power under UK conditions, therefore more than halving the annual fuel cost of a vehicle. There will also be capital and operational savings from no longer having to provide fuel storage tanks and filling equipment.
22 TIL analysis for the EBRD using 2020 UK operational data and tax rates for city bus operation.
Table 18. Sample calculation for a 12-metre Euro VI versus a 12-metre e-bus (annual average)
Energy consumption potential savings Single deck
Litres per 100 km 32.5
kWh per km 1.2
Average km per year 69,200
£ per litre (diesel) 1.09
BSOG refund (UK fuel tax rebate) 0.38
£ per kWh 0.1
Diesel energy costs
Litres per year 22,470
Cost per year (£) 15,948
E-bus energy costs
kWh per year 83,040
Cost per year (£) 8,304
Zero-emission incentive @ 6p/km -4,152
Total savings
Per year per bus (£) 11,796
15 years per bus (£) 176,935
Source: TIL analysis of UK urban bus operator economics, including fiscal regime.Note: Example based on data from UK operator.

Going electric | A pathway to zero-emission buses | Policy paper 42 June 2021
12. Procurement and financing
4. Special consideration should be given to the financingand management of batteries, which are likely torequire replacement during the life of the bus assets.
5. Disposal, and reuse, of bus batteries must beconsidered and budgeted for.
12.2. Sources and use-of-funds analysisFinancing of vehicles, batteries and other assets should be scoped by an outline multi-year “sources and uses of funds” analysis which should be refined as the project develops.
12.1. Principles of scheme financing and asset procurementWhen constructing projects, promoters should consider the following guiding principles:1. There should be a clear plan for the sources and uses
of funds needed to fund the capital and operationsthroughout the asset life.
2. Promoters should seek to align warranties to the life of theassets, which may be longer than traditional diesel buses.
3. Procurement strategies should also take account ofongoing costs, such as:• supply and pricing of high volume components• supply and pricing of “major units” which require
infrequent replacement• support services such as staff training and
outsourced engineering (overhaul and reuse ofcomponents, for instance).
Local taxes
National grants
Development bank finance
Power utility
Commercial loans
Farebox revenue
Local taxes
National grants
Local taxes
National grants
Upfront capital costs
Operating deficits and maintenance
Replacement capital costs
Source: TIL analysis for the EBRD.
Ove
rall
proj
ect c
ost
Figure 13. Sources and use-of-funds analysis
Capital items
Ongoing operating subsidies

Going electric | A pathway to zero-emission buses | Policy paper June 2021 43
Once an outline scheme budget has been established and a preliminary TCO developed, scheme promoters should undertake a “sources and uses of funds” review.
The purpose is to describe the project costs over time and the realistic funding sources that are available throughout the asset life. Electric bus systems require a variety of capital items to be funded. These will include some or all of the following:• bus fleet• batteries• charging equipment and grid connections• incremental generation capacity.
The capital needs must be budgeted and a sources and uses of funds analysis drafted, setting out the various categories of expenditure over the project life and the potential sources of funds available. These are likely to include some or all of:• user fares• local taxation• national government capital grants• bank loans• commercial leases• battery supply contracts – paid per kWh or per month• fiscal incentives for low-emission vehicles• utility investments.
The sources and uses of funds analysis should include an allowance for ongoing and future expenditure:• start-up and transition costs (non-capital) such as
training and staff changes• operating deficits estimated to be incurred:
• loss-making routes• peak hour capacity• excess of costs over passenger fares.
• periodic refurbishment of buses and other equipment• periodic replacement of batteries• ongoing fuel or power price and/or tax incentives,
which may be paid out by the public sector over time inthe form of subsidies or tax rebates.
In Figure 13, the green boxes indicate assets or operations that need to be financed, including the replacement of assets (such as batteries) and day-to-day operating costs (including staff wages and power). The grey boxes indicate typical funding sources, including farebox revenue from passengers, local taxes, national grants (subsidies paid by national government to local government) and commercial loans. The red box indicates the normal role of development bank finance, which is to fill a funding gap.
The sources and uses of funds review should consider the whole asset life, and therefore issues such as asset maintenance, battery replacement and long-term funding agreements for day-to-day operation, which would be secured and agreed via a formalised operating contract between the PTA and the PTO.
12.3. Using appropriate guidance for e-bus procurement tenders
When seeking tenders for buses, batteries and power equipment, promoters should use appropriate procurement guidance. An e-bus scheme will require the procurement of:• buses• batteries• charging equipment• grid connections• maintenance services• spare parts• power supplies.
This should be managed as a project, using best practice procurement guidelines. The TCO and business cases should be updated, as new information emerges and bids are negotiated, to confirm the continued validity of assumptions made at earlier stages regarding costs, risks and funding.
Given the scale of technological change required, many cities will wish to carry out structured pilot projects to explore the practical issues around technology selection, operations, asset financing and risk allocation. Pilot schemes should be designed to collect objective data and to generate learnings for wide scale roll-out.
Cities may wish to trial a small number of alternative OEM and technology options. Deployment of buses may be on a pilot basis or via “big bang” projects:• by line or depot
• 15-50 buses• for example Batumi, Pristina, Amman.
• entire depots or cities• 50-200 buses• for example Santiago.

Going electric | A pathway to zero-emission buses | Policy paper 44 June 2021
Develop implementation
plan
• Equipment • Team and people • Change management • Training
Figure 14. The UITP fleet renewal checklist
Identify stakeholders and regulatory
framework
Develop TCO and financial plan
Develop solution and test against
objectives and constraints
Develop technical specifications
• Strategy • Objectives • Constraints
• Cost drivers • Funding available • Funding sources
• Financial • Legal
• Buses • Equipment • Support services
Source: UITP checklist, TIL analysis for the EBRD.
The UITP Bus Committee has developed a detailed bus fleet renewal checklist for transport operators. This checklist23 provides best practice guidance on the factors that should be considered when undertaking a fleet procurement process.
Bus system actors (cities, PTA, PTO, others) are encouraged to consult the UITP checklist before embarking on the renewal process/at an early stage of project planning.
The checklist applies to all propulsion types and covers:• system actors, objectives and constraints setting• project planning (local context, risks) and budgeting• specifications and procurement (vehicle, infrastructure)• set up operations and staff (action plan, change
management and monitoring plan).
23 See https://www.uitp.org/publications/bus-fleet-renewal-checklist/
Cities are encouraged to contact UITP directly to access the latest available information: [email protected]
A due diligence checklist is also available in Annex 2, which shows the data needs and analysis framework for electric bus investments by the EBRD for development bank finance. The checklist presents (1) data needs and diagnosis and (2) assessment of e-bus solutions for funding.

Going electric | A pathway to zero-emission buses | Policy paper June 2021 45
12.4. Tendering strategies to procure e-bus fleetsAll models require long-term warranties, detailed output specifications and alignment between main contracts.
Most common procurement modelas bus and battery
technology are highly inter-connected
Figure 15. Tendering strategies
Multiple contracts Split contracts Turnkey integrated contract
Turnkey asset contract Fleet leasing and outsourced operations
PTA – strategic level PTA – strategic level PTA – strategic level PTA – strategic level
PTO may be in-house or external contract
PTO may be in-house or external contract
PTO may be in-house or external contract
PTO may be in-house or external contract
Buses, batteries and equipment procured by separate but coordinated contracts
Buses, batteries and equipment procured by separate but coordinated contracts
Master contract awarded for all system assets
Achieves most risk transfer for operational and equipment but at a price
Master contract awarded for all system assets, with PTA controlling assets and separate outsourced PTO
Achieves large degree of risk transfer on equipment element
Most traditional and commonly used, but achieves limited risk transfer
PTA
PTO
Bus supply contract
Power equipment supply contract
Battery supply contract
PTA
PTO
Bus supply contract
Power equipment
supply contract
Battery supply contract
PTA
PTO
Bus supply contract
Power equipment supply contract
Battery supply contract
Master contract “turnkey”
PTA
PTO –operations
contract
Bus supply contract
Power equipment supply contract
Battery supply contract
Master contract “turnkey”
Source: TIL analysis for the EBRD.
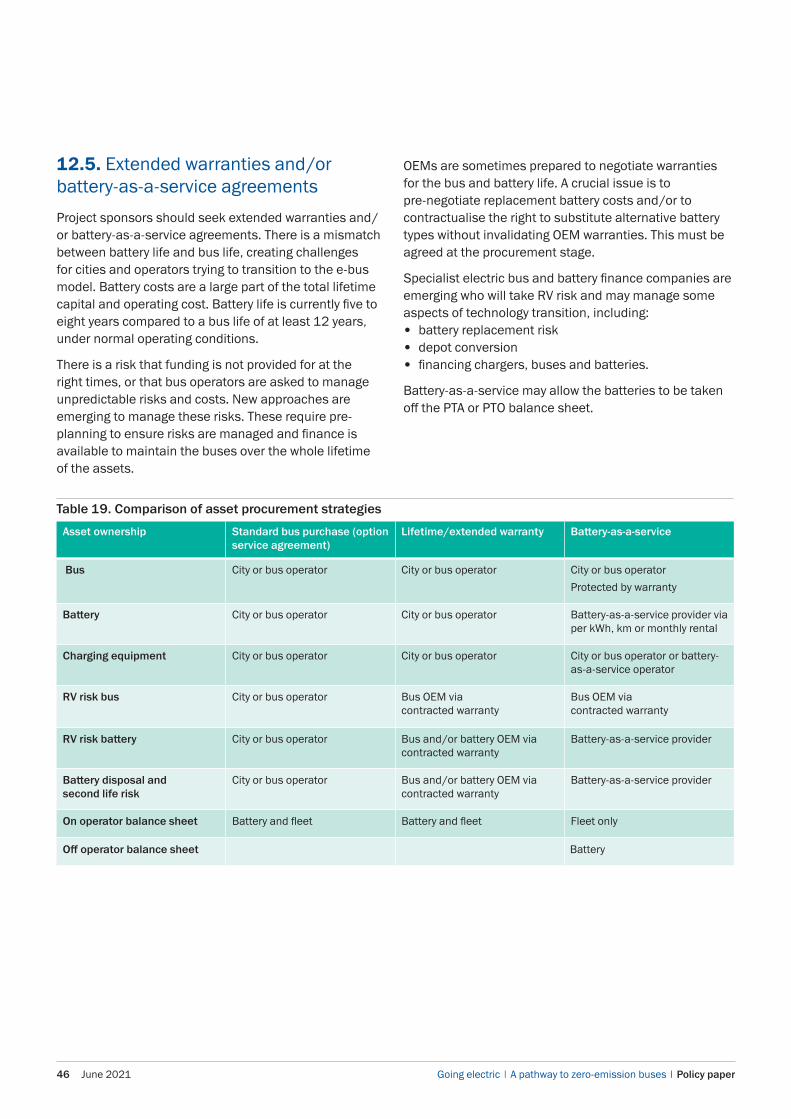
Going electric | A pathway to zero-emission buses | Policy paper 46 June 2021
12.5. Extended warranties and/or battery-as-a-service agreements
Project sponsors should seek extended warranties and/or battery-as-a-service agreements. There is a mismatch between battery life and bus life, creating challenges for cities and operators trying to transition to the e-bus model. Battery costs are a large part of the total lifetime capital and operating cost. Battery life is currently five to eight years compared to a bus life of at least 12 years, under normal operating conditions.
There is a risk that funding is not provided for at the right times, or that bus operators are asked to manage unpredictable risks and costs. New approaches are emerging to manage these risks. These require pre-planning to ensure risks are managed and finance is available to maintain the buses over the whole lifetime of the assets.
OEMs are sometimes prepared to negotiate warranties for the bus and battery life. A crucial issue is to pre-negotiate replacement battery costs and/or to contractualise the right to substitute alternative battery types without invalidating OEM warranties. This must be agreed at the procurement stage.
Specialist electric bus and battery finance companies are emerging who will take RV risk and may manage some aspects of technology transition, including:• battery replacement risk• depot conversion• financing chargers, buses and batteries.
Battery-as-a-service may allow the batteries to be taken off the PTA or PTO balance sheet.
Table 19. Comparison of asset procurement strategies
Asset ownership Standard bus purchase (option service agreement)
Lifetime/extended warranty Battery-as-a-service
Bus City or bus operator City or bus operator City or bus operatorProtected by warranty
Battery City or bus operator City or bus operator Battery-as-a-service provider via per kWh, km or monthly rental
Charging equipment City or bus operator City or bus operator City or bus operator or battery-as-a-service operator
RV risk bus City or bus operator Bus OEM via contracted warranty
Bus OEM via contracted warranty
RV risk battery City or bus operator Bus and/or battery OEM via contracted warranty
Battery-as-a-service provider
Battery disposal and second life risk
City or bus operator Bus and/or battery OEM via contracted warranty
Battery-as-a-service provider
On operator balance sheet Battery and fleet Battery and fleet Fleet only
Off operator balance sheet Battery

Going electric | A pathway to zero-emission buses | Policy paper June 2021 47
13. Lifetime funding models
13.1. Key negotiating points for asset funding modelsAll of the models described in section 13 require clarity on certain key elements, which are listed below.
Table 20. Factors to consider when negotiating bus and battery procurement contracts
Negotiating point Dimensions Commentary
Capital cost of bus Currency unit
Capital cost of battery pack Currency unit Initial battery pack
Capital cost of replacement battery packs Currency unit
Warranty period Years and scope Often defined for elements:• body structure• power train• batteries• and so on
Asset life Years Ask for “price versus years” trade offRelates to warranty period offered
Battery support package Capital costAlternative funding options
Price guarantees for key parts Currency unitSpecified partsSpecified periods
OEM is asked to “bid” future prices for both high-volume parts and high-cost parts over time
Buy-back or RV guarantees RV at a certain point in time OEM is asked to offer a buy-back guarantee and conditions for fixed points in timeThese may be linked to operating contract break points
Financing cost Interest rate Fixed or variable
Loan to value Percentage May vary across asset types
13.2. Emerging procurement models This section looks at five emerging models that attempt to overcome the battery-bus life mismatch for asset lifetime management at the operator level. The mismatch between battery life and bus life creates multiple challenges for cities and operators trying to transition to an e-bus model, as it adds additional risks and responsibilities to the traditional bus fleet operations:
• Under normal operating conditions, the life of the batterypack in a bus is currently 5-8 years24 compared to a buslife of at least 12 years, and perhaps over 20 years. Thusthe operator faces high battery replacement costs yearsafter the initial investment. These are a large part of thetotal lifetime capital and operating cost, up to 30-50 percent of the total lifecycle costs.
• The RV of the batteries needs to be managed andpre-planned, but often it gets lost as disposal is theeasiest and preferred solution. The batteries may bereused in static applications, but in all cases must besafely disposed of.
• The existing financing model for e-bus fleets does nottake into consideration the costs related to batterymanagement (such as battery repairs, changes andreplacement). This leads to the risk of funding shortfallwhen needed during operation, that funding is notprovided for at the right times, or that bus operators retainexcessive levels of unpredictable risks and costs yearsafter the introduction and operation of electric buses.
24 The battery life of a bus is currently much shorter than the battery life of the latest household electric vehicles (which is longer than the vehicle life itself) due to the much longer average annual travel distance. On average, buses are run for 40,000 to 65,000 km a year, equivalent to two to three times the average distance an average car is driven. Moreover, unlike most passenger cars, city buses run for the entire day, further deteriorating the batteries.

Going electric | A pathway to zero-emission buses | Policy paper 48 June 2021
• Furthermore, warranty periods are usually muchshorter than the asset life. Very few bus OEMshave been asked to provide long-term or lifetimewarranties. This means that the bus and battery assetsmaintenance costs are hard to estimate throughoutthe operation period and may vary.
New approaches are emerging to overcome these shortfalls. These are the results of proactive negotiation and strategic pre-planning from the bus operator side to ensure fair allocation of responsibilities among the different players involved and sufficient over the whole bus lifecycle.
Depending on each context and market conditions, some elements from each of the introduced models may be present in the final structure achieved after dynamic and iterative negotiation processes with well-known or emerging suppliers and specialised companies:
• Battery-as-a-service agreement with the battery OEMto be negotiated upfront (at the time of bus purchase)within standard e-bus purchase.
• Many OEMs are prepared to provide warrantiescovering both the vehicle and battery, however, asthis is not yet common practice in the e-bus sector(unlike the household passenger electric vehiclessector), it is crucial to pre-negotiate the warranty atprocurement stage.
• Emerging specialist electric bus and battery financecompanies are willing to take RV risk and may managesome aspects of technology transition, including:• financing of chargers, buses and batteries• battery replacement risk• depot conversion• project management• reuse of batteries after removal from buses.
13.3. Risk allocation comparison among the different models
Table 21. Comparison of risk allocation by procurement model
1. Standardpurchase model
2. Lifetime/extended warranty
3. Standard buspurchase andservice agreements
4. Battery-as-a-service 5. Utility-funded
Asset ownership (bus, battery and charging infrastructure)
The city or the bus operator purchases all assets for full ownership and directly invests in the charging infrastructure
The city or the bus operator purchases all assets for full ownership and directly invests in the charging infrastructure
The city or the bus operator purchases all assets for full ownership and directly invests in the charging infrastructure
Bus: the city or the bus operator owns the bus asset
Battery: owned by a specialised company, offered to operator as service through monthly rental or leasing
Charging infrastructure: may be owned by city/operator, or offered by the same specialised company within the battery-as-a-service package
Bus: the city or the bus operator owns the bus asset
Battery and charging infrastructure: initial investment by utility company; ownership is transferred to the city/operator once the investment cost has been fully recovered
Asset performance risks and costs related to repair of assets
Standard warranty on bus and battery for ~2 years, after which the city/operator retains full responsibility for asset performance and any costs related to asset repairs/replacement (including 2-3x battery replacement costs during bus lifecycle)
Longer warranties on pre-agreed major units such as motors, gearboxes, and so on
Extended/lifetime warranty of the bus and battery is negotiated at procurement stage
Additional costs related to the extended warranty may be paid upfront or also through annual payments throughout the operating period
Bus: standard limited warranty for ~2 years, fixed annual fee in exchange for repairs and maintenance under service agreement thereafter
Battery: standard limited warranty for ~2 years, fixed annual fee in exchange for repairs, maintenance and replacement thereafter
Bus: may be covered by (extended) warranty or service agreement from the bus OEM
Battery: risks and costs transferred to the specialised company
Charging infrastructure: may be included in the same battery-as- a-service agreement with consequential risk transfer
Bus: may be covered by (extended) warranty or service agreement from the bus OEM
Battery and charging infrastructure: longer warranty may be negotiated with the supplier. The utility company will remain responsible for these risks during the warranty, then retained by the city/operator after ownership transfer
(Continued on the next page)

Going electric | A pathway to zero-emission buses | Policy paper June 2021 49
1. Standardpurchase model
2. Lifetime/extended warranty
3. Standard buspurchase andservice agreements
4. Battery-as-a-service 5. Utility-funded
Asset interface risk No interface risk present between bus and battery
Interface risk with charging infrastructure is retained by city/operator
A key risk is that software and warranty may lock the operator into a specific OEM for the battery replacement
Warranty agreements for bus and battery may include interface risk management mechanisms
Interface risk between the charging infrastructure and the bus performance is retained by city/operator
Building on the standard financing model for buses, this model assumes that the bus and the battery are both provided by the same supplier/OEM, who retains all interface risks related to both assets
Interface risk with charging infrastructure is retained by city/operator
Battery-as-a-service agreement may include interface risk management mechanisms between bus and battery
When charging infrastructure is also offered within the service agreement, bus-charging infrastructure interface risk management mechanisms may also be negotiated upfront
Warranty agreements for bus and battery may include interface risk management mechanisms
Interface risk between the charging infrastructure and the bus performance is retained by city/operator
Battery disposal and second life
Taken by city/operator
This is both a safety and a cost risk
May be transferred to the bus OEM and/or battery OEM under contracted warranty
Taken by city/operator Transferred to battery-as-a-service provider
Retained by city/operator, unless the utility company manages to negotiate upfront agreement for battery second life
Residual value capture
Limited, especially in countries where the demand for used electric vehicle batteries or spare parts is limited
Under the service agreement, the city/operator may be able to contract resale of the assets back to the bus/battery OEM
Under the service agreement, the city/operator may be able to contract resale of the assets back to the bus/battery OEM
Fully and efficiently captured
Limited, depending on the utility company’s agreement
13.4. Financing model characteristics13.4.1. Standard funding model
Source: EBRD analysis. Note: This overview is an example provided for illustrative purposes only.
The following can be observed from the currently prevalent standard funding model for the introduction of battery electric buses. The costs financed during the initial investment period include:• bus and battery procurement costs (both procured
from same supplier)• investments in the charging infrastructure and power
connections to grid
• standard warranty on bus and battery included in thepurchase agreement is for ~2 years, after which allmaintenance/repair costs are to be financed.
During the operating period, once the standard warranty period expires, the city/operator becomes responsible for all maintenance/repair costs on the e-bus fleet, in addition to the other operating costs. There is
Figure 16. Lifecycle overview: standard e-bus funding
Initial investment Operating period Disposal
Year
0
Year
1
Year
2
Year
3
Yea
r 4
Year
5
Year
6
Year
7
Year
8
Year
9
Year
10
Year
11
Year
12
Year
13
Year
14
Year
15
(Continued from the previous page)

Going electric | A pathway to zero-emission buses | Policy paper 50 June 2021
little visibility on the exact nature and quantity of the extraordinary costs to be incurred:• Given the current state of technology, expenditures for
battery replacement are expected periodically (~everyfive to eight years) for at least two to three times acrossthe useful life of the buses, depending on the status ofuse of each bus/fleet, but the exact timing cannot beestimated ex-ante.
• Since the above costs are not routinely contractedwith designated suppliers, the availability of therequired service and the related costs will depend onthe state of the market (for example, whether thereare specialised repair services for buses available inthe same country; whether the operator is able to findan adequate supplier of new compatible batteriesat acceptable prices, and so on). These factors aredifficult to estimate if not close to the dates.
This may well undermine the ability of certain municipalities or operators to perform multi-year financial and operational planning and constitute an additional obstacle to the introduction of buses in the urban transport system when there is policy willingness and readiness to transition to greener solutions.
At the end of the bus useful life, the city/operator is also responsible for the disposal of the assets. • For pilot projects in particular (introducing the bus
for the first time in the country/region), there maybe no second market for used vehicles or busbatteries. Any RV of the assets will most likely get lostbecause it is the easiest way for the city/operator todismantle the assets.
• Not only would the asset disposal in this case notcapture the RV, it is also costly, causing additionalexpenses to the city/operator’s budget at the sametime it needs to re-invest to renew the e-bus fleet.
Depot charging in the Netherlands
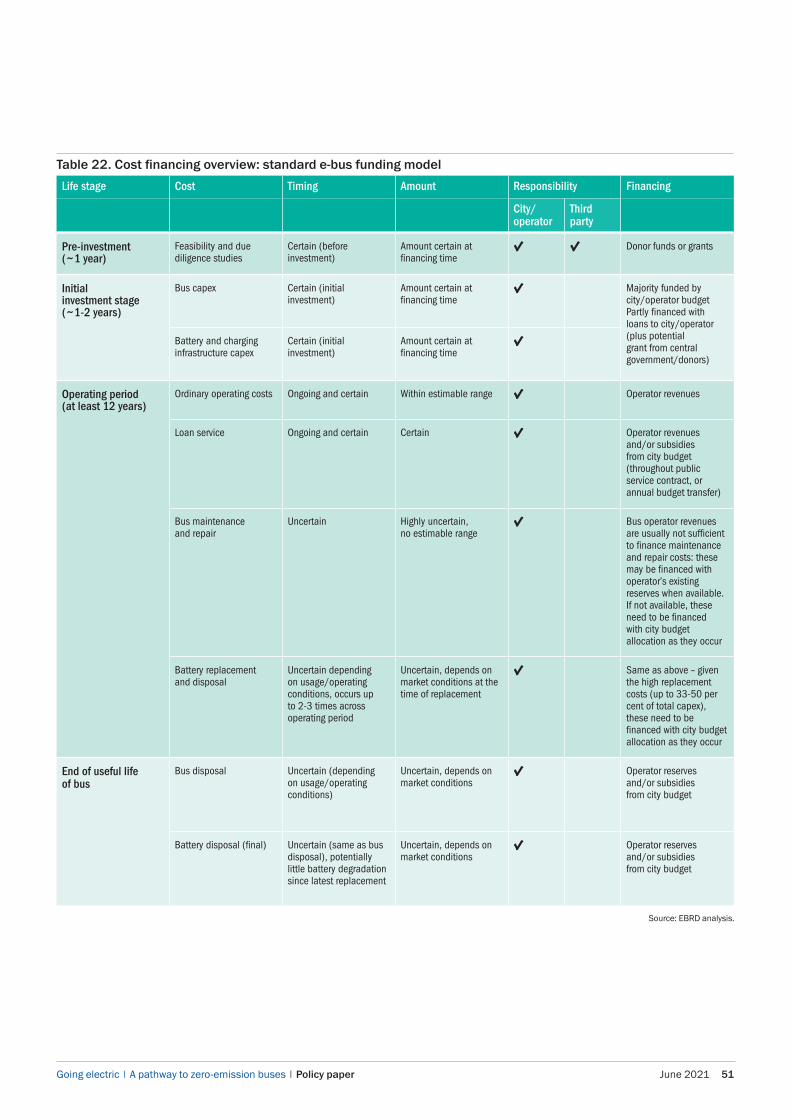
Going electric | A pathway to zero-emission buses | Policy paper June 2021 51
Table 22. Cost financing overview: standard e-bus funding model
Life stage Cost Timing Amount Responsibility Financing
City/ operator
Third party
Pre-investment(~1 year)
Feasibility and due diligence studies
Certain (before investment)
Amount certain at financing time
√ √ Donor funds or grants
Initial investment stage(~1-2 years)
Bus capex Certain (initial investment)
Amount certain at financing time
√ Majority funded by city/operator budgetPartly financed with loans to city/operator (plus potential grant from central government/donors)
Battery and charging infrastructure capex
Certain (initial investment)
Amount certain at financing time
√
Operating period(at least 12 years)
Ordinary operating costs Ongoing and certain Within estimable range √ Operator revenues
Loan service Ongoing and certain Certain √ Operator revenues and/or subsidies from city budget (throughout public service contract, or annual budget transfer)
Bus maintenance and repair
Uncertain Highly uncertain, no estimable range
√ Bus operator revenues are usually not sufficient to finance maintenance and repair costs: these may be financed with operator’s existing reserves when available.If not available, these need to be financed with city budget allocation as they occur
Battery replacement and disposal
Uncertain depending on usage/operating conditions, occurs up to 2-3 times across operating period
Uncertain, depends on market conditions at the time of replacement
√ Same as above – given the high replacement costs (up to 33-50 per cent of total capex), these need to be financed with city budget allocation as they occur
End of useful life of bus
Bus disposal Uncertain (depending on usage/operating conditions)
Uncertain, depends on market conditions
√ Operator reserves and/or subsidies from city budget
Battery disposal (final) Uncertain (same as bus disposal), potentially little battery degradation since latest replacement
Uncertain, depends on market conditions
√ Operator reserves and/or subsidies from city budget
Source: EBRD analysis.

Going electric | A pathway to zero-emission buses | Policy paper 52 June 2021
13.4.2. Standard funding model plus extended warranty
Figure 17. Lifecycle overview: standard e-bus funding plus extended warranty
Initial investment Extended warranty period
Year
0
Year
1
Year
2
Year
3
Yea
r 4
Year
5
Year
6
Year
7
Year
8
Year
9
Year
10
Year
11
Year
12
Year
13
Year
14
Year
15
Operating period
Source: EBRD analysis. Note: This overview is an example provided for illustrative purposes only.
This is a variation of the standard model, usually used when there are two distinct OEMs supplying the bus and the battery separately. The two OEMs would of course agree on the technical parameters and inter-operability at the bid stage. The costs financed during the initial investment period are the same as in the standard model. As an additional extended warranty period has been negotiated with the bus and battery OEMs, the operating period will be composed of:• Extended warranty coverage period: this may range
from 6-12 years depending on the market and onthe OEMs. OEMs should be asked to “bid” warrantyterms and periods.
• Uncovered operating period: where the maintenance,repair and replacement costs are uncertain toestimate both in timing and in amount, similarly to thestandard model.
This model may in some cases provide improvements to asset disposal at the pre-agreed prices at fixed points in the future – for instance, five, eight or ten years – at pre-agreed prices if the bus is returned in a pre-defined condition and/or mileage range. There is often a “balloon payment” connected to these deals.
Some factors of the extended/lifetime warranty to consider: • The extended/lifetime warranty needs to be negotiated
upfront, at procurement stage, since it is part of thepackage offered by the OEM(s). The adequacy of termsand conditions of the warranty may become one ofthe valuation criteria for the award of procurement, onwhich the OEMs can compete for the best offer.
• The warranty may be provided against additionalupfront costs, or payments in the initial year(s) of theoperating period. Given the relatively high upfront costsof the e-bus fleet (versus diesel fleet), the city/operatormay want to negotiate for the payments to be made inmore phases later on (during operations). This can alsobe a competing criterion during procurement.
• Since bus and battery are procured separately, thewarranties provided will cover separate assets. Thiswill lead to a potential rise of interface risk (wheresome costs may not be covered by either). The city/operator needs to carefully review both contracts inparallel to ensure full coverage during the warrantyperiod to avoid additional costs.
• It is important that the city/operator understandsand ensures adequate monitoring with respectto the specific technical parameters within whichthe warranty is applicable (in particular the batterywarranty). These parameters may include conceptssuch as battery temperature, state of charge, energyused and full cycles, within a maximum percentage ofbattery degradation. When the city/operator does nothave technical expertise in buses (especially in pilotprojects), it may include a battery monitoring system inits initial investment.
Bus Battery and charging infrastructure

Going electric | A pathway to zero-emission buses | Policy paper June 2021 53
Table 23. Cost financing overview: standard e-bus funding model plus extended or lifetime warranty
Life stage Cost Timing Amount Responsibility Financing
City/ operator
Third party
Pre-investment (~1 year)
Feasibility and due diligence studies
Certain (before investment)
Amount certain at financing time
√ √ Donor funds or grants
Initial investment stage (~1-2 years)
Bus capex Certain (initial investment)
Amount certain at financing time
√ Majority funded by city/operator budgetPartly financed with loans to city/operator (plus potential grant from central government/donors)
City/operator budget and/or grant/loan
Battery and charging infrastructure capex
Certain (initial investment)
Amount certain at financing time
√
Start up opex Staff trainingApprovalsRestructuring costs
Budgeted at planning stage
√
Operating period(at least 12 years)
Ordinary operating costs Ongoing and certain Within estimable range √ Operator passenger revenues and subsidies
Loan service Ongoing and certain Certain √ Operator revenues and/or subsidies from city budget (throughout public service contract, or annual budget transfer)
Bus maintenance and repair
Fixed for defined period on defined tasksDaily maintenance normally at operator risk
Certain and minimum (against upfront and/or annual payments)
√ This element (especially the upfront cost) can be included in the initial financing package
Uncertain after the extended warranty expires
UncertainRisk will decline as fleets enlarge
√ Operator revenues/reserves and/or subsidies from city budget Operator will want to minimise the uncovered period
Battery replacement and disposal
Certain for the covered period (upfront or ongoing annual fee)
Certain √ This element (especially the upfront cost) can be included in the initial financing package
Uncertain after the extended warranty expires
Uncertain √ Operator revenues/reserves and/or subsidies from city budget
Operator will want to minimise the uncovered period
End of useful life of bus
Bus disposal Uncertain (depending on usage/operating conditions)
Certain, when included in the warranty contract
√ Operator reserves and/or subsidies from city budget
Battery disposal (final) Uncertain (same as bus disposal)
Certain, when included in the warranty contract
√ Operator reserves and/or subsidies from city budget (plus donor funds or grant financing when battery second life contributes to energy efficiency targets)
Source: EBRD analysis.Note: This overview is an example provided for illustrative purposes only.

Going electric | A pathway to zero-emission buses | Policy paper 54 June 2021
Figure 18. Lifecycle overview: standard e-bus funding and service agreement
Initial investment
Year
0
Year
1
Year
2
Year
3
Yea
r 4
Year
5
Year
6
Year
7
Year
8
Year
9
Year
10
Year
11
Year
12
Year
13
Year
14
Year
15
Operating period
Source: EBRD analysis. Note: This overview is an example provided for illustrative purposes only.
Disposal
This is a slight variation of the standard model, with the introduction of an additional service agreement for bus/battery maintenance and performance management services. The costs financed during the initial investment period are the same as in the standard model. During the operating period, an additional service agreement is negotiated with the asset supplier. Usually, under the standard model there is one supplier (OEM) providing both the bus and the battery, leading to a unique service agreement covering the maintenance, repair and replacement of both. The uncertainty of extraordinary costs is now much lower, given that most of these have been transformed in fixed annual payments. However, some costs may not be covered under the service agreement. It is likely that day-to-day maintenance (cleaning, light bulbs, tyres, lubrication, safety inspections) will be carried out by the bus operator or the OEM could provide full service via an embedded maintenance team.
This model may also provide improvements to asset disposal at the end of the bus’s useful life, when the city/operator manages to negotiate resale of the assets back to the OEM who may be better able to capture the asset RV.
Main characteristics of the service agreementThe service agreement needs to be negotiated upfront, at procurement stage, since it is part of the package offered
by the OEM. The adequacy of terms and conditions in the service agreement may become one of the valuation criteria for the award of procurement, on which the OEMs can compete for the best offer.
The service agreement should cover a comprehensive and reasonable list of costs covered to ensure regular operational performance of the fleet. These would include, as a minimum, the ordinary check-ups and maintenance works of the assets and replacement of the battery when needed across the whole bus operating period.
Very clear boundaries will need to be defined between tasks assigned to each party. The bus operator will be unlikely to contract out safety responsibility, which will likely be a condition of the operating license. The services would be provided against fixed annual payments during the operating period after the expiration of the standard warranty.
This is a theoretical model with no known examples yet. However, it captures lessons learned from other sectors and has the potential to become more widely adopted, given enough market interest but especially adequate set-up of the procurement process.
13.4.3. Standard funding model and service agreement

Going electric | A pathway to zero-emission buses | Policy paper June 2021 55
Disposal
Table 24. Cost financing overview: standard e-bus funding model and service agreement (theoretical)
Life stage Cost Timing Amount Responsibility Financing
City/ operator
Third party
Pre-investment (~1 year)
Feasibility and due diligence studies
Certain (before investment)
Amount certain at financing time
√ √ Donor funds or grants
Initial investment stage (~1-2 years)
Bus capex Certain (initial investment)
Amount certain at financing time
√ Majority funded by city/operator budgetPartly financed with loans to city/operator (plus potential grant from central government/donors)
Battery and charging infrastructure capex
Certain (initial investment)
Amount certain at financing time
√
Start up opex
Staff trainingApprovalsRestructuring costs
Budgeted at planning stage
√ City/operator budget and/or grant/loan
Operating period(at least 12 years)
Ordinary operating costs Ongoing and certain Within estimable range √ Operator revenues
Loan service Ongoing and certain Certain √ Operator revenues and/or subsidies from city budget (throughout public service contract,or annual budget transfer)
Bus maintenance and repair
Ongoing and certain (annual payments)
Certain √ This element can be included in the public service contract (or annual budget transfer), given the amount certainty
Battery replacement and disposal
Ongoing and certain (annual payments)
Certain √ This element can be included in the public service contract (or annual budget transfer), given the amount certainty
End of useful life of bus
Bus disposal Uncertain (depending on usage/operating conditions)
Certain, when included in the service agreement
√ Operator reserves and/or subsidies from city budget
Battery disposal (final) Uncertain (same as bus disposal)
Certain, when included in the service agreement
√ Operator reserves and/or subsidies from city budget (+ Donor funds/grant financing when battery second life contributes to energy efficiency targets)
Source: EBRD analysis.Note: This overview is an example provided for illustrative purposes only.

Going electric | A pathway to zero-emission buses | Policy paper 56 June 2021
13.4.4. Battery-as-a-service model
Figure 19. Lifecycle overview: battery-as-a-service
Bus Battery and charging infrastructure
Initial investment
Year
0
Year
1
Year
2
Year
3
Yea
r 4
Year
5
Year
6
Year
7
Year
8
Year
9
Year
10
Year
11
Year
12
Year
13
Year
14
Year
15
Operating period
Source: EBRD analysis. Note: This overview is an example provided for illustrative purposes only.
Disposal
This model offers higher flexibility to the city/operator by financing the battery (and the charging and power infrastructure in some cases) only during the operating period, separated from the initial purchase package, contributing to lower the initial investment costs related to the e-bus fleet (currently one of the main challenges to introducing e-buses).
The costs financed during the initial investment period would now only consist of the bus purchase costs. This model is best suited for cities with previous experience in e-bus investment, having set up an existing charging infrastructure network. In this phase, the battery-as-a-service provider needs to carry out all works to ensure compatibility and appropriateness of the charging facility with the fleet operations. In cases where there is no existing charging facility, it is important to ensure the battery-as-a-service provider makes investments to set it up during the initial period. Depending on the specific contractual structure, the city/operator may still need to contribute to part of the initial investment in charging infrastructure.
During the operating periodIdeally, bus assets are covered by an extended or lifetime warranty, which helps transform the uncertain costs related to bus maintenance or repair during the operating life into occurring fixed annual payments. The battery is provided as an ongoing service (can take the form of operating or financial leasing) against annual payments. This may allow the battery costs to be “off balance sheet” for the bus operator, depending on accounting approval.
The battery service provider is a specialised company able to fully capture the asset RV at the end of the bus’s useful life.
Main characteristics of the service• Similarly to the previous models, the service
agreement needs to be negotiated upfront,at procurement stage, to ensure adequatelifecycle planning.
• The battery service agreement, ideally, should includeall maintenance and replacement costs to ensure clearvisibility and certainty on the costs incurred over theoperating period.
• The interface risk between bus supplier and batteryservice provider needs to be carefully managed tominimise the risks retained at operator level.

Going electric | A pathway to zero-emission buses | Policy paper June 2021 57
Disposal
Table 25. Cost financing overview: battery-as-a-service model
Life stage Cost Timing Amount Responsibility Financing
City/ operator
Third party
Pre-investment (~1 year)
Feasibility and due diligence studies
Certain (before investment)
Amount certain at financing time
√ Donor funds or grants
Initial investment stage (~1-2 years)
Bus capex Certain (initial investment)
Amount certain at financing time
√ Majority funded by city/operator budgetPartly financed with loans to city/operator(+ Potential grant from central government/donors)
Battery and charging infra capex
Certain Amount certain at financing time
√
Start up opex
Staff trainingApprovalsRestructuring costs
Budgeted at planning stage
√ City/operator budget and/or grant/loan
Operating period(at least 12 years)
Ordinary operating costs Ongoing and certain Within estimable range √ Operator revenues
Loan service Ongoing and certain Certain √ Operator revenues and/or subsidies from city budget (throughout public service contract,or annual budget transfer)
Bus maintenance and repair
Depends on bus package Depends on bus package √ When lifetime warranty is provided on the bus asset (against upfront cost) this can be included in the initial financing packageWhen there is service agreement (fixed annual payments), this cost can be included in the public service contract (or annual budget transfer), given the amount certainty
Battery replacement and disposal
Ongoing and certain (included in the annual service)
Certain √ This element can be included in the public service contract (or annual budget transfer), given the amount certainty
End of useful life of bus
Bus disposal Uncertain (depending on usage/operating conditions)
Certain √ Operator reserves and/or subsidies from city budget
Battery disposal (final) Uncertain (same as bus disposal)
Certain √ Operator reserves and/or subsidies from city budget (+ Donor funds/grant financing when battery second life contributes to energy efficiency targets)
Source: EBRD analysis.Note: This overview is an example provided for illustrative purposes only.

Going electric | A pathway to zero-emission buses | Policy paper 58 June 2021
13.4.5. Utility-funded model
The utility-based model is an alternative financing instrument to enable and accelerate higher investments in electrifying transportation. This model introduces collaboration with the utility company as a potential approach to lower the high upfront costs faced by the city/operator while transitioning to an electric bus fleet.
Similarly to the battery-as-a-service model, the costs financed during the initial investment period by the city/operator now would only consist of the bus purchase costs. The city/operator enters into a long-term agreement with the utility company (most likely large and creditworthy), which accepts to finance the upfront costs for the battery and charging facilities of the e-bus fleet with its own funds (internal or external).
During the operating period, the city/operator pays a leasing fee and is responsible for duty of care of the bus assets, which ideally are covered by extended/lifetime warranty. This will help convert the uncertain costs related to bus maintenance/repair during the operating life into occurring fixed annual payments. This model does not address the disposal/capture of the residual value at the end of the bus useful life. However, it is possible for the utility company to set up agreements with this regard during the procurement stage of the battery and the charging infrastructure.
Main advantages of this model• The utility funding model aims to tackle the main
challenge of high upfront costs (relative to dieselbuses) that every city/operator faces while consideringthe transition to electric bus fleets. With the presenceof a creditworthy utility company that accepts tofinance the battery and the charging facilities, theremaining costs to the city/operator, togetherwith operational cost savings, could be comparableto diesel buses.
• In addition, not only will the utility be positioned toobtain better terms of financing, the repayments fromcity/operator to the utility company will be under theform of operating costs (imbedded in the operator’score business), which contributes to easier recovery.
• The model may also contribute to facilitate thescalability of e-bus purchase programmes whileguaranteeing sufficient utility engagement intransport electrification, prompting lower reliance ongrant funding or subsidies for the transport systemelectrification.
Potential challenges and other factorsThe model requires the presence of private or autonomous energy utilities, able and willing to invest in transport assets to enable initial electric bus market development. Such utilities may be expected to exit the market, once operators are able to fund vehicle purchase directly, including through bus lease and/or BaaS contracts. The model requires the establishment of details on responsibility for the battery and charging infrastructure after the initial investment stage. It is important to understand whether or when responsibilities and costs related to these facilities are transferred to the company and combine the structure with one of the mechanisms introduced earlier (extended warranty or service agreement) to limit cost uncertainties during the operating period.
Examples The energy utility may rent or lease both the bus assets and the battery and charging facilities (potentially feasible for private operators). Such a system has been implemented in Santiago, Chile, where a private energy utility company has provided electric buses under a financial lease scheme, with payments backed by government guarantee and a monthly fee for charging services to the operator.
13.4.6. Joint purchase programmes
When there is high willingness to transition to electric bus fleets at the national level, it is possible to make joint purchases by two or more bus operators to increase buying power and lower upfront costs (for example, San Francisco Municipal Railways and King County made a joint order).
Joint purchase programmes, supported by regional or national governments, may be particularly relevant for initial e-bus development by providing increased market visibility, economies of scale, procurement standards and practices, and capacity-building opportunities.

Going electric | A pathway to zero-emission buses | Policy paper June 2021 59
14. Case studies
Battery-as-a-service
There is an emerging market of battery finance specialists who lease batteries to the operator on an availability basis per kWh, per km or per month, taking the residual value (RV) risk. They manage the installation and charging, under a 5 to 15-year contract, and may reuse mid-life batteries for on-site storage and charge for optimisation or non-transport use, for example in renewables networks.
14.1. Battery-as-a-service model case study
Table 26. Responsibility allocation in National Express case study (15-year contract)
Issue Allocation Comments
Bus operating costs PTO: National Express
Passenger revenue risk PTO: National Express Deregulated market, UK (outside of London)
Supplier (bus, battery, charging system) ADL/BYD Enviro400 Electric Vehicles (double decker)
Located at National Express Depot, Yardley Wood, UK
Bus ownership (body, chassis, electric motor) PTO: National Express
Battery ownership, with in-depot charging points Battery-as-a-service: Zenobe
Financed by Zenobe Financed under a managed service with PTO, on per e-bus battery basis
Battery replacement, reuse and/or disposal Battery-as-a-service: Zenobe As per performance requirements of
service agreement
Bus residual value (body and chassis) PTO: National Express
This section sets out a number of successful deployment models for buses, batteries and asset financing, across a range of operations and countries.
In this model, the PTO finances the buses (body and chassis) directly under a lease. The e-bus batteries and charging system are financed under a battery-as-a-service (BaaS) and charging-as-a-service (CaaS) contract, respectively, and provided through a finance and managed-service arrangement with the PTO under a monthly rental. The battery-as-a-service operator also:• manages RV risk and battery life• replaces the batteries to agreed performance
requirements• disposes of the batteries into a “second life”
• optimises and project manages grid connectionsand charging system
• supports power procurement and the implementationof the fleet charging strategy, using a dynamic chargingsoftware platform
• may include on-site renewable generation (PV panels)and battery storage (mainly subject to the availabilityand cost of the local grid supply); also offers separatepower purchase agreements providing energy froma green supply.
Source: Zenobe.

Going electric | A pathway to zero-emission buses | Policy paper 60 June 2021
Figure 20. Example: National Express – battery-as-a-service model in outsourced operations market
Public authority Deregulated
market
Bus operator National Express
Bus OEMADL/BYD
BaaS providerCaaS provider
Zenobe
Source: TIL analysis for the EBRD.
Issue operating licence
Define routes, services and bus types
Supply bus Supply spare parts Supply battery
Optimise charging solutions Finance battery and charging equipment Supply smart charging system Take battery RV and replacement risk Install chargers and battery array in depot
Charging station, National Express Electric Bus 900

Going electric | A pathway to zero-emission buses | Policy paper June 2021 61
14.2. Extended or lifetime warranty model: TEC Belgium
• Sixteen-year service contract to ensure reliableoperation during the entire lifetime of the project.
• Fifteen electric substations and switchgear fromopportunity charge ABB to power the chargers.
• Each charger has 150 kW of charging power.
OEM long warranty
Bus and/or battery OEM warrants the life of the battery.
Ideally, this agreement should include replacement cost certainty.
TEC Wallonia, Belgium, extended the warranty for “plug-in hybrid” buses on regional routes run by the in-house operations unit of the PTA. The PTA in this case is also the PTO and holds an operating contract via direct award.
Scheme description• Direct award operation in Wallonia’s regional transport
authority TEC, with operation contracted to TEC in-houseoperations (TEC also uses many external contractors).
• More than 100 electric plug-in hybrid buses arecharged by ABB fast chargers in the cities Namurand Charleroi in Belgium.
• Fifteen DC fast chargers installed in Namur andCharleroi based on open interface OppCharge®
(infrastructure-mounted pantograph).
Figure 21. TEC Belgium case study responsibility structure
TEC = PTA
Bus operator TEC operations unit
Bus OEMVolvo bus + ABB
Battery and charger install
ABB
Monopoly rights Define routes Let contract Define bus types Take fare and volume risk
“Direct award” under EU rules to in-house operations unit (TEC also outsources many routes) Plus service quality performance regime Procure assets Employ staff Maintain bus
Supply bus Supply spare parts Supply battery ABB produce electrical equipment
TEC finance bus, battery and charging equipment TEC take battery RV and replacement risk underpinned by a long (16-year) warranty ABB install chargers on street and in depots
Source: UITP, TEC and TIL analysis for the EBRD.

Going electric | A pathway to zero-emission buses | Policy paper 62 June 2021
14.3. The Netherlands: e-buses in outsourced operations market
In the north of the country (Groningen-Drenthe) almost half the buses (47 per cent) are electric. Limburg (37 per cent) and North Holland (31 per cent) hold second and third place.
Key challenges ahead The networks now electrified are the relatively easy ones. Most of the lines are relatively short. Further challenges, not least in terms of grid capacity and significant upgrade costs, lie ahead.
The electric grid is coming under growing pressure. Relatively high costs are being incurred to build the electric infrastructure in depots needed for charging the buses. With the electrification of private cars, the grid challenge is going to grow.
There are multiple players in the e-bus market and standardisation of charging infrastructure remains an issue.
The Netherlands provides a useful case study of what can be achieved rapidly with strong policy support for investment in e-buses in a market with both outsourced and municipal bus operations.
Market leader The Netherlands has been a leader of e-bus implementation in Europe. In 2016 the Dutch government signed an agreement with all public transport providers for no new diesel buses from 2025 and setting out the intention to have switched its entire fleet (currently circa 5,000 buses) to zero-emission by 2030.
Progress has been rapid: electric buses accounted for 15 per cent of the fleet by the end of 2019 (when electrics represented 41 per cent of new orders). At least 618 more are expected in 2020, taking the total to 1,388.
Operating model mixes in-house operation and concessionsOperations are covered by 34 regional concessions and the timing of contracts has a strong influence on patterns of fleet renewal which are subject to a periodic competitive tender.
City operations in Amsterdam, Rotterdam and The Hague are run by insourced municipal transport operators (PTO = PTA). Operators must provide and finance their own buses, which are owned or leased. Depot premises are leased from the authority or the previous concession holder.
Source: TIL analysis for the EBRD, 2019 data.
Figure 22. The Netherlands e-bus operator market share – outsourced concessions
27%28%
22% 23%
Transdev Qbuzz Arriva Others

Going electric | A pathway to zero-emission buses | Policy paper June 2021 63
14.4. Autonomous electric (battery and ultra-capacitor) deployment supported by the EBRD
Sofia, Bulgaria (delivery 2019-20)• 15 low-floor electric buses with fast-chargers (ultra-capacitor), six charging stations• Concessional loan with support from Green Energy Special Fund (GESF), Taipei-China• The project has been implemented as a trigger project for Sofia Green City Action Plan
which is now adopted• Phase 2 for an additional 15 buses and six charging stations was also approved to
increase the volume of electric buses and came as a follow-on project, aligned withthe GCAP recommendations
Batumi, Georgia (delivery 2020)• Eight low-entry battery electric midi-buses, depot charging• Grant support from E5P (Eastern Europe Energy Efficiency and Environment
Partnership (E5P) fund• First battery electric bus in the Caucasus region
Amman, Jordan (delivery expected 2022)• 15 electric buses in Jordan under a pilot project rollout as part of a wider fleet
expansion in Amman of 151 buses• Co-financed by an EBRD and GCF loan• Follow-on project to the Green City Action Plan and first introduction of
the e-bus in Jordan
EBRD support• Due diligence, project preparation and tender support• Market workshop and study tour (Brussels, with UITP)• PSC and corporate development programme (bus operator)• Green City Action Plans• Participation in the EBRD electric bus policy workshop (March 2019)

Going electric | A pathway to zero-emission buses | Policy paper 64 June 2021
14.6. “Big-bang” e-bus deployment in Santiago de Chile• Biggest fleet of e-buses in Latin America with 676
e-buses in Santiago (starting with more than 200 in2018, rest was procured in 2020).
• Strong political commitment:• Santiago’s government has pushed the e-bus
deployments through policy action and incentives tooperators (for example capital guarantees).
• The city has committed to procure only zero-emission buses after 2025.
• The national government aims to electrify publictransport by 2040:- regulatory framework- National Electric Mobility Strategy.
Electric roadmap 2018-22
• Risk reduction through new business models anddiversification:• new actors – the utility firms Enel X and Engie have
invested in e-buses and charging stations• credit guarantees from national banks• fleet size of operators is limited• PTA guarantees leasing payments between
operator and utility.
14.5. Extended range battery trolleybus supported by the EBRDDushanbe, Tajikistan (in service May 2019)• Four low-floor extended range trolleybus• Autonomous (off-wire) operation for 15 km• Investment grant from the EBRD (early transition country)• Follow-on investments in trolleybus substations and catenaries
Balti, Moldova (delivery 2021)• 10 trolleybuses• Increased autonomous operation, rehabilitating old network and infrastructure• This project was a trigger project for the Balti Green City Action Plan which
is now underway
EBRD support• Due diligence, project preparation and tender support• Sustainable public transport network planning• Corporate development plan (Dushanbe)• Green City Action Plan (Balti)

Going electric | A pathway to zero-emission buses | Policy paper June 2021 65
14.7. Good practice examples
Table 27. Good practice examples, as of June 2020
In-motion charging PKT Gdynia, Poland
Opportunity charging Transdev, Amstelland-Meerlanden, the NetherlandsConnexxion, Eindhoven, the NetherlandsQbuzz, Dordrecht, the NetherlandsIn the Netherlands there are now 907 zero-emission buses in operation. In December 2020 another 281 were to be added, with the cumulative fleet approaching 1,300
Overnight charging with large fleets of buses
TfL London, United KingdomTEC Wallonia, Namur and Charleroi, BelgiumRATP, Paris, France
Battery-as-a-service contracts FirstGroup, United Kingdom (8 years)Newport, Wales (5+2+5 years)TEC Wallonia, Belgium (5+2+5 years)National Express, Yardley Wood, United Kingdom (15 years) – BaaS provider ZenobeAbellio, London, United Kingdom (5+2+5 years) – BaaS provider Zenobe
Extended warranty – bus TEC Wallonia, Belgium (10 years)
Operational plan best practice Go-Ahead London, Hong Kong
Small-city deployment Go South Coast, Salisbury, United Kingdom
Warranty and contract terms Bus driveline – chassis, body, control equipment – up to 15 yearsBatteries – battery-as-a-service – continuous supply, maintain, replace deals now available; break clauses at 5-8 yearsCharging equipment – up to 15 year “lease and maintain” supply contracts available
Additional data and resources are available at the Clean Bus Europe Platform (https://www.uitp.org/projects/clean-bus-europe-platform/), run by UITP and funded by the European Commission.
Source: TIL and UITP.

Going electric | A pathway to zero-emission buses | Policy paper 66 June 2021
15. Summary
Cities should develop clear objectives, including the weighting among objectives, the desired policy deadlines and a realistic statement of achievable capital and operating funding sources. They should explore the policy trade-offs among key factors such as cost recovery through passenger fares and subsidies and the impact of commercial speeds on passenger revenue and operating costs as part of their e-bus planning. This process should result in a clean-buses deployment strategy – a master plan or vision.
Cities should update their governance and contractual arrangements for bus operations before investing in e-buses good practice in this area, as summarised in theEBRD publication Driving change: reforming urban busservices, published in association with UITP and GIZ.
Many larger cities will require a mix of depot-charged and opportunity-charged routes, depending on daily bus km operated and the relative costs of the charging equipment, depot re-configuration, batteries and power consumption differences.
The capital needs for depot re-equipment and impacts on depots operations costs must be calculated.
A key decision is whether to use AC or DC electric traction: DC is more expensive but can charge more quickly at 100-150 kW, AC is cheaper, but slower to charge.
Cities require a systematic bus charging strategy that identifies objectives and constraints and determines the AC/DC mix, the split between in-depot and opportunity charging and the practical locations for charging points.
The outcomes from the charging strategy should be fed into the financial evaluation model, including impacts on bus km, bus fleet size and paid hours, as well as capex items, in an iterative process in the project stage (feasibility study).
Risks should be identified at the project planning stage and clearly allocated. The bus operating contracts and asset procurement contracts should reflect this analysis and the bus operator should define the optimisation factors, in conjunction with the public authorities.
The procurement process should seek to price variant options – for example, bus life and address identified risks.
Given the large capital requirements and high costs of operational transition, the operating contract should be pre-agreed and aligned to the operating and capital risk allocation selected.
Engineering cost assumptions should be updated and there is good reason to assume that a substantial cost reduction of 10-30 per cent may be possible, depending on local assumptions.
Project promoters should plan for, and evaluate, the financial impacts of necessary changes to depot operations, maintenance and safety regimes and consequential impacts on bus km, spare buses and paid hours.
Scheme sponsors should assess their projects on a TCO basis, built up for local traffic and operating conditions.
Sample calculations and analyses have been prepared and are shown in this report, for illustration.
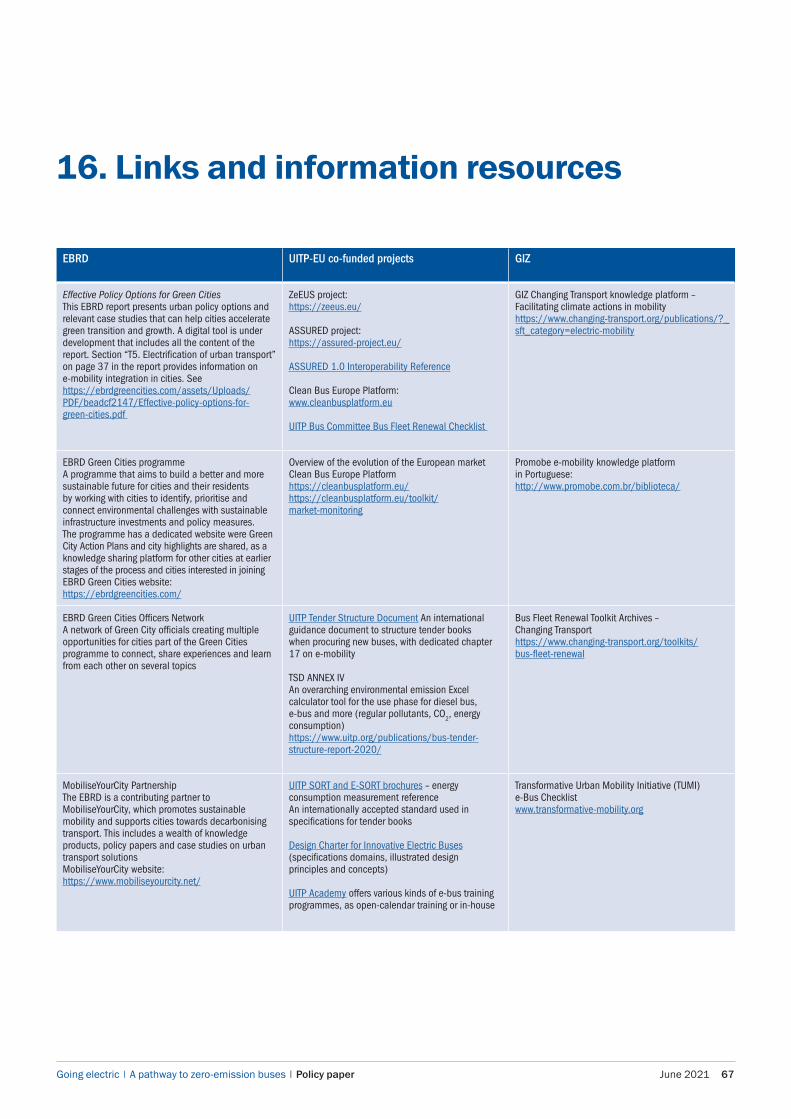
Going electric | A pathway to zero-emission buses | Policy paper June 2021 67
16. Links and information resources
EBRD UITP-EU co-funded projects GIZ
Effective Policy Options for Green CitiesThis EBRD report presents urban policy options and relevant case studies that can help cities accelerate green transition and growth. A digital tool is under development that includes all the content of the report. Section “T5. Electrification of urban transport” on page 37 in the report provides information on e-mobility integration in cities. Seehttps://ebrdgreencities.com/assets/Uploads/PDF/beadcf2147/Effective-policy-options-for-green-cities.pdf
ZeEUS project: https://zeeus.eu/
ASSURED project: https://assured-project.eu/
ASSURED 1.0 Interoperability Reference
Clean Bus Europe Platform: www.cleanbusplatform.eu
UITP Bus Committee Bus Fleet Renewal Checklist
GIZ Changing Transport knowledge platform – Facilitating climate actions in mobilityhttps://www.changing-transport.org/publications/?_sft_category=electric-mobility
EBRD Green Cities programmeA programme that aims to build a better and more sustainable future for cities and their residents by working with cities to identify, prioritise and connect environmental challenges with sustainable infrastructure investments and policy measures. The programme has a dedicated website were Green City Action Plans and city highlights are shared, as a knowledge sharing platform for other cities at earlier stages of the process and cities interested in joiningEBRD Green Cities website:https://ebrdgreencities.com/
Overview of the evolution of the European market Clean Bus Europe Platformhttps://cleanbusplatform.eu/https://cleanbusplatform.eu/toolkit/market-monitoring
Promobe e-mobility knowledge platform in Portuguese:http://www.promobe.com.br/biblioteca/
EBRD Green Cities Officers NetworkA network of Green City officials creating multiple opportunities for cities part of the Green Cities programme to connect, share experiences and learn from each other on several topics
UITP Tender Structure Document An international guidance document to structure tender books when procuring new buses, with dedicated chapter 17 on e-mobility
TSD ANNEX IV An overarching environmental emission Excel calculator tool for the use phase for diesel bus, e-bus and more (regular pollutants, CO2, energy consumption)https://www.uitp.org/publications/bus-tender-structure-report-2020/
Bus Fleet Renewal Toolkit Archives – Changing Transporthttps://www.changing-transport.org/toolkits/bus-fleet-renewal
MobiliseYourCity PartnershipThe EBRD is a contributing partner to MobiliseYourCity, which promotes sustainable mobility and supports cities towards decarbonising transport. This includes a wealth of knowledge products, policy papers and case studies on urban transport solutionsMobiliseYourCity website:https://www.mobiliseyourcity.net/
UITP SORT and E-SORT brochures – energy consumption measurement referenceAn internationally accepted standard used in specifications for tender books
Design Charter for Innovative Electric Buses (specifications domains, illustrated design principles and concepts)
UITP Academy offers various kinds of e-bus training programmes, as open-calendar training or in-house
Transformative Urban Mobility Initiative (TUMI) e-Bus Checklistwww.transformative-mobility.org

Going electric | A pathway to zero-emission buses | Policy paper 68 June 2021
17. Further information
Topic Resource Link
Bus reform, regulation and system funding
GIZ bus reform and modernisation China: New energy buses
Philippines: Mini-bus sector reform
Philippines: Bus corridor operational enhancements
India: Bus operations
UITP Training in Tendering and Contracting of Public Transport Services
https://www.uitp.org/trainings/tendering-and-contracting-of-public-transport-services/
EBRD bus reform paper (backed by UITP and GIZ)
https://www.ebrd.com/documents/municipal-infrastructure/driving-change-reforming-urban-bus-services.pdf
Procurement/deployment guidance
UITP SORT25 and E-SORT
ASSURED 1.0 Interoperability Reference
UITP Bus Fleet Renewal Checklist
Bus Fleet Renewal Toolkit
https://www.uitp.org/publications/uitp-sort-e-sort-brochures/
https://assured-project.eu/storage/files/assured-10-interoperability-reference.pdf
https://www.uitp.org/publications/bus-fleet-renewal-checklist/
https://www.changing-transport.org/toolkits/bus-fleet-renewal
Bus tech UITP Knowledge Brief on Trolleybus The series of knowledge briefs presents the benefits of introducing trolleybuses with IMC into a city and the benefits of upgrading an already existing trolleybus system with IMC technology, combining passing under the overhead wires network with battery charge while operating in autonomous battery mode
https://www.uitp.org/publications/in-motion-charging-innovative-trolleybus/
Battery economics and green cities
Bloomberg New Energy Finance https://about.bnef.com
EBRD Green Cities https://www.ebrdgreencities.com
EBRD contacts and support Ian Jennings, Urban Transport sector specialist
25 SORT is the only efficient tool that designs reproducible test cycles for on-road bus tests in order to measure their fuel consumption and is used by the public transport sector in the procurement phase of buses.
ReferencesUITP Bus Committee (2019), “UITP Bus Fleet Renewal Checklist”. Available at https://www.uitp.org/publications/bus-fleet-renewal-checklist/ (last accessed on 30 April 2021).
UITP Transport and Urban Life Committee (2019), The Impact of Electric Buses on Urban Life. Available at https://cms.uitp.org/wp/wp-content/uploads/2020/06/UITP-policybrief-June2019-V6-WEB-OK.pdf (last accessed on 13 May 2021).
UITP and ARUP (2020), Zero Emissions Bus Forum, Discussion Paper.
Website referenceshttps://assets.bbhub.io/professional/sites/24/2018/05/Electric-Buses-in-Cities-Report-BNEF-C40-Citi.pdfhttps://www.epa.gov/regulations-emissions-vehicles-and-engineshttps://www.sustainable-bus.com/parts/volvo-buses-and-second-life-batteries-a-new-project-in-gothenburghttps://www.uitp.org/clean-bus-europe-platformhttps://zeeus.eu/uploads/publications/documents/zeeus-ebus-report-2.pdf
Exchange rates Currency equivalents in this report were calculated based on an exchange rate of 1.12 euros to the British pound, where relevant.

Going electric | A pathway to zero-emission buses | Policy paper June 2021 69
Glossary
Term Abbreviation Meaning
Alternating current AC Alternating current
Battery-as-a-service BaaS
Battery electric bus BEB Bus powered by electricity, with power supplied by batteries and/or overhead wires
Battery operated bus BOB
Battery trolleybus Trolleybus fitted with lower-capacity batteries to allow passenger operation beyond overhead wires and charged by overhead wires
Bloomberg NEF BNEF Bloomberg New Energy Finance provides research, long-term forecasts, analytical tools and global in-depth analysis covering a wide range of energy and related industries
Bus fleet Number of buses in bus fleet – always greater than PVR
Catenary System of overhead trolley wires used to supply traction current to a bus, tram or train
Compressed natural gas CNG CNG is compressed natural gas that has been compressed to approximately 200 bar
Cost benefit analysis CBA Economic evaluation of the financial and social impacts of policy options, including factors such as impacts on pollution, travel time, noise, civic amenity, and so on
DC charging The AC to DC converter is mounted at the charging point or station and allows rapid charging
Direct current DC Direct current
E-bus Bus powered by electricity, with power supplied by batteries and/or overhead catenary
European Bank for Reconstruction and Development
EBRD Sponsors and co-authors of this report
Euro VI EU-defined emission standard
Deutsche Gesellschaft für Internationale Zusammenarbeit
GIZ Deutsche Gesellschaft für Internationale Zusammenarbeit (GIZ) GmbH
Greenhouse gas GHG A greenhouse gas is a gas that absorbs and emits radiant energy within the thermal infrared range, causing the greenhouse effect
Hydrogen fuel cell HFC Source for generating electricity through power pack fitted onto a bus
In-motion charging IMC Charging of battery trolleybus by overhead wires
Low emission zone LEZ An area designated by law to control vehicle emissions to a more restrictive level than the prevailing national standard
Opportunity charging Charging of e-buses at high speed via charging points located away from bus depots – for example on-street and/or at route terminal points
Original equipment manufacturer OEM Term may apply to bus builder, battery supplier or any other source of engineering equipment or services
Passenger transport authority PTA The government or local government authority charged with strategic responsibility for local transport within a region
Passenger transport operator PTO An entity that provides passenger transport services – may be owned and/or regulated by a PTA, or part of a PTA
Peak vehicle requirement PVR Maximum number of buses required for public service at any time in the operating timetable/plan
Residual value RV The residual value (market price) of an asset at the point of disposal
Standardised On-Road Test SORT UITP has devised cycles to create a common standard for testing performance and fuel consumption of buses. SORT number 1 is a heavy urban cycle and SORT 2 is an easy urban cycle. The availability of this data makes it possible to avoid repeating tests each time a contract is offered or awarded, thus saving time and expense.
TIL TIL Transport Investment Ltd – consulting firm that authored this report
Total cost of ownership TCO Sum of all capital and all operating costs over the planned asset life
Trolleybus A trolleybus is an electric bus that draws power from overhead wires, using spring-loaded trolley poles
Ultra-low emission bus ULEB
Union Internationale des Transports Publics
UITP The International Association of Public Transport: worldwide network to bring together all public transport stakeholders and all sustainable transport modes
Zero-emission bus ZEB A bus that produces zero emissions “at the tailpipe” – typically an e-bus, trolleybus or HFC bus

Going electric | A pathway to zero-emission buses | Policy paper 70 June 2021
Annex 1. EBRD Going Electric conference, London, March 2019
Table A.1.1. Going Electric conference: participants and topics covered
26 March 2019 Participants Activities Organisation
All Visit to Go-Ahead London electric bus depot Go-Ahead London, United Kingdom
All Meeting with Transport for London TfL, United Kingdom
All Reception and working dinner
27 March 2019 Name Role Organisation
Opening remarks Nandita Parshad Managing Director, Sustainable Infrastructure Group
EBRD
Objectives and public policy Ian Jennings Senior Urban Transport Specialist EBRD
Kjetil Tvedt Senior Economist EBRD
Aida Abdulah Senior Project Manager, Bus Unit, Knowledge and Innovation
UITP
Christian Mettke Project Manager, Climate Change, Environment, Infrastructure department
GIZ
David Leeder Managing Partner TIL
Arno Kerkhof Head of Bus Unit, Knowledge and Innovation UITP
Alok Jain Managing Director, TransConsult Asia (TCA) TIL – TCA
Electric bus – state of plan and deployment
Panel 1. Technology solutions: suppliers (Chair: Alok Jain, TCA)
Stefan Baguette Group Product Manager Alexander Dennis Ltd, United Kingdom
Mateusz Figaszewski Director E-mobility Development and PR Solaris Bus & Coach, Poland
Isbrand Ho European Sales Director BYD, the Netherlands
Richard Harrington Engineering Director Go-Ahead London, United Kingdom
Yussup Khassiev Head of Moscow, Astana Offices, Trolley Bus Committee Manager
UITP
Vladimir Korol Director General Belkommunmash, Belarus
Sergey Chistov Deputy Chief Design Engineer Belkommunmash, Belarus
Bob Bouhuijs VP Smart Grid and Virtual Power Plant Heliox, the Netherlands
Uday Khemka Vice Chairman of SUN Group Sun Mobility, India
Panel 2. Operations feedback: cities and operators (Chair: Arno Kerkhof, UITP)
David Leeder Managing Partner TIL
Claire Mann Director of Bus Operations TfL, United Kingdom
Tom Cunnington Director of Bus Operations TfL, United Kingdom
Whole life costings (TCO) Arno Kerkhof Head of Bus Unit, Knowledge and Innovation UITP
Key learning from ZeEUS (European Union (EU) co-funded project)
Marta Woronowicz Project Manager PKT Gdynia Trolleybus Co, Poland
Operator feedback from China, the Netherlands, Poland
Joe Ma Deputy General Manager Shenzhen Bus Group Co, China
Josh Carmichael Expert Zero-Emission Technology (Battery and Hydrogen)
Transdev (Connexxion), the Netherlands
Panel 3. Developing electric bus projects (Chair: Matthew Jordan-Tank, EBRD)
Project preparation, Green City Action Plans (GCAPs), capacity building
Lin O’Grady Associate Director, Head of Sustainable Infrastructure Project Preparation and Implementation and Green Cities
EBRD
Peter Hirsch Associate – Policy Products, Energy Efficiency and Climate Change, EBRD
EBRD
(continued on the next page)

Table A.1.1. Going Electric conference: participants and topics covered (continued from previous page)
Green funding, energy supply integration, policy
Metodi Avramov Adviser, Climate Change, Environment, Infrastructure department
Sofia Urban Mobility Centre, Bulgaria
Summary and next steps (Chair: David Leeder, TIL)
Aida Abdulah Senior Project Manager, Bus Unit, Knowledge and Innovation
UITP
Philip Good Senior Economist EBRD
What did we learn? Arno Kerkhof Head of Bus Unit, Knowledge and Innovation UITP
Christian Mettke Project Manager, Climate Change, Environment, Infrastructure department
GIZ
Outline of policy paper Ian Jennings Senior Urban Transport Specialist EBRD

Going electric | A pathway to zero-emission buses | Policy paper 72 June 2021
Annex 2. EBRD due diligence checklist for the renewal of e-bus fleets
Table A.2.1. Due diligence – data needs and diagnosis
Define project objectives Local air qualityCongestionClimate change/Paris Agreement goalsPatronageDecongestion
Prepare plans for new e-bus fleet Supporting plans and policies in sustainable urban mobility and electric mobilityPlanned bus priority measures (bus lanes and corridors, prioritised traffic management, and so on)Business plan for new bus fleet (proposed routes, service schedules, and so on)
Collect market and operational data Route network – bus routes, frequencies, service schedules, operating speeds, ridership (passengers) Bus fleet composition, including spare busesOperating kmsDaily range – average and maximumStaffing levels, breakdown
Assess topography and climate data Topography, temperature rangeFuel consumptionHeating and cooling needs
Determine revenues and funding Type of operating contract – gross/net cost public service contract, operating licenceRevenues (tickets, advertising, and so on), fare collection systemOperating subsidiesCapital subsidies and grantsLocal taxation
Calculate costs Operating cost breakdownFuel costs (existing fleets: diesel, CNG, and so on)Electricity tariffs (day, night)Maintenance costs (including power equipment)Battery replacement costs
Assess available street charging infrastructure Does the city have an existing tram or trolleybus network or other street charging infrastructure (sub-stations)? What is the existing condition of substations and overhead wires and are rehabilitation works required?Is there spare power capacity on the network, to support in-motion charging and/or opportunity charging?Are there possibilities for the optimisation of the trolleybus network and/or extension?What is the impact on charging strategy?What is the impact on the types of bus required?
Explore power and renewables needs Local source of power generation and availability thresholds (grid capacity) at charging locations, especially the depotCost of grid connectionsPossibility of on-site renewable generation (solar PV), with net metering or battery storage at depotsRole for battery boxes to allow trickle charging (to avoid high grid connection costs)Possible role of bus fleet for grid balancingPower cost estimates
Conduct technical and commercial maturity and risk assessment
Market availability (vehicle and spare parts) – which manufacturers are established in the market concerned? How has the specific solution been tried and tested in the market and in service elsewhere? What has been the operational performance?How does this compare to planned operations?Are warranties and guarantees on offer?Is there an established model or is it new to market (risks need to be evaluated)?

Going electric | A pathway to zero-emission buses | Policy paper June 2021 73
Table A.2.2. Due diligence – assessment of e-bus solution for funding
Explore and define charging strategy AC or DCDepot charging or opportunityLocation of chargersIncremental power needsPower connection costsDaily range needsCharging time available in timetable at night, at route-end points and so onPlanning permissions and approvals needed (especially for opportunity charging)
Define output requirements of buses Seating and standing capacityDaily rangeAsset life requiredSpeed and accelerationHeating and coolingBattery capacity neededPricing of “major units” (key parts)Pricing of “consumables” (high-volume parts)
Conduct safety assessment Risk identification (for instance, very quiet vehicles, battery management, high-voltage electricity, increased acceleration)Updated risk assessmentsRisk mitigation plansTraining needs
Explore technical option trade-offs Asset life versus first priceFit to output specificationOperating cost dataBattery and vehicle life cycleBattery capacity Warranty periods versus price
Determine battery financing and disposal Determine battery procurement and charging option:Capital item; “Power by the hour” or battery-as-a-service; OEM performance warranties; Battery disposal method; Forecast of warrantied battery life; Recycling of used batteries
Determine depot reconfiguration Impact on parking capacityReconfiguration of maintenance shopsStaff retrainingSafety and risk assessmentGrid connection costs and worksProject management of installation works
Conduct operating cost assessment Bus fleet – for example, buses needed for chargingMaintenance costsStaff count and hoursBus kms needed for chargingPower costsFiscal impacts – fuel tax versus power taxProject management requirements and costsAsset finance costsAnd so on
Analyse financial options Total cost of ownership (TCO) assessmentFinancial assessments versus as-is and alternativesAssessment of sources and uses of funds – how will the scheme be paid for?
Log risks and risk mitigation plan Cost risksAsset life riskAsset financing risksSafety risksWarranties on buses, batteries, power equipmentPower supply agreementsAsset performance regime – for example, non-performance penalties
Assess Paris Alignment and green economy transition
Assessment of reductions in GHG emissions and air pollution (particularly NOx and particulate matter) resulting from modal shift, energy efficiency, resource efficiency savings or other environmental benefits (in absolute values and percentage terms)Estimate of the number of beneficiaries EBRD Green Cities benchmark assessment, as relevant
Conduct economic cost-benefit analysis (public funding)
Passenger ridership assessment, value of time, operating costs, local pollution impacts, emissions impact and other social benefits (“project” versus “do-nothing” scenario)
Source: Compiled with input from TIL, WSP and Motts consultants.

Going electric | A pathway to zero-emission buses | Policy paper 74 June 2021
Annex 3. Working with the EBRD
The EBRD assists its clients in developing urban transport projects that are feasible, deliver value to users and public sector authorities and optimise private sector efficiencies. It supports effective ways for project delivery through both public and private actors, including public service contracts, route/area contracts, design-build-operate-maintain (DBOM) models and PPP contracts.
Overview of EBRD policyIn supporting urban transport projects, whether in their own right or as part of a larger project, the EBRD has certain overarching criteria (see Figure A.3.1).
FundingThe EBRD funds schemes that are viable and have a well-considered business case. The funding is subject to a loan agreement, negotiated separately to the contract, with requirements for advances and repayment. While the funding should cover all or part of the capital expenditure needed, the client needs to meet certain costs, such as sector planning and regulation, route planning, enforcement and revenue collection, communications and financial models.
The EBRD provides funding across the whole spectrum, from sovereign loans when legally necessary, to municipal loans, public utility loans backed by municipal guarantee, operational concessions (DBOM) and PPPs based on design-build-finance-operate (DBFO) to full privatisations.
Urban transport projects are often supported on a sub-sovereign basis, including loans to city authorities and companies and private contractors, under special project vehicle arrangements.
Funding from the EBRD is subject to approval by the credit committee and a separate loan agreement is required.
Technical and operational support can also be provided to support project preparation and implementation, subject to the specific needs of the client and project characteristics.
Project strategy and preparationThe EBRD should be involved early on during project preparation, the main step of which is a feasibility study undertaken by the city and/or due diligence study performed by the EBRD. The study establishes the business case for the project through a full legal, operational and technical analysis and an economic and financial analysis, and recommends the technical and operational solutions to be adopted. It forms the basis of any funding request to the EBRD.
A key requirement of EBRD support is that any project should allow the highest degree of open competition for private contractors, based on industry-accepted standards and available solutions and technology platforms.
Moreover, legislative, institutional and organisational changes for the reform process are often critical to project implementation and their impact should be factored into the project timescales. The EBRD may be able to provide advice on changes that are needed, and, where appropriate, assist the city in advocating for such changes.
Figure A.3.1. Summary of EBRD project requirements
Operations to comply with both national and EU standards, where applicable
Financially self-supporting project (debt repaid from cash flows with adequate cover ratios)
Objective of operational improvements supported by pre-defined investments
• Improved financial and operating performance• Commercialisation and private-sector engagement• Energy and other efficiencies
Objective of support for reform
• Green economy transition• Demonstration effect• Tariff and collection reform

Tendering and contract managementFor projects funded by the EBRD, the Bank’s Procurement Policies and Rules are applied, which override local rules and policy. For well-defined products, a one-stage open tender is generally applied. However, for complex systems, a two-stage tender may be more suitable. The first round is to provide an unpriced, technical solution and serves to establish qualified bidders and the final technical requirements for the tender. The second round is for a final technical and price offer, with the lowest qualified bid being the successful contractor. A full guide to the Procurement Policies and Rules is available on www.ebrd.com.
Regular meetings are required to review progress and see how challenges are being overcome. On large and/or complex projects, a lender’s supervisor is appointed to oversee progress on behalf of the EBRD, assess variations and changes to the contract and report regularly with the client on contract performance. It is also important and good practice to keep the lender well informed about progress and about issues that arise, as a lender who does not hear regularly how the project is progressing will often assume the worst, even if this is not the case.
For further advice, contact:Ian Jennings, Senior Specialist, Urban Transport Sustainable Infrastructure Project Preparation and Policy Unit, Sustainable Infrastructure Group, European Bank for Reconstruction and Development Tel: +44 20 7338 8517. Email: [email protected]
Photography: p6 ©Transdev The Netherlands; p13 ©www.solaris.com, ©iStockphoto, ©TEC 2021, ©iStockphoto, ©UITP and its member Erik Lenz (Kiepe Electric), ©Škoda Transportation Group and ©UITP and its member Solaris Bus & Coach; p14 ©UITP and its member PMDP; p15 ©Ebusco BV, ©TEC 2021 and ©Archive PMDP; p16 ©Transdev The Netherlands; p23 ©UITP and its member Enel X srl; p24 ©UITP and its member TEC 2021; p26 ©Enel X srl; p50 ©UITP and its member Ebusco BV; p60 ©Zenobe Energy Ltd; p61 ©TEC 2021; p62 ©UITP and its member GVB; p63 ©EBRD; and p64 ©EBRD, ©EBRD/Schimbator Studio.

European Bank for Reconstruction and Development One Exchange Square London EC2A 2JN United Kingdom Tel: +44 20 7338 6000www.ebrd.com