Embed Size (px)
Citation preview
GMR INFRASTRUCTURE LTD. FINANCIAL / OPERATIONAL OVERVIEW
Q3 FY 2010-11
Humility Entrepreneurship Teamwork & Relationships Learning Social Responsibility Respect for Individual Deliver The Promise
1
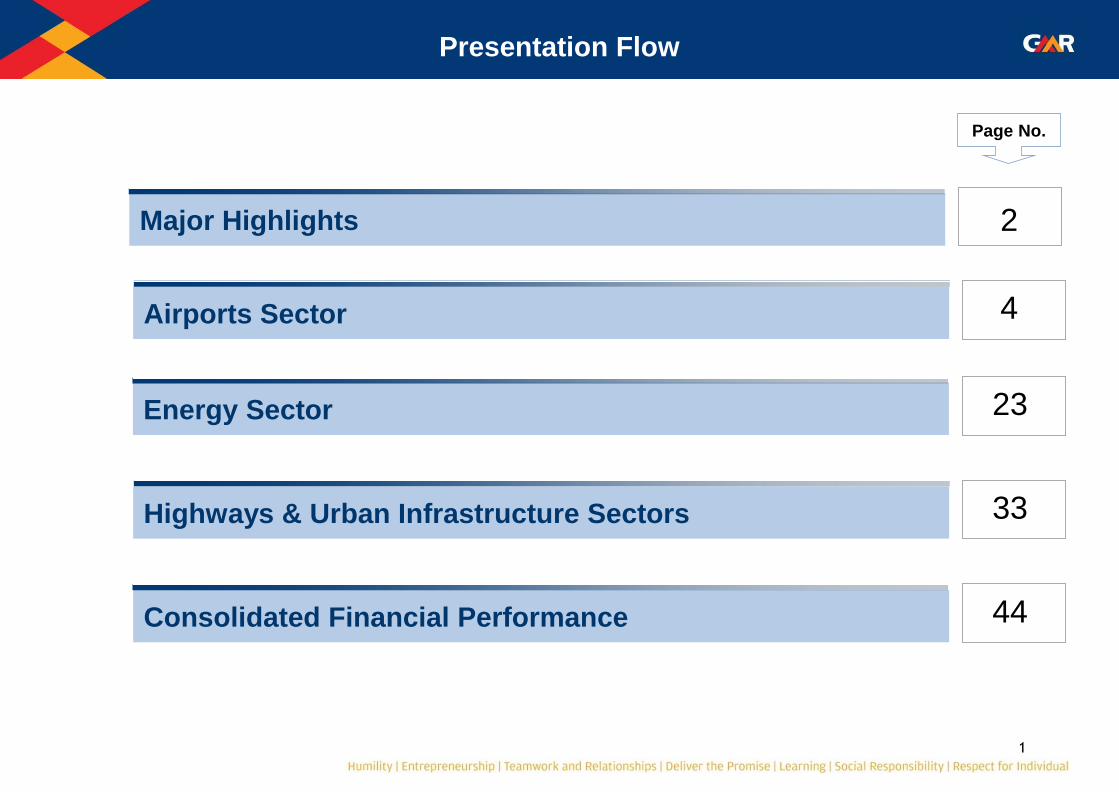
Presentation Flow
Page No.
Energy Sector
Highways & Urban Infrastructure Sectors
Airports Sector
Consolidated Financial Performance
Major Highlights 2
4
23
33
44

2
Major Highlights (1/2)
Highlights up to Q2 FY2010-11
Raised INR 1,400 Cr. through QIP in GIL.
Infusion of Private Equity in GMR Energy aggregating INR 1,390 Cr. by Temasek and IDFC
Prepayment of corporate loan of INR 425 Cr. in GEL
Prepayment of short term loan in GIL INR 800 Cr.
Prepayment of term loan in GPCL INR 55 Cr.
DIAL T3 commencement of international operation from 28th Jul 2010
The Barge mounted power plant was shifted to Kakinada in Apr 2010
− Started operation from Aug 2010 on Combined Cycle basis
Award of Male airport development and concession bid
Highlights in Q3 FY2010-11
DIAL T3 commencement of domestic operation from14th Nov 2010
In GHIAL, UDF increased to INR 430 for domestic and INR 1,700 for international departing passenger
Agreement executed to divest 50% stake in Intergen
Prepayment of Rupee Term Loan in VPGL (INR 510 Cr.) – partly paid in previous quarters
GPCL has got order from TNERC to receive old dues of Rs. 480 crore. An amount of Rs.160 crore received already
and the balance will be received in next 6 months.
Won transmission projects in Rajasthan - 386 circuit kms of 400 KV lines
Awarded 25 MW solar project in Gujarat
3
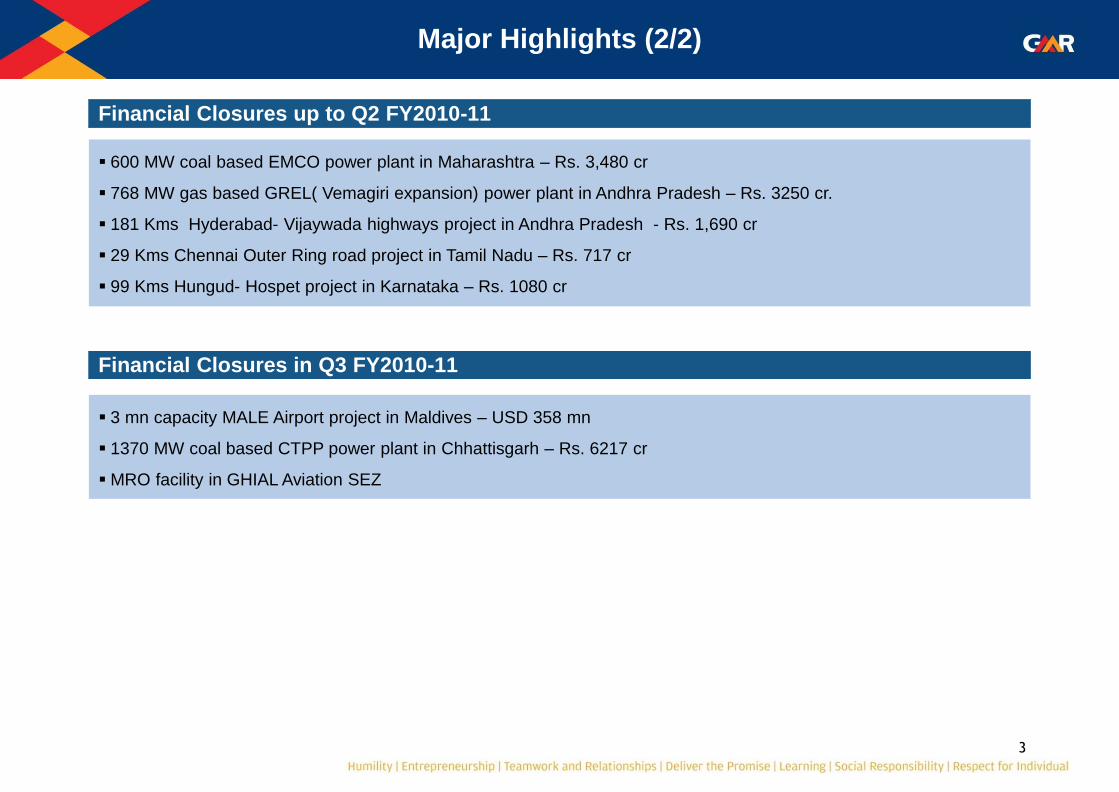
Financial Closures up to Q2 FY2010-11
600 MW coal based EMCO power plant in Maharashtra – Rs. 3,480 cr
768 MW gas based GREL( Vemagiri expansion) power plant in Andhra Pradesh – Rs. 3250 cr.
181 Kms Hyderabad- Vijaywada highways project in Andhra Pradesh - Rs. 1,690 cr
29 Kms Chennai Outer Ring road project in Tamil Nadu – Rs. 717 cr
99 Kms Hungud- Hospet project in Karnataka – Rs. 1080 cr
Financial Closures in Q3 FY2010-11
3 mn capacity MALE Airport project in Maldives – USD 358 mn
1370 MW coal based CTPP power plant in Chhattisgarh – Rs. 6217 cr
MRO facility in GHIAL Aviation SEZ
Major Highlights (2/2)

Airports Sector

5
Delhi International Airport: Operational Performance
Traffic Q2-2011 Q3-2011 Q3-2010 9m-2011 9m-2010 FY 2010 Q3-Q3 Q3-Q2 9m-9m
Passenger (mn)
Arriving
Domestic 2.31 2.68 2.47 7.66 6.75 9.02 8.4% 16.2% 13.4%
International 1.12 1.24 1.10 3.48 3.12 4.10 13.4% 10.4% 11.5%
Departing
Domestic 2.25 2.54 2.39 7.37 6.51 8.79 6.1% 12.9% 13.3%
International 1.04 1.24 1.14 3.22 2.94 4.30 8.3% 18.9% 9.5%
Total Passengers 6.72 7.70 7.10 21.73 19.32 26.21 8.4% 14.5% 12.5%
ATMs (Nos`000)
Domestic 48.88 50.09 48.58 147.56 139.07 185.42 3.1% 2.5% 6.1%
International 17.31 19.70 16.14 54.62 47.04 63.49 22.0% 13.8% 16.1%
Total ATM's 66.19 69.79 64.72 202.17 186.12 248.92 7.8% 5.4% 8.6%
Cargo (`000 in Tons)
Import 44.12 44.52 37.17 133.01 104.08 144.39 19.8% 0.9% 27.8%
Export 56.18 48.33 46.58 159.77 139.36 190.15 3.8% -14.0% 14.6%
Total Cargo 100.30 92.85 83.75 292.77 243.44 334.53 10.9% -7.4% 20.3%
6
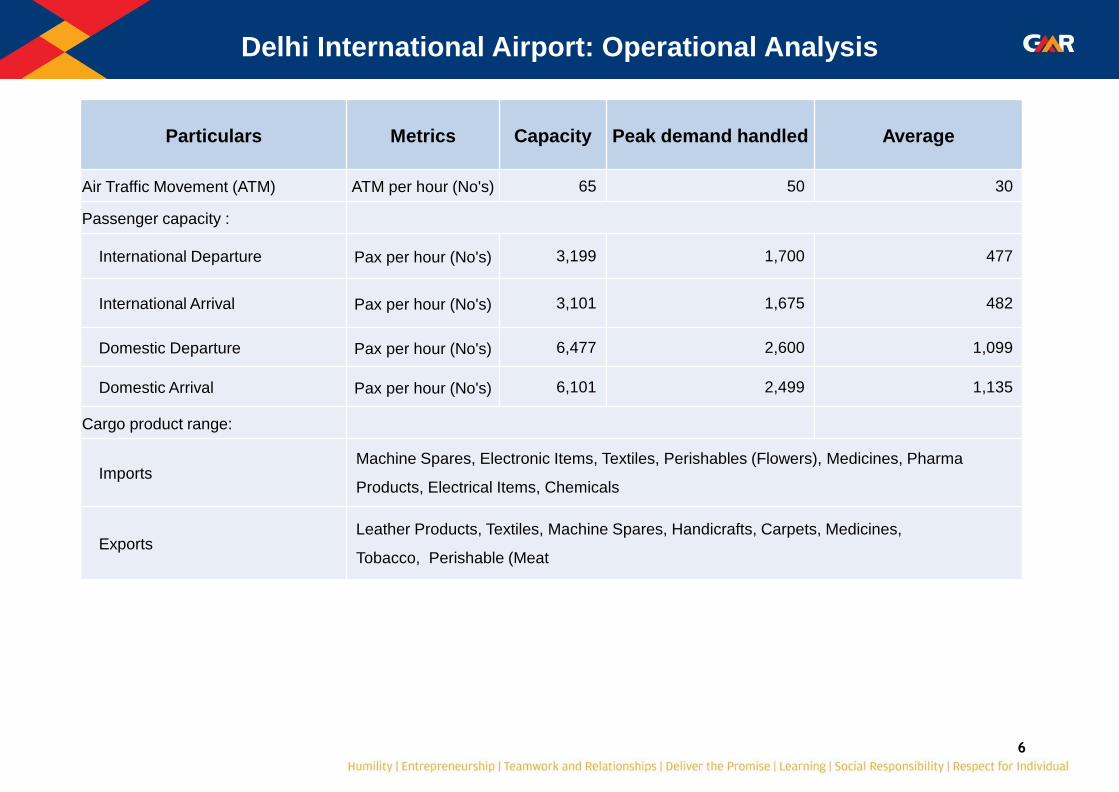
Particulars Metrics Capacity Peak demand handled Average
Air Traffic Movement (ATM) ATM per hour (No's) 65 50 30
Passenger capacity :
International Departure Pax per hour (No's) 3,199 1,700 477
International Arrival Pax per hour (No's) 3,101 1,675 482
Domestic Departure Pax per hour (No's) 6,477 2,600 1,099
Domestic Arrival Pax per hour (No's) 6,101 2,499 1,135
Cargo product range:
Imports Machine Spares, Electronic Items, Textiles, Perishables (Flowers), Medicines, Pharma
Products, Electrical Items, Chemicals
Exports Leather Products, Textiles, Machine Spares, Handicrafts, Carpets, Medicines,
Tobacco, Perishable (Meat
Delhi International Airport: Operational Analysis

7
Delhi International Airport: Financial Performance
Rs. In Mn.
Q2-2011 Q3-2011 Q3-2010 9m-2011 9m-2010 FY 2010 Q3-Q3 Q3-Q2 9m-9m
Aero Revenue 1,060 1,230 1,109 3,380 3,117 4,221 11% 16% 8%
Non Aero Revenue 1,247 1,617 1,018 3,936 3,070 5,094 59% 30% 28%
Cargo Revenue / Revenue
share 332 378 459 1,023 1,483 1,753 -18% 14% -31%
CPD Rentals 199 199 132 596 281 464 51% 0% 112%
Gross Revenue 2,838 3,424 2,718 8,935 7,952 11,532 26% 21% 12%
Less: Revenue Share 1,320 1,587 1,255 4,155 3,674 5,389 26% 20% 13%
Net Revenue 1,518 1,837 1,463 4,780 4,278 6,143 26% 21% 12%
Total Expenditure 1,494 1,483 888 3,742 2,694 3,701 67% -1% 39%
EBITDA 24 354 575 1,039 1,585 2,442 -38% 1374% -34%
EBITDA margin 2% 19% 39% 22% 37% 40% - - -
Other Income 25 20 8 106 28 410 156% -20% 283%
Interest & Finance Charges 610 1,147 325 2,082 954 1,281 253% 88% 118%
Depreciation 521 870 292 1,682 844 1,166 198% 67% 99%
Tax (287) - (7) (276) (98) (31)
PAT (Before Minority Interest) (795) (1,643) (27) (2,344) (87) 436
PAT (After Minority Interest) (428) (884) (15) (1,253) (44) 347
1
2
3
Increase in Non Aero Revenue is on account higher land & space , duty free, fuel farm income and other airport services
Increase in Total Expenditure is mainly on account of additional maintenance cost incurred in T-3.
Increase in Interest & Depreciation is on account of capitalization of T-3 in Q3-FY11.
1
2
3
8
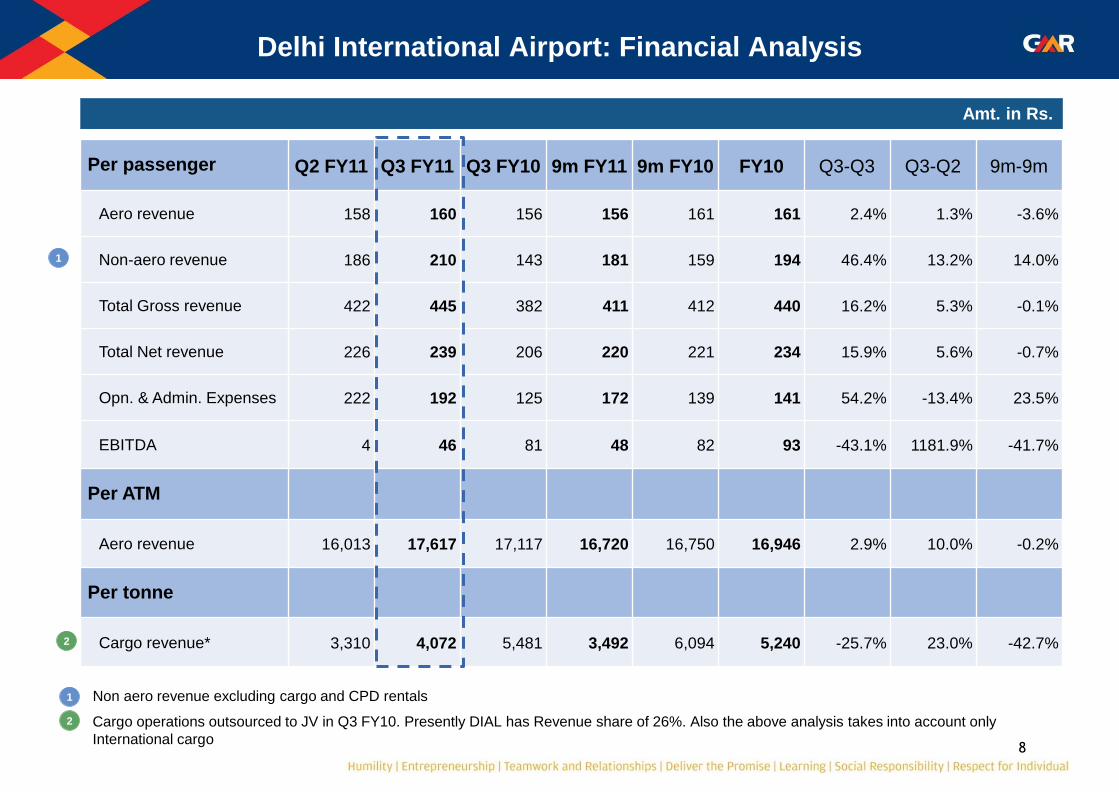
Non aero revenue excluding cargo and CPD rentals
Cargo operations outsourced to JV in Q3 FY10. Presently DIAL has Revenue share of 26%. Also the above analysis takes into account only
International cargo
Delhi International Airport: Financial Analysis
Amt. in Rs.
Per passenger Q2 FY11 Q3 FY11 Q3 FY10 9m FY11 9m FY10 FY10 Q3-Q3 Q3-Q2 9m-9m
Aero revenue 158 160 156 156 161 161 2.4% 1.3% -3.6%
Non-aero revenue 186 210 143 181 159 194 46.4% 13.2% 14.0%
Total Gross revenue 422 445 382 411 412 440 16.2% 5.3% -0.1%
Total Net revenue 226 239 206 220 221 234 15.9% 5.6% -0.7%
Opn. & Admin. Expenses 222 192 125 172 139 141 54.2% -13.4% 23.5%
EBITDA 4 46 81 48 82 93 -43.1% 1181.9% -41.7%
Per ATM
Aero revenue 16,013 17,617 17,117 16,720 16,750 16,946 2.9% 10.0% -0.2%
Per tonne
Cargo revenue* 3,310 4,072 5,481 3,492 6,094 5,240 -25.7% 23.0% -42.7%
1
2
1
2
9
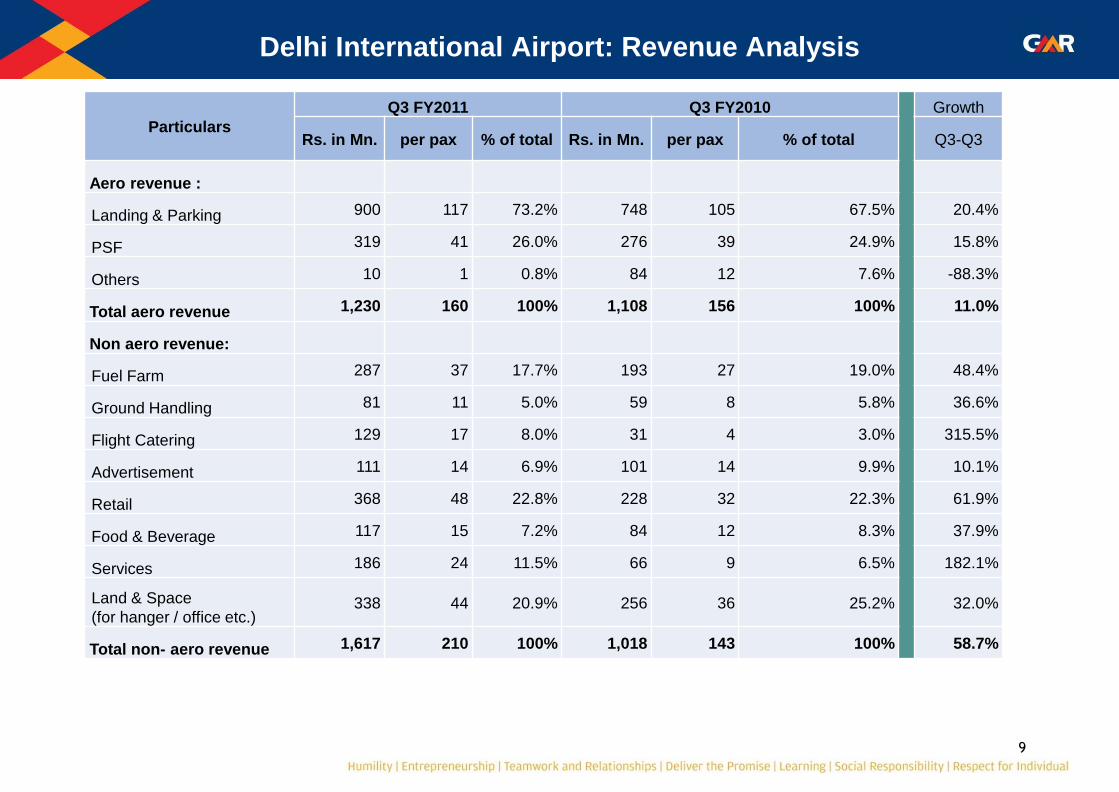
Delhi International Airport: Revenue Analysis
Particulars
Q3 FY2011 Q3 FY2010 Growth
Rs. in Mn. per pax % of total Rs. in Mn. per pax % of total Q3-Q3
Aero revenue :
Landing & Parking 900 117 73.2% 748 105 67.5% 20.4%
PSF 319 41 26.0% 276 39 24.9% 15.8%
Others 10 1 0.8% 84 12 7.6% -88.3%
Total aero revenue 1,230 160 100% 1,108 156 100% 11.0%
Non aero revenue:
Fuel Farm 287 37 17.7% 193 27 19.0% 48.4%
Ground Handling 81 11 5.0% 59 8 5.8% 36.6%
Flight Catering 129 17 8.0% 31 4 3.0% 315.5%
Advertisement 111 14 6.9% 101 14 9.9% 10.1%
Retail 368 48 22.8% 228 32 22.3% 61.9%
Food & Beverage 117 15 7.2% 84 12 8.3% 37.9%
Services 186 24 11.5% 66 9 6.5% 182.1%
Land & Space
(for hanger / office etc.) 338 44 20.9% 256 36 25.2% 32.0%
Total non- aero revenue 1,617 210 100% 1,018 143 100% 58.7%
10
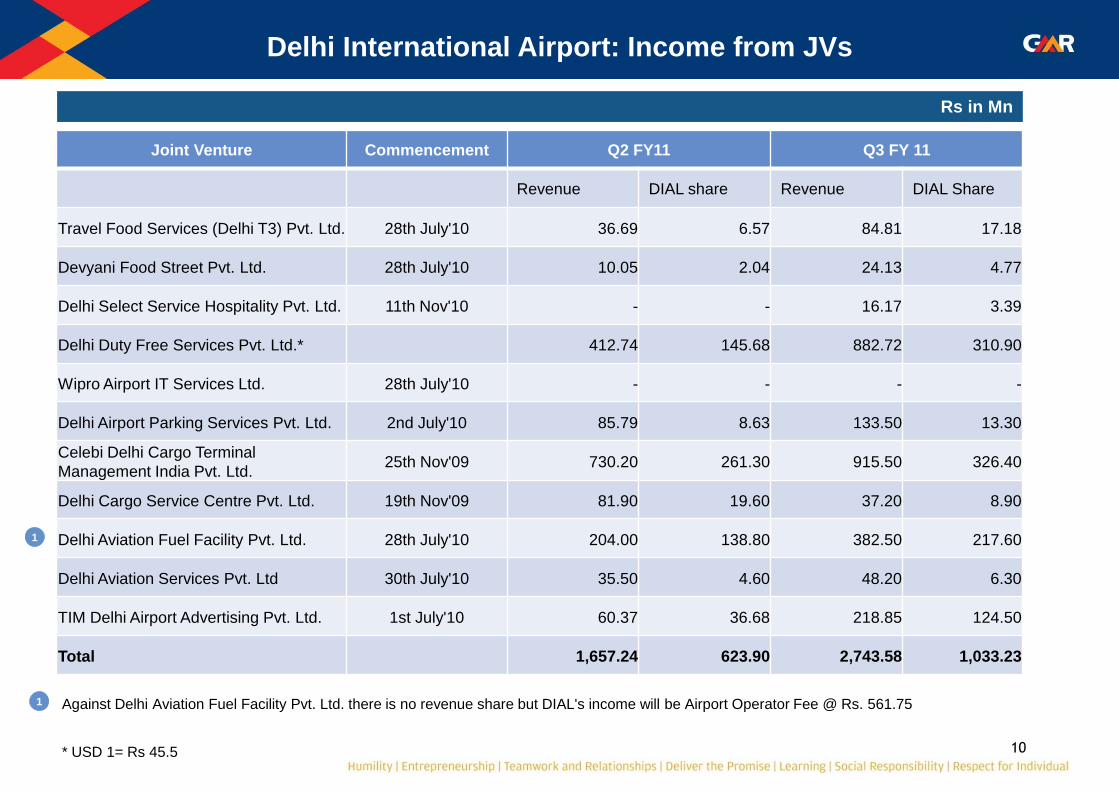
Delhi International Airport: Income from JVs
Joint Venture Commencement Q2 FY11 Q3 FY 11
Revenue DIAL share Revenue DIAL Share
Travel Food Services (Delhi T3) Pvt. Ltd. 28th July'10 36.69 6.57 84.81 17.18
Devyani Food Street Pvt. Ltd. 28th July'10 10.05 2.04 24.13 4.77
Delhi Select Service Hospitality Pvt. Ltd. 11th Nov'10 - - 16.17 3.39
Delhi Duty Free Services Pvt. Ltd.* 412.74 145.68 882.72 310.90
Wipro Airport IT Services Ltd. 28th July'10 - - - -
Delhi Airport Parking Services Pvt. Ltd. 2nd July'10 85.79 8.63 133.50 13.30
Celebi Delhi Cargo Terminal
Management India Pvt. Ltd. 25th Nov'09 730.20 261.30 915.50 326.40
Delhi Cargo Service Centre Pvt. Ltd. 19th Nov'09 81.90 19.60 37.20 8.90
Delhi Aviation Fuel Facility Pvt. Ltd. 28th July'10 204.00 138.80 382.50 217.60
Delhi Aviation Services Pvt. Ltd 30th July'10 35.50 4.60 48.20 6.30
TIM Delhi Airport Advertising Pvt. Ltd. 1st July'10 60.37 36.68 218.85 124.50
Total 1,657.24 623.90 2,743.58 1,033.23
Against Delhi Aviation Fuel Facility Pvt. Ltd. there is no revenue share but DIAL's income will be Airport Operator Fee @ Rs. 561.75
1
1
* USD 1= Rs 45.5
Rs in Mn

11
Hyderabad International Airport: Operational Performance
Traffic Q2-2011 Q3-2011 Q3-2010 9m-2011 9m-2010 FY 2010 Q3-Q3 Q3-Q2 9m-9m
Passenger (mn)
Arriving
Domestic 0.67 0.76 0.65 2.15 1.81 2.40 17.3% 9.2% 18.6%
International 0.24 0.26 0.22 0.73 0.66 0.90 17.2% 31.6% 11.4%
Departing
Domestic 0.66 0.77 0.64 2.11 1.78 2.40 20.3% 10.0% 19.1%
International 0.25 0.24 0.22 0.70 0.64 0.80 9.7% -20.8% 9.8%
Total Passengers 1.82 2.03 1.73 5.69 4.88 6.50 17.5% 13.1% 16.7%
ATMs (Nos`000)
Domestic 17.23 17.54 16.87 51.58 50.08 66.97 4.0% 1.8% 3.0%
International 3.56 3.66 3.63 10.54 10.18 13.58 0.8% 3.0% 3.6%
Total ATM's 20.78 21.20 20.50 62.12 60.26 80.55 3.4% 2.0% 3.1%
Cargo (`000 in Tons)
Inbound
Domestic 5.78 6.04 4.93 17.01 13.00 17.72 22.4% 4.4% 30.8%
International 3.55 3.55 2.33 10.15 7.24 10.24 52.2% 0.0% 40.2%
Outbound
Domestic 3.50 3.69 3.08 10.57 8.56 11.64 20.1% 5.7% 23.5%
International 7.65 7.67 7.04 22.72 19.76 26.88 9.0% 0.2% 14.9%
Total Cargo 20.48 20.95 17.38 60.46 48.57 66.48 20.6% 2.3% 24.5%

12
Particulars Metrics Capacity Peak demand handled Average
Air Traffic Movement (ATM) ATM per hour (No's) 42 24 11
Passenger capacity :
International Departure Pax per hour (No's) 1350 683 108
International Arrival Pax per hour (No's) 1125 868 129
Domestic Departure Pax per hour (No's) 2430 1128 370
Domestic Arrival Pax per hour (No's) 2800 1103 378
Cargo product range:
Imports Electrical & electronic goods, machinery & spare parts, pharma & chemical, computer parts, solar
cells, metal products, medical equipment's
Exports Pharma, fruits & vegetables, machinery & spare parts , garments & consolidated cargo
Hyderabad International Airport: Operational Analysis
13
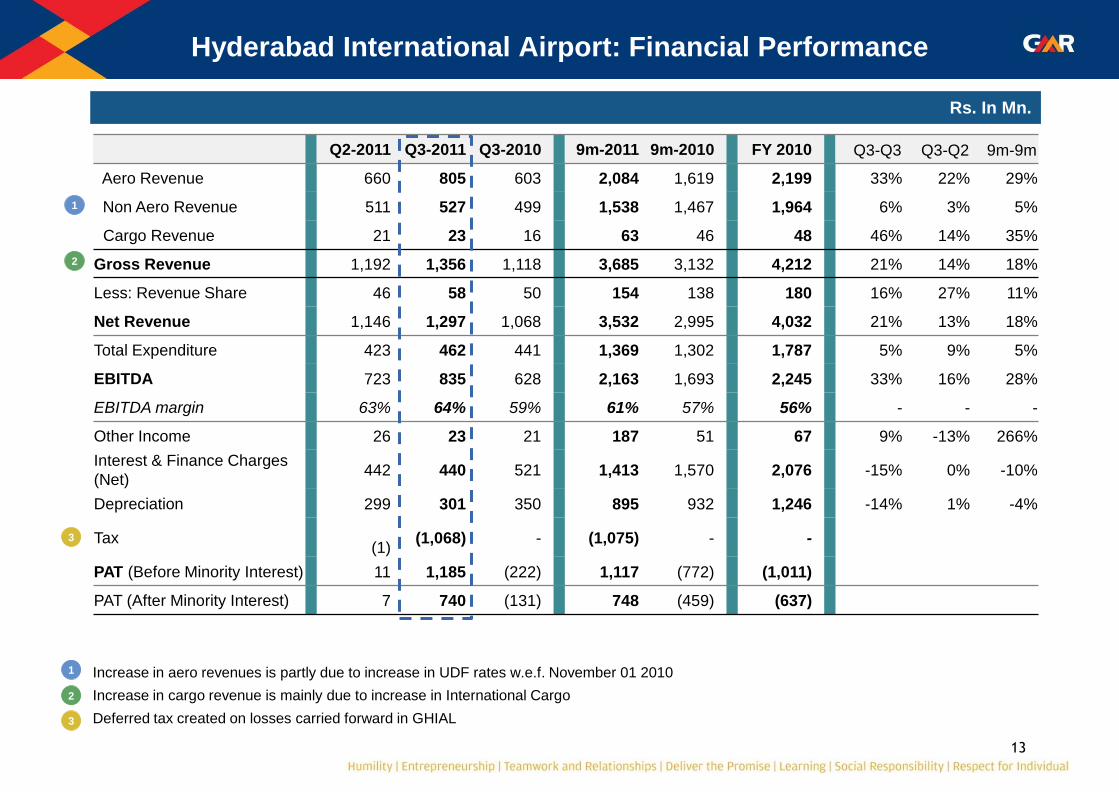
Hyderabad International Airport: Financial Performance
Rs. In Mn.
Q2-2011 Q3-2011 Q3-2010 9m-2011 9m-2010 FY 2010 Q3-Q3 Q3-Q2 9m-9m
Aero Revenue 660 805 603 2,084 1,619 2,199 33% 22% 29%
Non Aero Revenue 511 527 499 1,538 1,467 1,964 6% 3% 5%
Cargo Revenue 21 23 16 63 46 48 46% 14% 35%
Gross Revenue 1,192 1,356 1,118 3,685 3,132 4,212 21% 14% 18%
Less: Revenue Share 46 58 50 154 138 180 16% 27% 11%
Net Revenue 1,146 1,297 1,068 3,532 2,995 4,032 21% 13% 18%
Total Expenditure 423 462 441 1,369 1,302 1,787 5% 9% 5%
EBITDA 723 835 628 2,163 1,693 2,245 33% 16% 28%
EBITDA margin 63% 64% 59% 61% 57% 56% - - -
Other Income 26 23 21 187 51 67 9% -13% 266%
Interest & Finance Charges
(Net) 442 440 521 1,413 1,570 2,076 -15% 0% -10%
Depreciation 299 301 350 895 932 1,246 -14% 1% -4%
Tax
(1) (1,068) - (1,075) - -
PAT (Before Minority Interest) 11 1,185 (222) 1,117 (772) (1,011)
PAT (After Minority Interest) 7 740 (131) 748 (459) (637)
1
Increase in aero revenues is partly due to increase in UDF rates w.e.f. November 01 2010
Increase in cargo revenue is mainly due to increase in International Cargo
Deferred tax created on losses carried forward in GHIAL
1
2
2
3
3
14
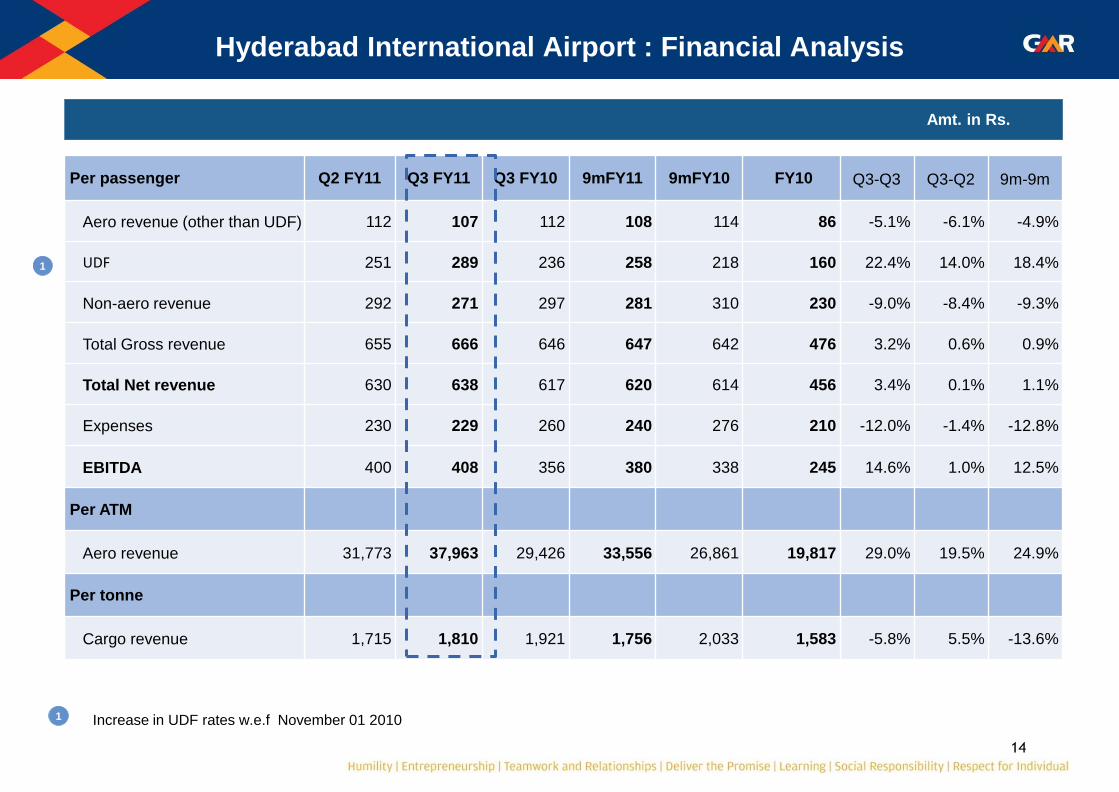
Hyderabad International Airport : Financial Analysis
Amt. in Rs.
Per passenger Q2 FY11 Q3 FY11 Q3 FY10 9mFY11 9mFY10 FY10 Q3-Q3 Q3-Q2 9m-9m
Aero revenue (other than UDF) 112 107 112 108 114 86 -5.1% -6.1% -4.9%
UDF 251 289 236 258 218 160 22.4% 14.0% 18.4%
Non-aero revenue 292 271 297 281 310 230 -9.0% -8.4% -9.3%
Total Gross revenue 655 666 646 647 642 476 3.2% 0.6% 0.9%
Total Net revenue 630 638 617 620 614 456 3.4% 0.1% 1.1%
Expenses 230 229 260 240 276 210 -12.0% -1.4% -12.8%
EBITDA 400 408 356 380 338 245 14.6% 1.0% 12.5%
Per ATM
Aero revenue 31,773 37,963 29,426 33,556 26,861 19,817 29.0% 19.5% 24.9%
Per tonne
Cargo revenue 1,715 1,810 1,921 1,756 2,033 1,583 -5.8% 5.5% -13.6%
Increase in UDF rates w.e.f November 01 2010
1
1
15
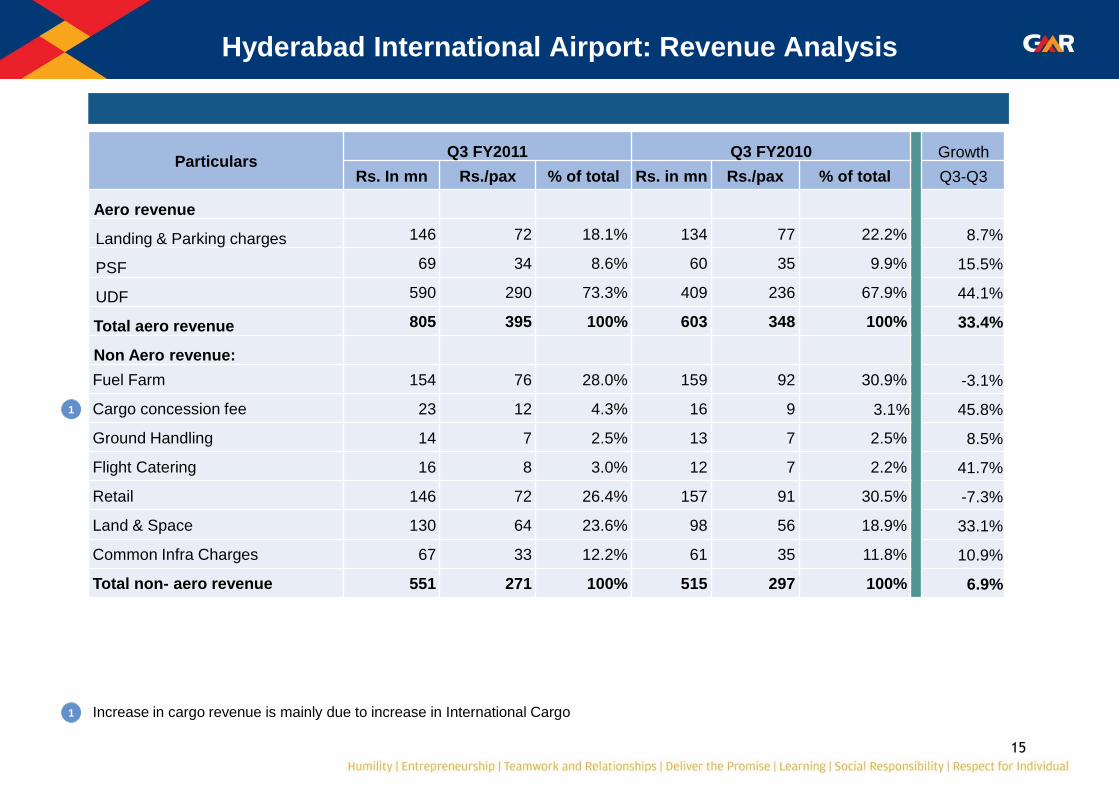
Hyderabad International Airport: Revenue Analysis
Particulars Q3 FY2011 Q3 FY2010 Growth
Rs. In mn Rs./pax % of total Rs. in mn Rs./pax % of total Q3-Q3
Aero revenue
Landing & Parking charges 146 72 18.1% 134 77 22.2% 8.7%
PSF 69 34 8.6% 60 35 9.9% 15.5%
UDF 590 290 73.3% 409 236 67.9% 44.1%
Total aero revenue 805 395 100% 603 348 100% 33.4%
Non Aero revenue:
Fuel Farm 154 76 28.0% 159 92 30.9% -3.1%
Cargo concession fee 23 12 4.3% 16 9 3.1% 45.8%
Ground Handling 14 7 2.5% 13 7 2.5% 8.5%
Flight Catering 16 8 3.0% 12 7 2.2% 41.7%
Retail 146 72 26.4% 157 91 30.5% -7.3%
Land & Space 130 64 23.6% 98 56 18.9% 33.1%
Common Infra Charges 67 33 12.2% 61 35 11.8% 10.9%
Total non- aero revenue 551 271 100% 515 297 100% 6.9%
1
Increase in cargo revenue is mainly due to increase in International Cargo
1
16
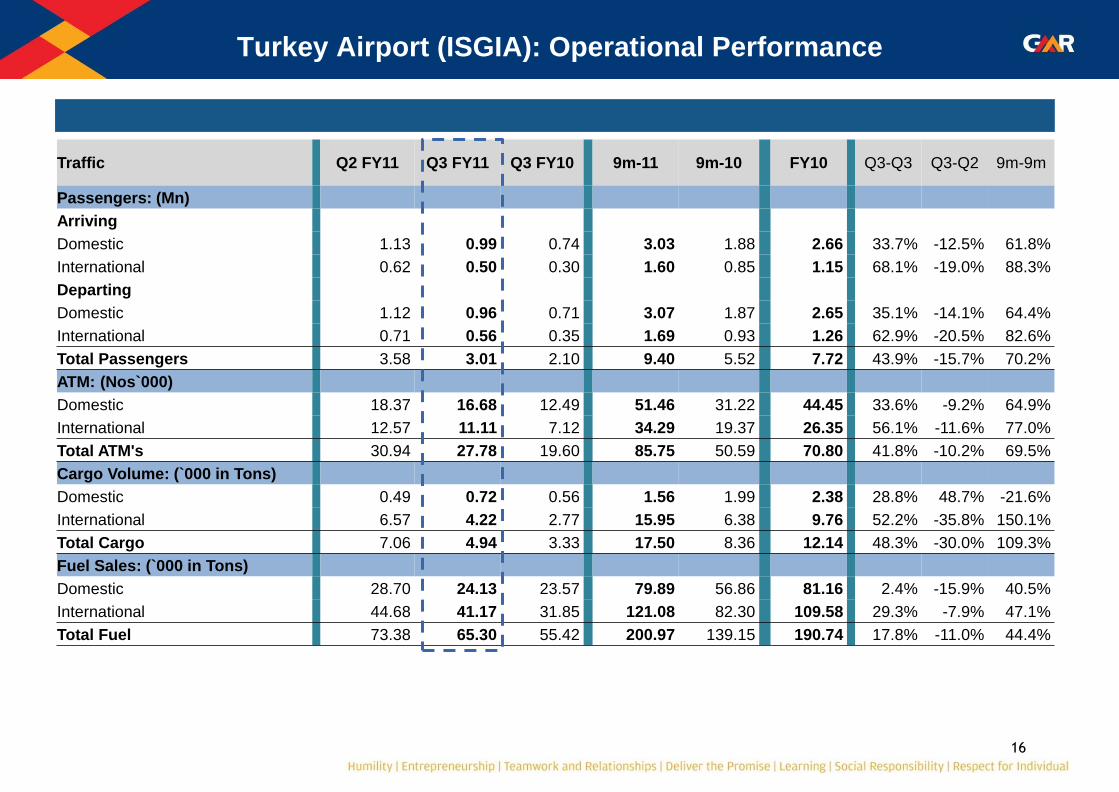
Turkey Airport (ISGIA): Operational Performance
Traffic Q2 FY11 Q3 FY11 Q3 FY10 9m-11 9m-10 FY10 Q3-Q3 Q3-Q2 9m-9m
Passengers: (Mn)
Arriving
Domestic 1.13 0.99 0.74 3.03 1.88 2.66 33.7% -12.5% 61.8%
International 0.62 0.50 0.30 1.60 0.85 1.15 68.1% -19.0% 88.3%
Departing
Domestic 1.12 0.96 0.71 3.07 1.87 2.65 35.1% -14.1% 64.4%
International 0.71 0.56 0.35 1.69 0.93 1.26 62.9% -20.5% 82.6%
Total Passengers 3.58 3.01 2.10 9.40 5.52 7.72 43.9% -15.7% 70.2%
ATM: (Nos`000)
Domestic 18.37 16.68 12.49 51.46 31.22 44.45 33.6% -9.2% 64.9%
International 12.57 11.11 7.12 34.29 19.37 26.35 56.1% -11.6% 77.0%
Total ATM's 30.94 27.78 19.60 85.75 50.59 70.80 41.8% -10.2% 69.5%
Cargo Volume: (`000 in Tons)
Domestic 0.49 0.72 0.56 1.56 1.99 2.38 28.8% 48.7% -21.6%
International 6.57 4.22 2.77 15.95 6.38 9.76 52.2% -35.8% 150.1%
Total Cargo 7.06 4.94 3.33 17.50 8.36 12.14 48.3% -30.0% 109.3%
Fuel Sales: (`000 in Tons)
Domestic 28.70 24.13 23.57 79.89 56.86 81.16 2.4% -15.9% 40.5%
International 44.68 41.17 31.85 121.08 82.30 109.58 29.3% -7.9% 47.1%
Total Fuel 73.38 65.30 55.42 200.97 139.15 190.74 17.8% -11.0% 44.4%
17
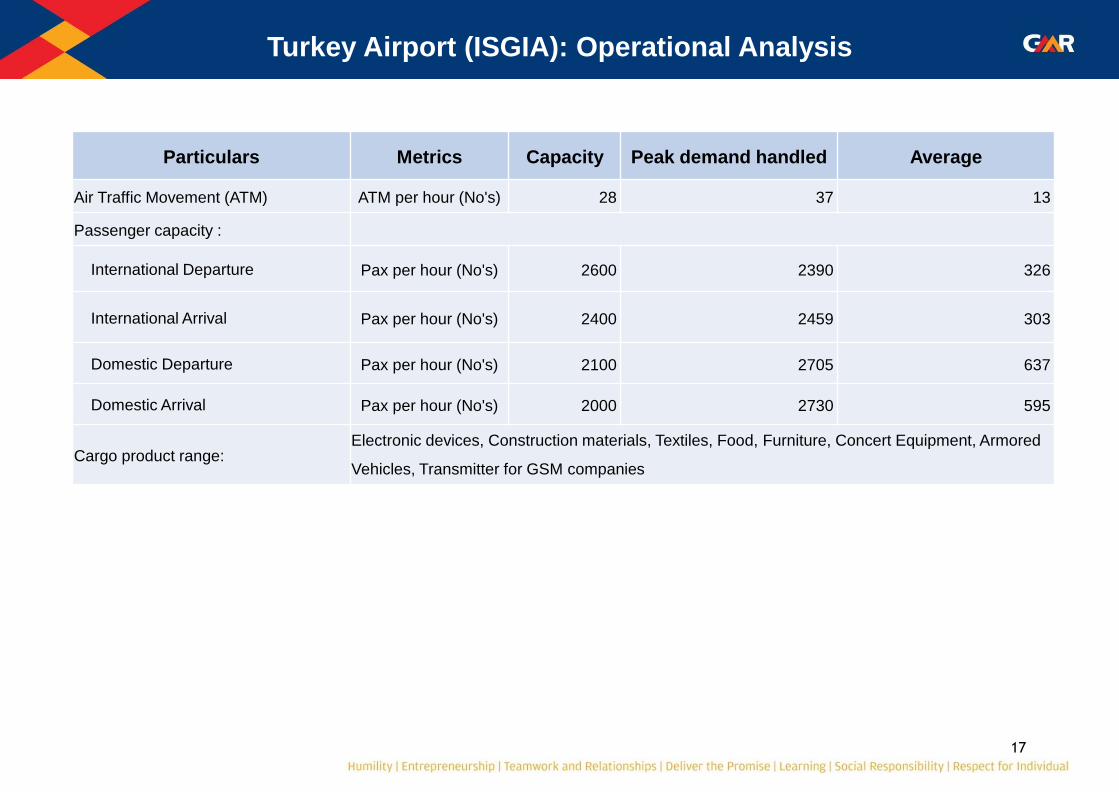
Particulars Metrics Capacity Peak demand handled Average
Air Traffic Movement (ATM) ATM per hour (No's) 28 37 13
Passenger capacity :
International Departure Pax per hour (No's) 2600 2390 326
International Arrival Pax per hour (No's) 2400 2459 303
Domestic Departure Pax per hour (No's) 2100 2705 637
Domestic Arrival Pax per hour (No's) 2000 2730 595
Cargo product range: Electronic devices, Construction materials, Textiles, Food, Furniture, Concert Equipment, Armored
Vehicles, Transmitter for GSM companies
Turkey Airport (ISGIA): Operational Analysis
18
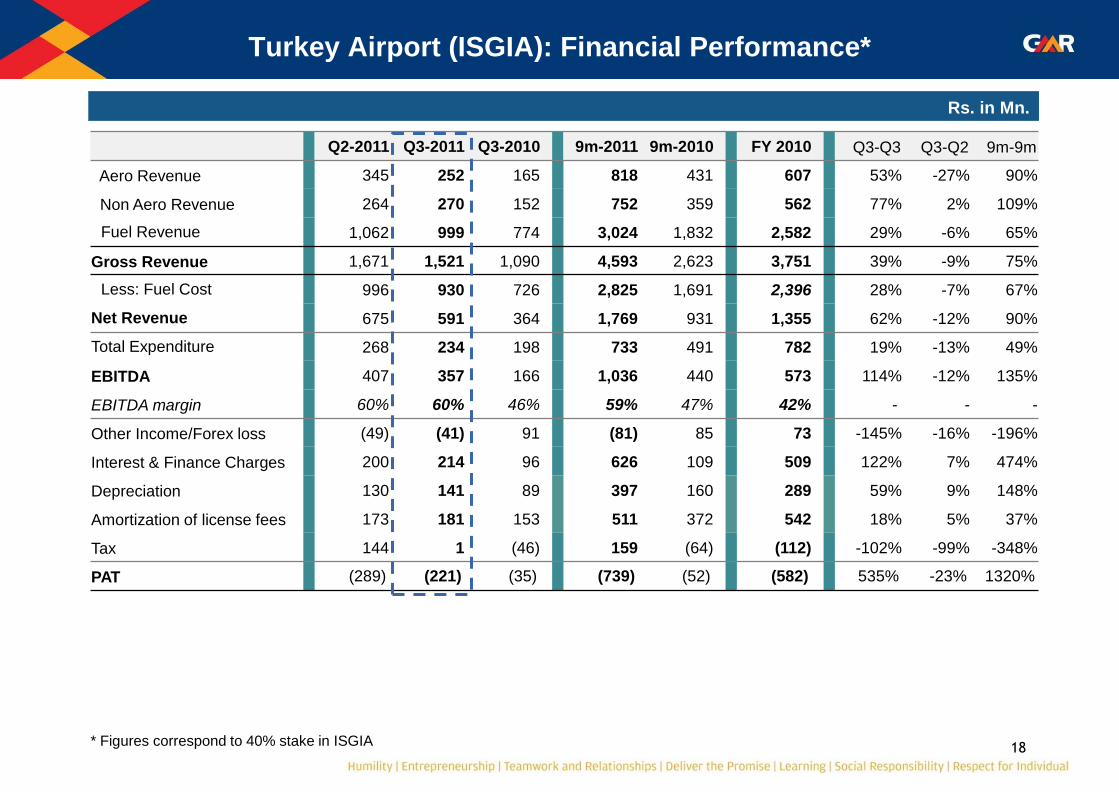
Turkey Airport (ISGIA): Financial Performance*
Rs. in Mn.
Q2-2011 Q3-2011 Q3-2010 9m-2011 9m-2010 FY 2010 Q3-Q3 Q3-Q2 9m-9m
Aero Revenue 345 252 165 818 431 607 53% -27% 90%
Non Aero Revenue 264 270 152 752 359 562 77% 2% 109%
Fuel Revenue 1,062 999 774 3,024 1,832 2,582 29% -6% 65%
Gross Revenue 1,671 1,521 1,090 4,593 2,623 3,751 39% -9% 75%
Less: Fuel Cost 996 930 726 2,825 1,691 2,396 28% -7% 67%
Net Revenue 675 591 364 1,769 931 1,355 62% -12% 90%
Total Expenditure 268 234 198 733 491 782 19% -13% 49%
EBITDA 407 357 166 1,036 440 573 114% -12% 135%
EBITDA margin 60% 60% 46% 59% 47% 42% - - -
Other Income/Forex loss (49) (41) 91 (81) 85 73 -145% -16% -196%
Interest & Finance Charges 200 214 96 626 109 509 122% 7% 474%
Depreciation 130 141 89 397 160 289 59% 9% 148%
Amortization of license fees 173 181 153 511 372 542 18% 5% 37%
Tax 144 1 (46) 159 (64) (112) -102% -99% -348%
PAT (289) (221) (35) (739) (52) (582) 535% -23% 1320%
* Figures correspond to 40% stake in ISGIA
19
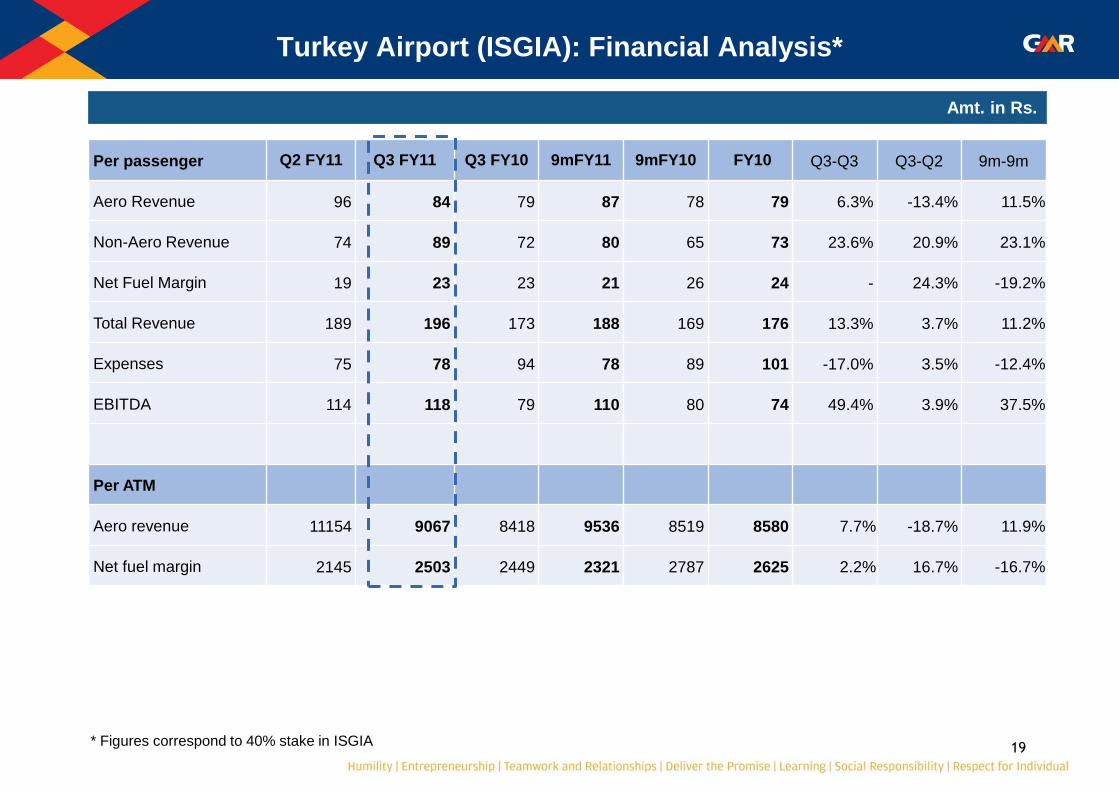
Turkey Airport (ISGIA): Financial Analysis*
Amt. in Rs.
Per passenger Q2 FY11 Q3 FY11 Q3 FY10 9mFY11 9mFY10 FY10 Q3-Q3 Q3-Q2 9m-9m
Aero Revenue 96 84 79 87 78 79 6.3% -13.4% 11.5%
Non-Aero Revenue 74 89 72 80 65 73 23.6% 20.9% 23.1%
Net Fuel Margin 19 23 23 21 26 24 - 24.3% -19.2%
Total Revenue 189 196 173 188 169 176 13.3% 3.7% 11.2%
Expenses 75 78 94 78 89 101 -17.0% 3.5% -12.4%
EBITDA 114 118 79 110 80 74 49.4% 3.9% 37.5%
Per ATM
Aero revenue 11154 9067 8418 9536 8519 8580 7.7% -18.7% 11.9%
Net fuel margin 2145 2503 2449 2321 2787 2625 2.2% 16.7% -16.7%
* Figures correspond to 40% stake in ISGIA
20
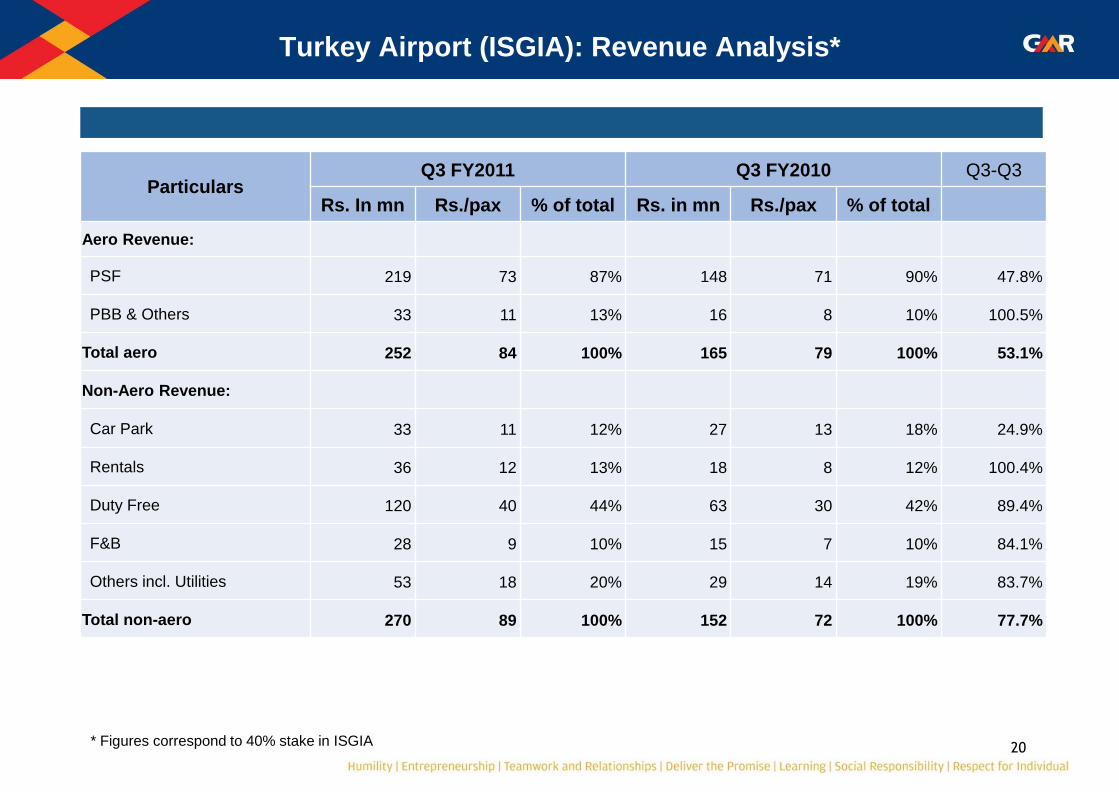
Turkey Airport (ISGIA): Revenue Analysis*
Particulars Q3 FY2011 Q3 FY2010 Q3-Q3
Rs. In mn Rs./pax % of total Rs. in mn Rs./pax % of total
Aero Revenue:
PSF 219 73 87% 148 71 90% 47.8%
PBB & Others 33 11 13% 16 8 10% 100.5%
Total aero 252 84 100% 165 79 100% 53.1%
Non-Aero Revenue:
Car Park 33 11 12% 27 13 18% 24.9%
Rentals 36 12 13% 18 8 12% 100.4%
Duty Free 120 40 44% 63 30 42% 89.4%
F&B 28 9 10% 15 7 10% 84.1%
Others incl. Utilities 53 18 20% 29 14 19% 83.7%
Total non-aero 270 89 100% 152 72 100% 77.7%
* Figures correspond to 40% stake in ISGIA

21
Male International Airport: Financial Performance*
Rs. in Mn.
Q3 FY 11 9mFY11
Aero Revenue 152 152
Non Aero Revenue 93 93
Fuel Revenue 704 704
Gross Revenue 949 949
Less: Fuel Cost 572 572
Less: Revenue Share 108 108
Net Revenue 269 269
Total Expenditure 206 206
EBITDA 64 64
EBITDA margin 24% 24%
Other Income 1 1
Interest & Finance Charges 27 27
Depreciation - -
Tax - -
PAT (Before Minority Interest) 38 38
PAT (After Minority interest) 29 29
* Male Airport consolidated w.e.f November 24 2010
22
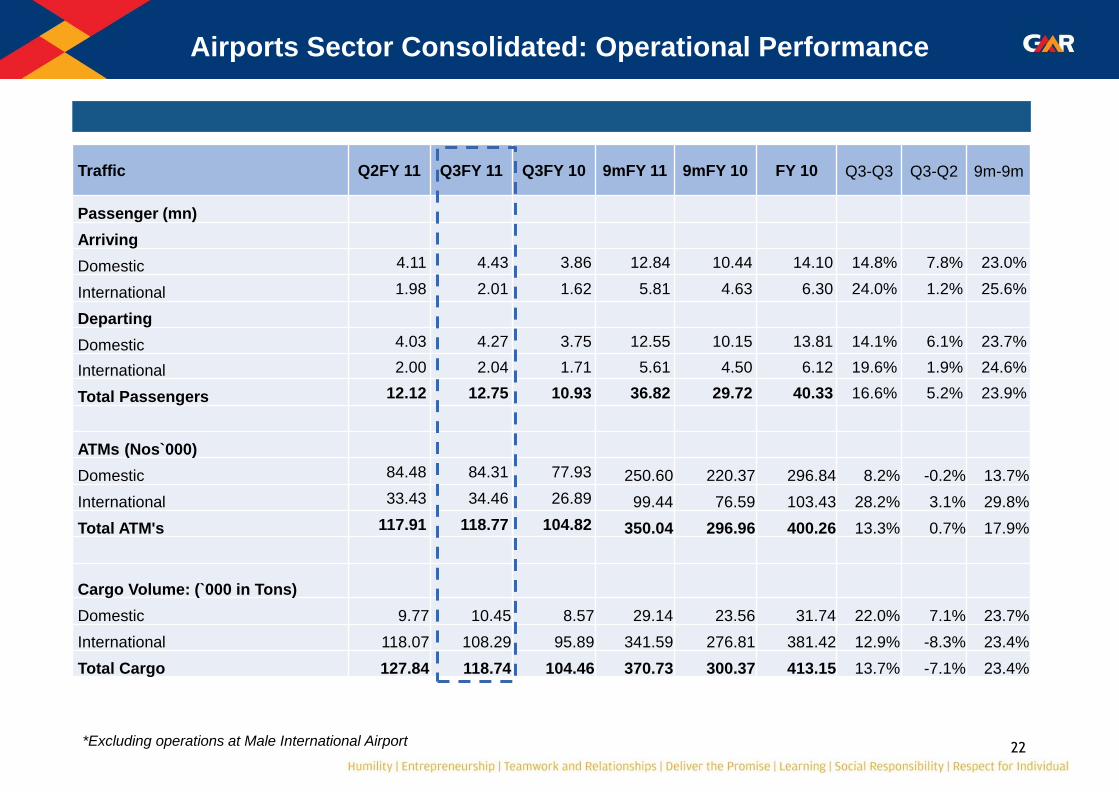
Airports Sector Consolidated: Operational Performance
Traffic Q2FY 11 Q3FY 11 Q3FY 10 9mFY 11 9mFY 10 FY 10 Q3-Q3 Q3-Q2 9m-9m
Passenger (mn)
Arriving
Domestic 4.11 4.43 3.86 12.84 10.44 14.10 14.8% 7.8% 23.0%
International 1.98 2.01 1.62 5.81 4.63 6.30 24.0% 1.2% 25.6%
Departing
Domestic 4.03 4.27 3.75 12.55 10.15 13.81 14.1% 6.1% 23.7%
International 2.00 2.04 1.71 5.61 4.50 6.12 19.6% 1.9% 24.6%
Total Passengers 12.12 12.75 10.93 36.82 29.72 40.33 16.6% 5.2% 23.9%
ATMs (Nos`000)
Domestic 84.48 84.31 77.93 250.60 220.37 296.84 8.2% -0.2% 13.7%
International 33.43 34.46 26.89 99.44 76.59 103.43 28.2% 3.1% 29.8%
Total ATM's 117.91 118.77 104.82 350.04 296.96 400.26 13.3% 0.7% 17.9%
Cargo Volume: (`000 in Tons)
Domestic 9.77 10.45 8.57 29.14 23.56 31.74 22.0% 7.1% 23.7%
International 118.07 108.29 95.89 341.59 276.81 381.42 12.9% -8.3% 23.4%
Total Cargo 127.84 118.74 104.46 370.73 300.37 413.15 13.7% -7.1% 23.4%
*Excluding operations at Male International Airport
23
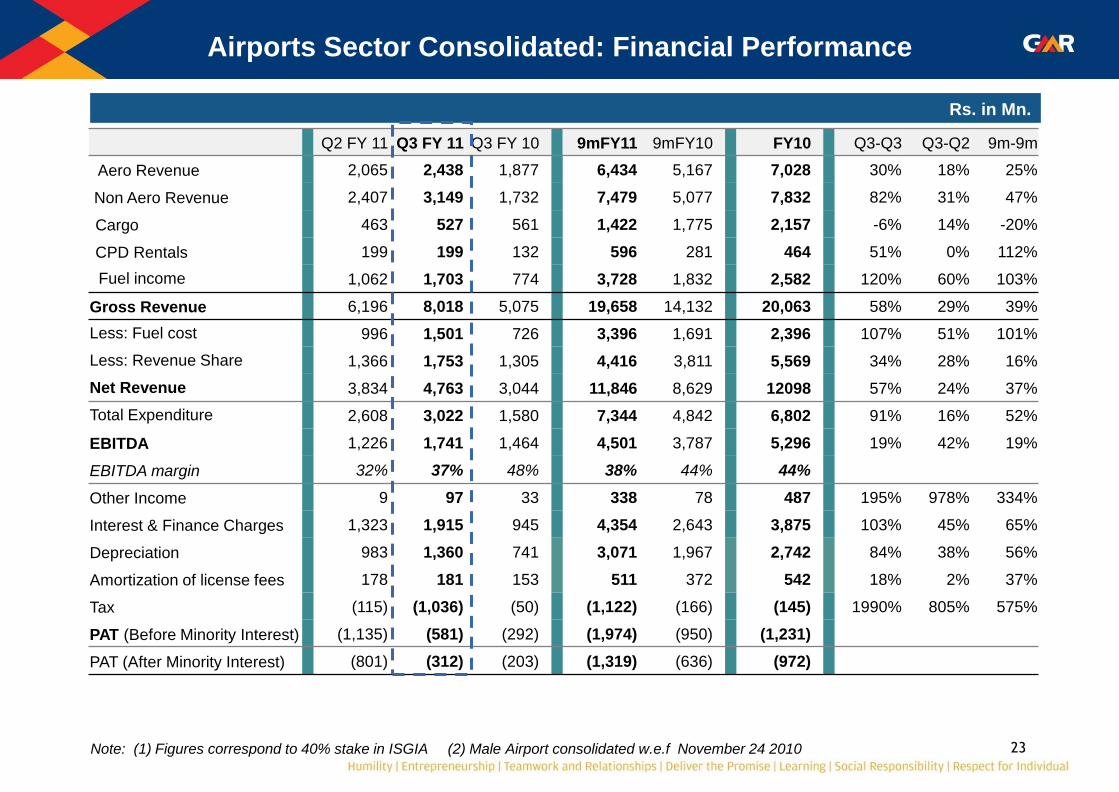
Airports Sector Consolidated: Financial Performance
Rs. in Mn.
Q2 FY 11 Q3 FY 11 Q3 FY 10 9mFY11 9mFY10 FY10 Q3-Q3 Q3-Q2 9m-9m
Aero Revenue 2,065 2,438 1,877 6,434 5,167 7,028 30% 18% 25%
Non Aero Revenue 2,407 3,149 1,732 7,479 5,077 7,832 82% 31% 47%
Cargo 463 527 561 1,422 1,775 2,157 -6% 14% -20%
CPD Rentals 199 199 132 596 281 464 51% 0% 112%
Fuel income 1,062 1,703 774 3,728 1,832 2,582 120% 60% 103%
Gross Revenue 6,196 8,018 5,075 19,658 14,132 20,063 58% 29% 39%
Less: Fuel cost 996 1,501 726 3,396 1,691 2,396 107% 51% 101%
Less: Revenue Share 1,366 1,753 1,305 4,416 3,811 5,569 34% 28% 16%
Net Revenue 3,834 4,763 3,044 11,846 8,629 12098 57% 24% 37%
Total Expenditure 2,608 3,022 1,580 7,344 4,842 6,802 91% 16% 52%
EBITDA 1,226 1,741 1,464 4,501 3,787 5,296 19% 42% 19%
EBITDA margin 32% 37% 48% 38% 44% 44%
Other Income 9 97 33 338 78 487 195% 978% 334%
Interest & Finance Charges 1,323 1,915 945 4,354 2,643 3,875 103% 45% 65%
Depreciation 983 1,360 741 3,071 1,967 2,742 84% 38% 56%
Amortization of license fees 178 181 153 511 372 542 18% 2% 37%
Tax (115) (1,036) (50) (1,122) (166) (145) 1990% 805% 575%
PAT (Before Minority Interest) (1,135) (581) (292) (1,974) (950) (1,231)
PAT (After Minority Interest) (801) (312) (203) (1,319) (636) (972)
Note: (1) Figures correspond to 40% stake in ISGIA (2) Male Airport consolidated w.e.f November 24 2010
Energy Sector
25
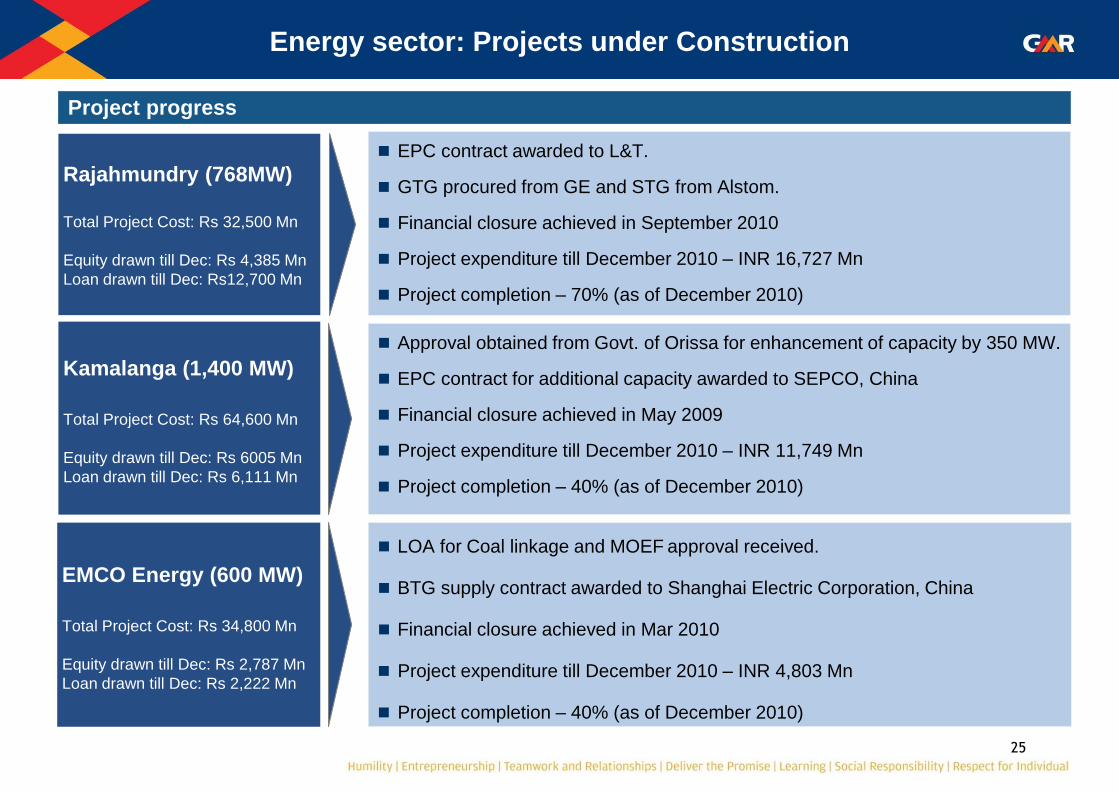
Energy sector: Projects under Construction
Project progress
EPC contract awarded to L&T.
GTG procured from GE and STG from Alstom.
Financial closure achieved in September 2010
Project expenditure till December 2010 – INR 16,727 Mn
Project completion – 70% (as of December 2010)
Rajahmundry (768MW)
Total Project Cost: Rs 32,500 Mn
Equity drawn till Dec: Rs 4,385 Mn
Loan drawn till Dec: Rs12,700 Mn
Kamalanga (1,400 MW)
Total Project Cost: Rs 64,600 Mn
Equity drawn till Dec: Rs 6005 Mn
Loan drawn till Dec: Rs 6,111 Mn
Approval obtained from Govt. of Orissa for enhancement of capacity by 350 MW.
EPC contract for additional capacity awarded to SEPCO, China
Financial closure achieved in May 2009
Project expenditure till December 2010 – INR 11,749 Mn
Project completion – 40% (as of December 2010)
1 CEA: Central Electricity Authority, 2 MOEF: Ministry of Environment and Forestry
LOA for Coal linkage and MOEF approval received.
BTG supply contract awarded to Shanghai Electric Corporation, China
Financial closure achieved in Mar 2010
Project expenditure till December 2010 – INR 4,803 Mn
Project completion – 40% (as of December 2010)
EMCO Energy (600 MW)
Total Project Cost: Rs 34,800 Mn
Equity drawn till Dec: Rs 2,787 Mn
Loan drawn till Dec: Rs 2,222 Mn

26
CEA concurrence received for DPR.
Environmental clearance received.
Forest clearance & Govt. land acquisition in progress.
Alaknanda (300 MW)
Other Hydro Projects
(1840 MW)
Environmental Clearance obtained and DPR submitted for CEA approval for
Bajoli Holi
Approval obtained from Govt. of Nepal for capacity enhancement of Upper
Karnali (900 MW) & Upper Marsyangdi (600 MW) projects - DPR under
finalization.
Transmission companies for Nepal projects established and DPR work
initiated
Energy sector: Projects under Development
Project progress
Chhattisgarh (1,370 MW)
Total Project Cost: Rs 82,900 Mn
Equity drawn till Dec; Rs 20 Mn
Loan drawn till Dec: Rs 10,764 Mn
EPC contract for BTG awarded to Doosan, Korea
Financial closure achieved in December 2010
Recommended for Coal Linkage by CEA
Project expenditure till December 2010 – INR 10,825 Mn
Project completion – 23% (as of December 2010)
27
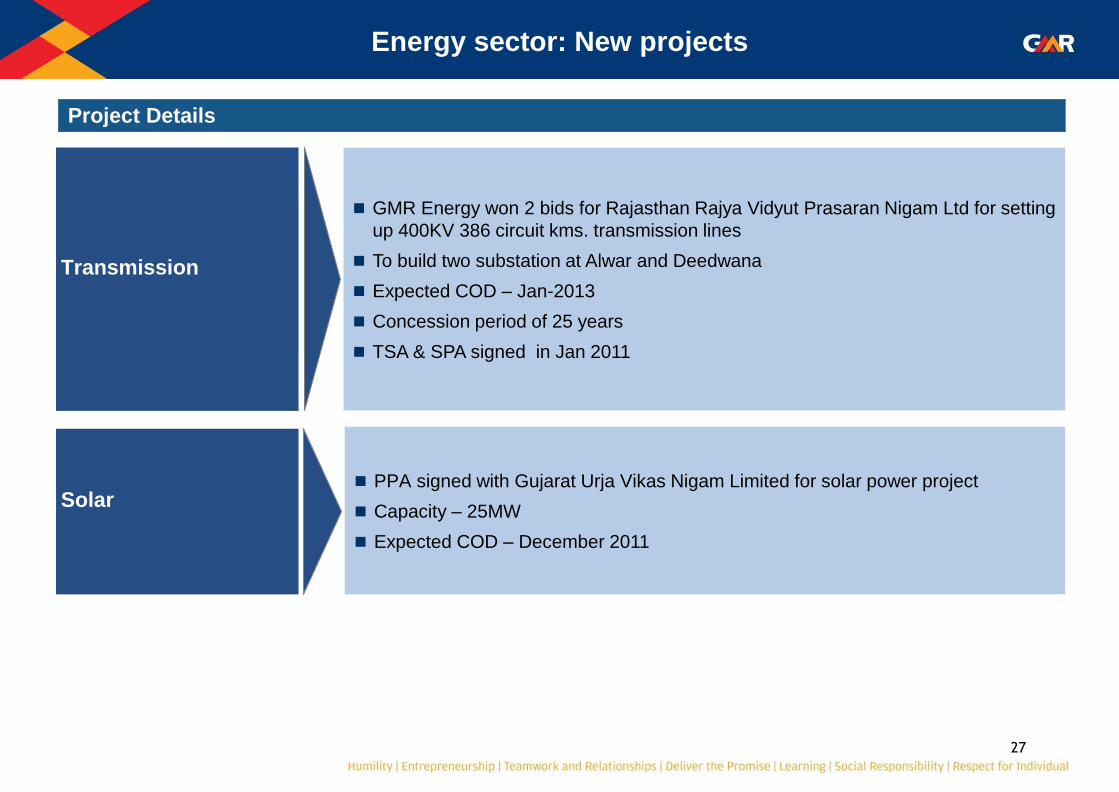
Energy sector: New projects
Project Details
Transmission
GMR Energy won 2 bids for Rajasthan Rajya Vidyut Prasaran Nigam Ltd for setting
up 400KV 386 circuit kms. transmission lines
To build two substation at Alwar and Deedwana
Expected COD – Jan-2013
Concession period of 25 years
TSA & SPA signed in Jan 2011
Solar
PPA signed with Gujarat Urja Vikas Nigam Limited for solar power project
Capacity – 25MW
Expected COD – December 2011

28
GPCPL (Chennai) – Tamil Nadu
Particulars UOM Q2-2011 Q3-2011 Q3-2010 9m-2011 9m-2010 FY 2010
PLF Achieved % 40 38 46 47 78 68
Power off take (PPA) MU 175 166 203 612 902 1,180
Fuel Consumption MT 33,971 31,948 39,152 118,269 172,939 226,259
VPGL (Vemagiri) – Andhra Pradesh
Particulars UOM Q2-2011 Q3-2011 Q3-2010 9m-2011 9m-2010 FY 2010
PLF Achieved % 90 76 87 82 85 86
Power off take (PPA) MU 772 647 747 2,100 2,165 2,917
Fuel Consumption MMBTU 5,387,561 4,543,432 5,204,613 14,691,180 15,100,933 20,322,180
GEL (Barge mounted) – Andhra Pradesh
Particulars UOM Q2-2011 Q3-2011 Q3-2010 9m-2011 9m-2010 FY 2010
PLF Achieved % 46 66 31 56 28 28
Power off take (Merchant) MU 255 343 100 598 361 361
Fuel Consumption MMBTU 2,089,169 2,512,503 - 4,717,951 - -
Energy Sector: Operational Performance
1
Lower PLF in GPCPL is due to lower demand from TNEB
Lower PLF in gas based plants is due to lower fall back gas allocation from RIL
GEL was converted from naptha fuel to gas fuel in Q2 FY 2011.
1
2
2
3
3
29
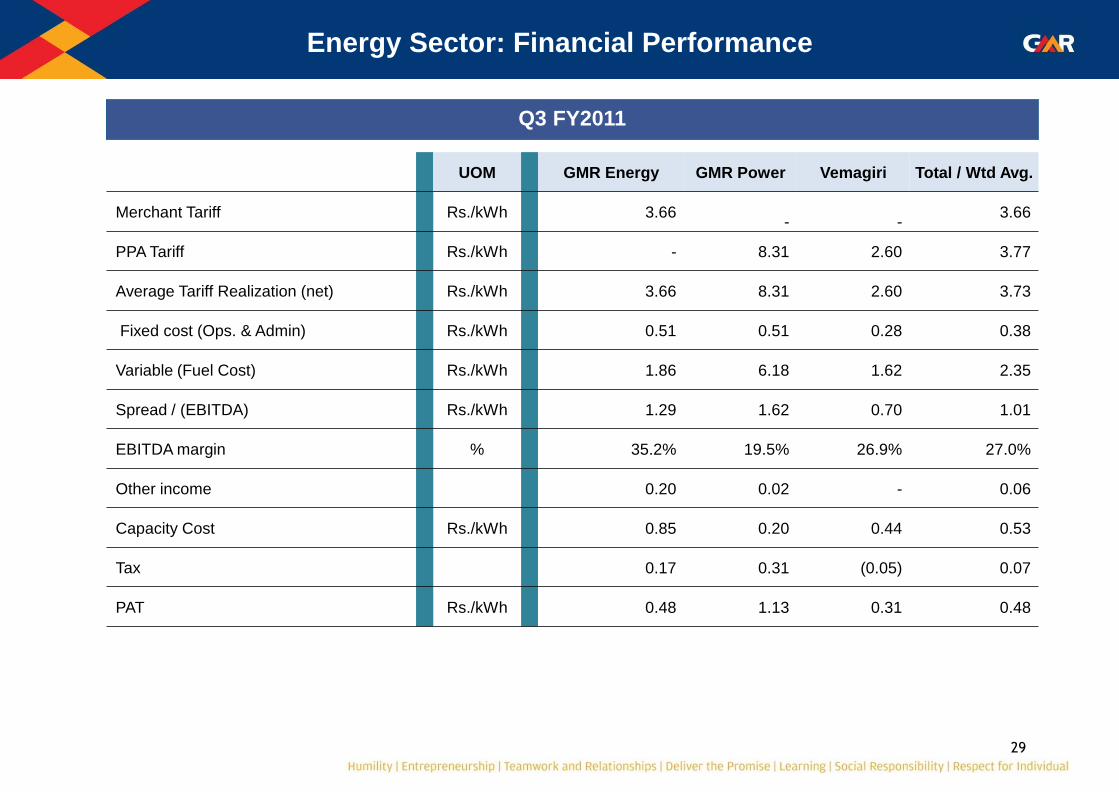
Energy Sector: Financial Performance
Q3 FY2011
UOM GMR Energy GMR Power Vemagiri Total / Wtd Avg.
Merchant Tariff Rs./kWh 3.66
-
- 3.66
PPA Tariff Rs./kWh - 8.31 2.60 3.77
Average Tariff Realization (net) Rs./kWh 3.66 8.31 2.60 3.73
Fixed cost (Ops. & Admin) Rs./kWh 0.51 0.51 0.28 0.38
Variable (Fuel Cost) Rs./kWh 1.86 6.18 1.62 2.35
Spread / (EBITDA) Rs./kWh 1.29 1.62 0.70 1.01
EBITDA margin % 35.2% 19.5% 26.9% 27.0%
Other income 0.20 0.02 - 0.06
Capacity Cost Rs./kWh 0.85 0.20 0.44 0.53
Tax 0.17 0.31 (0.05) 0.07
PAT Rs./kWh 0.48 1.13 0.31 0.48
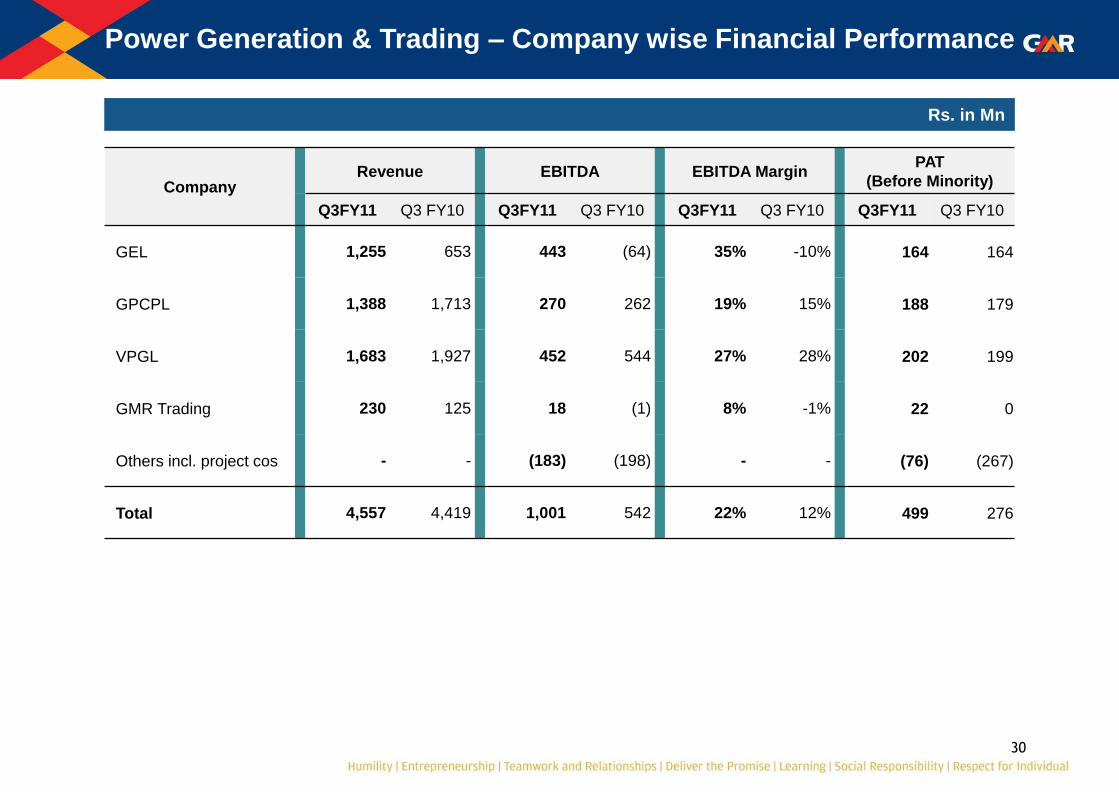
30
Company Revenue EBITDA EBITDA Margin
PAT
(Before Minority)
Q3FY11 Q3 FY10 Q3FY11 Q3 FY10 Q3FY11 Q3 FY10 Q3FY11 Q3 FY10
GEL 1,255 653 443 (64) 35% -10% 164 164
GPCPL 1,388 1,713 270 262 19% 15% 188 179
VPGL 1,683 1,927 452 544 27% 28% 202 199
GMR Trading 230 125 18 (1) 8% -1% 22 0
Others incl. project cos - - (183) (198) - - (76) (267)
Total 4,557 4,419 1,001 542 22% 12% 499 276
Power Generation & Trading – Company wise Financial Performance
Rs. in Mn
31
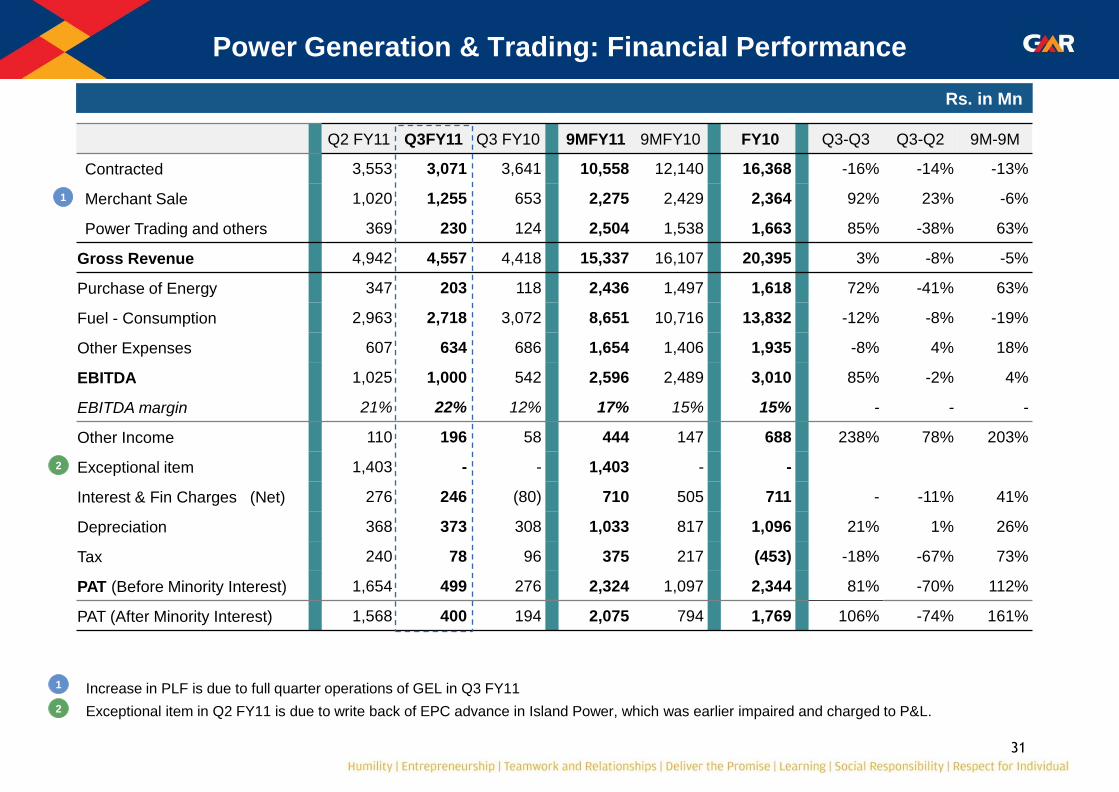
Power Generation & Trading: Financial Performance
Rs. in Mn
Q2 FY11 Q3FY11 Q3 FY10 9MFY11 9MFY10 FY10 Q3-Q3 Q3-Q2 9M-9M
Contracted 3,553 3,071 3,641 10,558 12,140 16,368 -16% -14% -13%
Merchant Sale 1,020 1,255 653 2,275 2,429 2,364 92% 23% -6%
Power Trading and others 369 230 124 2,504 1,538 1,663 85% -38% 63%
Gross Revenue 4,942 4,557 4,418 15,337 16,107 20,395 3% -8% -5%
Purchase of Energy 347 203 118 2,436 1,497 1,618 72% -41% 63%
Fuel - Consumption 2,963 2,718 3,072 8,651 10,716 13,832 -12% -8% -19%
Other Expenses 607 634 686 1,654 1,406 1,935 -8% 4% 18%
EBITDA 1,025 1,000 542 2,596 2,489 3,010 85% -2% 4%
EBITDA margin 21% 22% 12% 17% 15% 15% - - -
Other Income 110 196 58 444 147 688 238% 78% 203%
Exceptional item 1,403 - - 1,403 - -
Interest & Fin Charges (Net) 276 246 (80) 710 505 711 - -11% 41%
Depreciation 368 373 308 1,033 817 1,096 21% 1% 26%
Tax 240 78 96 375 217 (453) -18% -67% 73%
PAT (Before Minority Interest) 1,654 499 276 2,324 1,097 2,344 81% -70% 112%
PAT (After Minority Interest) 1,568 400 194 2,075 794 1,769 106% -74% 161%
1
Increase in PLF is due to full quarter operations of GEL in Q3 FY11
Exceptional item in Q2 FY11 is due to write back of EPC advance in Island Power, which was earlier impaired and charged to P&L.
1
2
2
32
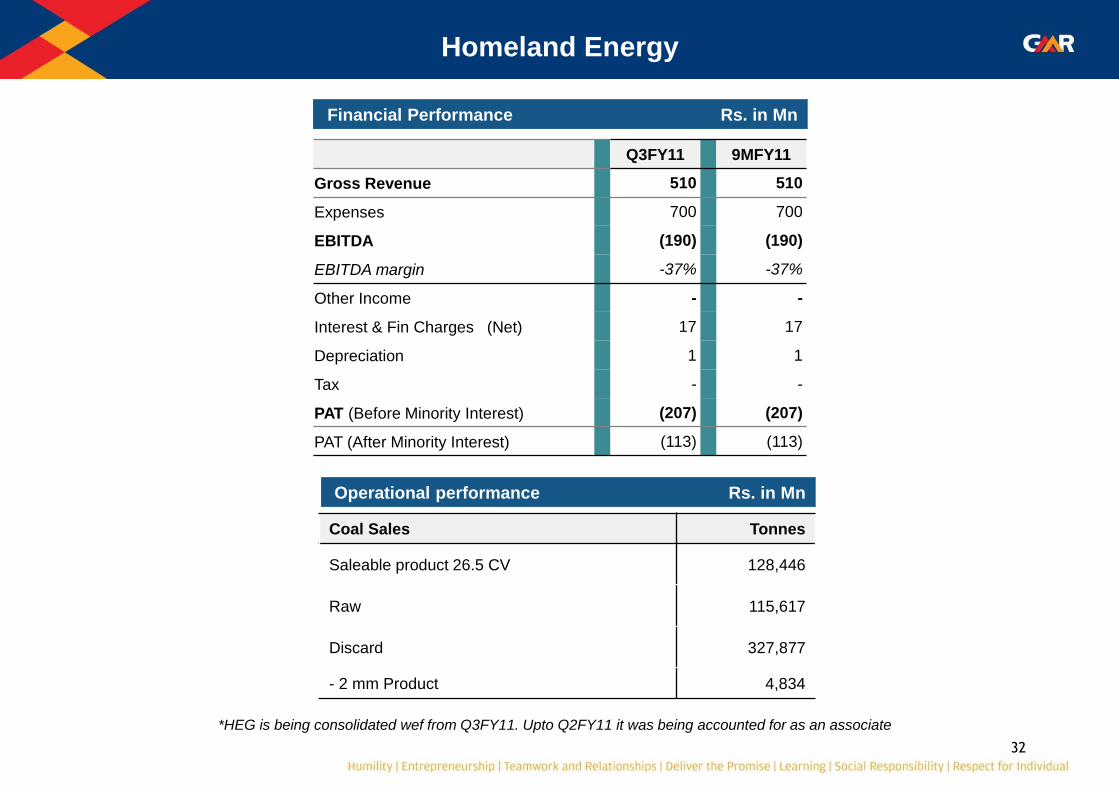
Homeland Energy
Financial Performance Rs. in Mn
Q3FY11 9MFY11
Gross Revenue 510 510
Expenses 700 700
EBITDA (190) (190)
EBITDA margin -37% -37%
Other Income - -
Interest & Fin Charges (Net) 17 17
Depreciation 1 1
Tax - -
PAT (Before Minority Interest) (207) (207)
PAT (After Minority Interest) (113) (113)
*HEG is being consolidated wef from Q3FY11. Upto Q2FY11 it was being accounted for as an associate
Coal Sales Tonnes
Saleable product 26.5 CV 128,446
Raw 115,617
Discard 327,877
- 2 mm Product 4,834
Operational performance Rs. in Mn
33
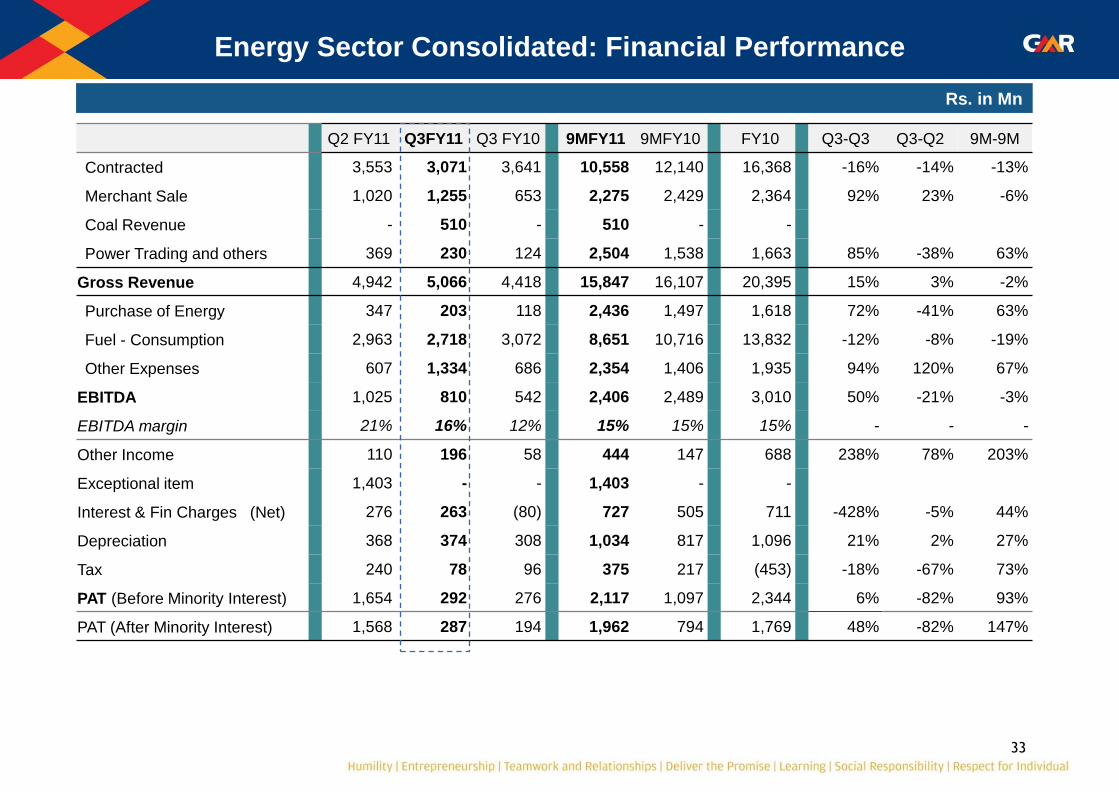
Energy Sector Consolidated: Financial Performance
Rs. in Mn
Q2 FY11 Q3FY11 Q3 FY10 9MFY11 9MFY10 FY10 Q3-Q3 Q3-Q2 9M-9M
Contracted 3,553 3,071 3,641 10,558 12,140 16,368 -16% -14% -13%
Merchant Sale 1,020 1,255 653 2,275 2,429 2,364 92% 23% -6%
Coal Revenue - 510 - 510 - -
Power Trading and others 369 230 124 2,504 1,538 1,663 85% -38% 63%
Gross Revenue 4,942 5,066 4,418 15,847 16,107 20,395 15% 3% -2%
Purchase of Energy 347 203 118 2,436 1,497 1,618 72% -41% 63%
Fuel - Consumption 2,963 2,718 3,072 8,651 10,716 13,832 -12% -8% -19%
Other Expenses 607 1,334 686 2,354 1,406 1,935 94% 120% 67%
EBITDA 1,025 810 542 2,406 2,489 3,010 50% -21% -3%
EBITDA margin 21% 16% 12% 15% 15% 15% - - -
Other Income 110 196 58 444 147 688 238% 78% 203%
Exceptional item 1,403 - - 1,403 - -
Interest & Fin Charges (Net) 276 263 (80) 727 505 711 -428% -5% 44%
Depreciation 368 374 308 1,034 817 1,096 21% 2% 27%
Tax 240 78 96 375 217 (453) -18% -67% 73%
PAT (Before Minority Interest) 1,654 292 276 2,117 1,097 2,344 6% -82% 93%
PAT (After Minority Interest) 1,568 287 194 1,962 794 1,769 48% -82% 147%
Highways & Urban Infrastructure Sectors
35
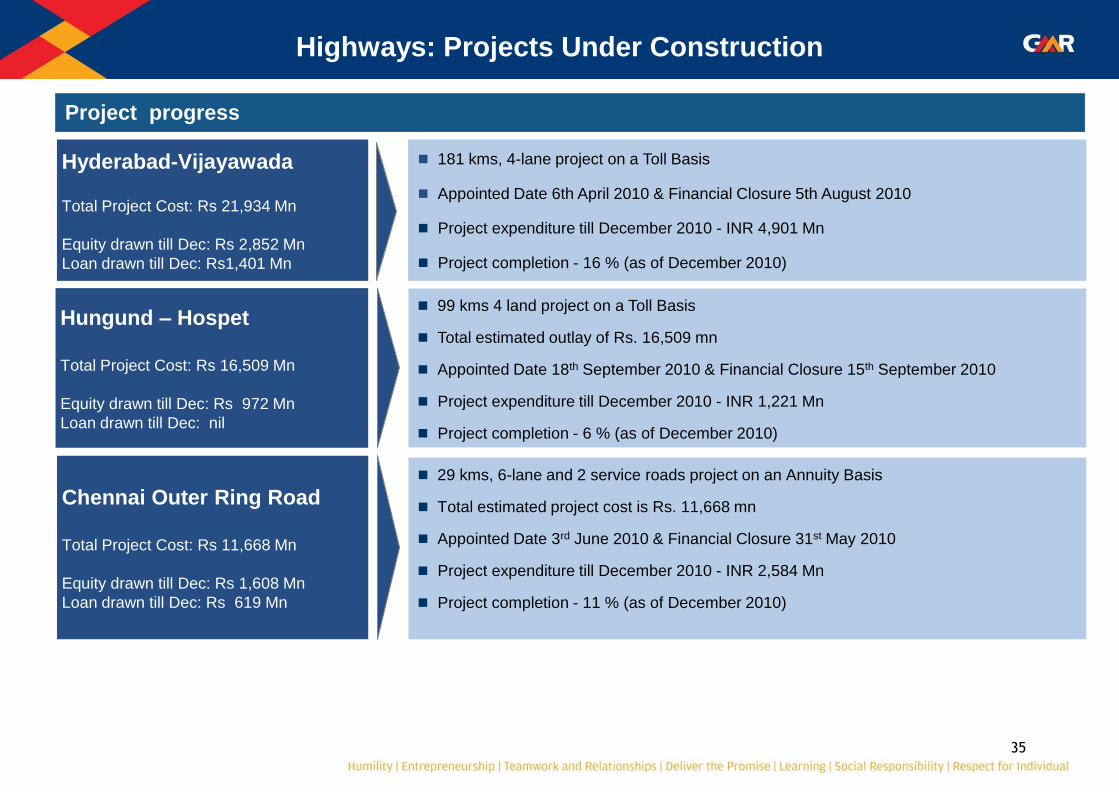
Highways: Projects Under Construction
Project progress
Hyderabad-Vijayawada Total Project Cost: Rs 21,934 Mn
Equity drawn till Dec: Rs 2,852 Mn
Loan drawn till Dec: Rs1,401 Mn
181 kms, 4-lane project on a Toll Basis
Appointed Date 6th April 2010 & Financial Closure 5th August 2010
Project expenditure till December 2010 - INR 4,901 Mn
Project completion - 16 % (as of December 2010)
99 kms 4 land project on a Toll Basis
Total estimated outlay of Rs. 16,509 mn
Appointed Date 18th September 2010 & Financial Closure 15th September 2010
Project expenditure till December 2010 - INR 1,221 Mn
Project completion - 6 % (as of December 2010)
Hungund – Hospet
Total Project Cost: Rs 16,509 Mn
Equity drawn till Dec: Rs 972 Mn
Loan drawn till Dec: nil
29 kms, 6-lane and 2 service roads project on an Annuity Basis
Total estimated project cost is Rs. 11,668 mn
Appointed Date 3rd June 2010 & Financial Closure 31st May 2010
Project expenditure till December 2010 - INR 2,584 Mn
Project completion - 11 % (as of December 2010)
Chennai Outer Ring Road
Total Project Cost: Rs 11,668 Mn
Equity drawn till Dec: Rs 1,608 Mn
Loan drawn till Dec: Rs 619 Mn
36
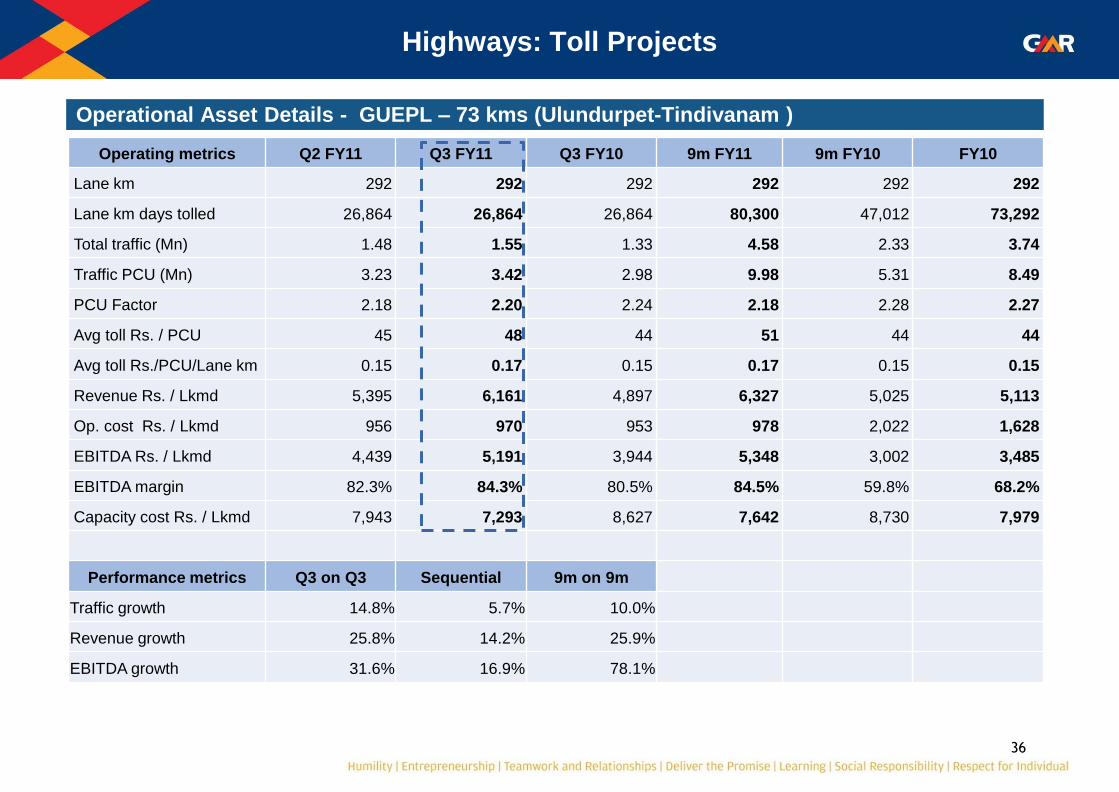
Highways: Toll Projects
Operational Asset Details - GUEPL – 73 kms (Ulundurpet-Tindivanam )
Operating metrics Q2 FY11 Q3 FY11 Q3 FY10 9m FY11 9m FY10 FY10
Lane km 292 292 292 292 292 292
Lane km days tolled 26,864 26,864 26,864 80,300 47,012 73,292
Total traffic (Mn) 1.48 1.55 1.33 4.58 2.33 3.74
Traffic PCU (Mn) 3.23 3.42 2.98 9.98 5.31 8.49
PCU Factor 2.18 2.20 2.24 2.18 2.28 2.27
Avg toll Rs. / PCU 45 48 44 51 44 44
Avg toll Rs./PCU/Lane km 0.15 0.17 0.15 0.17 0.15 0.15
Revenue Rs. / Lkmd 5,395 6,161 4,897 6,327 5,025 5,113
Op. cost Rs. / Lkmd 956 970 953 978 2,022 1,628
EBITDA Rs. / Lkmd 4,439 5,191 3,944 5,348 3,002 3,485
EBITDA margin 82.3% 84.3% 80.5% 84.5% 59.8% 68.2%
Capacity cost Rs. / Lkmd 7,943 7,293 8,627 7,642 8,730 7,979
Performance metrics Q3 on Q3 Sequential 9m on 9m
Traffic growth 14.8% 5.7% 10.0%
Revenue growth 25.8% 14.2% 25.9%
EBITDA growth 31.6% 16.9% 78.1%

37
Operational Asset Details - GJEPL – 58 kms (Jadcherla)
Highways: Toll Projects
Operating metrics Q2 FY11 Q3 FY11 Q3 FY10 9m FY11 9m FY10 FY10
Lane km 232 232 232 232 232 232
Lane km days tolled 21,344 21,344 21,344 63,800 63,800 84,680
Total traffic (Mn) 1.27 1.40 1.15 4.00 3.23 4.45
Traffic PCU ( Mn) 2.86 3.13 2.58 8.93 7.43 10.29
PCU Factor 2.26 2.23 2.25 2.23 2.30 2.31
Avg toll Rs. / PCU 41 44 40 42 42 41
Avg toll Rs./PCU/Lane km 0.18 0.19 0.17 0.18 0.18 0.18
Revenue Rs. / Lkmd 5,562 6,515 4,823 5,880 4,874 4,934
Op. cost Rs. / Lkmd 1,082 957 1,136 1,095 1,092 1,120
EBITDA Rs. / Lkmd 4,480 5,558 3,687 4,785 3,782 3,814
EBITDA margin 80.5% 85.3% 76.5% 81.4% 77.6% 77.3%
Capacity cost Rs. / Lkmd 6,300 6,009 6,374 6,074 6,374 6,438
Performance metrics Q3 on Q3 Sequential 9m on 9m
Traffic growth 21.4% 9.3% 20.2%
Revenue growth 35.1% 17.1% 20.6%
EBITDA growth 50.7% 24.1% 26.5%
38
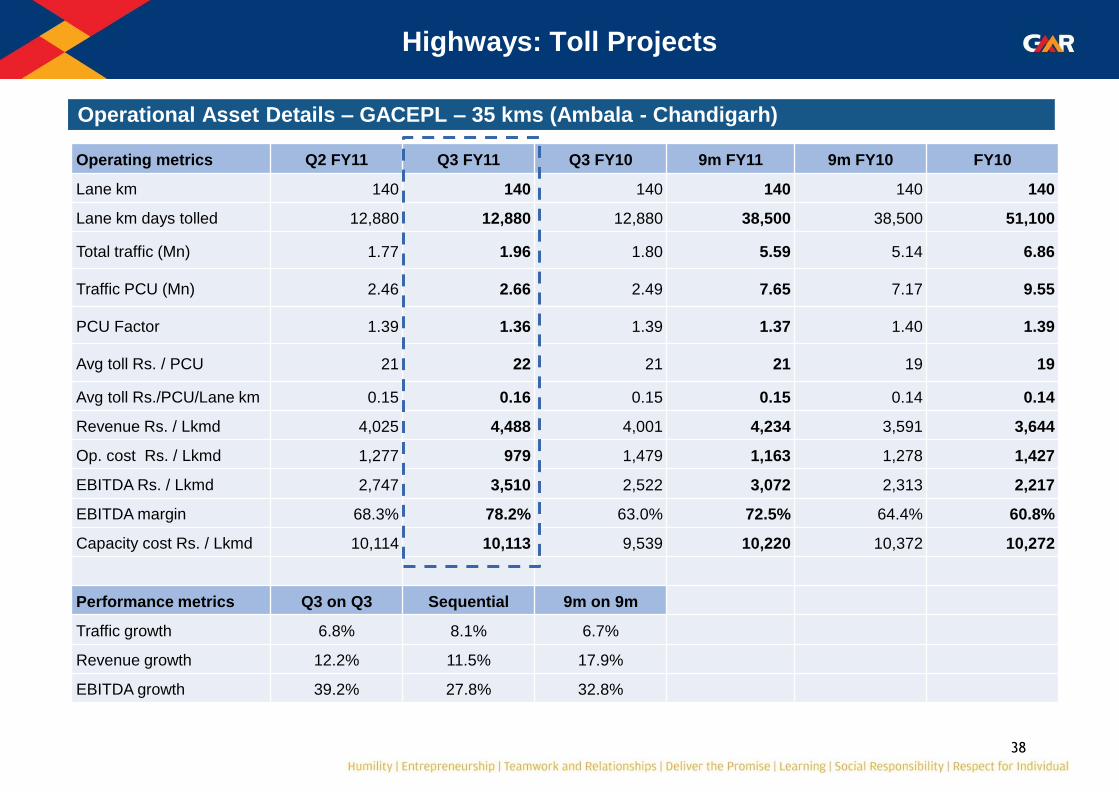
Operational Asset Details – GACEPL – 35 kms (Ambala - Chandigarh)
Highways: Toll Projects
Operating metrics Q2 FY11 Q3 FY11 Q3 FY10 9m FY11 9m FY10 FY10
Lane km 140 140 140 140 140 140
Lane km days tolled 12,880 12,880 12,880 38,500 38,500 51,100
Total traffic (Mn) 1.77 1.96 1.80 5.59 5.14 6.86
Traffic PCU (Mn) 2.46 2.66 2.49 7.65 7.17 9.55
PCU Factor 1.39 1.36 1.39 1.37 1.40 1.39
Avg toll Rs. / PCU 21 22 21 21 19 19
Avg toll Rs./PCU/Lane km 0.15 0.16 0.15 0.15 0.14 0.14
Revenue Rs. / Lkmd 4,025 4,488 4,001 4,234 3,591 3,644
Op. cost Rs. / Lkmd 1,277 979 1,479 1,163 1,278 1,427
EBITDA Rs. / Lkmd 2,747 3,510 2,522 3,072 2,313 2,217
EBITDA margin 68.3% 78.2% 63.0% 72.5% 64.4% 60.8%
Capacity cost Rs. / Lkmd 10,114 10,113 9,539 10,220 10,372 10,272
Performance metrics Q3 on Q3 Sequential 9m on 9m
Traffic growth 6.8% 8.1% 6.7%
Revenue growth 12.2% 11.5% 17.9%
EBITDA growth 39.2% 27.8% 32.8%
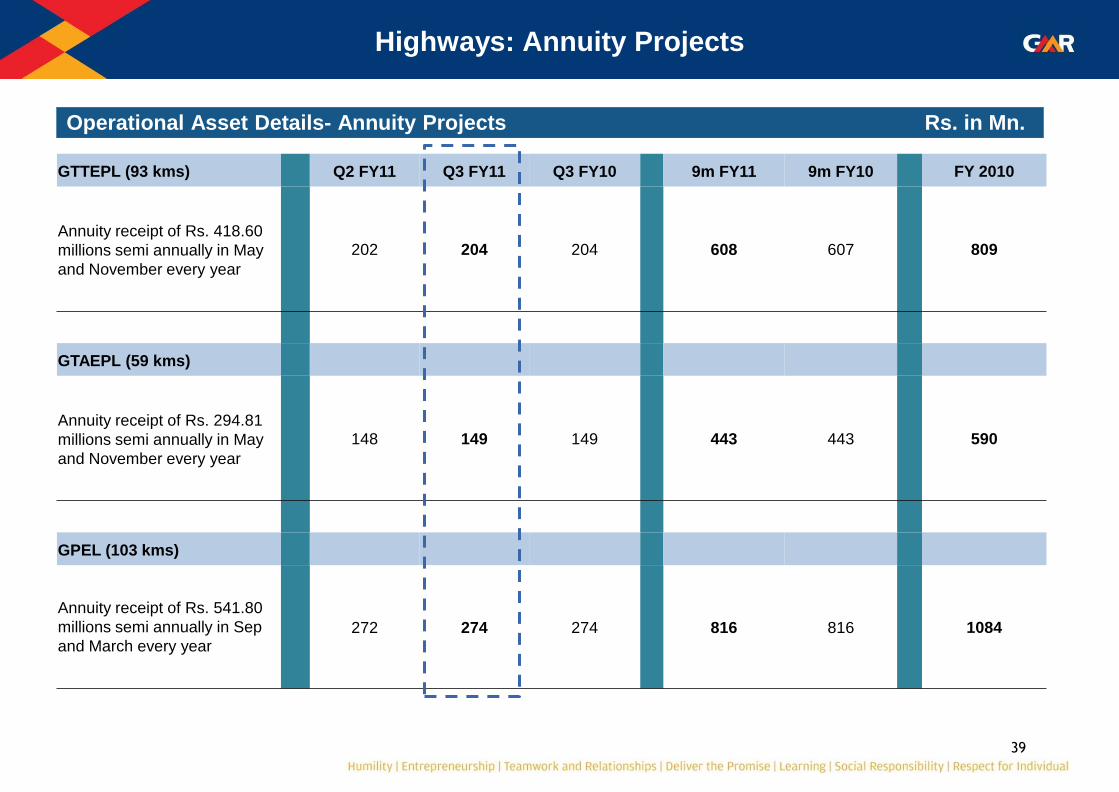
39
Operational Asset Details- Annuity Projects Rs. in Mn.
GTTEPL (93 kms) Q2 FY11 Q3 FY11 Q3 FY10 9m FY11 9m FY10 FY 2010
Annuity receipt of Rs. 418.60
millions semi annually in May
and November every year
202 204 204 608 607 809
GTAEPL (59 kms)
Annuity receipt of Rs. 294.81
millions semi annually in May
and November every year
148 149 149 443 443 590
GPEL (103 kms)
Annuity receipt of Rs. 541.80
millions semi annually in Sep
and March every year
272 274 274 816 816 1084
Highways: Annuity Projects
40
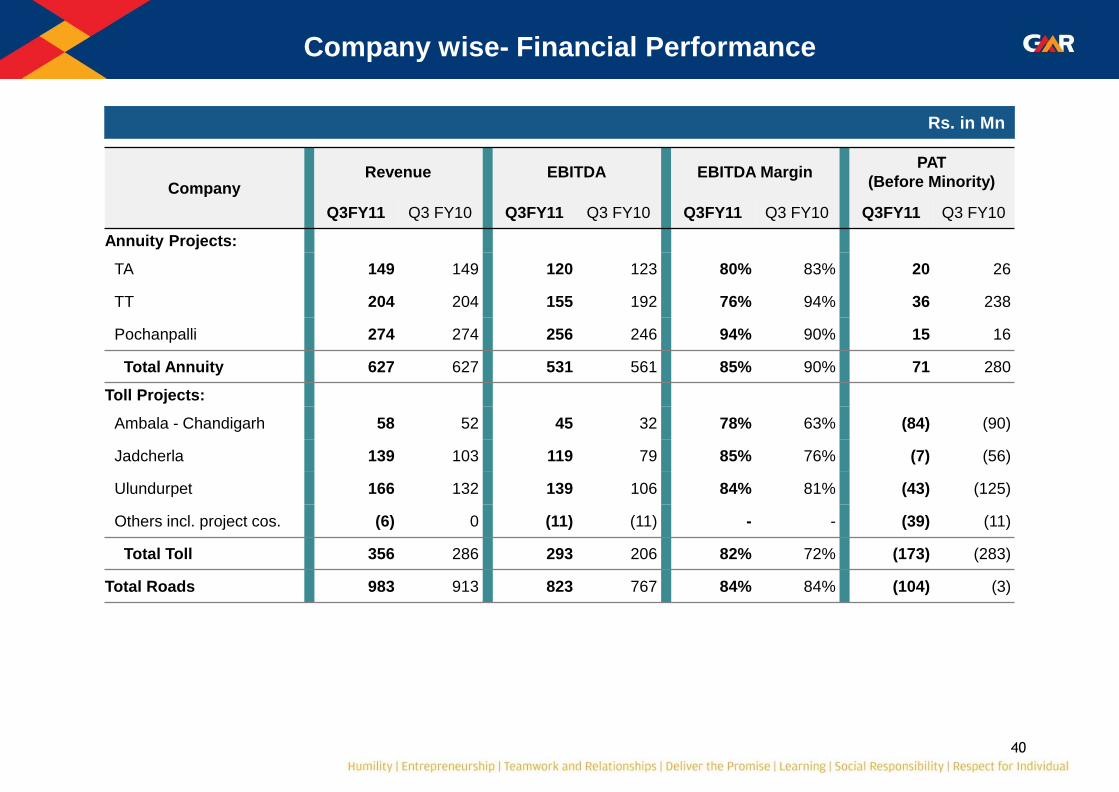
Company wise- Financial Performance
Rs. in Mn
Company Revenue EBITDA EBITDA Margin
PAT
(Before Minority)
Q3FY11 Q3 FY10 Q3FY11 Q3 FY10 Q3FY11 Q3 FY10 Q3FY11 Q3 FY10
Annuity Projects:
TA 149 149 120 123 80% 83% 20 26
TT 204 204 155 192 76% 94% 36 238
Pochanpalli 274 274 256 246 94% 90% 15 16
Total Annuity 627 627 531 561 85% 90% 71 280
Toll Projects:
Ambala - Chandigarh 58 52 45 32 78% 63% (84) (90)
Jadcherla 139 103 119 79 85% 76% (7) (56)
Ulundurpet 166 132 139 106 84% 81% (43) (125)
Others incl. project cos. (6) 0 (11) (11) - - (39) (11)
Total Toll 356 286 293 206 82% 72% (173) (283)
Total Roads 983 913 823 767 84% 84% (104) (3)
41
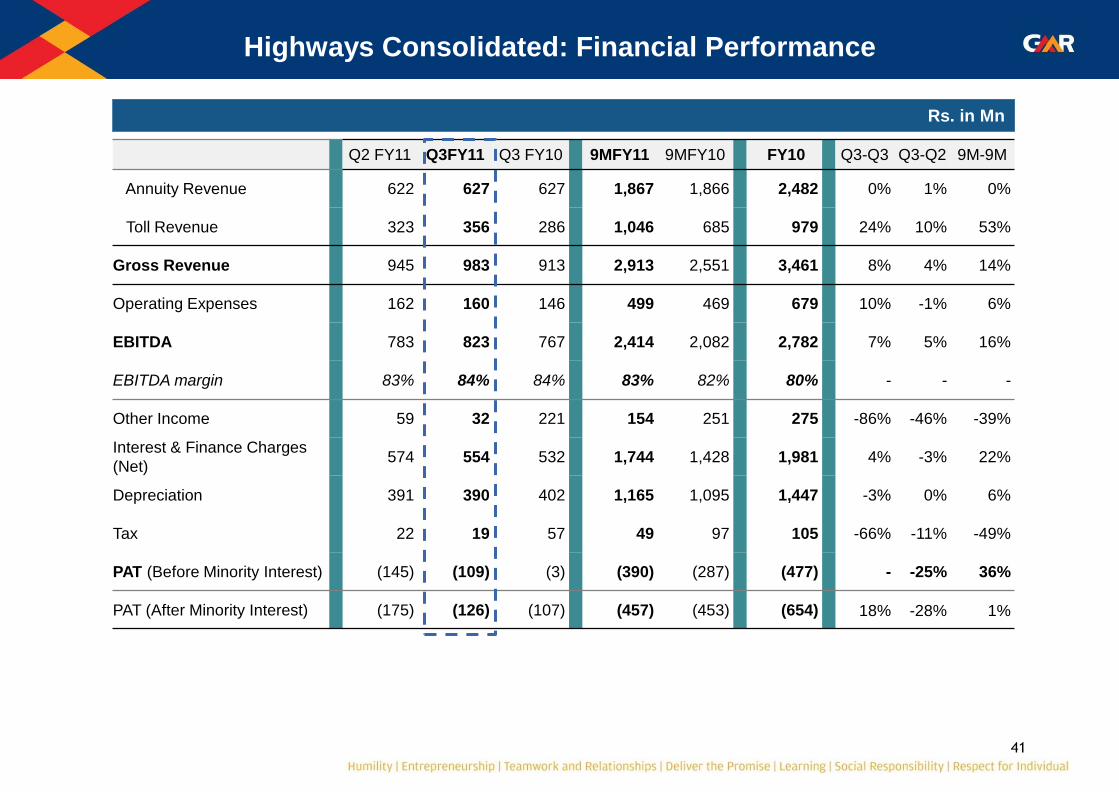
Highways Consolidated: Financial Performance
Rs. in Mn
Q2 FY11 Q3FY11 Q3 FY10 9MFY11 9MFY10 FY10 Q3-Q3 Q3-Q2 9M-9M
Annuity Revenue 622 627 627 1,867 1,866 2,482 0% 1% 0%
Toll Revenue 323 356 286 1,046 685 979 24% 10% 53%
Gross Revenue 945 983 913 2,913 2,551 3,461 8% 4% 14%
Operating Expenses 162 160 146 499 469 679 10% -1% 6%
EBITDA 783 823 767 2,414 2,082 2,782 7% 5% 16%
EBITDA margin 83% 84% 84% 83% 82% 80% - - -
Other Income 59 32 221 154 251 275 -86% -46% -39%
Interest & Finance Charges
(Net) 574 554 532 1,744 1,428 1,981 4% -3% 22%
Depreciation 391 390 402 1,165 1,095 1,447 -3% 0% 6%
Tax 22 19 57 49 97 105 -66% -11% -49%
PAT (Before Minority Interest) (145) (109) (3) (390) (287) (477) - -25% 36%
PAT (After Minority Interest) (175) (126) (107) (457) (453) (654) 18% -28% 1%
42
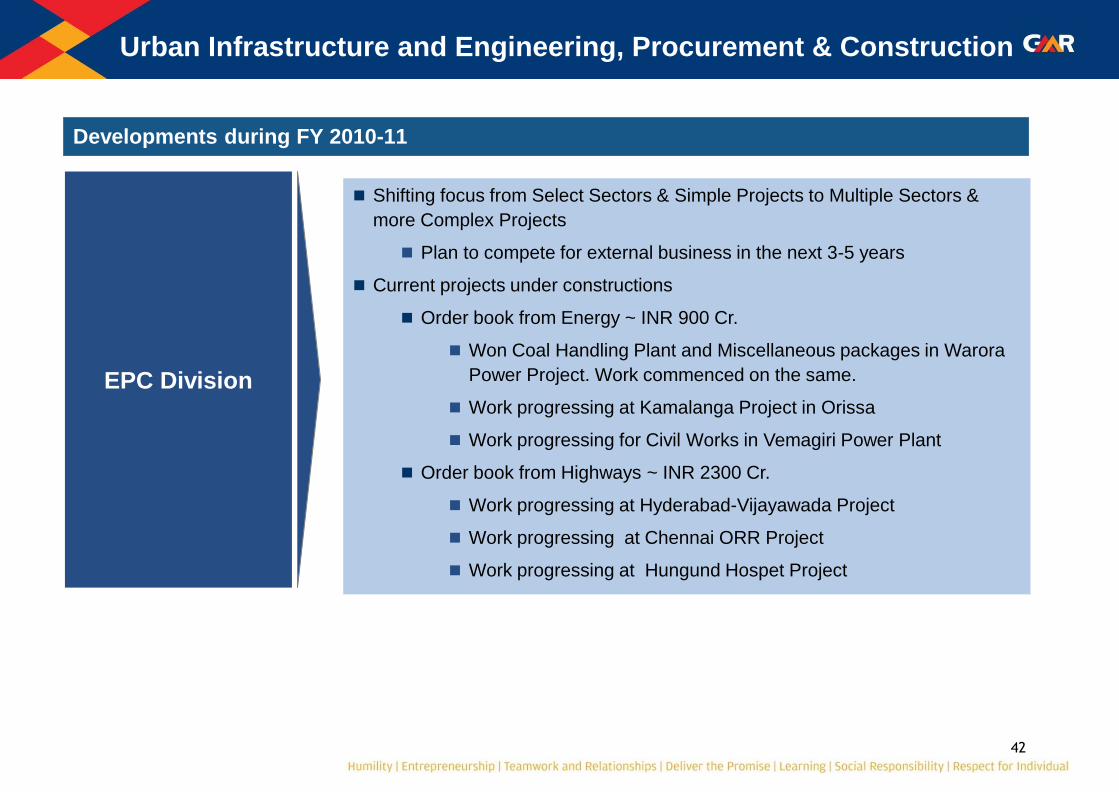
Urban Infrastructure and Engineering, Procurement & Construction
EPC Division
Shifting focus from Select Sectors & Simple Projects to Multiple Sectors &
more Complex Projects
Plan to compete for external business in the next 3-5 years
Current projects under constructions
Order book from Energy ~ INR 900 Cr.
Won Coal Handling Plant and Miscellaneous packages in Warora
Power Project. Work commenced on the same.
Work progressing at Kamalanga Project in Orissa
Work progressing for Civil Works in Vemagiri Power Plant
Order book from Highways ~ INR 2300 Cr.
Work progressing at Hyderabad-Vijayawada Project
Work progressing at Chennai ORR Project
Work progressing at Hungund Hospet Project
Developments during FY 2010-11
43
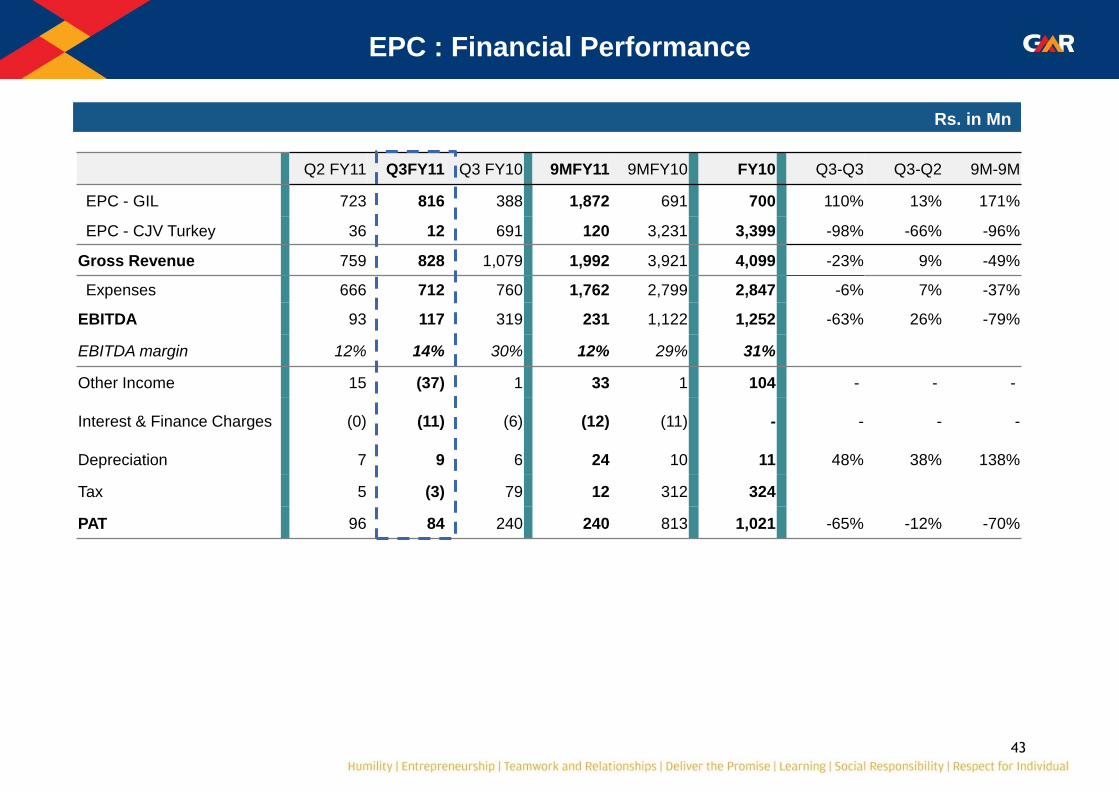
EPC : Financial Performance
Rs. in Mn
Q2 FY11 Q3FY11 Q3 FY10 9MFY11 9MFY10 FY10 Q3-Q3 Q3-Q2 9M-9M
EPC - GIL 723 816 388 1,872 691 700 110% 13% 171%
EPC - CJV Turkey 36 12 691 120 3,231 3,399 -98% -66% -96%
Gross Revenue 759 828 1,079 1,992 3,921 4,099 -23% 9% -49%
Expenses 666 712 760 1,762 2,799 2,847 -6% 7% -37%
EBITDA 93 117 319 231 1,122 1,252 -63% 26% -79%
EBITDA margin 12% 14% 30% 12% 29% 31%
Other Income 15 (37) 1 33 1 104 - - -
Interest & Finance Charges (0) (11) (6) (12) (11) - - - -
Depreciation 7 9 6 24 10 11 48% 38% 138%
Tax 5 (3) 79 12 312 324
PAT 96 84 240 240 813 1,021 -65% -12% -70%

Consolidated Financial Performance
45
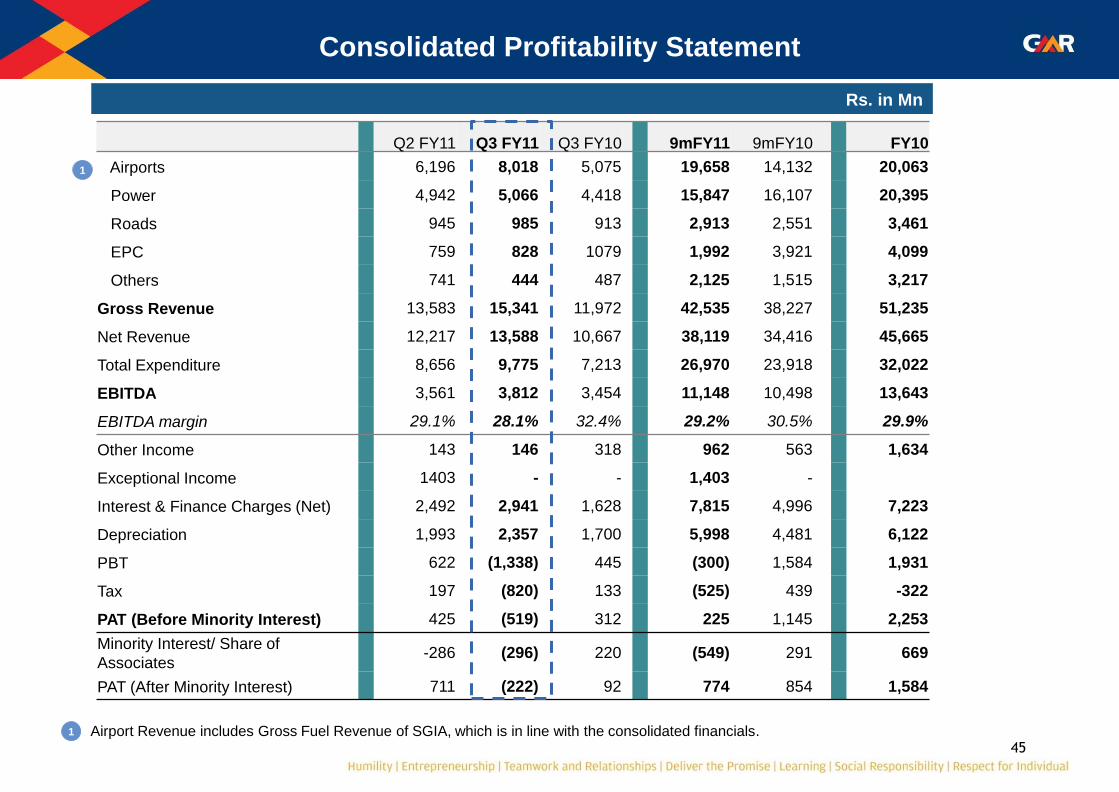
Consolidated Profitability Statement
Rs. in Mn
Q2 FY11 Q3 FY11 Q3 FY10 9mFY11 9mFY10 FY10
Airports 6,196 8,018 5,075 19,658 14,132 20,063
Power 4,942 5,066 4,418 15,847 16,107 20,395
Roads 945 985 913 2,913 2,551 3,461
EPC 759 828 1079 1,992 3,921 4,099
Others 741 444 487 2,125 1,515 3,217
Gross Revenue 13,583 15,341 11,972 42,535 38,227 51,235
Net Revenue 12,217 13,588 10,667 38,119 34,416 45,665
Total Expenditure 8,656 9,775 7,213 26,970 23,918 32,022
EBITDA 3,561 3,812 3,454 11,148 10,498 13,643
EBITDA margin 29.1% 28.1% 32.4% 29.2% 30.5% 29.9%
Other Income 143 146 318 962 563 1,634
Exceptional Income 1403 - - 1,403 -
Interest & Finance Charges (Net) 2,492 2,941 1,628 7,815 4,996 7,223
Depreciation 1,993 2,357 1,700 5,998 4,481 6,122
PBT 622 (1,338) 445 (300) 1,584 1,931
Tax 197 (820) 133 (525) 439 -322
PAT (Before Minority Interest) 425 (519) 312 225 1,145 2,253
Minority Interest/ Share of
Associates -286 (296) 220 (549) 291 669
PAT (After Minority Interest) 711 (222) 92 774 854 1,584
1 Airport Revenue includes Gross Fuel Revenue of SGIA, which is in line with the consolidated financials.
1
46
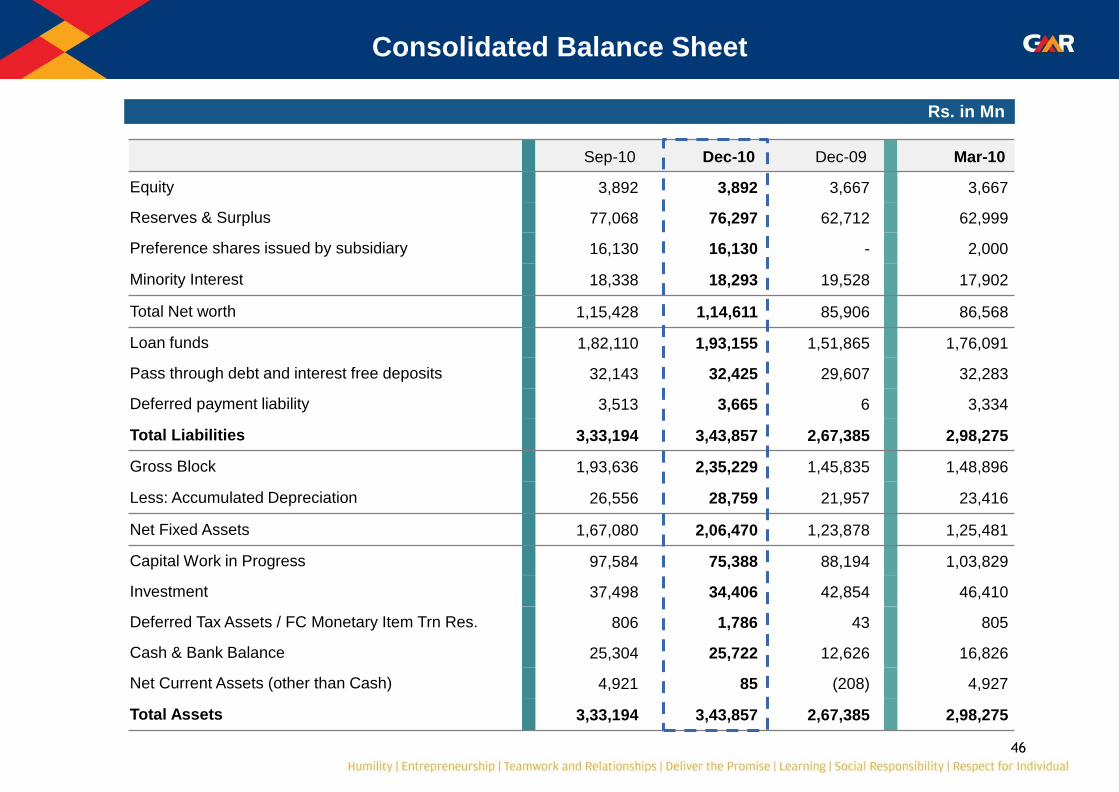
Consolidated Balance Sheet
Rs. in Mn
Sep-10 Dec-10 Dec-09 Mar-10
Equity 3,892 3,892 3,667 3,667
Reserves & Surplus 77,068 76,297 62,712 62,999
Preference shares issued by subsidiary 16,130 16,130 - 2,000
Minority Interest 18,338 18,293 19,528 17,902
Total Net worth 1,15,428 1,14,611 85,906 86,568
Loan funds 1,82,110 1,93,155 1,51,865 1,76,091
Pass through debt and interest free deposits 32,143 32,425 29,607 32,283
Deferred payment liability 3,513 3,665 6 3,334
Total Liabilities 3,33,194 3,43,857 2,67,385 2,98,275
Gross Block 1,93,636 2,35,229 1,45,835 1,48,896
Less: Accumulated Depreciation 26,556 28,759 21,957 23,416
Net Fixed Assets 1,67,080 2,06,470 1,23,878 1,25,481
Capital Work in Progress 97,584 75,388 88,194 1,03,829
Investment 37,498 34,406 42,854 46,410
Deferred Tax Assets / FC Monetary Item Trn Res. 806 1,786 43 805
Cash & Bank Balance 25,304 25,722 12,626 16,826
Net Current Assets (other than Cash) 4,921 85 (208) 4,927
Total Assets 3,33,194 3,43,857 2,67,385 2,98,275
47
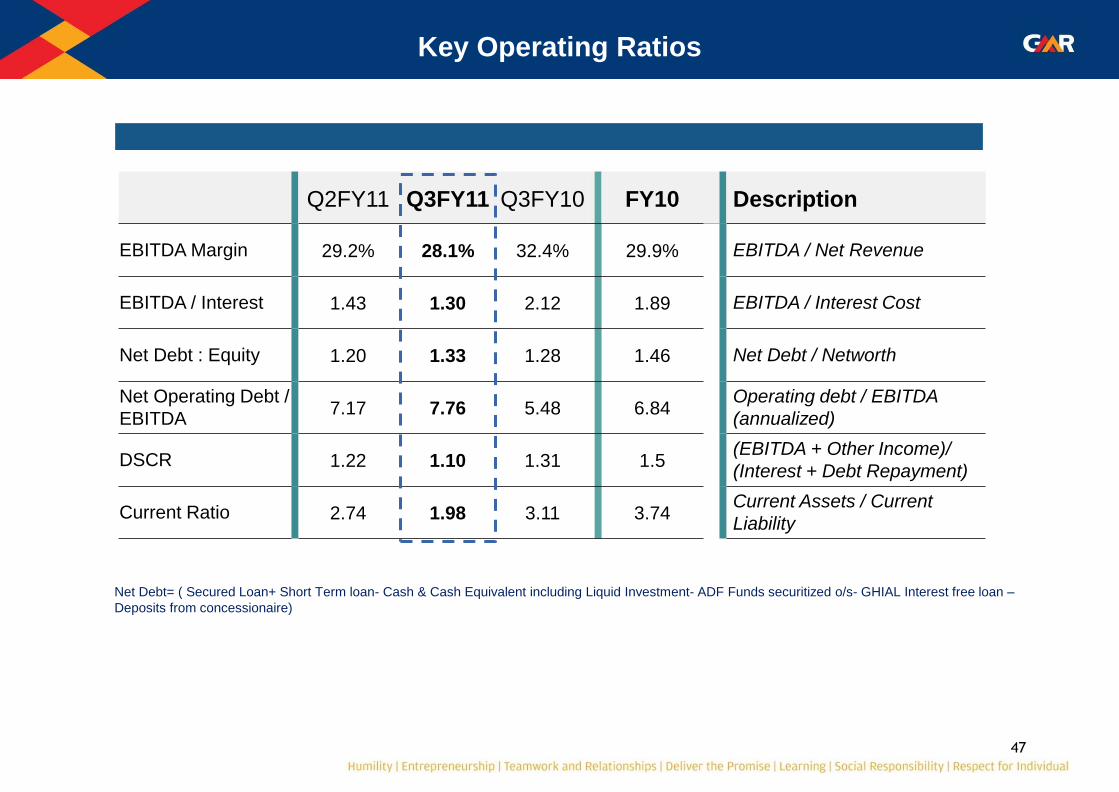
Key Operating Ratios
Q2FY11 Q3FY11 Q3FY10 FY10 Description
EBITDA Margin 29.2% 28.1% 32.4% 29.9% EBITDA / Net Revenue
EBITDA / Interest 1.43 1.30 2.12 1.89 EBITDA / Interest Cost
Net Debt : Equity 1.20 1.33 1.28 1.46 Net Debt / Networth
Net Operating Debt /
EBITDA 7.17 7.76 5.48 6.84
Operating debt / EBITDA
(annualized)
DSCR 1.22 1.10 1.31 1.5 (EBITDA + Other Income)/
(Interest + Debt Repayment)
Current Ratio 2.74 1.98 3.11 3.74 Current Assets / Current
Liability
Net Debt= ( Secured Loan+ Short Term loan- Cash & Cash Equivalent including Liquid Investment- ADF Funds securitized o/s- GHIAL Interest free loan –
Deposits from concessionaire)
Thank You
For further information, please visit
Website: www.gmrgroup.in or
Contact: [email protected]
![GMR Voting System Catalog Part1 ... - download.gongkong.comdownload.gongkong.com/file/company/10490/GMRVotingSystemCatalog.pdf · c?Ô 1 1. veÄ • gmr 2Ï4³ veÄ 3 • gmr ]](https://img.pdfslide.us/doc/110x75/5bfc0ea409d3f225088bc5a1/gmr-voting-system-catalog-part1-co-1-1-veae-gmr-2i4-veae-3-.jpg)