Embed Size (px)
Citation preview
1Q 2017
GMO Quarterly Letter
Up At NightBen Inker
Pages 1-8
Table of Contents
This Time Seems Very, Very Different(Part 2 of Not with a Bang but a Whimper -A Thought Experiment) Jeremy Grantham
Pages 9-16
1
1Q 2017
GMO Quarterly Letter
Executive SummaryInvestors spend a lot of time worrying about what can go wrong for their portfolios. This is a worthwhile and, indeed, essential exercise, but the obvious corollary activity, protecting a portfolio from what can go wrong, is less clearly a good idea. This seeming paradox can be disentangled by recognizing that it is impossible to determine if you are taking an appropriate amount of risk without understanding what the downside is for your portfolio, which means you simply have to do the exercise of understanding what can go wrong. Buying insurance for your portfolio to reduce that downside, however, is a much dicier proposition, leaving you generally either paying so much for broad insurance that you might as well own less in risky assets in the first place or buying insurance for such a narrow range of events that you haven’t protected your portfolio that much at all. This is not universally true, and it can make sense to hedge a piece of the risk that goes along with an asset whose other characteristics you like. It can also make sense to shift the assets you own in the first place given the particular risks that seem most important for your portfolio. For example, in our Benchmark-Free Allocation Strategy we are currently hedging a piece of the risk in emerging markets to protect against the possibility of US dollar strength, and we are choosing to hold alternative strategies and inflation-linked bonds versus equities and conventional bonds to protect against the risk of rising inflation and rising discount rates.
IntroductionPerhaps the most common question I get from clients is “What keeps you up at night?” This question is a shorthand way of asking what potential economic, political, or market events are we most worried about, and what, if anything, are we doing in our portfolios to deal with them. It is the kind of question that any responsible investment manager is supposed to have a thoughtful answer to, and within the context of the couple of minutes that it is generally expected that I will dedicate to answering a question, I will do my best to answer it thoughtfully. But risk is a more nuanced issue than most people make it out to be, and in this quarterly I will try to dig further into the issue than I can in a couple of minutes. Whether it still seems a thoughtful answer I will have to leave to the reader.
The business of investing is inherently about taking risk. While there are some risks it is possible to avoid taking – you don’t have to worry about the risk of financing being taken away from you if
Up At Night Ben Inker
2 GMO Quarterly Letter: 1Q 2017
you don’t lever your portfolio, for example – some important risks are unavoidable.1 The reason why the returns to stocks are higher than T-Bills is because they involve more risk of loss in a depression. The same is true for credit, real estate, venture capital, infrastructure, and everything else generally referred to as “risk assets.” Even government bonds with longer maturities than T-Bills generally have to offer a higher yield to compensate for the risk of inflation and rising interest rates. As a result, probably the most important question in determining the long-term returns investors can earn is how much risk they are prepared to take. Those prepared to take more risk should generally expect higher returns in the long run. But taking too much risk can also lead to disaster for investors. An investor holding a 60/40 S&P 500/Treasury bond portfolio in September 1929 would have had 39% of his money remaining by June of 1932. An investor holding 100% S&P Composite would have retained 18% of his money, and one leveraging his investment in the S&P 2:1 would have retained 1.8% of his money. Losing 61% of your money is no fun, but losing 82% is an awful lot worse, and losing 98.2% is too horrifying to contemplate. The brave investor who somehow kept going with the leveraged strategy would, indeed, have recovered eventually, but it’s hard to imagine how one could actually stick to such a strategy.2 The 100% S&P strategy outperformed the 60/40 strategy by about 1.5% annually since 1920, so there was, in fact, a higher return for the additional risk. Whether an investor would have been able to take that additional risk, however, is another matter.
How much risk can you take? Determining how much risk you can take as an investor is a crucial exercise. There are at least two aspects to it, generally referred to as risk capacity and risk appetite. Plenty of commentators have written on these concepts, so I won’t spend a lot of time discussing them here other than to say it is a bad idea to ignore either aspect. Risk capacity refers to the extent of loss a person or organization can withstand without having to significantly change spending patterns. An endowment that is responsible for covering a relatively small percentage of an institution’s budget probably has more risk capacity than a foundation, where spending from the corpus must cover 100% of spending. And a 25-year-old who is 40 years from retirement probably has more risk capacity in his retirement savings than a 70-year-old who relies on those savings for a large portion of his necessities.
It’s hard to quarrel with the idea that different investors have different risk capacities. It is easier to argue that risk appetite is more about a lack of education on investing – an investor who has much less risk appetite than risk capacity will wind up leaving a lot of return on the table over the years for no good objective reason. But the converse problem is quite real as well. An investor who sold risk assets in 2009 due to heightened fears of depression or just the shock of the losses suffered in the financial crisis clearly held a portfolio too risky for his risk appetite, regardless of his true risk capacity.
Calculating the risk of your portfolio is a complex exercise, so I’d like to keep to the conceptual end of things here. In thinking about risk for a portfolio, I believe you need to worry about both a few risks that are eternal – the risk of depression and the risk of unanticipated inflation come to mind as eternal risks – as well as risks that come out of the unique economic, political, and environmental issues that are specific to the world today.
1 James Montier and I have written at various times about various kinds of risk. In terms of the important risks – those that can lead to a permanent impairment of capital – depression risk and inflation risk are very difficult to avoid, while financing risk and valuation risk are more avoidable and less obviously risks you get directly paid for taking.2 The leveraged strategy is entirely hypothetical, assuming that you could have leveraged 2:1 on stocks for a cost of T-Bills + 0.5% rebalanced monthly. In reality this was probably impossible back in the 1930s and it is almost certain that even if it had been possible, the investor would have gotten closed out of his or her position somewhere along the way.
3 GMO Quarterly Letter: 1Q 2017
Why not hedge your risks?Any homeowner who fails to insure his house against theft and damage is rightly considered to be reckless. Plenty of insurance products are available for portfolios, so why not insure your portfolio, too?3 There are a number of reasons why the analogy fails. First and foremost, a house that is one quarter destroyed is not the same as a house that is three quarters the size. If a fire or tornado has destroyed one of the walls of your house it has to be repaired. You can’t decide to avoid the affected rooms and go on with your life otherwise unaffected. But a portfolio that has lost one quarter of its value is simply a portfolio that is 75% of its original size. It is disappointing, to be sure, but it doesn’t actually impair the proper functioning of the portfolio. It is possible that its smaller size does functionally impair your ability to live off of it, however. This is where risk capacity comes in, and if a 25% loss is unacceptable for whatever reason, it makes sense to build a portfolio where the risk of such a loss is very low.
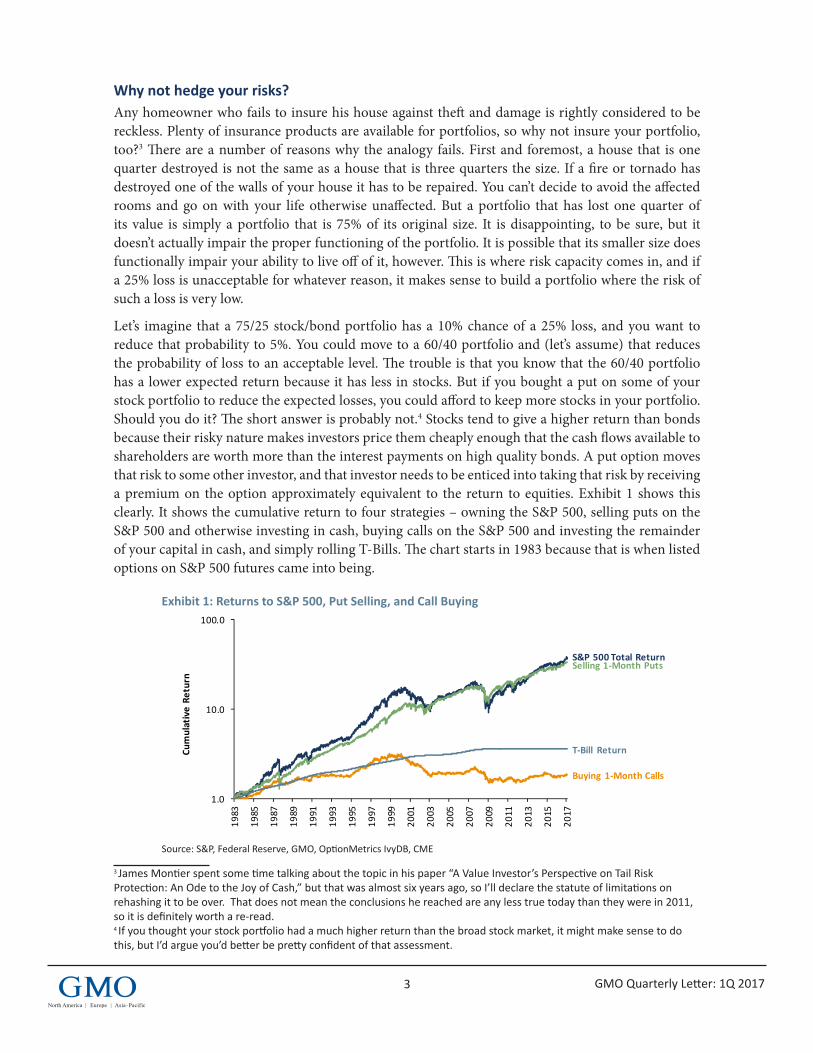
Let’s imagine that a 75/25 stock/bond portfolio has a 10% chance of a 25% loss, and you want to reduce that probability to 5%. You could move to a 60/40 portfolio and (let’s assume) that reduces the probability of loss to an acceptable level. The trouble is that you know that the 60/40 portfolio has a lower expected return because it has less in stocks. But if you bought a put on some of your stock portfolio to reduce the expected losses, you could afford to keep more stocks in your portfolio. Should you do it? The short answer is probably not.4 Stocks tend to give a higher return than bonds because their risky nature makes investors price them cheaply enough that the cash flows available to shareholders are worth more than the interest payments on high quality bonds. A put option moves that risk to some other investor, and that investor needs to be enticed into taking that risk by receiving a premium on the option approximately equivalent to the return to equities. Exhibit 1 shows this clearly. It shows the cumulative return to four strategies – owning the S&P 500, selling puts on the S&P 500 and otherwise investing in cash, buying calls on the S&P 500 and investing the remainder of your capital in cash, and simply rolling T-Bills. The chart starts in 1983 because that is when listed options on S&P 500 futures came into being.
Exhibit 1: Returns to S&P 500, Put Selling, and Call Buying
Source: S&P, Federal Reserve, GMO, OptionMetrics IvyDB, CME
3 James Montier spent some time talking about the topic in his paper “A Value Investor’s Perspective on Tail Risk Protection: An Ode to the Joy of Cash,” but that was almost six years ago, so I’ll declare the statute of limitations on rehashing it to be over. That does not mean the conclusions he reached are any less true today than they were in 2011, so it is definitely worth a re-read.4 If you thought your stock portfolio had a much higher return than the broad stock market, it might make sense to do this, but I’d argue you’d better be pretty confident of that assessment.
1GMO_Template
Proprietary information – not for distribution. Copyright © 2017 by GMO LLC. All rights reserved.
1.0
10.0
100.0
1983
1985
1987
1989
1991
1993
1995
1997
1999
2001
2003
2005
2007
2009
2011
2013
2015
2017
Cumulative Re
turn
S&P 500 Total ReturnSelling 1‐Month Puts
T‐Bill Return
Buying 1‐Month Calls
Exhibit 1: Returns to S&P 500, Put Selling, and Call Buying
As of 3/31/17Source: S&P, Federal Reserve, GMO, OptionMetrics IvyDB, CME
4 GMO Quarterly Letter: 1Q 2017
Since 1983 the S&P 500 has returned 11.2% annualized (a still impressive 8.3% after inflation). Put selling, which gives you all of the downside of the stock market and none of the upside, returned 10.9% after estimated transaction costs, almost exactly the same. By contrast, the call buying strategy, which gives all of the upside of the stock market and none of the downside, returned 1.8% after estimated transaction costs, 2% a year less than T-Bills! Markets are by no means efficiently priced at all times, but the assumption that you can keep the returns of owning stocks while getting rid of the downside has turned out to be almost exactly as wrong as it deserves to be.
Buying specialized insurance?So while you could use puts to reduce the downside of your stock portfolio, it is a pyrrhic exercise. You might as well just own less in stocks in the first place. Frankly, this is exactly how it should be. You don’t buy insurance on your house with the expectation that the losses you incur will be greater than the premiums you pay over time. Any insurance company that priced its product in that way would go out of business pretty quickly. It makes sense to buy homeowners insurance despite the fact that the expected return to buying the insurance is negative, because the alternative of altering your house so that the risk of loss is removed is either impractical or impossible. With a portfolio, you can alter it to change the loss characteristics by reducing the weight in risky assets, and that is likely to be a superior strategy to trying to buy insurance for the portfolio.
But there are other ways to try to protect your portfolio. While general “loss insurance” may be too expensive to be practical, it may be possible to take advantage of correlations between assets to try to get the insurance more cheaply. To stick with the insurance analogy, protecting your house against loss from fire may be expensive, but if your insurance only kicks in if the fire is started by a cow knocking over a lantern in a shed, it will be a lot cheaper; if you were living in Chicago in 1871, that insurance would have worked out perfectly.5 In portfolio terms, there are many ways to build such a hedge, depending on what you think will be the underlying cause of the trouble. If you were sitting in late 2006 and decided that you were worried about a market fall stemming from a drop in the US housing market, you could have hedged your portfolio by buying protection on mortgage-backed securities. This would have worked out spectacularly well. If you had been willing to spend 0.11% of your portfolio annually on protection in the form of the ABX-2006-2 AAA, you could have covered 100% of your portfolio with protection should the underlying subprime mortgages go bad. By the time the stock market hit its bottom in 2009, you would have paid about 0.3% total in protection, but your protection would have made you 70%. Now admittedly this was probably the most mispriced insurance policy in the history of the world, and had you managed to do what I suggest here Christian Bale might well have played you in the movie version of your exploit.
And that makes calling such a trade “insurance” a little misleading. If you can find a massively mispriced security, you will almost certainly be able to improve the expected return of your portfolio by exploiting the mispricing. If the trade is negatively correlated with the rest of your portfolio, so much the better, but I would submit that if you can pay 0.3% for a 70% gain it really doesn’t matter what that trade’s correlation was with the rest of your portfolio. The rest of your portfolio will have been a waste of time and money by contrast.
5 Okay, in reality it almost certainly wouldn’t. Even if the common story is that Mrs. O’Leary’s cow started the fire, you can be pretty confident that your insurance company would claim that the cow was blameless and the fire was caused by a chicken or pig or a lightning strike. While I admit that this is perhaps taking the insurance analogy pretty far, those who have found themselves thinking they were way in the money in a complex OTC derivative they purchased may be familiar with some of the surprising ways that counterparties find to reduce the value of a contract thought to be rock solid.
5 GMO Quarterly Letter: 1Q 2017
But let’s imagine a world with an all-knowing insurance company as your counterparty. This company is absolutely guaranteed to properly price any insurance it sells you, so that it has an appropriately negative expected return for you and positive return for it.6 Is there any circumstance in which you want to buy insurance from this company? Quite possibly. You may have a portfolio for which a particular risk is more important than it is for other investors and where an ability to hedge the risk buys you the ability to own more attractive assets than you otherwise could. While it generally doesn’t make sense to hold an asset and try to get rid of all of its risk, if there is a particular piece of its risk that is stopping you from owning as much as you’d like, it may make sense to hedge that risk and continue to bear the others.
An example for us currently is emerging market currencies. In our Benchmark-Free Allocation Strategy, the single largest piece of our equity portfolio today is emerging market stocks. We like them because they look a good deal cheaper than stocks in the developed world. But given their large weight in the portfolio, there are potential events that could hurt our portfolio more than a traditional portfolio, so even if the market is pricing the hedge “correctly,” we may want to hedge against these potential events. A pertinent risk today for emerging equities is a potential border adjustment tax in the US. Such a tax would be expected to cause the US dollar to appreciate against foreign currencies without any corresponding increase in foreign companies’ earnings from the US. At the moment, the risk of such a tax coming into existence is fairly low despite some support in the House of Representatives. But if it did happen, it would create a meaningful loss for our portfolio without causing the expected return to the damaged asset (emerging equities) to rise.7 Let’s imagine, for simplicity’s sake, that passage of a border adjustment tax would cause the US dollar to appreciate by 10%.8 We could potentially do a few things about this risk. First, we could own less in emerging equities to reduce the impact. The trouble with that is we think the emerging equities we own are around 5% per year better in expected returns than the next best alternative. Selling an asset with an expected gain of 5% for a perhaps 10% chance of a 10% loss is very unappealing. We could currency hedge our emerging equities, but emerging currencies also look cheap to us and generally have a high hedging cost against the US dollar. Fully hedging the currency of the emerging countries would cost over 2.5% on an expected basis. In fact, the only emerging currency that doesn’t look at least mildly cheap to us against the US dollar is the Israeli shekel, which is not a material exposure in our portfolio and does not act much at all like other emerging currencies most of the time. But the next least attractive currency in emerging is the Korean won, which looks only a few percent cheap versus the US dollar and has interest rates much lower than the average in the emerging world. This combination makes for a lower hedging cost. Furthermore, the Korean won has both a high empirical beta to emerging currencies and seems absolutely in the cross-hairs of the kind of country a border adjustment tax is designed to hurt – an export-oriented manufacturing powerhouse with a relatively small domestic market. Should a border adjustment tax
6 I am not assuming that this insurance company is an all-knowing investor, merely an all-knowing insurer. If you happen to have a justified belief that Apple is an undervalued company and will give strong returns from here, I am not assuming that the insurer also knows this and will price any contract on Apple with perfect knowledge. I am assuming, however, that the insurer can accurately assess the probability and impact of a financial crisis, unanticipated inflation, or major war and will price contracts referencing such events or their consequences properly. 7 This makes it different from a generic fall of 10% to our emerging equity portfolio. If the price of emerging equities fell by 10% and the fundamentals didn’t change, our forecast would go up, so we’d have the solace of owning a portfolio with a higher expected return, albeit from a lower asset level. The trouble with the border adjustment tax is that it would be a price fall that was fully justified by a change to the fundamentals, so we suffer the loss with no expected future benefit.8 I’ve read a number of reports that have tried to come up with the likely impact of a border adjustment tax, coming up with numbers ranging from 6% to 25%. There is certainly no magic to a 10% assumption, but it is not outside the general realm of guesses on the topic.
6 GMO Quarterly Letter: 1Q 2017
come into being, it seems to us very likely that the won would get hit, and in the more likely event that it does not, our expectation of the cost of the short position is about 1% to 1.5% of the notional per year. Our best guess is that the hedge will cost us some money. But if the alternative is to own less in emerging equities, it makes sense to do it anyway, because a 1.5% expected cost is a lot less than losing 5% by having to sell that amount of emerging equities.
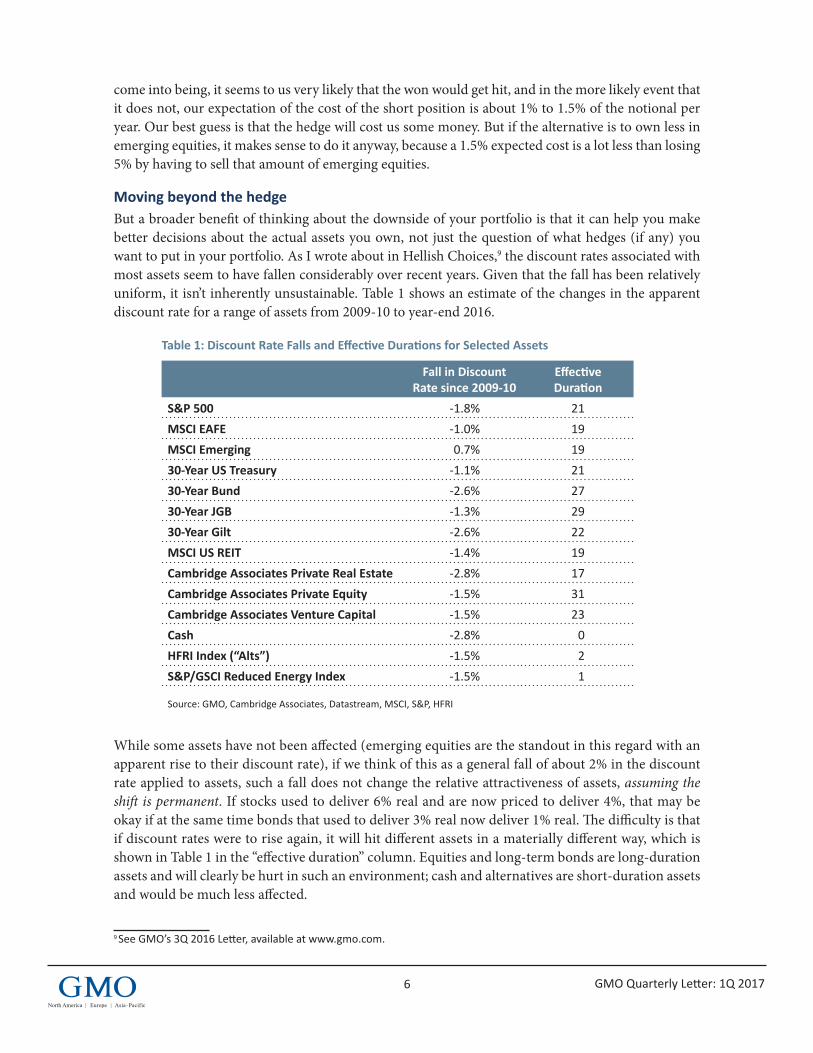
Moving beyond the hedgeBut a broader benefit of thinking about the downside of your portfolio is that it can help you make better decisions about the actual assets you own, not just the question of what hedges (if any) you want to put in your portfolio. As I wrote about in Hellish Choices,9 the discount rates associated with most assets seem to have fallen considerably over recent years. Given that the fall has been relatively uniform, it isn’t inherently unsustainable. Table 1 shows an estimate of the changes in the apparent discount rate for a range of assets from 2009-10 to year-end 2016.
Table 1: Discount Rate Falls and Effective Durations for Selected Assets
Fall in Discount Rate since 2009-10
Effective Duration
S&P 500 -1.8% 21MSCI EAFE -1.0% 19MSCI Emerging 0.7% 1930-Year US Treasury -1.1% 2130-Year Bund -2.6% 2730-Year JGB -1.3% 2930-Year Gilt -2.6% 22MSCI US REIT -1.4% 19Cambridge Associates Private Real Estate -2.8% 17Cambridge Associates Private Equity -1.5% 31Cambridge Associates Venture Capital -1.5% 23Cash -2.8% 0HFRI Index (“Alts”) -1.5% 2S&P/GSCI Reduced Energy Index -1.5% 1
Source: GMO, Cambridge Associates, Datastream, MSCI, S&P, HFRI
While some assets have not been affected (emerging equities are the standout in this regard with an apparent rise to their discount rate), if we think of this as a general fall of about 2% in the discount rate applied to assets, such a fall does not change the relative attractiveness of assets, assuming the shift is permanent. If stocks used to deliver 6% real and are now priced to deliver 4%, that may be okay if at the same time bonds that used to deliver 3% real now deliver 1% real. The difficulty is that if discount rates were to rise again, it will hit different assets in a materially different way, which is shown in Table 1 in the “effective duration” column. Equities and long-term bonds are long-duration assets and will clearly be hurt in such an environment; cash and alternatives are short-duration assets and would be much less affected.
9 See GMO’s 3Q 2016 Letter, available at www.gmo.com.
7 GMO Quarterly Letter: 1Q 2017
Potential driver of discount rate back-upSo if we are otherwise trying to own assets with relatively good expected returns on our forecasts, a significant risk for our portfolio (and most portfolios) would be an event that causes discount rates to back up significantly. This would hit long-duration assets particularly hard. So if today we are faced with two assets of similar expected returns, we can preferentially buy the shorter-duration one. Under normal circumstances this isn’t necessarily a good idea. If discount rates are as likely to fall as rise, long-duration assets are a good thing because a long-duration asset will gain more in price for a given fall in discount rates than it will lose for the same size rise.10 But today’s circumstances do not appear to be normal. While it is possible that discount rates will continue to fall from here, it’s hard to see why you’d want to put a high probability on it. Rising discount rates, on the other hand, would see valuations move closer to historical levels, and even if that is not considered a certainty it’s awfully hard to discount it as a meaningful possibility.
And we have, indeed, shortened up the duration of the Benchmark-Free Allocation Strategy, both by moving money that would otherwise be in equities into alternatives and by having a pretty short-duration fixed income portfolio. But we can go a step further. If we try to think about the circumstances in which discount rates will have to rise significantly, an extremely plausible driver would be a return of inflation pressures in the global economy. After all, the “stylized fact” that the secular stagnation argument has been trying to explain is that inflation has remained low in the face of monetary policy that would have been expected to encourage a rise. If it turns out that this was only a temporary phenomenon, average interest rates will need to be higher than markets are expecting today, because the secular stagnation scenario that so many investors have bought into will be proved wrong. So beyond thinking about the duration of assets, we can think about their expected returns in the event of inflation, because an inflation event is probably the most likely reason why discount rates come up significantly.
Here we probably want to separate out the impact of duration and the underlying cash flows. Equities tend to do poorly in inflation, but their cash flows actually hold up fine. The trouble is that P/Es fall. While that is an important effect, we are taking that into account when we think about duration and a potential rise in discount rates. We don’t want to double count the trouble in the event of inflation. So what we hold in equities is probably okay here. Alternatives, which are the shorter-duration risk asset we own instead of equities, shouldn’t be a particular problem either, because their cash flows come quickly enough not to be hugely impacted by inflation, barring a hyperinflation event. But on the fixed income side, insofar as we own duration, it makes a lot of sense to make it inflation-indexed duration, in the form of TIPS, rather than traditional nominal bonds. This is not to say that TIPS will do well in the event of inflation. Rising inflation would almost certainly drive the Federal Reserve to increase rates by more than the increase in inflation, so TIPS will take losses, but their losses would be significantly lower than those of conventional bonds.
But even here there is an important nuance to be aware of: TIPS will almost unquestionably outperform conventional bonds in the event of unanticipated inflation. They will also very likely underperform in the event of a depression. While there have been a few inflationary depressions in history, and government policies in depressions can wind up leading to inflation later, generally speaking, inflation surprises to the downside when the economy tanks. And for portfolios with a lot of equities or other risk assets in them, depression is the “worst-case scenario” for the portfolio. 10 The reason for this, of course, is convexity. Traditional long-duration assets are convex, just as long-duration bonds are. I’m already stretching the use of the term duration in applying it to assets like equities, so I was a little leery of using the term convexity in the main text. Mathematically, however, I think it’s fair to use it.
8 GMO Quarterly Letter: 1Q 2017
Disclaimer: The views expressed are the views of Ben Inker through the period ending May 2017, and are subject to change at any time based on market and other conditions. This is not an offer or solicitation for the purchase or sale of any security and should not be construed as such. References to specific securities and issuers are for illustrative purposes only and are not intended to be, and should not be interpreted as, recommendations to purchase or sell such securities.
Copyright © 2017 by GMO LLC. All rights reserved.
Ben Inker. Mr. Inker is head of GMO’s Asset Allocation team and member of the GMO Board of Directors. He joined GMO in 1992 following the completion of his B.A. in Economics from Yale University. In his years at GMO, Mr. Inker has served as an analyst for the Quantitative Equity and Asset Allocation teams, as a portfolio manager of several equity and asset allocation portfolios, as co-head of International Quantitative Equities, and as CIO of Quantitative Developed Equities. He is a CFA charterholder.
While unanticipated inflation seems like a particularly salient risk today, protecting against inflation at the cost of increasing vulnerability to depression is far from an easy decision. Even if choosing to own TIPS versus conventional bonds is not a “hedge” in the way that buying puts on a stock portfolio is, it still isn’t free. But for our Benchmark-Free Allocation Strategy, given that we have a lower than normal allocation to risk assets, we believe we can afford the lost protection against depression that would come with holding conventional bonds and that the trade-off is a good one. Without having done the analysis on the downside scenarios for our portfolio in the first place, we would not be in a position to conclude that.
Conclusion By analyzing the vulnerability of our portfolio both against eternal risks and today’s particularly relevant risks, we have gained knowledge we can use to help us decide whether there are any risks it makes sense to hedge against today, as well as to help us alter the underlying asset mix to improve the portfolio’s robustness. Occasionally, markets will be sufficiently mispriced that we can get insurance for free, or actually be paid for it. Such times are to be treasured, but they are the exception rather than the rule. Most of the time, hedging and asset shifting decisions are not easy and involve trade-offs that have real costs to them, either in terms of lower expected returns or worse returns in a scenario that we may well care a good deal about. Today, we think the potential of a border adjustment tax is a meaningful one to our portfolio given the way the portfolio is positioned. We also think that the risk of unanticipated inflation is worse than usual, given how low discount rates are across asset classes.11 The latter risk rises to the level of causing us to lose some sleep, and we have tried to position the portfolio to mitigate some of the risk. Our goal is to improve our expected outcomes in the events we fear without paying too large a price in lower expected returns or increased risks against other scenarios. This is not always possible, and when it isn’t, we’ll suffer some insomnia. Losing sleep isn’t fun, but overpaying for sleep aids will wind up hurting in the long run.
11 Whether it is a more likely event than usual is harder to handicap, but it does seem so. Certainly, global growth seems somewhat more synchronized than it has been for a while, the US is pretty close to full employment, and the rise of economic nationalism around the world makes the prospect of a global trade war more realistic than it would have seemed a few years ago. All that makes inflation a possible outcome, but that is a far cry from saying a nasty inflation surprise is inevitable, or even a high likelihood.
9
1Q 2017
GMO Quarterly Letter
Oh, the good old days! When I started following the market in 1965 I could look back at what we might call the Ben Graham training period of 1935-1965. He noticed financial relationships and came to the conclusion that for patient investors the important ratios always went back to their old trends. He unsurprisingly preferred larger safety margins to smaller ones and, most importantly, more assets per dollar of stock price to fewer because he believed margins would tend to mean revert and make underperforming assets more valuable.
You do not have to be an especially frugal Yorkshireman to think, “What’s not to like about that?” So in my training period I adopted the same biases. And they worked! For the next 10 years, the out-of-favor cheap dogs beat the market as their low margins recovered. And the next 10 years, and the next!1 Not exactly shooting fish in a barrel, but close. Similarly, a group of stocks or even the whole market would shoot up from time to time, but eventually – inconveniently, sometimes a couple of painful years longer than expected – they would come down. Crushed margins would in general recover, and for value managers the world was, for the most part, convenient, and even easy for decades. And then it changed.
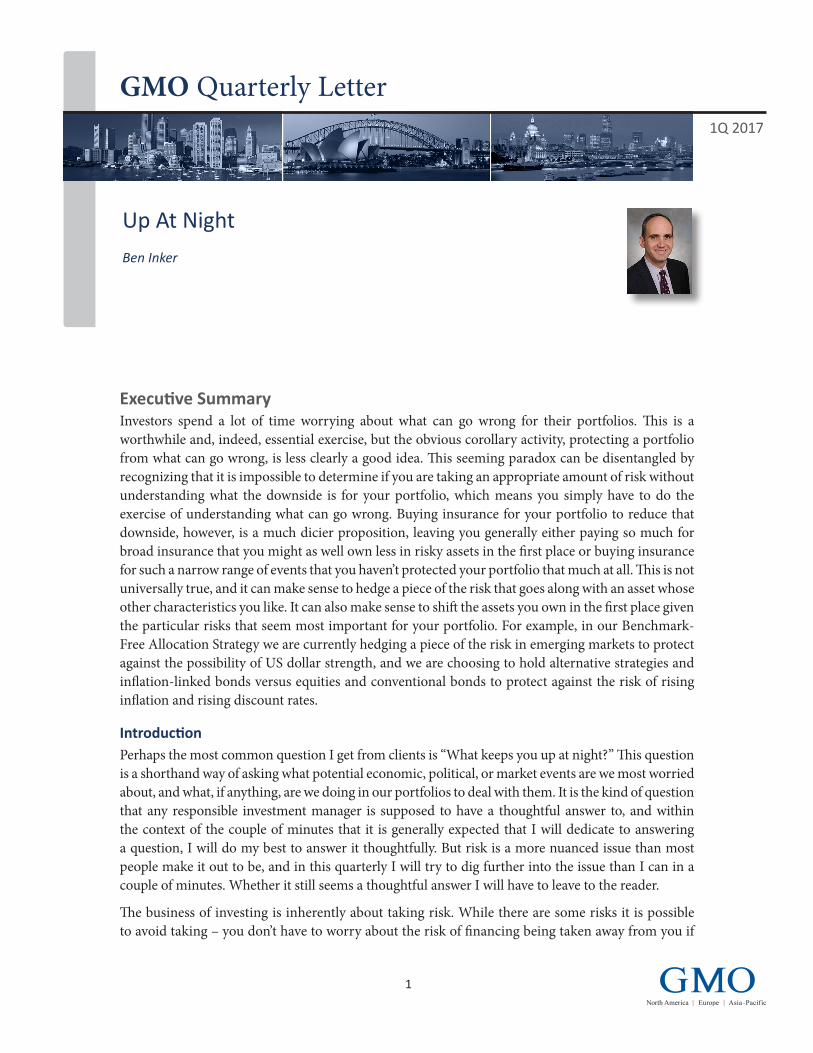
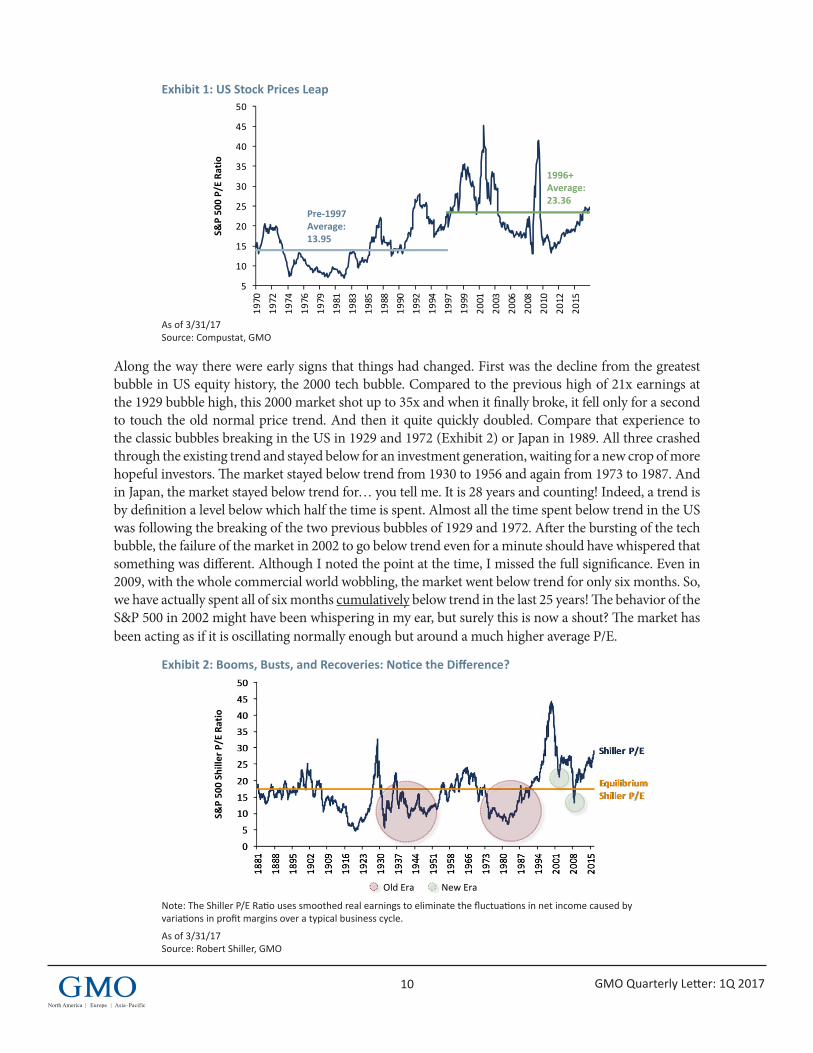
Exhibit 1 shows what happened to the average P/E ratio of the S&P 500 after 1996. For a long and painful 20 years – for someone betting on a steady, unchanging world order – the P/E ratio stayed high by 1935-1995 standards. It still oscillated the same as before, but was now around a much higher mean, 65% to 70% higher! This is not a trivial difference to investors, and 20 years is long enough to test the apocryphal but suitable Keynesian quote that the market can stay irrational longer than the investor can stay solvent.
1 In fact, between 1965 and 1995 cheap price to book stocks (best decile) continuously outperformed the market on a rolling 10-year basis with one exception – 1973 (French and Fama).
This Time Seems Very, Very Different(Part 2 of Not with a Bang but a Whimper - A Thought Experiment)
Jeremy Grantham
10 GMO Quarterly Letter: 1Q 2017
Exhibit 1: US Stock Prices Leap
As of 3/31/17Source: Compustat, GMO
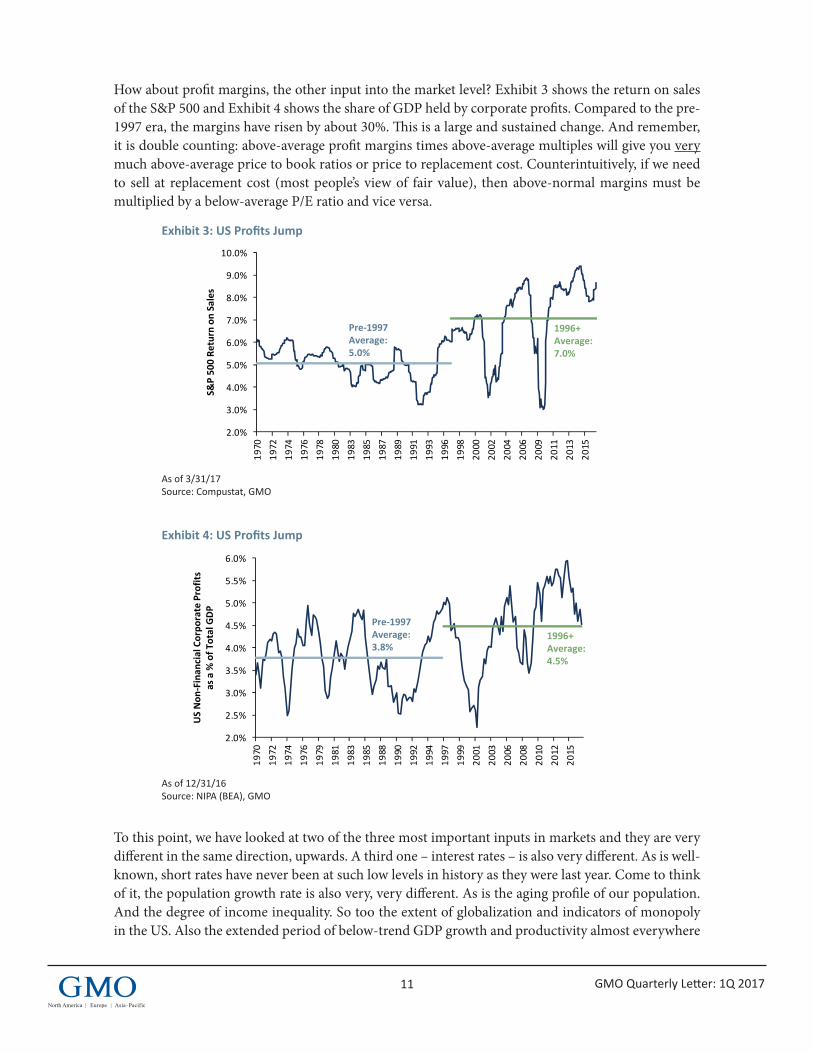
Along the way there were early signs that things had changed. First was the decline from the greatest bubble in US equity history, the 2000 tech bubble. Compared to the previous high of 21x earnings at the 1929 bubble high, this 2000 market shot up to 35x and when it finally broke, it fell only for a second to touch the old normal price trend. And then it quite quickly doubled. Compare that experience to the classic bubbles breaking in the US in 1929 and 1972 (Exhibit 2) or Japan in 1989. All three crashed through the existing trend and stayed below for an investment generation, waiting for a new crop of more hopeful investors. The market stayed below trend from 1930 to 1956 and again from 1973 to 1987. And in Japan, the market stayed below trend for… you tell me. It is 28 years and counting! Indeed, a trend is by definition a level below which half the time is spent. Almost all the time spent below trend in the US was following the breaking of the two previous bubbles of 1929 and 1972. After the bursting of the tech bubble, the failure of the market in 2002 to go below trend even for a minute should have whispered that something was different. Although I noted the point at the time, I missed the full significance. Even in 2009, with the whole commercial world wobbling, the market went below trend for only six months. So, we have actually spent all of six months cumulatively below trend in the last 25 years! The behavior of the S&P 500 in 2002 might have been whispering in my ear, but surely this is now a shout? The market has been acting as if it is oscillating normally enough but around a much higher average P/E.
Exhibit 2: Booms, Busts, and Recoveries: Notice the Difference?
Note: The Shiller P/E Ratio uses smoothed real earnings to eliminate the fluctuations in net income caused by variations in profit margins over a typical business cycle.
As of 3/31/17Source: Robert Shiller, GMO
1GMO_Template
Proprietary information – not for distribution. Copyright © 2017 by GMO LLC. All rights reserved.
5
10
15
20
25
30
35
40
45
50
1970
1972
1974
1976
1979
1981
1983
1985
1988
1990
1992
1994
1997
1999
2001
2003
2006
2008
2010
2012
2015
Exhibit 1: US Stock Prices Leap
As of 3/31/17Source: Compustat, GMO
Pre‐1997 Average: 13.95
1996+ Average: 23.36
S&P 50
0 P/E Ra
tio
2GMO_Template
Proprietary information – not for distribution. Copyright © 2017 by GMO LLC. All rights reserved.
Exhibit 2: Booms, Busts, and Recoveries: Notice the Difference?
Note: The Shiller P/E Ratio uses smoothed real earnings to eliminate the fluctuations in net income caused by variations in profit margins over a typical business cycle.As of 3/31/17Source: Robert Shiller, GMO
S&P 50
0 Sh
iller P/E Ratio
Old Era New Era
11 GMO Quarterly Letter: 1Q 2017
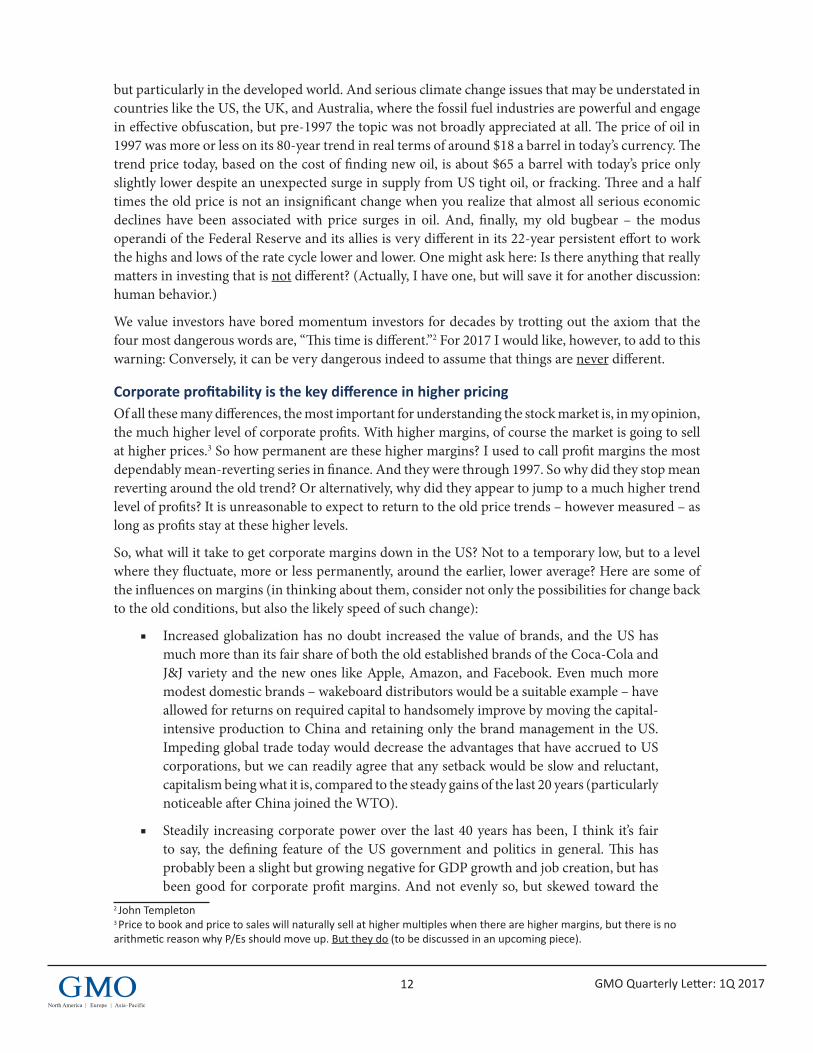
How about profit margins, the other input into the market level? Exhibit 3 shows the return on sales of the S&P 500 and Exhibit 4 shows the share of GDP held by corporate profits. Compared to the pre-1997 era, the margins have risen by about 30%. This is a large and sustained change. And remember, it is double counting: above-average profit margins times above-average multiples will give you very much above-average price to book ratios or price to replacement cost. Counterintuitively, if we need to sell at replacement cost (most people’s view of fair value), then above-normal margins must be multiplied by a below-average P/E ratio and vice versa.
Exhibit 3: US Profits Jump
As of 3/31/17Source: Compustat, GMO
Exhibit 4: US Profits Jump
As of 12/31/16Source: NIPA (BEA), GMO
To this point, we have looked at two of the three most important inputs in markets and they are very different in the same direction, upwards. A third one – interest rates – is also very different. As is well-known, short rates have never been at such low levels in history as they were last year. Come to think of it, the population growth rate is also very, very different. As is the aging profile of our population. And the degree of income inequality. So too the extent of globalization and indicators of monopoly in the US. Also the extended period of below-trend GDP growth and productivity almost everywhere
3GMO_Template
Proprietary information – not for distribution. Copyright © 2017 by GMO LLC. All rights reserved.
2.0%
3.0%
4.0%
5.0%
6.0%
7.0%
8.0%
9.0%
10.0%19
7019
7219
7419
7619
7819
8019
8319
8519
8719
8919
9119
9319
9619
9820
0020
0220
0420
0620
0920
1120
1320
15
Exhibit 3: US Profits Jump
As of 3/31/17Source: Compustat, GMO
Pre‐1997 Average: 5.0%
1996+ Average: 7.0%
S&P 50
0 Re
turn on Sales
4GMO_Template
Proprietary information – not for distribution. Copyright © 2017 by GMO LLC. All rights reserved.
2.0%
2.5%
3.0%
3.5%
4.0%
4.5%
5.0%
5.5%
6.0%
1970
1972
1974
1976
1979
1981
1983
1985
1988
1990
1992
1994
1997
1999
2001
2003
2006
2008
2010
2012
2015
Pre‐1997 Average: 3.8%
1996+ Average: 4.5%
Exhibit 4: US Profits Jump
As of 12/31/16Source: NIPA (BEA), GMO
US Non
‐Finan
cial Corpo
rate Profits
as a % of T
otal GDP
12 GMO Quarterly Letter: 1Q 2017
but particularly in the developed world. And serious climate change issues that may be understated in countries like the US, the UK, and Australia, where the fossil fuel industries are powerful and engage in effective obfuscation, but pre-1997 the topic was not broadly appreciated at all. The price of oil in 1997 was more or less on its 80-year trend in real terms of around $18 a barrel in today’s currency. The trend price today, based on the cost of finding new oil, is about $65 a barrel with today’s price only slightly lower despite an unexpected surge in supply from US tight oil, or fracking. Three and a half times the old price is not an insignificant change when you realize that almost all serious economic declines have been associated with price surges in oil. And, finally, my old bugbear – the modus operandi of the Federal Reserve and its allies is very different in its 22-year persistent effort to work the highs and lows of the rate cycle lower and lower. One might ask here: Is there anything that really matters in investing that is not different? (Actually, I have one, but will save it for another discussion: human behavior.)
We value investors have bored momentum investors for decades by trotting out the axiom that the four most dangerous words are, “This time is different.”2 For 2017 I would like, however, to add to this warning: Conversely, it can be very dangerous indeed to assume that things are never different.
Corporate profitability is the key difference in higher pricingOf all these many differences, the most important for understanding the stock market is, in my opinion, the much higher level of corporate profits. With higher margins, of course the market is going to sell at higher prices.3 So how permanent are these higher margins? I used to call profit margins the most dependably mean-reverting series in finance. And they were through 1997. So why did they stop mean reverting around the old trend? Or alternatively, why did they appear to jump to a much higher trend level of profits? It is unreasonable to expect to return to the old price trends – however measured – as long as profits stay at these higher levels.
So, what will it take to get corporate margins down in the US? Not to a temporary low, but to a level where they fluctuate, more or less permanently, around the earlier, lower average? Here are some of the influences on margins (in thinking about them, consider not only the possibilities for change back to the old conditions, but also the likely speed of such change):
■ Increased globalization has no doubt increased the value of brands, and the US has much more than its fair share of both the old established brands of the Coca-Cola and J&J variety and the new ones like Apple, Amazon, and Facebook. Even much more modest domestic brands – wakeboard distributors would be a suitable example – have allowed for returns on required capital to handsomely improve by moving the capital-intensive production to China and retaining only the brand management in the US. Impeding global trade today would decrease the advantages that have accrued to US corporations, but we can readily agree that any setback would be slow and reluctant, capitalism being what it is, compared to the steady gains of the last 20 years (particularly noticeable after China joined the WTO).
■ Steadily increasing corporate power over the last 40 years has been, I think it’s fair to say, the defining feature of the US government and politics in general. This has probably been a slight but growing negative for GDP growth and job creation, but has been good for corporate profit margins. And not evenly so, but skewed toward the
2 John Templeton3 Price to book and price to sales will naturally sell at higher multiples when there are higher margins, but there is no arithmetic reason why P/Es should move up. But they do (to be discussed in an upcoming piece).
13 GMO Quarterly Letter: 1Q 2017
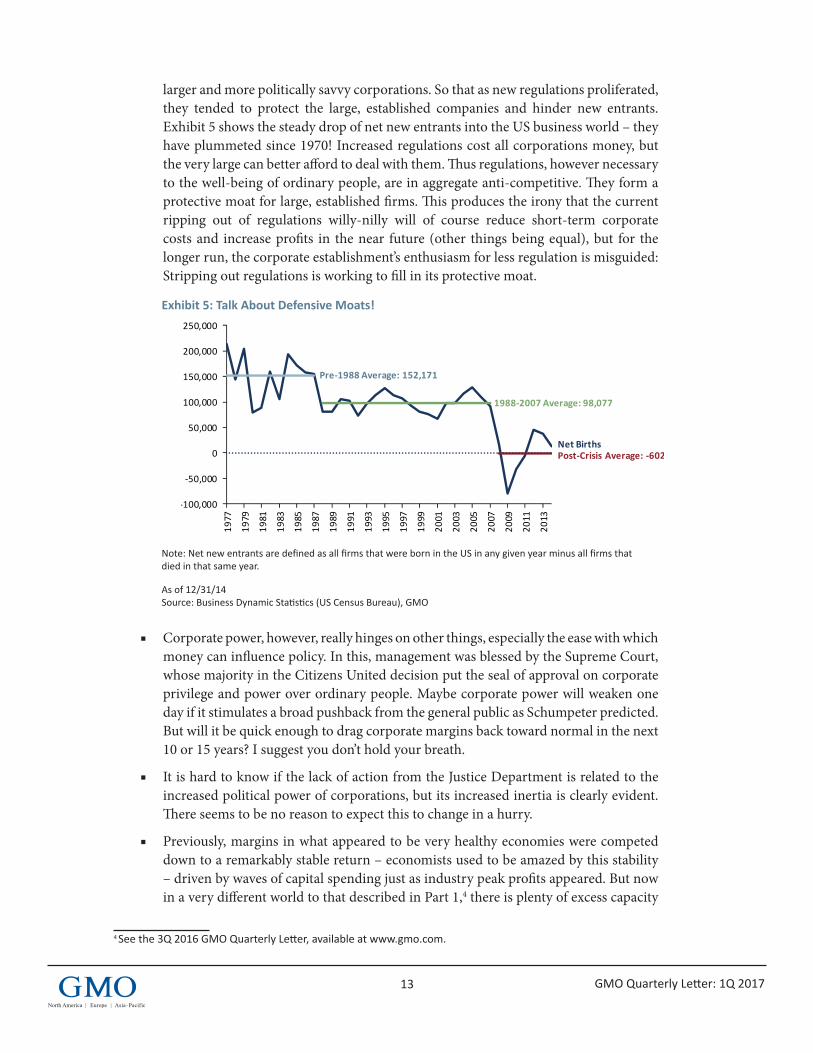
larger and more politically savvy corporations. So that as new regulations proliferated, they tended to protect the large, established companies and hinder new entrants. Exhibit 5 shows the steady drop of net new entrants into the US business world – they have plummeted since 1970! Increased regulations cost all corporations money, but the very large can better afford to deal with them. Thus regulations, however necessary to the well-being of ordinary people, are in aggregate anti-competitive. They form a protective moat for large, established firms. This produces the irony that the current ripping out of regulations willy-nilly will of course reduce short-term corporate costs and increase profits in the near future (other things being equal), but for the longer run, the corporate establishment’s enthusiasm for less regulation is misguided: Stripping out regulations is working to fill in its protective moat.
Exhibit 5: Talk About Defensive Moats!
Note: Net new entrants are defined as all firms that were born in the US in any given year minus all firms that died in that same year.
As of 12/31/14Source: Business Dynamic Statistics (US Census Bureau), GMO
■ Corporate power, however, really hinges on other things, especially the ease with which money can influence policy. In this, management was blessed by the Supreme Court, whose majority in the Citizens United decision put the seal of approval on corporate privilege and power over ordinary people. Maybe corporate power will weaken one day if it stimulates a broad pushback from the general public as Schumpeter predicted. But will it be quick enough to drag corporate margins back toward normal in the next 10 or 15 years? I suggest you don’t hold your breath.
■ It is hard to know if the lack of action from the Justice Department is related to the increased political power of corporations, but its increased inertia is clearly evident. There seems to be no reason to expect this to change in a hurry.
■ Previously, margins in what appeared to be very healthy economies were competed down to a remarkably stable return – economists used to be amazed by this stability – driven by waves of capital spending just as industry peak profits appeared. But now in a very different world to that described in Part 1,4 there is plenty of excess capacity
4 See the 3Q 2016 GMO Quarterly Letter, available at www.gmo.com.
5GMO_Template
Proprietary information – not for distribution. Copyright © 2017 by GMO LLC. All rights reserved.
‐100,000
‐50,000
0
50,000
100,000
150,000
200,000
250,000
1977
1979
1981
1983
1985
1987
1989
1991
1993
1995
1997
1999
2001
2003
2005
2007
2009
2011
2013
Net Births
Pre‐1988 Average: 152,171
1988‐2007 Average: 98,077
Post‐Crisis Average: ‐602
Exhibit 5: Talk About Defensive Moats!
Note: Net new entrants are defined as all firms that were born in the US in any given year minus all firms that died in that same year.
As of 12/31/14Source: Business Dynamic Statistics (US Census Bureau), GMO
US Net New
Firm
s (Births –Deaths)
14 GMO Quarterly Letter: 1Q 2017
and a reduced emphasis on growth relative to profitability. Consequently, there has been a slight decline in capital spending as a percentage of GDP. No speedy joy to be expected here.
■ The general pattern described so far is entirely compatible with increased monopoly power for US corporations. Put this way, if they had materially more monopoly power, we would expect to see exactly what we do see: higher profit margins; increased reluctance to expand capacity; slight reductions in GDP growth and productivity; pressure on wages, unions, and labor negotiations; and fewer new entrants into the corporate world and a declining number of increasingly large corporations. And because these factors affect the US more than other developed countries, US margins should be higher than theirs. It is a global system and we out-brand them for one thing.
■ The single largest input to higher margins, though, is likely to be the existence of much lower real interest rates since 1997 combined with higher leverage. Pre-1997 real rates averaged 200 bps higher than now and leverage was 25% lower. At the old average rate and leverage, profit margins on the S&P 500 would drop back 80% of the way to their previous much lower pre-1997 average, leaving them a mere 6% higher. (Turning up the rate dial just another 0.5% with a further modest reduction in leverage would push them to complete the round trip back to the old normal.)
This neat outcome tempted me to say, “well that’s it then, these new higher margins are simply and exclusively the outcome of lower rates and higher leverage,” leaving only the remaining 20% of increased margins to be explained by our almost embarrassingly large number of other very plausible reasons for higher margins such as monopoly and increased corporate power. But then I realized that there is a conundrum: In a world of reasonable competitiveness, higher margins from long-term lower rates should have been competed away. (Corporate risk had not materially changed, for interest coverage was unchanged and rate volatility was fine.) But they were not, and I believe it was precisely these other factors – increased monopoly, political, and brand power – that had created this new stickiness in profits that allowed these new higher margin levels to be sustained for so long.
So, to summarize, stock prices are held up by abnormal profit margins, which in turn are produced mainly by lower real rates, the benefits of which are not competed away because of increased monopoly power, etc. What, we might ask, will it take to break this chain? Any answer, I think, must start with an increase in real rates. Last fall, a hundred other commentators and I offered many reasons for the lower rates. The problem for explaining or predicting future higher rates is that all the influences on rates seem long term or even very long term. One of the most plausible reasons, for example, is the aging of the populations of the developed world and China, which produces more desperate 50-year-olds saving for retirement and fewer 30-year-olds spending everything they earn or can borrow. This results, on the margin, in a lowered demand for capital and hence lower real rates. We can probably agree that this reason will take a few decades to fade away, not the usual seven-year average regression period for financial ratios.
Any effect of lower population growth rates is likely to take even longer. No one seems sure what is causing lower productivity growth or what role it has in lower rates, but it would take some very unexpected good fortune to have productivity accelerate enough to drive rates upward in the near term. Income inequality that may be helping to keep growth and rates lower will, unfortunately, in my opinion, also take decades to move materially unless we have a very unexpected near revolution in politics.
15 GMO Quarterly Letter: 1Q 2017
Perhaps the best bet for higher rate equilibrium in the next few years is a change in the dominant central bank policy of using low rates to stimulate asset prices (which they clearly do) and stimulate growth (which, other than pushing growth back or forward a quarter or so, I believe they do not do). With 20 years of Fed support for this approach and loyal adherents in the ECB and The Banks of England and Japan, changing the policy is unlikely to be quick or easy. It is a deeply entrenched establishment view, or so it seems. President Trump is admittedly a very, very wild card in this game, and he said a few anti-Fed things in the election phase, for whatever that is worth. He also gets to appoint five new members, including the chair, in the next 18 months. But in the end, will a real estate developer with plenty of assets and an apparent interest in being very rich really promote a materially higher-yield policy at the Fed? Possible, but quite improbable, I think.
In short, I think lower rates than those in effect pre-1997 are likely to be with us for years, and the best we can hope for is several of the factors we’ve discussed moving slowly to push real rates higher. In the meantime, while we wait for higher risk-free rates, investors – value mangers included – should brace themselves for continued higher multiples than those of the old days. (Although with a very good chance that multiples will show a very slow decline.) What does this mean for value investing?
What it does not mean is that cheaper is not better. But price to book was never a measure of cheapness. The low price to book ratios reflect the market’s vote as to which companies have the least useful assets. Only if the market gets carried away with pessimism or feels uncomfortable with the career risk of owning companies in temporary trouble will such ratios work. Sometimes they do and sometimes they don’t. A fully-fledged dividend discount model with strong quality adjustments and epic struggles to correct for accounting slippage is ideally what is needed.
Alternatively, any analyst good enough to predict the future, whether for six months or six years, better than the market will win. Unfortunately for us investors, the prediction business is not easy.
The S&P has been selling at a much higher level of P/E for 20 years now and it has not meant that better stock pickers have not won. My personal belief and experience has been, though, that the greatest deviations from fair value occur at more macro levels – countries and asset classes – where career risk is higher than picking one insurance company over another and therefore the inefficiencies and opportunities for outperforming are greater.
What this argument probably does mean is that if you are expecting a quick or explosive market decline in the S&P 500 that will return us to pre-1997 ratios (perhaps because that is the kind of thing that happened in the past), then you should at least be prepared to be frustrated for some considerable further time: until you can feel the process of the real interest rate structure moving back up toward its old level. All in all, from the many possibilities, I prefer my suggestion (from Part 1) of a 20-year limping regression that takes us two-thirds of the way back to the good old days pre-1997. What I fear is that if I am wrong, it is less likely to be because regression is more dramatic as some die-hard value managers believe (and I would dearly, dearly love to see!) than it is to be even slower. (The outlook I proposed for the S&P 500 last October of 2.8% real per year for 20 years – the whimper path – has fallen to 2.3% real at recent higher prices).
Outlook for corporate margins – and hence (probably) the market in 2017There are three factors moving in favor of US profit margins this year. First, oil and resource prices appeared to have bottomed out last year and seem likely to have favorable comparisons for a few
16 GMO Quarterly Letter: 1Q 2017
Disclaimer: The views expressed are the views of Jeremy Grantham through the period ending May 2017, and are subject to change at any time based on market and other conditions. This is not an offer or solicitation for the purchase or sale of any security and should not be construed as such. References to specific securities and issuers are for illustrative purposes only and are not intended to be, and should not be interpreted as, recommendations to purchase or sell such securities.
Copyright © 2017 by GMO LLC. All rights reserved.
Jeremy Grantham. Mr. Grantham co-founded GMO in 1977 and is a member of GMO’s Asset Allocation team, serving as the firm’s chief investment strategist. Prior to GMO’s founding, Mr. Grantham was co-founder of Batterymarch Financial Management in 1969 where he recommended commercial indexing in 1971, one of several claims to being first. He began his investment career as an economist with Royal Dutch Shell. He is a member of the GMO Board of Directors and has also served on the investment boards of several non-profit organizations. He earned his undergraduate degree from the University of Sheffield (U.K.) and an MBA from Harvard Business School.
quarters.5 Second, Trump is likely to settle for a moderate reduction in corporate tax rates this year after bouncing off the infinitely complex task of a full redo of the tax code. In a theoretical world, corporate taxes are a pass-through to consumers, but in the current, stickier, more monopolistic, more profit-fixated world, a corporate tax reduction will raise corporate profits for quite a while from where they otherwise would have been. Third, removing regulations here and there will, as mentioned, lower corporate costs in the short term. Net-net, unless there are some substantial unexpected negatives, US corporate margins will be up this year, making for the likelihood, in my opinion, of an up year in the market at least until late in the year. This does seem to make the odds of a major decline in the near future quite low (famous last words?). Next year, though, is a different proposition.
In conclusion, there are two important things to carry in your mind: First, the market now and in the past acts as if it believes the current higher levels of profitability are permanent; and second, a regular bear market of 15% to 20% can always occur for any one of many reasons. What I am interested in here is quite different: a more or less permanent move back to, or at least close to, the pre-1997 trends of profitability, interest rates, and pricing. And for that it seems likely that we will have a longer wait than any value manager would like (including me).
5 Rising oil prices have a short-term effect of about one year of boosting profits and vice versa because oil company profits quickly respond and the much more thinly-spread benefits do indeed cause profits to move in the opposite direction, but much more slowly.