Embed Size (px)
Citation preview

“
FIRST-QUARTER 2019 EARNINGS
GM's first-quarter operating results were in line with expectations we shared in January. My confidence in the year ahead remains strong, driven by our all-new full-size truck launch and our ongoing business transformation.”
– Mary Barra, Chairman and CEO
GM Reports Income of $2.1 Billion and EBIT-adj. of $2.3 Billion • Full-size truck launch ahead of plan; average transaction prices for all-new crew cabs up $5,800 vs. outgoing models.
• Execution of company’s transformation cost savings of $2 to $2.5 billion through 2019 remains on track.
GM remains firmly committed to investing in its U.S. manufacturing operations. Since 2009, GM has invested $22 billion in the U.S., including $4.3 billion since the beginning of 2017.
In March, the company announced a $300 million investment in its Orion, Michigan assembly plant to produce a future Chevrolet electric vehicle based on the Bolt EV architecture, adding 400 new jobs. The company is also adding a second shift and more than 400 new jobs at its Bowling Green, Kentucky plant to support production of the next-generation Corvette. GM has invested more than $900 million in its Bowling Green facility since 2011.
GM remains committed to making job opportunities available for all 2,800 U.S. hourly employees impacted by the company’s decision to unallocate plants. More than 1,300 hourly employees have accepted jobs at other GM facilities supporting growth segments including trucks, crossovers and SUVs.
Q1 sales of the 2019 Chevrolet Silverado and GMC Sierra light-duty crew cabs were up 20 percent year over year, delivering on GM’s strategy to launch high-content, high-margin trucks first. These all-new crew cab models generated transaction prices nearly $5,800 higher than the crew-cab models they replace (Q1 2018, J.D. Power PIN). The 2019 GMC Sierra leads the segment in pricing, with more than 95 percent of its sales in high-end models. Full production of regular and double cabs began in March, as planned.
GM begins the next phase of its full-size pickup truck launch in the second half of the year with the 2020 Chevrolet Silverado HD and GMC Sierra HD. These vehicles will be built at Flint Assembly, where 1,000 jobs were added and capacity increased to meet anticipated customer demand.
EPS-diluted and EPS-diluted-adj. include a benefit of $0.31 from Lyft and PSA revaluations.
Strong GMC Sierra 1500 Q1 sales led by surge in all-new crew cabs.
EBIT-adj. Margin EBIT-adj. Adj. Auto FCF EPS-Diluted-adj.
Non-GAAP 6.6% $2.3 B $(3.9) B $1.41vs. Q1 2018 (0.6) pts (11.5)% $(0.6) B (1.4)%
Net Revenue Income Auto Operating Cash Flow EPS-Diluted
GAAP $34.9 B $2.1 B $(2.2) B $1.48vs. Q1 2018 (3.4)% + 93.2% $(1.1) B + 92.2%
Q 1 2 0 1 9 R E S U LT S O V E R V I E W
CONTINUED INVESTMENT IN U.S. MANUFACTURING
GM IS BULLISH ON PICKUPS
We’re making progress on our businesstransformation. We expect our globalproduct mix, launch cadence and costefficiencies to drive earnings growththroughout the year.”
– Dhivya Suryadevara, CFO
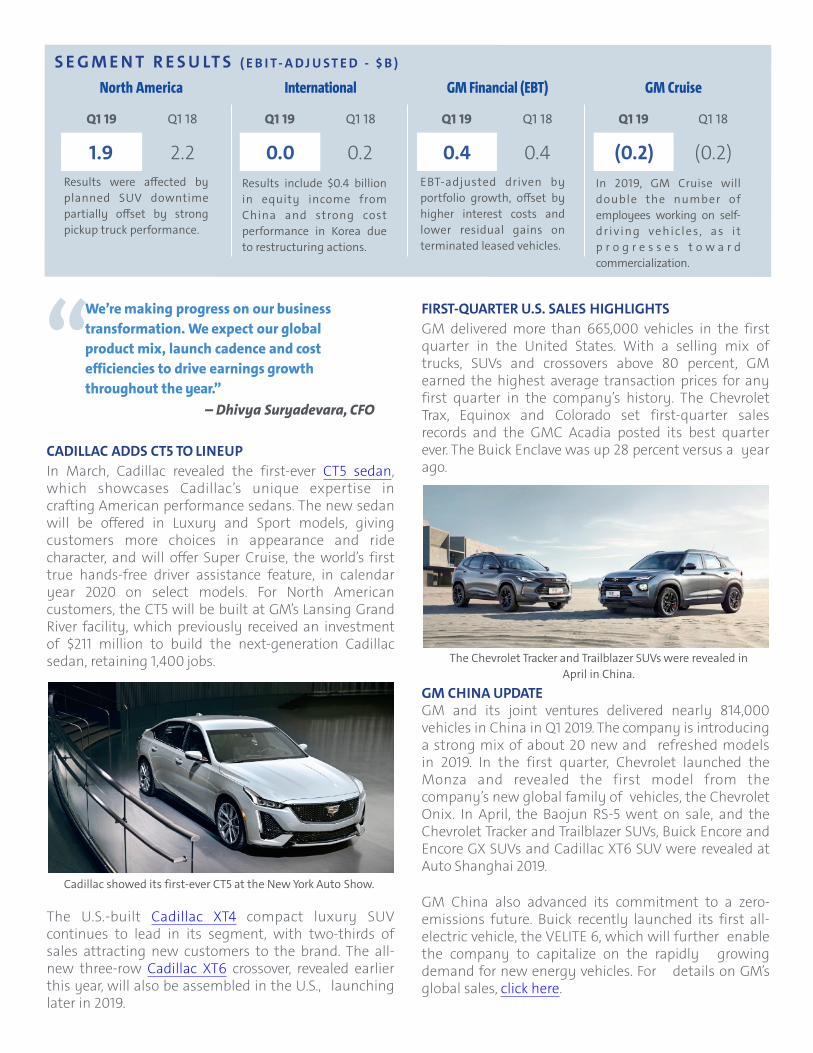
“CADILLAC ADDS CT5 TO LINEUP In March, Cadillac revealed the first-ever CT5 sedan, which showcases Cadillac’s unique expertise in crafting American performance sedans. The new sedan will be offered in Luxury and Sport models, giving customers more choices in appearance and ride character, and will offer Super Cruise, the world’s first true hands-free driver assistance feature, in calendar year 2020 on select models. For North American customers, the CT5 will be built at GM’s Lansing Grand River facility, which previously received an investment of $211 million to build the next-generation Cadillac sedan, retaining 1,400 jobs.
FIRST-QUARTER U.S. SALES HIGHLIGHTS GM delivered more than 665,000 vehicles in the first quarter in the United States. With a selling mix of trucks, SUVs and crossovers above 80 percent, GM earned the highest average transaction prices for any first quarter in the company’s history. The Chevrolet Trax, Equinox and Colorado set first-quarter sales records and the GMC Acadia posted its best quarter ever. The Buick Enclave was up 28 percent versus a year ago.
Cadillac showed its first-ever CT5 at the New York Auto Show.
The U.S.-built Cadillac XT4 compact luxury SUV continues to lead in its segment, with two-thirds of sales attracting new customers to the brand. The all- new three-row Cadillac XT6 crossover, revealed earlier this year, will also be assembled in the U.S., launching later in 2019.
GM and its joint ventures delivered nearly 814,000 vehicles in China in Q1 2019. The company is introducing a strong mix of about 20 new and refreshed models in 2019. In the first quarter, Chevrolet launched the Monza and revealed the first model from the company’s new global family of vehicles, the Chevrolet Onix. In April, the Baojun RS-5 went on sale, and the Chevrolet Tracker and Trailblazer SUVs, Buick Encore and Encore GX SUVs and Cadillac XT6 SUV were revealed at Auto Shanghai 2019.
GM China also advanced its commitment to a zero- emissions future. Buick recently launched its first all- electric vehicle, the VELITE 6, which will further enable the company to capitalize on the rapidly growing demand for new energy vehicles. For details on GM’s global sales, click here.
The Chevrolet Tracker and Trailblazer SUVs were revealed in April in China.
“North America International GM Financial (EBT) GM Cruise
Q1 19 Q1 18 Q1 19 Q1 18 Q1 19 Q1 18 Q1 19 Q1 18
1.9 2.2 0.0 0.2 0.4 0.4 (0.2) (0.2)Results were affected by planned SUV downtime partially offset by strong pickup truck performance.
In 2019, GM Cruise will double the number of employees working on self-dr iv ing vehic les, as i t p r o g r e s s e s t o w a r d commercialization.
S E G M E N T R E S U LT S ( E B I T- A D J U ST E D - $ B )
Results include $0.4 billion in equity income from China and strong cost performance in Korea due to restructuring actions.
EBT-adjusted driven by portfolio growth, offset by higher interest costs and lower residual gains on terminated leased vehicles.
GM CHINA UPDATE

General Motors (NYSE:GM) is committed to delivering safer, better and more sustainable ways for people to get around. General Motors, its subsidiaries and its joint venture entities sell vehicles under the Cadillac, Chevrolet, Baojun, Buick, GMC, Holden, Jiefang and Wuling brands. More information on the company and its subsidiaries, including OnStar, a global leader in vehicle safety and security services, Maven, its personal mobility brand, and Cruise, its autonomous vehicle business, can be found at gm.com.
Tom Henderson GM Finance Communications 313-410-2704 [email protected]
Media Investors
MEDIA CONTACT
Michael Heifler GM Investor Relations 313-418-0220 [email protected]
INVESTOR CONTACT
Cautionary Note on Forward-Looking Statements: This press release may include “forward-looking statements” within the meaning of the Private Securities
Litigation Reform Act of 1995. We caution readers not to place undue reliance on forward-looking statements. Statements including words such as
“anticipate,” “appears,” “approximately,” “believe,” “continue,” “could,” “designed,” “effect,” “estimate,” “evaluate,” “expect,” “forecast,” “goal,” “initiative,”
“intend,” “may,” “objective,” “outlook,” “plan,” “potential,” “priorities,” “project,” “pursue,” “seek,” “should,” “target,” “when,” “will,” “would,” or the negative
of any of those words or similar expressions to identify forward-looking statements represent our current judgment about possible future events. In making
these statements we rely upon assumptions and analysis based on our experience and perception of historical trends, current conditions and expected
future developments, as well as other factors we consider appropriate under the circumstances. These statements are not guarantees of future performance;
they involve risks and uncertainties and actual events or results may differ materially from these statements. Factors that might cause such differences
include, but are not limited to, a variety of economic, competitive and regulatory factors, many of which are beyond our control and are described in our
Annual Report on Form 10-K for the year ended December 31, 2018, as well as additional factors we may describe from time to time in other filings with the
U.S. Securities and Exchange Commission. We undertake no obligation to update publicly or otherwise revise any forward-looking statements, whether as a
result of new information, future events or other factors that affect the subject of these statements, except where we are expressly required to do so by law.
Basis of Presentation: The financial and operational information included in this press release relate to our continuing operations and not our discontinued
operations, which consist of the Opel and Vauxhall businesses and certain other assets in Europe and the European financing subsidiaries and branches that
were sold in 2017.

Exhibit 99.2
General Motors Company and SubsidiariesSupplemental Material
(Unaudited)
1
Unless otherwise indicated, General Motors Company's (GM) non-GAAP measures are related to our continuing operations and not our discontinued operations. GM's non-GAAP measures include: earnings before interest and taxes (EBIT)-adjusted, presented net of noncontrolling interests; earnings before taxes (EBT)-adjusted for our GM Financial segment; earnings per share (EPS)-diluted-adjusted; effective tax rate-adjusted (ETR-adjusted); return on invested capital-adjusted (ROIC-adjusted) and adjusted automotive free cash flow. GM's calculation of these non-GAAP measures may not be comparable to similarly titled measures of other companies due to potential differences between companies in the method of calculation. As a result, the use of these non-GAAP measures has limitations and should not be considered superior to, in isolation from, or as a substitute for, related U.S. GAAP measures.
These non-GAAP measures allow management and investors to view operating trends, perform analytical comparisons and benchmark performance between periods and among geographic regions to understand operating performance without regard to items we do not consider a component of our core operating performance. Furthermore, these non-GAAP measures allow investors the opportunity to measure and monitor our performance against our externally communicated targets and evaluate the investment decisions being made by management to improve ROIC-adjusted. Management uses these measures in its financial, investment and operational decision-making processes, for internal reporting and as part of its forecasting and budgeting processes. Further, our Board of Directors uses certain of these and other measures as key metrics to determine management performance under our performance-based compensation plans. For these reasons we believe these non-GAAP measures are useful for our investors.
EBIT-adjusted EBIT-adjusted is presented net of noncontrolling interests and is used by management and can be used by investors to review our consolidated operating results because it excludes automotive interest income, automotive interest expense and income taxes as well as certain additional adjustments that are not considered part of our core operations. Examples of adjustments to EBIT include but are not limited to impairment charges on long-lived assets and other exit costs resulting from strategic shifts in our operations or discrete market and business conditions; costs arising from the ignition switch recall and related legal matters; and certain currency devaluations associated with hyperinflationary economies. For EBIT-adjusted and our other non-GAAP measures, once we have made an adjustment in the current period for an item, we will also adjust the related non-GAAP measure in any future periods in which there is an impact from the item. Our corresponding measure for our GM Financial segment is EBT-adjusted.
EPS-diluted-adjusted EPS-diluted-adjusted is used by management and can be used by investors to review our consolidated diluted EPS results on a consistent basis. EPS-diluted-adjusted is calculated as net income attributable to common stockholders-diluted less income (loss) from discontinued operations on an after-tax basis, adjustments noted above for EBIT-adjusted and certain income tax adjustments divided by weighted-average common shares outstanding-diluted. Examples of income tax adjustments include the establishment or reversal of significant deferred tax asset valuation allowances.
ETR-adjusted ETR-adjusted is used by management and can be used by investors to review the consolidated effective tax rate for our core operations on a consistent basis. ETR-adjusted is calculated as Income tax expense less the income tax related to the adjustments noted above for EBIT-adjusted and the income tax adjustments noted above for EPS-diluted-adjusted divided by Income before income taxes less adjustments.
ROIC-adjusted ROIC-adjusted is used by management and can be used by investors to review our investment and capital allocation decisions. We define ROIC-adjusted as EBIT-adjusted for the trailing four quarters divided by ROIC-adjusted average net assets, which is considered to be the average equity balances adjusted for average automotive debt and interest liabilities, exclusive of capital leases; average net pension and other postretirement benefits (OPEB) liabilities; and average automotive net income tax assets during the same period. Adjustments to the average equity balances exclude assets and liabilities classified as either assets held for sale or liabilities held for sale.
Adjusted automotive free cash flow Adjusted automotive free cash flow is used by management and can be used by investors to review the liquidity of our automotive operations and to measure and monitor our performance against our capital allocation program and evaluate our automotive liquidity against the substantial cash requirements of our automotive operations. We measure adjusted automotive free cash flow as automotive operating cash flow from continuing operations less capital expenditures adjusted for management actions. Management actions can include voluntary events such as discretionary contributions to employee benefit plans or nonrecurring specific events such as a closure of a facility that are considered special for EBIT-adjusted purposes.

General Motors Company and SubsidiariesSupplemental Material
(Unaudited)
2
The following table reconciles segment profit (loss) to Net income attributable to stockholders under U.S. GAAP (dollars in millions):
Three Months Ended
March 31, 2019 March 31, 2018
Operating segmentsGM North America (GMNA) $ 1,896 $ 2,233GM International (GMI) 31 189GM Cruise (169) (166)General Motors Financial Company, Inc. (GM Financial)(a) 359 443
Total operating segments 2,117 2,699Corporate and eliminations(b) 193 (89)EBIT-adjusted 2,310 2,610Adjustments
Transformation activities(c) (790) —GM Brazil indirect tax recoveries(d) 857 —GMI restructuring(e) — (942)
Total adjustments 67 (942)Automotive interest income 98 64Automotive interest expense (181) (150)Income tax expense (137) (466)Income from continuing operations(f) 2,157 1,116Loss from discontinued operations, net of tax(g) — 70Net income attributable to stockholders $ 2,157 $ 1,046
__________(a) GM Financial amounts represent earnings before income taxes-adjusted.(b) GM's automotive operations' interest income and interest expense, Maven, legacy costs from the Opel and Vauxhall businesses and certain
other assets in Europe (the Opel/Vauxhall Business), which are primarily pension costs, corporate expenditures and certain nonsegment-specific revenues and expenses are recorded centrally in Corporate.
(c) This adjustment was excluded because of a strategic decision to accelerate our transformation for the future to strengthen our core business, capitalize on the future of personal mobility and drive significant cost efficiencies. The adjustment primarily consists of accelerated depreciation.
(d) This adjustment was excluded because of the unique event associated with a decision rendered by the Superior Judicial Court of Brazil resulting in retrospective recoveries of indirect taxes.
(e) This adjustment was excluded because of a strategic decision to rationalize our core operations by exiting or significantly reducing our presence in various international markets to focus resources on opportunities expected to deliver higher returns. The adjustment primarily consists of asset impairments and employee separation costs in Korea.
(f) Net of Net loss attributable to noncontrolling interests.(g) Represents the results of the Opel/Vauxhall Business and our European financing subsidiaries and branches (the Fincos, and together with
the Opel/Vauxhall Business, the European Business).
General Motors Company and SubsidiariesSupplemental Material
(Unaudited)
3
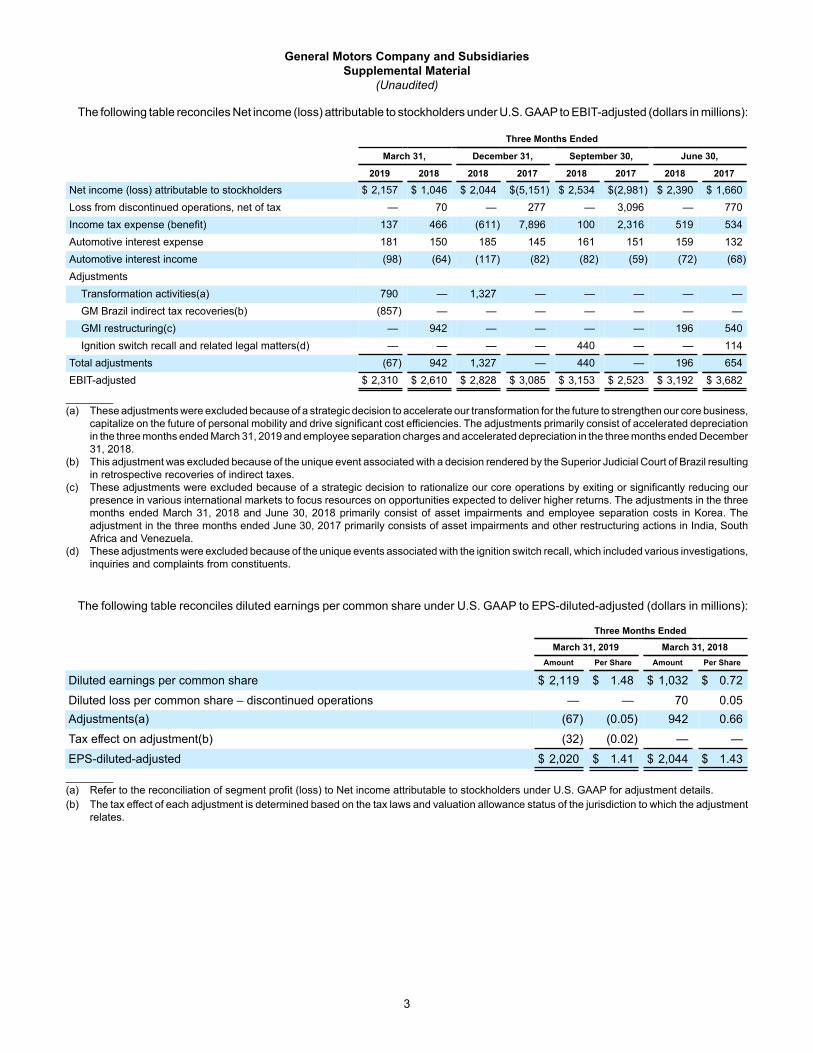
The following table reconciles Net income (loss) attributable to stockholders under U.S. GAAP to EBIT-adjusted (dollars in millions):
Three Months Ended
March 31, December 31, September 30, June 30,
2019 2018 2018 2017 2018 2017 2018 2017
Net income (loss) attributable to stockholders $ 2,157 $ 1,046 $ 2,044 $(5,151) $ 2,534 $(2,981) $ 2,390 $ 1,660Loss from discontinued operations, net of tax — 70 — 277 — 3,096 — 770Income tax expense (benefit) 137 466 (611) 7,896 100 2,316 519 534Automotive interest expense 181 150 185 145 161 151 159 132Automotive interest income (98) (64) (117) (82) (82) (59) (72) (68)Adjustments
Transformation activities(a) 790 — 1,327 — — — — —GM Brazil indirect tax recoveries(b) (857) — — — — — — —GMI restructuring(c) — 942 — — — — 196 540Ignition switch recall and related legal matters(d) — — — — 440 — — 114
Total adjustments (67) 942 1,327 — 440 — 196 654EBIT-adjusted $ 2,310 $ 2,610 $ 2,828 $ 3,085 $ 3,153 $ 2,523 $ 3,192 $ 3,682
________(a) These adjustments were excluded because of a strategic decision to accelerate our transformation for the future to strengthen our core business,
capitalize on the future of personal mobility and drive significant cost efficiencies. The adjustments primarily consist of accelerated depreciation in the three months ended March 31, 2019 and employee separation charges and accelerated depreciation in the three months ended December 31, 2018.
(b) This adjustment was excluded because of the unique event associated with a decision rendered by the Superior Judicial Court of Brazil resulting in retrospective recoveries of indirect taxes.
(c) These adjustments were excluded because of a strategic decision to rationalize our core operations by exiting or significantly reducing our presence in various international markets to focus resources on opportunities expected to deliver higher returns. The adjustments in the three months ended March 31, 2018 and June 30, 2018 primarily consist of asset impairments and employee separation costs in Korea. The adjustment in the three months ended June 30, 2017 primarily consists of asset impairments and other restructuring actions in India, South Africa and Venezuela.
(d) These adjustments were excluded because of the unique events associated with the ignition switch recall, which included various investigations, inquiries and complaints from constituents.
The following table reconciles diluted earnings per common share under U.S. GAAP to EPS-diluted-adjusted (dollars in millions):
Three Months Ended
March 31, 2019 March 31, 2018Amount Per Share Amount Per Share
Diluted earnings per common share $ 2,119 $ 1.48 $ 1,032 $ 0.72
Diluted loss per common share – discontinued operations — — 70 0.05Adjustments(a) (67) (0.05) 942 0.66
Tax effect on adjustment(b) (32) (0.02) — —
EPS-diluted-adjusted $ 2,020 $ 1.41 $ 2,044 $ 1.43________(a) Refer to the reconciliation of segment profit (loss) to Net income attributable to stockholders under U.S. GAAP for adjustment details. (b) The tax effect of each adjustment is determined based on the tax laws and valuation allowance status of the jurisdiction to which the adjustment
relates.

General Motors Company and SubsidiariesSupplemental Material
(Unaudited)
4
The following table reconciles our effective tax rate under U.S. GAAP to ETR-adjusted (dollars in millions):
Three Months Ended
March 31, 2019 March 31, 2018Income before income taxes
Income taxexpense
Effectivetax rate
Income beforeincome taxes
Income taxexpense
Effectivetax rate
Effective tax rate $ 2,282 $ 137 6.0% $ 1,576 $ 466 29.6%
Adjustments(a)(b) (67) 32 942 —
ETR-adjusted $ 2,215 $ 169 7.6% $ 2,518 $ 466 18.5%
________(a) Refer to the reconciliation of segment profit (loss) to Net income attributable to stockholders under U.S. GAAP for adjustment details. (b) The tax effect of each adjustment is determined based on the tax laws and valuation allowance status of the jurisdiction to which the adjustment
relates.
We define return on equity (ROE) as Net income (loss) attributable to stockholders for the trailing four quarters divided by average equity for the same period. Management uses average equity to provide comparable amounts in the calculation of ROE. The following table summarizes the calculation of ROE (dollars in billions):
Four Quarters Ended
March 31, 2019 March 31, 2018
Net income (loss) attributable to stockholders $ 9.1 $ (5.4)
Average equity(a) $ 39.3 $ 39.3
ROE 23.2% (13.8)%________(a) Includes equity of noncontrolling interests where the corresponding earnings (loss) are included in Net income (loss) attributable to stockholders.
The following table summarizes the calculation of ROIC-adjusted (dollars in billions):
Four Quarters Ended
March 31, 2019 March 31, 2018
EBIT-adjusted(a) $ 11.5 $ 11.9
Average equity(b) $ 39.3 $ 39.3Add: Average automotive debt and interest liabilities (excluding capital leases) 14.4 12.7
Add: Average automotive net pension & OPEB liability 17.5 20.6
Less: Average automotive and other net income tax asset (22.9) (26.9)ROIC-adjusted average net assets $ 48.3 $ 45.7ROIC-adjusted 23.8% 26.0%________(a) Refer to the reconciliation of Net income (loss) attributable to stockholders under U.S. GAAP to EBIT-adjusted.(b) Includes equity of noncontrolling interests where the corresponding earnings (loss) are included in EBIT-adjusted.

General Motors Company and SubsidiariesSupplemental Material
(Unaudited)
5
The following table reconciles Net automotive cash used in operating activities from continuing operations under U.S. GAAP to adjusted automotive free cash flow (dollars in millions):
Three Months Ended
March 31, 2019 March 31, 2018
Net automotive cash used in operating activities $ (2,207) $ (1,063)Less: Capital expenditures (1,993) (2,240)Add: Transformation activities 315 —Add: GMI restructuring 9 —Adjusted automotive free cash flow $ (3,876) $ (3,303)
The following tables summarize key financial information by segment (dollars in millions):
GMNA GMI Corporate EliminationsTotal
AutomotiveGM
CruiseGM
Financial Eliminations Total
Three Months Ended March 31, 2019
Net sales and revenue $ 27,365 $ 3,850 $ 46 $ 31,261 $ 25 $ 3,620 $ (28) $ 34,878Expenditures for property $ 1,701 $ 292 $ — $ — $ 1,993 $ 4 $ 17 $ — $ 2,014Depreciation and amortization $ 2,069 $ 127 $ 12 $ — $ 2,208 $ 2 $ 1,899 $ — $ 4,109Impairment charges $ 7 $ — $ — $ — $ 7 $ — $ — $ — $ 7Equity income(a) $ 2 $ 374 $ (7) $ — $ 369 $ — $ 45 $ — $ 414
GMNA GMI Corporate EliminationsTotal
AutomotiveGM
CruiseGM
Financial Eliminations Total
Three Months Ended March 31, 2018
Net sales and revenue $ 27,818 $ 4,848 $ 49 $ 32,715 $ — $ 3,411 $ (27) $ 36,099Expenditures for property $ 2,064 $ 162 $ 14 $ — $ 2,240 $ 12 $ 20 $ — $ 2,272Depreciation and amortization $ 1,109 $ 153 $ 11 $ — $ 1,273 $ 1 $ 1,823 $ — $ 3,097Impairment charges $ 25 $ 459 $ — $ — $ 484 $ — $ — $ — $ 484Equity income(a) $ 2 $ 594 $ — $ — $ 596 $ — $ 52 $ — $ 648
________(a) Includes Automotive China equity income of $376 million and $597 million in the three months ended March 31, 2019 and 2018.

General Motors Company and SubsidiariesSupplemental Material
(Unaudited)
6
Vehicle Sales
GM presents both wholesale and total vehicle sales data to assist in the analysis of our revenue and our market share. Cuba, Iran, North Korea, Sudan and Syria are subject to broad economic sanctions. Accordingly these countries are excluded from industry sales data and the corresponding calculation of GM's market share.
Wholesale vehicle sales data consists of sales to GM's dealers and distributors as well as sales to the U.S. Government, and excludes vehicles sold by our joint ventures. Wholesale vehicle sales data correlates to GM's revenue recognized from the sale of vehicles, which is the largest component of Automotive net sales and revenue. In the three months ended March 31, 2019, 34.0% of our wholesale vehicle sales volume was generated outside the U.S. The following table summarizes wholesale vehicle sales by automotive segment (vehicles in thousands):
Three Months Ended
March 31, 2019 March 31, 2018
GMNA 859 893GMI 236 266Total 1,095 1,159

General Motors Company and SubsidiariesSupplemental Material
(Unaudited)
7
Total vehicle sales data represents: (1) retail sales (i.e., sales to consumers who purchase new vehicles from dealers or distributors); (2) fleet sales, such as sales to large and small businesses, governments, and daily rental car companies; and (3) vehicles used by dealers in their businesses, including courtesy transportation vehicles. Total vehicle sales data includes all sales by joint ventures on a total vehicle basis, not based on our percentage ownership interest in the joint venture. Certain joint venture agreements in China allow for the contractual right to report vehicle sales of non-GM trademarked vehicles by those joint ventures, which are included in the total vehicle sales we report for China. While total vehicle sales data does not correlate directly to the revenue GM recognizes during a particular period, we believe it is indicative of the underlying demand for GM vehicles. Total vehicle sales data represents management's good faith estimate based on sales reported by GM's dealers, distributors, and joint ventures, commercially available data sources such as registration and insurance data, and internal estimates and forecasts when other data is not available.
The following table summarizes total vehicle sales by geographic region (vehicles in thousands):
Three Months Ended
March 31, 2019 March 31, 2018
United StatesChevrolet – Cars 100 121Chevrolet – Trucks 197 223Chevrolet – Crossovers 155 147Cadillac 36 37Buick 52 57GMC 126 131Total United States 666 716
Canada, Mexico and Other 109 111Total North America 775 827
Asia/Pacific, Middle East and AfricaChevrolet 221 217Wuling 266 289Buick 225 272Baojun 169 244Cadillac 46 57Other 20 22Total Asia/Pacific, Middle East and Africa 947 1,101
South America(a) 156 168Total in GM markets 1,878 2,096Total Europe 1 1Total Worldwide 1,879 2,097
_______(a) Primarily Chevrolet.

General Motors Company and SubsidiariesSupplemental Material
(Unaudited)
8
The vehicle sales at GM's China joint ventures presented in the following table are included in the preceding vehicle sales table (vehicles in thousands):
Three Months Ended
March 31, 2019 March 31, 2018
SAIC General Motors Sales Co., Ltd. 382 457SAIC GM Wuling Automobile Co., Ltd. and FAW-GM Light Duty Commercial Vehicle Co., Ltd. 432 529
Three Months Ended
March 31, 2019 March 31, 2018
Market ShareUnited States – Cars 9.4% 10.9%United States – Trucks(a) 28.0% 31.9%United States – Crossovers(a) 14.5% 14.1%Total United States 16.1% 17.0%Total North America 15.6% 16.3%Total Asia/Pacific, Middle East and Africa 8.0% 9.0%Total South America 15.5% 15.5%
Total GM Market 10.6% 11.4%Total Worldwide 8.3% 8.9%
United States fleet sales as a percentage of retail vehicle sales 25.0% 23.0%
North America capacity two shift utilization 100.7% 99.0%________(a) Certain industry vehicles have been reclassified between these vehicle segments. GM vehicles were not impacted by this change. The prior
period has been recast to reflect the changes.

General Motors Company and Subsidiaries
9
Combining Income Statement Information(In millions) (Unaudited)
Three Months Ended March 31, 2019 Three Months Ended March 31, 2018
AutomotiveGM
CruiseGM
FinancialReclassifications
/Eliminations Combined AutomotiveGM
CruiseGM
Financial Eliminations Combined
Net sales and revenueAutomotive $ 31,261 $ 25 $ — $ (25) $ 31,261 $ 32,715 $ — $ — $ (24) $ 32,691GM Financial — — 3,620 (3) 3,617 — — 3,411 (3) 3,408Total net sales and revenue 31,261 25 3,620 (28) 34,878 32,715 — 3,411 (27) 36,099
Costs and expensesAutomotive and other cost
of sales 28,035 195 — (1) 28,229 30,061 148 — (25) 30,184GM Financial interest,
operating and other expenses — — 3,306 — 3,306 — — 3,020 (6) 3,014
Automotive and other selling, general and administrative expense 2,080 19 — — 2,099 2,354 18 — — 2,372
Total costs and expenses 30,115 214 3,306 (1) 33,634 32,415 166 3,020 (31) 35,570Operating income (loss) 1,146 (189) 314 (27) 1,244 300 (166) 391 4 529
Automotive interest expense 184 — — (3) 181 152 — — (2) 150Interest income and other
non-operating income, net 768 24 — 13 805 549 — — — 549Equity income 369 — 45 — 414 596 — 52 — 648Income (loss) before income
taxes $ 2,099 $ (165) $ 359 $ (11) 2,282 $ 1,293 $ (166) $ 443 $ 6 1,576Income tax expense 137 466Income from continuing
operations 2,145 1,110Loss from discontinued
operations, net of tax — 70Net income 2,145 1,040Net loss attributable to
noncontrolling interests 12 6Net income attributable to
stockholders $ 2,157 $ 1,046
Net income attributable to common stockholders $ 2,119 $ 1,032

General Motors Company and Subsidiaries
10
Basic and Diluted Earnings per Share(Unaudited)
The following table summarizes basic and diluted earnings (loss) per share (in millions, except per share amounts):
Three Months Ended
March 31, 2019 March 31, 2018
Basic earnings per share
Income from continuing operations(a) $ 2,157 $ 1,116Less: cumulative dividends on subsidiary preferred stock (38) (14)Income from continuing operations attributable to common stockholders 2,119 1,102Loss from discontinued operations, net of tax — 70Net income attributable to common stockholders $ 2,119 $ 1,032
Weighted-average common shares outstanding 1,417 1,408
Basic earnings per common share – continuing operations $ 1.50 $ 0.78Basic loss per common share – discontinued operations $ — $ 0.05Basic earnings per common share $ 1.50 $ 0.73
Diluted earnings per share
Income from continuing operations attributable to common stockholders – diluted(a) $ 2,119 $ 1,102Loss from discontinued operations, net of tax – diluted $ — $ 70Net income attributable to common stockholders – diluted $ 2,119 $ 1,032
Weighted-average common shares outstanding – diluted 1,436 1,430
Diluted earnings per common share – continuing operations $ 1.48 $ 0.77Diluted loss per common share – discontinued operations $ — $ 0.05Diluted earnings per common share $ 1.48 $ 0.72Potentially dilutive securities(b) 8 4
__________(a) Net of Net loss attributable to noncontrolling interests.(b) Potentially dilutive securities attributable to outstanding stock options and Restricted Stock Units were excluded from the computation of diluted
EPS because the securities would have had an antidilutive effect.

General Motors Company and Subsidiaries
11
Combining Balance Sheet Information(In millions, except per share amounts) (Unaudited)
March 31, 2019 December 31, 2018
AutomotiveGM
CruiseGM
FinancialReclassifications
/Eliminations Combined AutomotiveGM
CruiseGM
FinancialReclassifications
/Eliminations Combined
ASSETSCurrent Assets
Cash and cash equivalents $ 9,758 $ 2,132 $ 5,286 $ — $ 17,176 $ 13,670 $ 2,291 $ 4,883 $ — $ 20,844Marketable securities(a) 6,021 90 — (90) 6,021 5,966 92 — (92) 5,966Accounts and notes receivable, net(b) 11,682 2 1,148 (716) 12,116 5,916 1 1,430 (798) 6,549GM Financial receivables, net(c) — — 27,722 (492) 27,230 — — 27,367 (517) 26,850Inventories 11,108 — — — 11,108 9,816 — — — 9,816Other current assets(d) 1,917 45 4,509 (32) 6,439 1,619 27 3,640 (18) 5,268Total current assets 40,486 2,269 38,665 (1,330) 80,090 36,987 2,411 37,320 (1,425) 75,293
Non-current AssetsGM Financial receivables, net(c) — — 25,507 (59) 25,448 — — 25,145 (62) 25,083Equity in net assets of
nonconsolidated affiliates 6,837 — 1,429 — 8,266 7,860 — 1,355 — 9,215Property, net 38,042 45 249 — 38,336 38,464 43 251 — 38,758Goodwill and intangible assets, net 3,491 670 1,357 — 5,518 3,552 671 1,356 — 5,579Equipment on operating leases, net — — 43,052 — 43,052 — — 43,559 — 43,559Deferred income taxes 24,162 117 24 — 24,303 23,935 70 77 — 24,082Other assets 7,055 127 937 — 8,119 4,880 — 890 — 5,770Total non-current assets 79,587 959 72,555 (59) 153,042 78,691 784 72,633 (62) 152,046
Total Assets $120,073 $ 3,228 $111,220 $ (1,389) $ 233,132 $115,678 $ 3,195 $109,953 $ (1,487) $227,339LIABILITIES AND EQUITY
Current LiabilitiesAccounts payable (principally trade)(b) $ 24,607 $ 45 $ 650 $ (742) $ 24,560 $ 22,359 $ 28 $ 707 $ (797) $ 22,297Short-term debt and current portion of
long-term debtAutomotive(c) 2,491 — — (492) 1,999 1,452 — — (517) 935GM Financial — — 31,273 — 31,273 — — 30,956 — 30,956
Accrued liabilities 23,634 68 3,801 (32) 27,471 24,042 41 3,985 (19) 28,049Total current liabilities 50,732 113 35,724 (1,266) 85,303 47,853 69 35,648 (1,333) 82,237
Non-current LiabilitiesLong-term debt
Automotive(c) 13,013 — — (59) 12,954 13,090 — — (62) 13,028GM Financial — — 60,858 — 60,858 — — 60,032 — 60,032
Postretirement benefits other thanpensions 5,363 — — — 5,363 5,370 — — — 5,370
Pensions 11,096 — 3 — 11,099 11,535 — 3 — 11,538Other liabilities 10,574 148 2,195 — 12,917 10,167 35 2,155 — 12,357Total non-current liabilities 40,046 148 63,056 (59) 103,191 40,162 35 62,190 (62) 102,325
Total Liabilities 90,778 261 98,780 (1,325) 188,494 88,015 104 97,838 (1,395) 184,562Commitments and contingenciesEquity
Common stock, $0.01 par value 14 — — — 14 14 — — — 14Preferred stock, $0.01 par value — — — — — — — — — —Additional paid-in capital(a)(e) 25,681 10 1,373 (1,403) 25,661 25,606 4 1,373 (1,420) 25,563Retained earnings(a) 10,531 1,375 12,066 (33) 23,939 9,103 1,480 11,783 (44) 22,322Accumulated other comprehensive
loss (7,850) — (999) — (8,849) (7,998) — (1,041) — (9,039)Total stockholders’ equity 28,376 1,385 12,440 (1,436) 40,765 26,725 1,484 12,115 (1,464) 38,860Noncontrolling interests(e) 919 1,582 — 1,372 3,873 938 1,607 — 1,372 3,917
Total Equity 29,295 2,967 12,440 (64) 44,638 27,663 3,091 12,115 (92) 42,777Total Liabilities and Equity $120,073 $ 3,228 $111,220 $ (1,389) $ 233,132 $115,678 $ 3,195 $109,953 $ (1,487) $227,339
_________(a) Elimination primarily includes GM Cruise investment in GM common stock at March 31, 2019 and December 31, 2018.(b) Eliminations primarily include Automotive accounts receivable of $66 million offset by GM Financial accounts payable and GM Financial accounts receivable of $640 million offset by Automotive
accounts payable at March 31, 2019 and Automotive accounts receivable of $63 million offset by GM Financial accounts payable and GM Financial accounts receivable of $729 million offset by Automotive accounts payable at December 31, 2018.
(c) Eliminations include GM Financial loan receivable of $551 million and $579 million offset by an Automotive loan payable at March 31, 2019 and December 31, 2018.(d) Includes the reclassification of the current portion of Equipment on operating leases, net. The prior period has been recast to reflect the changes.(e) Primarily reclassification of GM Financial Cumulative Perpetual Preferred Stock, Series A and B. The preferred stock is classified as noncontrolling interests in our condensed consolidated balance
sheet.

General Motors Company and Subsidiaries
12
Combining Cash Flow Information(In millions) (Unaudited)
Three Months Ended March 31, 2019 Three Months Ended March 31, 2018
AutomotiveGM
CruiseGM
FinancialReclassification/
Eliminations Combined AutomotiveGM
CruiseGM
FinancialReclassification/
Eliminations Combined
Cash flows from operating activitiesIncome (loss) from continuing operations $ 2,001 $ (118) $ 273 $ (11) $ 2,145 $ 886 $ (156) $ 374 $ 6 $ 1,110Depreciation and impairment of Equipment on
operating leases, net 16 — 1,881 — 1,897 52 — 1,807 — 1,859Depreciation, amortization and impairment
charges on Property, net 2,199 2 18 — 2,219 1,705 1 16 — 1,722Foreign currency remeasurement and
transaction (gains) losses 82 — (2) — 80 238 — 5 — 243Undistributed earnings of nonconsolidated
affiliates, net (368) — (45) — (413) (596) — (52) — (648)Pension contributions and OPEB payments (291) — — — (291) (400) — — — (400)Pension and OPEB income, net (149) — — — (149) (300) — — — (300)Provision (benefit) for deferred taxes (273) (47) 67 — (253) 328 (10) 47 — 365Change in other operating assets and
liabilities(a)(b) (5,424) 16 (49) 141 (5,316) (2,976) 16 (528) (15) (3,503)Net cash provided by (used in) operating
activities (2,207) (147) 2,143 130 (81) (1,063) (149) 1,669 (9) 448Cash flows from investing activities
Expenditures for property (1,993) (4) (17) — (2,014) (2,240) (12) (20) — (2,272)Available-for-sale marketable securities,
acquisitions (677) — — — (677) (914) — — — (914)Available-for-sale marketable securities,
liquidations 678 12 — (12) 678 2,062 — — — 2,062Purchases of finance receivables, net(a)(b) — — (7,222) 7 (7,215) — — (5,073) 148 (4,925)Principal collections and recoveries on finance
receivables(b) — — 6,370 (163) 6,207 — — 3,608 (130) 3,478Purchases of leased vehicles, net — — (3,747) — (3,747) — — (4,496) — (4,496)Proceeds from termination of leased vehicles — — 3,059 — 3,059 — — 2,379 — 2,379Other investing activities(c) (4) — 1 1 (2) (202) — — 162 (40)Net cash provided by (used in) investing
activities – continuing operations (1,996) 8 (1,556) (167) (3,711) (1,294) (12) (3,602) 180 (4,728)Net cash provided by investing activities –
discontinued operations — — — — — 166 — — — 166Net cash provided by (used in) investing
activities (1,996) 8 (1,556) (167) (3,711) (1,128) (12) (3,602) 180 (4,562)Cash flows from financing activities
Net increase in short-term debt 480 — 479 — 959 97 — 23 — 120Proceeds from issuance of debt (original
maturities greater than three months)(c) 683 1 11,074 (1) 11,757 1,871 162 9,463 (162) 11,334Payments on debt (original maturities greater
than three months) (110) — (10,682) 15 (10,777) (166) — (6,652) (14) (6,832)Dividends paid (565) (16) (46) 1 (626) (536) — (30) — (566)Other financing activities(d) (222) (2) (34) 22 (236) (244) (8) (40) 5 (287)
Net cash provided by (used in) financingactivities 266 (17) 791 37 1,077 1,022 154 2,764 (171) 3,769
Effect of exchange rate changes on cash, cashequivalents and restricted cash (8) — 8 — — 36 — 8 — 44
Net increase (decrease) in cash, cashequivalents and restricted cash (3,945) (156) 1,386 — (2,715) (1,133) (7) 839 — (301)
Cash, cash equivalents and restricted cash atbeginning of period 13,762 2,291 7,443 — 23,496 11,258 23 6,567 — 17,848
Cash, cash equivalents and restricted cash atend of period $ 9,817 $2,135 $ 8,829 $ — $20,781 $ 10,125 $ 16 $ 7,406 $ — $17,547
Cash, cash equivalents and restricted cash –continuing operations at end of period $ 9,817 $2,135 $ 8,829 $ — $20,781 $ 10,125 $ 16 $ 7,406 $ — $17,547
_________(a) Includes reclassifications of $200 million and $13 million in the three months ended March 31, 2019 and 2018 for purchases/collections of wholesale finance receivables resulting from vehicles
sold by GM to dealers that have arranged their inventory floor plan financing through GM Financial.(b) Eliminations include $207 million and $161 million in Purchases of finance receivables, net in the three months ended March 31, 2019 and 2018, and $163 million and $129 million in Principal
collections and recoveries on finance receivables in the three months ended March 31, 2019 and 2018 primarily related to the re-timing of cash receipts and payments between Automotive and GM Financial.
(c) Eliminations include an insignificant amount in the three months ended March 31, 2019 and $162 million for Automotive cash injections in GM Cruise in the three months ended March 31, 2018.(d) Includes the reclassification of Payments to purchase common stock. The prior period has been recast to reflect the changes.

![Charts on Q4 FY 2019/20 Facts & Figures - ThyssenKrupp · 2020. 10. 1. · Q4 EBIT adj. with sequential recovery, particularly at Auto and Materials businesses [€ mn] 1. Figures](https://img.pdfslide.us/doc/110x75/60bb7a6789ce347487097e40/charts-on-q4-fy-201920-facts-figures-thyssenkrupp-2020-10-1-q4-ebit.jpg)