Embed Size (px)
Citation preview
Linear versus Mel Frequency Cepstral Coefficients
for Speaker Recognition Xinhui Zhou
#1, Daniel Garcia-Romero
#2, Ramani Duraiswami
*3, Carol Espy-Wilson
#4, Shihab Shamma
#5
# Department of Electrical and Computer Engineering, University of Maryland, College Park, USA [email protected],
* Department of Computer Science, University of Maryland, College Park, USA [email protected]
Abstract—Mel-frequency cepstral coefficients (MFCC) have
been dominantly used in speaker recognition as well as in speech
recognition. However, based on theories in speech production,
some speaker characteristics associated with the structure of the
vocal tract, particularly the vocal tract length, are reflected more
in the high frequency range of speech. This insight suggests that
a linear scale in frequency may provide some advantages in
speaker recognition over the mel scale. Based on two state-of-the-
art speaker recognition back-end systems (one Joint Factor
Analysis system and one Probabilistic Linear Discriminant
Analysis system), this study compares the performances between
MFCC and LFCC (Linear frequency cepstral coefficients) in the
NIST SRE (Speaker Recognition Evaluation) 2010 extended-core
task. Our results in SRE10 show that, while they are
complementary to each other, LFCC consistently outperforms
MFCC, mainly due to its better performance in the female trials.
This can be explained by the relatively shorter vocal tract in
females and the resulting higher formant frequencies in speech.
LFCC benefits more in female speech by better capturing the
spectral characteristics in the high frequency region. In addition,
our results show some advantage of LFCC over MFCC in
reverberant speech. LFCC is as robust as MFCC in the babble
noise, but not in the white noise. It is concluded that LFCC
should be more widely used, at least for the female trials, by the
mainstream of the speaker recognition community.
I. INTRODUCTION
A. Motivation
Mel-frequency cepstral coefficients (MFCC) [1] have been
dominantly used in speaker recognition as well as in speech
recognition. This is counterintuitive to many researchers since
speech recognition and speaker recognition seek different
types of information from speech, namely, phonetic
information for speech recognition and speaker information
for speaker recognition. MFCC was first proposed for speech
recognition and its mel-warped frequency scale is to mimic how human ears process sound. Its spectral resolution
becomes lower as the frequency increases. Therefore, the
information in the higher frequency region is down-sampled
by the mel scale. However, based on theory in speech
production [2][3], speaker characteristics associated with the
structure of the vocal tract, particularly the vocal tract length,
are reflected more in the high frequency region of speech.
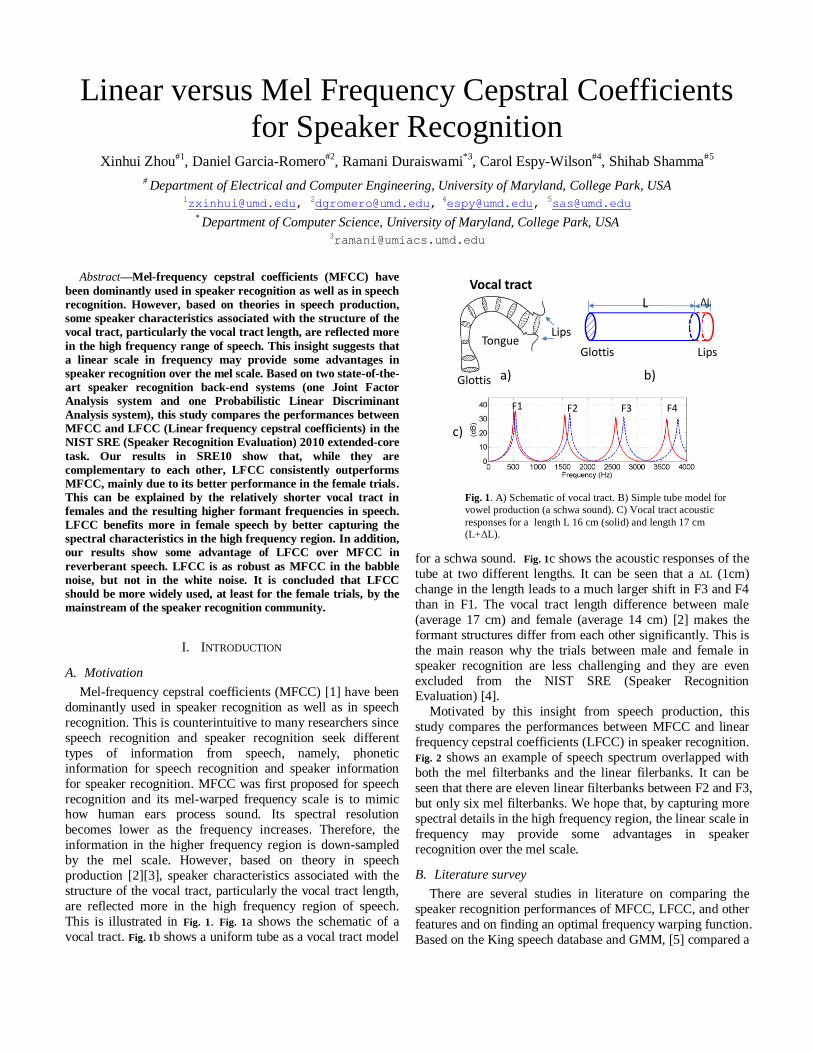
This is illustrated in Fig. 1. Fig. 1a shows the schematic of a
vocal tract. Fig. 1b shows a uniform tube as a vocal tract model
for a schwa sound. Fig. 1c shows the acoustic responses of the
tube at two different lengths. It can be seen that a ΔL (1cm)
change in the length leads to a much larger shift in F3 and F4
than in F1. The vocal tract length difference between male
(average 17 cm) and female (average 14 cm) [2] makes the
formant structures differ from each other significantly. This is
the main reason why the trials between male and female in
speaker recognition are less challenging and they are even
excluded from the NIST SRE (Speaker Recognition Evaluation) [4].
Motivated by this insight from speech production, this
study compares the performances between MFCC and linear
frequency cepstral coefficients (LFCC) in speaker recognition.
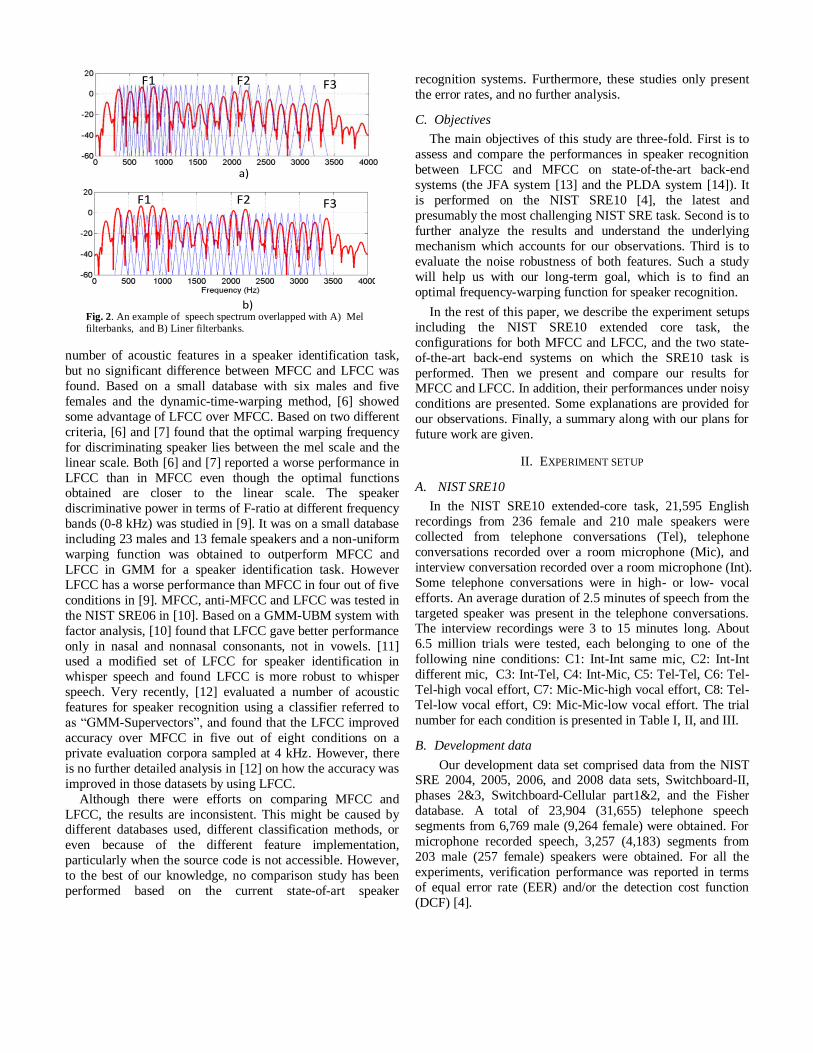
Fig. 2 shows an example of speech spectrum overlapped with
both the mel filterbanks and the linear filerbanks. It can be
seen that there are eleven linear filterbanks between F2 and F3,
but only six mel filterbanks. We hope that, by capturing more
spectral details in the high frequency region, the linear scale in
frequency may provide some advantages in speaker
recognition over the mel scale.
B. Literature survey
There are several studies in literature on comparing the
speaker recognition performances of MFCC, LFCC, and other
features and on finding an optimal frequency warping function.
Based on the King speech database and GMM, [5] compared a
Fig. 1. A) Schematic of vocal tract. B) Simple tube model for
vowel production (a schwa sound). C) Vocal tract acoustic
responses for a length L 16 cm (solid) and length 17 cm
(L+ΔL).
F1 F2 F3 F4
Vocal tract
Tongue
Glottis
Lips
a)
c)
b)
L ΔL
Glottis Lips
number of acoustic features in a speaker identification task,
but no significant difference between MFCC and LFCC was
found. Based on a small database with six males and five
females and the dynamic-time-warping method, [6] showed
some advantage of LFCC over MFCC. Based on two different
criteria, [6] and [7] found that the optimal warping frequency
for discriminating speaker lies between the mel scale and the
linear scale. Both [6] and [7] reported a worse performance in
LFCC than in MFCC even though the optimal functions obtained are closer to the linear scale. The speaker
discriminative power in terms of F-ratio at different frequency
bands (0-8 kHz) was studied in [9]. It was on a small database
including 23 males and 13 female speakers and a non-uniform
warping function was obtained to outperform MFCC and
LFCC in GMM for a speaker identification task. However
LFCC has a worse performance than MFCC in four out of five
conditions in [9]. MFCC, anti-MFCC and LFCC was tested in
the NIST SRE06 in [10]. Based on a GMM-UBM system with
factor analysis, [10] found that LFCC gave better performance
only in nasal and nonnasal consonants, not in vowels. [11] used a modified set of LFCC for speaker identification in
whisper speech and found LFCC is more robust to whisper
speech. Very recently, [12] evaluated a number of acoustic
features for speaker recognition using a classifier referred to
as “GMM-Supervectors”, and found that the LFCC improved
accuracy over MFCC in five out of eight conditions on a
private evaluation corpora sampled at 4 kHz. However, there
is no further detailed analysis in [12] on how the accuracy was
improved in those datasets by using LFCC.
Although there were efforts on comparing MFCC and
LFCC, the results are inconsistent. This might be caused by different databases used, different classification methods, or
even because of the different feature implementation,
particularly when the source code is not accessible. However,
to the best of our knowledge, no comparison study has been
performed based on the current state-of-art speaker
recognition systems. Furthermore, these studies only present
the error rates, and no further analysis.
C. Objectives
The main objectives of this study are three-fold. First is to
assess and compare the performances in speaker recognition
between LFCC and MFCC on state-of-the-art back-end
systems (the JFA system [13] and the PLDA system [14]). It
is performed on the NIST SRE10 [4], the latest and
presumably the most challenging NIST SRE task. Second is to
further analyze the results and understand the underlying
mechanism which accounts for our observations. Third is to
evaluate the noise robustness of both features. Such a study
will help us with our long-term goal, which is to find an
optimal frequency-warping function for speaker recognition.
In the rest of this paper, we describe the experiment setups
including the NIST SRE10 extended core task, the
configurations for both MFCC and LFCC, and the two state-
of-the-art back-end systems on which the SRE10 task is
performed. Then we present and compare our results for MFCC and LFCC. In addition, their performances under noisy
conditions are presented. Some explanations are provided for
our observations. Finally, a summary along with our plans for
future work are given.
II. EXPERIMENT SETUP
A. NIST SRE10
In the NIST SRE10 extended-core task, 21,595 English
recordings from 236 female and 210 male speakers were
collected from telephone conversations (Tel), telephone
conversations recorded over a room microphone (Mic), and
interview conversation recorded over a room microphone (Int).
Some telephone conversations were in high- or low- vocal
efforts. An average duration of 2.5 minutes of speech from the
targeted speaker was present in the telephone conversations. The interview recordings were 3 to 15 minutes long. About
6.5 million trials were tested, each belonging to one of the
following nine conditions: C1: Int-Int same mic, C2: Int-Int
different mic, C3: Int-Tel, C4: Int-Mic, C5: Tel-Tel, C6: Tel-
Tel-high vocal effort, C7: Mic-Mic-high vocal effort, C8: Tel-
Tel-low vocal effort, C9: Mic-Mic-low vocal effort. The trial
number for each condition is presented in Table I, II, and III.
B. Development data
Our development data set comprised data from the NIST SRE 2004, 2005, 2006, and 2008 data sets, Switchboard-II,
phases 2&3, Switchboard-Cellular part1&2, and the Fisher
database. A total of 23,904 (31,655) telephone speech
segments from 6,769 male (9,264 female) were obtained. For
microphone recorded speech, 3,257 (4,183) segments from
203 male (257 female) speakers were obtained. For all the
experiments, verification performance was reported in terms
of equal error rate (EER) and/or the detection cost function
(DCF) [4].
Fig. 2. An example of speech spectrum overlapped with A) Mel filterbanks, and B) Liner filterbanks.
F1 F2 F3
F1 F2 F3
a)
b)
C. Feature extraction
A package named RASTAMAT [15] was adapted for
extracting the MFCC and LFCC features 1 . The parameter
configurations for both are the same except for the frequency
warping scales. The speech signal is band-limited to 300-3400
Hz. 32 filter-banks were used, as shown in Fig. 2. The 19
cepstral coefficients plus its delta make a 38-dimensional
feature vector. The analysis window is 20 ms with a shift of
10 ms. The delta was performed over five frames.
The voice activity detection for segmenting speech from
the silence region is based on the provided ASR transcript
combined with the output of an energy-based VAD system. The cepstral mean subtraction and variance normalization was
applied.
For the additive noise cases, only the region specified by
VAD is counted for the signal-to-noise ratio. For reverberant
speech, simulated room impulses at different reverberation
times were used for creating reverberant speech.
D. Two state-of-the-art back-end systems
Below are the description of the two state-of-the-art back-
end systems we used in this study and their detailed descriptions are in [16][17].
1 The MFCC/LFCC code is available online at
http://www.glue.umd.edu/~zxinhui/LFCC_ASRU2011
The Joint Factor Analysis (JFA) system [16]: The JFA
[13] paradigm provides an explicit mechanism to model the
undesired variability in speech. Two separate gender-
dependent universal background models (UBM) with 2048
mixtures were trained using all of the development data. The JFA hyper-parameter sets were also gender-dependent. The
eigenvoice and eigenchannel matrices (V and U) were trained
independently. First, a V matrix with 400 columns was trained
by pooling together all the telephone and microphone
recordings from the development set. Then, after projecting
away the information in V from the supervectors, the residual
term was used to train U=[U_tel U_mic ], with 100 columns
from telephone data and 50 columns from microphone data.
The residual matrix D was not trained and set to produce an
equivalent relevance-MAP with a relevance factor of 16 [16].
The I-vectors and Probabilistic Linear Discriminant Analysis (PLDA) system [17]: Both the i-vector extractor as
well as the PLDA systems were gender-dependent. Baum-
Welch sufficient statistics were collected using the same 2048
mixture UBMs as in the JFA system. The subspace matrix T
with 400 columns was obtained by pooling together all the
telephone and microphone recordings of the development set
from the corresponding gender. For the PLDA model, the
same data was used (excluding the Fisher database) to train
the eigenvoice matrix with 200 columns and the full-
covariance matrix . For all the experiments in additive noise and reverberation in this study, the PLDA
scores were normalized using S-norm [17]. For the
experiments with the original data, only the scores from trials
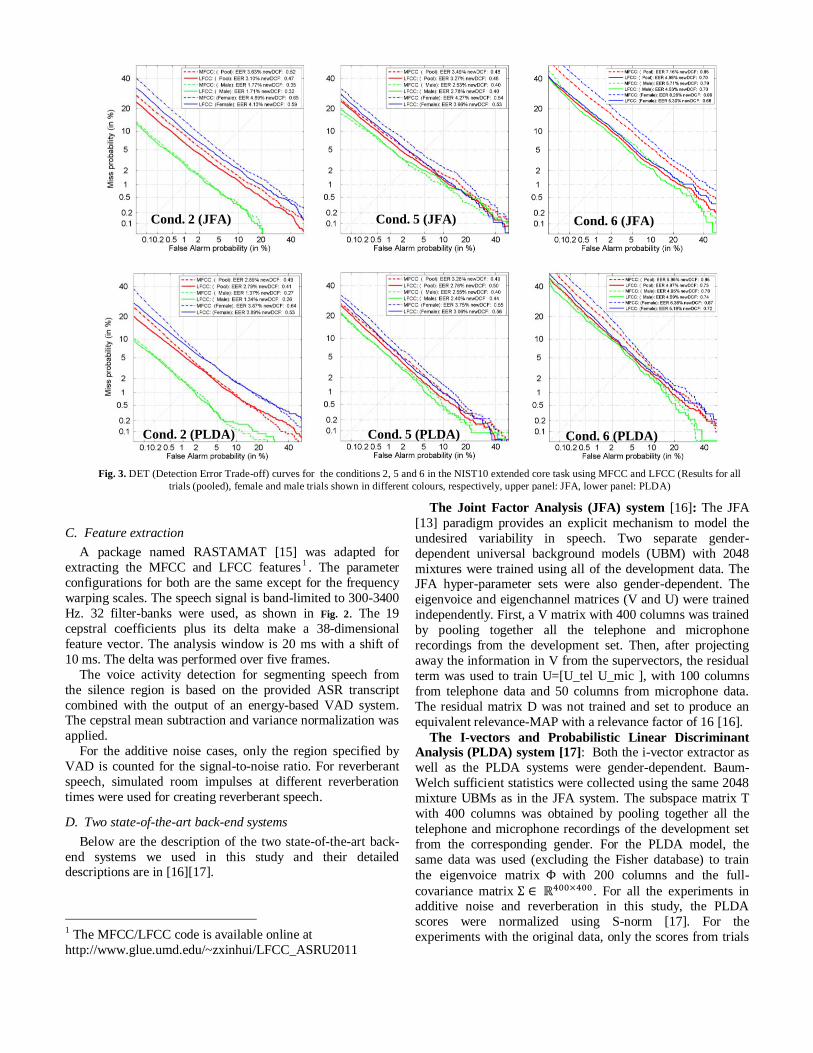
Fig. 3. DET (Detection Error Trade-off) curves for the conditions 2, 5 and 6 in the NIST10 extended core task using MFCC and LFCC (Results for all
trials (pooled), female and male trials shown in different colours, respectively, upper panel: JFA, lower panel: PLDA)
Cond. 2 (JFA) Cond. 5 (JFA) Cond. 6 (JFA)
Cond. 2 (PLDA) Cond. 5 (PLDA) Cond. 6 (PLDA)
involving telephone speech were normalized since the
performance was degraded by S-norm in conditions not involving telephone recordings.
III. RESULTS
A. Performances of MFCC and LFCC in the SRE10 core-
extended task
To have a comprehensive performance comparison, the
results of MFCC and LFCC on both JFA and PLDA are
presented in Fig. 3, Fig. 4, and Tables I, II and III in different
forms. Fig. 3 shows the DET curves. Fig. 4 shows the bar plots
of EER, and Tables I-III show the EERs, the EER difference
and the relative EER difference between MFCC and LFCC. In
addition, they are presented for pooled, male, and female trials
separately.
The DET curves for three conditions (2, 5 and 6 having the
most number of target trials) are shown in Fig. 3. It can be seen that, in all the DET curves, the LFCC outperforms the MFCC
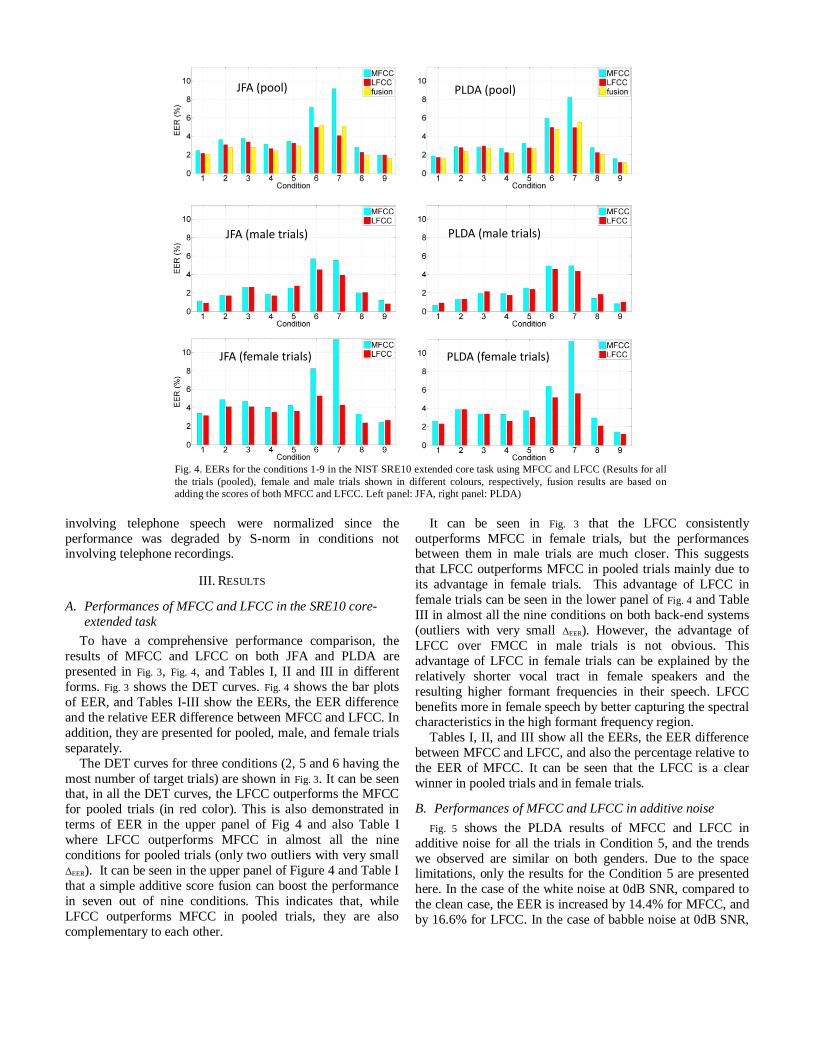
for pooled trials (in red color). This is also demonstrated in
terms of EER in the upper panel of Fig 4 and also Table I
where LFCC outperforms MFCC in almost all the nine
conditions for pooled trials (only two outliers with very small
ΔEER). It can be seen in the upper panel of Figure 4 and Table I
that a simple additive score fusion can boost the performance
in seven out of nine conditions. This indicates that, while
LFCC outperforms MFCC in pooled trials, they are also
complementary to each other.
It can be seen in Fig. 3 that the LFCC consistently
outperforms MFCC in female trials, but the performances between them in male trials are much closer. This suggests
that LFCC outperforms MFCC in pooled trials mainly due to
its advantage in female trials. This advantage of LFCC in
female trials can be seen in the lower panel of Fig. 4 and Table
III in almost all the nine conditions on both back-end systems
(outliers with very small ΔEER). However, the advantage of
LFCC over FMCC in male trials is not obvious. This
advantage of LFCC in female trials can be explained by the
relatively shorter vocal tract in female speakers and the
resulting higher formant frequencies in their speech. LFCC
benefits more in female speech by better capturing the spectral characteristics in the high formant frequency region.
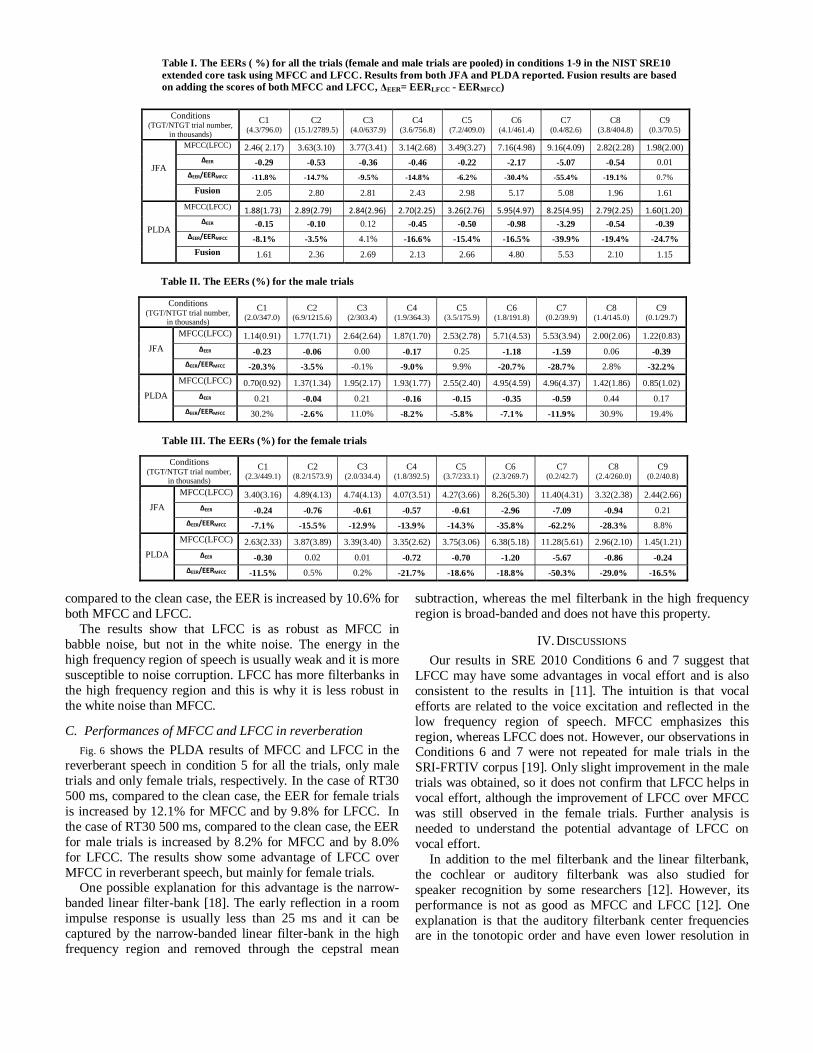
Tables I, II, and III show all the EERs, the EER difference
between MFCC and LFCC, and also the percentage relative to
the EER of MFCC. It can be seen that the LFCC is a clear
winner in pooled trials and in female trials.
B. Performances of MFCC and LFCC in additive noise
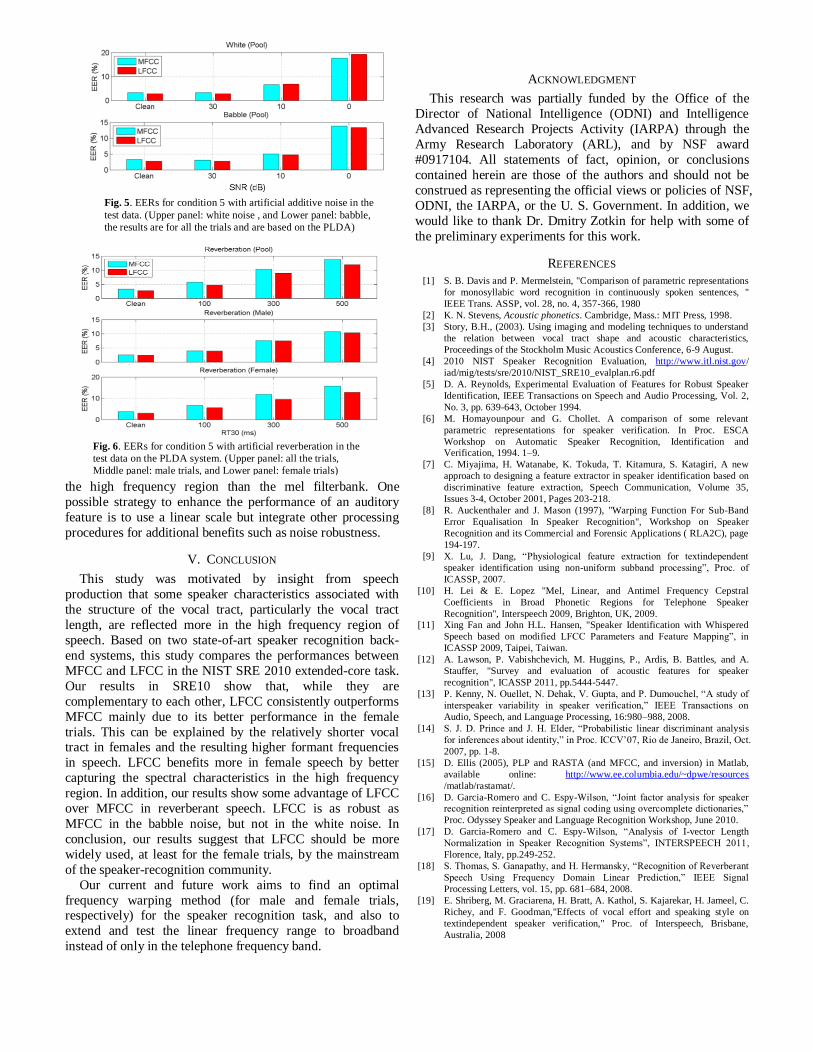
Fig. 5 shows the PLDA results of MFCC and LFCC in
additive noise for all the trials in Condition 5, and the trends
we observed are similar on both genders. Due to the space limitations, only the results for the Condition 5 are presented
here. In the case of the white noise at 0dB SNR, compared to
the clean case, the EER is increased by 14.4% for MFCC, and
by 16.6% for LFCC. In the case of babble noise at 0dB SNR,
Fig. 4. EERs for the conditions 1-9 in the NIST SRE10 extended core task using MFCC and LFCC (Results for all
the trials (pooled), female and male trials shown in different colours, respectively, fusion results are based on
adding the scores of both MFCC and LFCC. Left panel: JFA, right panel: PLDA)
JFA (pool) PLDA (pool)
JFA (male trials) PLDA (male trials)
PLDA (female trials)JFA (female trials)
compared to the clean case, the EER is increased by 10.6% for
both MFCC and LFCC.
The results show that LFCC is as robust as MFCC in
babble noise, but not in the white noise. The energy in the
high frequency region of speech is usually weak and it is more
susceptible to noise corruption. LFCC has more filterbanks in
the high frequency region and this is why it is less robust in
the white noise than MFCC.
C. Performances of MFCC and LFCC in reverberation
Fig. 6 shows the PLDA results of MFCC and LFCC in the
reverberant speech in condition 5 for all the trials, only male
trials and only female trials, respectively. In the case of RT30
500 ms, compared to the clean case, the EER for female trials
is increased by 12.1% for MFCC and by 9.8% for LFCC. In
the case of RT30 500 ms, compared to the clean case, the EER
for male trials is increased by 8.2% for MFCC and by 8.0%
for LFCC. The results show some advantage of LFCC over
MFCC in reverberant speech, but mainly for female trials. One possible explanation for this advantage is the narrow-
banded linear filter-bank [18]. The early reflection in a room
impulse response is usually less than 25 ms and it can be
captured by the narrow-banded linear filter-bank in the high
frequency region and removed through the cepstral mean
subtraction, whereas the mel filterbank in the high frequency
region is broad-banded and does not have this property.
IV. DISCUSSIONS
Our results in SRE 2010 Conditions 6 and 7 suggest that
LFCC may have some advantages in vocal effort and is also
consistent to the results in [11]. The intuition is that vocal
efforts are related to the voice excitation and reflected in the
low frequency region of speech. MFCC emphasizes this
region, whereas LFCC does not. However, our observations in Conditions 6 and 7 were not repeated for male trials in the
SRI-FRTIV corpus [19]. Only slight improvement in the male
trials was obtained, so it does not confirm that LFCC helps in
vocal effort, although the improvement of LFCC over MFCC
was still observed in the female trials. Further analysis is
needed to understand the potential advantage of LFCC on
vocal effort.
In addition to the mel filterbank and the linear filterbank,
the cochlear or auditory filterbank was also studied for
speaker recognition by some researchers [12]. However, its
performance is not as good as MFCC and LFCC [12]. One
explanation is that the auditory filterbank center frequencies are in the tonotopic order and have even lower resolution in
Conditions (TGT/NTGT trial number,
in thousands)
C1 (4.3/796.0)
C2
(15.1/2789.5)
C3 (4.0/637.9)
C4 (3.6/756.8)
C5 (7.2/409.0)
C6 (4.1/461.4)
C7 (0.4/82.6)
C8 (3.8/404.8)
C9 (0.3/70.5)
JFA
MFCC(LFCC) 2.46( 2.17) 3.63(3.10) 3.77(3.41) 3.14(2.68) 3.49(3.27) 7.16(4.98) 9.16(4.09) 2.82(2.28) 1.98(2.00)
ΔEER -0.29 -0.53 -0.36 -0.46 -0.22 -2.17 -5.07 -0.54 0.01
ΔEER/EERMFCC -11.8% -14.7% -9.5% -14.8% -6.2% -30.4% -55.4% -19.1% 0.7%
Fusion 2.05 2.80 2.81 2.43 2.98 5.17 5.08 1.96 1.61
PLDA
MFCC(LFCC) 1.88(1.73) 2.89(2.79) 2.84(2.96) 2.70(2.25) 3.26(2.76) 5.95(4.97) 8.25(4.95) 2.79(2.25) 1.60(1.20) ΔEER -0.15 -0.10 0.12 -0.45 -0.50 -0.98 -3.29 -0.54 -0.39
ΔEER/EERMFCC -8.1% -3.5% 4.1% -16.6% -15.4% -16.5% -39.9% -19.4% -24.7%
Fusion 1.61 2.36 2.69 2.13 2.66 4.80 5.53 2.10 1.15
Conditions (TGT/NTGT trial number,
in thousands)
C1 (2.0/347.0)
C2
(6.9/1215.6)
C3 (2/303.4)
C4 (1.9/364.3)
C5 (3.5/175.9)
C6 (1.8/191.8)
C7 (0.2/39.9)
C8 (1.4/145.0)
C9 (0.1/29.7)
JFA
MFCC(LFCC) 1.14(0.91) 1.77(1.71) 2.64(2.64) 1.87(1.70) 2.53(2.78) 5.71(4.53) 5.53(3.94) 2.00(2.06) 1.22(0.83)
ΔEER -0.23 -0.06 0.00 -0.17 0.25 -1.18 -1.59 0.06 -0.39
ΔEER/EERMFCC -20.3% -3.5% -0.1% -9.0% 9.9% -20.7% -28.7% 2.8% -32.2%
PLDA
MFCC(LFCC) 0.70(0.92) 1.37(1.34) 1.95(2.17) 1.93(1.77) 2.55(2.40) 4.95(4.59) 4.96(4.37) 1.42(1.86) 0.85(1.02)
ΔEER 0.21 -0.04 0.21 -0.16 -0.15 -0.35 -0.59 0.44 0.17
ΔEER/EERMFCC 30.2% -2.6% 11.0% -8.2% -5.8% -7.1% -11.9% 30.9% 19.4%
Conditions (TGT/NTGT trial number,
in thousands)
C1 (2.3/449.1)
C2
(8.2/1573.9)
C3 (2.0/334.4)
C4 (1.8/392.5)
C5 (3.7/233.1)
C6 (2.3/269.7)
C7 (0.2/42.7)
C8 (2.4/260.0)
C9 (0.2/40.8)
JFA
MFCC(LFCC) 3.40(3.16) 4.89(4.13) 4.74(4.13) 4.07(3.51) 4.27(3.66) 8.26(5.30) 11.40(4.31) 3.32(2.38) 2.44(2.66)
ΔEER -0.24 -0.76 -0.61 -0.57 -0.61 -2.96 -7.09 -0.94 0.21
ΔEER/EERMFCC -7.1% -15.5% -12.9% -13.9% -14.3% -35.8% -62.2% -28.3% 8.8%
PLDA
MFCC(LFCC) 2.63(2.33) 3.87(3.89) 3.39(3.40) 3.35(2.62) 3.75(3.06) 6.38(5.18) 11.28(5.61) 2.96(2.10) 1.45(1.21)
ΔEER -0.30 0.02 0.01 -0.72 -0.70 -1.20 -5.67 -0.86 -0.24
ΔEER/EERMFCC -11.5% 0.5% 0.2% -21.7% -18.6% -18.8% -50.3% -29.0% -16.5%
Table II. The EERs (%) for the male trials
Table III. The EERs (%) for the female trials
Table I. The EERs ( %) for all the trials (female and male trials are pooled) in conditions 1-9 in the NIST SRE10
extended core task using MFCC and LFCC. Results from both JFA and PLDA reported. Fusion results are based
on adding the scores of both MFCC and LFCC, ΔEER= EERLFCC - EERMFCC)
the high frequency region than the mel filterbank. One
possible strategy to enhance the performance of an auditory
feature is to use a linear scale but integrate other processing
procedures for additional benefits such as noise robustness.
V. CONCLUSION
This study was motivated by insight from speech
production that some speaker characteristics associated with
the structure of the vocal tract, particularly the vocal tract
length, are reflected more in the high frequency region of
speech. Based on two state-of-art speaker recognition back-
end systems, this study compares the performances between
MFCC and LFCC in the NIST SRE 2010 extended-core task.
Our results in SRE10 show that, while they are
complementary to each other, LFCC consistently outperforms
MFCC mainly due to its better performance in the female
trials. This can be explained by the relatively shorter vocal tract in females and the resulting higher formant frequencies
in speech. LFCC benefits more in female speech by better
capturing the spectral characteristics in the high frequency
region. In addition, our results show some advantage of LFCC
over MFCC in reverberant speech. LFCC is as robust as
MFCC in the babble noise, but not in the white noise. In
conclusion, our results suggest that LFCC should be more
widely used, at least for the female trials, by the mainstream
of the speaker-recognition community.
Our current and future work aims to find an optimal
frequency warping method (for male and female trials, respectively) for the speaker recognition task, and also to
extend and test the linear frequency range to broadband
instead of only in the telephone frequency band.
ACKNOWLEDGMENT
This research was partially funded by the Office of the
Director of National Intelligence (ODNI) and Intelligence
Advanced Research Projects Activity (IARPA) through the
Army Research Laboratory (ARL), and by NSF award
#0917104. All statements of fact, opinion, or conclusions
contained herein are those of the authors and should not be
construed as representing the official views or policies of NSF,
ODNI, the IARPA, or the U. S. Government. In addition, we
would like to thank Dr. Dmitry Zotkin for help with some of
the preliminary experiments for this work.
REFERENCES
[1] S. B. Davis and P. Mermelstein, "Comparison of parametric representations
for monosyllabic word recognition in continuously spoken sentences, "
IEEE Trans. ASSP, vol. 28, no. 4, 357-366, 1980
[2] K. N. Stevens, Acoustic phonetics. Cambridge, Mass.: MIT Press, 1998.
[3] Story, B.H., (2003). Using imaging and modeling techniques to understand
the relation between vocal tract shape and acoustic characteristics,
Proceedings of the Stockholm Music Acoustics Conference, 6-9 August.
[4] 2010 NIST Speaker Recognition Evaluation, http://www.itl.nist.gov/
iad/mig/tests/sre/2010/NIST_SRE10_evalplan.r6.pdf
[5] D. A. Reynolds, Experimental Evaluation of Features for Robust Speaker
Identification, IEEE Transactions on Speech and Audio Processing, Vol. 2,
No. 3, pp. 639-643, October 1994.
[6] M. Homayounpour and G. Chollet. A comparison of some relevant
parametric representations for speaker verification. In Proc. ESCA
Workshop on Automatic Speaker Recognition, Identification and Verification, 1994. 1–9.
[7] C. Miyajima, H. Watanabe, K. Tokuda, T. Kitamura, S. Katagiri, A new
approach to designing a feature extractor in speaker identification based on
discriminative feature extraction, Speech Communication, Volume 35,
Issues 3-4, October 2001, Pages 203-218.
[8] R. Auckenthaler and J. Mason (1997), "Warping Function For Sub-Band
Error Equalisation In Speaker Recognition", Workshop on Speaker
Recognition and its Commercial and Forensic Applications ( RLA2C), page
194-197.
[9] X. Lu, J. Dang, “Physiological feature extraction for textindependent
speaker identification using non-uniform subband processing”, Proc. of
ICASSP, 2007.
[10] H. Lei & E. Lopez "Mel, Linear, and Antimel Frequency Cepstral
Coefficients in Broad Phonetic Regions for Telephone Speaker
Recognition", Interspeech 2009, Brighton, UK, 2009. [11] Xing Fan and John H.L. Hansen, "Speaker Identification with Whispered
Speech based on modified LFCC Parameters and Feature Mapping”, in
ICASSP 2009, Taipei, Taiwan.
[12] A. Lawson, P. Vabishchevich, M. Huggins, P., Ardis, B. Battles, and A.
Stauffer, "Survey and evaluation of acoustic features for speaker
recognition", ICASSP 2011, pp.5444-5447.
[13] P. Kenny, N. Ouellet, N. Dehak, V. Gupta, and P. Dumouchel, “A study of
interspeaker variability in speaker verification,” IEEE Transactions on
Audio, Speech, and Language Processing, 16:980–988, 2008.
[14] S. J. D. Prince and J. H. Elder, “Probabilistic linear discriminant analysis
for inferences about identity,” in Proc. ICCV’07, Rio de Janeiro, Brazil, Oct.
2007, pp. 1-8.
[15] D. Ellis (2005), PLP and RASTA (and MFCC, and inversion) in Matlab,
available online: http://www.ee.columbia.edu/~dpwe/resources
/matlab/rastamat/.
[16] D. Garcia-Romero and C. Espy-Wilson, “Joint factor analysis for speaker recognition reinterpreted as signal coding using overcomplete dictionaries,”
Proc. Odyssey Speaker and Language Recognition Workshop, June 2010.
[17] D. Garcia-Romero and C. Espy-Wilson, “Analysis of I-vector Length
Normalization in Speaker Recognition Systems”, INTERSPEECH 2011,
Florence, Italy, pp.249-252.
[18] S. Thomas, S. Ganapathy, and H. Hermansky, “Recognition of Reverberant
Speech Using Frequency Domain Linear Prediction,” IEEE Signal
Processing Letters, vol. 15, pp. 681–684, 2008.
[19] E. Shriberg, M. Graciarena, H. Bratt, A. Kathol, S. Kajarekar, H. Jameel, C.
Richey, and F. Goodman,"Effects of vocal effort and speaking style on
textindependent speaker verification," Proc. of Interspeech, Brisbane,
Australia, 2008
Fig. 5. EERs for condition 5 with artificial additive noise in the
test data. (Upper panel: white noise , and Lower panel: babble,
the results are for all the trials and are based on the PLDA)
system
Fig. 6. EERs for condition 5 with artificial reverberation in the
test data on the PLDA system. (Upper panel: all the trials,
Middle panel: male trials, and Lower panel: female trials)