Embed Size (px)
DESCRIPTION
IJCNLP2008 Jan 10, 2008. Gloss-based Semantic Similarity Metrics for Predominant Sense Acquisition. Ryu Iida Nara Institute of Science and Technology Diana McCarthy and Rob Koeling University of Sussex. Word Sense Disambiguation. Predominant sense acquisition - PowerPoint PPT Presentation
Citation preview
1
Gloss-based Semantic Similarity Metrics for
Predominant Sense Acquisition
Ryu Iida Nara Institute of Science and TechnologyDiana McCarthy and Rob Koeling University of Sussex
IJCNLP2008 Jan 10, 2008

2
IJCNLP2008 Jan 10, 2008
Word Sense Disambiguation
Predominant sense acquisitionExploited as a powerful back-off strategy
for word sense disambiguation
McCarthy et al (2004): Achieved 64% precision on Senseval2 all-
words taskStrongly relies on linguistic resources such
as WordNet for calculating the semantic similarity
Difficulty: porting it to other languages

3
IJCNLP2008 Jan 10, 2008
Focus
How to calculate the semantic similarity score without semantic relations such as hyponym
Explore the potential use of the word definitions (glosses) instead of WordNet-style resources for porting McCarthy et al.’s method to other languages

4
IJCNLP2008 Jan 10, 2008
Table of contents
1. Task
2. Related work: McCarthy et al (2004)
3. Gloss-based semantic similarity metrics
4. Experiments WSD on the two datasets: EDR and
Japanese Senseval2 task
5. Conclusion and future directions

5
IJCNLP2008 Jan 10, 2008
Word Sense Disambiguation (WSD) task
select the correct sense of the word appearing in the context
I ate fried chicken last Sunday.
sense id gloss
1 a common farm bird that is kept for its meat and eggs
2 the meat from this bird eaten as food
3 informal someone who is not at all brave
4 a game in which children must do something dangerous to show that they are brave
Supervised approaches have been mainly applied to learn the context

6
IJCNLP2008 Jan 10, 2008
Word Sense Disambiguation (WSD) task (Cont’d)Estimate the most predominant sense
of a word regardless of its contextEnglish coarse-grained all words task
(2007)Choosing most frequent senses: 78.9%Best performing system: 82.5%
Systems using a first sense heuristic have relied on sense-tagged dataHowever, sense-tagged data is expensive

7
IJCNLP2008 Jan 10, 2008 McCarthy et al. (2004)’s unsupervised approach Extract top N neighbour words of the target word acc
ording to the distributional similarity score (simds)
Calculate the prevalent score of each senseCalculate simds weighted by the semantic similarity score
(simss)Sum up all the weighted simds of top N neighboursSemantic similarity: estimated from linguistic resources
(e.g. WordNet)
Output the sense which has the maximum prevalent score

8
IJCNLP2008 Jan 10, 2008 McCarthy et al. (2004)’s approach: An example
neighbour simds
turkey 0.1805
meat 0.1781
... ...
tomato 0.1573
sense2: the meat from this bird eaten as food.sense3: informal someone who is not at all brave.
chicken
prevalence(sense2) = 0.0271 + 0.0365 + ... + 0.0157 = 0.152
distributional similarity score
0.20
0.10
...
0.15
simss(word, sense2)
0.0365
0.0157
...
0.0271
weighted simds
=
semantic similarity score (from WordNet)

9
IJCNLP2008 Jan 10, 2008 McCarthy et al. (2004)’s approach: An example
neighbour simds
turkey 0.1805
meat 0.1781
... ...
tomato 0.1573
simss(word, sense3)
0.01
0.02
...
0.01
weighted simds
0.0018
0.0037
...
0.0016
=
sense2: the meat from this bird eaten as food.sense3: informal someone who is not at all brave.
chicken
prevalence(sense3) = 0.0018 + 0.0037 + ... + 0.0016 = 0.023
prevalence(sense2) = 0.152
prevalence(sense2) > prevalence(sense3) predominant sense: sense2

10
IJCNLP2008 Jan 10, 2008
Problem
While the McCarthy et al.’s method works well for English, other inventories do no always have WordNet-style resources to tie the nearest neighbors to the sense inventory
While traditional dictionaries do not organise senses into synsets, they do typically have sense definitions (glosses) associated with the senses

11
IJCNLP2008 Jan 10, 2008
Gloss-based similarity
Calculate similarity between two glosses in a dictionary as semantic similarity
simlesk: simply calculate the overlap of the content words in the glosses of the two word senses
simDSlesk: use distributional similarity as an approximation of semantic distance between the words in the two glosses

12
IJCNLP2008 Jan 10, 2008
lesk: Example
simlesk(chicken, turkey) = 2“meat” and “food” are overlapped in two glosses
word gloss
chicken
the meat from this bird eaten as food
turkey the meat from a turkey eaten as food

13
IJCNLP2008 Jan 10, 2008
lesk: Example
simlesk(chicken, tomato) = 0No overlap in two glosses
word gloss
chicken
the meat from this bird eaten as food
tomato a round soft red fruit eaten raw or cooked as a vegetable

14
IJCNLP2008 Jan 10, 2008
simDSlesk (chicken, tomato)= 1/3 (0.1843 + 0.1001 + 0.1857) = 0.1557
DSlesk Calculate distributional similarity scores of
any pairs of nouns in two glosses
Output the average of the maximum distributional similarity of all the nouns in target word
simds(meat, fruit) = 0.1625, simds(meat, vegetable) = 0.1843,
simds(bird, fruit) = 0.1001, simds(bird, vegetable) = 0.0717,
simds(food, fruit) = 0.1857, simds(food, vegetable) = 0.1772

15
IJCNLP2008 Jan 10, 2008
DSlesk
),(max),()(
jinWSws
iDSlesk wswssimnwssimj
),(max ji ggsim
)(ba )( ji gg: noun appearing in
ig iws: gloss of word sense
),(max||
1),( basim
gaggsim ds
gagb
iji
ij

16
IJCNLP2008 Jan 10, 2008
Apply Gloss-based similarity to McCarthy et al.’s approach
neighbour simds
turkey 0.1805
meat 0.1781
... ...
tomato 0.1573
simDSlesk(word, sense2)
0.3453
0.2323
...
0.1557
weighted simds
0.0623
0.0414
...
0.0245
=
sense2: the meat from this bird eaten as food.sense3: informal someone who is not at all brave.
chicken
prevalence(sense2) = 0.0623 + 0.0414 + ... + 0.0245 = 0.2387

17
IJCNLP2008 Jan 10, 2008
Table of contents
1. Task
2. Related work: McCarthy et al (2004)
3. Gloss-based semantic similarity metrics
4. Experiments WSD on the two datasets: EDR and
Japanese Senseval2 task
5. Conclusion and future directions

18
IJCNLP2008 Jan 10, 2008
Experiment 1: EDR
Dataset: EDR corpus3,836 polysemous nouns (183,502 instances)
Adopt the similarity score proposed by Lin (1998) as the distributional similarity score9-years Mainichi newspaper articles and 10-years
Nikkei newspaper articlesJapanese dependency parser CaboCha (Kudo and
Matsumoto, 2002)Use 50 nearest neighbors in line with McCart
hy et al. (2004)

19
IJCNLP2008 Jan 10, 2008
Methods
BaselineSelect one word sense at random for each word t
oken and average the precision over 100 trials
Unsupervised: McCarthy et al. (2004)Semantic similarity:
Jiang and Conrath (1997) (jcn), lesk, DSlesk
Supervised (Majority)Use hand-labeled training data for obtaining the p
redominant sense of the test words

20
IJCNLP2008 Jan 10, 2008
Results: EDR
DSlesk is comparable to jcn without the requirement for semantic relations such as hyponymy
recall precision
baseline 0.402 0.402
jcn 0.495 0.495
lesk 0.474 0.488
DSlesk 0.495 0.495
upper-bound 0.745 0.745
supervised 0.731 0.731
21
IJCNLP2008 Jan 10, 2008
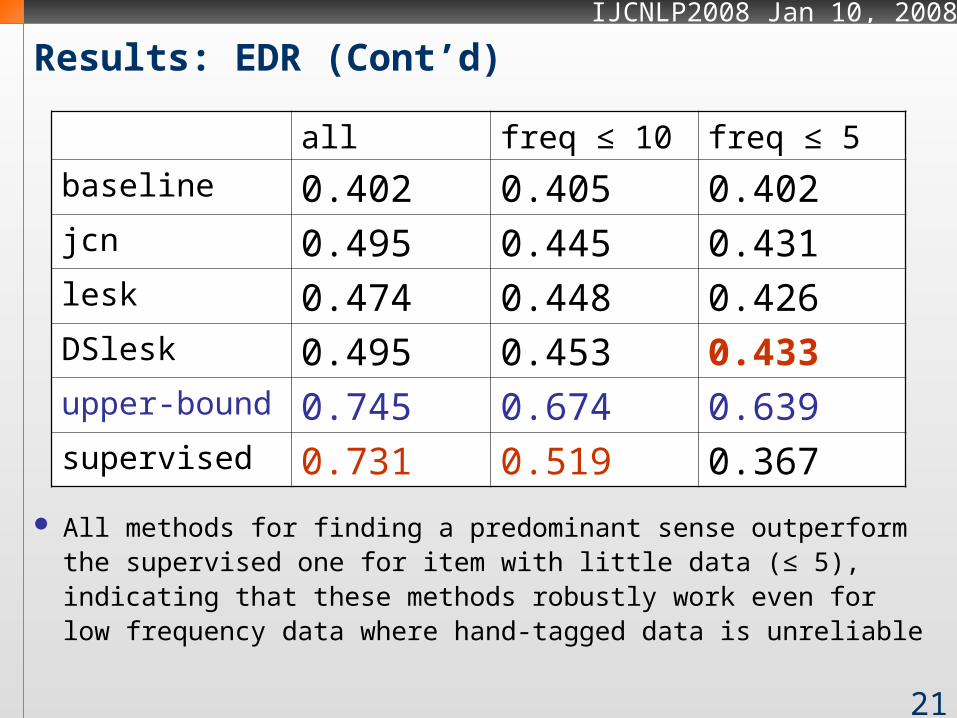
Results: EDR (Cont’d)
All methods for finding a predominant sense outperform the supervised one for item with little data (≤ 5), indicating that these methods robustly work even for low frequency data where hand-tagged data is unreliable
all freq ≤ 10 freq ≤ 5
baseline 0.402 0.405 0.402jcn 0.495 0.445 0.431lesk 0.474 0.448 0.426DSlesk 0.495 0.453 0.433upper-bound 0.745 0.674 0.639supervised 0.731 0.519 0.367

22
IJCNLP2008 Jan 10, 2008 Experiment 2 and Results: Senseval2 in Japanese50 nouns (5,000 instances)4 methods
lesk, DSlesk, baseline, supervised
fine-grained coarse-grained
baseline 0.282 0.399
lesk 0.344 0.501
DSlesk 0.386 0.593
upper-bound 0.747 0.834
supervised 0.742 0.842
precision = recall
sense-id: 105-0-0-2-0 fine-grained
coarse-grained

23
IJCNLP2008 Jan 10, 2008
Conclusion
We examined different measures of semantic similarity for finding a first sense heuristic for WSD automatically in Japanese
We defined a new gloss-based similarity (DSlesk) and evaluated the performance on two Japanese WSD datasets (EDR and Senseval2), outperforming lesk and achieving a performance comparable to the jcn method which relies on hyponym links which are not always available

24
IJCNLP2008 Jan 10, 2008
Future directions
Explore other information in the glosses, such as words of other POS and predicate-argument relations
Group fine-grained word senses into clusters, making the task suitable for NLP applications (Ide and Wilks, 2006)
Use the results of predominant sense acquisition as a prior knowledge of other approachesGraph-based approaches (Mihalcea 2005, Nasta
se 2008)