Embed Size (px)
Citation preview
Global WINDPOWER 2004 - Chicago, Illinois
Assessment of Potential Improvements in Large-Scale Low Wind Speed Technology
Joseph Cohen
Princeton Energy Resources International, LLC1700 Rockville Pike, Suite 550
Rockville, Maryland 20852 [email protected]
(301) 468-8416
Global WINDPOWER 2004, Chicago, IllinoisMarch 29, 2004

Global WINDPOWER 2004 - Chicago, Illinois
ACKNOWLEDGEMENTS
U.S. Department of Energy Under Subcontract To:
National Renewable Energy Laboratory, NWTC
NWTC Staff Paul Migliore Alan Laxson Mike Robinson Bob Thresher Scott Schreck Paul Veers (Sandia National
Laboratories)
Project Supported By: Technical Inputs:
Global WINDPOWER 2004 - Chicago, Illinois
TECHOLOGY PATHWAYS ANALYSIS
Identify TIOs
Estimate TIO Effects
Perform Analysis
Review Results
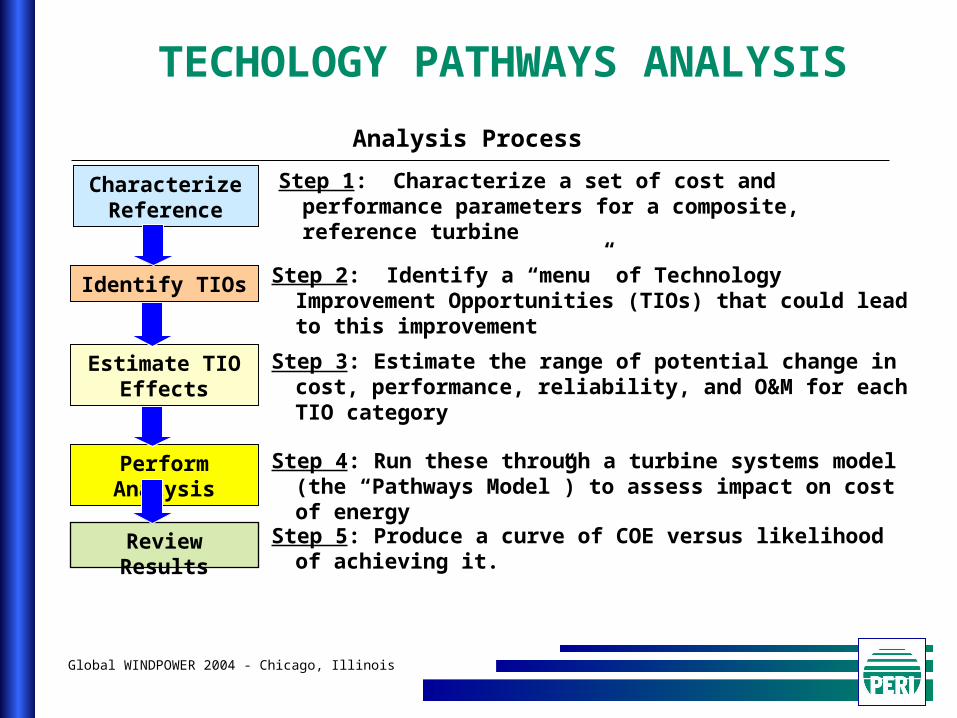
Step 4: Run these through a turbine systems model (the “Pathways Model”) to assess impact on cost of energy
Step 5: Produce a curve of COE versus likelihood of achieving it.
Step 3: Estimate the range of potential change in cost, performance, reliability, and O&M for each TIO category
Step 2: Identify a “menu” of Technology Improvement Opportunities (TIOs) that could lead to this improvement
Analysis Process
Characterize Reference
Step 1: Characterize a set of cost and performance parameters for a composite, reference turbine
Global WINDPOWER 2004 - Chicago, Illinois
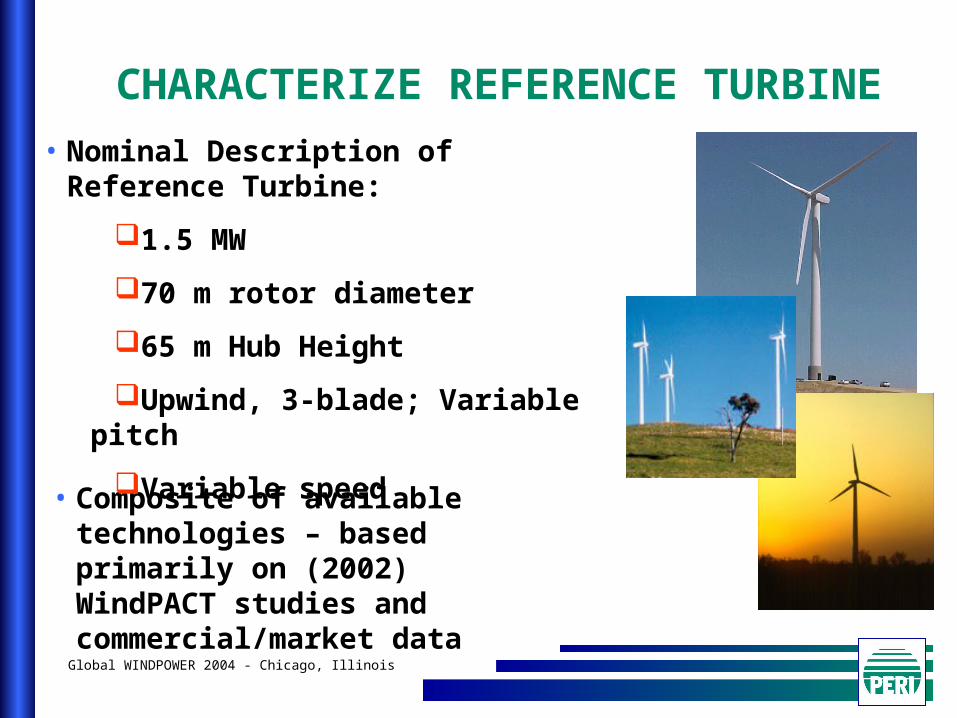
CHARACTERIZE REFERENCE TURBINE
• Composite of available technologies – based primarily on (2002) WindPACT studies and commercial/market data
• Nominal Description of Reference Turbine:
1.5 MW
70 m rotor diameter
65 m Hub Height
Upwind, 3-blade; Variable pitch
Variable speed
Global WINDPOWER 2004 - Chicago, Illinois
ANALYSIS METRICS Overall evaluation metric - Levelized Cost of Energy (COE), which requires the following input variables:
Turbine Capital Cost (TCC)Balance of Station Cost (BOS)Levelized Replacement Cost (LRC)Annual Operation and Maintenance Cost (O&M)Net Annual Energy Production (AEP)
ISSUE: How to choose for “leading edge” technology, 100 MW plant, “favorable installation & maintenance conditions” consistent with large areas of class 4 winds, i.e., relatively flat land, easy access, no soil issues

Global WINDPOWER 2004 - Chicago, Illinois
REFERENCE WIND PLANT CHARACTERISTICS
ExpectedReference Inputs Minimum (most likely) MaximumTCC Turbine Capital Cost (2002 $) 920,000 1,000,000 1,100,000
Low/High Range -8% 10%BOS BOS Cost (2002 $) 368,600 388,000 465,600
Low/High Range -5% 20%LRC Levelized Replacement Costs ($) 9,750 15,000 22,500
Low/High Range -35% 50%O&M O&M Cost ($) 12,000 30,000 37,950
Low/High Range -60% 27%Land Land Lease Cost ($/kWh) 0.000648 0.00108 0.00140
-40% 30%AEP Net Annual Energy Production(kWh/yr) 3,973,500 4,415,000 4,547,450
Low/High Range -10% 3%A&L Availability and Losses 15%FCR Fixed Charge Rate 11.85%
Total Cost per kW $859 $925 $1,044Total cost per square meter 335 361 407Net Annual Energy per square meter 1,032 1,147 1,182Capacity Factor 0.302 0.336 0.346
Global WINDPOWER 2004 - Chicago, Illinois
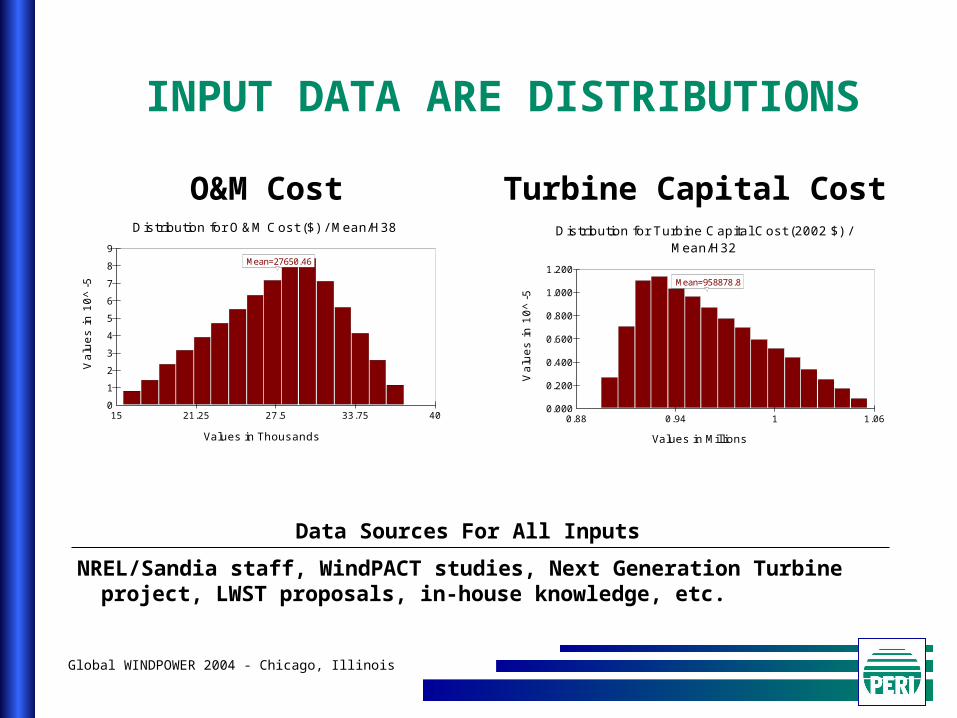
INPUT DATA ARE DISTRIBUTIONS
15 21.25 27.5 33.75 40
5% 90% 5% 19.1225 34.9229
Mean=27650.46
Distribution for O&M Cost ($) / Mean/H38
Val
ues
in 1
0 ̂-
5
Values in Thousands
0
1
2
3
4
5
6
7
8
9
Mean=27650.46
15 21.25 27.5 33.75 40 0.88 0.94 1 1.06
5% 90% 5% .9094 1.0263
Mean=958878.8
Distribution for Turbine Capital Cost (2002 $) /Mean/H32
Val
ues
in 1
0 ̂-
5
Values in Millions
0.000
0.200
0.400
0.600
0.800
1.000
1.200
Mean=958878.8
0.88 0.94 1 1.06
Turbine Capital CostO&M Cost
NREL/Sandia staff, WindPACT studies, Next Generation Turbine project, LWST proposals, in-house knowledge, etc.
NREL/Sandia staff, WindPACT studies, Next Generation Turbine project, LWST proposals, in-house knowledge, etc.
Data Sources For All Inputs
Global WINDPOWER 2004 - Chicago, Illinois
REFERENCE COE
In constant end-of-2002 dollars
Class 4 winds (13 mph average at 10 m)
Assumes financing structures typical of GenCos (i.e., balance sheet financing)
Detailed cash flow model used to calculate COE using assumptions for taxes, insurance, depreciation, cost of capital, financing fees, and construction financing
Caveat – uses a relatively high required rate of return compared to current market rates
Levelized Cost of Energy of Reference (2002) Turbine: 4.8 cents/kWh
Global WINDPOWER 2004 - Chicago, Illinois
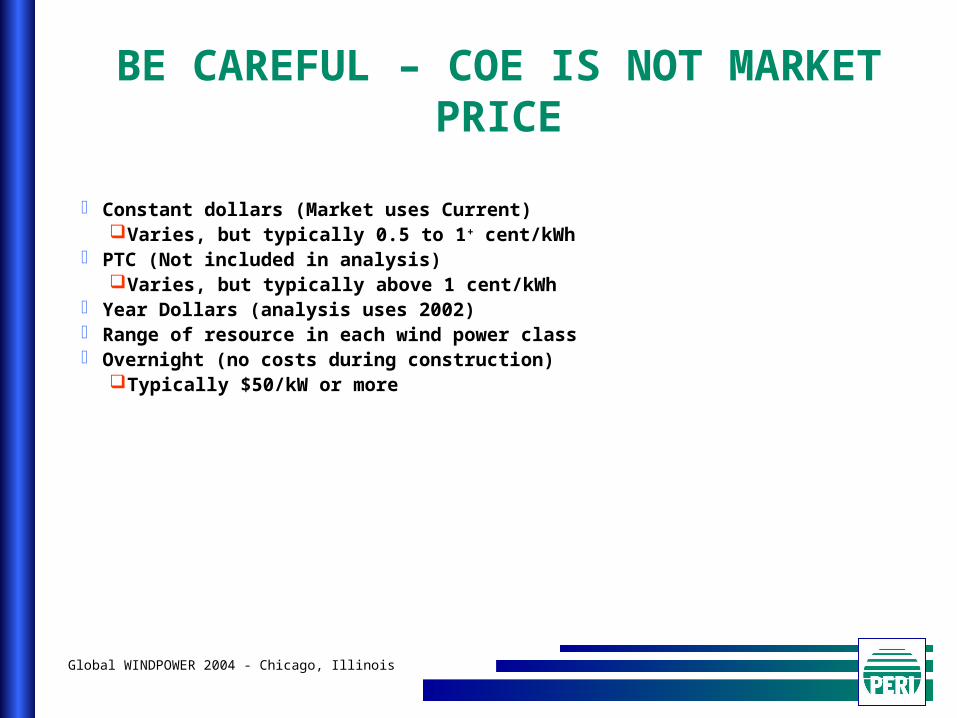
BE CAREFUL – COE IS NOT MARKET PRICE
Constant dollars (Market uses Current)Varies, but typically 0.5 to 1+ cent/kWh
PTC (Not included in analysis)Varies, but typically above 1 cent/kWh
Year Dollars (analysis uses 2002) Range of resource in each wind power class Overnight (no costs during construction)
Typically $50/kW or more

Global WINDPOWER 2004 - Chicago, Illinois
TECNOLOGY IMPROVEMENT OPPORTUNITIES
Learning Curve Effects
Market–driven cost reductions
Advanced Tower TIOs
New Materials
Innovative structures
Advanced foundations
Self-erecting designs
New Drive Train Concept TIOs
Permanent magnet generator
Innovative mechanical drives
Site-Specific Design/Reduced Design Margin TIOs
Improved definition of site characteristics
Design load tailoring
Micrositing
Favorable wind speed distributions and shear
Advanced (Enlarged) Rotor TIOs
Advanced materials
Changed/improved structural/aero design
Active controls
Passive controls
Higher tip speed ratios/lower acoustics
Manufacturing TIOs
Manufacturing methods
Lower margins
Manufacturing markupsAdvanced Power Electronics TIOs
Incorporation of improved PE components
Advanced circuit topology
Reduced Energy Losses and Increased Availability TIOs
Health monitoring (SCADA, etc.)
Blade soiling mitigation
Extended scheduled maintenance
Global WINDPOWER 2004 - Chicago, Illinois
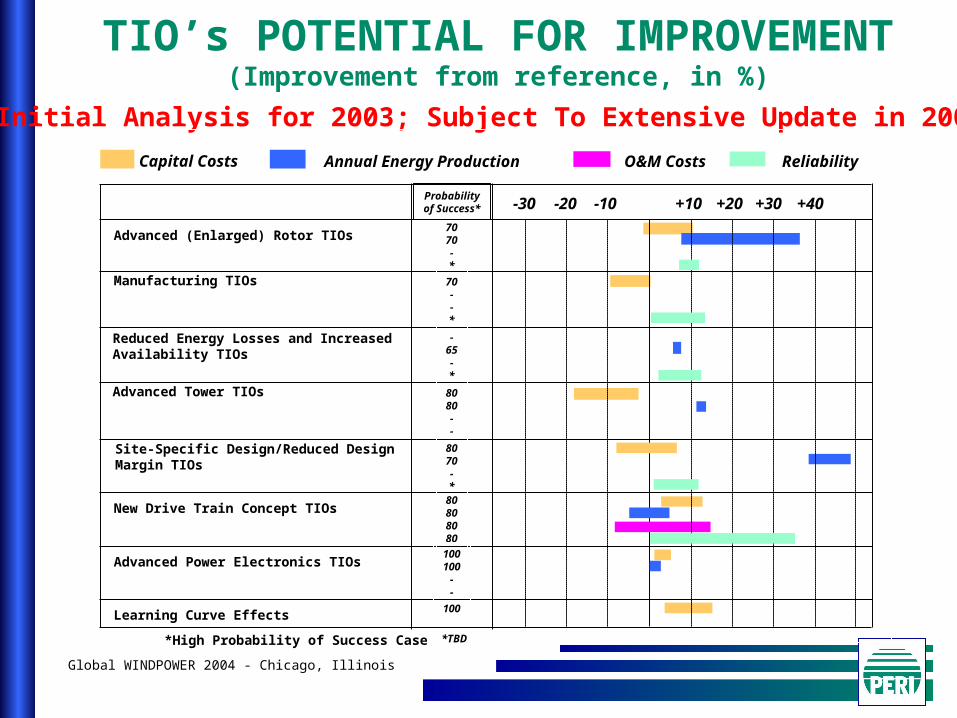
TIO’s POTENTIAL FOR IMPROVEMENT
(Improvement from reference, in %)(Initial Analysis for 2003; Subject To Extensive Update in 2004)
Capital Costs Annual Energy Production O&M Costs Reliability
Site-Specific Design/Reduced Design Margin TIOs
Advanced (Enlarged) Rotor TIOs
Reduced Energy Losses and Increased Availability TIOs
Advanced Tower TIOs
Manufacturing TIOs
New Drive Train Concept TIOs
Advanced Power Electronics TIOs
Learning Curve Effects
+10 +20 +30-30 -20 -10 +407070-*
70--*
-65-*
8080--
8070-*
80808080
100100
--
100
Probabilityof Success*
*TBD*High Probability of Success Case
Global WINDPOWER 2004 - Chicago, Illinois
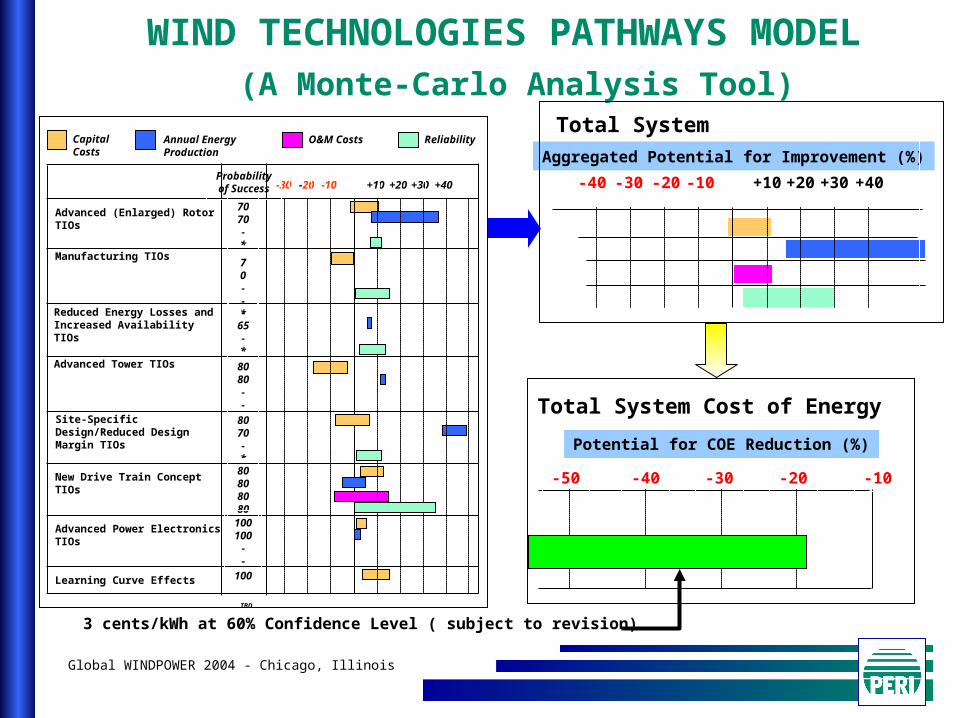
WIND TECHNOLOGIES PATHWAYS MODEL
(A Monte-Carlo Analysis Tool)Capital Costs
Annual EnergyProduction
O&M Costs Reliability
Site-Specific Design/Reduced Design Margin TIOs
Advanced (Enlarged) Rotor TIOs
Reduced Energy Losses and Increased Availability TIOs
Advanced Tower TIOs
Manufacturing TIOs
New Drive Train Concept TIOs
Advanced Power Electronics TIOs
Learning Curve Effects
+10+20+30-30 -20 -10 +40
7070-*
70--*-
65-*
8080--
8070-*
80808080
100100
--
100
Probabilityof Success
*TBD
Total SystemAggregated Potential for Improvement (%)
+10+20+30-40 -30 -20 -10 +40
Total System Cost of Energy
Potential for COE Reduction (%)
-50 -40 -30 -20 -10
3 cents/kWh at 60% Confidence Level ( subject to revision)
Total System
Global WINDPOWER 2004 - Chicago, Illinois
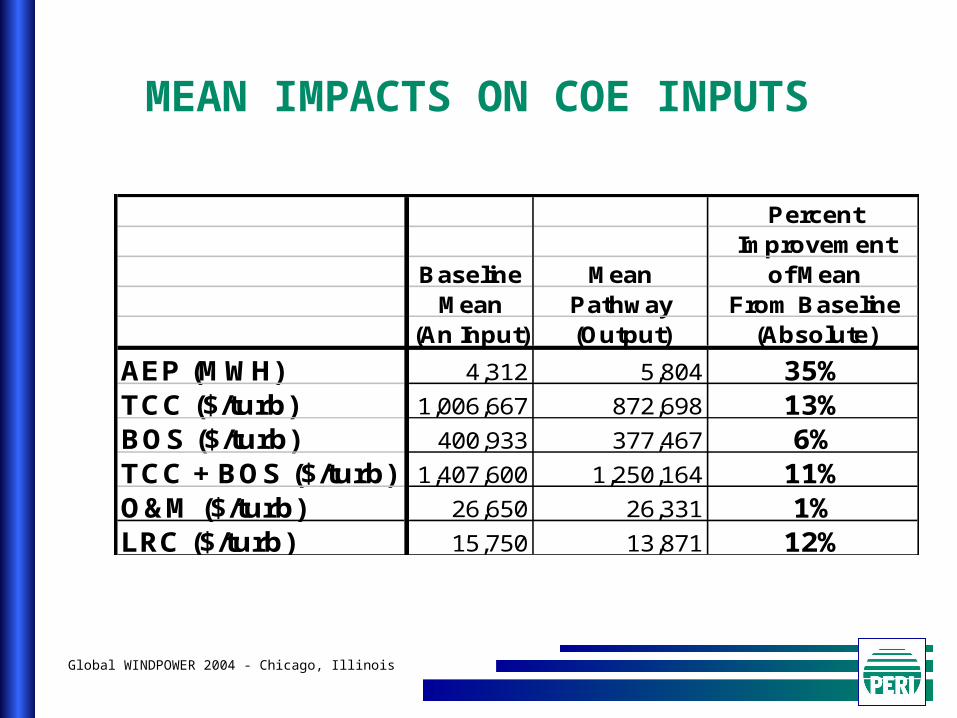
MEAN IMPACTS ON COE INPUTS
PercentImprovement
Baseline Mean of MeanMean Pathway From Baseline
(An Input) (Output) (Absolute)
AEP (MWH) 4,312 5,804 35%TCC ($/turb) 1,006,667 872,698 13%BOS ($/turb) 400,933 377,467 6%TCC + BOS ($/turb) 1,407,600 1,250,164 11%O&M ($/turb) 26,650 26,331 1%LRC ($/turb) 15,750 13,871 12%
Global WINDPOWER 2004 - Chicago, Illinois
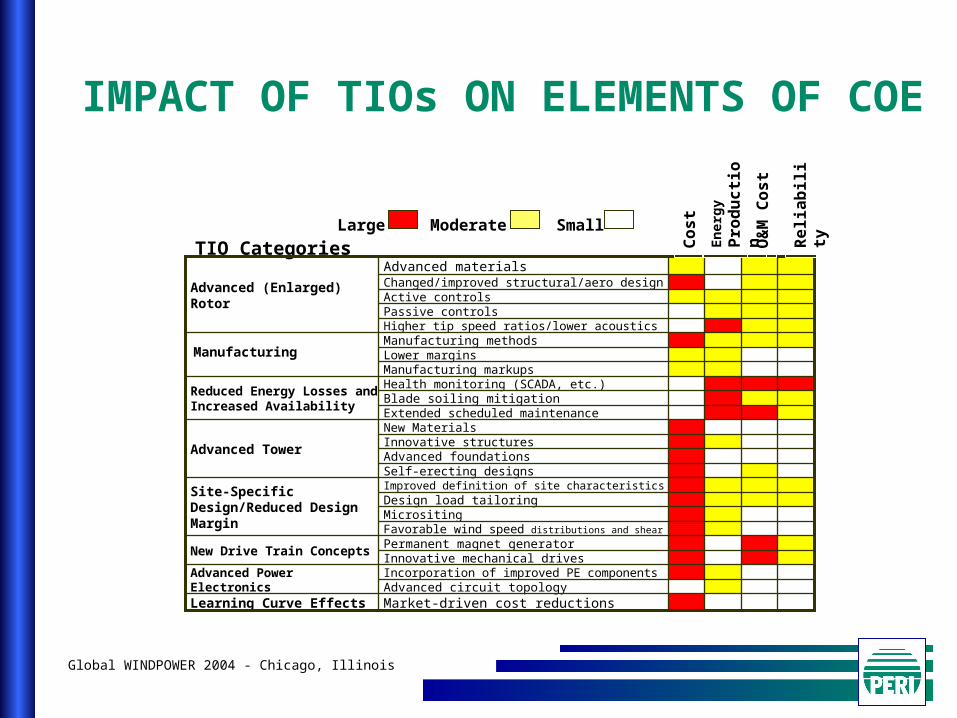
IMPACT OF TIOs ON ELEMENTS OF COE
TIO Categories
Incorporation of improved PE components
Improved definition of site characteristicsSite-Specific Design/Reduced Design Margin
Design load tailoringMicrositingFavorable wind speed distributions and shear
Innovative mechanical drives
Innovative structuresAdvanced foundationsSelf-erecting designs
Blade soiling mitigationExtended scheduled maintenance
Lower marginsManufacturing markups
Active controlsChanged/improved structural/aero design
Passive controls
Market-driven cost reductionsLearning Curve EffectsAdvanced circuit topology
Advanced Power Electronics
Permanent magnet generatorNew Drive Train Concepts
New Materials
Advanced Tower
Health monitoring (SCADA, etc.)Reduced Energy Losses and Increased Availability
Manufacturing methodsManufacturing
Higher tip speed ratios/lower acoustics
Advanced materials
Advanced (Enlarged) Rotor
Large Moderate Small
Cos
t En
erg
y
Pro
du
cti
on O
&M
Cost
Reliab
ilit
y