Embed Size (px)
Citation preview
Global Warming HiatusMátyás Csiky, Harold Eyster, & Sebastian Saldivar
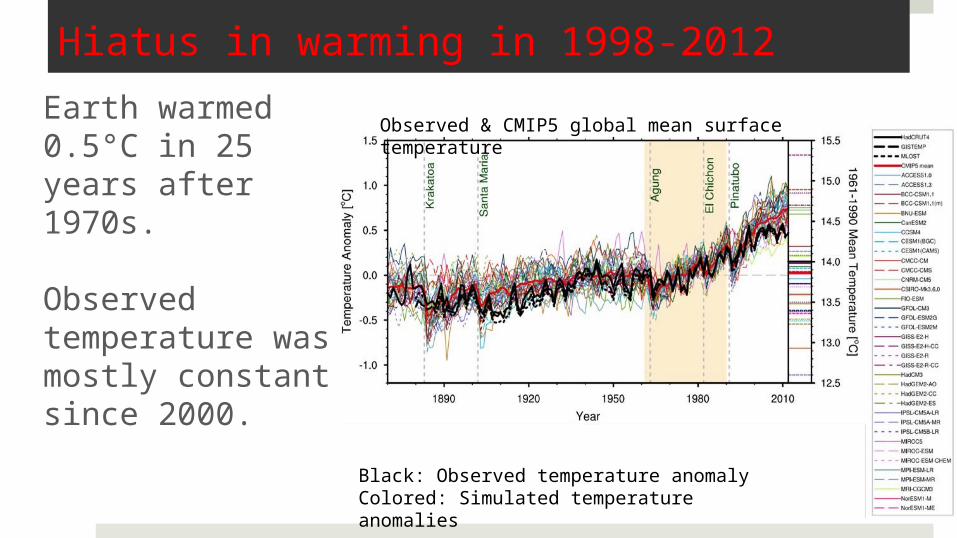
Hiatus in warming in 1998-2012
Earth warmed 0.5°C in 25 years after 1970s.
Observed temperature was mostly constant since 2000.
Black: Observed temperature anomalyColored: Simulated temperature anomalies
Observed & CMIP5 global mean surface temperature
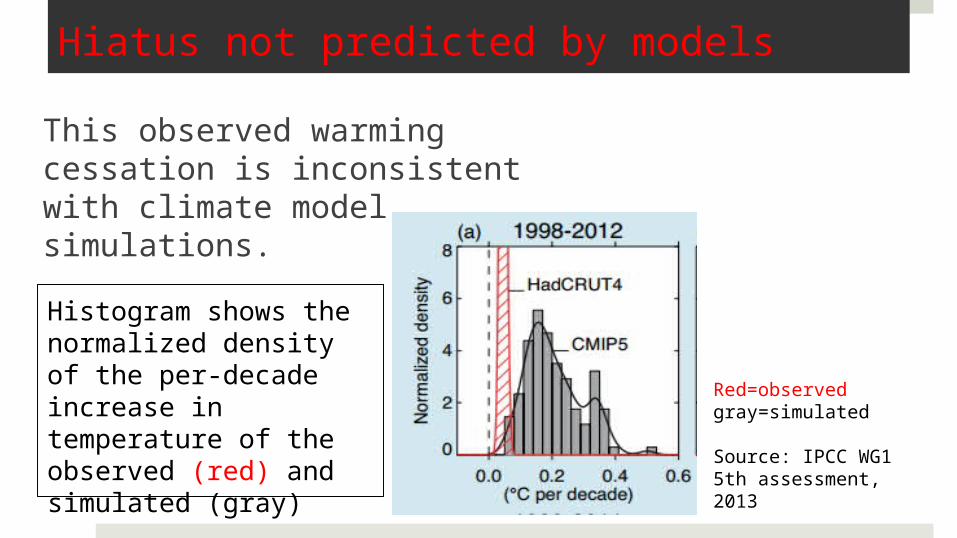
Hiatus not predicted by models
This observed warming cessation is inconsistent with climate model simulations.
Red=observedgray=simulated
Source: IPCC WG1 5th assessment, 2013
Histogram shows the normalized density of the per-decade increase in temperature of the observed (red) and simulated (gray)
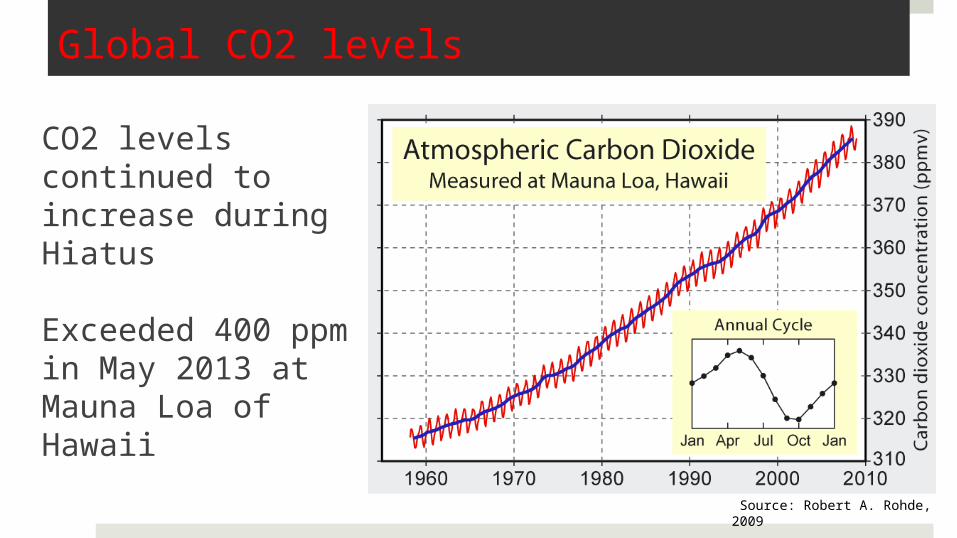
Global CO2 levels
CO2 levels continued to increase during Hiatus
Exceeded 400 ppm in May 2013 at Mauna Loa of Hawaii
Source: Robert A. Rohde, 2009
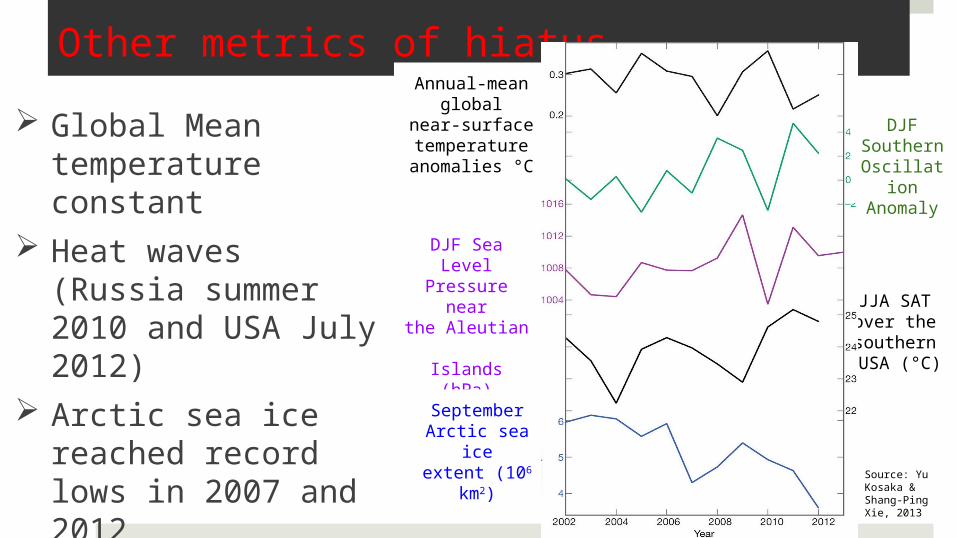
Other metrics of hiatus
Global Mean temperature constant
Heat waves (Russia summer 2010 and USA July 2012)
Arctic sea ice reached record lows in 2007 and 2012
Source: Yu Kosaka & Shang-Ping Xie, 2013
JJA SAT over the southern USA (°C)
Annual-mean global near-surface temperature
anomalies °C DJF
Southern Oscillation Anomaly
DJF Sea Level Pressure nearthe Aleutian Islands (hPa)
September Arctic sea ice
extent (106 km2)

Does this hiatus disprove Climate Change?
Are environmentalists and climate scientists wrong about the truth of climate change?
Or is there an explanation for the pause in warming that is consistent with climate change?
Scientific hypotheses
Subsurface ocean warming
Radiative warming dominated by pacific cooling
Stratospheric water vapor decrease
Reduction in solar forcing 2000-2009
Aerosol increase by volcanos
Model oversensitivity to GHGs
Models & observations over 15 yr periods
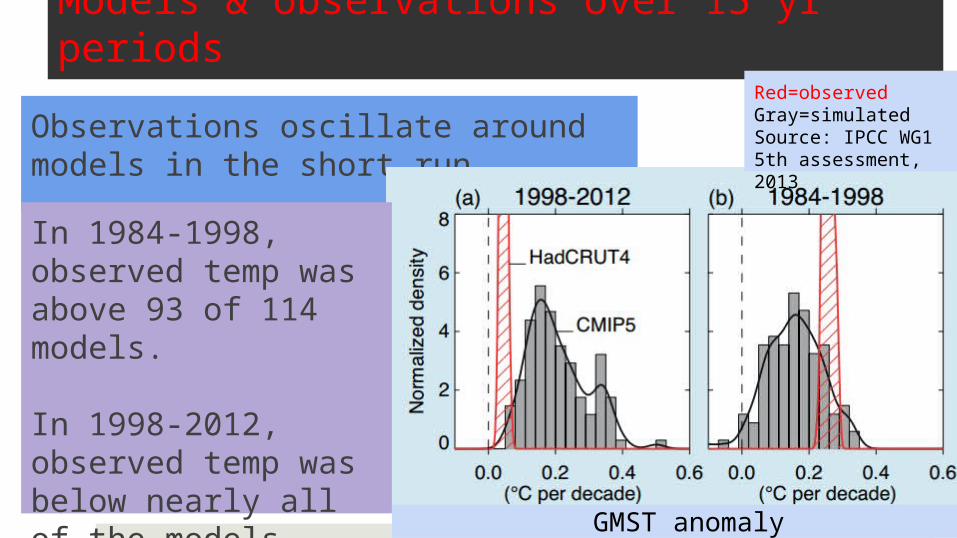
Observations oscillate around models in the short run.
Red=observedGray=simulated Source: IPCC WG1 5th assessment, 2013
In 1984-1998, observed temp was above 93 of 114 models.
In 1998-2012, observed temp was below nearly all of the models.
GMST anomaly
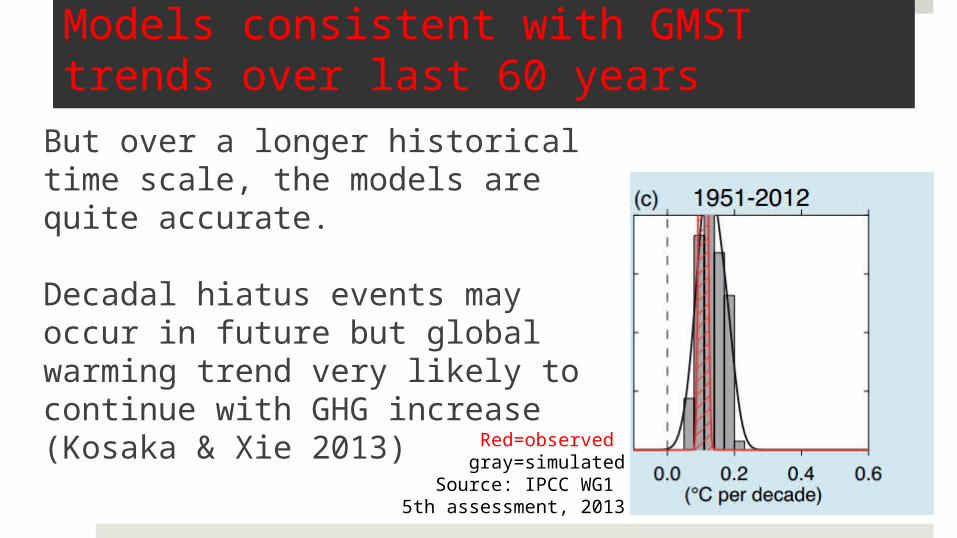
Models consistent with GMST trends over last 60 years
But over a longer historical time scale, the models are quite accurate.
Decadal hiatus events may occur in future but global warming trend very likely to continue with GHG increase (Kosaka & Xie 2013)
Red=observed gray=simulated
Source: IPCC WG1 5th assessment, 2013
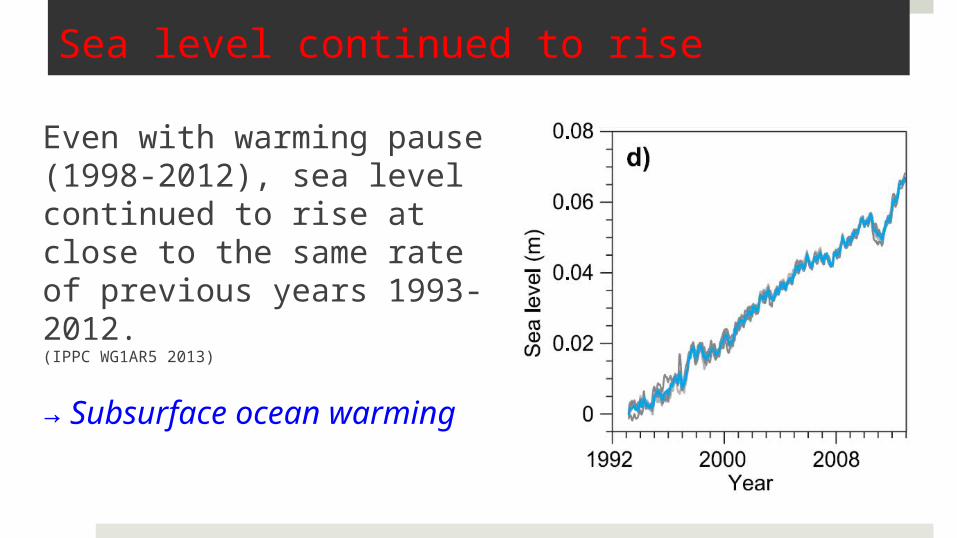
Sea level continued to rise
Even with warming pause (1998-2012), sea level continued to rise at close to the same rate of previous years 1993-2012.(IPPC WG1AR5 2013)
→ Subsurface ocean warming

Seasonality of the hiatusSAT hiatus confined to winter.
Global temperature continues to rise in summer (e.g. Arctic Ice)
Tropical influence more pronounced in winter (but greater variation)
Source: Yu Kosaka & Shang-Ping Xie, 2013
Tropics N. Extratropcis
Tropics N. Extratropics
Temperature anomaly in winter (blue) and summer (red)
Probability density of temp. trends in winter (blue) & summer (red)
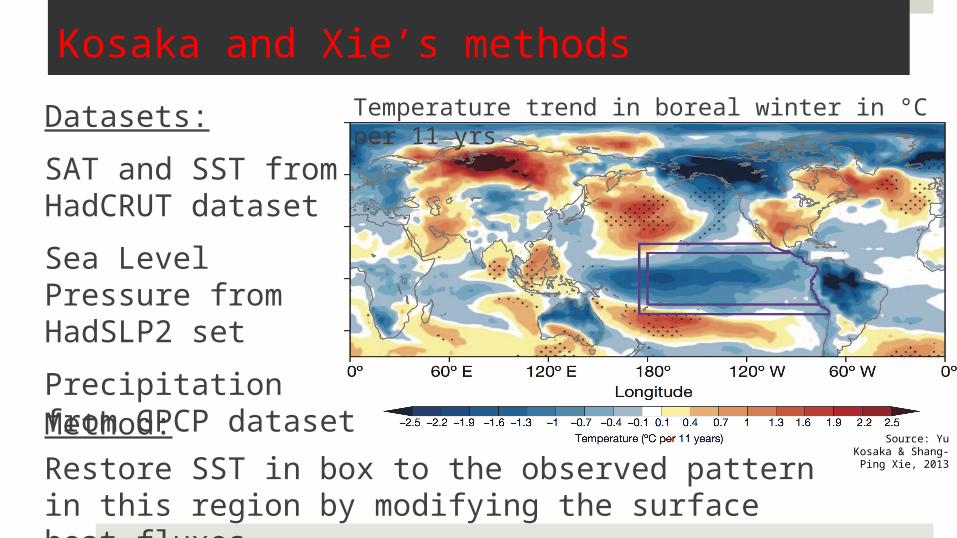
Kosaka and Xie’s methods
Datasets:
SAT and SST from HadCRUT dataset
Sea Level Pressure from HadSLP2 set
Precipitation from GPCP datasetMethod:
Restore SST in box to the observed pattern in this region by modifying the surface heat fluxes
Temperature trend in boreal winter in °C per 11 yrs
Source: Yu Kosaka & Shang-Ping Xie,
2013
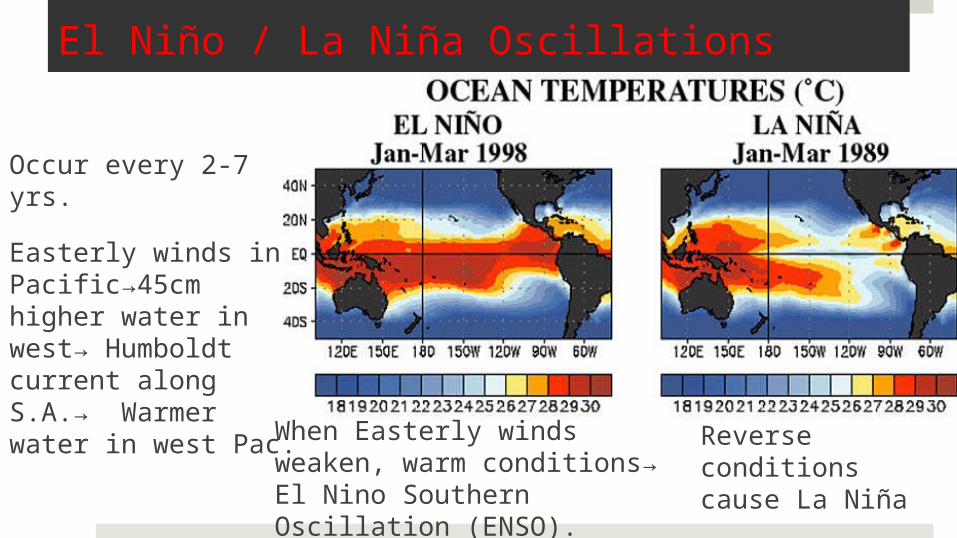
El Niño / La Niña Oscillations
http://oceanservice.noaa.gov/
Reverse conditions cause La Niña
When Easterly winds weaken, warm conditions→ El Nino Southern Oscillation (ENSO).
Occur every 2-7 yrs.
Easterly winds in Pacific→45cm higher water in west→ Humboldt current along S.A.→ Warmer water in west Pac.
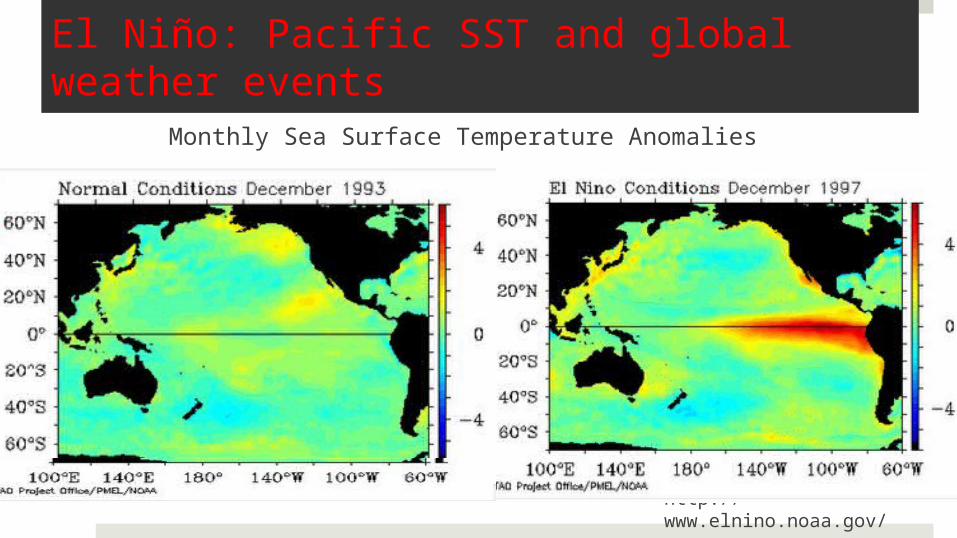
El Niño: Pacific SST and global weather events
http://www.elnino.noaa.gov/
Monthly Sea Surface Temperature Anomalies
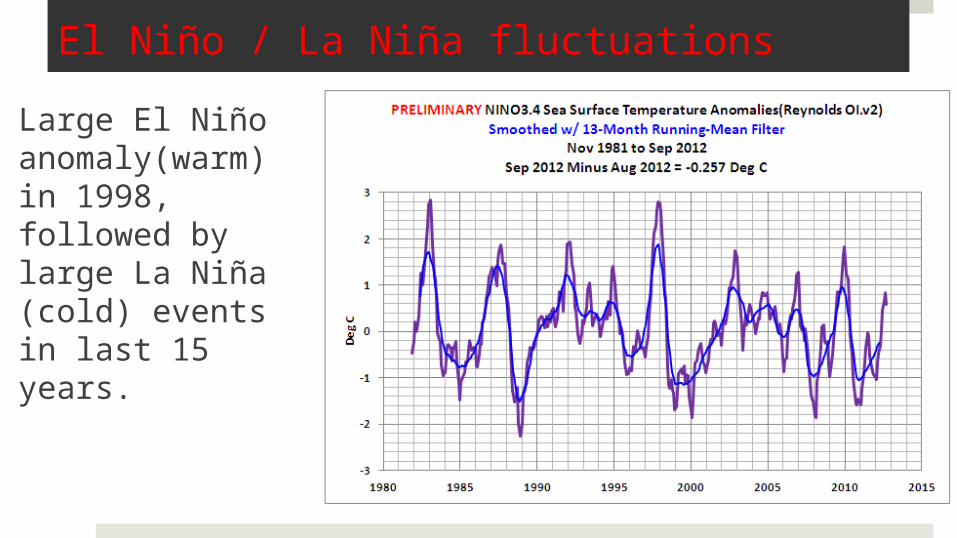
El Niño / La Niña fluctuations
Large El Niño anomaly(warm) in 1998, followed by large La Niña (cold) events in last 15 years.
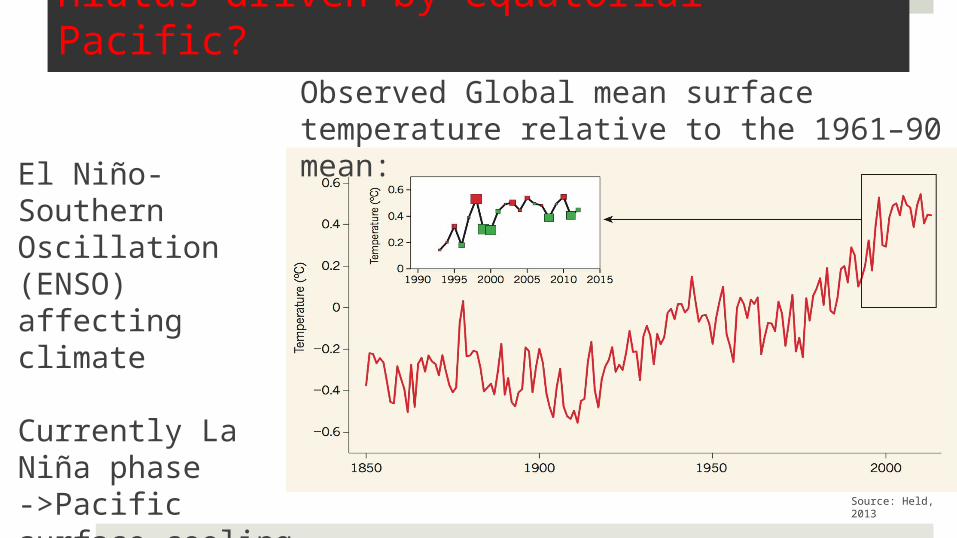
Hiatus driven by equatorial Pacific?
El Niño-Southern Oscillation (ENSO) affecting climate
Currently La Niña phase ->Pacific surface cooling
Source: Held, 2013
Observed Global mean surface temperature relative to the 1961–90 mean:
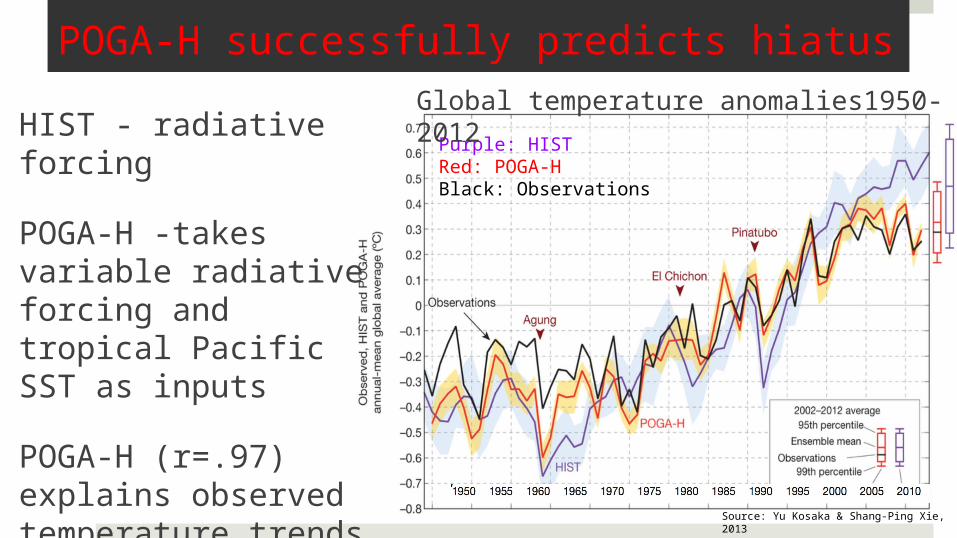
POGA-H successfully predicts hiatus
Purple: HISTRed: POGA-HBlack: Observations
Global temperature anomalies1950-2012
Source: Yu Kosaka & Shang-Ping Xie, 2013
HIST - radiative forcing
POGA-H -takes variable radiative forcing and tropical Pacific SST as inputs
POGA-H (r=.97) explains observed temperature trends better than HIST (r=.90)

ENSO affects global temperature
Source: Yu Kosaka & Shang-Ping Xie, 2013
How much of the observed global warming is due to the tropical Pacific?
Red= POGA-C Green= Pacific region SAT
Seasonal global anomaly modeled by POGA-H
0 is 1980-1990 average
Temperature relation between restoring region & POGA-CPOGA-C fixed radiative forcing to 1990 level
La Niña event lowered global temperature by about 0.15°C
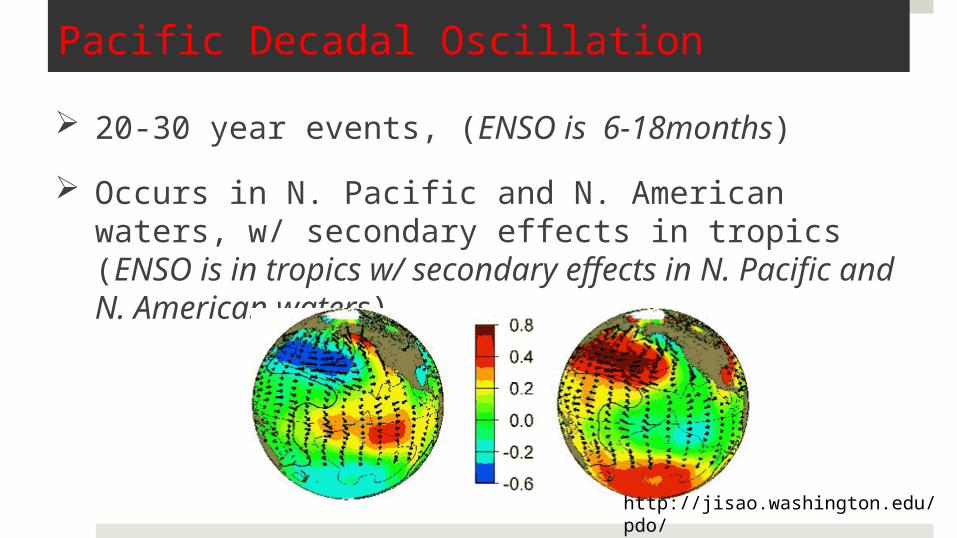
Pacific Decadal Oscillation
20-30 year events, (ENSO is 6-18months)
Occurs in N. Pacific and N. American waters, w/ secondary effects in tropics (ENSO is in tropics w/ secondary effects in N. Pacific and N. American waters).
http://jisao.washington.edu/pdo/
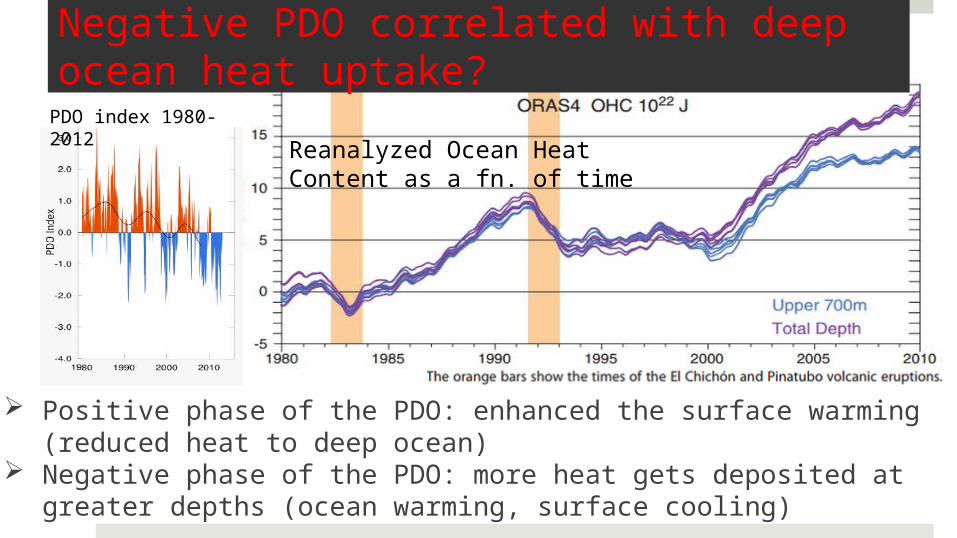
Positive phase of the PDO: enhanced the surface warming (reduced heat to deep ocean)
Negative phase of the PDO: more heat gets deposited at greater depths (ocean warming, surface cooling)
Reanalyzed Ocean Heat Content as a fn. of time
PDO index 1980-2012
Negative PDO correlated with deep ocean heat uptake?
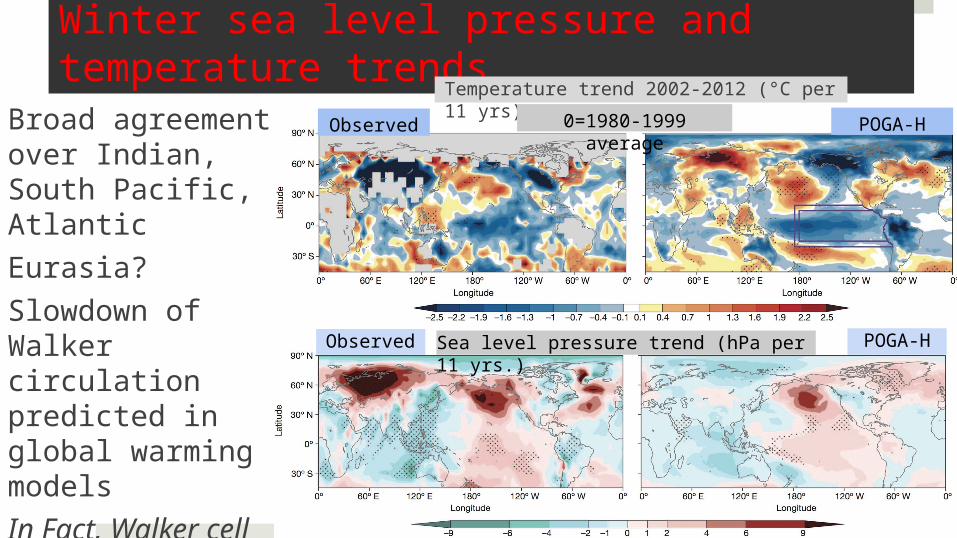
Winter sea level pressure and temperature trends
Source: Yu Kosaka & Shang-Ping Xie, 2013
Temperature trend 2002-2012 (°C per 11 yrs)
Observed 0=1980-1999 average
POGA-H
Sea level pressure trend (hPa per 11 yrs.)
Observed POGA-H
Broad agreement over Indian, South Pacific, Atlantic
Eurasia?
Slowdown of Walker circulation predicted in global warming models
In Fact, Walker cell intensified, which model captures
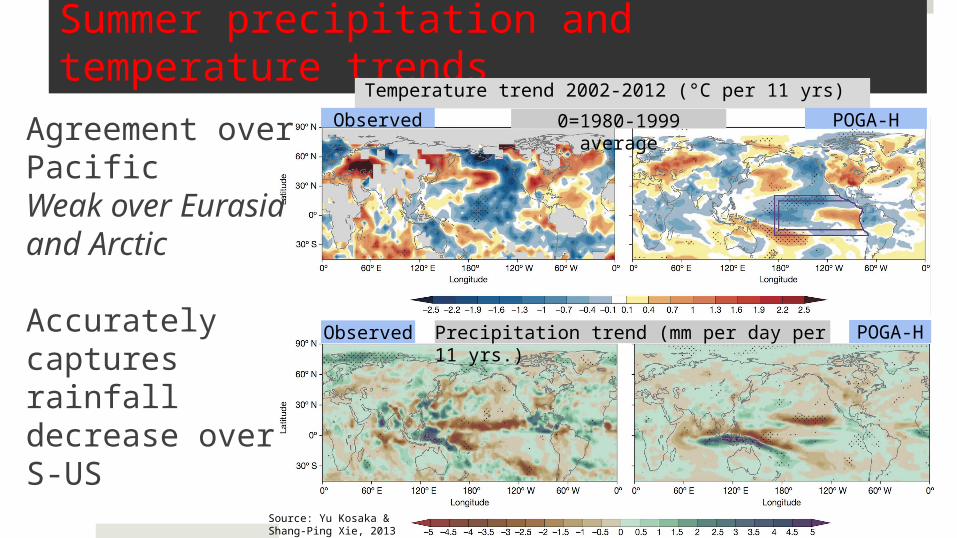
Summer precipitation and temperature trends
Temperature trend 2002-2012 (°C per 11 yrs)
POGA-H0=1980-1999 average
ObservedAgreement over PacificWeak over Eurasia and Arctic
Accurately captures rainfall decrease over S-US
Source: Yu Kosaka & Shang-Ping Xie, 2013
POGA-HObserved Precipitation trend (mm per day per 11 yrs.)

How valuable is the model?
What are the advantages/disadvantages of tying the model to SST of the equatorial Pacific?
Is La Niña forced by Climate Change, or is it merely a result of internal variability (Held, 2013)?
Can internal variability account for the warming hiatus?
Guemas et al.’s methods
Init experiment: all model state variables are initialized with the observations at a given year
NoInit: does not include any information about the previous observed variability, only information about the external radiative forcing.
Variables assessed for experiments: Measure Global SST anomalies (Kelvin) and Ocean Heat Uptake (Joules) in multiple geographic regions
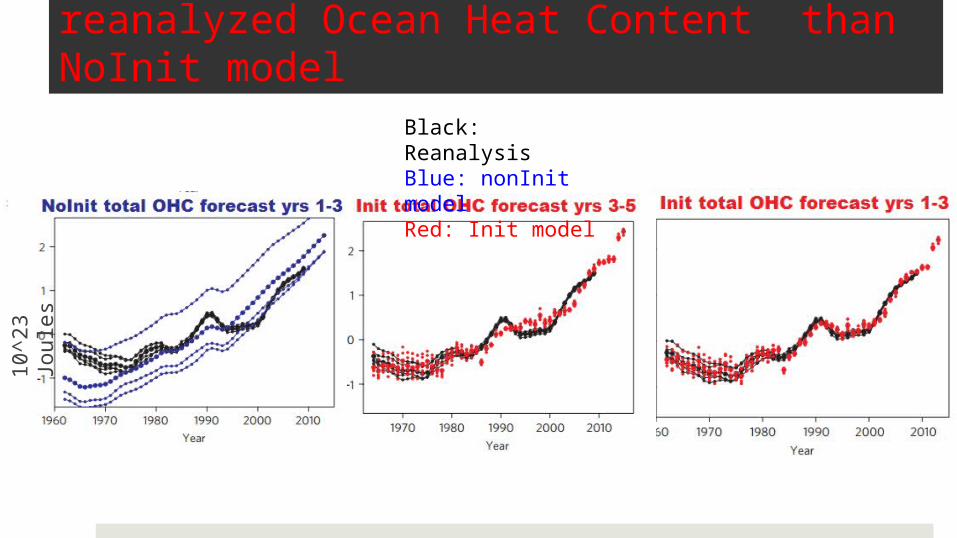
Init model is more consistent with reanalyzed Ocean Heat Content than NoInit model
Black: ReanalysisBlue: nonInit modelRed: Init model
10
^2
3 Joule
s
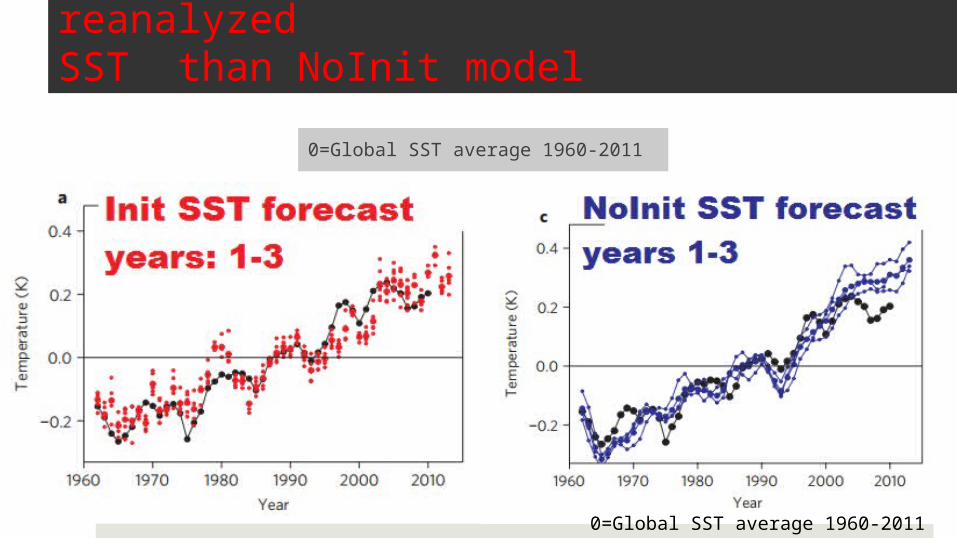
Init model is more consistent with reanalyzed SST than NoInit model
0=Global SST average 1960-2011
0=Global SST average 1960-2011
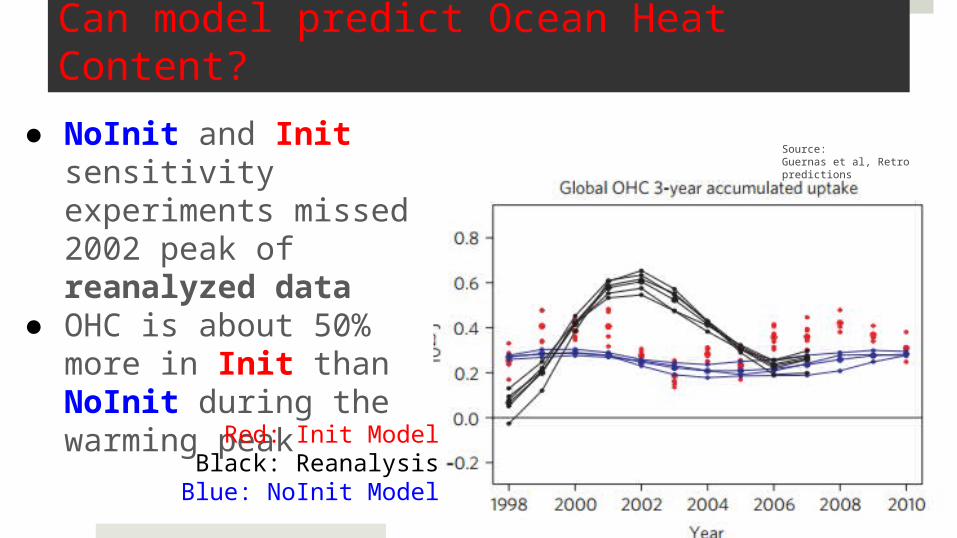
Can model predict Ocean Heat Content?
● NoInit and Init sensitivity experiments missed 2002 peak of reanalyzed data
● OHC is about 50% more in Init than NoInit during the warming peak
Source: Guernas et al, Retro predictions
Red: Init ModelBlack: Reanalysis
Blue: NoInit Model

Importance of Tropic-waters in OHC
Triangle: Mixed layer. Diamonds: Below mixed layer
OHC 3-yr uptake Tropical Pacific 1998-2012
OHC 3-yr uptake in Tropical Atlantic 1998-2012
Black= Reanalysis, Red=Init, Blue= NoInit
OHC 3-yr uptake in N. Atlantic 1998-2012
The tropical Pacific, the tropical Atlantic and the North Atlantic absorption below the mixed layer explain 42%, 25% and 16% of the upper ocean heat uptake at the time of its maximum, respectively.
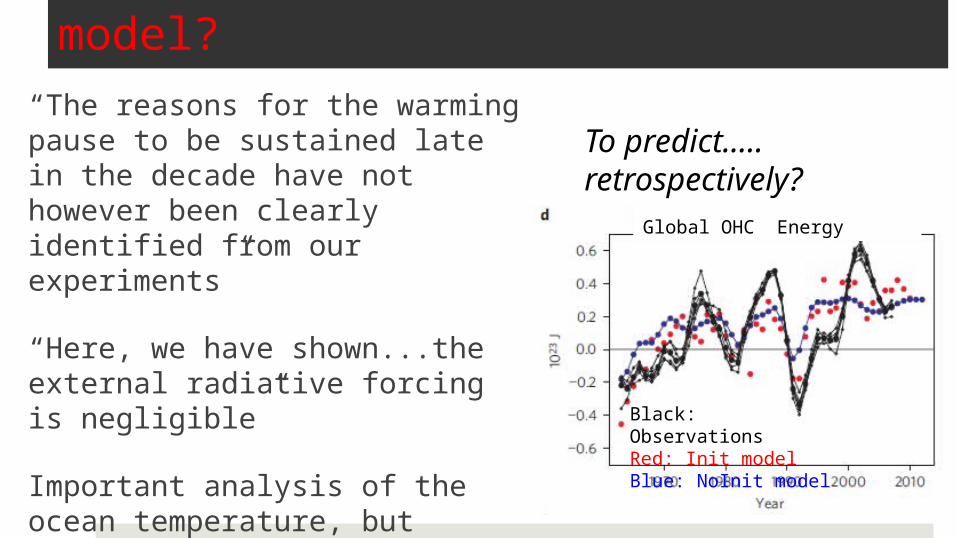
How accurate and useful is this model?
“The reasons for the warming pause to be sustained late in the decade have not however been clearly identified from our experiments”
“Here, we have shown...the external radiative forcing is negligible”
Important analysis of the ocean temperature, but useful model?
To predict…..retrospectively?
Global OHC Energy
Black: ObservationsRed: Init modelBlue: NoInit model

Some models appear to be too sensitive to anthropogenic greenhouse gases.
IPCC suggests that model response to anthropogenic GHG should be scaled by 0.9
Brown= scale by which the contributions from anthropogenic forcings
are multiplied by to equal HadCrut4
observationsBlue= ...natural
contribution...Source: IPCC WG1AY5 3013
Are models too sensitive to GHG?
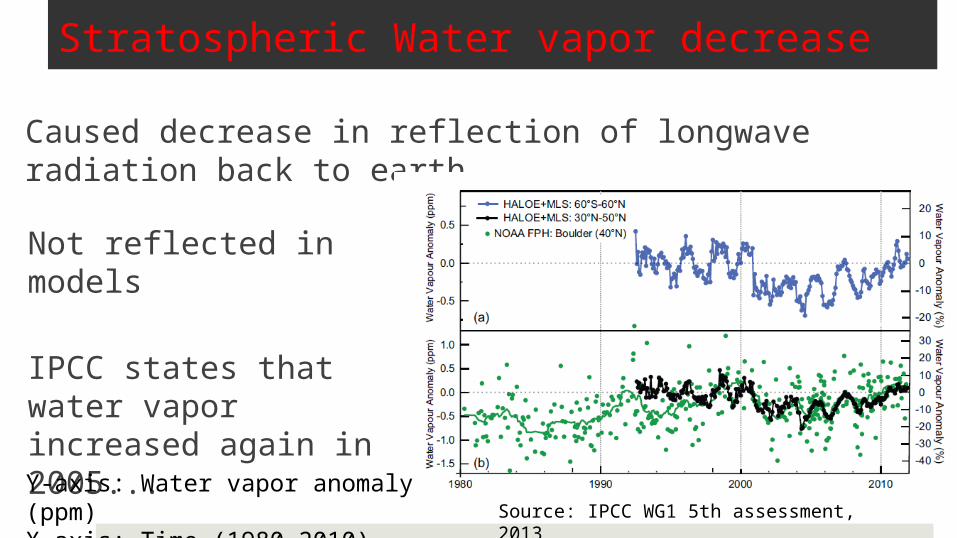
Stratospheric Water vapor decrease
Caused decrease in reflection of longwave radiation back to earth.
Source: IPCC WG1 5th assessment, 2013
Not reflected in models
IPCC states that water vapor increased again in 2005...
Y-axis: Water vapor anomaly (ppm)X-axis: Time (1980-2010)
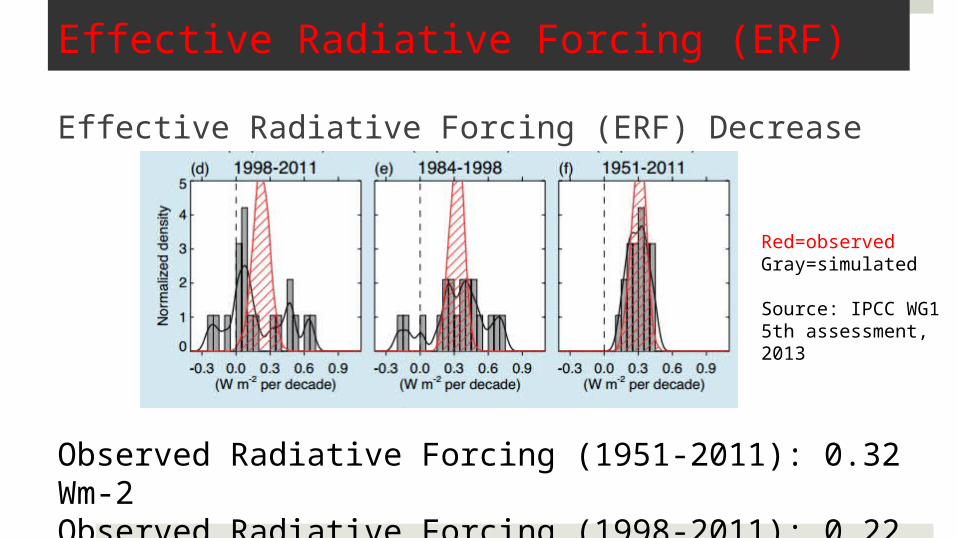
Effective Radiative Forcing (ERF)
Effective Radiative Forcing (ERF) Decrease
Red=observedGray=simulated
Source: IPCC WG1 5th assessment, 2013
Observed Radiative Forcing (1951-2011): 0.32 Wm-2Observed Radiative Forcing (1998-2011): 0.22 Wm-2
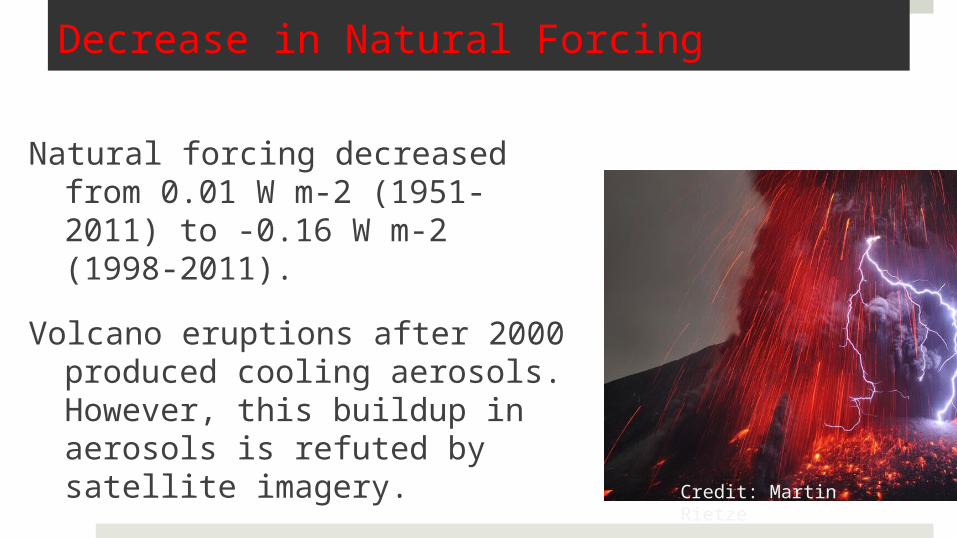
Decrease in Natural Forcing
Natural forcing decreased from 0.01 W m-2 (1951-2011) to -0.16 W m-2 (1998-2011).
Volcano eruptions after 2000 produced cooling aerosols. However, this buildup in aerosols is refuted by satellite imagery.
Credit: Martin Rietze
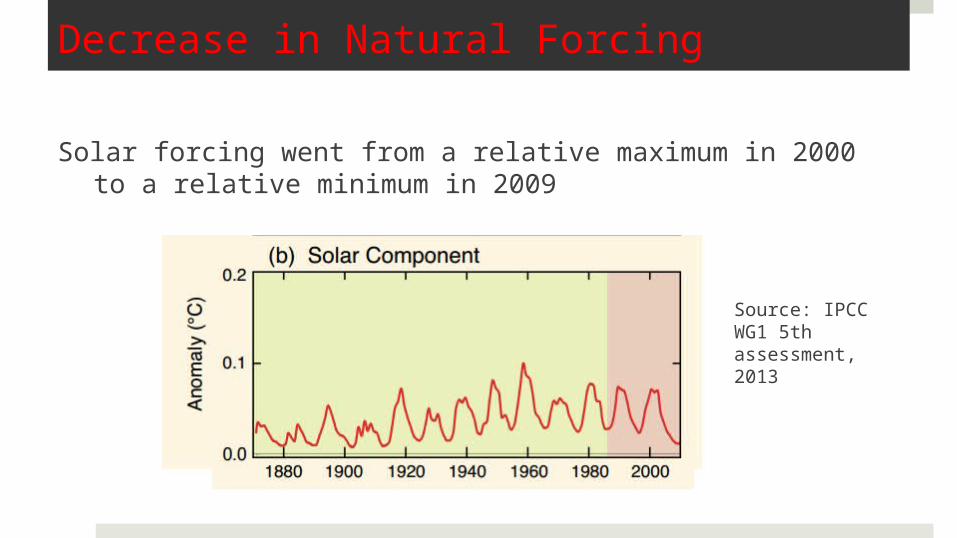
Decrease in Natural Forcing
Solar forcing went from a relative maximum in 2000 to a relative minimum in 2009
Source: IPCC WG1 5th assessment, 2013

Simulated ERF is less than observed ERF
Models ignored decreasing solar forcing and volcanism.
However, models (CMIP5) still show lower ERF than observations (hadCRUT4).
Red=observedGray=simulated
Source: IPCC WG1 5th assessment,
2013
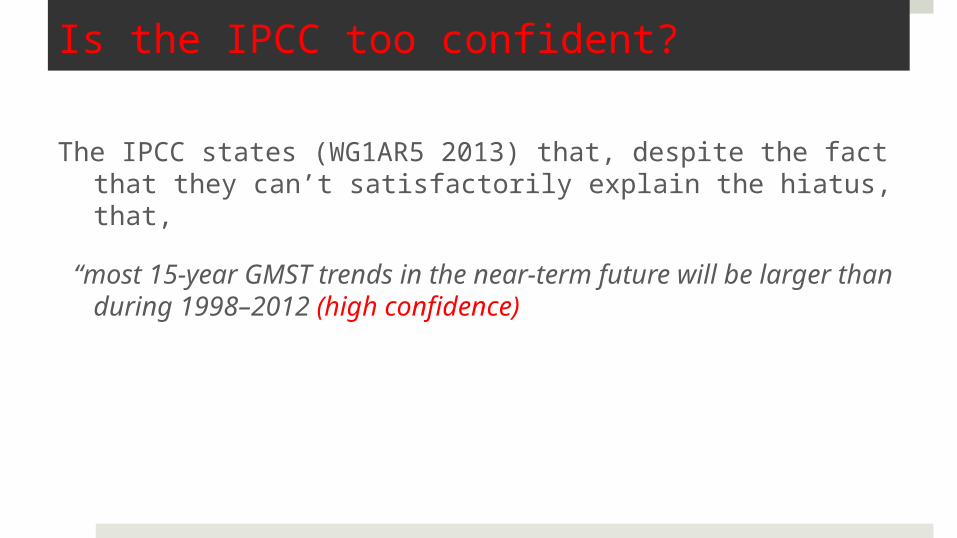
Is the IPCC too confident?
The IPCC states (WG1AR5 2013) that, despite the fact that they can’t satisfactorily explain the hiatus, that,
“most 15-year GMST trends in the near-term future will be larger than during 1998–2012 (high confidence)