Embed Size (px)
Citation preview

GLOBAL WARMINGGLOBAL WARMING
Dr. Chris P. TsokosDistinguished University Professor
Vice President of IFNAJuly 03, 2008
KeynoteAddress: WCNA 2008
Orlando FloridaJuly 03, 2008

GLOBAL WARMINGGLOBAL WARMINGResearch Seminar Team
Chris P. TsokosGan LaddeRebecca WootenShou Hsing ShihBongjin ChoiYong XuDimitris Vovoras

Mathematical and Statistical Mathematical and Statistical Modeling of Global WarmingModeling of Global Warming
Do we scientifically understand the concept of “Global Do we scientifically understand the concept of “Global Warming”?Warming”?
Recent Definition: “GLOBAL WARMING- an increase Recent Definition: “GLOBAL WARMING- an increase in Temperature at the surface of the earth supposedly in Temperature at the surface of the earth supposedly caused by the greenhouse effects” (Greenhouse Effects- caused by the greenhouse effects” (Greenhouse Effects- Carbon Dioxide COCarbon Dioxide CO22 (greenhouse gas)) (greenhouse gas))
SupposedlySupposedly – assumed to be true without conclusive evidenceassumed to be true without conclusive evidence– Hypothetical, conjectural, etc.Hypothetical, conjectural, etc.

Wikipedia(on-line encyclopedia)
Defines the phenomenon of
“GLOBAL WARMING”
as the increase in the average temperature of the earth’s near-surface air and oceans in recent decades and its projected continuation.
MEDIA CHAOS: PRO AND MEDIA CHAOS: PRO AND CONCERNED (SKEPTICS)CONCERNED (SKEPTICS)
PRO - GLOBAL WARMINGPRO - GLOBAL WARMING *Intergovernmental Panel on Climate Change *Intergovernmental Panel on Climate Change
(IPCC) “Climate Change 2007”(IPCC) “Climate Change 2007” Increase in Temperature → Increase Sea LevelIncrease in Temperature → Increase Sea Level Unpredictable Pattern in RainfallUnpredictable Pattern in Rainfall Increase in Extreme Weather EventsIncrease in Extreme Weather Events Alterations in Agriculture YieldsAlterations in Agriculture Yields Increase in River FlowsIncrease in River Flows Etc.Etc.

PRO - GLOBAL WARMING PRO - GLOBAL WARMING (Continued)(Continued)
Award Winning Documentary–Vice President GoreAward Winning Documentary–Vice President Gore– Fiction VS. Reality / AwarenessFiction VS. Reality / Awareness– ABC: 20/20 / Give Me A Break!ABC: 20/20 / Give Me A Break!
A Number of Professional OrganizationsA Number of Professional Organizations– American Meteorological SocietyAmerican Meteorological Society– American Geographical UnionAmerican Geographical Union– AAASAAAS
National AcademiesNational Academies– Blame Human ActivitiesBlame Human Activities

CONCERNED / SKEPTICSCONCERNED / SKEPTICS Great Britain’s Channel 4 DocumentaryGreat Britain’s Channel 4 Documentary
– ““The Great Global Warming Swindle”The Great Global Warming Swindle” NASA ScientistsNASA Scientists
– Sun spots are hotter than previously thoughtSun spots are hotter than previously thought Danish National Space CenterDanish National Space Center
– Temperature changes are due to fluctuations in the Temperature changes are due to fluctuations in the sun’s output (NASA)sun’s output (NASA)
– (Stated: …there is absolutely nothing we can do to (Stated: …there is absolutely nothing we can do to correct the situation)correct the situation)
ABC – 20/20: Broadcast – “Give Me a Break”ABC – 20/20: Broadcast – “Give Me a Break”

CONCERNED / SKEPTICS CONCERNED / SKEPTICS (Continued)(Continued)
Times Washington Bureau Chief, Bill AdairTimes Washington Bureau Chief, Bill Adair– ““Global Warming has been called the most dire issue Global Warming has been called the most dire issue
facing the planet and yet, if you are not a scientist, it facing the planet and yet, if you are not a scientist, it can be difficult to sort out the truth”can be difficult to sort out the truth”
Finally, St. Pete Times, Jan 23, 2007Finally, St. Pete Times, Jan 23, 2007– ““Global Warming: Meet Your Adversary” By the Global Warming: Meet Your Adversary” By the
numbers: 9 out of 10 statistical Info. numbers: 9 out of 10 statistical Info. Not CorrectNot Correct

Wall Street JournalWall Street Journal“Global Warming is 300-years-old news”“Global Warming is 300-years-old news” ““The various kind of evidence examined by NRC – The various kind of evidence examined by NRC –
National Research Council, led it to conclude that National Research Council, led it to conclude that the observed disparity between the surface and the observed disparity between the surface and atmospheric temperature trends during the 20-year atmospheric temperature trends during the 20-year period is probably at least partially real”period is probably at least partially real”– Uncertainties in all aspects exist – can not draw any Uncertainties in all aspects exist – can not draw any
conclusions concerning “GW”conclusions concerning “GW”– NRC concludes that “Major Advances” in scientific NRC concludes that “Major Advances” in scientific
methods will be necessary before these questions methods will be necessary before these questions (GW) can be resolved.(GW) can be resolved.
… … spread fear of “Global Warming” demonizing, spread fear of “Global Warming” demonizing, hydrocarbon fuel.hydrocarbon fuel.

Do We Understand the Problem of Do We Understand the Problem of Global Warming?Global Warming?
Zero Legal Legislative Policies: Why?Zero Legal Legislative Policies: Why? Continental U.SContinental U.S
– Popular Claim to Global Warming: The Marriage of Popular Claim to Global Warming: The Marriage of Temperature and Carbon Dioxide (COTemperature and Carbon Dioxide (CO22))
Need to UnderstandNeed to Understand– Temperature Behavior (Type)Temperature Behavior (Type)– Carbon Dioxide (Type)Carbon Dioxide (Type)– Their RelationshipTheir Relationship

TemperatureTemperature
Atmospheric (2 or 3 Versions)Atmospheric (2 or 3 Versions) SurfaceSurface
– LandLand– Ocean (73%)Ocean (73%)
Historical Data: 1895-2007 / Daily, Historical Data: 1895-2007 / Daily, Weekly, Monthly, YearlyWeekly, Monthly, Yearly
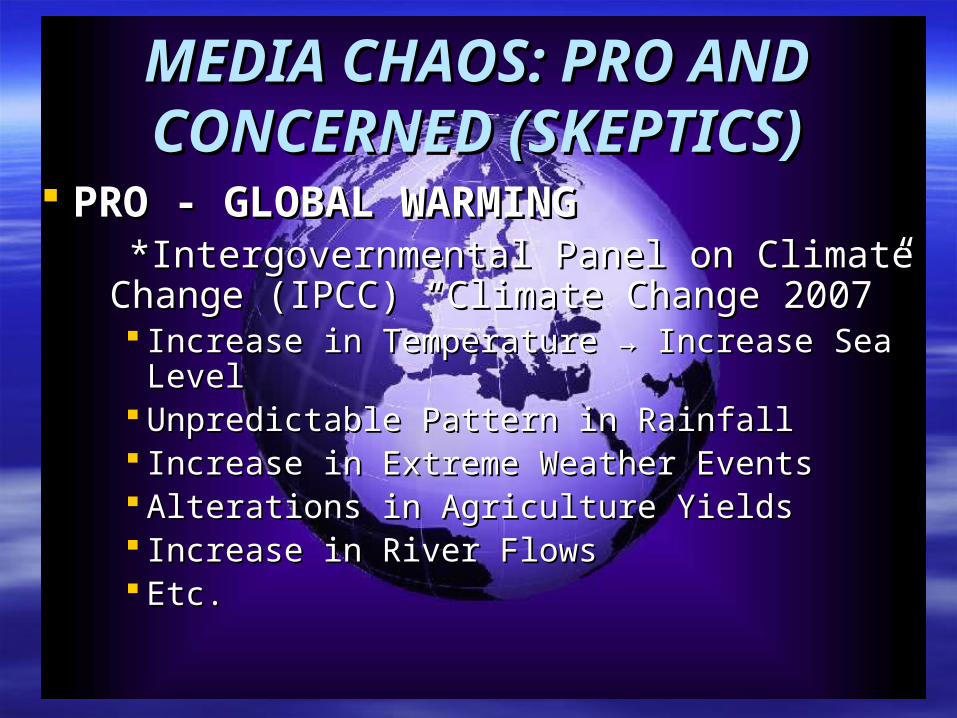
Atmospheric Temperature DataAtmospheric Temperature Data
Version 1: United States Climate Division, Version 1: United States Climate Division, USCD, (1895-2007) 344 Climate DivisionsUSCD, (1895-2007) 344 Climate Divisions
Version 2: United States Historical Version 2: United States Historical Climatology Network, USHCN , (1895-2007) Climatology Network, USHCN , (1895-2007) 1219 Stations1219 Stations
Proposed Version: Stratified The Continental Proposed Version: Stratified The Continental U. S. in Equal SegmentU. S. in Equal Segment– Uniformly WeightedUniformly Weighted– Statistically Correct Statistically Correct

Creating Grid PointCreating Grid Point Select a random point in bottom left corner of map, Select a random point in bottom left corner of map,
use do loops to create points every x metersuse do loops to create points every x meters

Clipping Grid PointClipping Grid Point Clip the grids that fall within the boundary of the Clip the grids that fall within the boundary of the
polygonpolygon
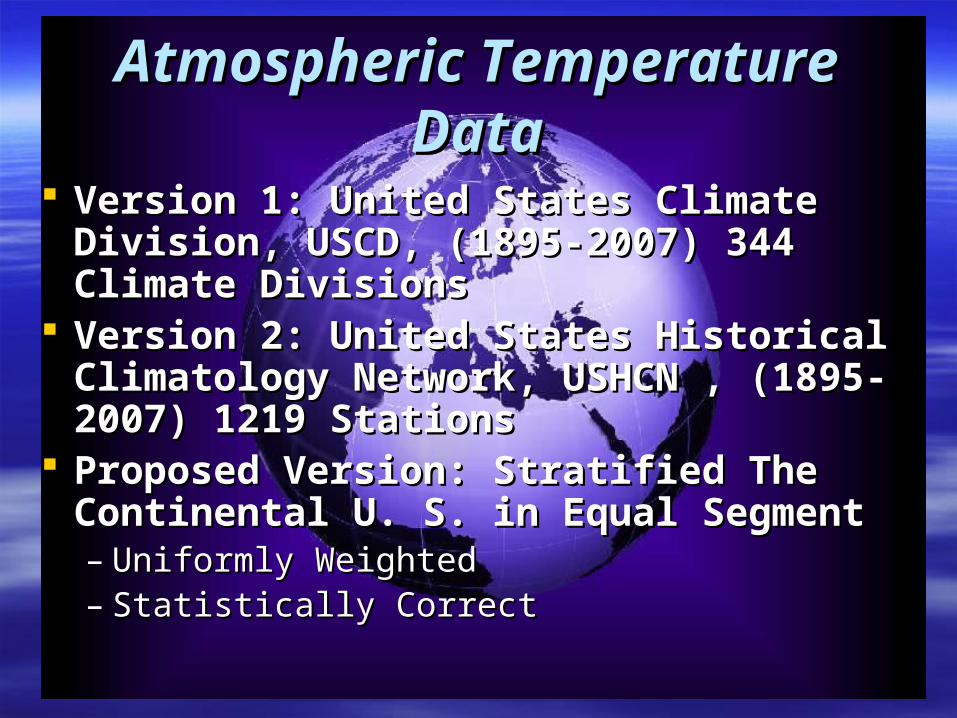
Sampling Stations and Grid PointSampling Stations and Grid Point Output location of stations and grids in metersOutput location of stations and grids in meters

Sampling Stations and Grid PointSampling Stations and Grid Point Select sampling locations within a certain radius of Select sampling locations within a certain radius of
the grid pointsthe grid points

Comparison on Version 2 Temperature Comparison on Version 2 Temperature VS. Proposed VersionVS. Proposed Version
Version 2 * Proposed Version *
Year Temperature Year Temperature
1998 55.04 1934 56.0452266
2006 54.97 1921 55.32124871
1934 54.87 1931 55.1708375
1999 54.65 1998 55.16739946
1921 54.55 1939 55.07299072
2001 54.38 1953 54.96006998
1931 54.34 1938 54.92172591
2007 54.33 1954 54.90617377
2005 54.31 1999 54.83801259
1990 54.31 1946 54.77032593

Atmospheric TemperatureAtmospheric Temperature Descriptive AnalysisDescriptive Analysis
– Tabular, Graphical – Not Very UsefulTabular, Graphical – Not Very Useful Parametric Analysis / InferentialParametric Analysis / Inferential
– Temperature data follows 3-par. Lognormal pdfTemperature data follows 3-par. Lognormal pdf
– ScaleScale
– ShapeShape– – LocationLocation– X: TemperatureX: Temperature
Thus, we can probabilistically characterize the behavior of Thus, we can probabilistically characterize the behavior of temperature and obtain useful information.temperature and obtain useful information.
0,,;2)(
}]/))[(ln(21
exp{),,;(
2
x
x
xxf
59.3:
019.0:
195.0:

Temperature Forecasting ModelTemperature Forecasting Model
Version 2: ARIMA(2,1,1)×(1,1,1)Version 2: ARIMA(2,1,1)×(1,1,1)1212
Ref. (Shih & Tsokos, Vol. 16, March 2008, Ref. (Shih & Tsokos, Vol. 16, March 2008, NP&S Comp.)NP&S Comp.)
1312127
26252411514
1312321
9599.09741.09855.000014.0
0002.00916.00036.00395.00554.0
9009.09964.00396.00556.00952.1
tttt
ttttt
tttttt
x
xxxxx
xxxxxx
0131.0r 056.0SE

Estimated ValuesEstimated Values
Original Values Forecast Values Residuals
March 2006 43.45 44.1812 -0.7312
April 2006 56.12 53.2506 2.86942
May 2006 63.12 62.6351 0.48486
June 2006 71.55 70.7152 0.83478
July 2006 77.22 75.6947 1.52532
August 2006 74.19 74.3167 -0.1267
September 2006 63.86 66.8069 -2.9469
October 2006 53.13 55.6137 -2.4837
November 2006 44.58 43.3947 1.18529
December 2006 36.79 34.7224 2.06761
January 2007 31.46 32.6854 -1.2254
February 2007 32.86 36.3025 -3.4425

Monthly Temperature VS. Our Monthly Temperature VS. Our Predicted ValuesPredicted Values
Month
Te
mp
era
ture
0 2 4 6 8 10 12
30
40
50
60
70
80
0 2 4 6 8 10 12
30
40
50
60
70
80
Original Data Predicted Value

Yearly Temperature PatternsYearly Temperature Patterns
January
February
April
May
JuneAugust
September
October
November
December
July
March

Carbon Dioxide, COCarbon Dioxide, CO22
COCO22 – – – No Color, No Odor, No Taste No Color, No Odor, No Taste
– Puts Out Fire, Puts Fizz in Seltzer Puts Out Fire, Puts Fizz in Seltzer
– It is to plants what oxygen is to usIt is to plants what oxygen is to us
““It is hard to think of COIt is hard to think of CO22 as a poison” as a poison”
It is very important to understand its behaviorIt is very important to understand its behavior Atmospheric COAtmospheric CO22: 5.91221 billion metric tons in U.S, : 5.91221 billion metric tons in U.S,
Second to ChinaSecond to China COCO22 Emissions: Related to Gas, Liquid, Solid Fuels, Emissions: Related to Gas, Liquid, Solid Fuels,
Gas Flares, Cement ProductionGas Flares, Cement Production

Atmospheric Carbon DioxideAtmospheric Carbon Dioxide

CO2 in the Atmosphere
8 Contributable Variables
E CO2 emission (fossil fuel combustion)
D Deforestation and destruction
R Terrestrial plant respiration
S Respiration
O the flux from oceans to atmosphere
P terrestrial photosynthesis
A the flux from atmosphere to oceans
B burial of organic carbon and limestone carbon


To Understand COTo Understand CO22 - Atmosphere - Atmosphere We must analyze and model existing dataWe must analyze and model existing data
– To have a better understanding of the attributable variables To have a better understanding of the attributable variables (Rank)(Rank)
– To identify possible interactions of the attributable variablesTo identify possible interactions of the attributable variables– Parametric / Inferential Analysis To probabilistically Parametric / Inferential Analysis To probabilistically
understand the behavior of COunderstand the behavior of CO22
– Develop forecasting models to accurately predict CODevelop forecasting models to accurately predict CO22 in the in the futurefuture
– Identify the relationship between Temperature and COIdentify the relationship between Temperature and CO22
i.e., knowing Temperature predict COi.e., knowing Temperature predict CO22, etc., etc. Development of legal policiesDevelopment of legal policies
– Development of Economic models of Global Warming for Development of Economic models of Global Warming for implementing legal policiesimplementing legal policies

Atmospheric COAtmospheric CO22 (1958-2004) (1958-2004)Parametric Analysis / InferentialParametric Analysis / Inferential
– It is best characterized by the 3-par. Weibull, and its cumulative form is given by It is best characterized by the 3-par. Weibull, and its cumulative form is given by
– ScaleScale
– ShapeShape– – LocationLocation– X: Atmospheric COX: Atmospheric CO22
Thus, we can obtain, E[X], Var[X], S.D[X], Confidence limits, etc.Thus, we can obtain, E[X], Var[X], S.D[X], Confidence limits, etc.
0};)(exp{1)(
xx
xF
779.2:
029.23:
7.343:
})029.23
7.343(exp{1)( 779.2
x
xF

Trend Analysis: Determine If Trend Analysis: Determine If Atmospheric COAtmospheric CO22 Depends on Time Depends on Time
TheThe wherewhere gamma functiongamma function
ConsiderConsider Best FitBest Fit
Thus, F(x) as a function of time, isThus, F(x) as a function of time, is
Using this result we can obtain projections with a desired degree Using this result we can obtain projections with a desired degree of confidence, ten, twenty, fifty years from now.of confidence, ten, twenty, fifty years from now.
)1
1()(XE :
28107475.800225.028.314 ttt
)(tft
})092.17
)107475.800225.5534.354((exp{1)( 108.2
8
txxF
8857.0)108.2
11(;
8857.0;108.2
tt

Trend Analysis: Determine If Atmospheric Trend Analysis: Determine If Atmospheric COCO22 Depends on Time (Continued) Depends on Time (Continued)
That is, 10 years from now, 2018, at 95% That is, 10 years from now, 2018, at 95% level of confidence that the probable amount level of confidence that the probable amount of carbon dioxide in the atmosphere will be of carbon dioxide in the atmosphere will be between 381.35 and 410.11 ppm.between 381.35 and 410.11 ppm.
20 years, 2028, 95% CL, between 397.2 and 20 years, 2028, 95% CL, between 397.2 and 425.96 ppm, etc.425.96 ppm, etc.

Profiling: Ten Year ProjectionsProfiling: Ten Year Projections
Projections through 2018

Profiling: Fifty Year Projections
Projections through 2057

Confidence IntervalsConfidence Intervals

Time Series Plot on Monthly COTime Series Plot on Monthly CO22
Emissions 1981-2003Emissions 1981-2003
Month
CO
2 E
mis
sion
0 50 100 150 200 250
9010
011
012
013
014
015
0

The COThe CO22 Emissions Model Emissions Model
ARIMA(1,1,2)×(1,1,1)ARIMA(1,1,2)×(1,1,1)1212
After expanding the model and inserting the After expanding the model and inserting the coefficients, we havecoefficients, we have
tt BBBxBBBB )1)(1()1)(1)(1)(1( 121
221
121
121
141312
21262524
141312212
10517.08512772.08523.0
1234.09988.0002549.0007449.00049.0
5228495.0527749.10049.15203.05203.1
ttt
ttttt
ttttt
xxx
xxxxxCOE

Monthly COMonthly CO22 Emissions VS. Forecast Emissions VS. Forecast
Values for the Last 100 ObservationsValues for the Last 100 Observations
Month
CO
2 E
mis
sion
s
0 20 40 60 80 100
110
120
130
140
150
0 20 40 60 80 100
110
120
130
140
150
Original Data Predicted Value

COCO22 Emissions Forecast Emissions Forecast
Original Values Forecast Values Residuals
Jan-03 147.6298 145.2361 2.3937
Feb-03 134.1716 132.6554 1.5162
Mar-03 133.6979 137.3912 -3.6933
Apr-03 121.0047 124.5518 -3.5471
May-03 120.4789 122.4091 -1.9302
Jun-03 120.7394 123.101 -2.3616
Jul-03 132.4187 129.3481 3.0706
Aug-03 135.1314 132.787 2.3444
Sep-03 121.7753 123.8295 -2.0542
Oct-03 125.2487 125.9811 -0.7324
Nov-03 126.2127 126.812 -0.5993
Dec-03 143.1509 141.1834 1.9675

Time Series Plot for Monthly COTime Series Plot for Monthly CO22 in in
the Atmosphere 1965-2004the Atmosphere 1965-2004
Month
Atm
osph
eric
CO
2 C
once
ntra
tion
0 100 200 300 400
320
330
340
350
360
370
380

The Atmospheric COThe Atmospheric CO22 Model Model
ARIMA(2,1,0)×(2,1,1)ARIMA(2,1,0)×(2,1,1)1212
After expanding the model and inserting the After expanding the model and inserting the coefficients, we havecoefficients, we have
tt BxBBBBBB )1()1)(1)(1)(1( 121
12221
242
121
123938
37362726
25241514
13123212
8787.000085.00015116.0
005234.00076.000768.0013585.0
047038.00683.012093.0213997.0
74097.00759.11124.01989.06887.0
ttt
tttt
tttt
ttttt
xx
xxxx
xxxx
xxxxxCOA

Monthly COMonthly CO22 in the Atmosphere VS. Forecast in the Atmosphere VS. Forecast
Values for the Last 100 ObservationsValues for the Last 100 Observations
Month
Atm
osph
eric
CO
2 C
once
ntra
tion
0 20 40 60 80 100
360
365
370
375
380
0 20 40 60 80 100
360
365
370
375
380
Original Data Predicted Value

Atmospheric COAtmospheric CO22 Forecast Forecast
Original Values Forecast Values Residuals
Jan-04 376.79 376.7963 -0.0063
Feb-04 377.37 377.609 -0.239
Mar-04 378.41 378.1837 0.2263
Apr-04 380.52 379.6653 0.8547
May-04 380.63 380.8268 -0.1968
Jun-04 379.57 380.2339 -0.6639
Jul-04 377.79 378.3489 -0.5589
Aug-04 375.86 375.837 0.023
Sep-04 374.06 374.1871 -0.1271
Oct-04 374.24 374.1482 0.0918
Nov-04 375.86 375.6897 0.1703
Dec-04 377.48 377.2186 0.2614

Total Atmospheric CO2Total Atmospheric CO2EE CO2 emission (fossil fuel CO2 emission (fossil fuel
combustion)combustion)C1C1 Gas fuelsGas fuels
C2C2 Liquid fuel Liquid fuel
C3C3 Solid fuelSolid fuel
C4C4 Gas flaresGas flares
C5C5 Cement productionCement production
DD Deforestation and destructionDeforestation and destruction D1D1 deforestationdeforestation
D2D2 destruction of biomassdestruction of biomass
D3D3 destruction of soil carbondestruction of soil carbon
RR Terrestrial plant respirationTerrestrial plant respiration Only one variableOnly one variable
SS RespirationRespiration S1S1 respiration from soilsrespiration from soils
S2S2 respiration from decomposersrespiration from decomposers
OO the flux from oceans to atmospherethe flux from oceans to atmosphere Only one variableOnly one variable
PP terrestrial photosynthesisterrestrial photosynthesis Only one variableOnly one variable
AA the flux from atmosphere to oceansthe flux from atmosphere to oceans Only one variableOnly one variable
BB burial of organic carbon and burial of organic carbon and limestone carbonlimestone carbon
B1B1 the burial of organic carbonthe burial of organic carbon
B2B2 burial of limestone carbonburial of limestone carbon

Statistical Model for CO2 EmissionsStatistical Model for CO2 Emissions
CC22 & C & C44 alone contributions alone contributions CC11, C, C33, C, C55 Do not contribute alone, but their Do not contribute alone, but their
interactions contribute (Cinteractions contribute (C44CC55, C, C11CC33, C, C11CC55) )
2515
543
4316
2
255.10769.910228.5
529.571031.5289.807025
CCCCC
CCCCOE

Differential Equation of Differential Equation of Atmospheric COAtmospheric CO22
8 Contributable Variables
E CO2 emission (fossil fuel combustion)
D Deforestation and destruction
R Terrestrial plant respiration
S Respiration
O the flux from oceans to atmosphere
P terrestrial photosynthesis
A the flux from atmosphere to oceans
B burial of organic carbon and limestone carbon
),,,,,,,()( 2 BAPOSRDEf
dt
COd

Differential Equation of Differential Equation of Atmospheric COAtmospheric CO22
Note: B, P, R are constants, thusNote: B, P, R are constants, thus
dtBPAOSRDECOA
})({2
BdtkPdtk
tttk
tk
ttk
etk
CO
BP
OA
t
tt
S
D
E
t
32
82
12
3
12
4
12
2
9
2
0967.02665.4814.42
1031995315462
19954.10541995132.0
01625.05.10730
104755.2593503 1200
dtBkPkAOkSkRkDkEkCO BPAOSRDEA})({2